Article

Experimental Investigation of Antibiotic Photodegradation Using a Nanocatalyst Synthesized via an Eco-Friendly Process

by
Rúbia Martins Bernardes Ramos
1,*,
Pablo Inocêncio Monteiro
1,
Lizandra Viana Maurat da Rocha
2,
Oscar Oliveira Santos
3,
Evandro Roberto Alves
4 and
Tirzhá Lins Porto Dantas
1,*
1
Chemical Engineering Department, Federal University of Parana, Curitiba 81531-980, PR, Brazil
2
Instituto de Macromoléculas Professora Eloisa Mano—IMA, Federal University of Rio de Janeiro, Rio de Janeiro 21941-598, RJ, Brazil
3
Department of Chemistry, State University of Maringá, Maringá 87020-900, PR, Brazil
4
Food Engineering Department, Federal University of the Triangulo Mineiro, Uberaba 38064-200, MG, Brazil
*
Authors to whom correspondence should be addressed.
Appl. Sci. 2025, 15(8), 4308; https://doi.org/10.3390/app15084308
Submission received: 28 February 2025 / Revised: 5 April 2025 / Accepted: 11 April 2025 / Published: 14 April 2025
(This article belongs to the Special Issue Sustainable Environmental Engineering)

Abstract

:
Iron-based nanostructures mediated by plant aqueous extract were synthesized. The nanostructures were subjected to ultraviolet radiation to degrade a difficult-to-degrade compound. Various characterization techniques were performed to analyze the morphology of the nanomaterial, including scanning electron microscopy (SEM) and transmission electron microscopy (TEM), as well as crystallinity by X-ray diffraction (XRD). The chemical composition was investigated by energy dispersive X-ray spectroscopy (EDX) and structural characteristics by Fourier-transform infrared spectroscopy (FTIR), Raman spectroscopy, and thermogravimetric analysis (TGA). The results showed that the nanoparticles exhibited high photocatalytic efficiency, achieving 80% degradation of the pollutant. The study concludes that iron nanoparticles synthesized with plant aqueous extract are promising for the degradation of recalcitrant compounds, combining good efficiency with a cost-effective synthesis approach.

1. Introduction

Among antibiotics, amoxicillin is one of the most frequently administered globally [1,2]. Its action in the human and animal body helps combat bacterial infections. Studies suggest that more than half of the ingested amoxicillin is eliminated by the human body and released into the environment [3,4]. Additionally, its molecule has a property known as recalcitrance. This property causes amoxicillin to persist in conventional effluent treatments and become increasingly prevalent in environments worldwide. Previous studies [5] have shown that amoxicillin has been found in food, wastewater treatment plants, and sewage. The presence of antibiotics in the environment not only leads to environmental pollution problems but also contributes to the proliferation of antibiotic resistance. Furthermore, hepatotoxicity, nephropathy, and cancer are some examples of health problems that drug residues can cause in human health [6,7].
Several studies have been dedicated to the development of techniques for the degradation of amoxicillin [5,8,9,10] and other pharmaceutical compounds [11,12,13]. Among these techniques are sonocatalysis [8], ozonation [14], electrochemistry [15], Fenton [16], and photocatalysis [9]. Heterogeneous photocatalysis is a technique capable of generating hydroxyl radicals when photocatalysts are exposed to visible or ultraviolet light. These radicals have high oxidation power and low selectivity. These characteristics enable these radicals to react with a wide variety of molecules [17,18], including the amoxicillin molecule.
In recent years, nanoscale photocatalysts have been developed through green routes. The nanoscale enables the enhancement of certain characteristics of these catalysts, such as increased surface area [19]. Green synthesis allows the generation of nanomaterials that do not harm, pollute, or degrade the environment. In the green route, microorganisms, residues, and plants can be used to aid in the formation of green nanoparticles [20,21]. Additionally, it is worth noting that the green route utilizing plants is more feasible due to the speed of the process and its lower risks [21].
Metals that can be used in this synthesis can be extracted from salts, such as sulfates and chlorides. Iron, zinc, copper, manganese, and magnesium are some examples of metals that can be synthesized through the green route in the production of nanostructures. Iron is a widely used metal in this synthesis as it yields excellent results in the degradation of recalcitrant compounds as a photocatalyst. A previous study [22] states that iron-based nanostructures possess characteristics such as ferroelectricity and magnetism.
In this study, we used the peel of hybrid pumpkin to synthesize iron nanostructures through the green route and employed them as photocatalysts under UV light. The selection of hybrid pumpkin peel was based on its rich composition of bioactive compounds, which act as natural reducing and stabilizing agents, facilitating the formation of nanostructures without the need for hazardous chemicals. Additionally, pumpkin peels are by-products generated in the food processing industry [23]. Therefore, their use in nanocatalyst production represents an alternative for the valorization of this residue. This green nanophotocatalyst was used to investigate the photodegradation of the recalcitrant antibiotic amoxicillin, aiming to provide a potential eco-friendly and efficient alternative for water treatment applications.

2. Materials and Methods

The iron precursor reagent was iron (II) sulfate heptahydrate (Fe2SO4·7H2O). For iron precipitation, the pH was adjusted using sodium hydroxide (0.5 M). The photocatalysis experiments were carried out using commercial liquid amoxicillin as the antibiotic. The plant extract was obtained by extracting the peels of a hybrid pumpkin purchased from a local market in Curitiba, Paraná, Brazil.

2.1. Aqueous Pumpkin Extract and Synthesis of Green Nanoparticles

The methodology for synthesizing the iron nanoparticle was adapted from previous studies [24,25]. The hybrid pumpkin was selected based on its freshness. After selection, its coverings were separated from the pulp with precise cuts. Distilled water was used to remove undesired particles in this process. Approximately 22 g of the peels was heated in a water bath with distilled water. This process lasted 65 min at a temperature of 60 °C. This stage aimed to extract bioactive compounds from the peels, which play a crucial role in the formation of iron nanoparticles. After this period, the peels were filtered, and the resulting aqueous extract was used in the next step of nanoparticle synthesis. In the previously prepared extract (40 mL), 3.5 g of iron sulfate was added, and the pH of the solution was adjusted to 8.5 (NaOH 0.5 M). For 390 min, the solid retained in the filter (dark solution) was dried at 70 °C, resulting in a green photocatalyst (Figure 1).

2.2. Photocatalytic Experiments with Green Nanoparticles

The photocatalysis process was carried out in a borosilicate reactor exposed to ultraviolet radiation (365 nm) for a period of 60 to 420 min. Throughout the experiment, the temperature was kept constant at 25 °C, and a magnetic stirrer was used during this stage. Before exposure to ultraviolet radiation, the samples containing nanoparticles were kept in the dark and stirred at 80 rpm. The initial concentrations of the antibiotic were 10, 20, 30, and 40 mg L−1, while the concentrations of nanoparticles were 1.0, 1.5, 2.0, 2.5, and 3.0 g L−1. The pH of the sample was adjusted to 3.0, 6.0, and 9.0. At specific time intervals, 3 mL aliquots were collected and analyzed using a UV-6100 PC Double Beam spectrophotometer (Shanghai Instr., Shanghai, China) (231 nm).
To determine the influence of hydroxyl radicals on the advanced oxidation of the antibiotic, isopropanol (2 mM) was used as the reagent. The reagent was added to the samples before the nanoparticles. After 300 min, an aliquot of the sample was subjected to antibiotic quantification using a spectrophotometer, as previously mentioned. The antibiotic concentration at this stage was 0.01 g L−1, and the nanoparticle concentration was 1000 mg L−1.
The monitoring of photodegradation by-product generation was conducted through mass spectrometry analysis. A mass spectrometer, Impact II by Bruker Daltonics Corporation, Bremen, Germany, was used for this analysis. Samples were filtered and added to 1000 µL of HPLC-grade methanol. Compound identification was performed using ChEBI, GNPS, and PubChem.
The energy required for the photodegradation process in this study was calculated using the electrical energy per order (EE/O) (Equation (1)):
EE / O = 38.76 × P k × V
where P (kW) is the power of UV light, k (min−1) represents the rate constant for the pseudo-first order reaction, and V (L) is the volume of the sample [26,27].

2.3. Characterization Analyses of Green Nanoparticles

The characterization of the nanomaterial was performed using various techniques. To determine the structure and configuration of the iron nanoparticles, transmission electron microscopy (TEM, JEOL, Tokyo, Japan, JEM 1200 EX-II) and scanning electron microscopy (SEM, TESCAN, Brno–Kohoutovice, Czech Republic, VEGA3 LMU) were performed. To determine the chemical bonds present in the nanostructures, Fourier transform infrared spectroscopy (FTIR, FIR 98737, SPECTRUM VERSION 10.4.2, Waltham, MA, USA) was performed. To understand the crystalline structure of the nanoparticles, X-ray diffraction (XRD, RIGAKU ULTIMA IV, Tokyo, Japan) was performed. To verify how the nanostructures behaved within a specific temperature range, thermogravimetric analysis (TGA, V20.10 BUILD 36, New Castle, DE, USA) was performed. To understand the textural analysis of the nanoparticles, the surface area determination was carried out using nitrogen sorption isotherms (QUANTACHROME TOUCHWIN, 1.22, Anton Paar, Graz, Austria). To confirm the synthesis of iron nanoparticles, Raman spectroscopy (WITEC, Alpha 300, Ulm, Germany) was performed.

3. Results

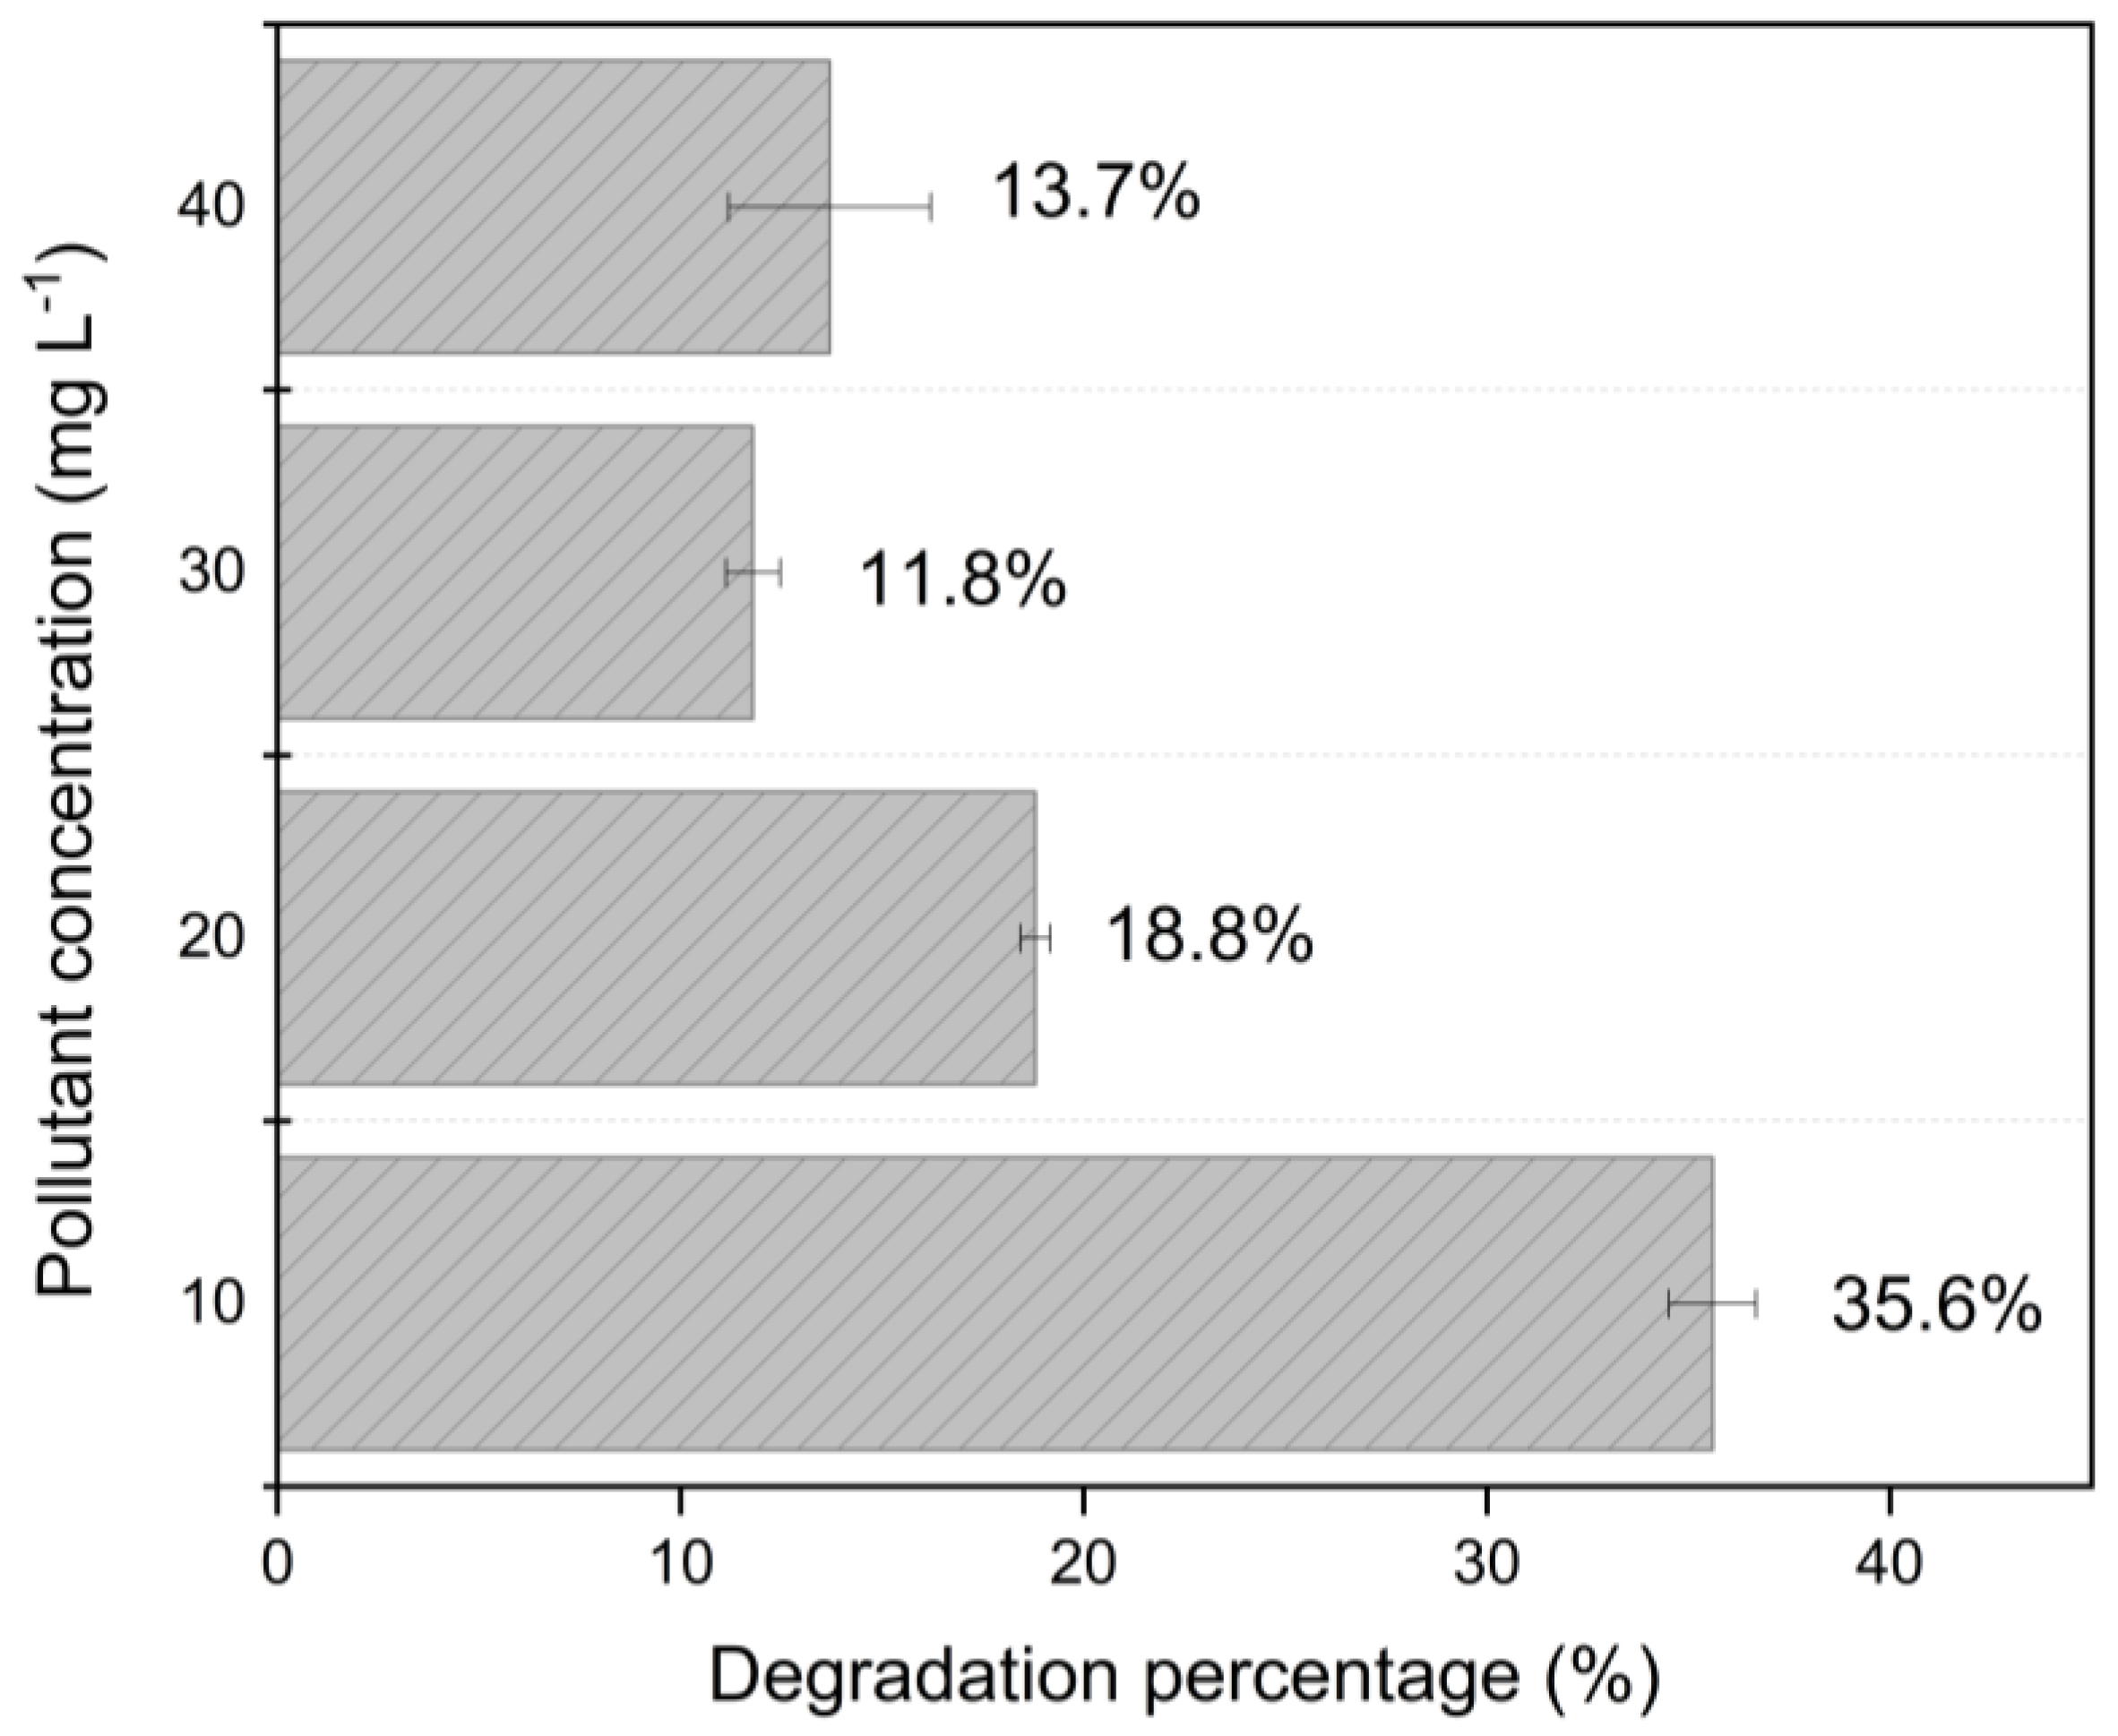
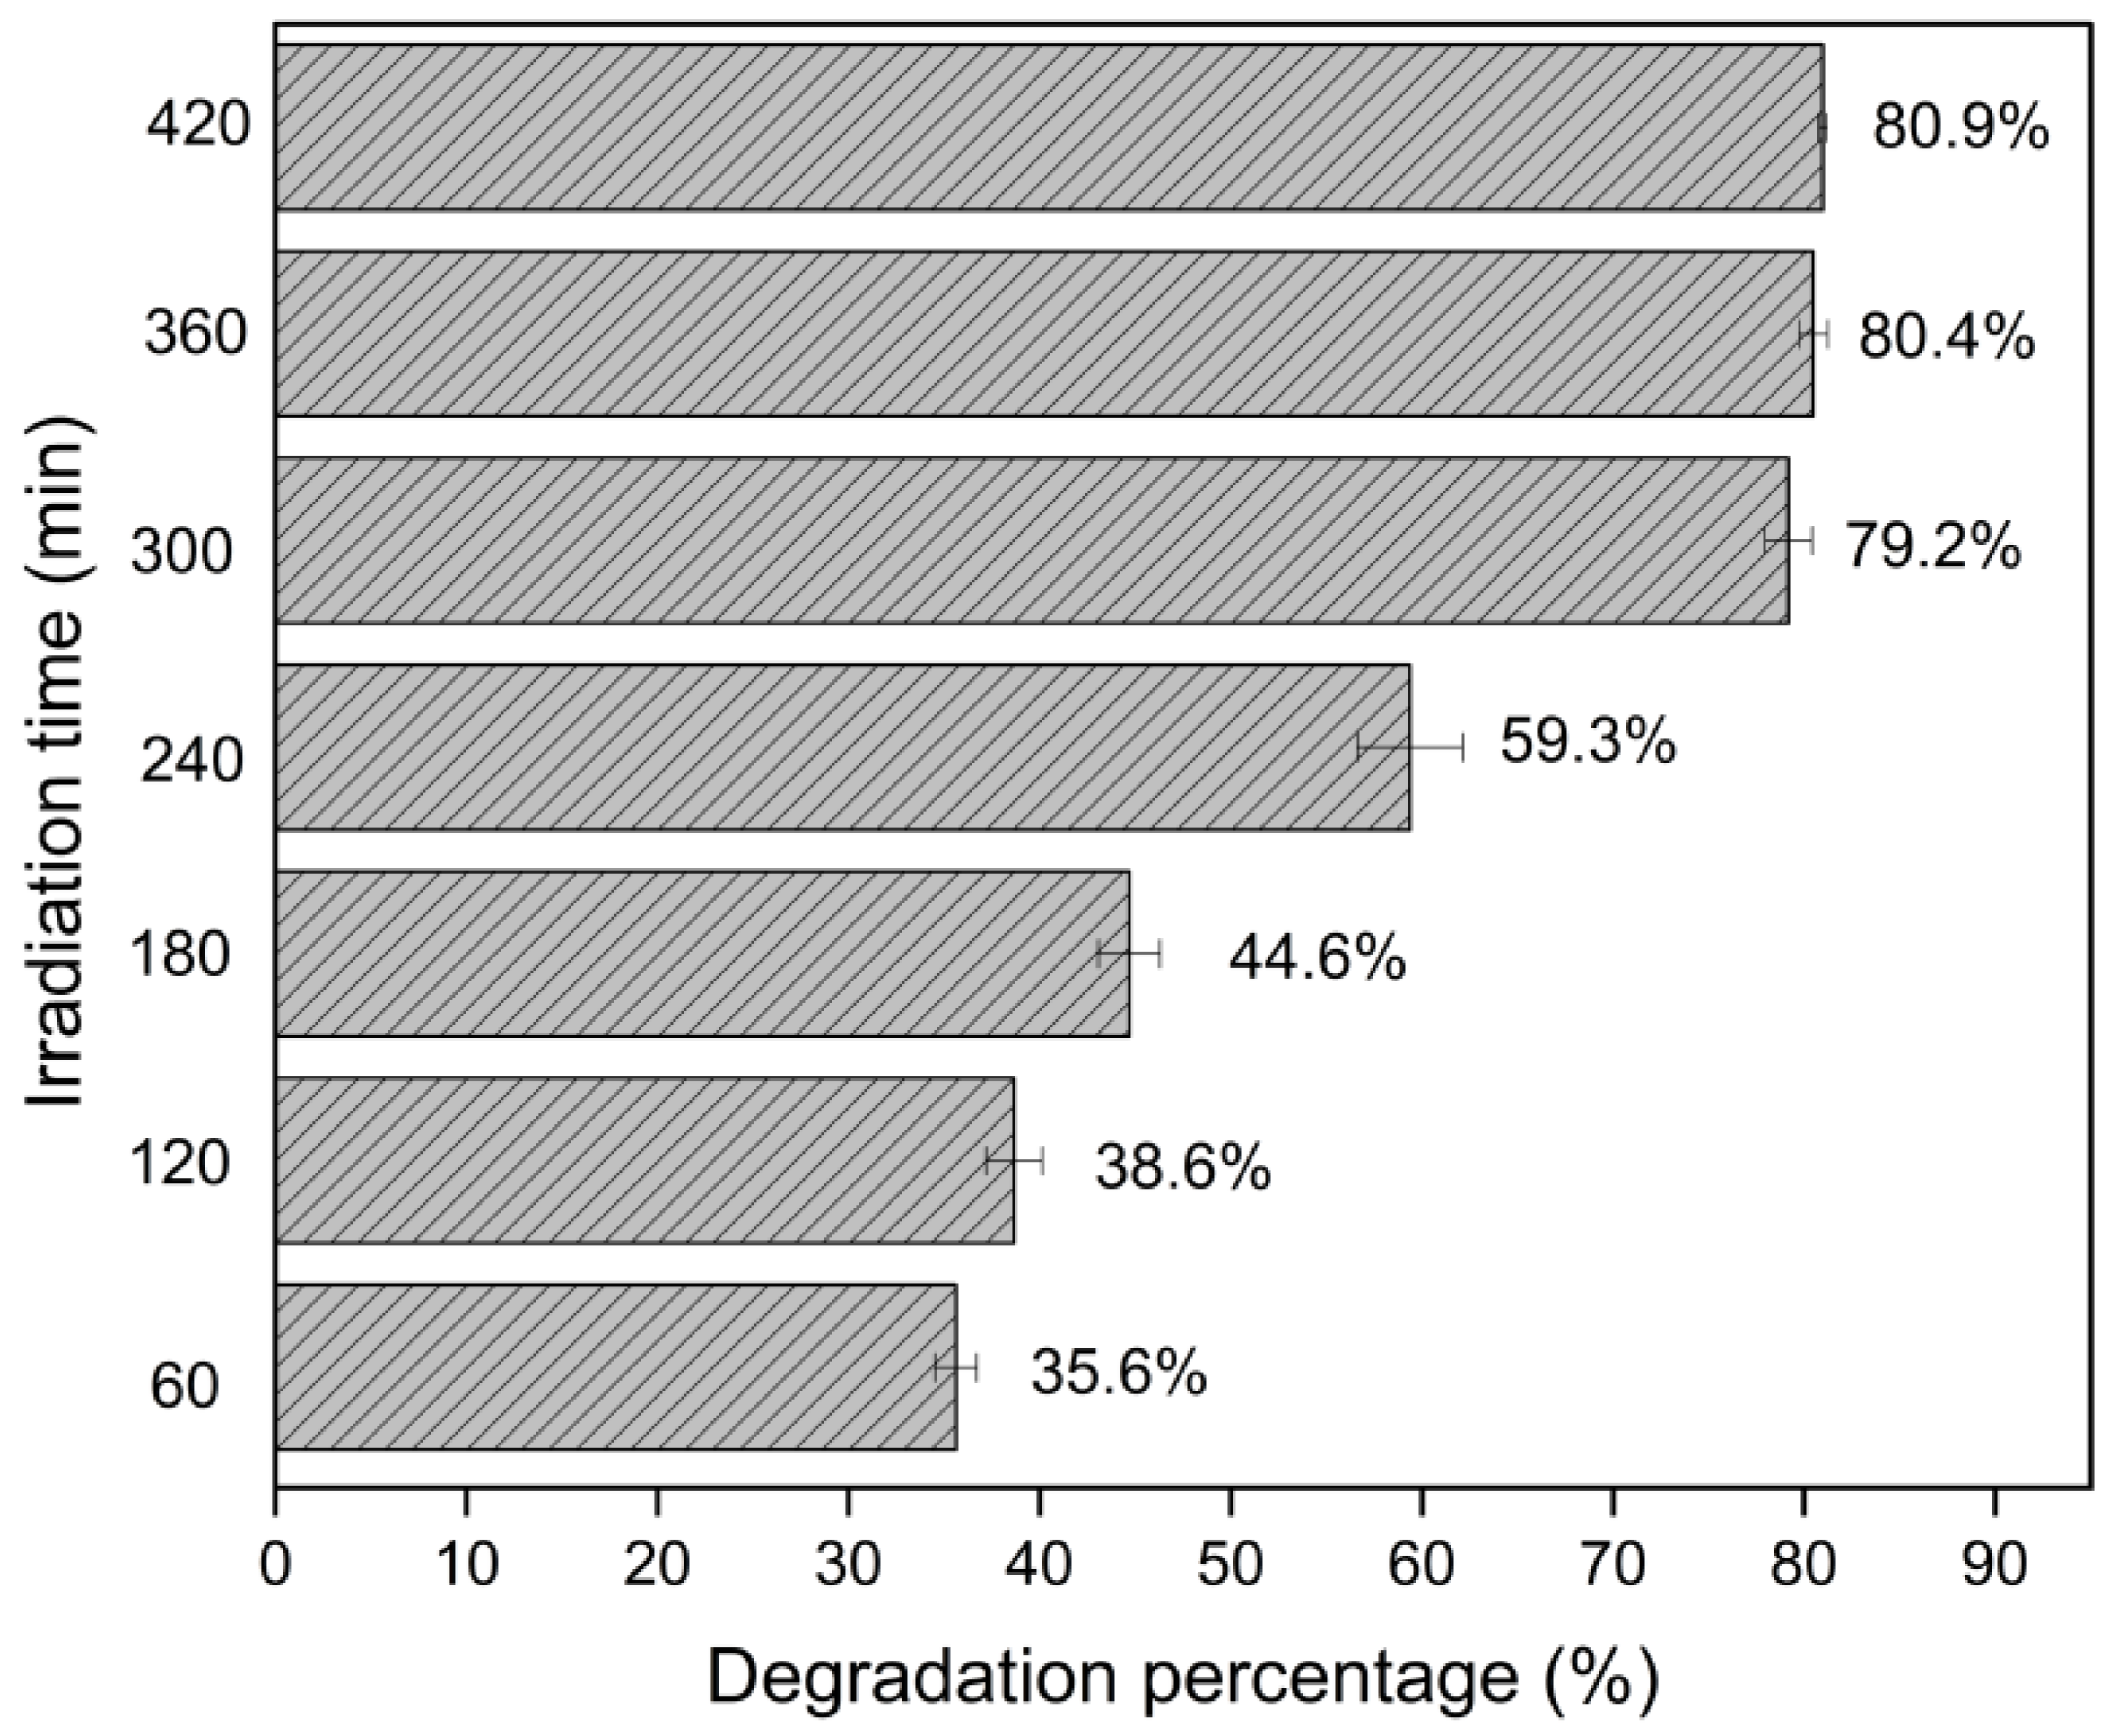
3.1. Investigation of Experimental Parameters for Catalytic Activity

The photocatalytic activity was studied in relation to the experimental parameters of green photocatalyst dosage, initial pollutant concentration (amoxicillin), exposure time, and the effect of pH.
The optimal photocatalyst dosage for pollutant degradation was evaluated under pH 6, an initial pollutant concentration of 10 mg L−1, and a reaction time of 60 min. The results showed that the photocatalyst dosage had an impact on amoxicillin degradation efficiency. Efficiency increased from 35.6% to 45.1% as the green photocatalyst dosage rose from 1 to 1.5 g L−1. However, increasing the dosage further led to a decline in efficiency, reaching 13.8%, 22.1%, and 18.4% for 2 g L−1, 2.5 g L−1, and 3 g L−1, respectively. Thus, the optimal dosage was determined to be 1.5 g L−1, as the highest degradation efficiency was observed within the initial range of 1 to 1.5 g L−1. Higher dosages resulted in diminishing returns, likely due to increased light scattering or catalyst aggregation. A similar behavior was observed in previous studies. Wahyuni et al. (2024) [28] investigated the photocatalytic degradation of amoxicillin, and Mohammadi et al. (2024) [29] studied tetracycline degradation. In both studies, different photocatalysts were used, but the trend of an optimal dosage followed by decreased efficiency with higher dosages was consistently observed. The increase in catalyst dosage may cause turbidity in the medium and particle aggregation, which in turn reduces the photocatalytic degradation efficiency [28,30].
Figure 2 shows the degradation of amoxicillin at different initial concentrations. It can be observed that, as the initial concentration of the antibiotic increases, the degradation efficiency decreases. A similar behavior was observed by Harikumar et al. (2022) [30], who studied the photocatalytic degradation of cefixime and doxycycline under visible light irradiation using a ternary nanocomposite. Mohammadi et al. (2024) [29] reported that increasing the concentration of antibiotics can block the active sites on the surface of the catalyst, reducing the efficiency. They also observed that the generation of electron–hole pairs is negatively affected, which contributes to the decrease in degradation efficiency.
Figure 3 shows that an extended reaction time increases degradation. This occurs due to the continuous generation of more reactive species, which further enhances the photodegradation efficiency. This behavior was observed in the photodegradation of methylene blue dye under visible light [31]. A previous study [32] synthesized a copper and titanium photocatalyst, achieving 90% photodegradation of amoxicillin after 24 h of reaction under visible light, using a photocatalyst dose of 0.4 g L−1. In contrast, this study’s green photocatalyst, at a dose of 1.0 g L−1, achieved 80.9% degradation in just 420 min (7 h) under UV light. These findings suggest that the proposed method may offer a more time-efficient alternative while maintaining effective photocatalytic performance.
Table 1 shows the influence of the initial pH of the solution on the amoxicillin photodegradation. This analysis is important because the charges on both the amoxicillin molecule and the catalyst surface interact, and this interaction can cause electrostatic repulsion or attraction, affecting the efficiency of photodegradation. It is observed that the highest efficiency of photodegradation occurs at pH = 6.0. Safari et al. (2022) [33] explain that amoxicillin has three pKa values corresponding to the functional groups, such as the carboxyl group, amine group, and phenol group, with pKa values of 4.2, 7.4, and 9.6, respectively. Therefore, the pKa of these functional groups may have influenced the fact that the highest photodegradation occurs at a pH of 6. Additionally, it is observed that at pH = 3 and pH = 9, the removal efficiency was low. This can be attributed to the surface charges of both the amoxicillin molecule and the green photocatalyst. At pH = 3, the charges on amoxicillin were in the cationic form, while at pH = 9, they were in the anionic form, causing electrostatic repulsion and decreasing the removal efficiency.

3.2. Photodegradation Mechanisms

The hydroxyl radical scavenger test was conducted to assess the influence of OH species on the photodegradation of amoxicillin by the green photocatalyst. In the absence of the scavenger, the photodegradation efficiency was 81% ± 0.2054, whereas, in the presence of isopropyl alcohol, the efficiency decreased to 48% ± 0.2254. This significant reduction indicates that hydroxyl radicals play a crucial role in the photocatalytic degradation process. Similar results were found by Rocha et al. (2024) [34]. These hydroxyl radicals are generated when the incident light is absorbed by the surface of the iron nanocatalyst, promoting electron excitation and hole (h+) generation. These holes react with water molecules adsorbed on the catalyst surface, forming highly reactive hydroxyl radicals [35,36]. When the nanocatalyst is synthesized through green processes, biomolecules present in the synthesis medium can influence its catalytic properties. According to previous studies [37,38], the presence of biomolecules in the plant extract and on the surface of the nanoparticles can enhance photocatalytic activity—an effect already observed in dye degradation and potentially extendable to the photodegradation of antibiotics.
The proposed reaction mechanism for the photodegradation of amoxicillin using the green photocatalyst has been adapted and can be seen in Equations (2)–(6). However, the influence of other radicals on the photodegradation of amoxicillin should also be considered, even if their effect is less significant in the reaction (Equations (5) and (6)) [39,40,41].
G r e e n   p h o t o c a t a l y s t h v h V B + + e C B
W a t e r   ( H 2 O 2 ) + h V B + O H + H +
O H + A m o x i c i l l i n by - products
O x y g e n ( O 2 ) + e C B O 2
O 2 + A m o x i c i l l i n by - products

3.3. Comparative Analysis with Prior Studies

Table 2 presents a comparison of the photocatalytic performance of different nanoparticle synthesis methodologies from a previous study, highlighting aspects such as efficiency, reaction time, light source, and medium pH. Methods such as sol–gel synthesis and the microwave-assisted technique demonstrated moderate efficiency, with degradation rates not exceeding 69.15% within 300 min of reaction [42]. In comparison, the present study achieved 80% within the same time frame, indicating superior performance. It is worth noting that the pH in a previous study was 3.5, whereas this study it was 6.0. This factor may limit its application in real systems, as extreme pH adjustments can increase operational costs. The pH affects factors such as the types of reactive oxygen species and catalytic activity [43]. Furthermore, Zhang et al. (2024) [44] state that deprotonation and protonation influence the reactivity of organic pollutants. These results highlight the importance of considering not only degradation efficiency but also the experimental parameters involved, which will pose challenges for future industrial applications.

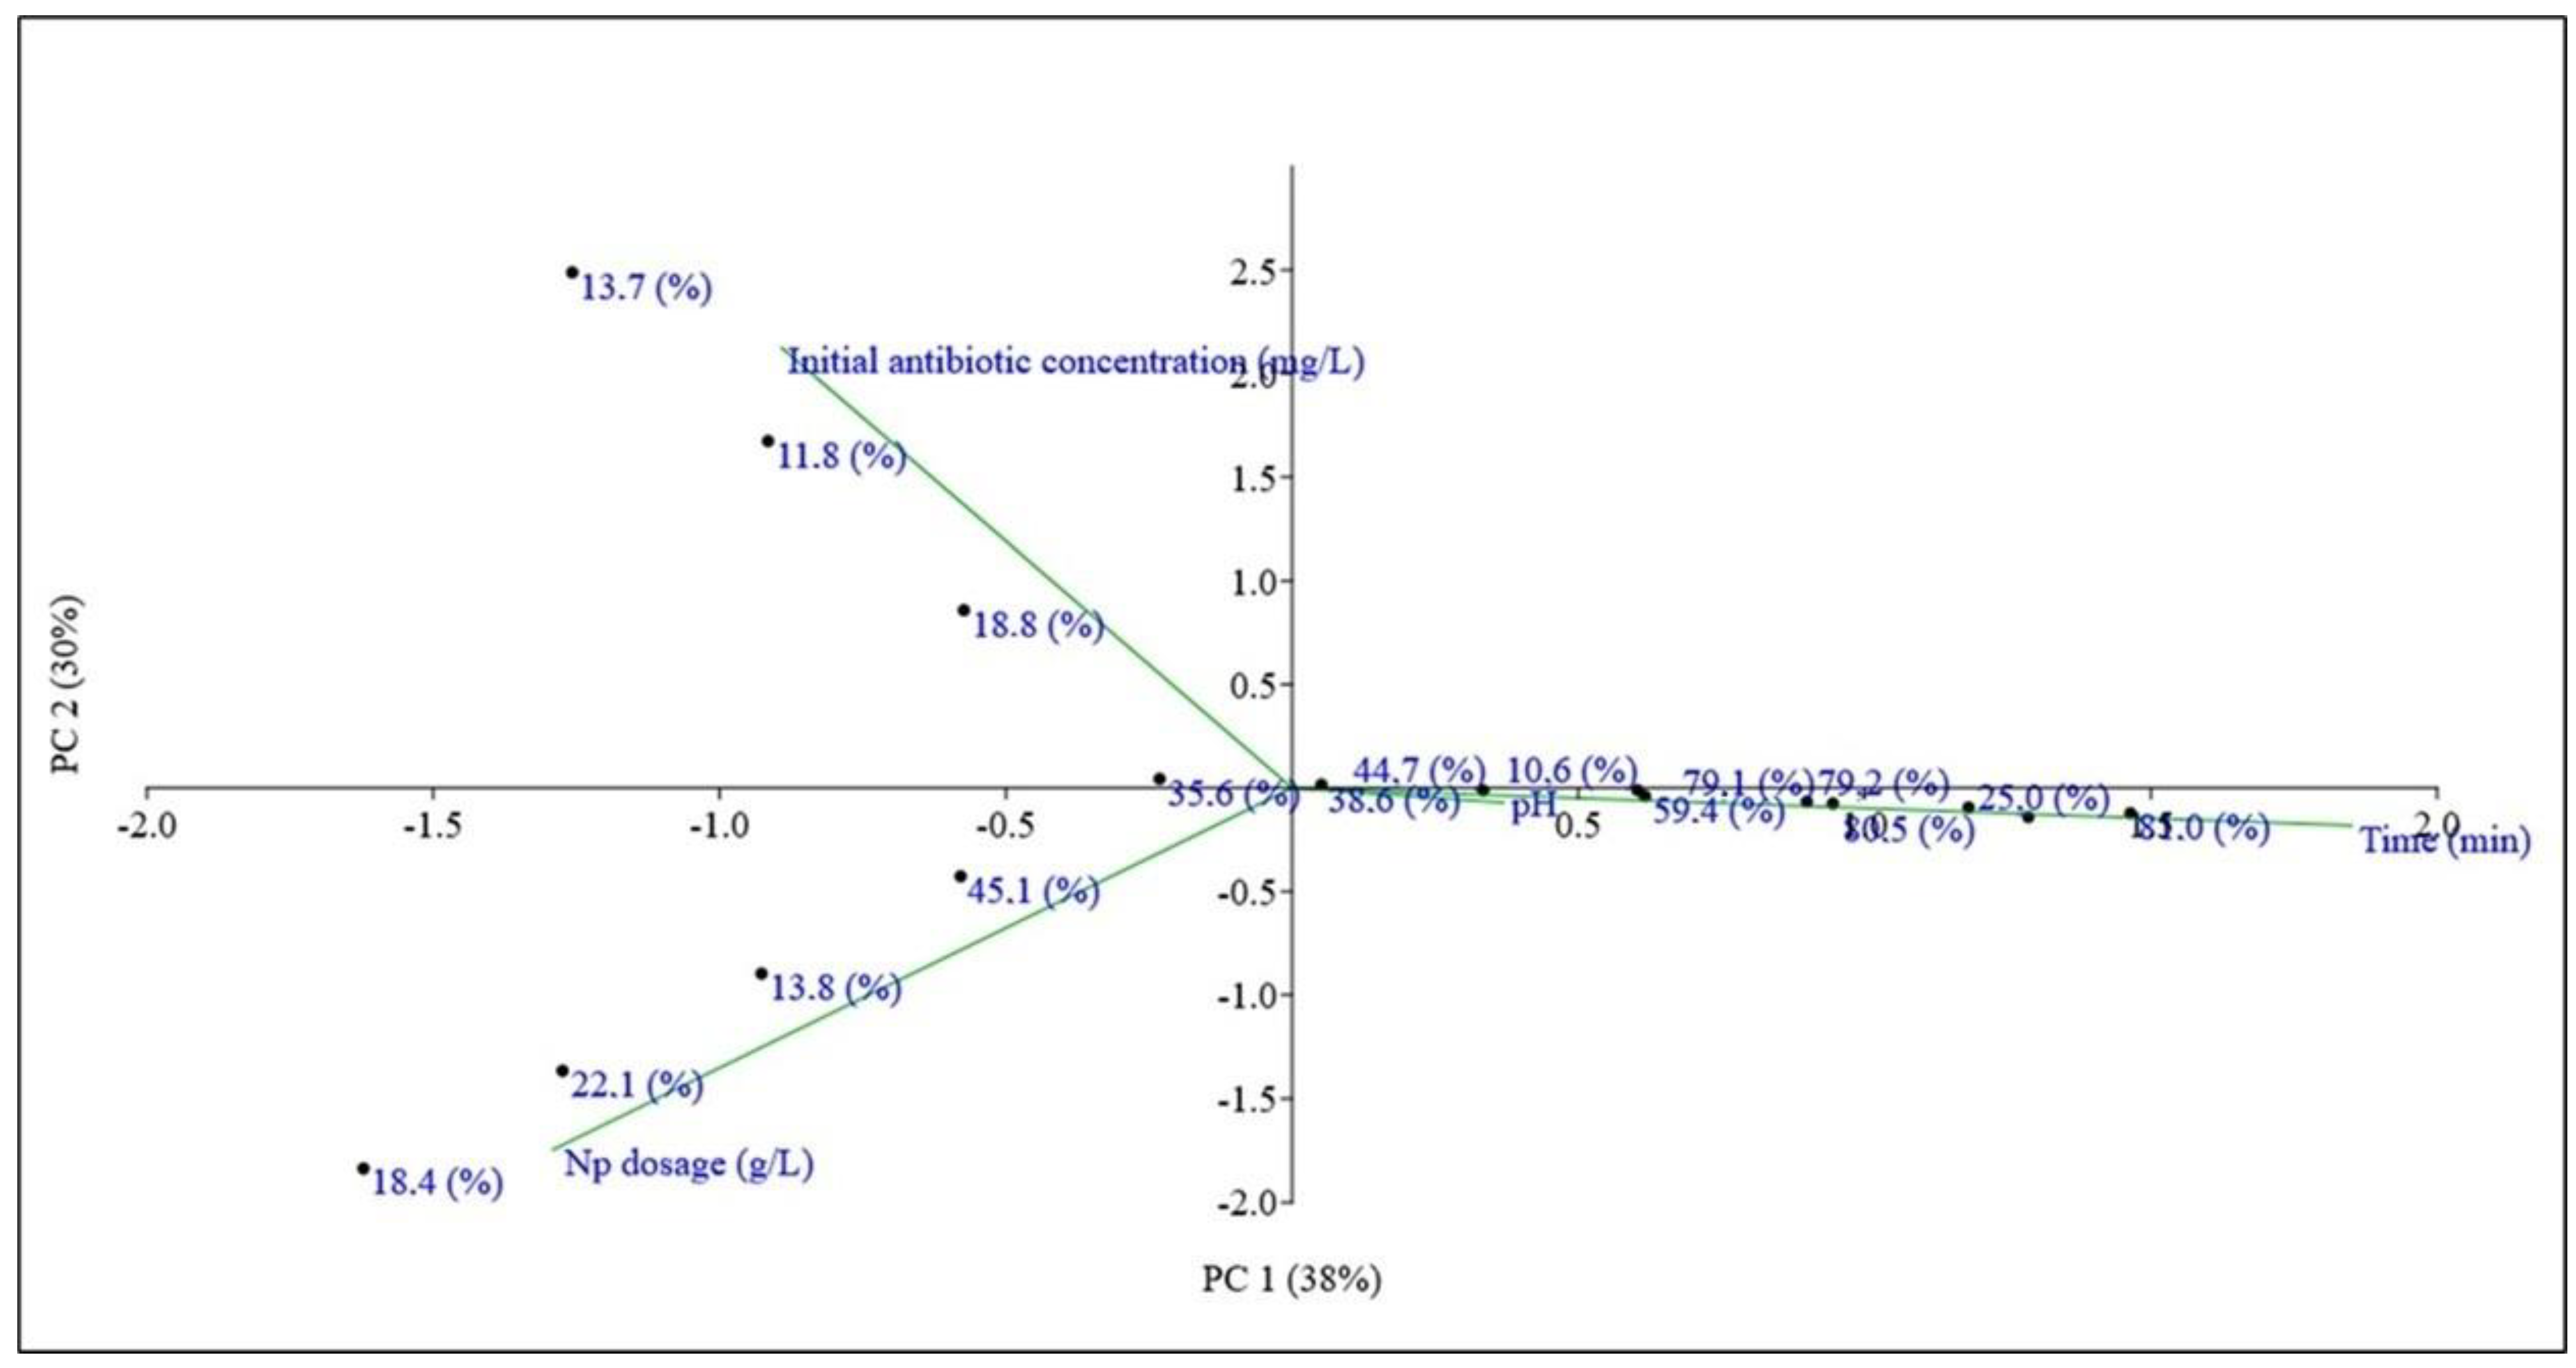
3.4. Principal Component Analysis (PCA)

Figure 4 shows the principal component analysis (PCA). PCA was performed to investigate how the experimental parameters influence the variation in the data. Principal components PC1 and PC2 accounted for 68% of the total variance. It was observed that high initial concentrations of the antibiotic and high dosages of the nanoparticles result in lower pollutant removal rates. This can be explained by factors that hinder the efficiency of photocatalysis, which aligns with the previously conducted analyses. The pH, being a variable close to the origin point, shows that it is weakly correlated with the main directions of variation in the data. On the other hand, time has a significant influence on the experiments with higher removal percentages. This is due to the constant generation of hydroxyl radicals, which can react with the antibiotic molecule, promoting its photocatalytic degradation.

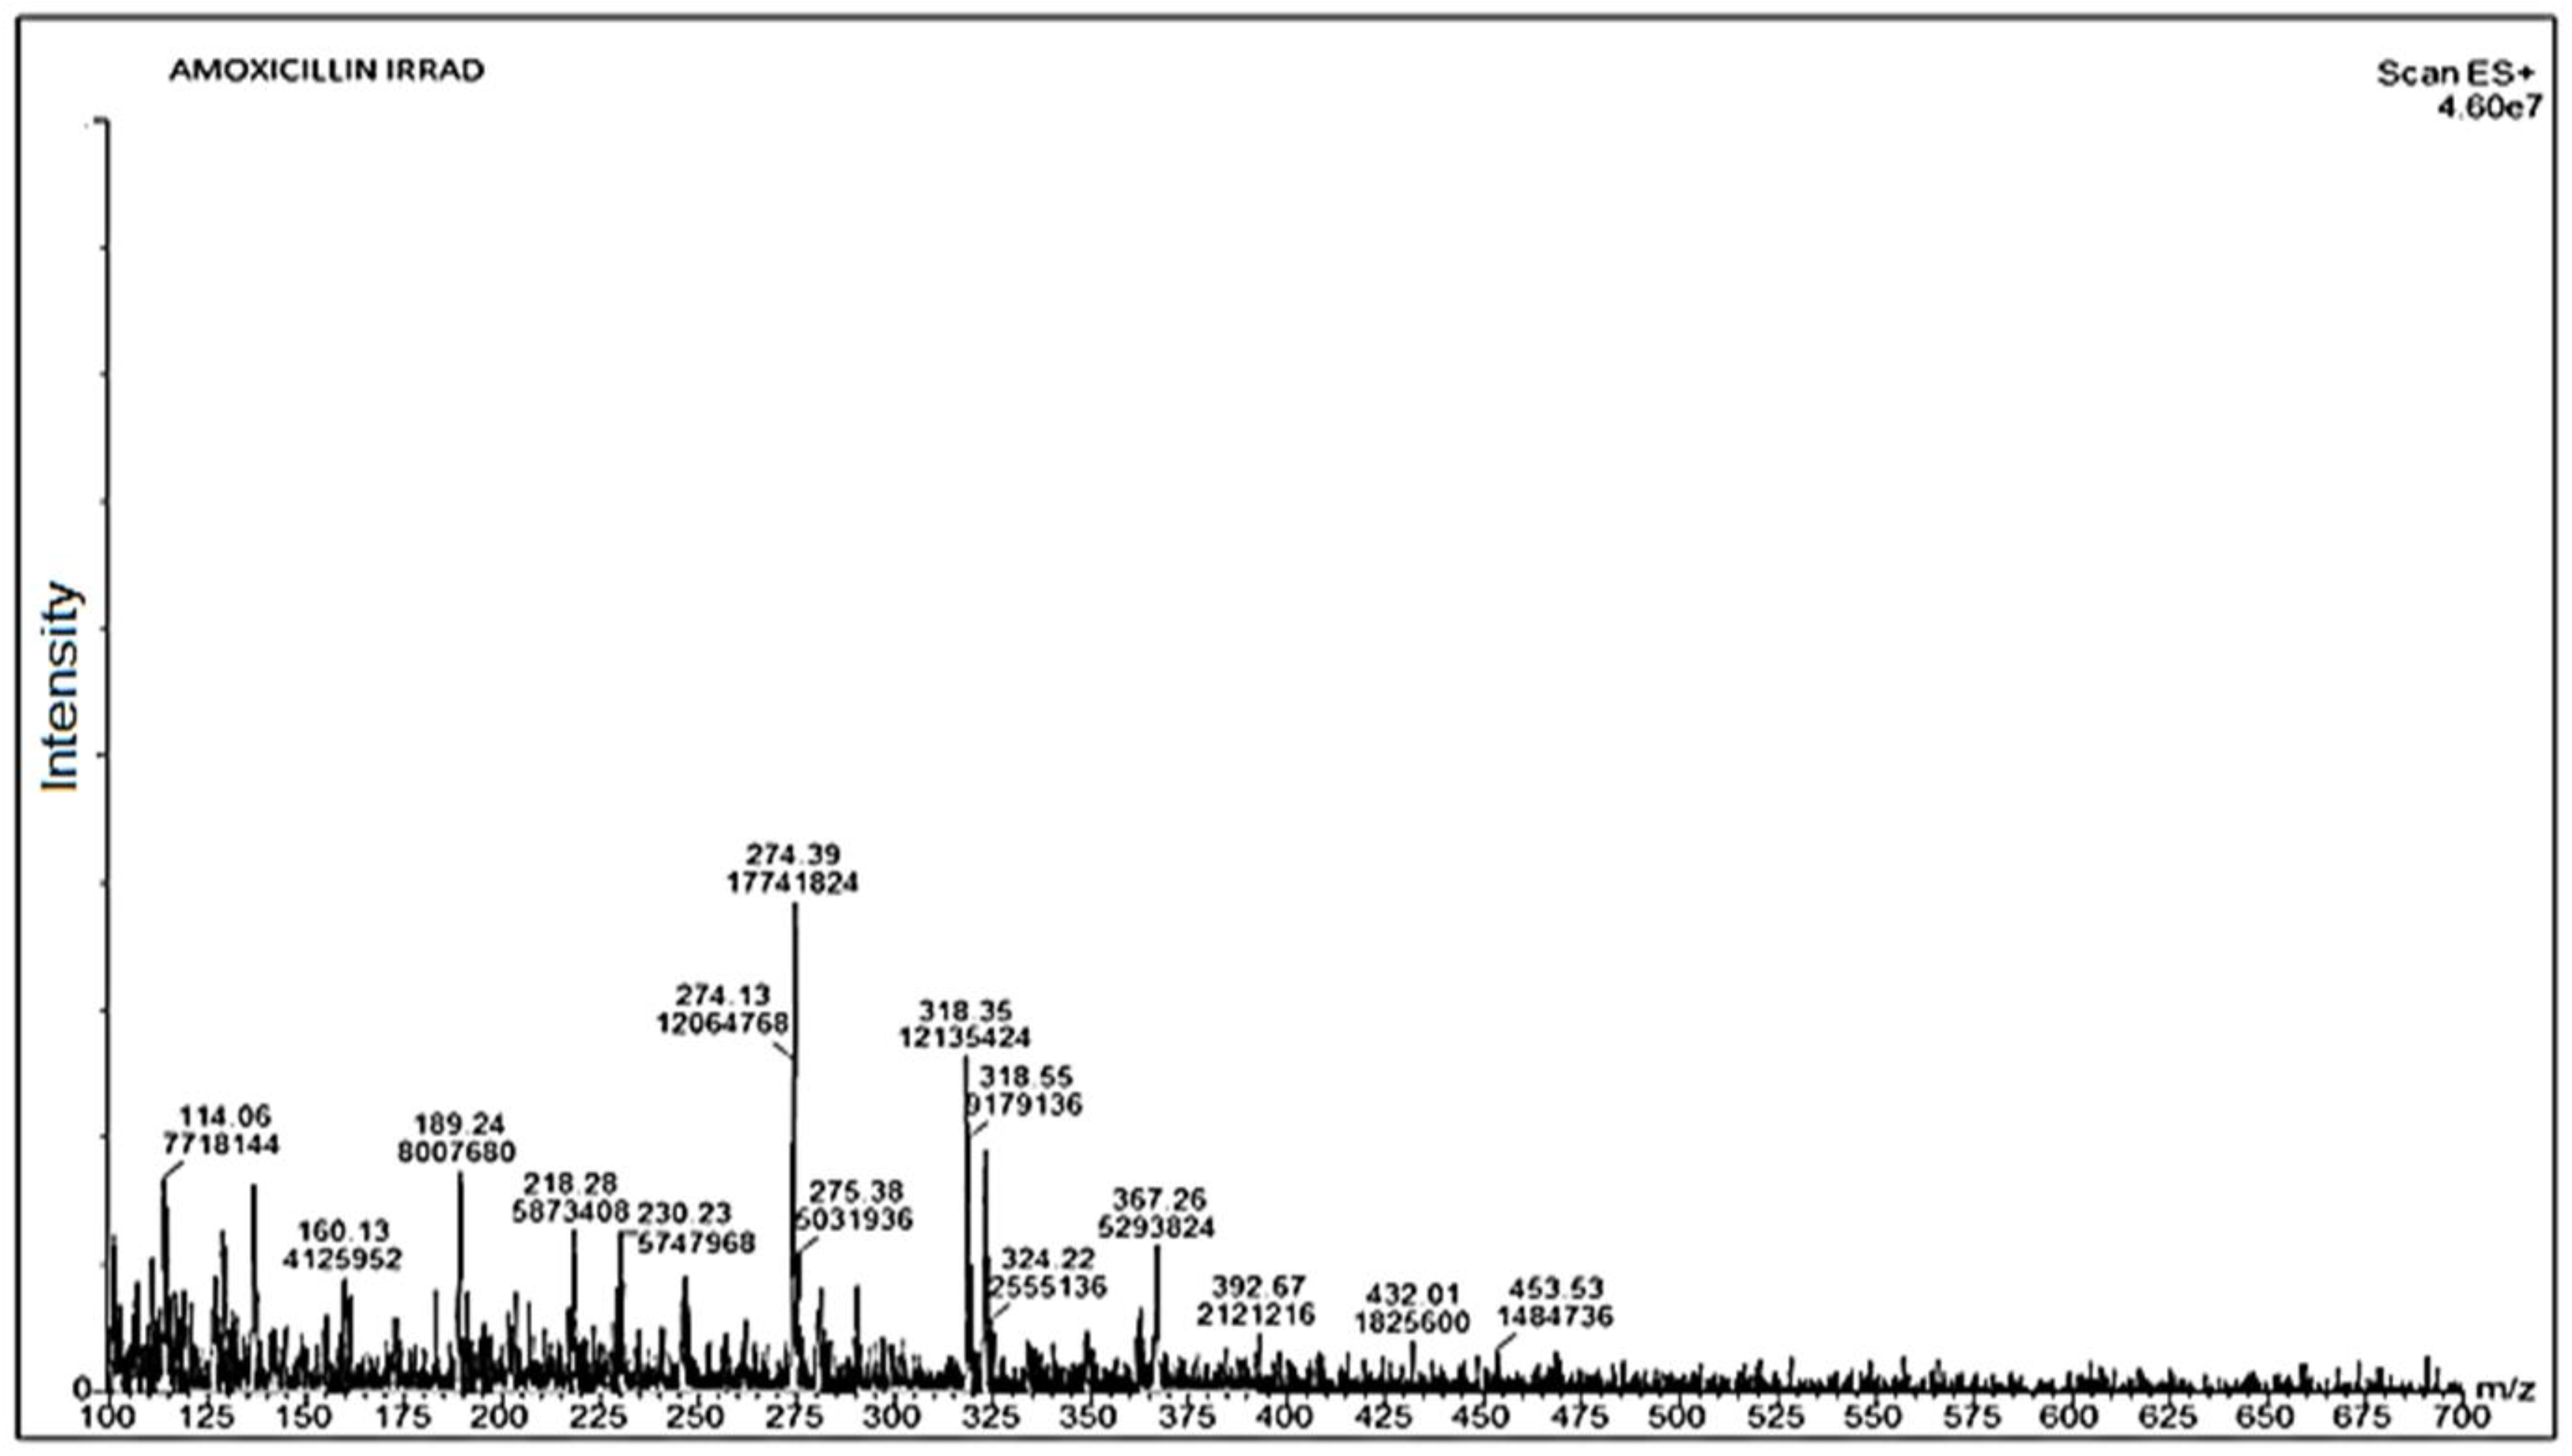
3.5. Mass Spectrometry (Q-TOF-MS/MS)

Figure 5 shows the mass spectrum of amoxicillin irradiated with the green photocatalyst. As shown in Figure 5, after 300 min, amoxicillin was completely degraded, evidenced by the absence of the peak at 366.11. The compound at m/z 366.11 is protonated amoxicillin [M + H]+. The degradation process produced peaks at 274.39 and 114.06, corresponding to the fragments [C14H15N2O2S]+ and [C3H4NOS]+, respectively. These results not only confirm the degradation of amoxicillin but also indicate that the remaining by-products were reduced to just two fragments in the irradiated solution. This outcome highlights the high efficiency of the green photocatalyst synthesized in this study for the degradation of amoxicillin.

3.6. Electrical Energy Consumption per Order (EE/O)

The EE/O calculated for this study with the green photocatalyst was 721.12 kWh m−3 order−1. A previous study [45] found 7.31 × 10⁴ kWh m−3 order−1 to degrade amoxicillin in a UV light cylindrical multi-column reactor. The lower value found for the green photocatalyst in this study indicates a significantly higher energy efficiency compared to the use of titanium under UV light. This suggests that the green photocatalyst may require less energy to degrade amoxicillin, indicating its potential as a more energy-efficient option for photocatalytic degradation processes.

3.7. Characterization of the Green Photocatalyst

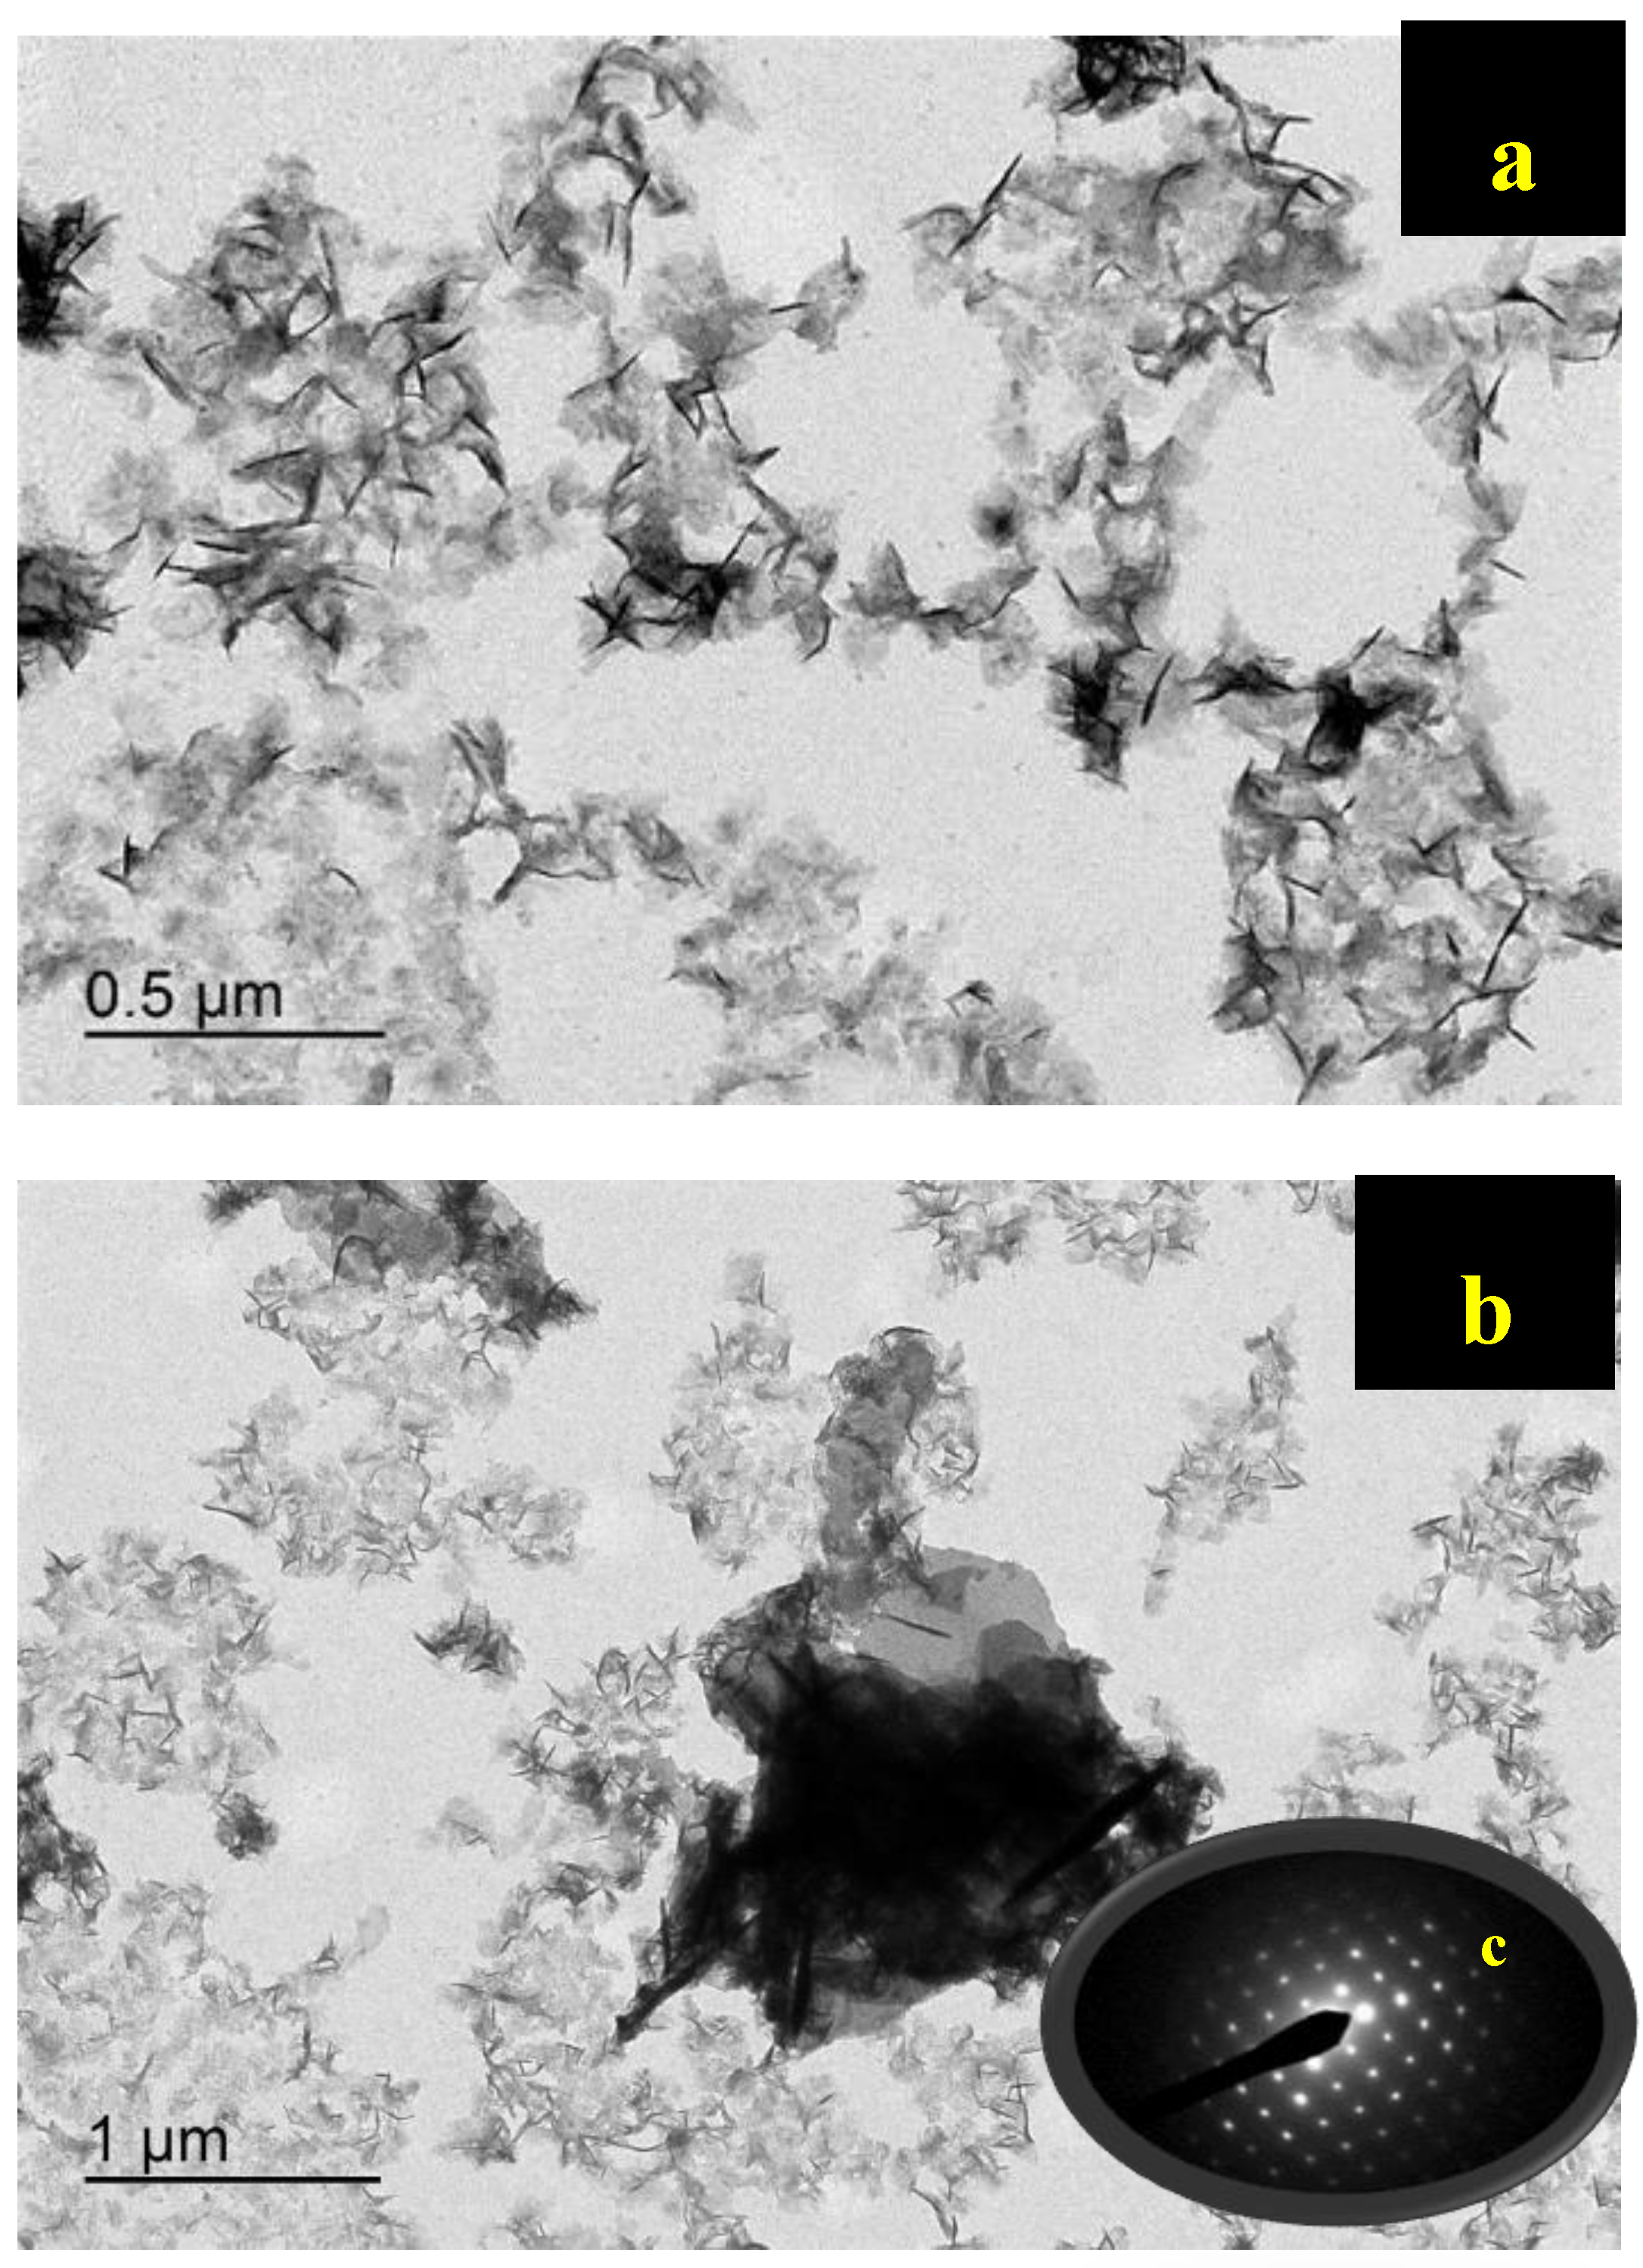
3.7.1. Transmission Electron Microscopy (TEM)

Figure 6 shows green photocatalyst with longitudinal, nanoneedle structures along with some agglomerates. A comparable morphology was observed by MubarakAli et al. (2019) [46]. The authors synthesized hydroxyapatite nanoparticles using microwaves. In contrast, a study by Panneerselvam et al. (2024) [47] synthesized iron nanomaterials using A. indicum (L) extract, resulting in non-aggregated, spherical nanoparticles. Additionally, Sayed and Polshettiwar (2015) [48] demonstrated that the choice of precursor iron salts can significantly influence the shape of iron oxides synthesized following the same synthesis protocol. These findings suggest that both the synthesis methodology and the type of precursor are critical in determining the final morphology of the nanoparticles. Figure 6c shows the selected area electron diffraction (SAED) pattern of the green photocatalyst. This pattern, characterized by well-defined points, indicates the formation of nanocrystals within the nanoparticle structure.

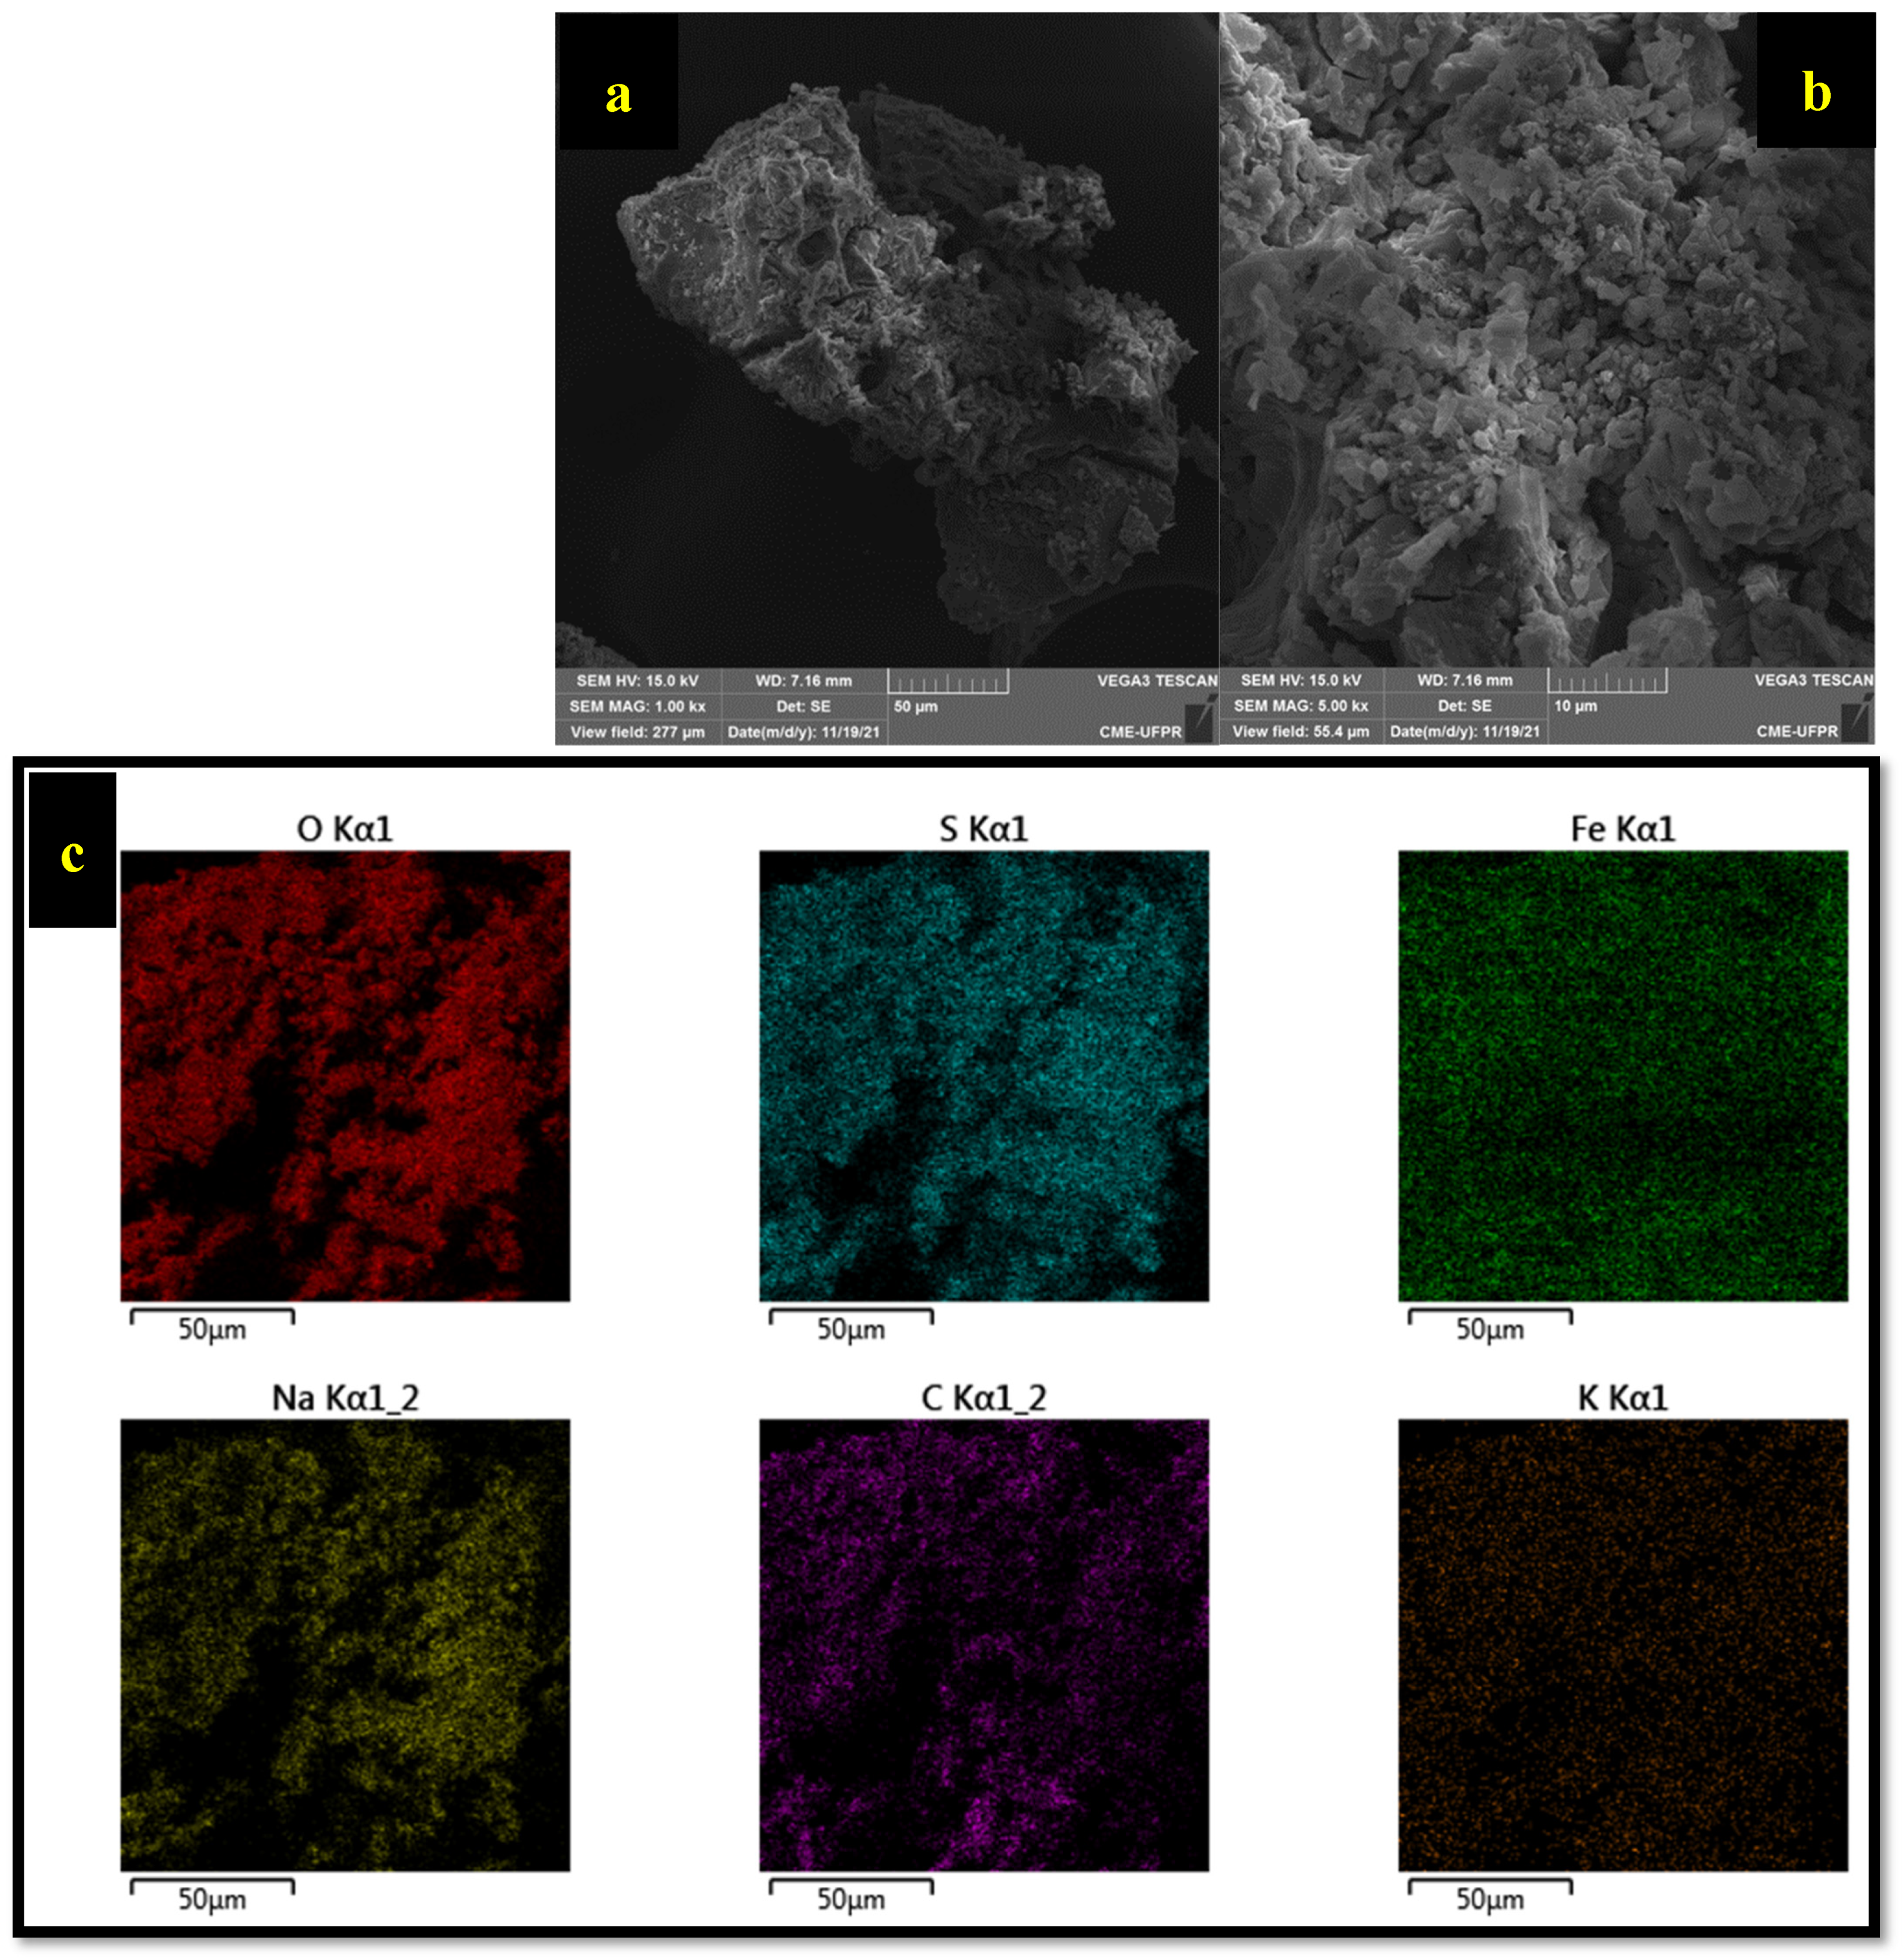
3.7.2. Scanning Electron Microscopy (SEM)

Figure 7 shows the heterogeneous and rough surface of the green photocatalyst nanomaterial. The surface does not have a defined shape and appears irregular. Bensy et al. (2022) [49] attributed the irregular formation of nanomaterials to the agglomerations caused by Van der Waals forces and magnetic attraction. Figure 7c shows the elemental distribution map of the nanostructure. The iron content is 20 wt%, and the oxygen content is approximately 50 wt%. Other elements were identified in small amounts (carbon, sulfur, sodium) and can be attributed to the plant extract used in the synthesis. In this study, the carbon content was 17 wt%, while a previous study [50] on nickel nanoparticles synthesized via a green route reported 18.5 wt%. The authors suggested that the amount of carbon indicates that organic components from the plant extract contributed to the stability of the nanoparticles.

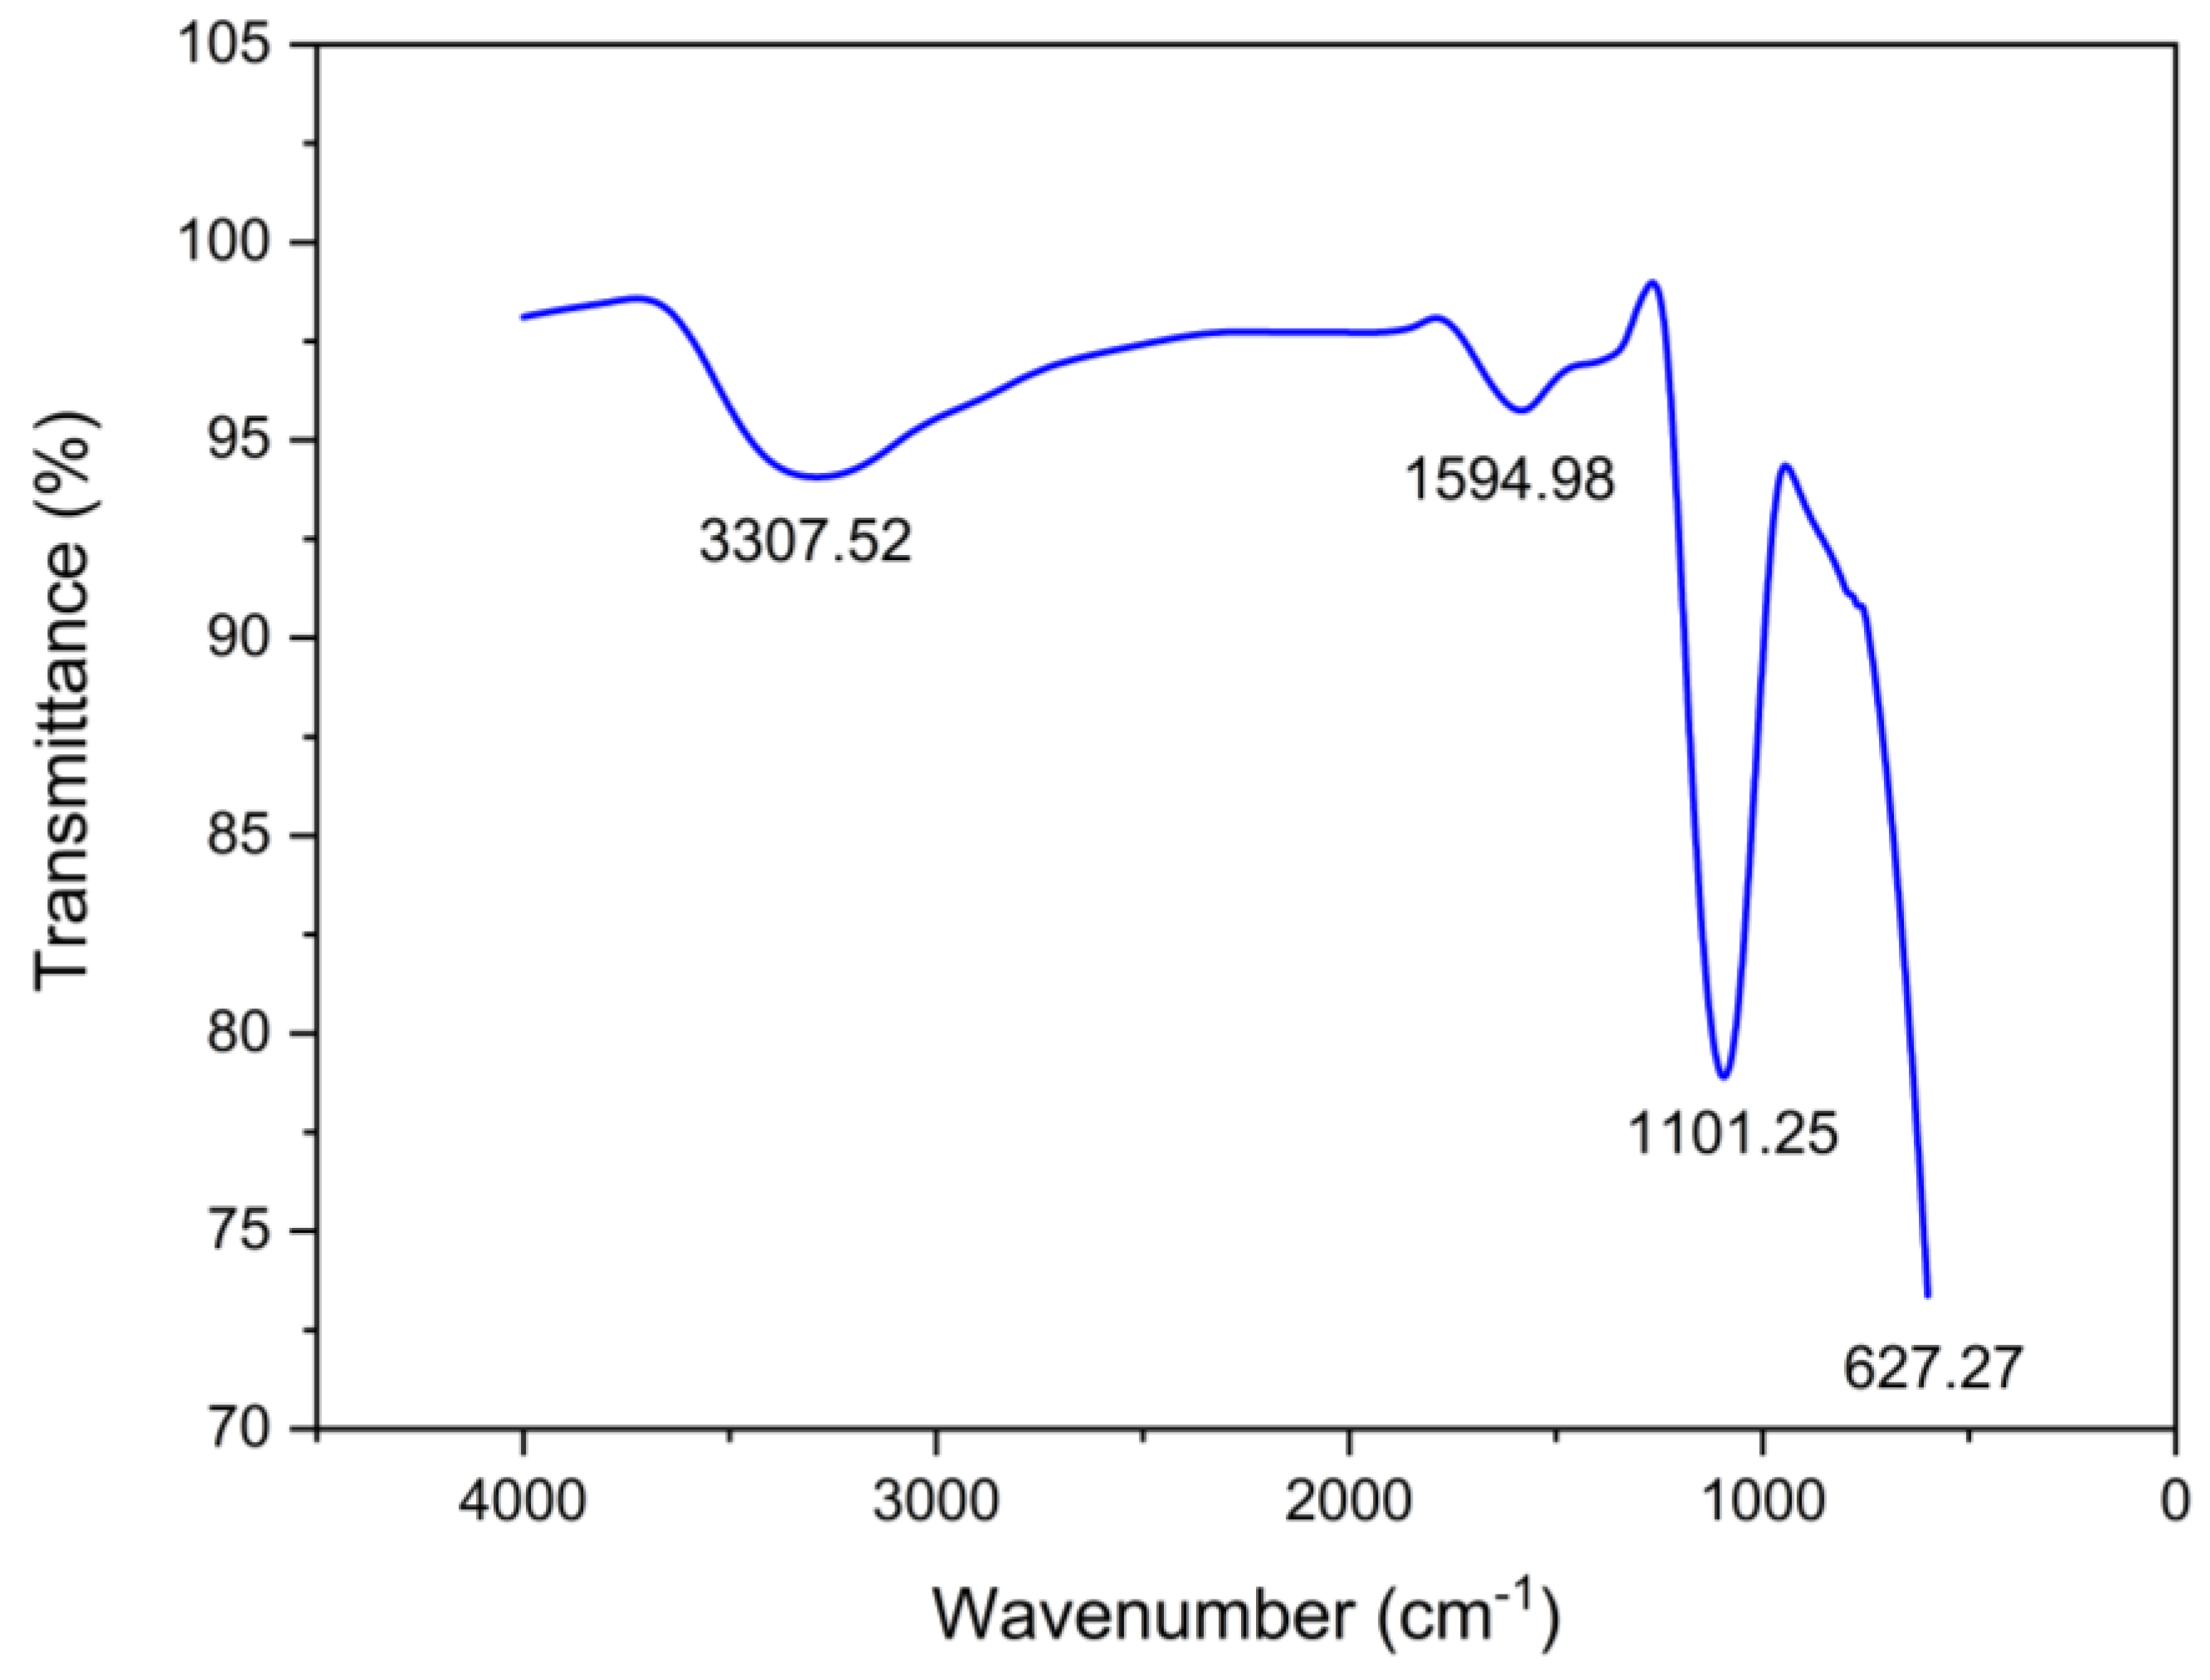
3.7.3. FTIR Analysis

FTIR analysis was performed to determine the functional groups present in green photocatalyst. Figure 8 shows the presence of functional groups related to iron oxide (FeO). The presence of iron oxide was determined by the peak at 627.27 cm−1. The peak at 3307.52 cm−1 is related to the stretching of O-H bonds, as observed by Duan et al. (2024) [51] at 3436 cm−1. On the other hand, the peak observed at 1594.98 cm−1 can be attributed to the C=C stretching of aromatic compounds present in the extract used as a solvent in nanoparticle synthesis. Yassin et al. (2024) [52] synthesized iron nanoparticles with Salvia officinalis extract and attributed the peak at 1627.30 cm−1 in the FTIR spectrum to this functional group (C=C). The peak at 1101.25 cm−1 may be related to C-O bond stretching. The stability of nanoparticles during degradation processes and their solubility are factors that can be improved by the presence of functional groups in the nanoparticles [53].

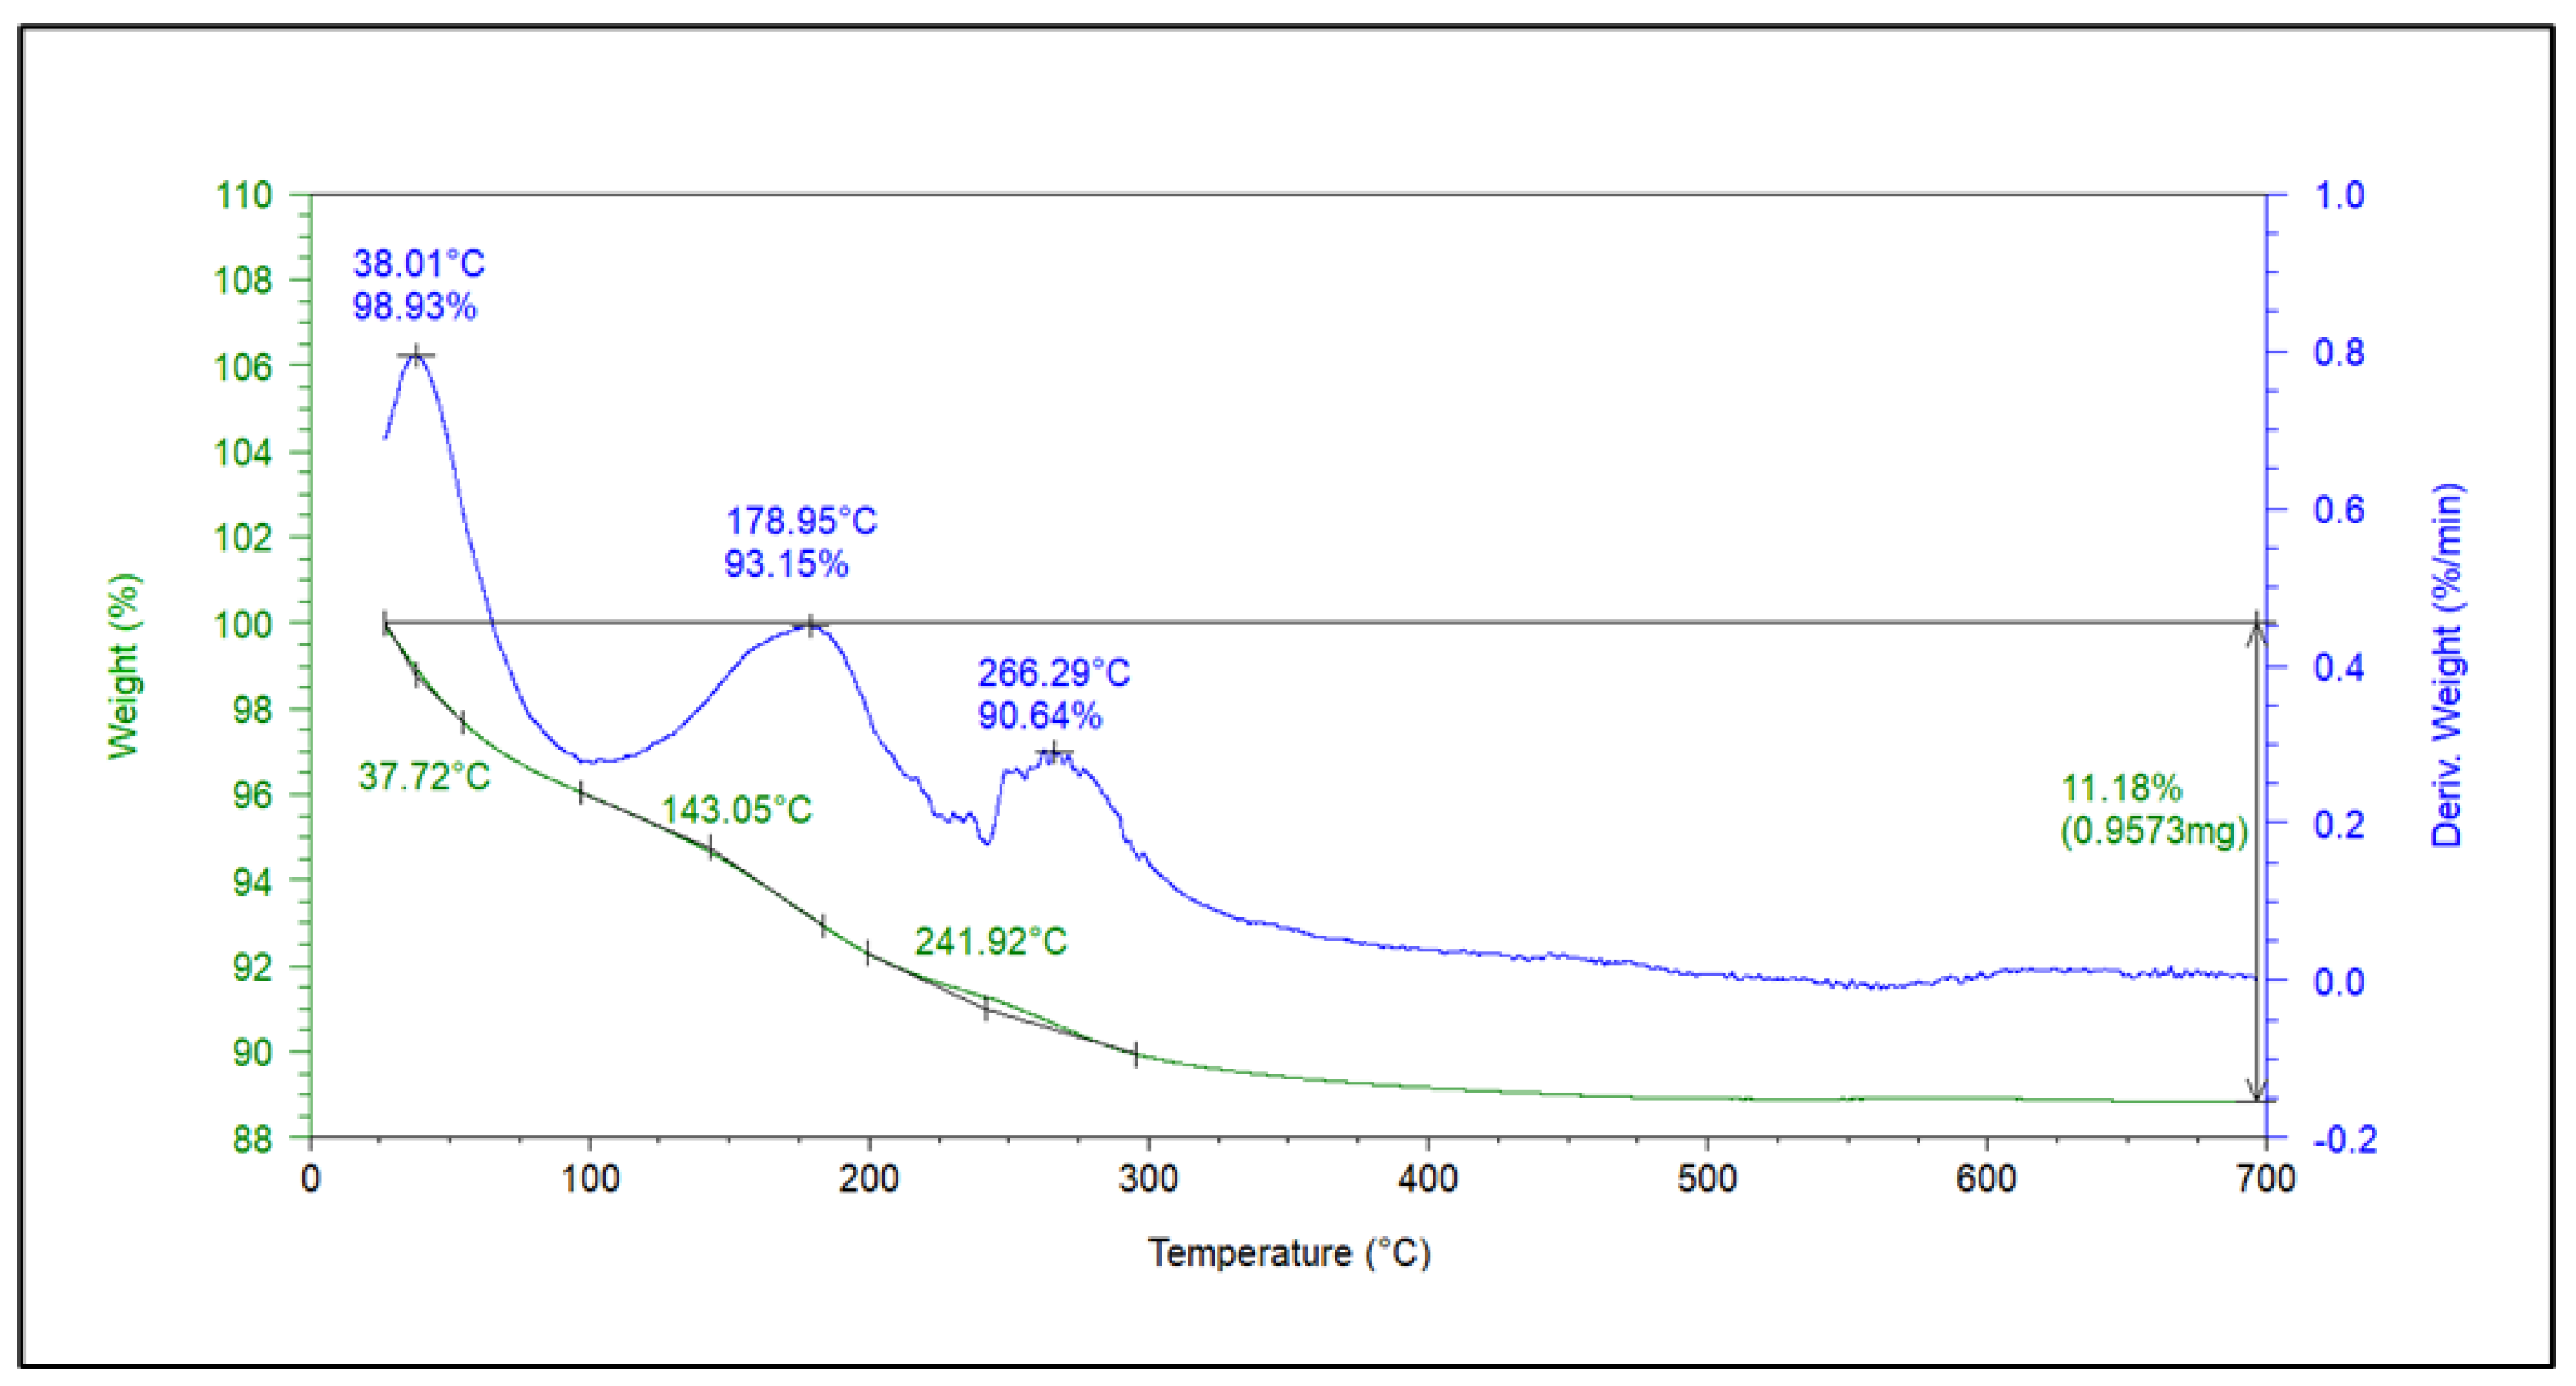
3.7.4. Thermogravimetric Analysis (TGA)

TGA was employed to assess the thermal stability of the synthesized material, revealing its high thermal resistance up to the maximum tested temperature of 700 °C, with only a ~11.2% mass loss observed (Figure 9). The mass loss up to 150 °C is likely due to the evaporation of water adsorbed on the nanoparticle surface, while the mass loss beyond this range may be related to the loss of bioactive compounds previously identified in the FTIR analysis (Figure 9). Bhattacharjee et al. (2021) [54] synthesized iron nanoparticles from date seed extract and observed a 60% mass loss in their TGA, attributed to the weight percentage of capping biomolecules. In this study, the mass loss was only 11%, which can be attributed to the drying of the nanoparticles at 70 °C for 390 min during synthesis, leading to the loss of biomolecules at this stage and resulting in a purer nanomaterial.

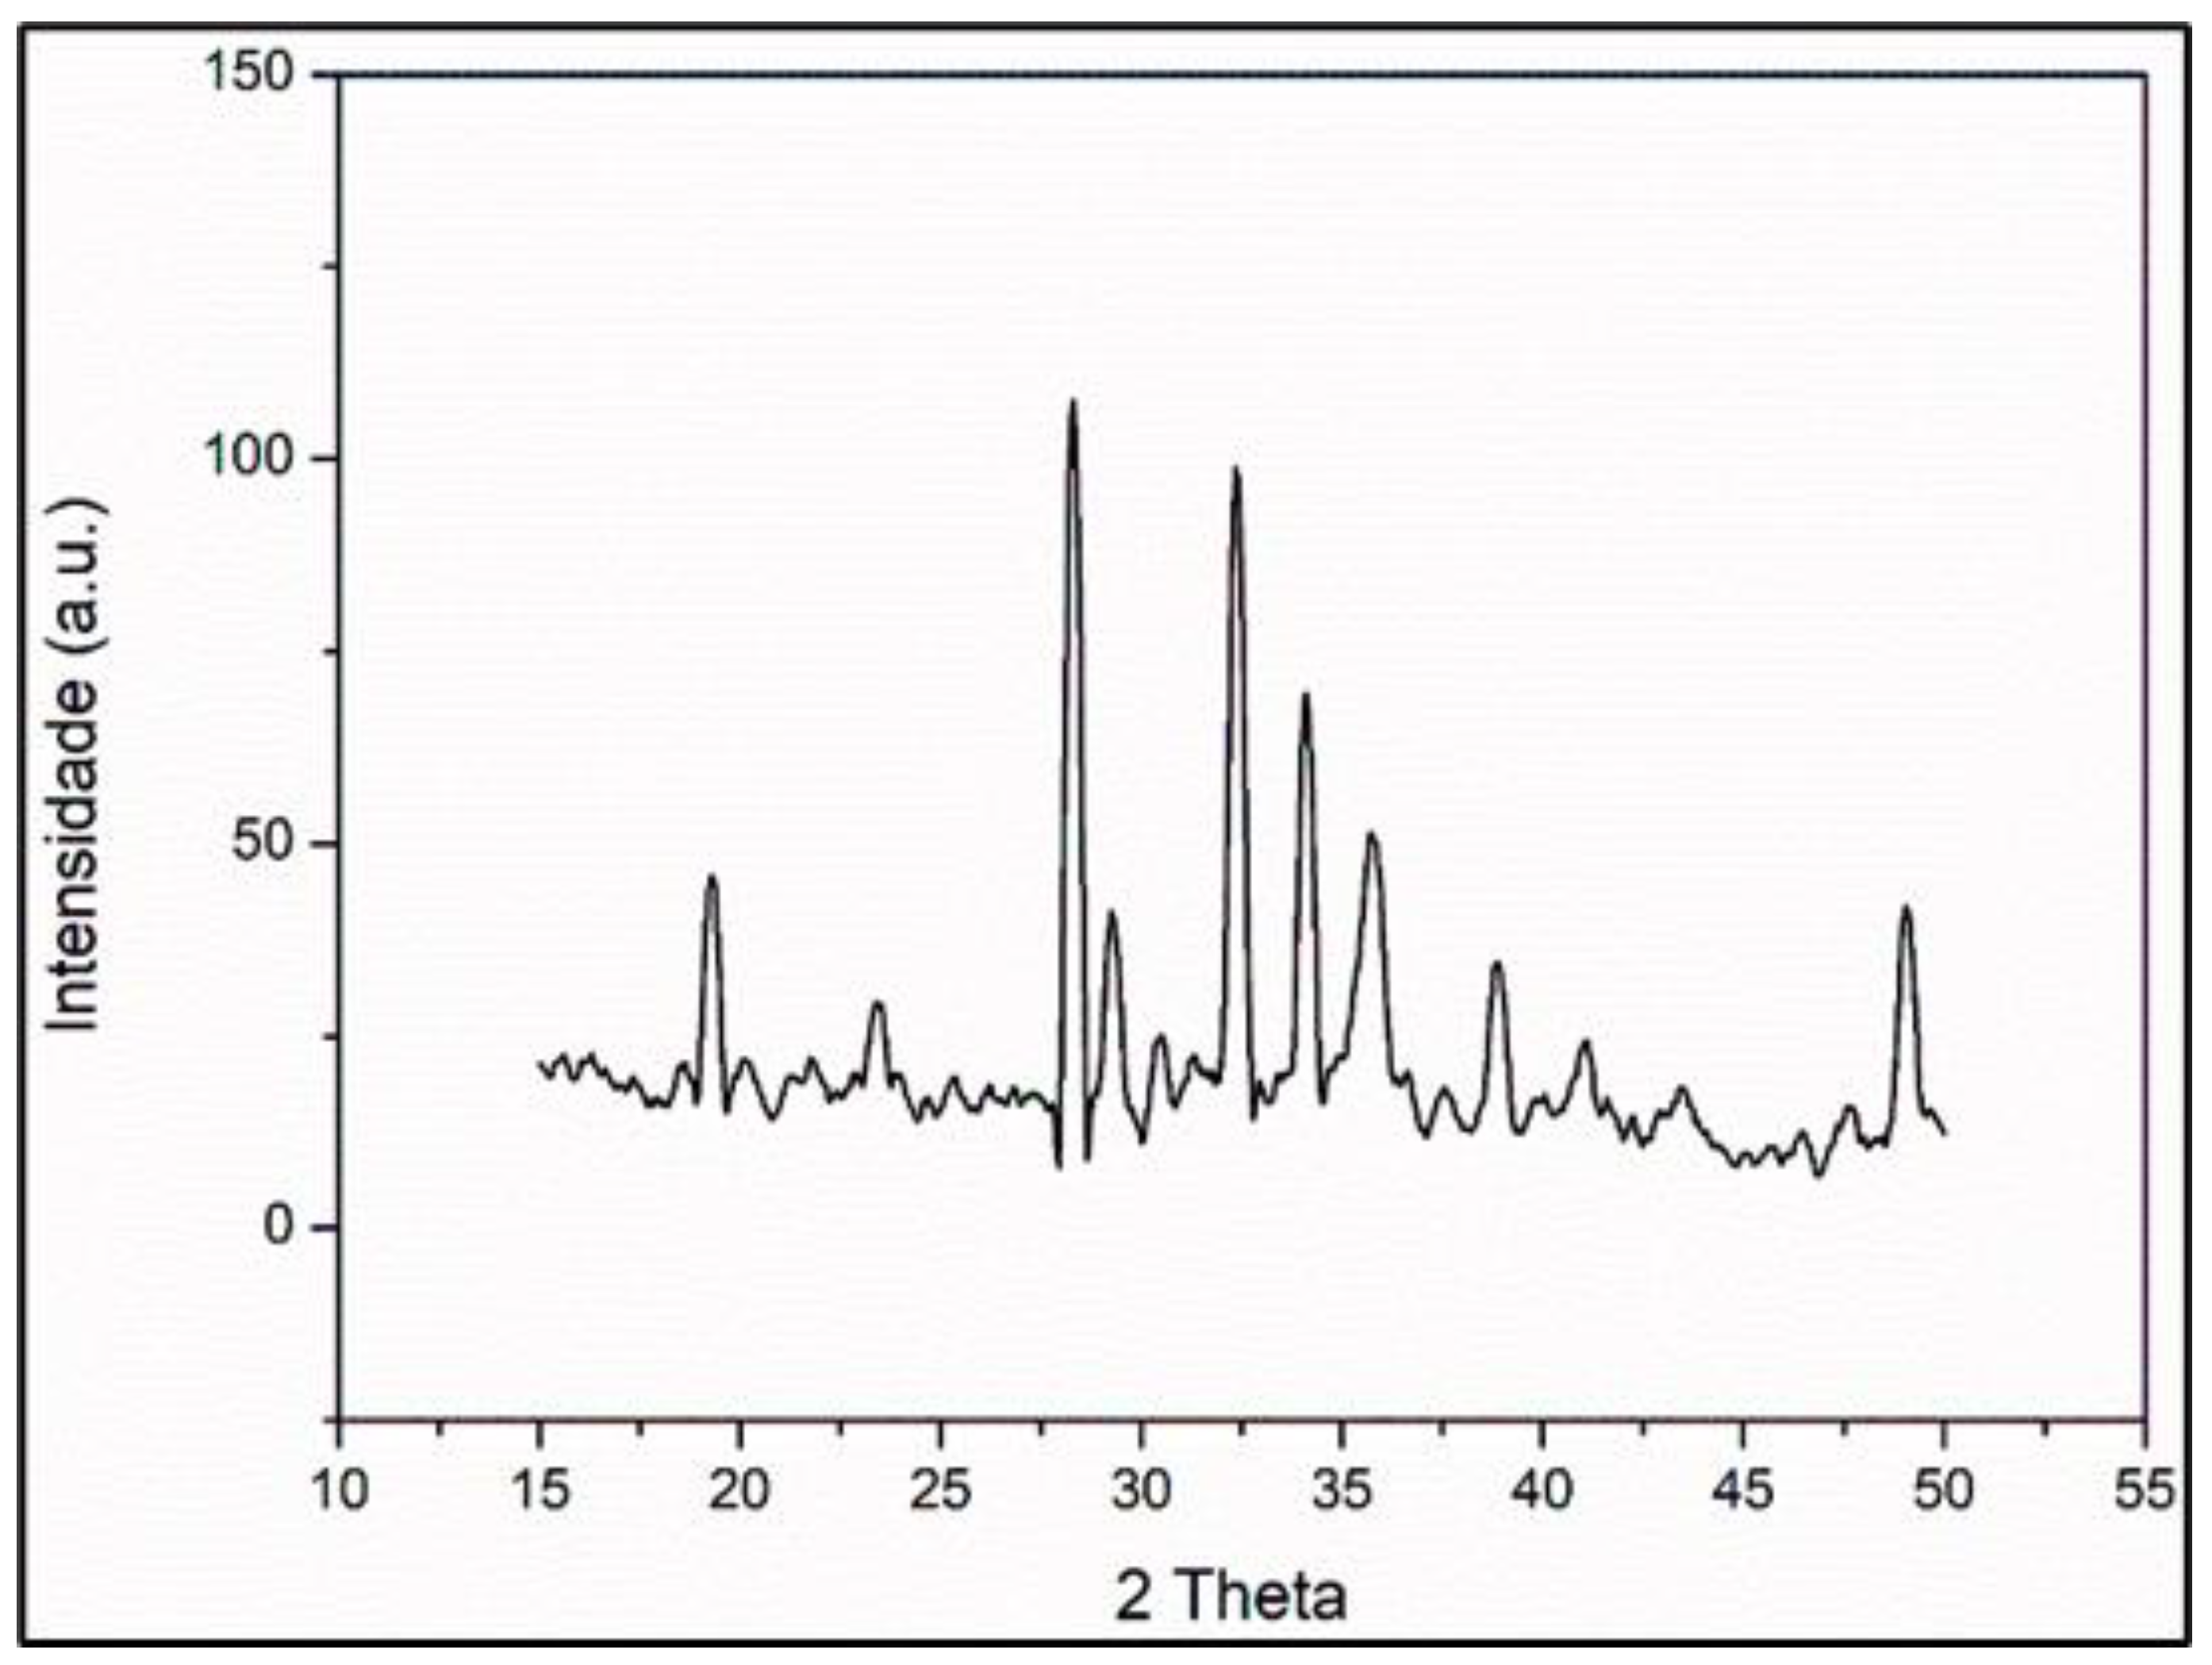
3.7.5. X-Ray Diffraction

In the nanoparticles’ XRD (Figure 10) are evidenced nine main diffraction peaks with 2θ values between 15 and 50°, corresponding to the hematite crystal planes (α-Fe2O3, JCPDS Card No. 33-0664), which are properly specified in Table 3. To calculate the average crystallite diameter (D), the Debye–Scherrer equation (D = k λ/b cosθ), with k being Scherrer’s constant, λ the X-ray wavelength for Cu-Ka radiation, θ the diffraction angle, and b the full width at half maximum—FWHM—of the corresponding XRD peak [55,56,57]. The average green photocatalyst crystal sizes calculated were D = 57 nm. These data are in fair accordance with the SAED (Figure 6c) findings.

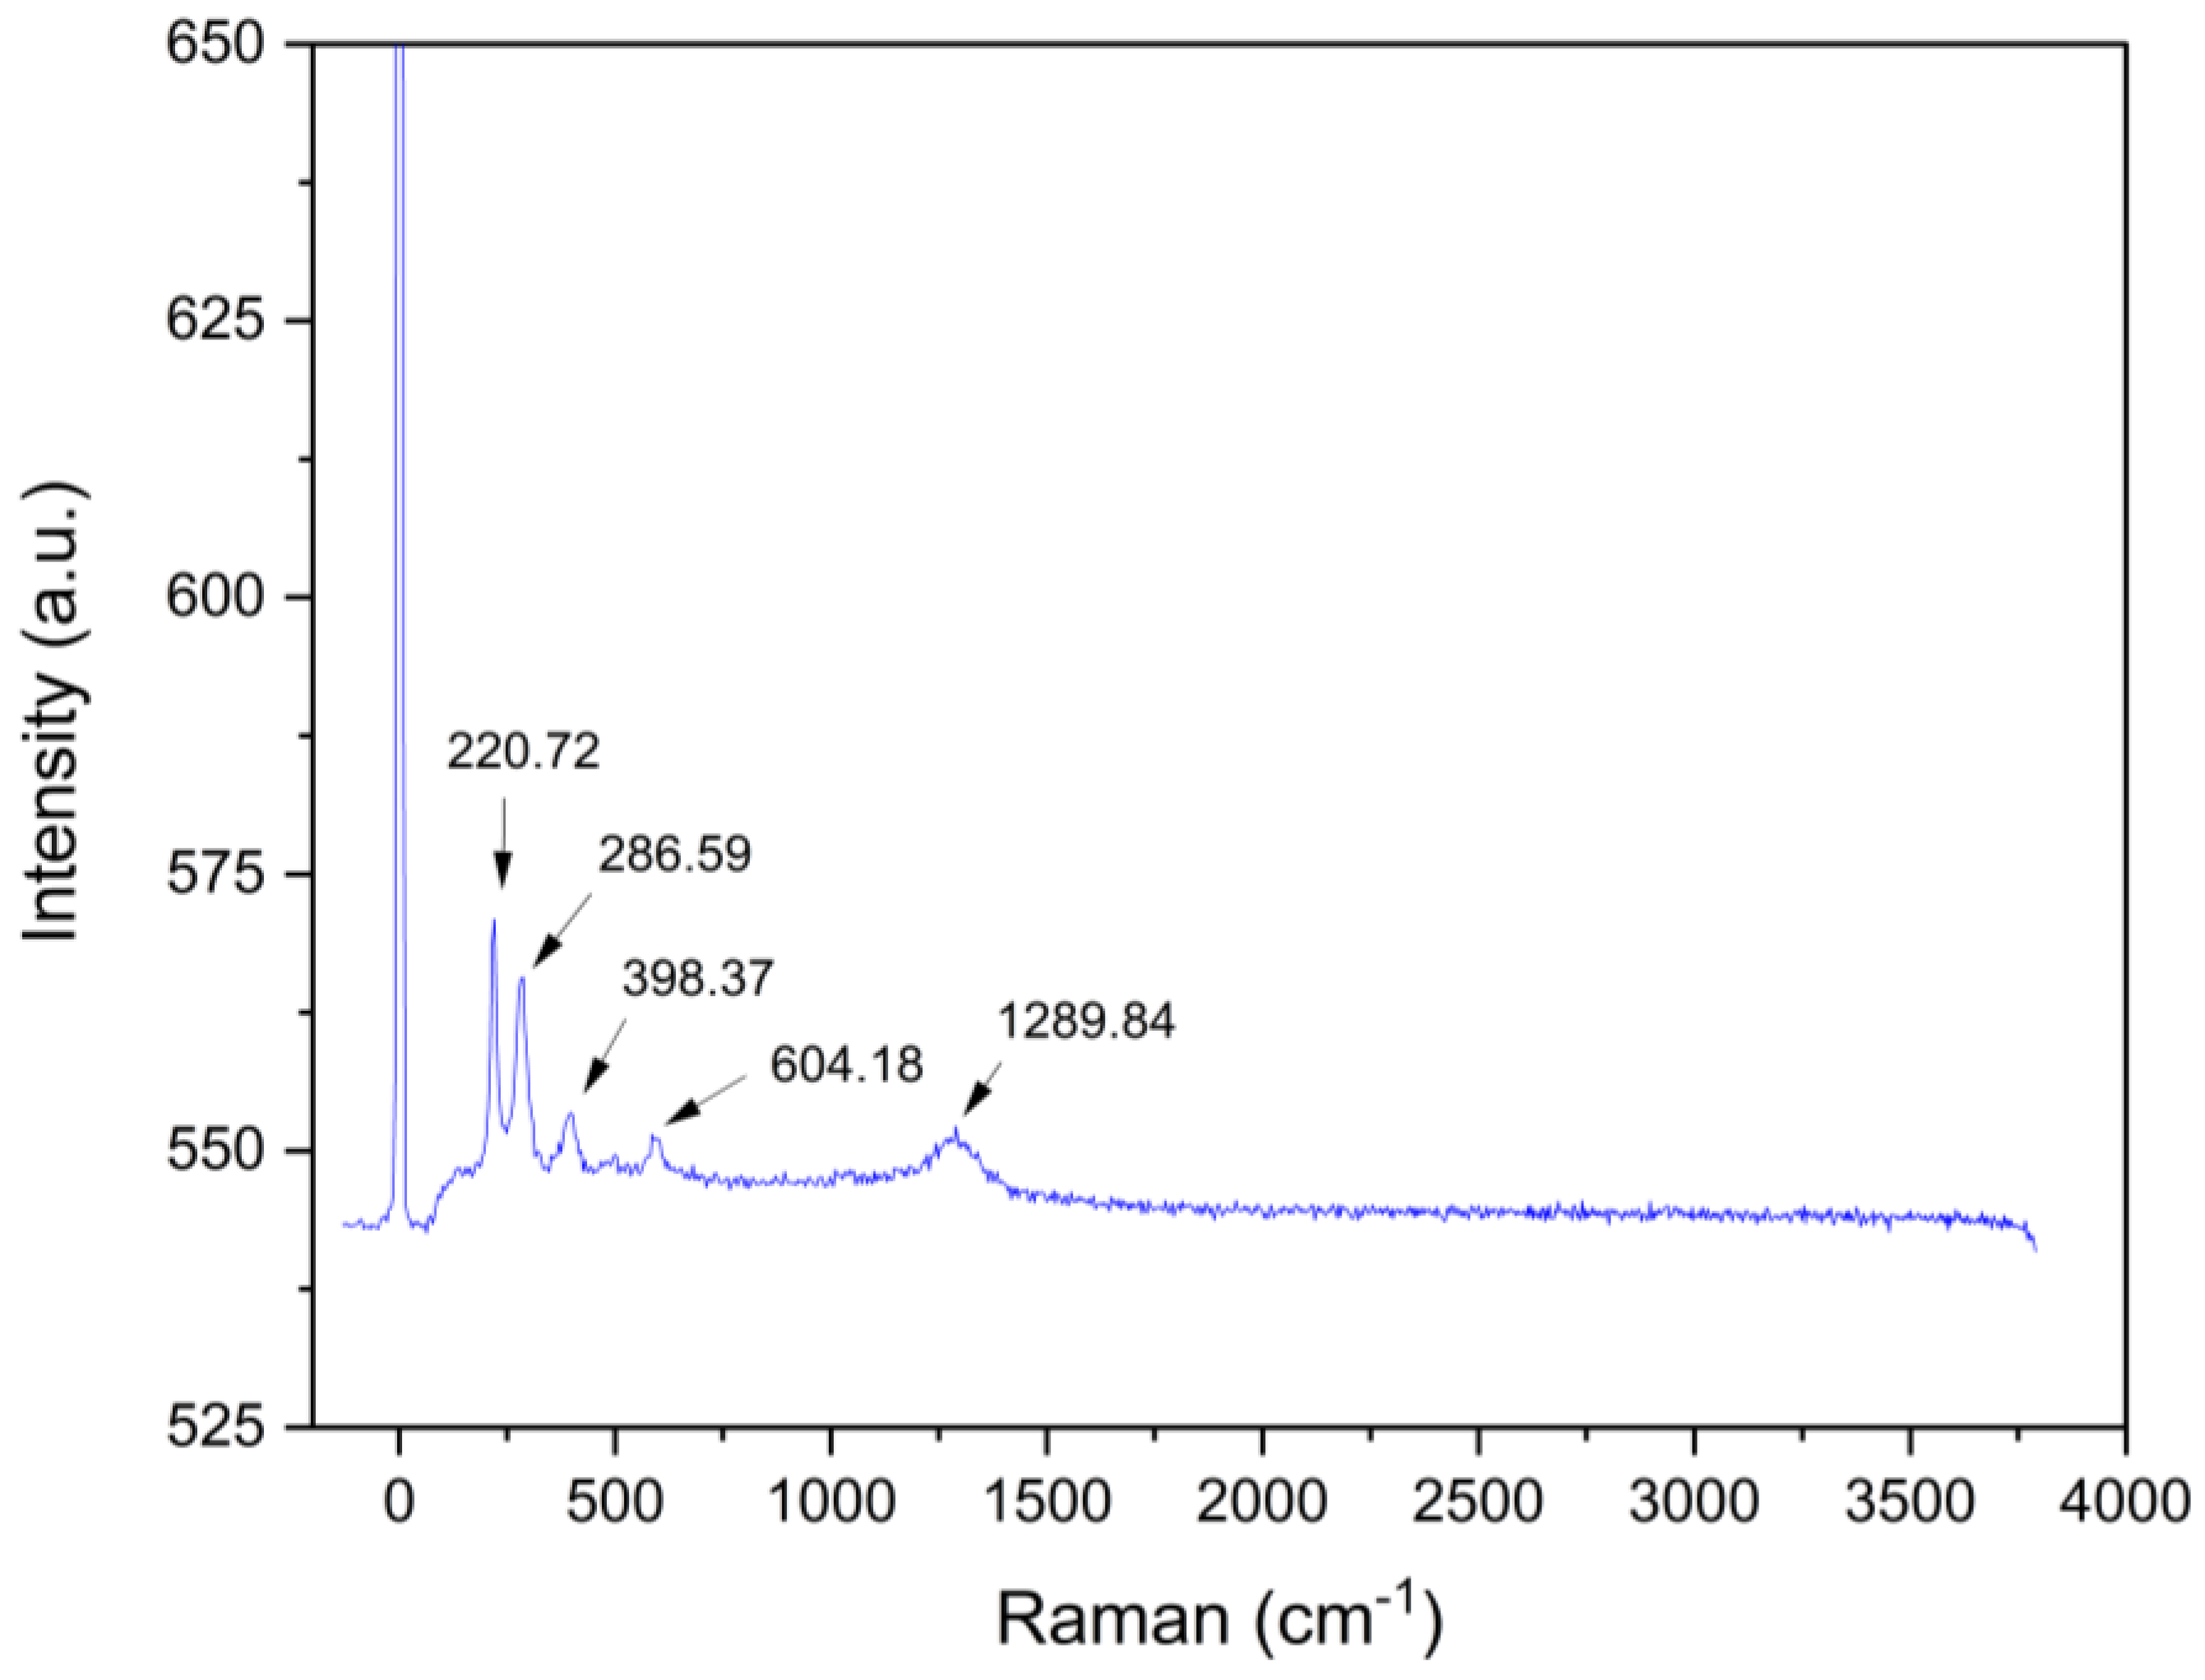
3.7.6. Raman Spectrum
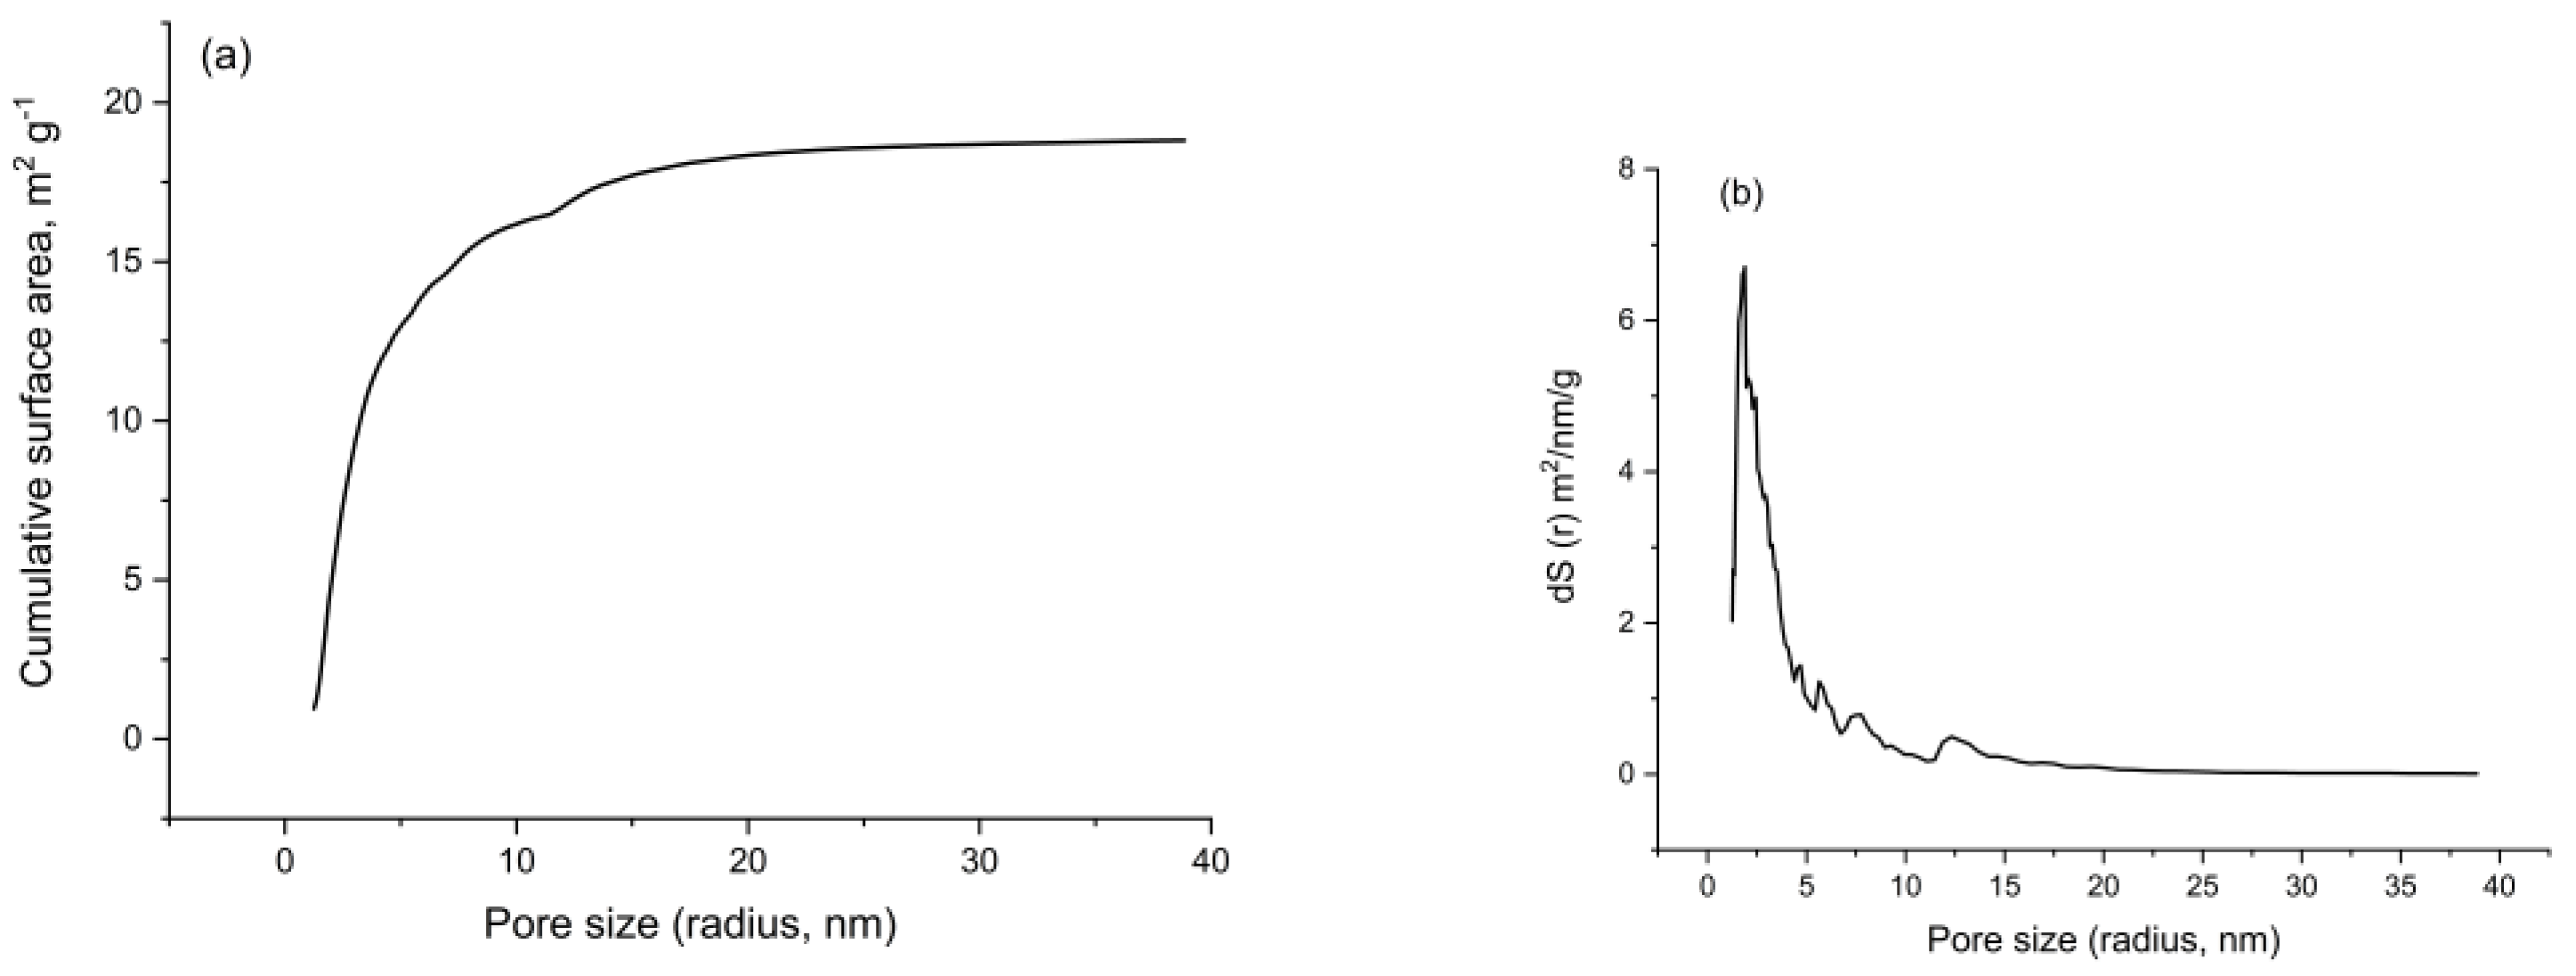
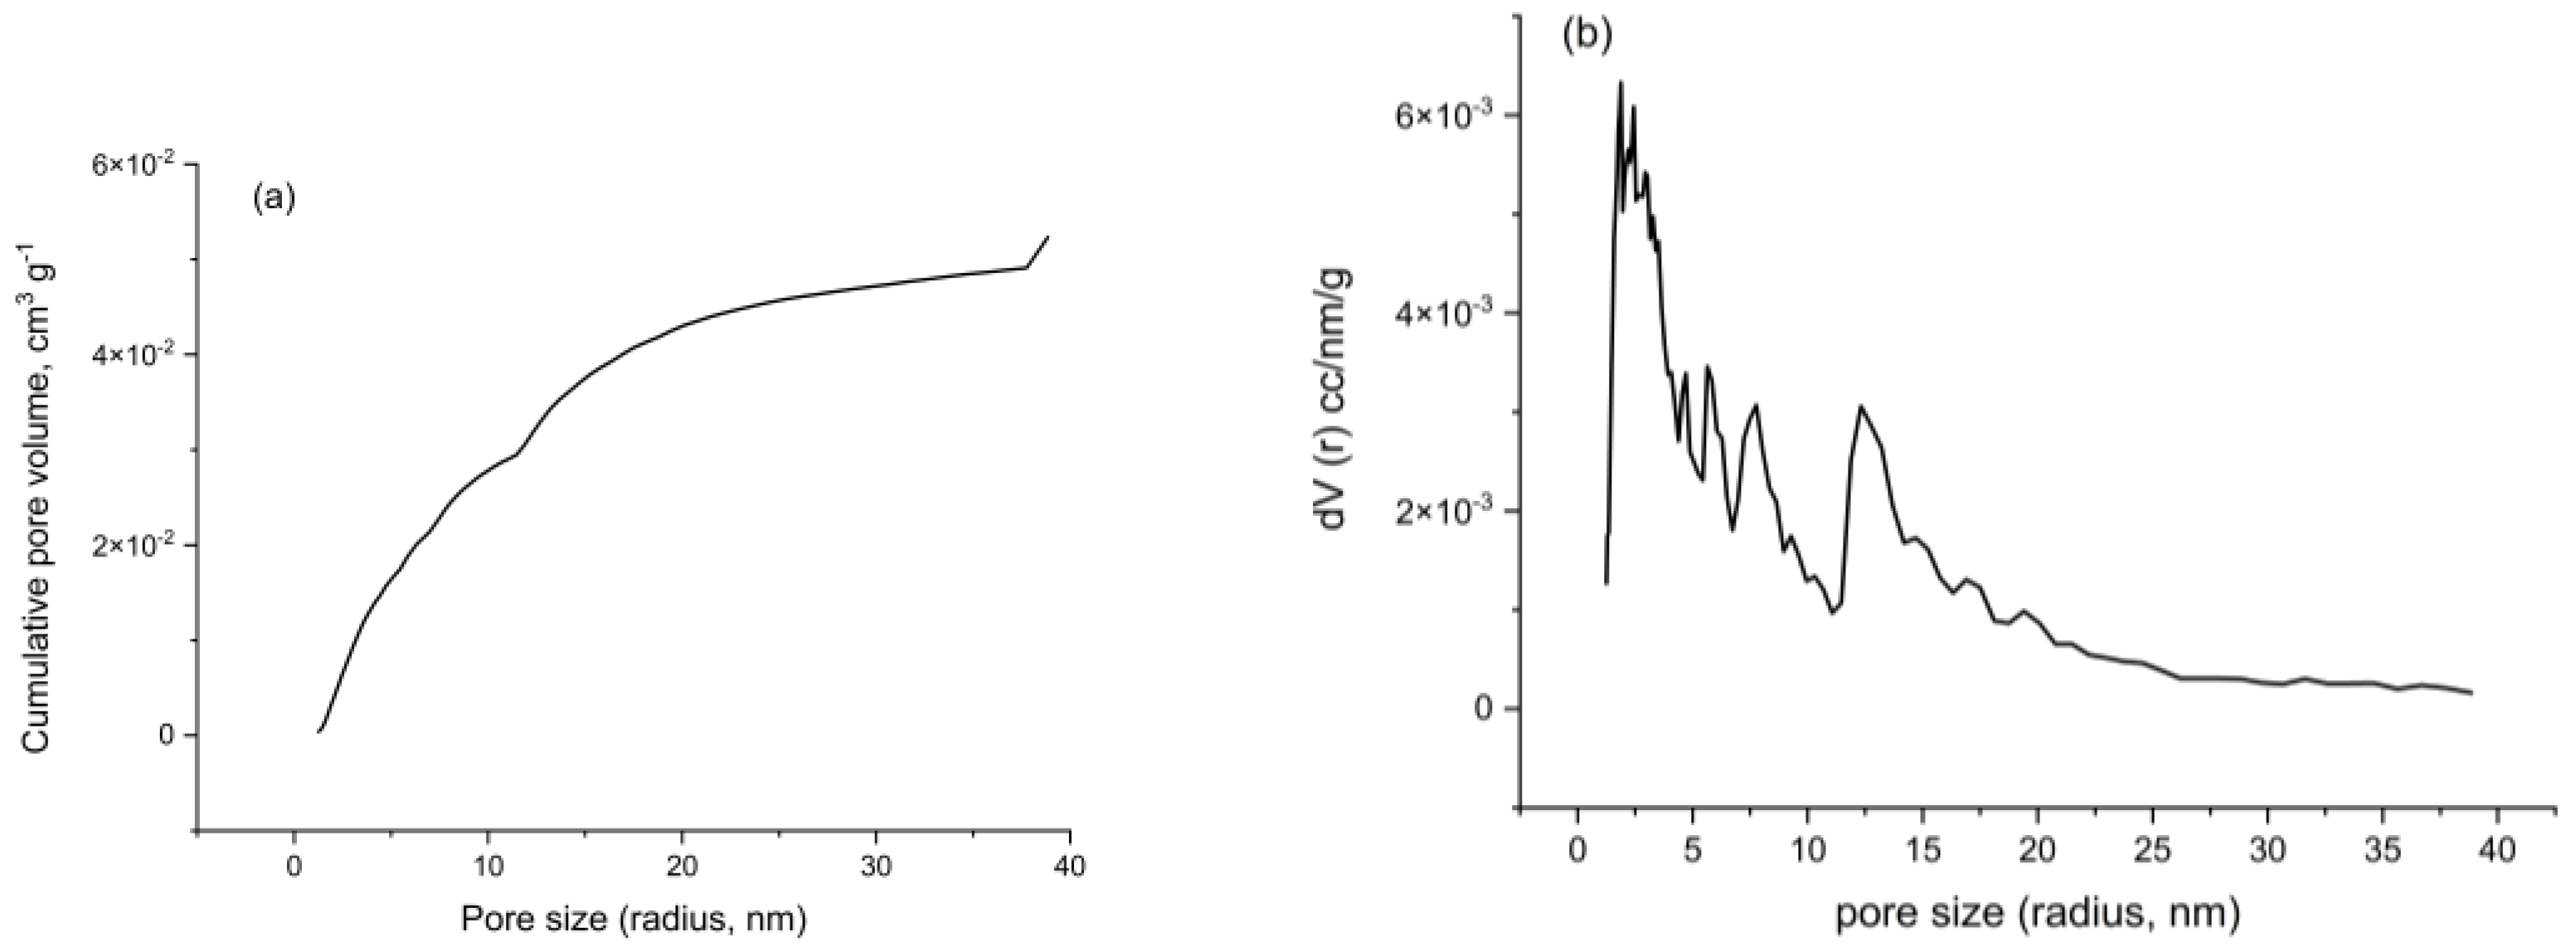
Figure 11 displays the identification of five Raman shifts in the green photocatalyst spectrum. These shifts are 220.72, 286.59, 398.37, 604.18, and 1289.84 cm−1. These vibrational modes are characteristic of iron oxide and may be related to the hematite phase. The signal near 220.71 cm−1 may be related to the A1g (1) mode, 286.59 cm−1 to the Eg (2) mode, 398.37 cm−1 to the Eg (4) mode, and the 604.18 cm−1 signal to the Eg (5) mode. Additionally, hematite has an intense signal predicted at 1320 cm−1, which may be related to the peak at 1289.84 cm−1 in this study [58,59].

3.7.7. Surface Area

The adsorption and desorption isotherm of nitrogen on the green photocatalyst can be seen in Figure 12. The BET analysis can determine the surface area of green photocatalyst, which was measured as 22.86 m2 g−1. The cumulative surface area and the distribution of surface area can be seen in Figure 13. The total pore volume for pores smaller than 66.96 nm (radius) is 5.08 × 10⁻² cm3 g−1. The cumulative pore volume and the distribution of pore volume can be seen in Figure 14. The surface area found in this work is consistent with previous studies for iron nanoparticles using oak leaves and eucalyptus leaves [60].

4. Conclusions

The synthesis of the green iron-based photocatalyst, mediated by a plant extract, was successful, resulting in a material with a nanoneedle longitudinal morphology, low agglomeration, and a rough surface, identified as the hematite phase. Experimental investigation demonstrated that, with the application of 1 g L−1 of the photocatalyst, approximately 80% of amoxicillin (10 mg L−1) was degraded in 300 min at the natural pH of the solution (pH = 6). Changes in pH did not significantly improve pollutant degradation. Mass spectrometry identified two by-products formed during the degradation process. This study confirms the viability of the green photocatalyst, synthesized through an eco-friendly method without the use of toxic reagents, and reveals that, under optimal conditions and UV irradiation, the material achieved satisfactory results in the degradation of amoxicillin.

Author Contributions

R.M.B.R.: Data curation, Methodology Investigation, Writing—original draft, Writing—original draft. P.I.M.: Writing—original draft, Writing—review and editing, Investigation. L.V.M.d.R.: Data curation, Investigation. O.O.S.: Investigation, Writing—review and editing, Visualization. E.R.A.: Conceptualization, Writing—review and editing, Visualization. T.L.P.D.: Supervision, Conceptualization, Project administration, Methodology, Resources. All authors have read and agreed to the published version of the manuscript.

Funding

This work was funded by the Coordination Improvement of Higher Education Personnel CAPES (nº 88887.818311/2023-00), a Brazilian government agency.

Institutional Review Board Statement

Not applicable.

Informed Consent Statement

Not applicable.

Data Availability Statement

The original contributions presented in the study are included in the article, further inquiries can be directed to the corresponding authors.

Acknowledgments

The authors thanks to the support from the Graduation Program of Food Engineering (PPGEAL-UFPR) and Coordination Improvement of Higher Education Personnel (CAPES), a Brazilian government agency.

Conflicts of Interest

The authors declare no conflicts of interest.

References

  1. Sodhi, K.K.; Kumar, M.; Singh, D.K. Insight into the amoxicillin resistance, ecotoxicity, and remediation strategies. J. Water Process Eng. 2021, 39, 101858. [Google Scholar] [CrossRef]
  2. Elizalde-Velázquez, A.; Gómez-Oliván, L.M.; Galar-Martínez, M.; Islas-Flores, H.; Dublán-García, O.; SanJuan-Reyes, N. Amoxicillin in the Aquatic Environment, Its Fate and Environmental Risk, Environmental Health Risk; IntechOpen: London, UK, 2016. [Google Scholar] [CrossRef]
  3. Aryee, A.A.; Han, R.; Qu, L. Occurrence, detection and removal of amoxicillin in wastewater: A review. J. Clean. Prod. 2022, 368, 1221140. [Google Scholar] [CrossRef]
  4. Rodriguez-Mozaz, S.; Vaz-Moreira, I.; Della Giustina, S.V.; Llorca, M.; Barceló, D.; Schubert, S.; Berendonk, T.U.; Michael-Kordatou, I.; Fatta-Kassinos, D.; Martinez, J.L.; et al. Antibiotic residues in final effluents of European wastewater treatment plants and their impact on the aquatic environment. Environ. Int. 2020, 140, 105733. [Google Scholar] [CrossRef]
  5. Dias, I.M.; Mourão, L.C.; Andrade, L.A.; Souza, G.B.; Viana, J.C.; Oliveira, S.B.; Alonso, C.G. Degradation of antibiotic amoxicillin from pharmaceutical industry wastewater into a continuous flow reactor using supercritical water gasification. Water Res. 2023, 234, 119826. [Google Scholar] [CrossRef] [PubMed]
  6. Nisha, A.R. Antibiotic residues—A global health hazard. Vet. World 2008, 2, 375–377. [Google Scholar] [CrossRef]
  7. Chowdhury, J.; Mandal, T.K.; Mondal, S. Genotoxic impact of emerging contaminant amoxicillin residue on zebra fish (Danio rerio) embryos. Heliyon 2020, 6, e05379. [Google Scholar] [CrossRef]
  8. Ayanda, O.S.; Aremu, O.H.; Akintayo, C.O.; Sodeinde, K.O.; Igboama, W.N.; Oseghe, E.O.; Nelana, S.M. Sonocatalytic degradation of amoxicillin from aquaculture effluent by zinc oxide nanoparticles. Environ. Nanotechnol. Monit. Manag. 2021, 16, 100513. [Google Scholar] [CrossRef]
  9. Tung, M.H.T.; Phuong, T.T.T.; Le Chi, N.T.P.; The, D.M.; Quoc, N.T.; Khan, D.T.; Pham, T.-D.; Khoa, N.V.; Hien, T.T.T.; Cam, N.T.D. Novel amoxicillin degradation via photocatalysis of WO3/AgI heterojunction decorated on rGO. Ceram. Int. 2022, 49, 10881–10888. [Google Scholar] [CrossRef]
  10. Alwared, A.I.; Sulaiman, F.A.; Raad, H.; Al-Musawi, T.J.; Mohammed, N.A. Ability of FeNi3/SiO2/TiO2 nanocomposite to degrade amoxicillin in wastewater samples in solar light-driven processes. S. Afr. J. Bot. 2022, 153, 195–202. [Google Scholar] [CrossRef]
  11. Mohapatra, S.; Snow, D.; Shea, P.; Gálvez-Rodríguez, A.; Kumar, M.; Padhye, L.P.; Mukherji, S. Photodegradation of a mixture of five pharmaceuticals commonly found in wastewater: Experimental and computational analysis. Environ. Res. 2022, 216, 114659. [Google Scholar] [CrossRef]
  12. Ma, X.; Liu, G.; Wang, L.; Xin, S.; Zhang, B.; Chen, Q.; Yan, Q.; Zhang, G.; Zhang, Y.; Xin, Y. High efficiency 2D/0D/3D Z-scheme rGO@g-C3N4/TiO2 nanobelt-tubes heterojunction for tetracycline degradation under visible light: Electrochemical synthesis, performance, and mechanisms. J. Environ. Chem. Eng. 2023, 11, 110483. [Google Scholar] [CrossRef]
  13. Hirami, Y.; Hunge, Y.M.; Suzuki, N.; Rodríguez-González, V.; Kondo, T.; Yuasa, M.; Fujishima, A.; Teshima, K.; Terashima, C. Enhanced degradation of ibuprofen using a combined treatment of plasma and Fenton reactions. J. Colloid Interface Sci. 2023, 642, 829–836. [Google Scholar] [CrossRef] [PubMed]
  14. Anjali, R.; Shanthakumar, S. Simultaneous degradation of amoxicillin, ciprofloxacin and acetaminophen in a mixture by ozonation: Kinetics and mechanisms pathway. J. Clean. Prod. 2022, 378, 134509. [Google Scholar] [CrossRef]
  15. Hu, J.; Bian, X.; Xia, Y.; Weng, M.; Zhou, W.; Dai, Q. Application of response surface methodology in electrochemical degradation of amoxicillin with Cu-PbO2 electrode: Optimization and mechanism. Sep. Purif. Technol. 2020, 250, 117109. [Google Scholar] [CrossRef]
  16. Xie, W.; Huang, Z.; Zhou, F.; Li, Y.; Bi, X.; Bian, Q.; Sun, S. Heterogeneous fenton-like degradation of amoxicillin using MOF-derived Fe0 embedded in mesoporous carbon as an effective catalyst. J. Clean. Prod. 2021, 313, 127754. [Google Scholar] [CrossRef]
  17. Brito, N.N.; Silva, V.B.M. Advanced oxidative process and environmental application. Rev. Eletrônica Eng. Civ. 2012, 1, 36–47. [Google Scholar]
  18. Fioreze, M.; dos Santos, E.P.; Schmachtenberg, N. Processos oxidativos avançados: Fundamentos e aplicação ambiental. Rev. Cent. Cienc. Nat. Exatas 2014, 18, 19–91. [Google Scholar] [CrossRef]
  19. Choudhary, S. Role of nano catalysts in green chemistry. J. Sci. Innov. Nat. Earth 2024, 4, 8–11. [Google Scholar] [CrossRef]
  20. Xiao, Z.; Yuan, M.; Yang, B.; Liu, Z.; Huang, J.; Sun, D. Plant-mediated synthesis of highly active iron nanoparticles for Cr (VI) removal: Investigation of the leading biomolecules. Chemosphere 2016, 150, 357–364. [Google Scholar] [CrossRef]
  21. Bolade, O.P.; Williams, A.B.; Benson, N.U. Green synthesis of iron-based nanomaterials for environmental remediation: A review. Environ. Nanotechnol. Monit. Manag. 2020, 13, 100279. [Google Scholar] [CrossRef]
  22. AlSalka, Y.; Granone, L.I.; Ramadan, W.; Hakki, A.; Dillert, R.; Bahnemann, D.W. Iron-based photocatalytic and photoelectrocatalytic nano-estructures: Facts, perspectives, and expectations. Appl. Catal. B Environ. 2019, 244, 1065–1095. [Google Scholar] [CrossRef]
  23. Lalnunthari, C.; Devi, L.M.; Amami, E.; Badwaik, L.S. Valorisation of pumpkin seeds and peels into biodegradable packaging films. Food Bioprod. Process. 2019, 118, 58–66. [Google Scholar] [CrossRef]
  24. Ramos, R.M.B.; Paludo, L.C.; Monteiro, P.I.; da Rocha, L.V.M.; de Moraes, C.V.; Santos, O.O.; Alves, E.R.; Dantas, T.L.P. Amoxicillin degradation by iron photonanocatalyst synthetized by green route using pumpkin (Tetsukabuto) peel extract. Talanta 2023, 260, 124658. [Google Scholar] [CrossRef] [PubMed]
  25. Ramos, R.M.B.; Monteiro, P.I.; Biz, A.P.; Paludo, L.C.; Tasso, I.d.S.; da Rocha, L.V.M.; Alves, E.R.; Dantas, T.L.P. Green synthesis and characterization of magnesium nanoparticles using pumpkin peel extract (Tetsukabuto). Obs. Econ. Latinoam. 2024, 22, e573. [Google Scholar] [CrossRef]
  26. Liu, J.; Liang, R.; Hu, Z.; Zhang, X.; Zhou, M. Photoelectrocatalysis/photoelectro-Fenton system based on cone-like TiO2/nickel foam photoanode for efficient degradation of carbamazepine: Comparison with DSA. Chem. Eng. J. 2024, 491, 152088. [Google Scholar] [CrossRef]
  27. Wang, J.; Zhou, X.; Hao, J.; Wang, Z.; Huo, B.; Qi, J.; Wang, Y.; Meng, F. Sustainable self-powered degradation of antibiotics using Fe3O4@MoS2/PVDF modified pipe with superior piezoelectric activity: Mechanism insight, toxicity assessment and energy consumption. Appl. Catal. B Environ. 2023, 331, 122655. [Google Scholar] [CrossRef]
  28. Wahyuni, E.T.; Cahyono, R.N.; Nora, M.; Alharissa, E.Z.; Kunarti, E.S. Degradation of amoxicillin residue under visible light over TiO2 doped with Cr prepared from tannery wastewater. Results Chem. 2024, 7, 101302. [Google Scholar] [CrossRef]
  29. Mohammadi, A.; Kazemeini, M.; Sadjadi, S. A developed novel Hal′@MIL-PMA triple composite utilized as a robust photocatalyst for activated removal of antibiotic contaminants: A new chemical mechanism for Tetracycline degradation. J. Environ. Chem. Eng. 2024, 12, 112941. [Google Scholar] [CrossRef]
  30. Harikumar, B.; Khan, S.S. Hierarchical construction of ZrO2/CaCr2O4/BiOIO3 ternary photocatalyst: Photodegradation of antibiotics, degradation pathway, toxicity assessment, and genotoxicity studies. Chem. Eng. J. 2022, 442, 136107. [Google Scholar] [CrossRef]
  31. Khalaji, A.D. NiFe2O4 prepared by the chitosan-assisted route for the photodegradation of methylene blue under simulated sun light irradiation. Chem. Phys. Impact 2024, 8, 00652. [Google Scholar] [CrossRef]
  32. Wahyuni, E.T.; Yulikayani, P.Y.; Aprilita, N.H. Enhancement of visible-light photocatalytic activity of Cu-doped TiO2 for photodegradation of amoxicillin in water. J. Mater. Environ. Sci. 2020, 11, 670–683. [Google Scholar]
  33. Safari, M.; Rezaee, R.; Soltani, R.D.C.; Ghorbani, M.; Faridan, M.; Wantala, K.; Shivaraju, H.; Shahmoradi, B. Solar photocatalytic degradation of amoxicillin using Ni:TiO2 nanocatalyst stabilized on ceramic plates. Desalination Water Treat. 2022, 270, 163–171. [Google Scholar] [CrossRef]
  34. Rocha, H.F.; Silva, V.; Lima, D.L.; Calisto, V. Evaluation of the impact of photodegradation processes on the environmental persistence of amoxicillin. Case Stud. Chem. Environ. Eng. 2024, 9, 100724. [Google Scholar] [CrossRef]
  35. Mahlaule-Glory, L.M.; Mapetla, S.; Makofane, A.; Mathipa, M.M.; Hintsho-Mbita, N.C. Biosynthesis of iron oxide nanoparticles for the degradation of methylene blue dye, sulfisoxazole antibiotic and removal of bacteria from real water. Heliyon 2022, 8, e10536. [Google Scholar] [CrossRef] [PubMed]
  36. Wang, H.; Li, X.; Zhao, X.; Li, C.; Song, X.; Zhang, P.; Huo, P. A review on heterogeneous photocatalysis for environmental remediation: From semiconductors to modification strategies. Chin. J. Catal. 2022, 43, 178–214. [Google Scholar] [CrossRef]
  37. Haritha, E.; Roopan, S.M.; Madhavi, G.; Elango, G.; Al-Dhabi, N.A.; Arasu, M.V. Green chemical approach towards the synthesis of SnO2 NPs in argument with photocatalytic degradation of diazo dye and its kinetic studies. J. Photochem. Photobiol. B Biol. 2016, 162, 441–447. [Google Scholar] [CrossRef] [PubMed]
  38. Bhuiyan, S.H.; Miah, M.Y.; Paul, S.C.; Das Aka, T.; Saha, O.; Rahaman, M.; Sharif, J.I.; Habiba, O.; Ashaduzzaman, M. Green synthesis of iron oxide nanoparticle using Carica papaya leaf extract: Application for photocatalytic degradation of remazol yellow RR dye and antibacterial activity. Heliyon 2020, 6, e04603. [Google Scholar] [CrossRef]
  39. Verbruggen, S.W. TiO2 photocatalysis for the degradation of pollutants in gas phase: From morphological design to plasmonic enhancement. J. Photochem. Photobiol. C Photochem. Rev. 2015, 24, 64–82. [Google Scholar] [CrossRef]
  40. Rosales, M.; Orive, J.; Espinoza-González, R.; de Luis, R.F.; Gauvin, R.; Brodusch, N.; Rodríguez, B.; Gracia, F.; García, A. Evaluating the bi-functional capacity for arsenic photo-oxidation and adsorption on anatase TiO2 nanostructures with tunable morphology. Chem. Eng. J. 2021, 415, 128906. [Google Scholar] [CrossRef]
  41. Zheng, F.; Queirós, J.M.; Martins, P.M.; de Luis, R.F.; Fidalgo-Marijuan, A.; Vilas-Vilela, J.L.; Lanceros-Méndez, S.; Reguera, J. Au-sensitised TiO2 and ZnO nanoparticles for broadband pharmaceuticals photocatalytic degradation in water remediation. Colloids Surfaces A Physicochem. Eng. Asp. 2023, 671, 131594. [Google Scholar] [CrossRef]
  42. Aba-Guevara, C.G.; Medina-Ramírez, I.E.; Hernández-Ramírez, A.; Jáuregui-Rincón, J.; Lozano-Álvarez, J.A.; Rodríguez-López, J.L. Comparison of two synthesis methods on the preparation of Fe, N-Co-doped TiO2 materials for degradation of pharmaceutical compounds under visible light. Ceram. Int. 2017, 43, 5068–5079. [Google Scholar] [CrossRef]
  43. Liang, J.; Chen, K.; Duan, X.; Zhao, L.; Qiu, H.; Xu, X.; Cao, X. pH-dependent generation of radical and nonradical species for sulfamethoxazole degradation in different carbon/persulfate systems. Water Res. 2022, 224, 119113. [Google Scholar] [CrossRef] [PubMed]
  44. Zhang, P.; Sun, M.; Liang, J.; Xiong, Z.; Liu, Y.; Peng, J.; Yuan, Y.; Zhang, H.; Zhou, P.; Lai, B. pH-modulated oxidation of organic pollutants for water decontamination: A deep insight into reactivity and oxidation pathway. J. Hazard. Mater. 2024, 471, 134393. [Google Scholar] [CrossRef] [PubMed]
  45. Li, D.; Zhu, Q.; Han, C.; Yang, Y.; Jiang, W.; Zhang, Z. Photocatalytic degradation of recalcitrant organic pollutants in water using a novel cylindrical multi-column photoreactor packed with TiO2-coated silica gel beads. J. Hazard. Mater. 2015, 285, 398–408. [Google Scholar] [CrossRef]
  46. MubarakAli, D. Microwave irradiation mediated synthesis of needle-shaped hydroxyapatite nanoparticles as a flocculant for Chlorella vulgaris. Biocatal. Agric. Biotechnol. 2019, 17, 203–206. [Google Scholar] [CrossRef]
  47. Panneerselvam, C.; Alshehri, M.A.; Saif, A.; Faridi, U.; Khasim, S.; Mohammedsaleh, Z.M.; Parveen, H.; Omer, N.; Alasmari, A.; Mukhtar, S.; et al. Green synthesis of Abutilon indicum (L) derived iron oxide (FeO) nanoparticles with excellent biological, anticancer and photocatalytic activities. Polyhedron 2024, 257, 117022. [Google Scholar] [CrossRef]
  48. Sayed, F.N.; Polshettiwar, V. Facile and sustainable synthesis of shaped iron oxide nanoparticles: Effect of iron precursor salts on the shapes of iron oxides. Sci. Rep. 2015, 5, 9733. [Google Scholar] [CrossRef]
  49. Bensy, A.D.; Christobel, G.J.; Muthusamy, K.; Alfarhan, A.; Anantharaman, P. Green synthesis of iron nanoparticles from Ulva lactuca and bactericidal activity against enteropathogens. J. King Saud Univ.-Sci. 2022, 34, 101888. [Google Scholar] [CrossRef]
  50. Dash, A.; Ragavendran, C.; Rajendran, R. Biogenic Nickel Oxide Nanoparticles: Synthesis, Characterization and Biomedical Potential. Mol. Biotechnol. 2025. [Google Scholar] [CrossRef]
  51. Duan, Y.-T.; Soni, K.; Patel, D.; Choksi, H.; Sangani, C.B.; Saeed, W.S.; Ameta, K.L.; Ameta, R.K. Green synthesis of iron oxide nanoparticles using Nicotiana plumbaginifolia and their biological evaluation. J. Mol. Liq. 2024, 396, 123985. [Google Scholar] [CrossRef]
  52. Yassin, M.T.; Al-Otibi, F.O.; Al–Askar, A.A. Green synthesis, characterization and antimicrobial activity of iron oxide nanoparticles with tigecycline against multidrug resistant bacterial strains. J. King Saud Univ.-Sci. 2024, 36, 103131. [Google Scholar] [CrossRef]
  53. Kumari, T.; Phogat, D.; Shukla, V. Exploring the multipotentiality of plant extracts for the green synthesis of iron nanoparticles: A study of adsorption capacity and dye degradation efficiency. Environ. Res. 2023, 229, 116025. [Google Scholar] [CrossRef] [PubMed]
  54. Bhattacharjee, S.; Habib, F.; Darwish, N.; Shanableh, A. Iron sulfide nanoparticles prepared using date seed extract: Green synthesis, characterization and potential application for removal of ciprofloxacin and chromium. Powder Technol. 2021, 380, 219–228. [Google Scholar] [CrossRef]
  55. Joshi, D.P.; Pant, G.; Arora, N.; Nainwal, S. Effect of solvents on morphology, magnetic and dielectric properties of (α-Fe2O3SiO2) core-shell nanoparticles. Heliyon 2017, 3, e00253. [Google Scholar] [CrossRef] [PubMed]
  56. Shukla, S.; Jadaun, A.; Arora, V.; Sinha, R.K.; Biyani, N.; Jain, V. In vitro toxicity assessment of chitosan oligosaccharide coated iron oxide nanoparticles. Toxicol. Rep. 2015, 2, 27–39. [Google Scholar] [CrossRef]
  57. Chen, Y.-H.; Li, F.-A. Kinetic study on removal of copper(II) using goethite and hematite nano-photocatalysts. J. Colloid Interface Sci. 2010, 347, 277–281. [Google Scholar] [CrossRef]
  58. Faria, D.L.A.; Silva, S.V.; Oliveira, M.T. Raman Microspectroscopy of Some Iron Oxides and Oxyhydroxides. J. Raman Spectrosc. 1997, 28, 873–878. [Google Scholar] [CrossRef]
  59. Chamritski, I.; Burns, G. Infrared- and Raman-active phonons of magnetite, maghemite, and hematite: A computer simulation and spectroscopic study. J. Phys. Chem. B 2005, 109, 4965–4968. [Google Scholar] [CrossRef]
  60. Kamath, V.; Chandra, P.; Jeppu, G.P. Comparative study of using five different leaf extracts in the green synthesis of iron oxide nanoparticles for removal of arsenic from water. Int. J. Phytoremediat. 2020, 22, 1278–1294. [Google Scholar] [CrossRef]
Figure 1. Eco-friendly Synthesis (Dark solution and green nanoparticles).
Applsci 15 04308 g001
Figure 2. Investigation of the initial pollutant concentration (pH = 6, exposure time = 60 min, green photocatalyst dosage = 1 g L−1).
Applsci 15 04308 g002
Figure 3. Kinetics of pollutant degradation for 420 min (initial pollutant concentration = 10 mg L−1, green photocatalyst dosage = 1 g L−1, pH = 6).
Applsci 15 04308 g003
Figure 4. PCA of photodegradation parameters of the pollutant using a green photocatalyst.
Applsci 15 04308 g004
Figure 5. Analysis of the mass spectrum of the photodegraded pollutant sample (10 mg L−1) with 1 g L−1 of green photocatalyst; exposure time = 300 min; pH = 6.0.
Applsci 15 04308 g005
Figure 6. Morphological analysis by Transmission Electron Microscopy (TEM): (a) 0.5 µm; (b) 1 µm; (c) SAED patterns.
Applsci 15 04308 g006
Figure 7. Morphological analysis by Scanning Electron Microscopy (SEM) of the green photocatalyst at different magnifications: (a) 1.00 kx; (b) 5.00 kx; (c) Elemental distribution map.
Applsci 15 04308 g007
Figure 8. Functional group analysis by FTIR of the green photocatalyst.
Applsci 15 04308 g008
Figure 9. Thermal stability of the green photocatalyst: TGA (mass loss analysis) and DTGA (derivative thermogravimetric curve).
Applsci 15 04308 g009
Figure 10. Crystallinity analysis by X-ray diffraction (XRD) of the green photocatalyst.
Applsci 15 04308 g010
Figure 11. Raman spectroscopy of green photocatalyst.
Applsci 15 04308 g011
Figure 12. Adsorption–desorption isotherm at −195.8 °C (468.95 K) for the green photocatalyst using N2.
Applsci 15 04308 g012
Figure 13. Cumulative surface area (a) and surface area distribution (b) of the green photocatalyst.
Applsci 15 04308 g013
Figure 14. Cumulative pore volume (a) and pore volume distribution (b) of the green photocatalyst.
Applsci 15 04308 g014
Table 1. Degradation of the pollutant at various pH levels. Green photocatalyst dosage = 1 g L−1, exposure time = 300 min, initial concentration of pollutant = 10 mg L−1.
pHAmoxicillin ChargeGreen Photocatalyst (Surface Charge)Degradation
3.0++10.6 ± 0.8871
6.0+79.2 ± 1.2173
9.025.0 ± 2.3648
Table 2. Comparative Analysis with Previous Studies on Amoxicillin Photodegradation by Nanostructures.
Synthesis MethodDegradation (%.)Time (min) LightpHReference
Sol–gel58.61240Visible3.50[42]
Microwave46.12240Visible3.50[42]
Microwave69.15300Visible3.50[42]
Green synthesis80.00300UV6.00This study
Table 3. XRD conditions used to estimate size and kind of the green photocatalyst crystalline domains.
2 Theta Values (Degrees)Crystallographic Planes (h k l)FWHM (Degrees)
19.31110.4733
23.40120.1950
28.33111.0593
29.32220.0122
32.41040.5943
34.11100.2372
35.81131.0142
38.94000.5357
49.14220.8975
Disclaimer/Publisher’s Note: The statements, opinions and data contained in all publications are solely those of the individual author(s) and contributor(s) and not of MDPI and/or the editor(s). MDPI and/or the editor(s) disclaim responsibility for any injury to people or property resulting from any ideas, methods, instructions or products referred to in the content.

