3.1. Variation Laws of Surface Micro-Pore Structure Under Different Corrosion Mechanisms
Nuclear magnetic resonance (NMR) was used to analyze the pore structure of sandstone before and after exposure to different dissolution conditions, complemented by scanning electron microscopy (SEM) to observe microscopic morphological changes. In NMR analysis, the relaxation time (T
2) and signal intensity of the T
2 relaxation spectrum correspond to pore size and quantity, respectively. Specifically, relaxation times of [0.01, 3], [3, 50], and [50, 10,000] ms correspond to small, medium, and large pores in sandstone [
17]. Using NMR technology, the evolution of the pore structure under static and dynamic dissolution conditions was systematically characterized. The T
2 relaxation spectra, as shown in
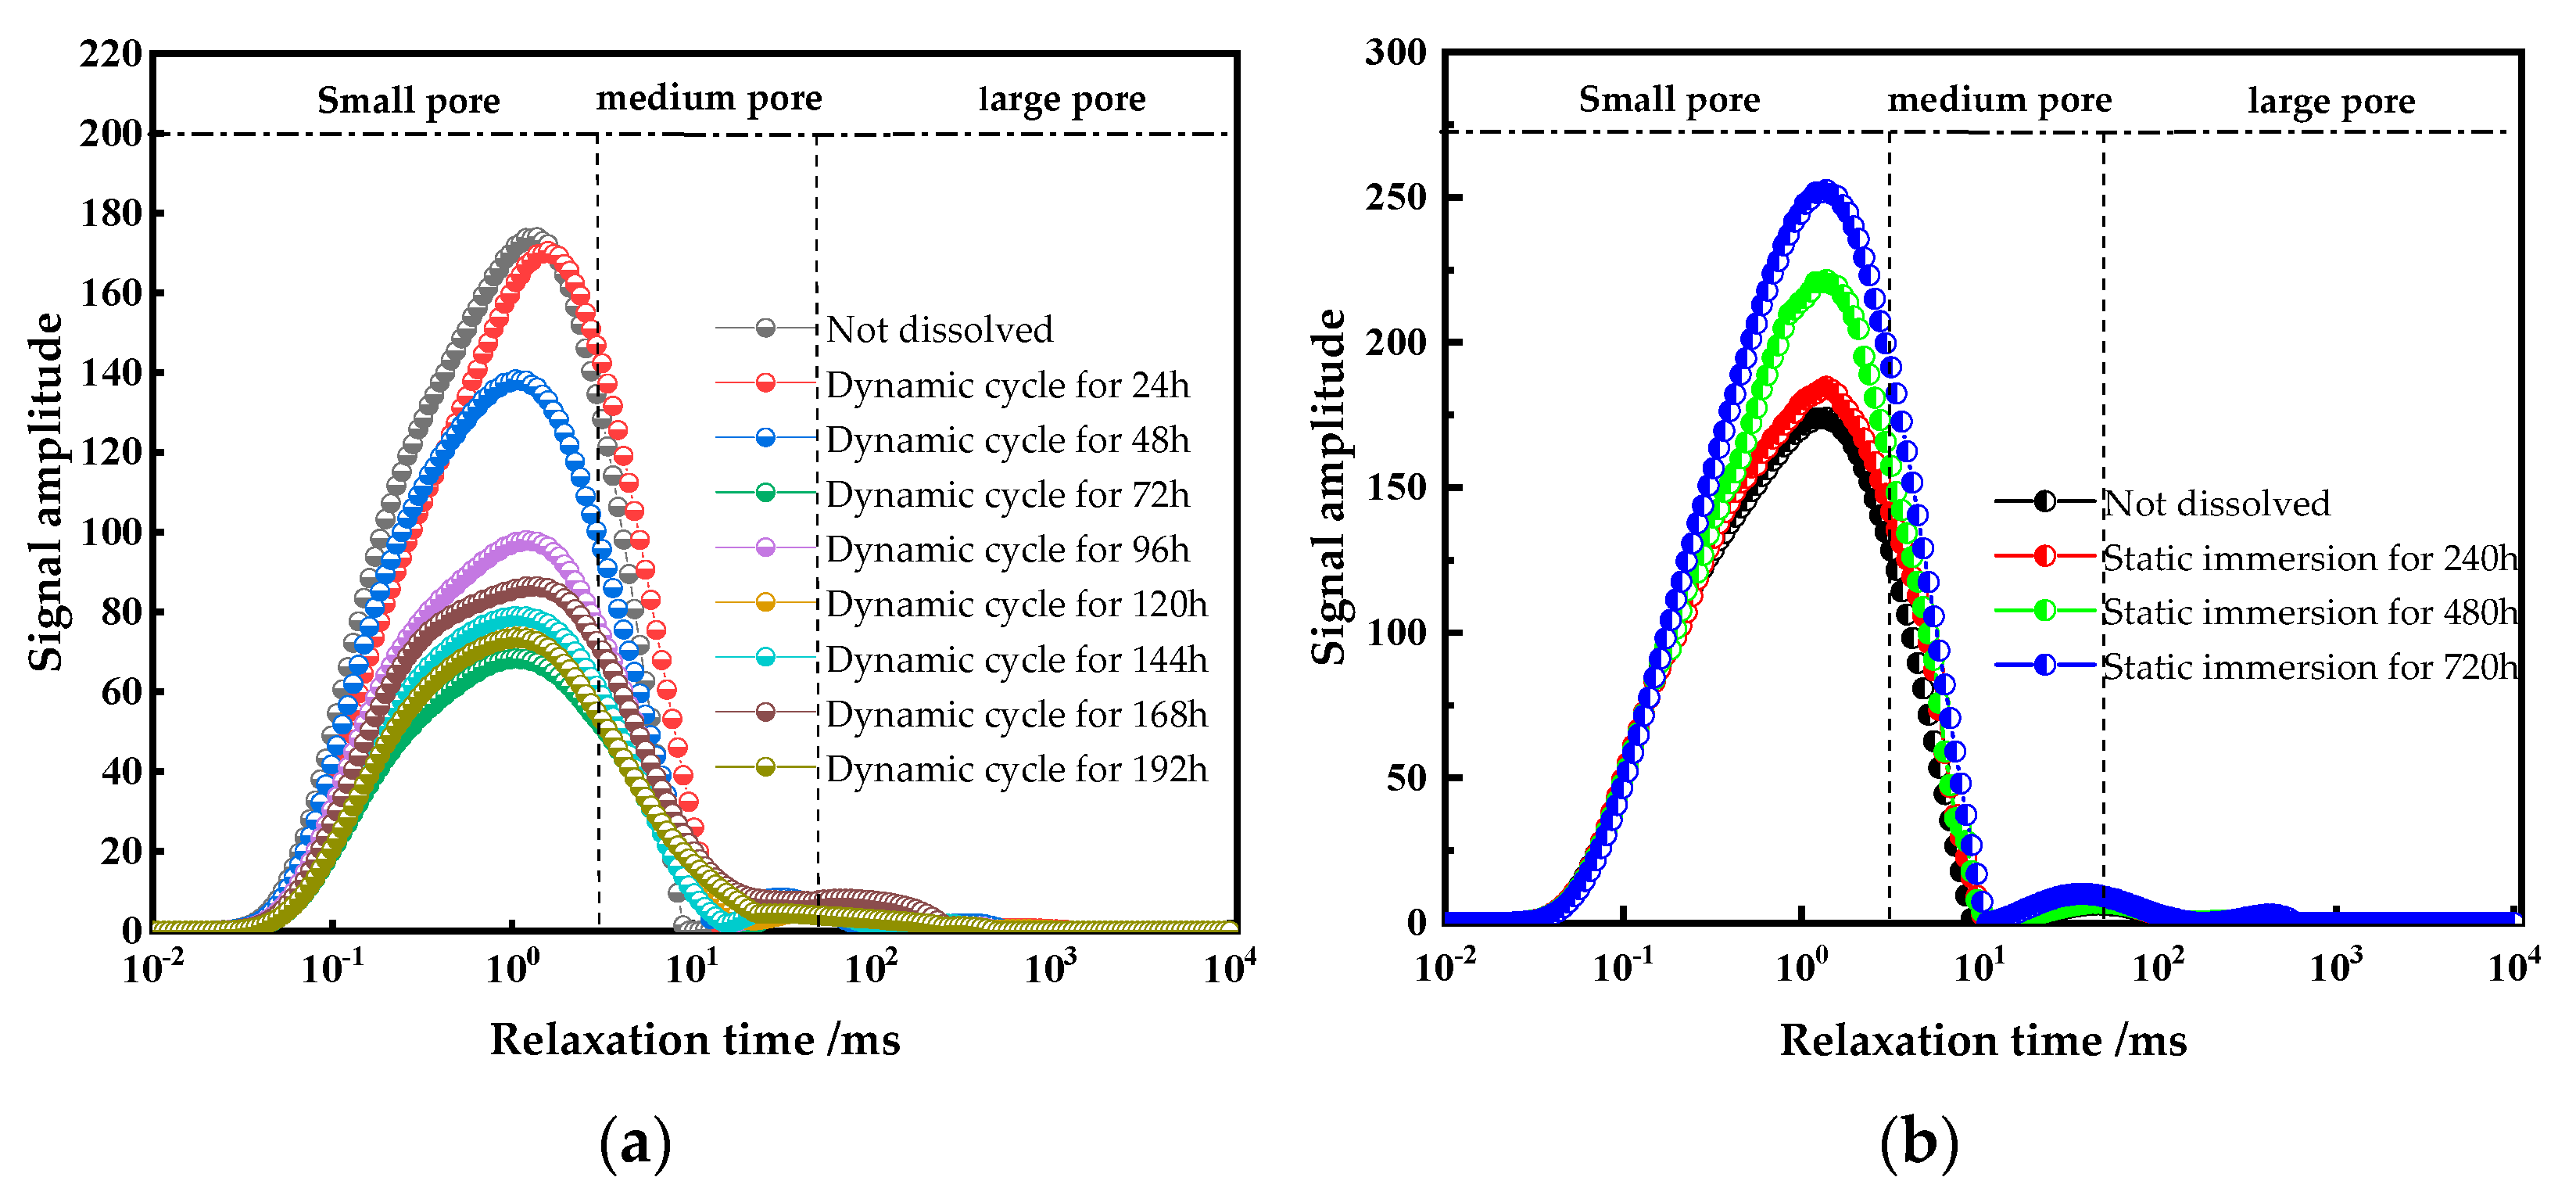
Figure 6, provide a detailed visualization of pore size distribution and connectivity changes, offering critical insights into sandstone degradation mechanisms. This combined NMR and SEM approach enables a comprehensive understanding of microstructural alterations induced by acidic dissolution, essential for developing effective preservation strategies for sandstone-based cultural heritage.
As shown in
Figure 6, the T
2 relaxation spectra display a bimodal distribution. In untreated samples, the significant signal amplitude difference between the two peaks indicates a clear boundary between small pores and medium-to-large pores, suggesting poor pore connectivity [
18]. With increasing dynamic cyclic dissolution time, the amplitude difference between the two peaks gradually decreases, and the boundary between small and medium-to-large pores becomes smoother, indicating improved pore connectivity. In contrast, under static immersion dissolution, the amplitude difference between the two peaks increases over time, and the boundary between small and medium-to-large pores remains distinct, suggesting that pore connectivity remains relatively poor. These observations highlight the distinct effects of dynamic and static dissolution on the sandstone pore structure: dynamic dissolution enhances pore connectivity by promoting the merging of small and large pores whereas static dissolution primarily enlarges existing pores without significantly improving connectivity. These findings offer valuable insights into the microstructural changes induced by different dissolution processes, critical for understanding sandstone degradation mechanisms and developing targeted conservation strategies.
Based on nuclear magnetic resonance (NMR) test results,
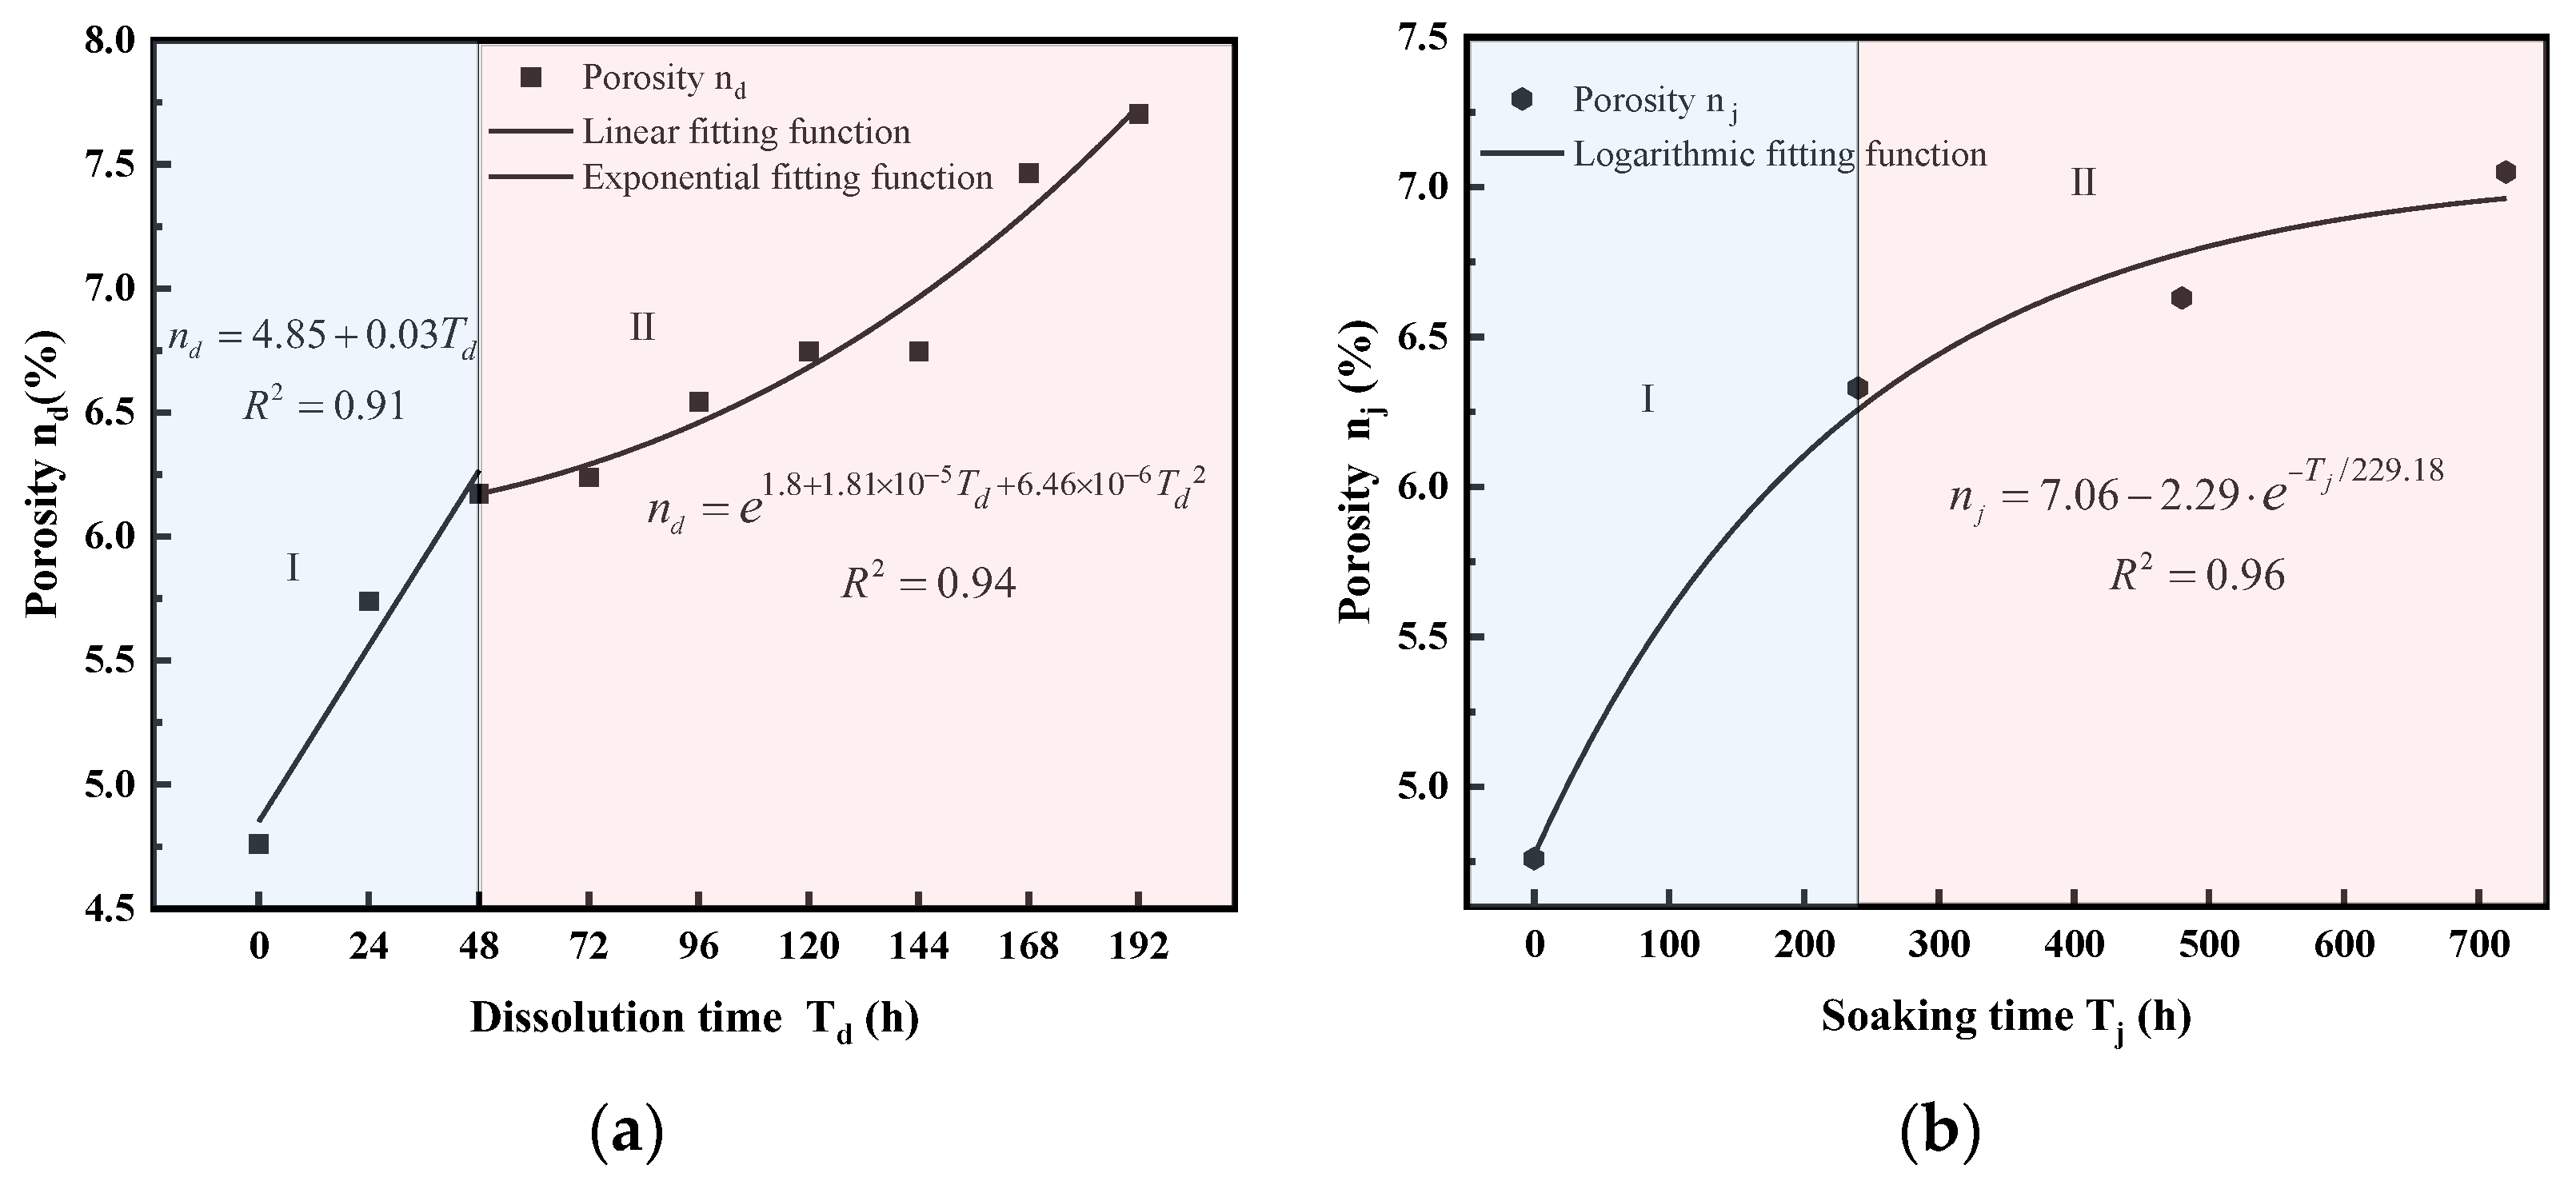
Figure 7 illustrates the changes in porosity under different dissolution conditions.
As shown in the figure, sandstone porosity progressively increases with dissolution time under both dynamic cyclic dissolution and static immersion conditions. For dynamic cyclic dissolution, porosity shows a strong linear relationship with dissolution time during Stage I (for example, 0–48 h as shown in
Figure 7a), followed by an exponential relationship in Stage II (for example, 48~192 h as shown in
Figure 7a). In contrast, static immersion dissolution leads to an exponential increase in porosity over time. During Stage I (for example, 0~240 h as shown in
Figure 7b) of static immersion, porosity rapidly increases to 1.33 times the initial value, while, in Stage II (for example, 240~720 h as shown in
Figure 7b), the rate of porosity increase slows, reaching 1.48 times the initial value after 720 h of dissolution. These trends highlight the distinct mechanisms of porosity evolution under dynamic and static dissolution: dynamic dissolution accelerates porosity growth through enhanced pore connectivity whereas static immersion results in a more gradual increase, primarily driven by the enlargement of existing pores. These findings offer critical insights into the time-dependent degradation of sandstone under different environmental conditions, providing a scientific basis for preserving sandstone-based cultural heritage.
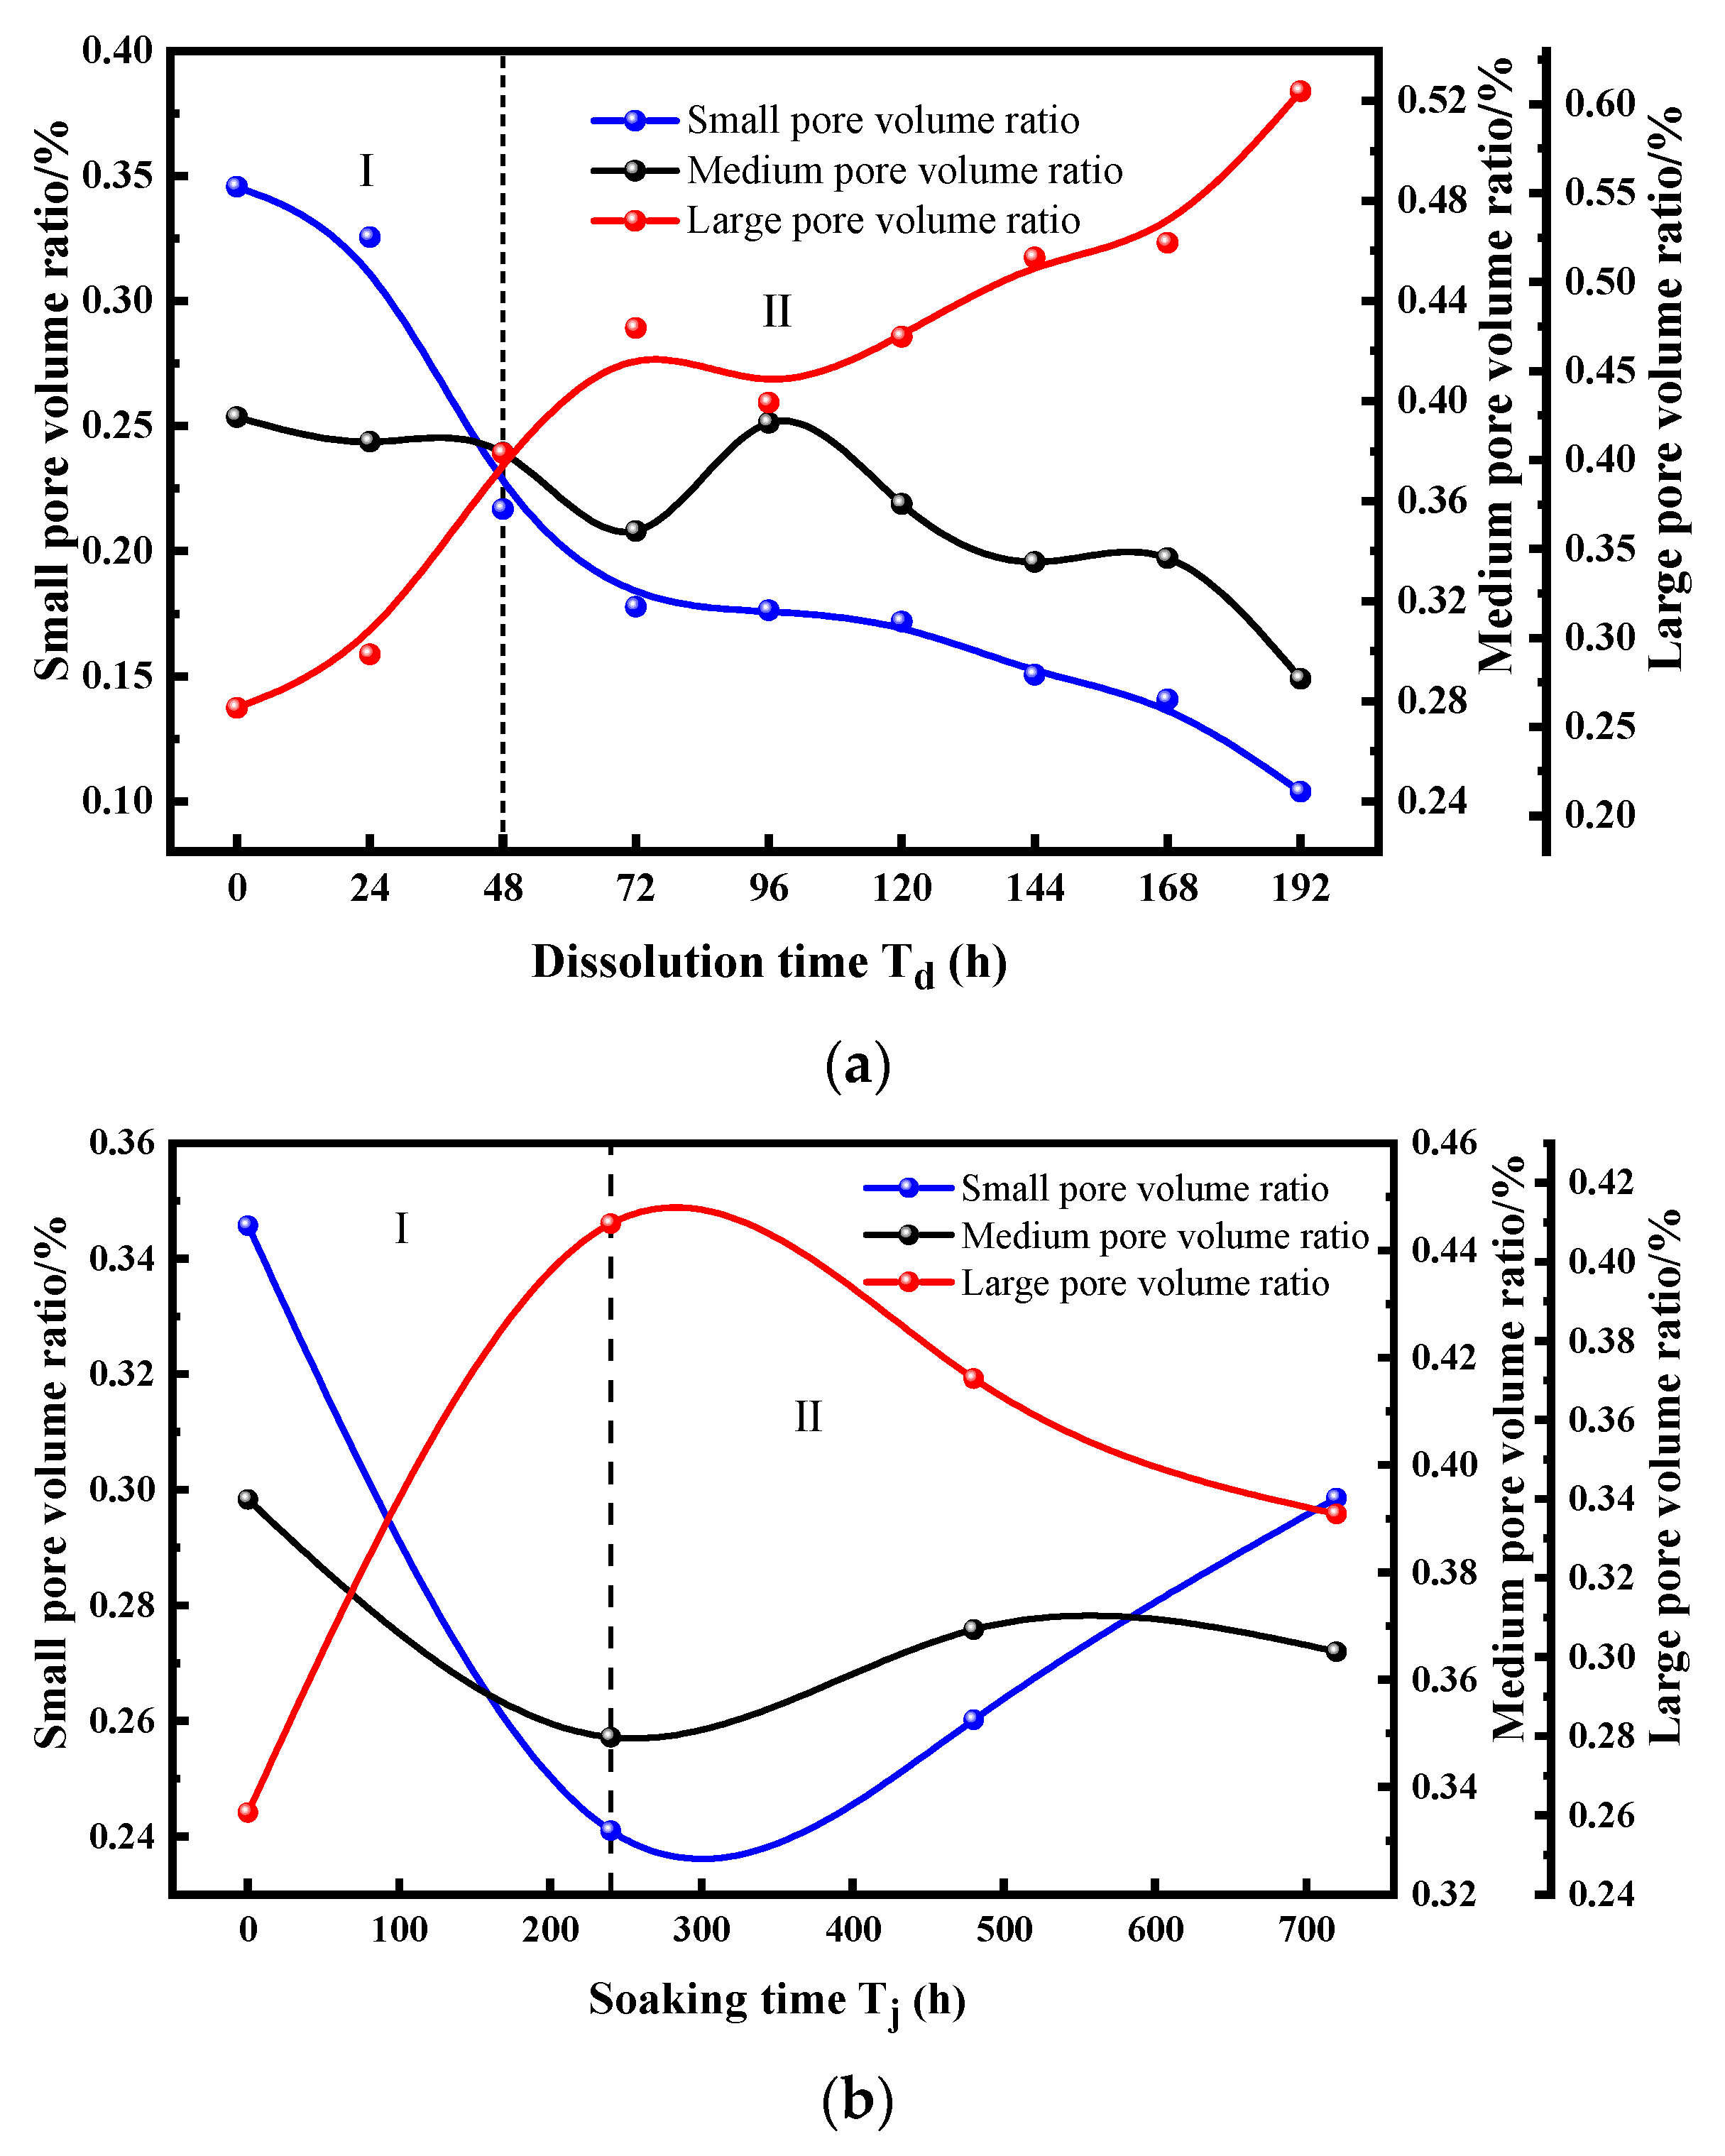
Furthermore, the proportions of small, medium, and large pores under dynamic and static dissolution conditions were analyzed as a function of dissolution time.
As shown in
Figure 8, the proportions of small, medium, and large pores exhibit distinct trends under dynamic and static dissolution conditions.
During Stage I of dynamic cyclic dissolution, the proportion of small pores decreases, while large pores increase rapidly, and medium pores show a slight decline. This stage is primarily characterized by large pore development. In Stage II, the proportion of large pores continues to increase exponentially, albeit at a slower rate than in Stage I, while small pores decrease linearly, and medium pores decline due to the continued expansion of large pores. In contrast, under static immersion dissolution, Stage I is marked by a rapid and significant decrease in small pores, accompanied by a sharp increase in large pores and a slight decline in medium pores.
In Stage II, large pores gradually decrease while small pores begin to rise, and medium pores fluctuate. These trends highlight the distinct mechanisms of pore structure evolution under dynamic and static dissolution: dynamic dissolution promotes the merging of small pores into larger ones, enhancing pore connectivity, whereas static dissolution primarily enlarges existing pores without significantly improving connectivity. These findings offer critical insights into the time-dependent degradation of sandstone under different environmental conditions, providing a scientific basis for preserving sandstone-based cultural heritage.
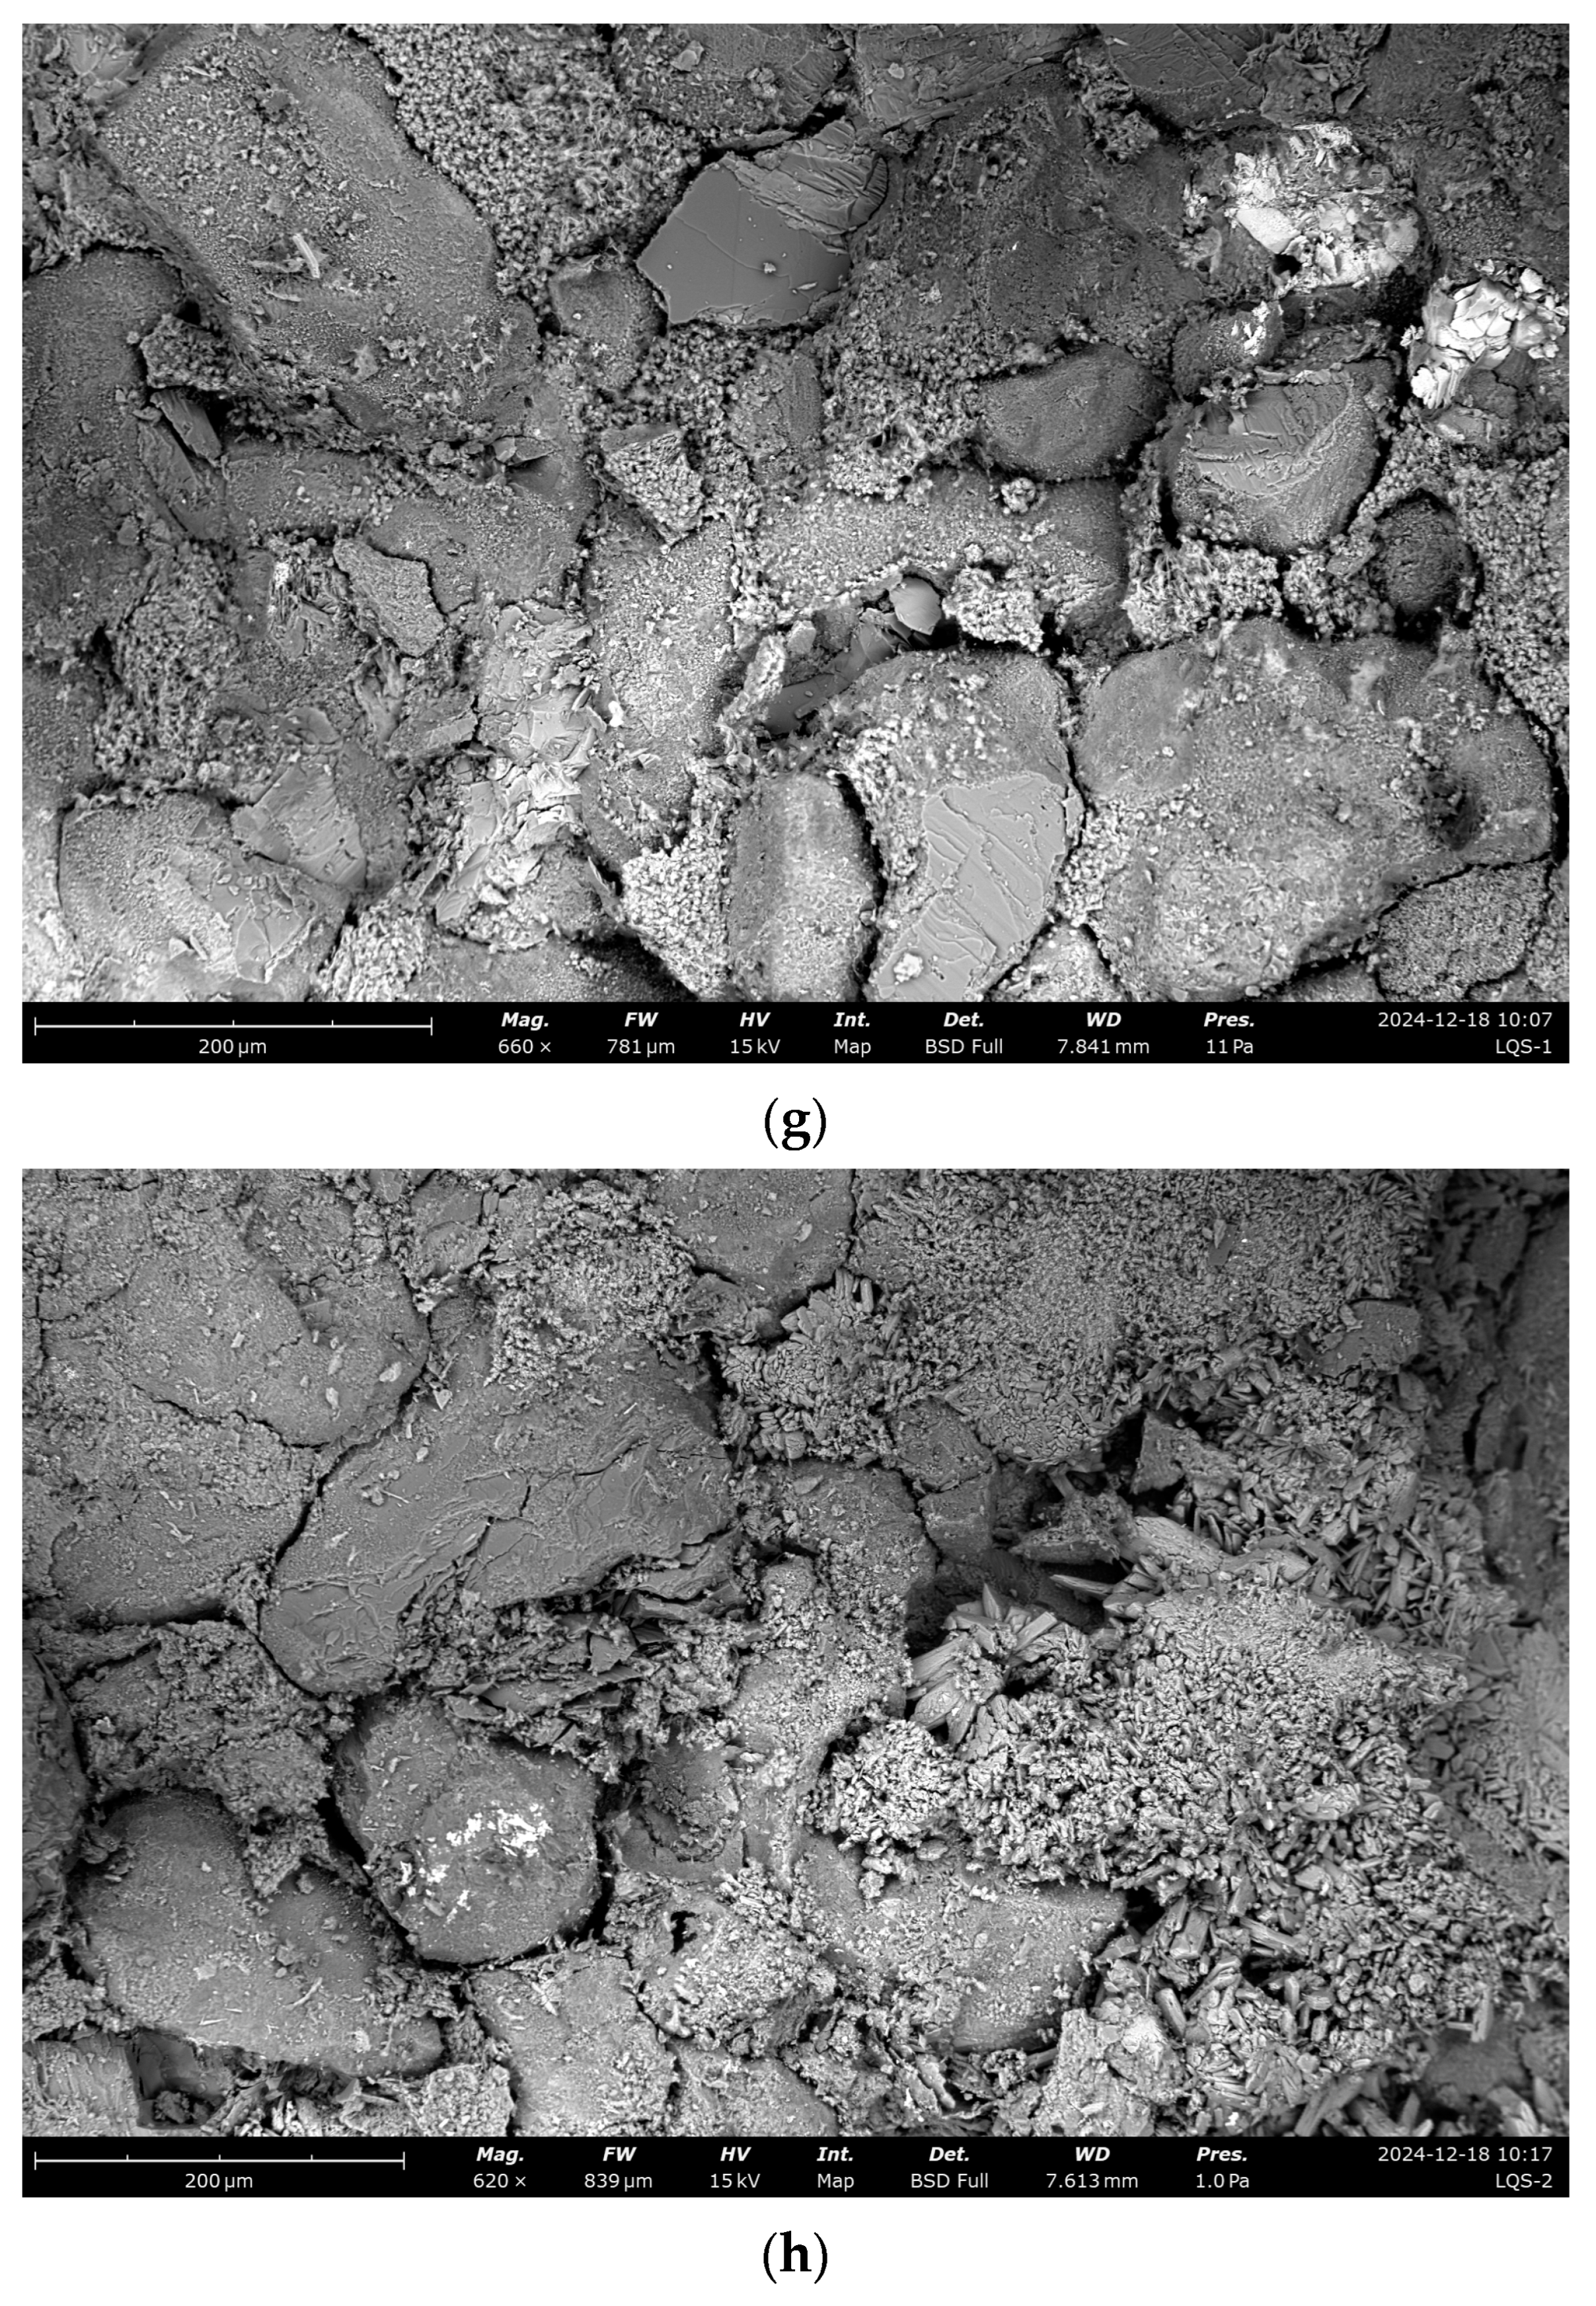
To investigate microscopic changes in the pore structure, scanning electron microscopy (SEM) was used to analyze the surface morphology of sandstone samples subjected to dynamic and static dissolution, e.g., the SEM images in
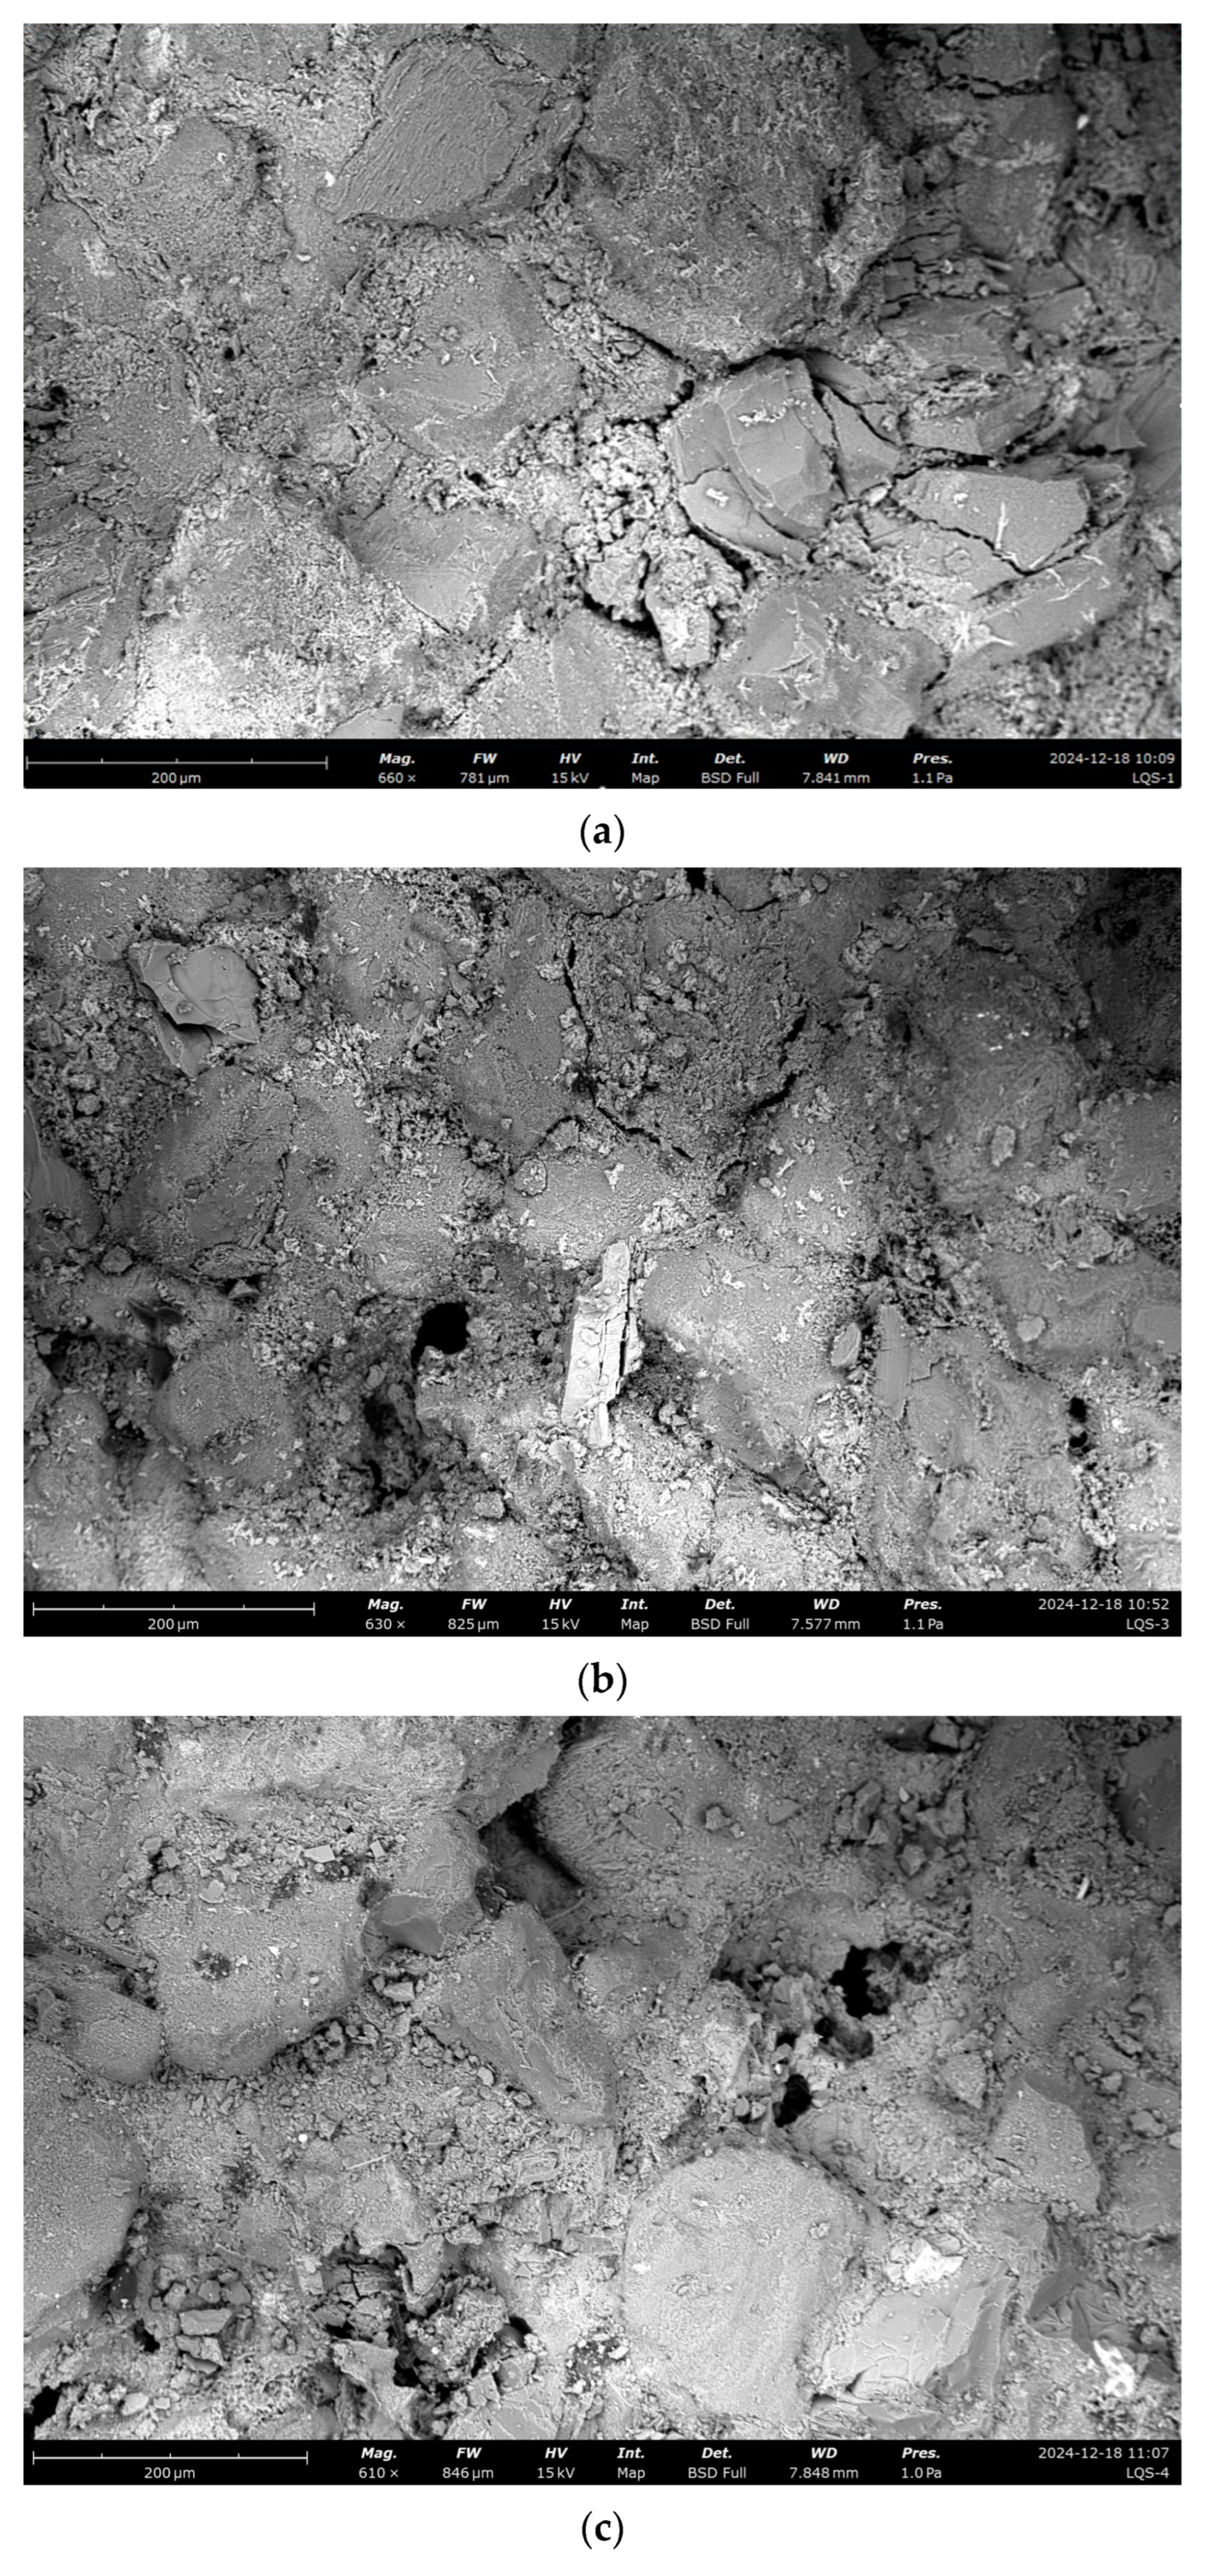
Figure 9.
Scanning electron microscopy (SEM) observations reveal distinct changes in the sandstone microstructure induced by dissolution processes. In untreated samples, the sandstone structure appears intact, with cementitious fragments filling spaces between mineral grains. Under dynamic cyclic dissolution, dissolution cavities and pits form within minerals and at mineral boundaries, indicating significant material loss and enhanced pore connectivity. In contrast, static immersion dissolution causes the gradual disappearance of cementitious materials at mineral edges, accompanied by widening and deepening boundary cracks. Additionally, as immersion time increases, gaps between minerals become progressively filled with secondary minerals. These microstructural changes highlight the distinct degradation mechanisms under dynamic and static dissolution: dynamic dissolution promotes interconnected pore network development through dissolution feature formation, whereas static dissolution results in localized damage and secondary mineral deposition, partially mitigating further degradation. These findings offer critical insights into the microscopic processes driving sandstone deterioration, providing a scientific basis for preserving sandstone-based cultural heritage.
In summary, dissolution processes cause a gradual increase in porosity, with distinct two-stage evolution patterns observed under dynamic and static dissolution conditions.
(1) Dynamic Dissolution
Stage I: The formation of dissolution cavities and pits in the sandstone microstructure reduces the proportion of small pores and increases the proportion of large pores, leading to a linear increase in porosity.
Stage II: The development of larger and more extensive dissolution features drives an exponential increase in large pores, accompanied by a continued decrease in small pores and a slight reduction in medium pores. This stage is characterized by an exponential rise in porosity.
(2) Static Dissolution
Stage I: The rapid dissolution of intergranular cement due to solution diffusion causes a sharp increase in large pores and a significant decrease in small pores. This stage is marked by a rapid rise in porosity, with microscopic observations revealing dissolved debris and localized dissolution features.
Stage II: Mineral separation becomes more pronounced, with widening and deepening cracks at grain boundaries. Simultaneously, secondary minerals fill existing fractures, causing a gradual decline in large pores and an increase in small pores. Medium pores fluctuate due to the combined effects of dissolution and secondary mineral deposition, resulting in a decelerated increase in porosity.
These findings highlight the distinct mechanisms of pore structure evolution under dynamic and static dissolution, offering critical insights into sandstone degradation processes. Understanding these differences is crucial for developing targeted conservation strategies to mitigate the deterioration of sandstone-based cultural heritage under varying environmental conditions.
3.2. Variation Laws of Surface Mechanical Properties Under Different Corrosion Mechanisms
Dissolution-induced microstructural changes significantly weaken the mechanical properties of sandstone. Previous studies have shown a strong correlation between ultrasonic wave velocity, hardness, and sandstone mechanical strength [
19,
20]. Therefore, ultrasonic wave velocity and hardness measurements can serve as reliable indicators for indirectly assessing sandstone strength degradation following dissolution. Furthermore, rock failure is typically not a sudden, catastrophic event but a gradual process initiated at localized weak zones [
21]. Consequently, when evaluating the durability and stability of stone-based cultural heritage, it is crucial to monitor not only the overall decline in mechanical strength but also the distribution and evolution of localized mechanical properties. A comprehensive understanding of both global and localized strength degradation is essential for developing effective conservation strategies to mitigate the progressive deterioration of sandstone structures.
3.2.1. Variation Laws of Surface Hardness Under Different Corrosion Mechanisms
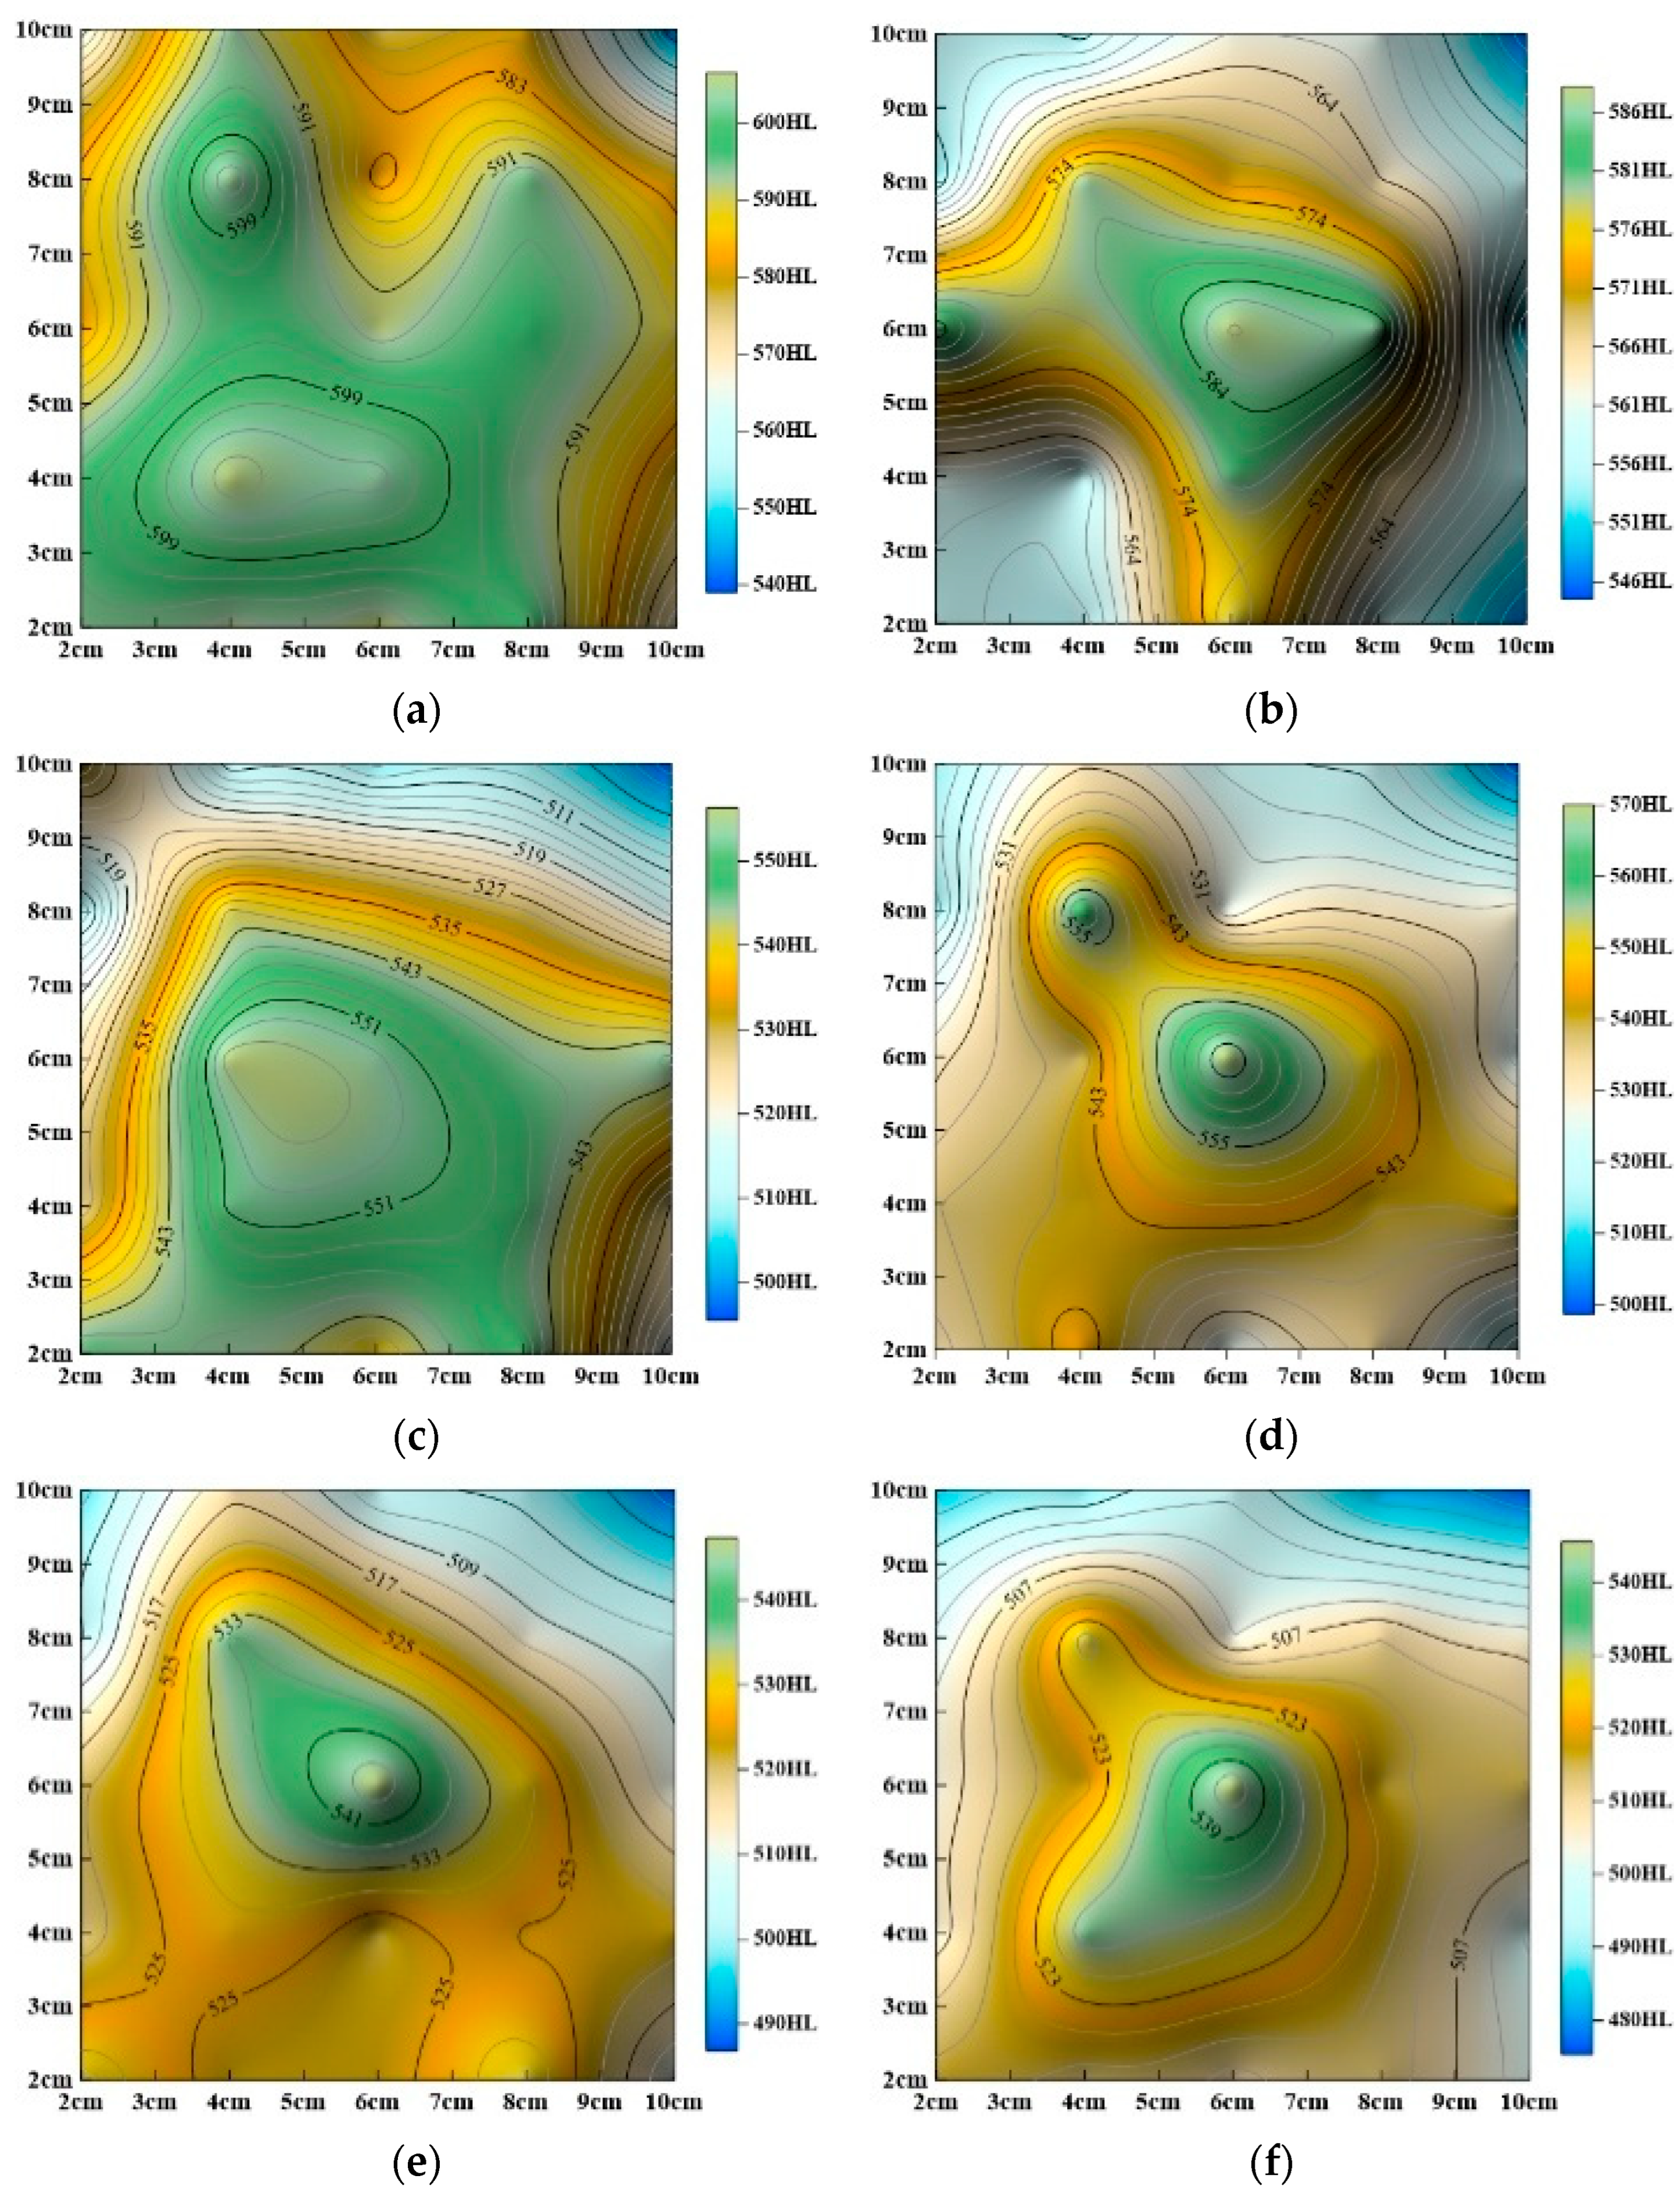
Dissolution processes induce chemical reactions and material loss on sandstone surfaces, resulting in gradual softening and a decline in mechanical properties. To visualize the spatial distribution of surface hardness under static and dynamic dissolution conditions, hardness contour maps were generated, as shown in
Figure 10 and
Figure 11.
The studies above (
Figure 10 and
Figure 11) show that surface hardness gradually decreases under both dynamic and static dissolution conditions, but the specific patterns of change differ significantly:
(1) Dynamic Cyclic Dissolution:
As shown in
Figure 10, overall surface hardness progressively decreases, with hardness values significantly lower than those of untreated samples. The lowest hardness values consistently appear in the upper-right corner while the highest values are located in the central region. Hardness decreases radially from the center toward the edges. Initially, hardness values in the inner and outer regions are similar, but, as cyclic dissolution continues, contour lines become more localized, the central high-hardness area shrinks, and overall surface hardness heterogeneity increases.
(2) Static Immersion Dissolution:
As shown in
Figure 11, overall surface hardness also decreases, but, unlike dynamic dissolution, the rate of hardness reduction slows over time. After 240 h of immersion, the decrease in hardness becomes less pronounced. Static immersion significantly alters surface hardness distribution, even after 240 h. The locations of the highest and lowest hardness values shift continuously during immersion, with the highest values following a pattern of center (
Figure 10a) → upper-left (
Figure 11a) → lower-left (
Figure 11b) → center (
Figure 11c) and the lowest values following a pattern of upper-right (
Figure 10a) → lower-right (
Figure 11a) → upper-left (
Figure 11b) → upper-right (
Figure 11c). Despite these changes, the final hardness distribution tends to revert to a pattern similar to the initial untreated state.
To further elucidate differences in surface hardness evolution under static and dynamic dissolution, area ratios of hardness distribution (relative to the untreated state) were calculated from hardness contour maps. These ratios are summarized in
Table 3 and visualized in
Figure 12, illustrating changes in hardness distribution over time. This analysis highlights the increasing heterogeneity of surface hardness under dynamic dissolution and the more uniform but slower degradation under static dissolution, offering critical insights into the distinct mechanisms of sandstone deterioration under different environmental conditions.
Based on the data described above, area ratios of hardness distribution (expressed as the ratio of hardness to the initial untreated state) were calculated for static and dynamic dissolution conditions. These ratios are presented in the histogram in
Figure 12, illustrating the evolution of hardness distribution over dissolution time. The histogram reveals distinct trends in surface hardness degradation under static and dynamic dissolution.
The above analysis shows that the distribution of hardness ratios progressively shifts toward lower values in a staged manner.
(1) Dynamic Cyclic Dissolution:
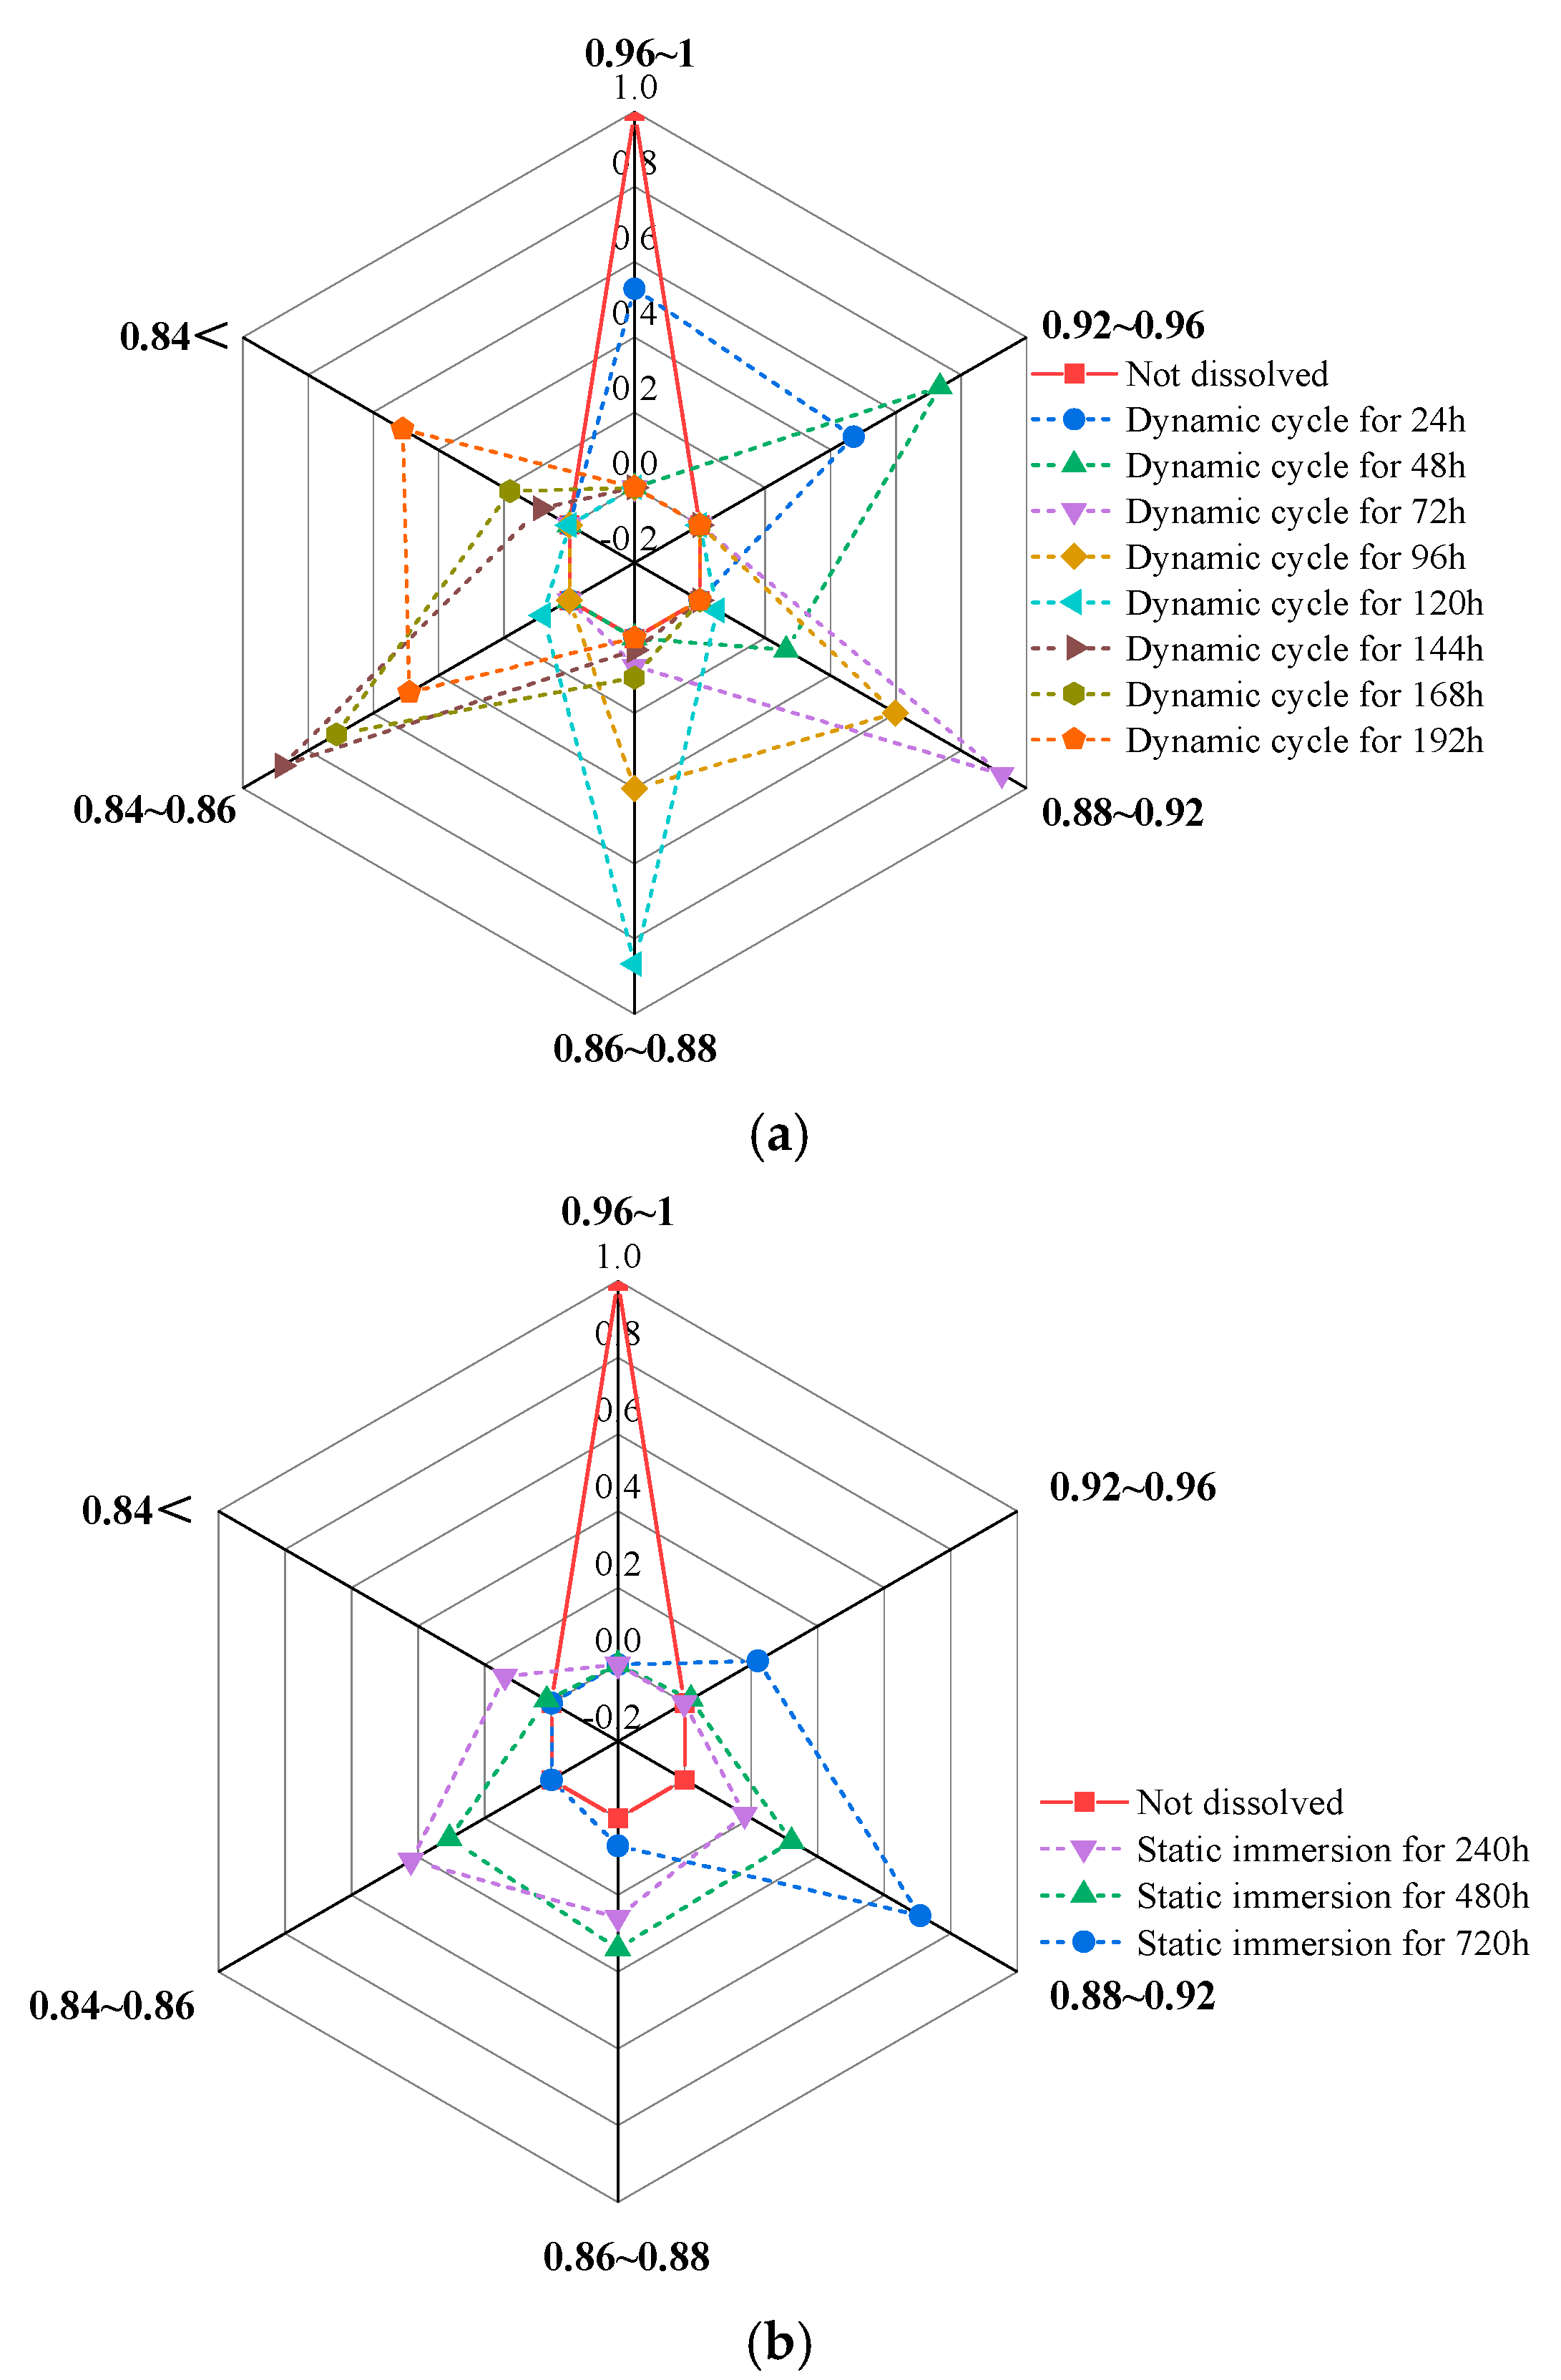
In the radar chart (
Figure 12a), a finer distribution indicates a more concentrated pattern. As cyclic dissolution time increases, the hardness ratio decreases, and the distribution range gradually expands, reflecting an enlargement of the affected area. Critical turning points occur at 72 h, 120 h, and 168 h of cyclic dissolution, where hardness ratios exhibit relatively concentrated distributions. At 72 h, hardness ratios primarily range from 0.89 to 0.95. By 120 h, the main distribution shifts to 0.85–0.9. At 168 h, hardness ratios are no longer concentrated in a single range but are nearly evenly distributed between 0.8–0.85 and below 0.8. Combined with contour map analysis, the upper-right corner of the rock slab is identified as the region with the lowest dynamic dissolution intensity and the most vulnerable to potential damage.
(2) Static Immersion Dissolution:
As shown in
Figure 12b, a significant decrease in hardness is observed at 240 h of immersion, with hardness ratios predominantly distributed between 0.89 and 0.95. Subsequently, although hardness ratios continue to decrease, the rate of decline slows, and no significant changes in hardness distribution are observed.
In conclusion, dynamic cyclic dissolution has a more pronounced impact on rock slab surface hardness compared to static immersion dissolution, making surface damage more likely under dynamic conditions. These findings highlight the importance of considering dissolution mechanisms when assessing the durability and stability of sandstone structures in acidic environments.
3.2.2. Variation Laws of Surface Longitudinal Wave Velocity Under Different Corrosion Mechanisms
P-wave velocity is a reliable indicator of pore and micro-fissure development within the rock, as well as the degree of specimen damage [
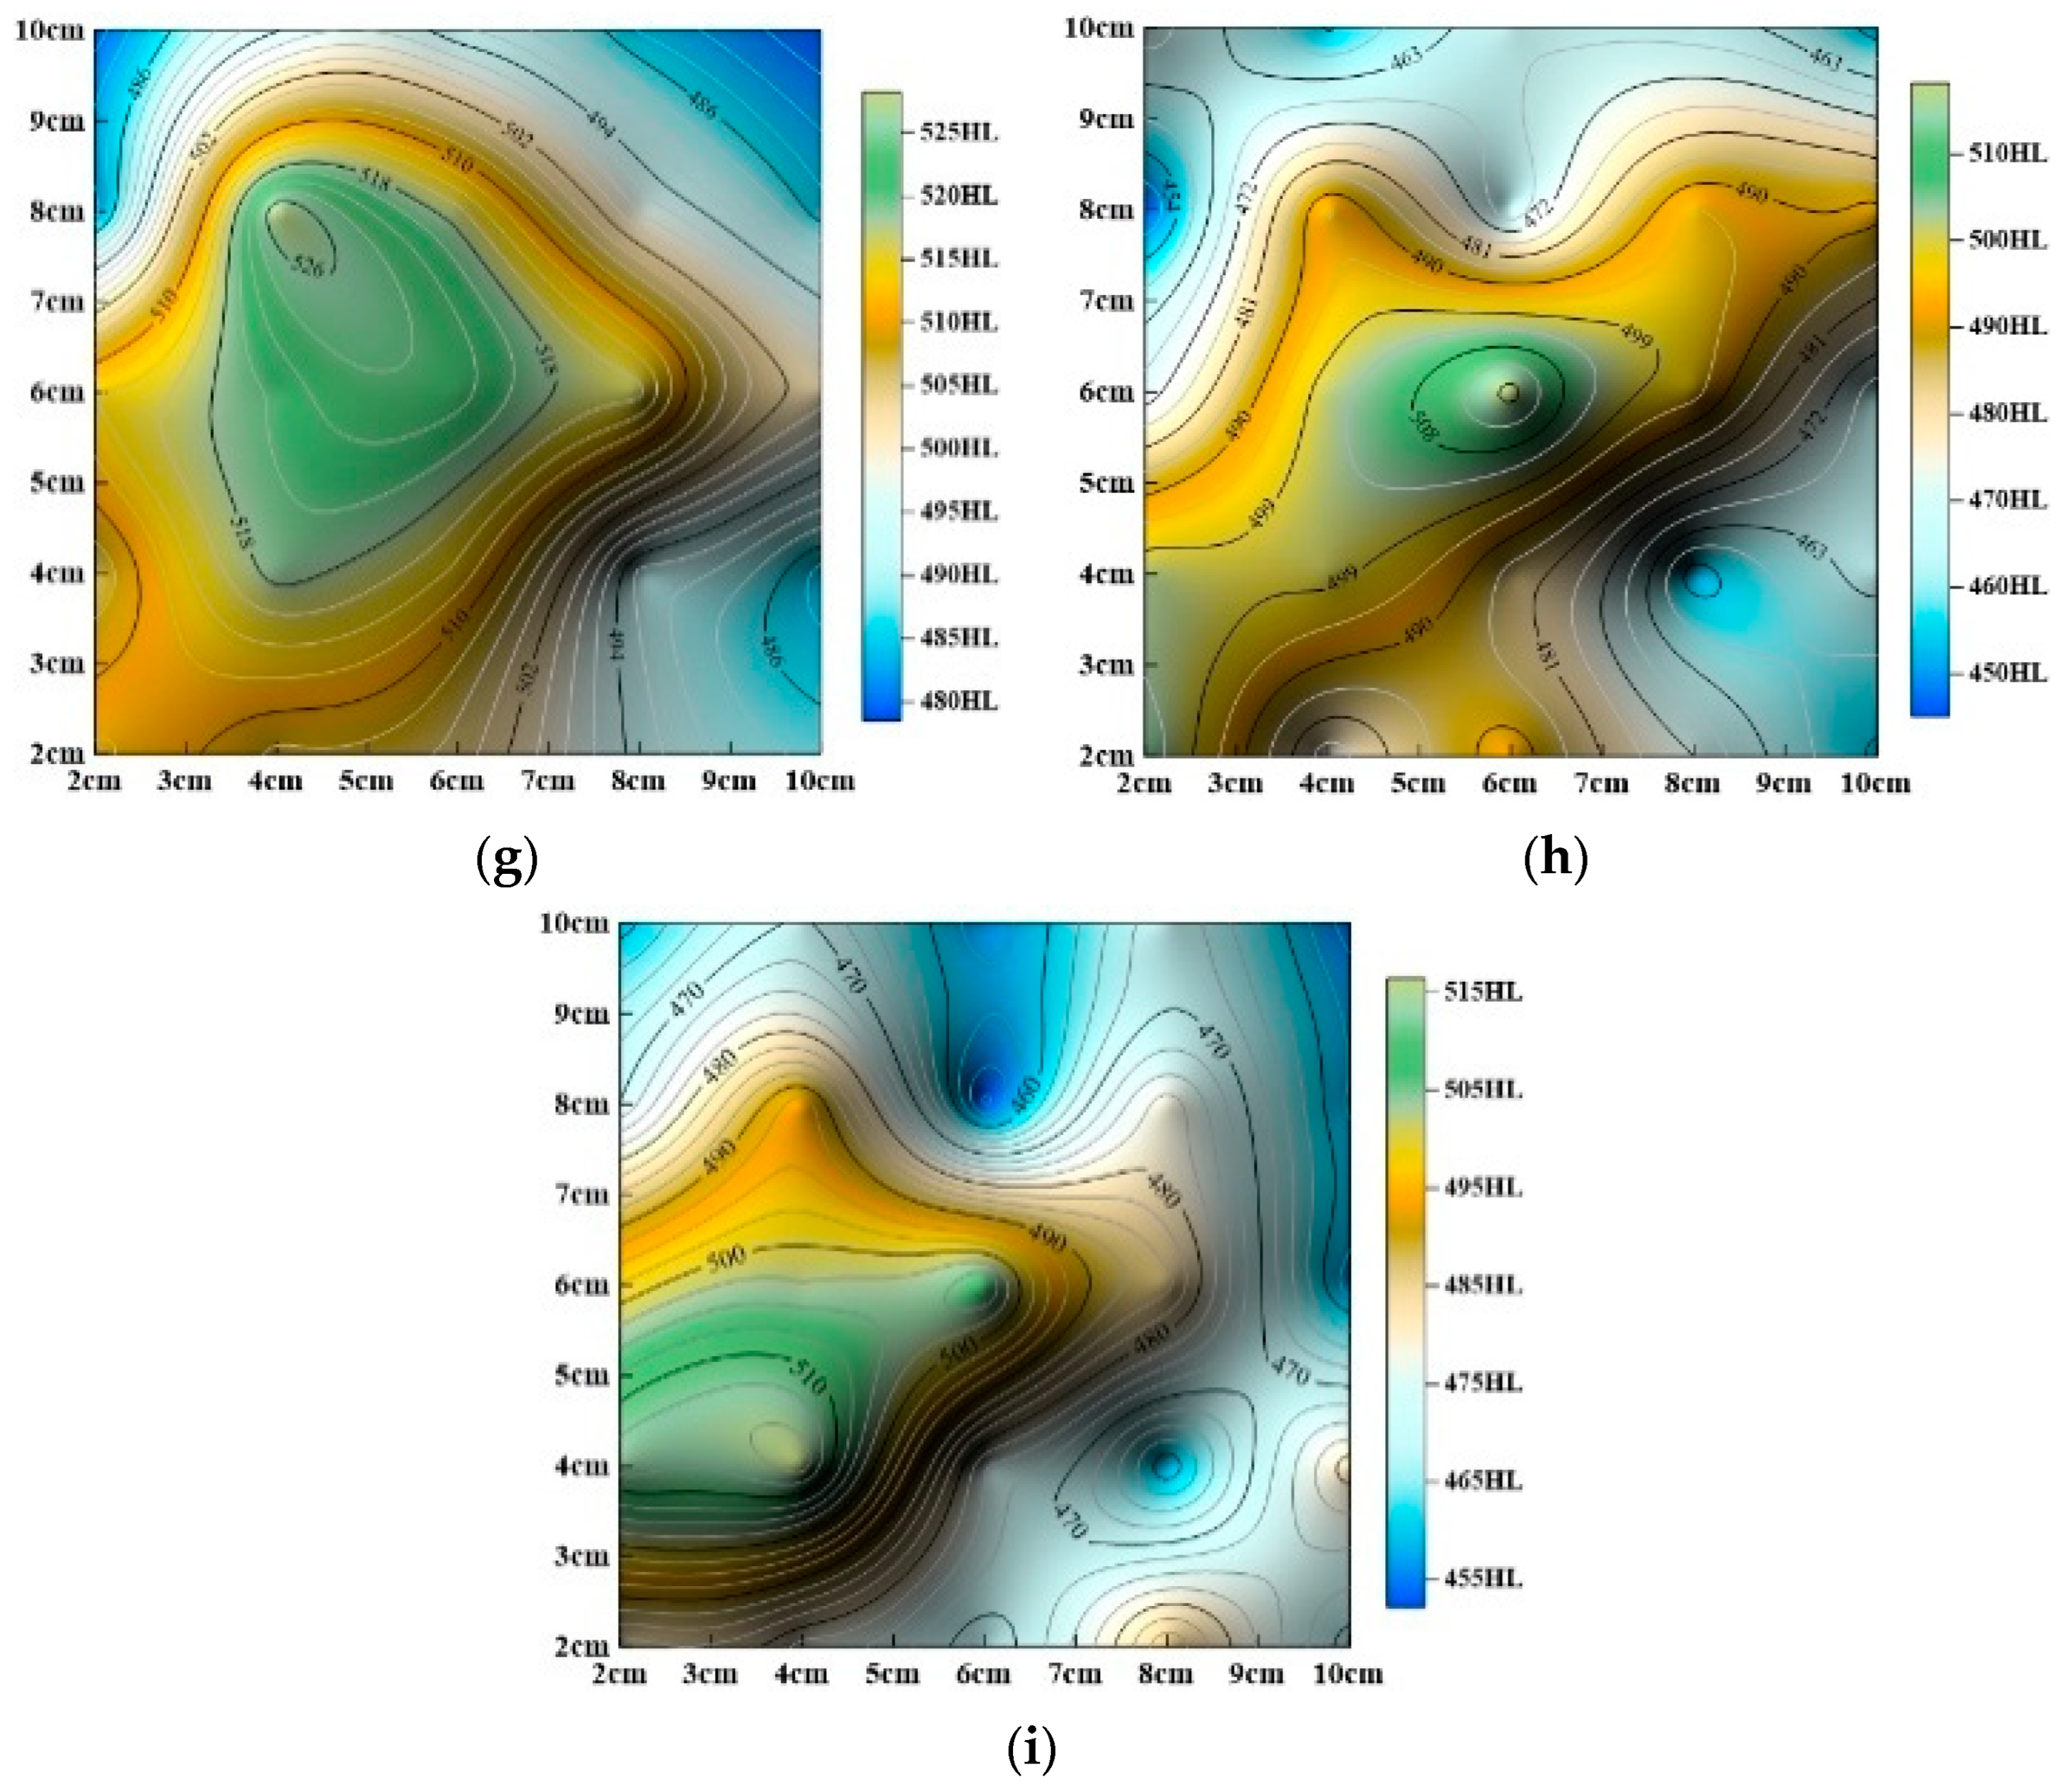
22]. To compare changes in surface acoustic wave distribution under different dissolution conditions, acoustic wave contour maps for dynamic and static dissolution are presented in
Figure 13 and
Figure 14.
The aforementioned studies (
Figure 13 and
Figure 14) show that surface P–wave velocity under different dissolution methods gradually decreases as corrosion progresses. However, the specific patterns of change differ significantly, as described below:
(1) Dynamic Cyclic Dissolution:
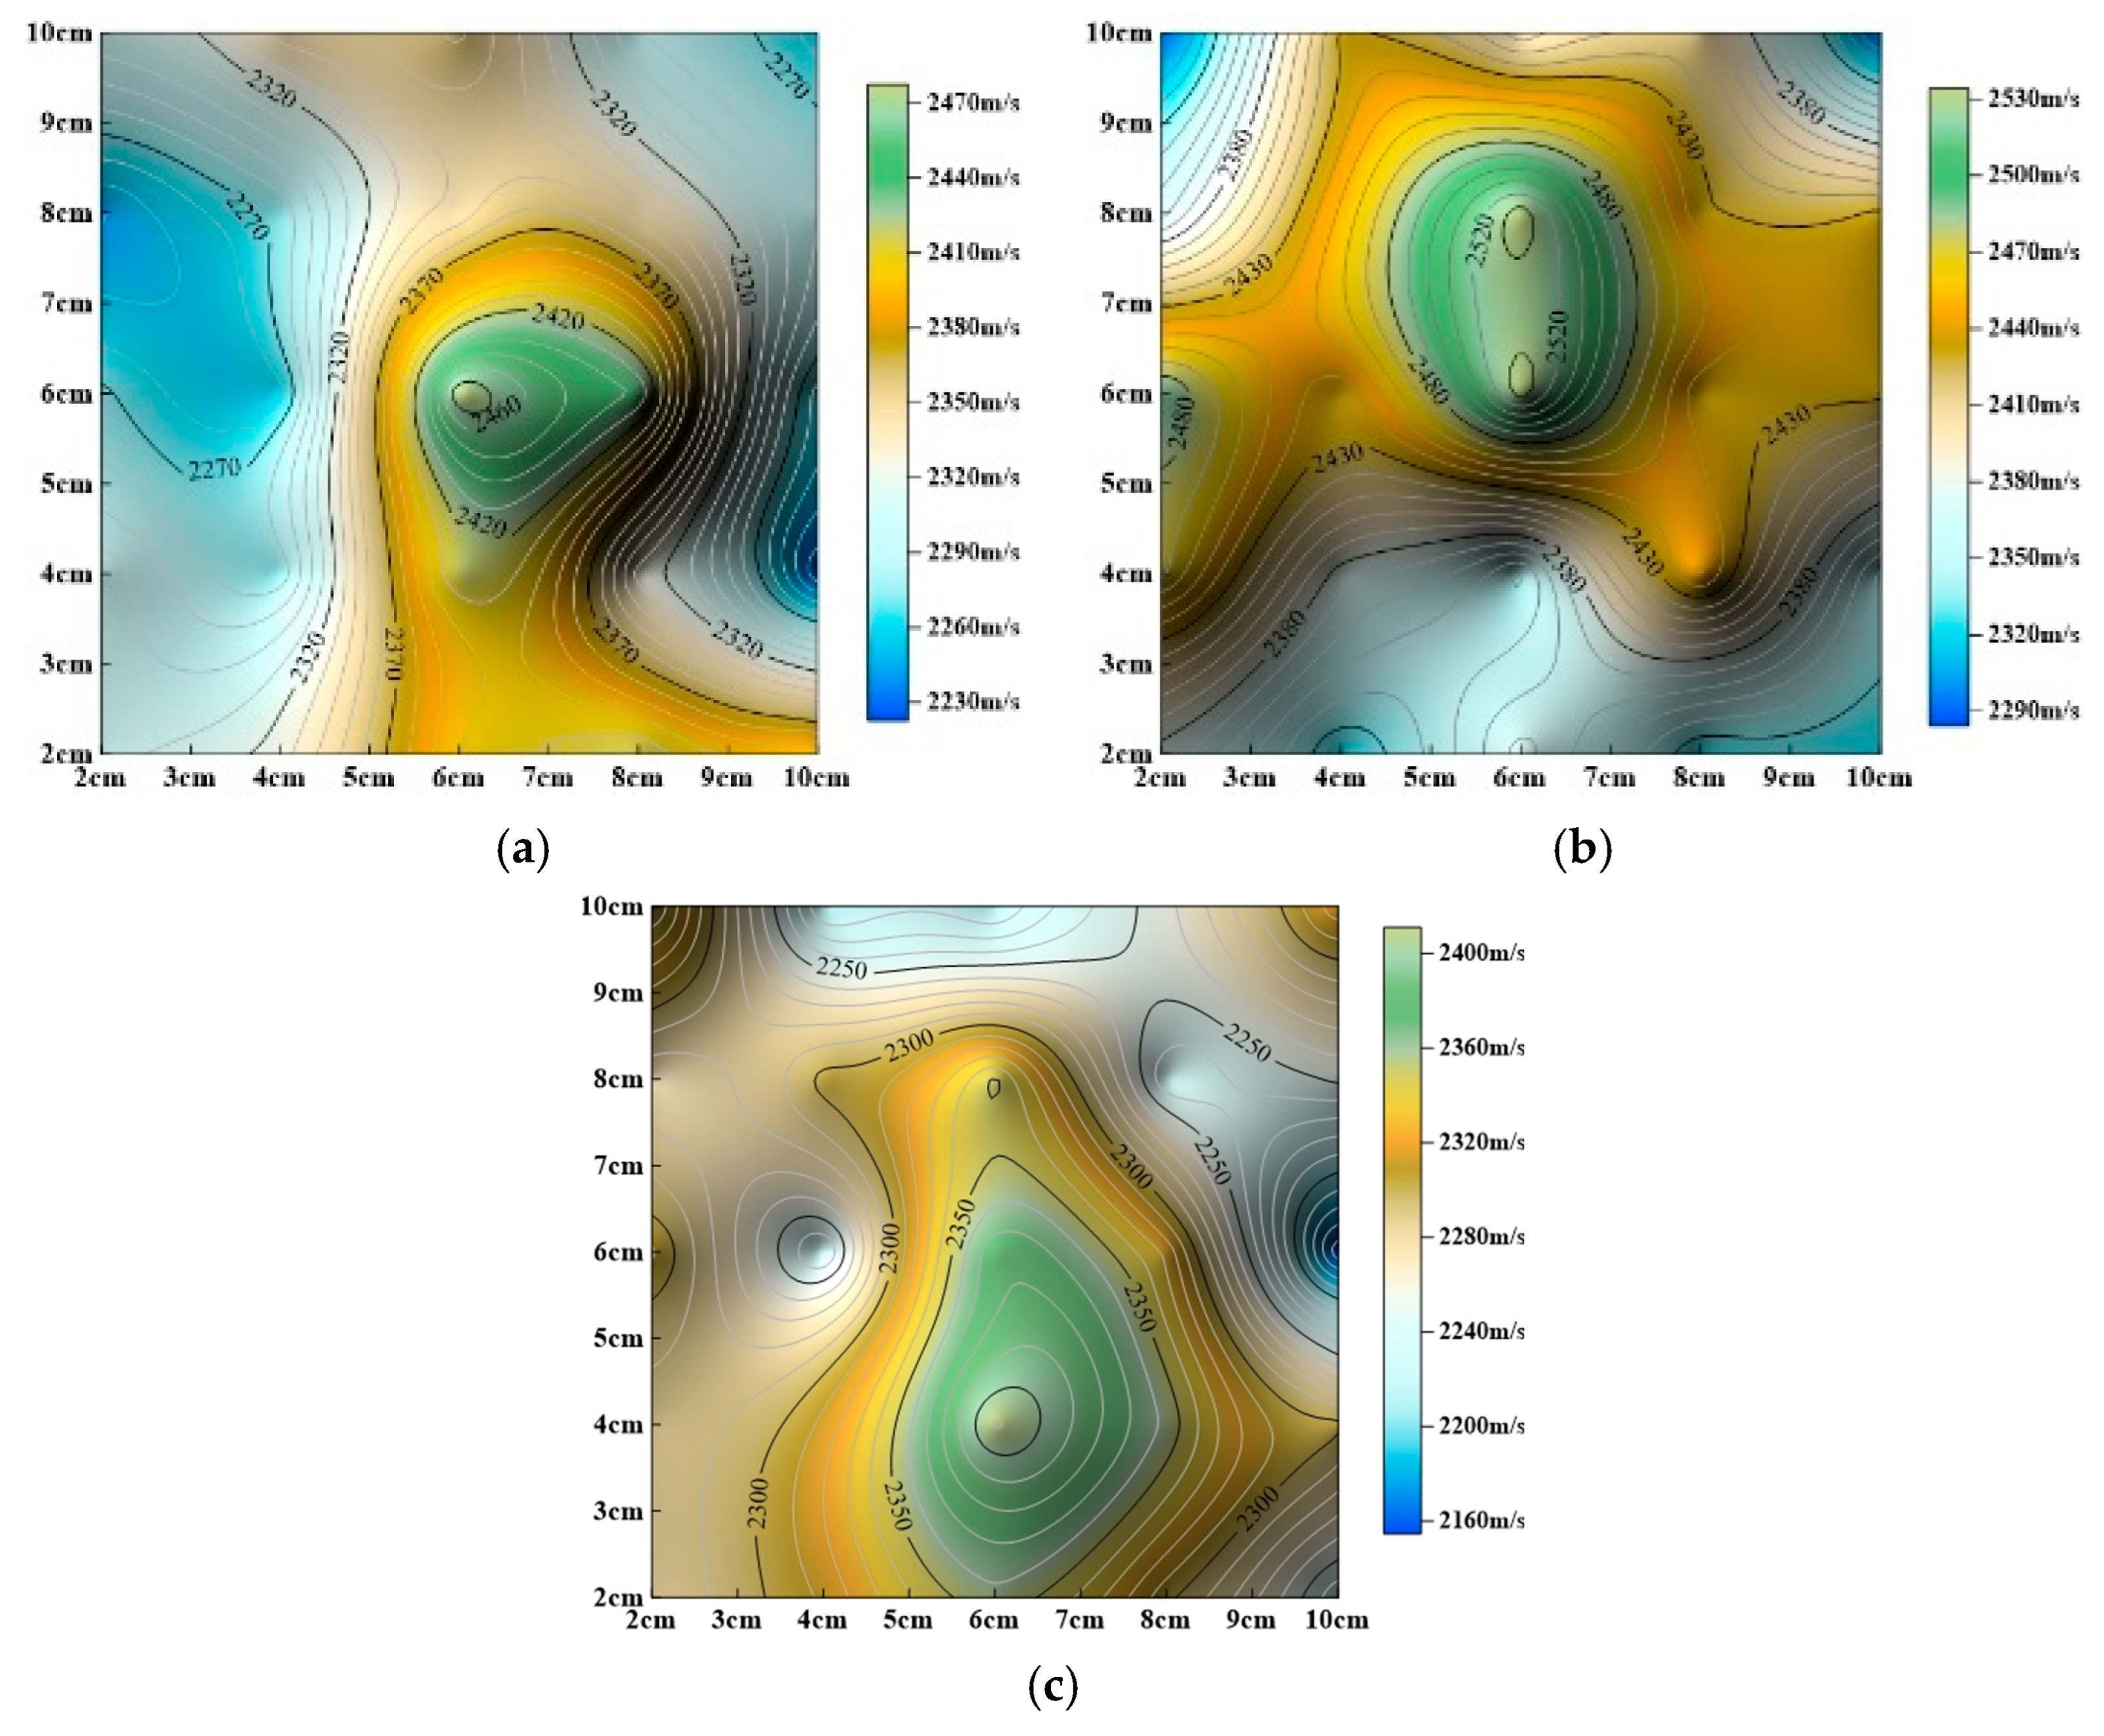
As shown in
Figure 13, overall P-wave velocity gradually decreases with increasing dissolution time. Analysis shows that minimum P–wave velocity values become more concentrated and their distribution range becomes more defined. Maximum P–wave velocity values remain largely unchanged in position, consistently concentrated in the central region, but their distribution range gradually expands. The areas where minimum P-wave velocity occurs follow a sequence: periphery (
Figure 13a) → upper right (
Figure 13b and c) → upper left (
Figure 13d) → upper right (
Figure 13e) → upper left (
Figure 13f and g) → lower right (
Figure 13h) → upper left (
Figure 13i), indicating significant fluctuations in the locations of minimum values. This suggests that dynamic cyclic dissolution induces fluctuating changes in the rock’s internal pore structure, attributed to the staged evolution of porosity.
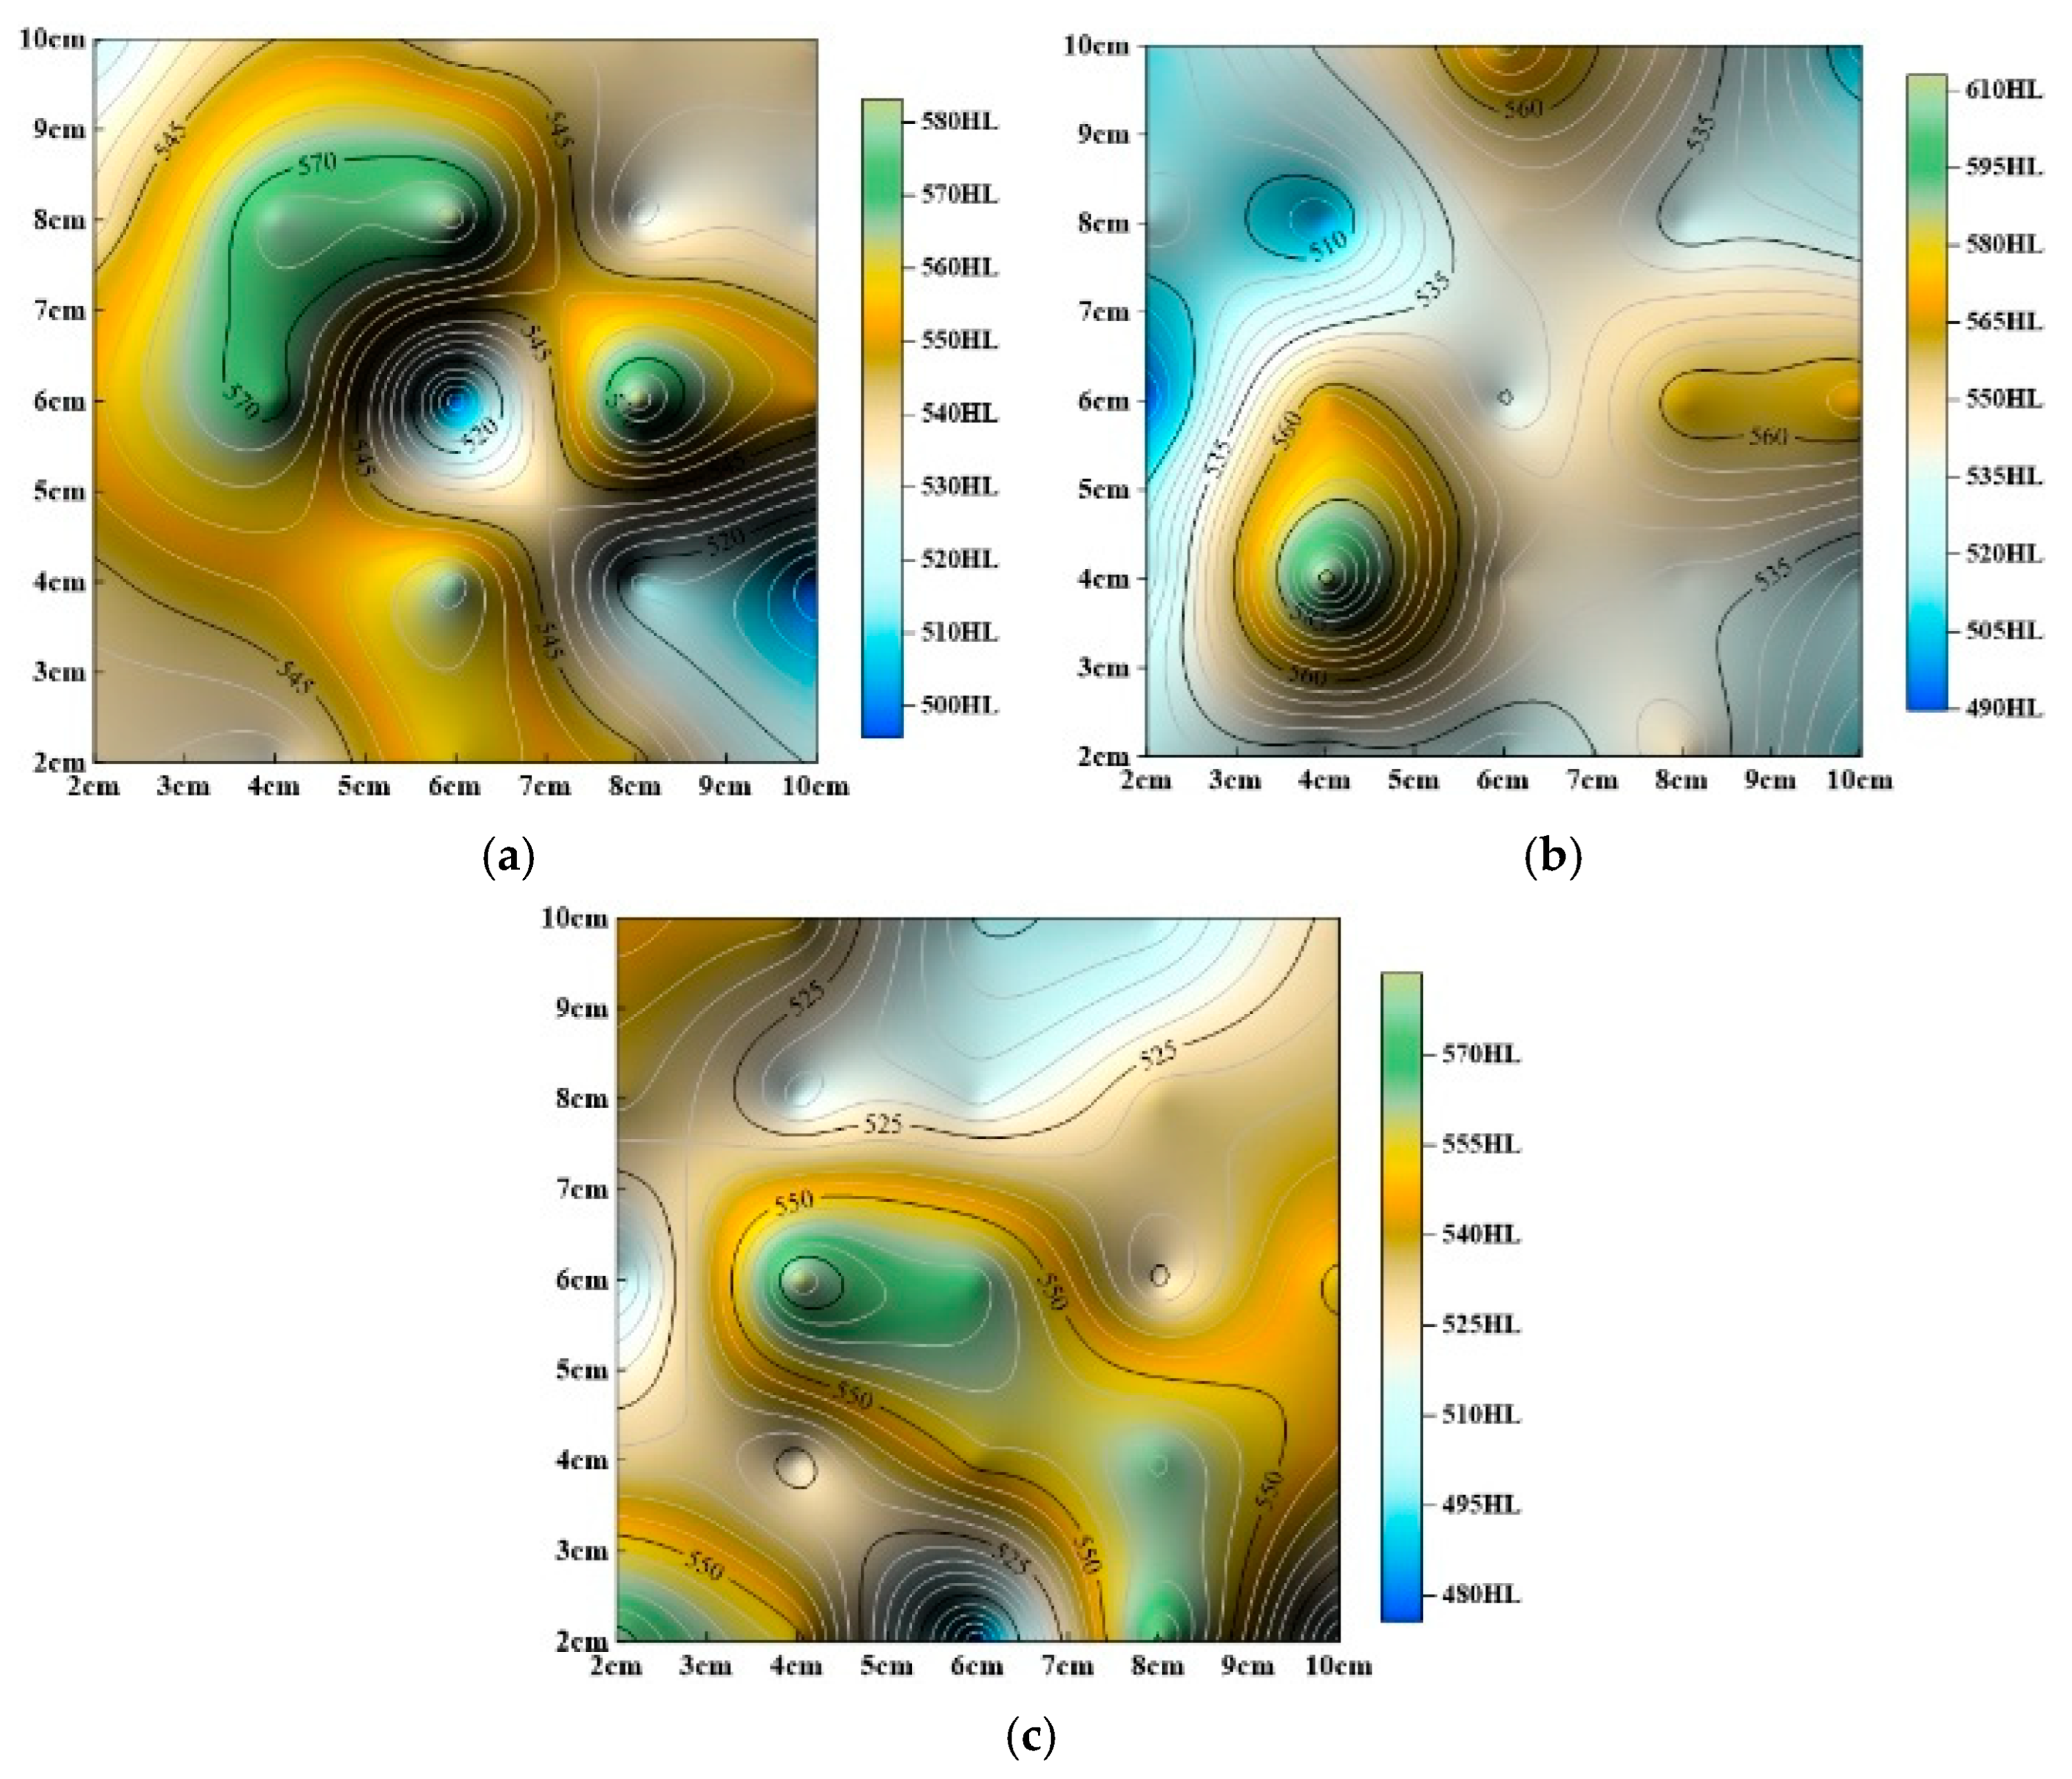
(2) Static Immersion Dissolution:
As shown in
Figure 14, overall P–wave velocity also decreases gradually with increasing immersion time. Maximum P–wave velocity values remain relatively concentrated in the central region, with no significant positional changes, but their distribution range gradually expands. Minimum P–wave velocity values consistently appear around the edges of the rock slab.
To further elucidate the differential impacts of static and dynamic dissolution on surface acoustic waves, area proportions of P–wave velocity distribution (relative to the non-corroded state) were calculated from P–wave velocity contour maps and are summarized in
Table 4.
Figure 15 illustrates changes in the area distribution proportions of different wave–velocity ratios over dissolution time. These analyses reveal distinct variation patterns of surface P–wave velocity under static and dynamic dissolution, highlighting the non-uniformity of acoustic wave distribution during weathering. These insights are crucial for understanding sandstone degradation mechanisms and developing targeted conservation strategies for sandstone-based cultural heritage.
The above analysis shows that the distribution of P-wave velocity ratios progressively shifts toward lower values, with distinct differences between static and dynamic dissolution.
(1) Dynamic Cyclic Dissolution:
The shift toward lower values occurs in a staged and continuous manner. As cyclic dissolution time increases, the P–wave velocity ratio decreases, and the distribution range gradually expands, indicating an enlargement of the affected area. Critical turning points occur at 48 h, 72 h, 120 h, and 144 h of cyclic dissolution (equivalent to the duration of acid rain in Southwest China), where P–wave velocity ratios exhibit relatively concentrated distributions. At 48 h, ratios primarily range from 0.92 to 0.96; at 72 h, they shift to 0.88–0.92; at 120 h, the main distribution moves to 0.85–0.9; and, at 144 h, ratios are predominantly in the range of 0.84–0.86. Combined with contour map analysis, the regions above the two sides of the rock slab are identified as areas with the lowest dynamic dissolution intensity.
(2) Static Immersion Dissolution:
A significant decrease in P-wave velocity is observed at 240 h of immersion, with ratios mainly distributed between 0.88 and 0.92. Subsequently, although P–wave velocity ratios continue to decrease, the distribution range broadens, and no concentrated areas of P–wave velocity ratios emerge.
In summary, dynamic cyclic dissolution results in a more complex P–wave velocity distribution, reflecting significant changes in the internal pore structure. Consequently, dynamic dissolution has a greater impact on pore structure evolution compared to static immersion dissolution. These findings highlight the importance of considering dissolution mechanisms when assessing sandstone degradation and developing preservation strategies for sandstone-based cultural heritage.
3.2.3. Research on Differences in Distribution Laws of Mechanical Parameters Under Different Corrosion Mechanisms
To comprehensively analyze the variation in corrosion influence range with static and dynamic corrosion time and the differences between static and dynamic corrosion, the distribution of mechanical strength affected by static and dynamic corrosion is analyzed by combining surface hardness and surface P–wave velocity analyses.
From the above analysis, the following can be concluded:
(1) During dynamic cyclic corrosion, the distributions of surface hardness and surface P–wave velocity show relatively consistent changes. Specifically, the maximum values of surface hardness and surface P–wave velocity are concentrated in the central area, and the positions of minimum values correspond closely, with the strength distribution showing good integrity. However, the distribution range of low P–wave velocity values gradually decreases, while that of low surface hardness values gradually increases.
(2) During static immersion corrosion, the consistency of surface hardness and surface P–wave velocity shows fluctuating changes. Initially, the distributions of surface hardness and P–wave velocity are inconsistent, but they gradually become consistent with increasing immersion time.
From the above analysis, it is evident that both static and dynamic corrosion lead to decreased surface mechanical strength, deteriorated surface stability, and reduced material durability. However, differences exist in the non-uniformity of mechanical strength distribution. The more concentrated the surface hardness ratio and P–wave velocity ratio are in one area, the more uniform they become.
Therefore, the following can be concluded:
(1) During dynamic cyclic corrosion, the distribution range of the surface hardness ratio gradually increases, and uniformity gradually decreases. The distribution range of the surface P–wave velocity ratio fluctuates, leading to fluctuating uniformity.
(2) During static immersion corrosion, the distribution range of surface hardness increases slightly, but the overall distribution remains relatively concentrated with good uniformity; the distribution range of surface P–wave velocity gradually expands, and uniformity gradually decreases.
For testing purposes, more non-uniform indicators are more suitable as danger signals. Therefore, for dynamic cyclic corrosion, it is advisable to focus on testing hardness distribution and hardness ratio changes; for static immersion corrosion, it is advisable to focus on testing P–wave velocity distribution and the P–wave velocity ratio.
3.3. Variation Regularities of Surface Moisture –Absorption Water –Content Curves Under Different Corrosion Mechanisms
When exposed to atmospheric conditions, sandstone materials are perpetually subjected to dynamic fluctuations in moisture content. Therefore, an indepth investigation into changes in the hygroscopic properties of sandstone following dissolution damage is of significant importance. The variations in moisture absorption curves under different dissolution conditions are shown in
Figure 16.
Moisture absorption curves under different dissolution conditions exhibit a similar growth pattern, characterized by an initial rapid increase followed by gradual deceleration, eventually approaching equilibrium. The effects of static and dynamic dissolution on moisture absorption are as follows:
(1) Dynamic cyclic dissolution progressively enhances sandstone hygroscopicity. This is evidenced by the gradual increase in sandstone moisture content during absorption as the dynamic cyclic dissolution duration extends; longer cyclic dissolution times result in higher moisture absorption rates at any given time. A clear positive correlation exists between cyclic dissolution duration and hygroscopicity.
(2) Static immersion dissolution leads to a gradual increase in moisture absorption. This is reflected in higher moisture absorption rates of sandstone post-immersion compared to pre-dissolution rates at all stages, with longer immersion times resulting in greater surface moisture absorption rates.
The moisture content in porous materials, when in equilibrium with air humidity, is referred to as equilibrium moisture content. It is evident that equilibrium moisture content under dynamic cyclic dissolution increases significantly during the initial phase, with the rate of increase slowing down subsequently. In contrast, static immersion dissolution shows a smaller initial increase, followed by an accelerated rate of increase.
As shown in the figure, both static and dynamic dissolution moisture contents exhibit a rapid increase within the first 20 min, after which the rate of increase significantly slows down. Therefore, the growth stages of static and dynamic moisture content are divided into two phases. Additionally, to compare differences between them, the growth rates of different dissolution methods are contrasted.
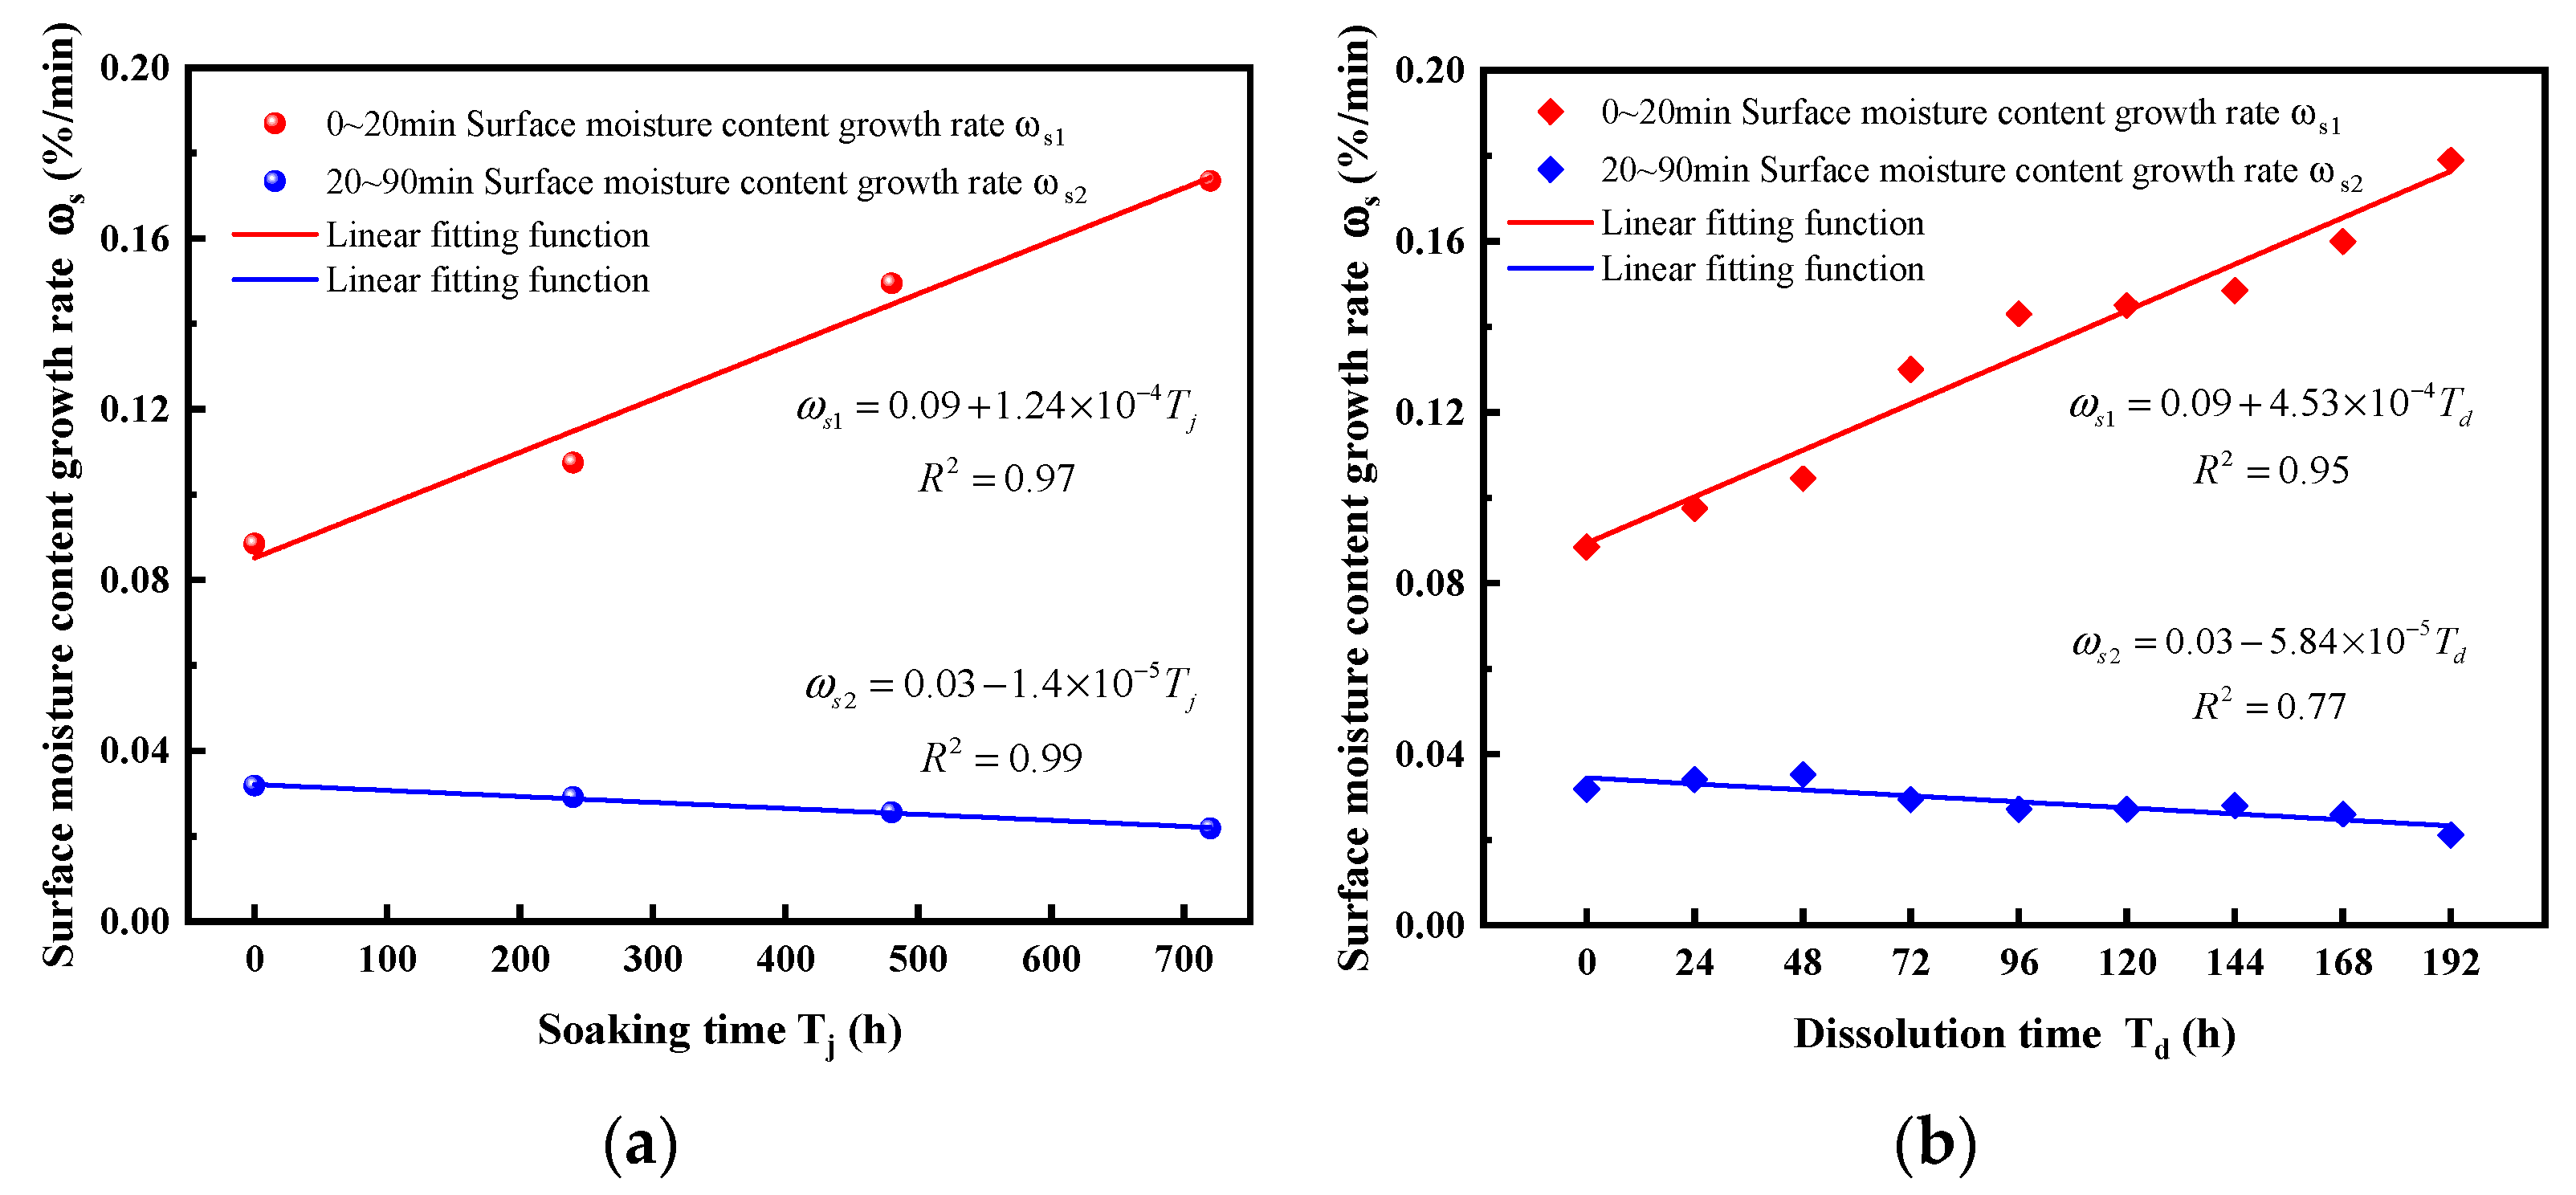
As shown in
Figure 17, the two phases of moisture content growth rate under static and dynamic dissolution exhibit a strong linear relationship with dissolution duration.
Specifically,
(1) During the first phase of moisture content growth (0~20 min), the growth rates of static and dynamic dissolution increase linearly with dissolution damage. The growth rate of dynamic cyclic dissolution shows some fluctuations during this phase, ultimately increasing to 0.18%/min, 2.02 times the initial growth rate. In contrast, the growth rate of static immersion dissolution increases almost linearly, reaching 1.96 times the initial growth rate. This indicates that dynamic cyclic dissolution results in a greater moisture content increase during this phase compared to static immersion dissolution.
(2) In the second phase of moisture content growth (20~90 min), the growth rates of static and dynamic dissolution decrease linearly with dissolution damage. During this phase, the growth rates of static and dynamic dissolution decrease steadily without significant fluctuations, with dynamic cyclic dissolution decreasing more substantially. This suggests that dynamic cyclic dissolution allows moisture content to reach equilibrium more quickly during this phase.


