

Urban Wastewater Phytoremediation by Autochthonous Microalgae in Winter Season: Indoor and Outdoor Trials

 ,
,  , , , ,
Abstract
1. Introduction
2. Materials and Methods
2.1. Microalgae Cultivation
2.2. Indoor Setup
2.3. Outdoor Setup
2.4. Growth Evaluations
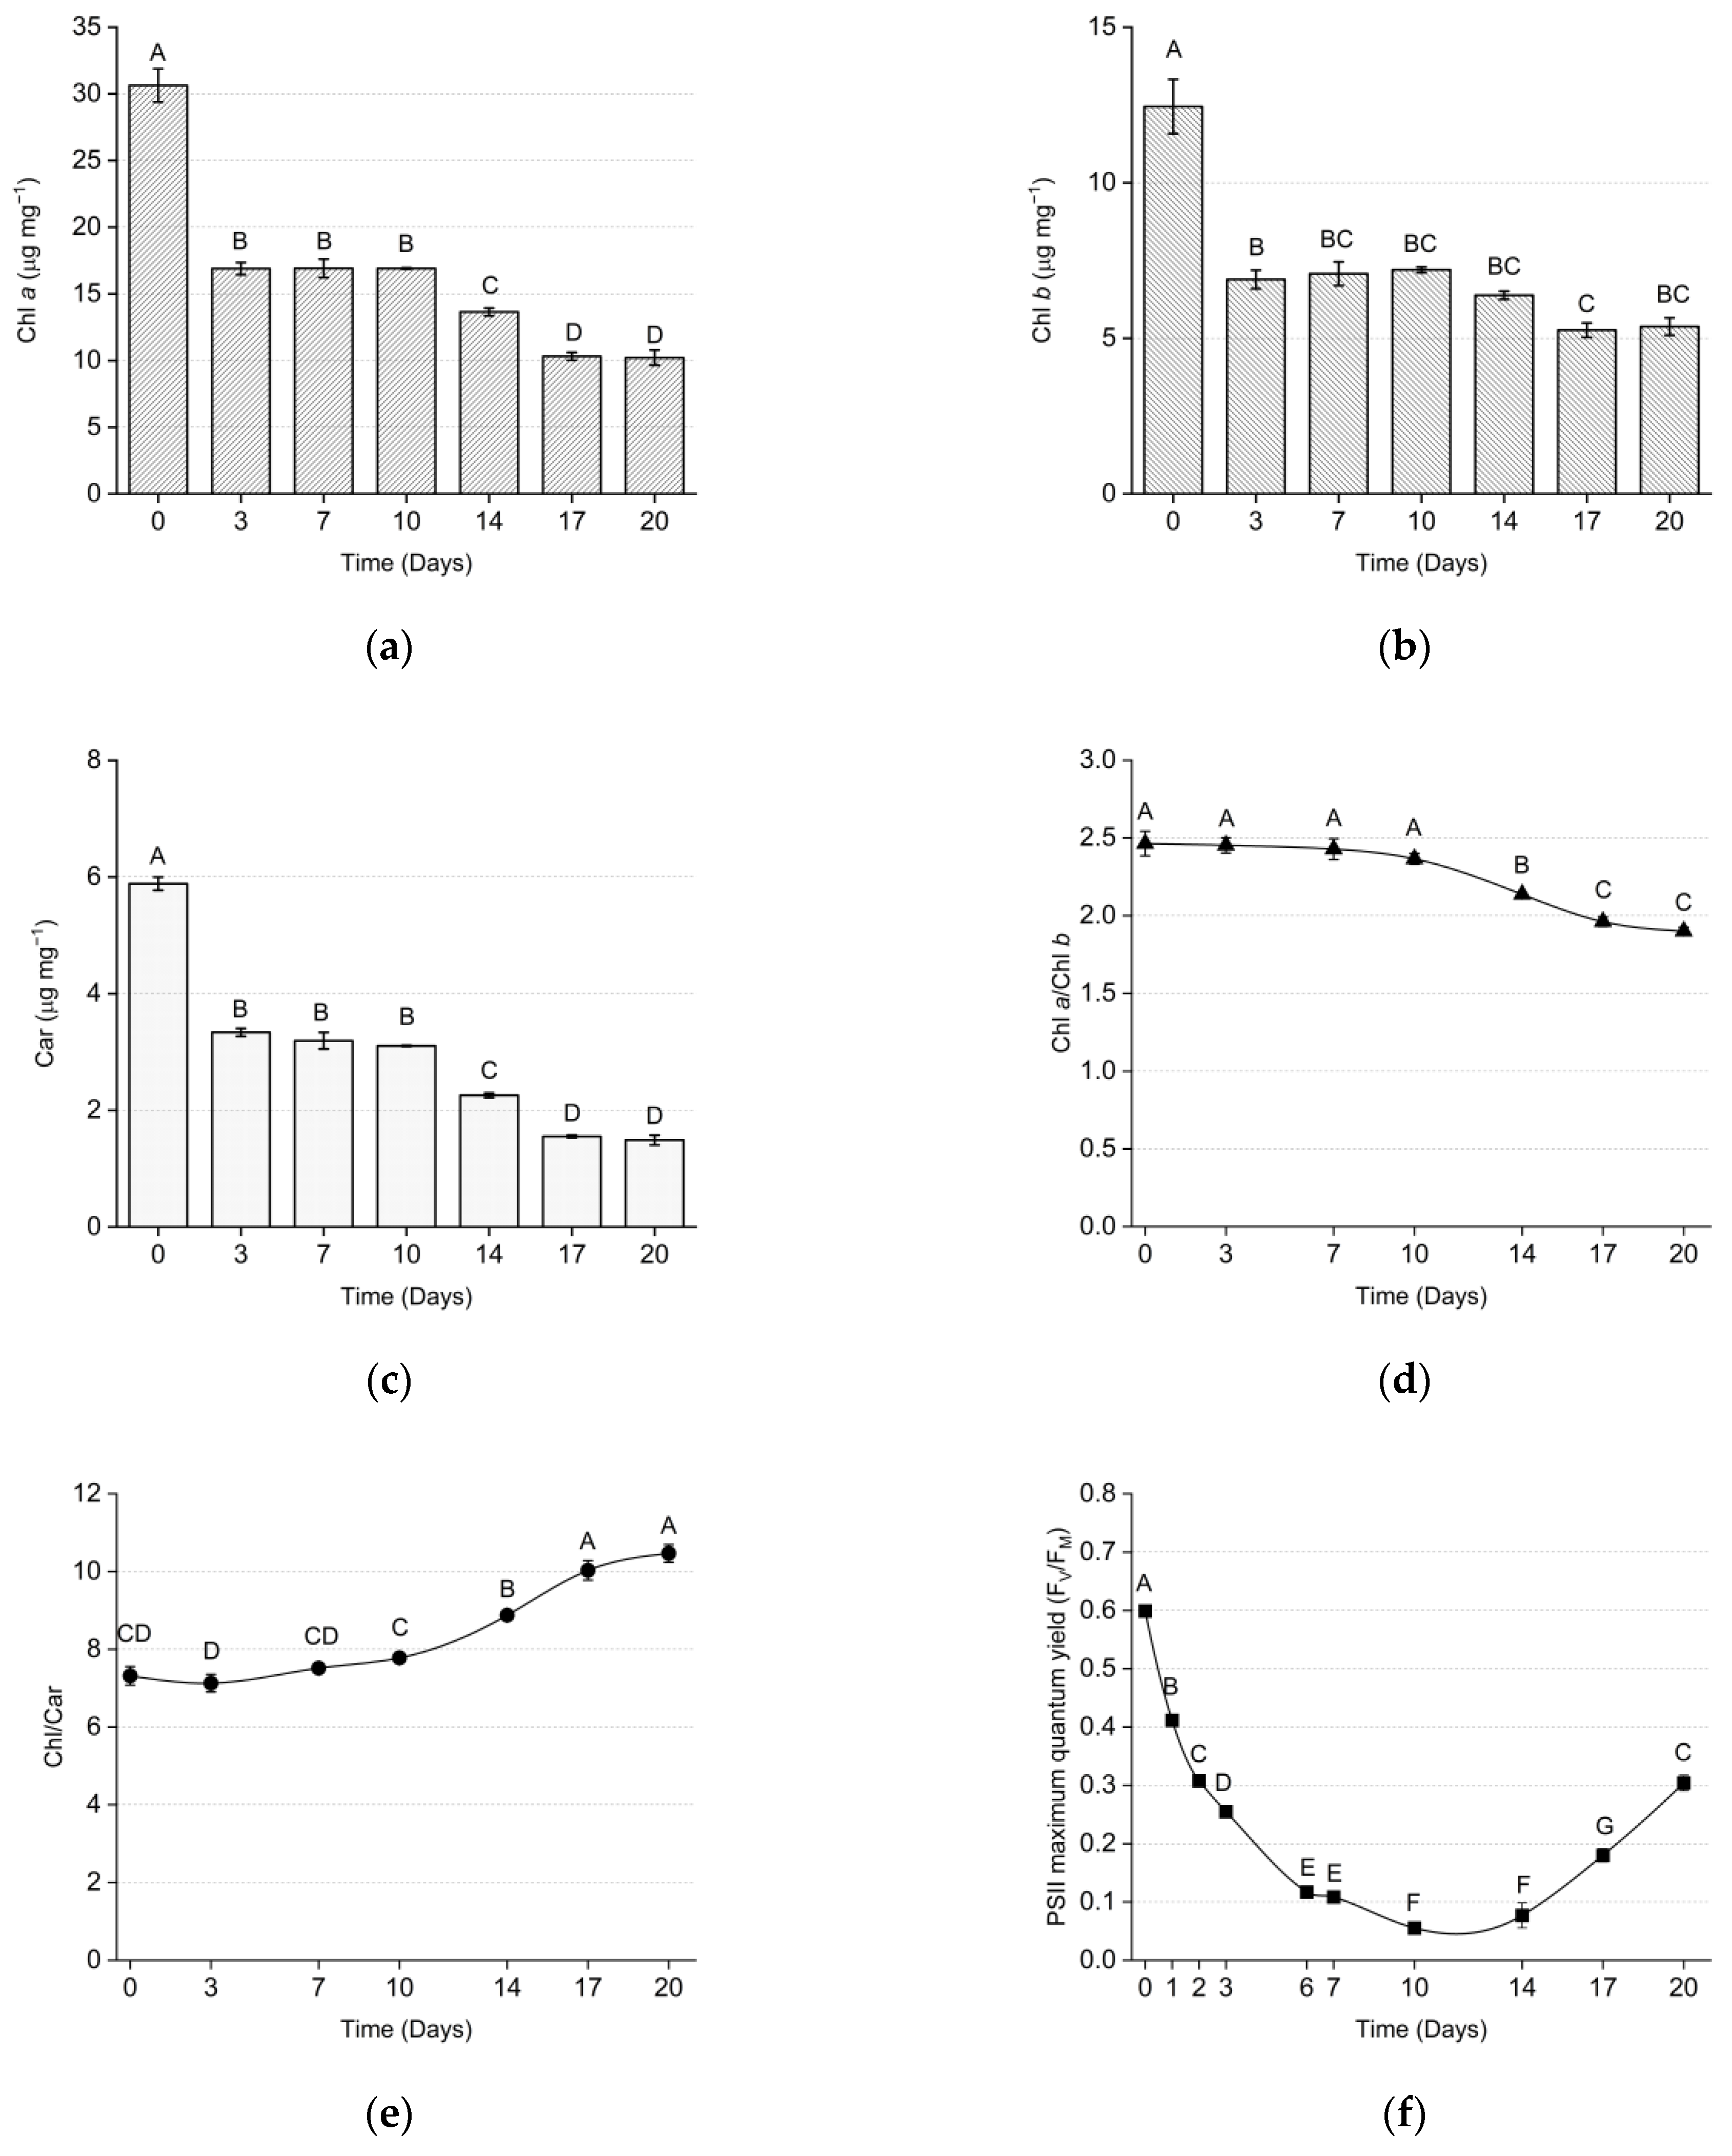
2.5. PSII Maximum Quantum Yield and Photosynthetic Pigments Analysis
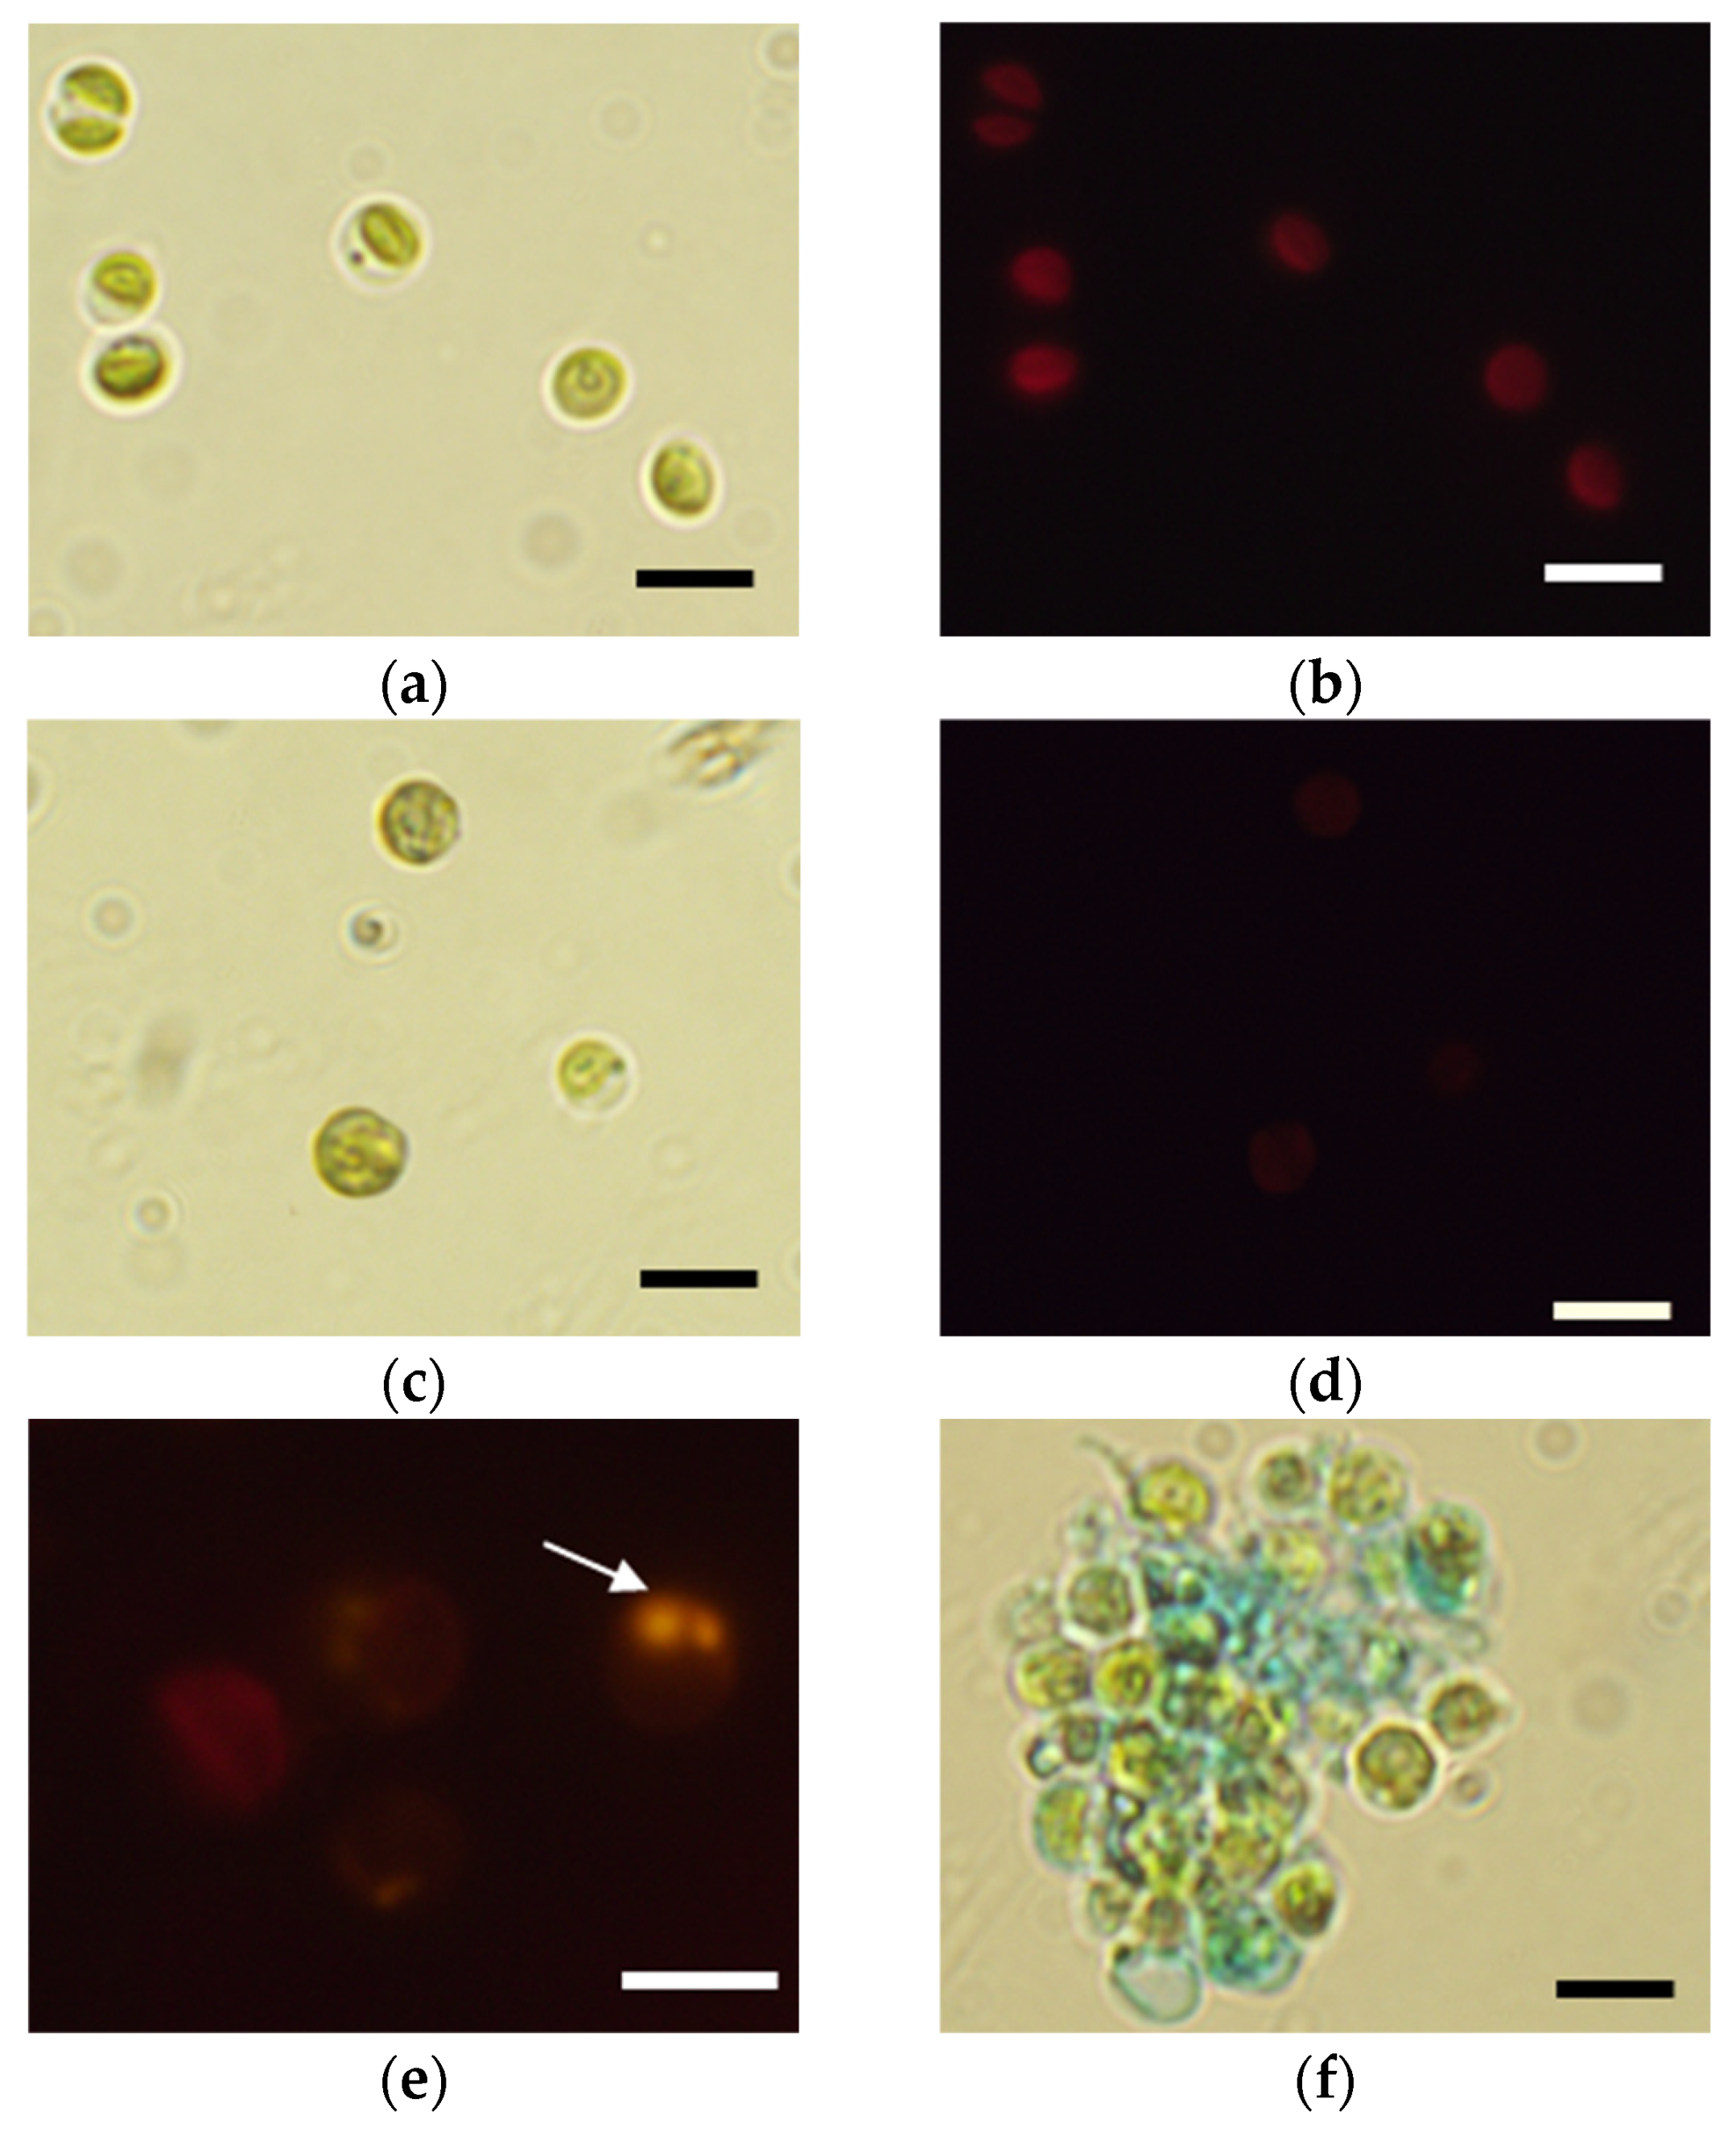
2.6. Morphological Aspects: Light and Electron Microscopy
2.7. Phytoremediation Analysis
2.8. Statistical Analyses
3. Results
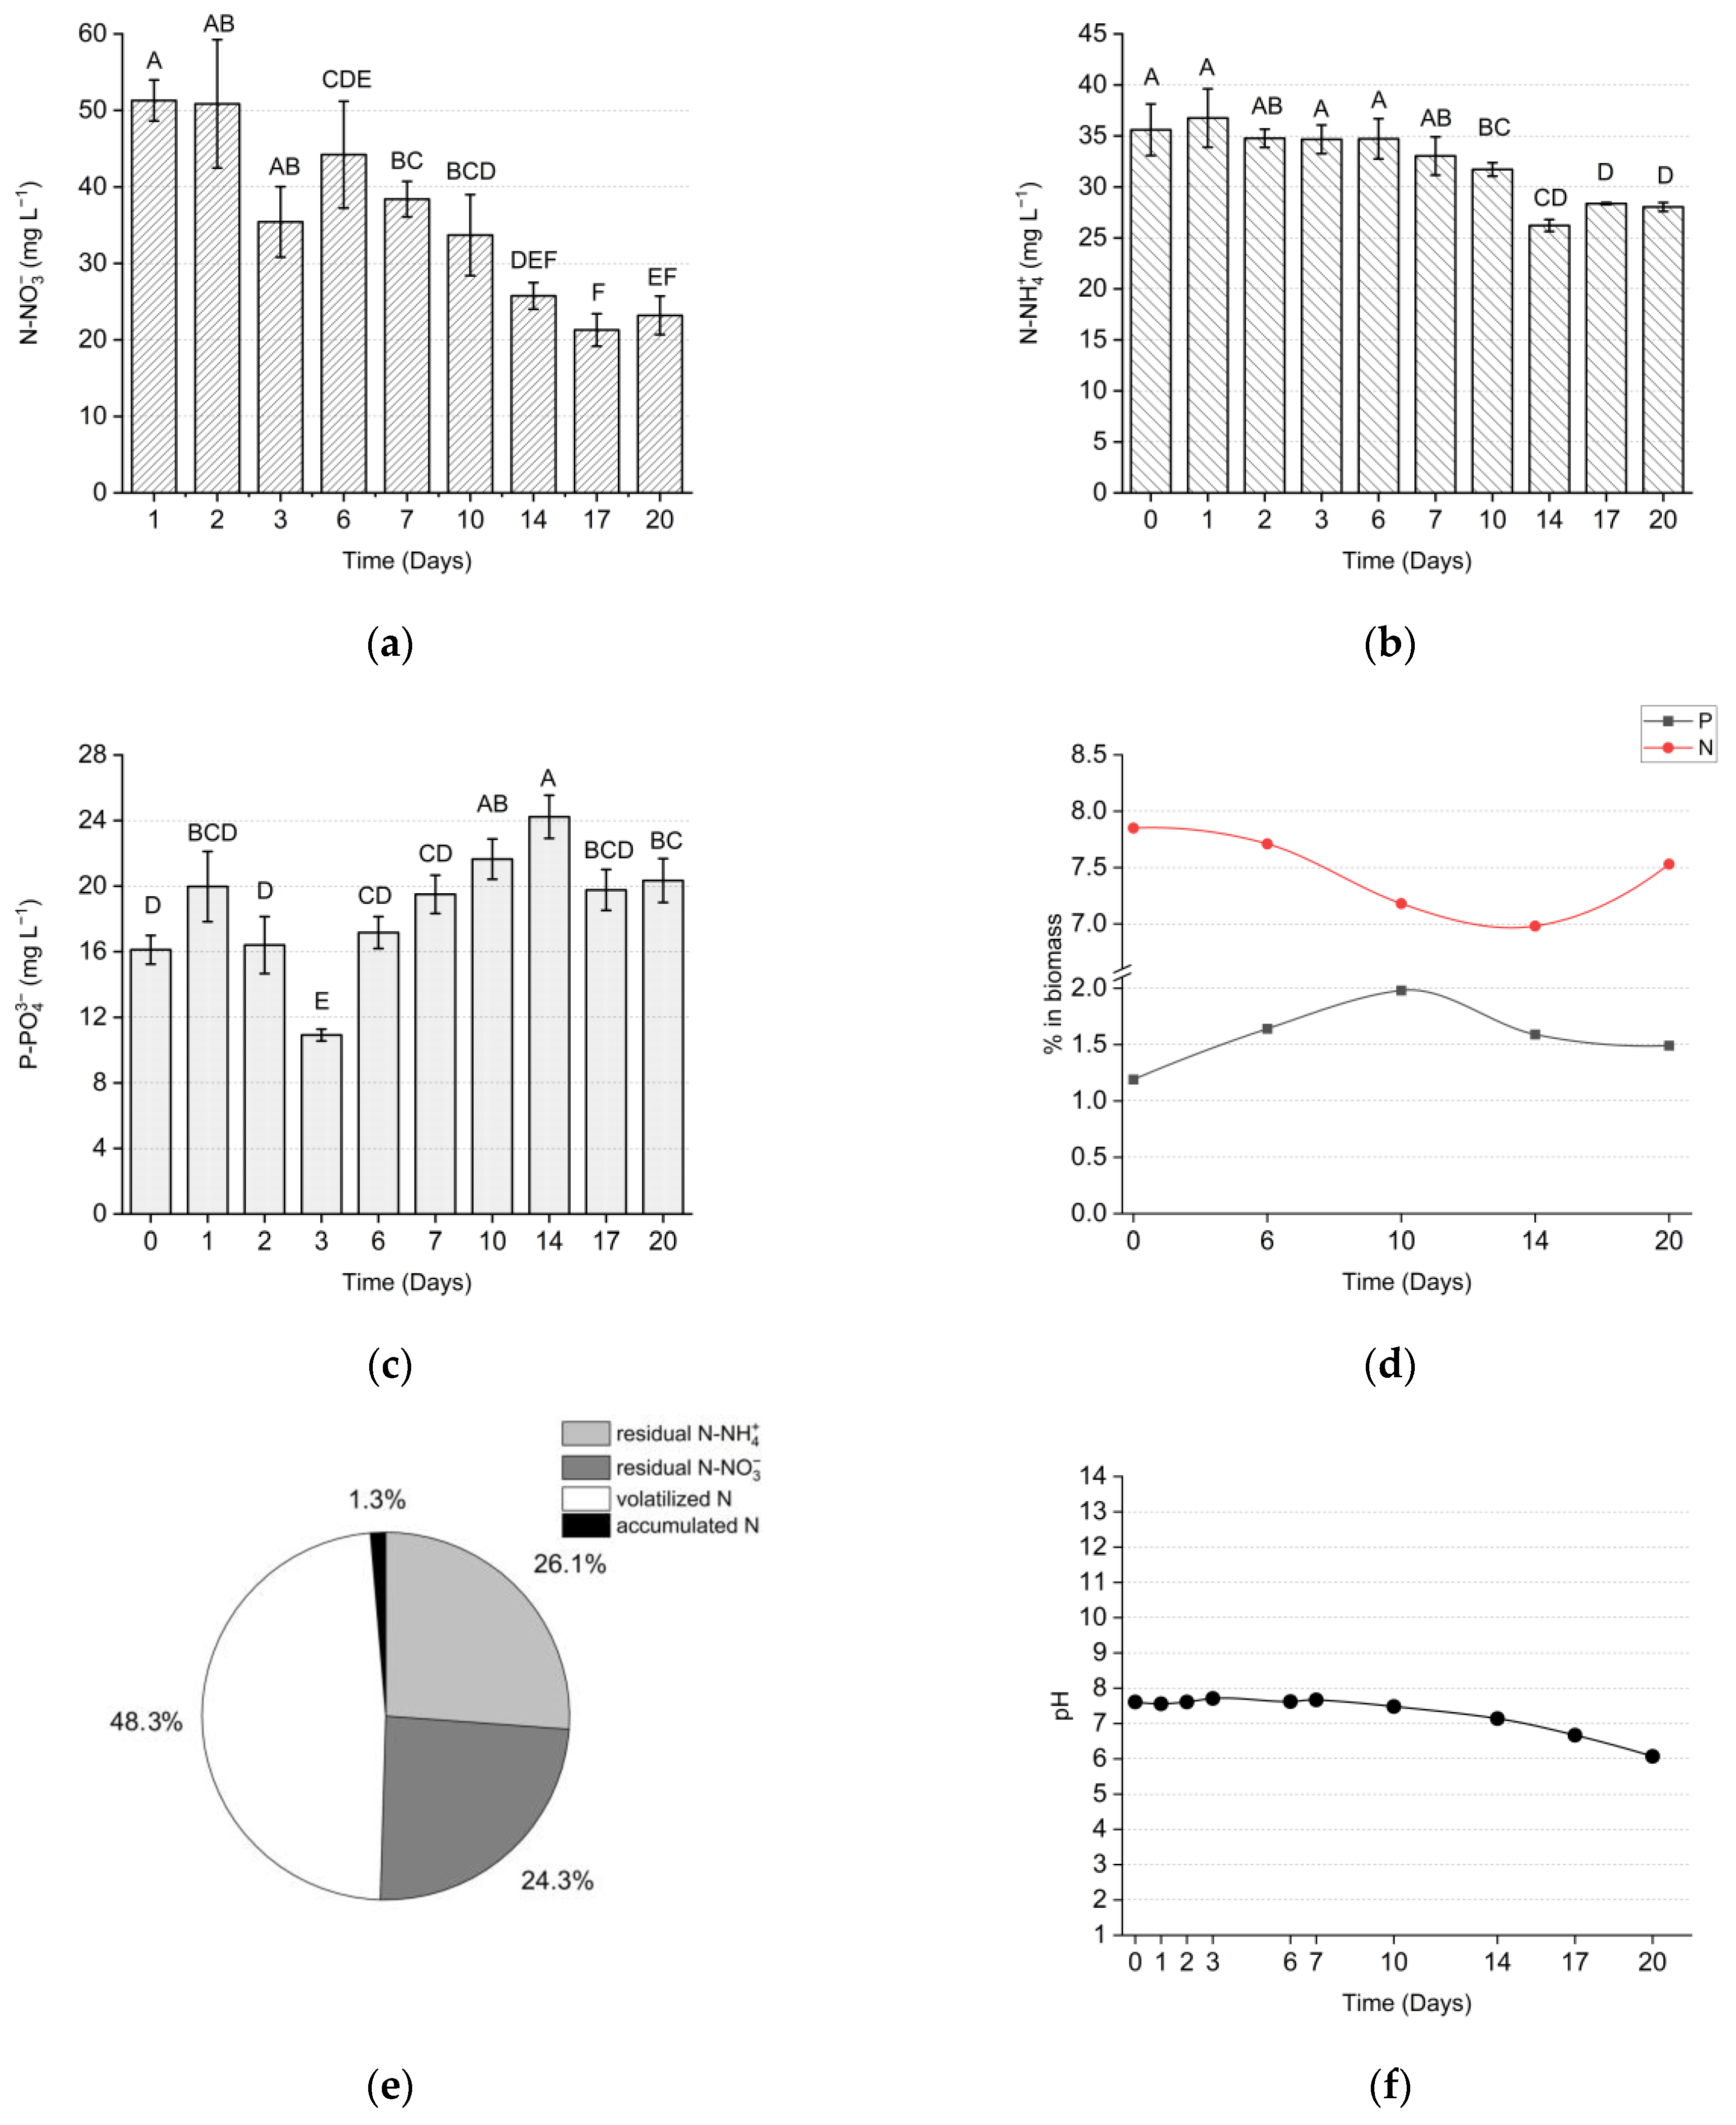
3.1. Indoor Setup
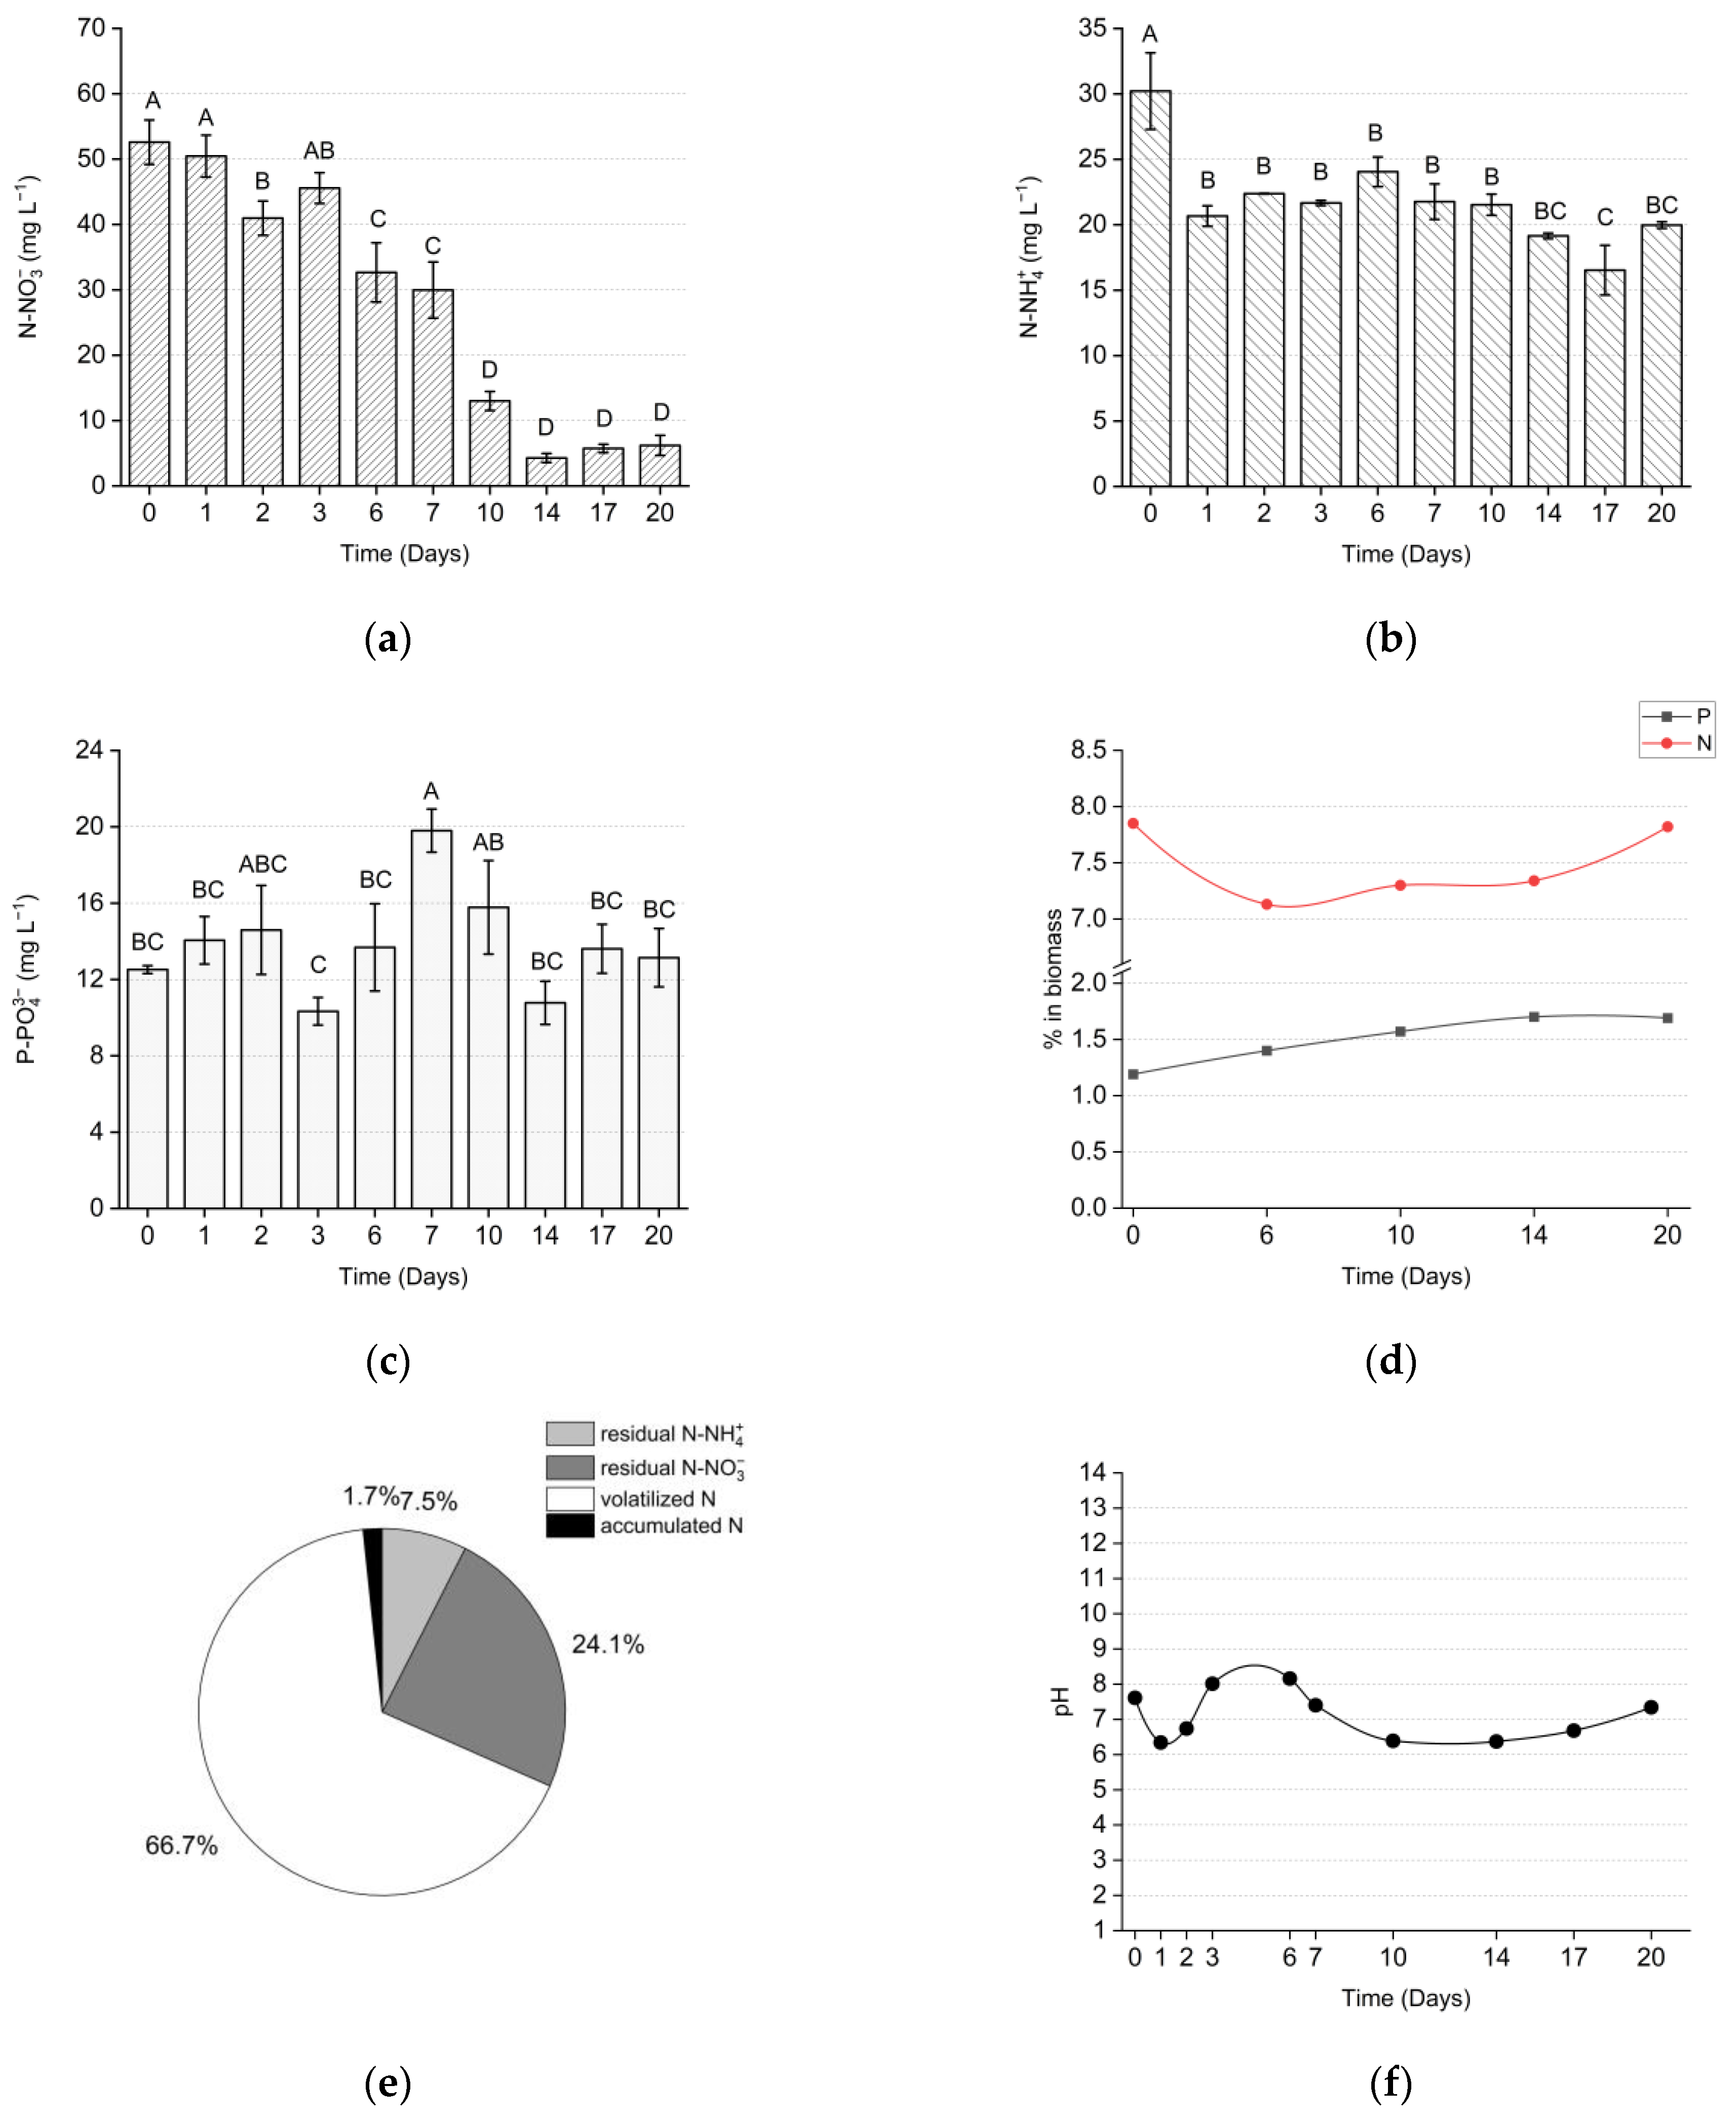
3.2. Outdoor Setup
4. Discussion
4.1. Effects of the Environmental Parameters on Microalgae Growth and Metabolism
4.2. Aggregate Production and Effluent Disinfection
4.3. Nutrient Removal
5. Conclusions
Supplementary Materials
Author Contributions
Funding
Institutional Review Board Statement
Informed Consent Statement
Data Availability Statement
Acknowledgments
Conflicts of Interest
Abbreviations
| WW | Wastewater |
| N | Nitrogen |
| P | Phosphate |
| WWTP | Wastewater treatment plants |
| ASP | Active sludge process |
| PAOs | Polyphosphate accumulating organisms |
References
- He, C.; Liu, Z.; Wu, J.; Pan, X.; Fang, Z.; Li, J.; Bryan, B.A. Future Global Urban Water Scarcity and Potential Solutions. Nat. Commun. 2021, 12, 4667. [Google Scholar] [CrossRef] [PubMed]
- Awere, E.; Pennellini, S.; Bonoli, A. State of the Art on Water Consumption and Wastewater Reuse in Developing Countries. In Water-Energy-Nexus in the Ecological Transition: Natural-Based Solutions, Advanced Technologies and Best Practices for Environmental Sustainability; Naddeo, V., Choo, K.-H., Ksibi, M., Eds.; Advances in Science, Technology & Innovation; Springer International Publishing: Cham, Switzerland, 2022; pp. 303–306. ISBN 978-3-031-00808-5. [Google Scholar]
- Madias, K.; Szymkowiak, A. Residential Sustainable Water Usage and Water Management: Systematic Review and Future Research. Water 2022, 14, 1027. [Google Scholar] [CrossRef]
- Mascolo, G.; Murgolo, S.; Stefani, F.; Viganò, L. Target and Suspect Contaminants of Emerging Concern in the Po River Delta Lagoons. Estuar. Coast. Shelf Sci. 2019, 230, 106424. [Google Scholar] [CrossRef]
- Soana, E.; Gervasio, M.P.; Granata, T.; Colombo, D.; Castaldelli, G. Climate Change Impacts on Eutrophication in the Po River (Italy): Temperature-Mediated Reduction in Nitrogen Export but No Effect on Phosphorus. J. Environ. Sci. 2023, 143, 148–163. [Google Scholar] [CrossRef] [PubMed]
- Tong, Y.; Wang, X.; Elser, J.J. Unintended Nutrient Imbalance Induced by Wastewater Effluent Inputs to Receiving Water and Its Ecological Consequences. Front. Environ. Sci. Eng. 2022, 16, 149. [Google Scholar] [CrossRef]
- Viganò, L.; Guzzella, L.; Marziali, L.; Mascolo, G.; Bagnuolo, G.; Ciannarella, R.; Roscioli, C. The Last 50 Years of Organic Contamination of a Highly Anthropized Tributary of the Po River (Italy). J. Environ. Manag. 2023, 326, 116665. [Google Scholar] [CrossRef]
- Daverey, A.; Pandey, D.; Verma, P.; Verma, S.; Shah, V.; Dutta, K.; Arunachalam, K. Recent Advances in Energy Efficient Biological Treatment of Municipal Wastewater. Bioresour. Technol. Rep. 2019, 7, 100252. [Google Scholar] [CrossRef]
- Wu, P.; Chen, J.; Garlapati, V.K.; Zhang, X.; Wani Victor Jenario, F.; Li, X.; Liu, W.; Chen, C.; Aminabhavi, T.M.; Zhang, X. Novel Insights into Anammox-Based Processes: A Critical Review. Chem. Eng. J. 2022, 444, 136534. [Google Scholar] [CrossRef]
- Roychoudhury, A.; Das, N. Sewage Sludge Treatment and Involvement of Microbes. In Sustainable Management and Utilization of Sewage Sludge; Rajput, V.D., Yadav, A.N., Jatav, H.S., Singh, S.K., Minkina, T., Eds.; Springer International Publishing: Cham, Switzerland, 2022; pp. 165–181. ISBN 978-3-030-85226-9. [Google Scholar]
- Radetic, B. Sludge Treatment Technologies and Systems, an Introduction. In Handbook of Water and Used Water Purification; Lahnsteiner, J., Ed.; Springer International Publishing: Cham, Switzerland, 2024; pp. 689–713. ISBN 978-3-319-78000-9. [Google Scholar]
- Di Capua, F.; Iannacone, F.; Sabba, F.; Esposito, G. Simultaneous Nitrification–Denitrification in Biofilm Systems for Wastewater Treatment: Key Factors, Potential Routes, and Engineered Applications. Bioresour. Technol. 2022, 361, 127702. [Google Scholar] [CrossRef]
- Lin, H.; Wang, Y.; Dong, Y. A Review of Methods, Influencing Factors and Mechanisms for Phosphorus Recovery from Sewage and Sludge from Municipal Wastewater Treatment Plants. J. Environ. Chem. Eng. 2024, 12, 111657. [Google Scholar] [CrossRef]
- Wang, J.; Lei, Z.; Tian, C.; Liu, S.; Wang, Q.; Shimizu, K.; Zhang, Z.; Adachi, Y.; Lee, D.-J. Ionic Response of Algal-Bacterial Granular Sludge System during Biological Phosphorus Removal from Wastewater. Chemosphere 2021, 264, 128534. [Google Scholar] [CrossRef] [PubMed]
- Romero-Güiza, M.S.; Flotats, X.; Asiain-Mira, R.; Palatsi, J. Enhancement of Sewage Sludge Thickening and Energy Self-Sufficiency with Advanced Process Control Tools in a Full-Scale Wastewater Treatment Plant. Water Res. 2022, 222, 118924. [Google Scholar] [CrossRef] [PubMed]
- Senfter, T.; Fritsch, L.; Berger, M.; Kofler, T.; Mayerl, C.; Pillei, M.; Kraxner, M. Sludge Thickening in a Wastewater Treatment Plant Using a Modified Hydrocyclone. Carbon Resour. Convers. 2021, 4, 132–141. [Google Scholar] [CrossRef]
- Shakeri, H.; Motiee, H.; McBean, E. Forecasting Impacts of Climate Change on Changes of Municipal Wastewater Production in Wastewater Reuse Projects. J. Clean. Prod. 2021, 329, 129790. [Google Scholar] [CrossRef]
- Geremia, E.; Ripa, M.; Catone, C.M.; Ulgiati, S. A Review about Microalgae Wastewater Treatment for Bioremediation and Biomass Production—A New Challenge for Europe. Environments 2021, 8, 136. [Google Scholar] [CrossRef]
- de Jesus Raposo, M.F.; de Morais, R.M.S.C.; de Morais, A.M.M.B. Health Applications of Bioactive Compounds from Marine Microalgae. Life Sci. 2013, 93, 479–486. [Google Scholar] [CrossRef]
- Vázquez-Romero, B.; Perales, J.A.; Pereira, H.; Barbosa, M.; Ruiz, J. Techno-Economic Assessment of Microalgae Production, Harvesting and Drying for Food, Feed, Cosmetics, and Agriculture. Sci. Total Environ. 2022, 837, 155742. [Google Scholar] [CrossRef] [PubMed]
- Zhou, W.; Li, Y.; Gao, Y.; Zhao, H. Nutrients Removal and Recovery from Saline Wastewater by Spirulina Platensis. Bioresour. Technol. 2017, 245, 10–17. [Google Scholar] [CrossRef]
- Morillas-España, A.; Lafarga, T.; Sánchez-Zurano, A.; Acién-Fernández, F.G.; González-López, C. Microalgae Based Wastewater Treatment Coupled to the Production of High Value Agricultural Products: Current Needs and Challenges. Chemosphere 2022, 291, 132968. [Google Scholar] [CrossRef]
- Kumar, A.; Bera, S. Revisiting Nitrogen Utilization in Algae: A Review on the Process of Regulation and Assimilation. Bioresour. Technol. Rep. 2020, 12, 100584. [Google Scholar] [CrossRef]
- Qiao, S.; Hou, C.; Wang, X.; Zhou, J. Minimizing Greenhouse Gas Emission from Wastewater Treatment Process by Integrating Activated Sludge and Microalgae Processes. Sci. Total Environ. 2020, 732, 139032. [Google Scholar] [CrossRef] [PubMed]
- Shahid, A.; Malik, S.; Zhu, H.; Xu, J.; Nawaz, M.Z.; Nawaz, S.; Alam, M.A.; Mehmood, M.A. Cultivating Microalgae in Wastewater for Biomass Production, Pollutant Removal, and Atmospheric Carbon Mitigation; a Review. Sci. Total Environ. 2020, 704, 135303. [Google Scholar] [CrossRef]
- Lee, Y.-J.; Lei, Z. Wastewater Treatment Using Microalgal-Bacterial Aggregate Process at Zero-Aeration Scenario: Most Recent Research Focuses and Perspectives. Bioresour. Technol. Rep. 2022, 17, 100943. [Google Scholar] [CrossRef]
- Razzak, S.A. Recent Advances in Sustainable Biological Nutrient Removal from Municipal Wastewater. Clean. Water 2024, 2, 100047. [Google Scholar] [CrossRef]
- Alvarez, A.L.; Weyers, S.L.; Goemann, H.M.; Peyton, B.M.; Gardner, R.D. Microalgae, Soil and Plants: A Critical Review of Microalgae as Renewable Resources for Agriculture. Algal Res. 2021, 54, 102200. [Google Scholar] [CrossRef]
- Solovchenko, A.E.; Ismagulova, T.T.; Lukyanov, A.A.; Vasilieva, S.G.; Konyukhov, I.V.; Pogosyan, S.I.; Lobakova, E.S.; Gorelova, O.A. Luxury Phosphorus Uptake in Microalgae. J. Appl. Phycol. 2019, 31, 2755–2770. [Google Scholar] [CrossRef]
- Mehariya, S.; Goswami, R.K.; Verma, P.; Lavecchia, R.; Zuorro, A. Integrated Approach for Wastewater Treatment and Biofuel Production in Microalgae Biorefineries. Energies 2021, 14, 2282. [Google Scholar] [CrossRef]
- Alishah Aratboni, H.; Rafiei, N.; Garcia-Granados, R.; Alemzadeh, A.; Morones-Ramírez, J.R. Biomass and Lipid Induction Strategies in Microalgae for Biofuel Production and Other Applications. Microb. Cell Factories 2019, 18, 178. [Google Scholar] [CrossRef]
- Popovich, C.A.; Damiani, C.; Constenla, D.; Martínez, A.M.; Freije, H.; Giovanardi, M.; Pancaldi, S.; Leonardi, P.I. Neochloris oleoabundans Grown in Enriched Natural Seawater for Biodiesel Feedstock: Evaluation of Its Growth and Biochemical Composition. Bioresour. Technol. 2012, 114, 287–293. [Google Scholar] [CrossRef]
- Kaloudas, D.; Pavlova, N.; Penchovsky, R. Phycoremediation of Wastewater by Microalgae: A Review. Environ. Chem. Lett. 2021, 19, 2905–2920. [Google Scholar] [CrossRef]
- Ethiraj, S.; Samuel, M.S. A Comprehensive Review of the Challenges and Opportunities in Microalgae-Based Wastewater Treatment for Eliminating Organic, Inorganic, and Emerging Pollutants. Biocatal. Agric. Biotechnol. 2024, 60, 103316. [Google Scholar] [CrossRef]
- Amaro, H.M.; Salgado, E.M.; Nunes, O.C.; Pires, J.C.M.; Esteves, A.F. Microalgae Systems—Environmental Agents for Wastewater Treatment and Further Potential Biomass Valorisation. J. Environ. Manag. 2023, 337, 117678. [Google Scholar] [CrossRef]
- Bhatt, A.; Arora, P.; Prajapati, S.K. Chlorella Pyrenoidosa-Mediated Removal of Pathogenic Bacteria from Municipal Wastewater—Multivariate Process Optimization and Application in the Real Sewage. J. Environ. Chem. Eng. 2023, 11, 109494. [Google Scholar] [CrossRef]
- Ferro, L.; Gorzsás, A.; Gentili, F.G.; Funk, C. Subarctic Microalgal Strains Treat Wastewater and Produce Biomass at Low Temperature and Short Photoperiod. Algal Res. 2018, 35, 160–167. [Google Scholar] [CrossRef]
- Lee, J.-C.; Joo, J.-H.; Chun, B.H.; Moon, K.; Song, S.H.; Kim, Y.J.; Lee, S.M.; Lee, A.H. Isolation and Screening of Indigenous Microalgae Species for Domestic and Livestock Wastewater Treatment, Biodiesel Production, and Carbon Sequestration. J. Environ. Manag. 2022, 318, 115648. [Google Scholar] [CrossRef]
- Aketo, T.; Hoshikawa, Y.; Nojima, D.; Yabu, Y.; Maeda, Y.; Yoshino, T.; Takano, H.; Tanaka, T. Selection and Characterization of Microalgae with Potential for Nutrient Removal from Municipal Wastewater and Simultaneous Lipid Production. J. Biosci. Bioeng. 2020, 129, 565–572. [Google Scholar] [CrossRef] [PubMed]
- Afonso, V.; Borges, R.; Rodrigues, B.; Barros, R.; João Bebianno, M.; Raposo, S. Are Native Microalgae Consortia Able to Remove Microplastics from Wastewater Effluents? Environ. Pollut. 2024, 349, 123931. [Google Scholar] [CrossRef]
- Nishshanka, G.K.S.H.; Thevarajah, B.; Nimarshana, P.H.V.; Prajapati, S.K.; Ariyadasa, T.U. Real-Time Integration of Microalgae-Based Bioremediation in Conventional Wastewater Treatment Plants: Current Status and Prospects. J. Water Process Eng. 2023, 56, 104248. [Google Scholar] [CrossRef]
- Pacheco, M.M.; Hoeltz, M.; Moraes, M.S.; Schneider, R.C. Microalgae: Cultivation Techniques and Wastewater Phycoremediation. J. Environ. Sci. Health Part A 2015, 50, 585–601. [Google Scholar]
- Bohutskyi, P.; Liu, K.; Nasr, L.K.; Byers, N.; Rosenberg, J.N.; Oyler, G.A.; Betenbaugh, M.J.; Bouwer, E.J. Bioprospecting of Microalgae for Integrated Biomass Production and Phytoremediation of Unsterilized Wastewater and Anaerobic Digestion Centrate. Appl. Microbiol. Biotechnol. 2015, 99, 6139–6154. [Google Scholar] [CrossRef]
- Costa, J.A.V.; Freitas, B.C.B.; Santos, T.D.; Mitchell, B.G.; Morais, M.G. Chapter 9—Open Pond Systems for Microalgal Culture. In Biofuels from Algae, 2nd ed.; Pandey, A., Chang, J.-S., Soccol, C.R., Lee, D.-J., Chisti, Y., Eds.; Biomass, Biofuels, Biochemicals; Elsevier: Amsterdam, The Netherlands, 2019; pp. 199–223. ISBN 978-0-444-64192-2. [Google Scholar]
- Zhuang, L.-L.; Yang, P.; Liang, S.; Yu, T.; Liu, C.; Zhao, T.; Tan, G.; Niu, Y.; Zhang, J. Comparison of Microalgae Cultivation Modes for Advanced Wastewater Purification and Pollutant-Resource Conversion: A Pilot Study. J. Water Process Eng. 2023, 56, 104374. [Google Scholar] [CrossRef]
- Novoveská, L.; Nielsen, S.L.; Eroldoğan, O.T.; Haznedaroglu, B.Z.; Rinkevich, B.; Fazi, S.; Robbens, J.; Vasquez, M.; Einarsson, H. Overview and Challenges of Large-Scale Cultivation of Photosynthetic Microalgae and Cyanobacteria. Mar. Drugs 2023, 21, 445. [Google Scholar] [CrossRef]
- Iasimone, F.; Panico, A.; De Felice, V.; Fantasma, F.; Iorizzi, M.; Pirozzi, F. Effect of Light Intensity and Nutrients Supply on Microalgae Cultivated in Urban Wastewater: Biomass Production, Lipids Accumulation and Settleability Characteristics. J. Environ. Manag. 2018, 223, 1078–1085. [Google Scholar] [CrossRef] [PubMed]
- Lee, K.; Lee, C.-G. Effect of Light/Dark Cycles on Wastewater Treatments by Microalgae. Biotechnol. Bioprocess Eng. 2001, 6, 194–199. [Google Scholar] [CrossRef]
- Xu, K.; Zou, X.; Xue, Y.; Qu, Y.; Li, Y. The Impact of Seasonal Variations about Temperature and Photoperiod on the Treatment of Municipal Wastewater by Algae-Bacteria System in Lab-Scale. Algal Res. 2021, 54, 102175. [Google Scholar] [CrossRef]
- Delgadillo-Mirquez, L.; Lopes, F.; Taidi, B.; Pareau, D. Nitrogen and Phosphate Removal from Wastewater with a Mixed Microalgae and Bacteria Culture. Biotechnol. Rep. 2016, 11, 18–26. [Google Scholar] [CrossRef]
- Lee, C.S.; Lee, S.-A.; Ko, S.-R.; Oh, H.-M.; Ahn, C.-Y. Effects of Photoperiod on Nutrient Removal, Biomass Production, and Algal-Bacterial Population Dynamics in Lab-Scale Photobioreactors Treating Municipal Wastewater. Water Res. 2015, 68, 680–691. [Google Scholar] [CrossRef]
- Murata, N.; Takahashi, S.; Nishiyama, Y.; Allakhverdiev, S.I. Photoinhibition of Photosystem II under Environmental Stress. Biochim. Biophys. Acta BBA Bioenerg. 2007, 1767, 414–421. [Google Scholar] [CrossRef]
- Plöhn, M.; Spain, O.; Sirin, S.; Silva, M.; Escudero-Oñate, C.; Ferrando-Climent, L.; Allahverdiyeva, Y.; Funk, C. Wastewater Treatment by Microalgae. Physiol. Plant. 2021, 173, 568–578. [Google Scholar] [CrossRef]
- Ferro, L.; Hu, Y.O.O.; Gentili, F.G.; Andersson, A.F.; Funk, C. DNA Metabarcoding Reveals Microbial Community Dynamics in a Microalgae-Based Municipal Wastewater Treatment Open Photobioreactor. Algal Res. 2020, 51, 102043. [Google Scholar] [CrossRef]
- Valledor, L.; Furuhashi, T.; Hanak, A.-M.; Weckwerth, W. Systemic Cold Stress Adaptation of Chlamydomonas reinhardtii. Mol. Cell. Proteom. 2013, 12, 2032–2047. [Google Scholar] [CrossRef]
- Larsdotter, K.; la Cour Jansen, J.; Dalhammar, G. Phosphorus Removal from Wastewater by Microalgae in Sweden—A Year-round Perspective. Environ. Technol. 2010, 31, 117–123. [Google Scholar] [CrossRef] [PubMed]
- AlMomani, F.; Örmeci, B. Assessment of Algae-Based Wastewater Treatment in Hot Climate Region: Treatment Performance and Kinetics. Process Saf. Environ. Prot. 2020, 141, 140–149. [Google Scholar] [CrossRef]
- Cheregi, O.; Ekendahl, S.; Engelbrektsson, J.; Strömberg, N.; Godhe, A.; Spetea, C. Microalgae Biotechnology in Nordic Countries—The Potential of Local Strains. Physiol. Plant. 2019, 166, 438–450. [Google Scholar] [CrossRef] [PubMed]
- Wan Mahari, W.A.; Wan Razali, W.A.; Manan, H.; Hersi, M.A.; Ishak, S.D.; Cheah, W.; Chan, D.J.C.; Sonne, C.; Show, P.L.; Lam, S.S. Recent Advances on Microalgae Cultivation for Simultaneous Biomass Production and Removal of Wastewater Pollutants to Achieve Circular Economy. Bioresour. Technol. 2022, 364, 128085. [Google Scholar] [CrossRef]
- Arbib, Z.; Ruiz, J.; Álvarez-Díaz, P.; Garrido-Pérez, C.; Barragan, J.; Perales, J.A. Long Term Outdoor Operation of a Tubular Airlift Pilot Photobioreactor and a High Rate Algal Pond as Tertiary Treatment of Urban Wastewater. Ecol. Eng. 2013, 52, 143–153. [Google Scholar] [CrossRef]
- Ayre, J.M.; Moheimani, N.R.; Borowitzka, M.A. Growth of Microalgae on Undiluted Anaerobic Digestate of Piggery Effluent with High Ammonium Concentrations. Algal Res. 2017, 24, 218–226. [Google Scholar] [CrossRef]
- Díez-Montero, R.; Belohlav, V.; Ortiz, A.; Uggetti, E.; García-Galán, M.J.; García, J. Evaluation of Daily and Seasonal Variations in a Semi-Closed Photobioreactor for Microalgae-Based Bioremediation of Agricultural Runoff at Full-Scale. Algal Res. 2020, 47, 101859. [Google Scholar] [CrossRef]
- Shayesteh, H.; Vadiveloo, A.; Bahri, P.A.; Moheimani, N.R. Long Term Outdoor Microalgal Phycoremediation of Anaerobically Digested Abattoir Effluent. J. Environ. Manag. 2022, 323, 116322. [Google Scholar] [CrossRef]
- Posadas, E.; del Mar Morales, M.; Gomez, C.; Acién, F.G.; Muñoz, R. Influence of pH and CO2 Source on the Performance of Microalgae-Based Secondary Domestic Wastewater Treatment in Outdoors Pilot Raceways. Chem. Eng. J. 2015, 265, 239–248. [Google Scholar] [CrossRef]
- Tan, X.-B.; Yang, L.-B.; Zhang, Y.-L.; Zhao, F.-C.; Chu, H.-Q.; Guo, J. Chlorella pyrenoidosa Cultivation in Outdoors Using the Diluted Anaerobically Digested Activated Sludge. Bioresour. Technol. 2015, 198, 340–350. [Google Scholar] [CrossRef] [PubMed]
- Das, P.; Quadir, M.A.; Thaher, M.I.; Alghasal, G.S.H.S.; Aljabri, H.M.S.J. Microalgal Nutrients Recycling from the Primary Effluent of Municipal Wastewater and Use of the Produced Biomass as Bio-Fertilizer. Int. J. Environ. Sci. Technol. 2019, 16, 3355–3364. [Google Scholar] [CrossRef]
- Baldisserotto, C.; Demaria, S.; Accoto, O.; Marchesini, R.; Zanella, M.; Benetti, L.; Avolio, F.; Maglie, M.; Ferroni, L.; Pancaldi, S. Removal of Nitrogen and Phosphorus from Thickening Effluent of an Urban Wastewater Treatment Plant by an Isolated Green Microalga. Plants 2020, 9, 1802. [Google Scholar] [CrossRef]
- UNI EN 12260:2004; Water Quality—Determination of Nitrogen—Determination of Bound Nitrogen (TNb) After Oxidation to Nitrogen Oxides. European Standard: Rome, Italy, 2004.
- APAT CNR IRSA 4030; Determination of Ammonium—Indophenol Method. APAT-IRSA/CNR: Rome, Italy, 2003.
- APAT CNR IRSA 4020; Determination of Inorganic Anions by Ionic Chromatography. APAT-IRSA/CNR: Rome, Italy, 2003.
- APAT CNR IRSA 4050; Nitrite. APAT-IRSA/CNR: Rome, Italy, 2003.
- UNI EN 17294-2:2016; Water Quality—Application of Inductively Coupled Plasma Mass Spectrometry (ICP-MS). European Standard: Rome, Italy, 2016.
- ISO 15587-2:2002; Water Quality—Digestion for the Determination of Selected Elements in Water. ISO: Geneva, Switzerland, 2002.
- COD: ISO 15705:2002; Water Quality—Determination of the Chemical Oxygen Demand Index (ST-COD)—Small-Scale Sealed-Tube Method. European Standard: Rome, Italy, 2016.
- BOD: 5210; Biochemical Oxygen Demand (BOD); BOD 5-Day Test. Standard Methods for the Examination of Water and Wastewater. Standard Methods Committee (SMC): Wichita Falls, TX, USA, 2017.
- APAT CNR IRSA 2090 B; Total Suspended Solids. APAT-IRSA/CNR: Rome, Italy, 2003.
- APAT CNR IRSA 3150 C; Spectrophotometric Detection Using Diphenylcarbazide. APAT-IRSA/CNR: Rome, Italy, 2003.
- ISO 1187-2:2002; Plastics—Compression Moulding of Test Specimens of Thermoplastic Materials. ISO: Geneva, Switzerland, 2002.
- UNI EN ISO 9308-1:2017; Water Quality—Enumeration of Escherichia coli and Coliform bacteria—Part 1: Membrane Filtration Method for Waters with Low Bacterial Background Flora. European Standard: Rome, Italy, 2017.
- Arpae Emilia-Romagna Dext3r. Available online: https://simc.arpae.it/dext3r/ (accessed on 5 June 2023).
- Baldisserotto, C.; Popovich, C.; Giovanardi, M.; Sabia, A.; Ferroni, L.; Constenla, D.; Leonardi, P.; Pancaldi, S. Photosynthetic Aspects and Lipid Profiles in the Mixotrophic Alga Neochloris oleoabundans as Useful Parameters for Biodiesel Production. Algal Res. 2016, 16, 255–265. [Google Scholar] [CrossRef]
- Kalaji, H.M.; Schansker, G.; Ladle, R.J.; Goltsev, V.; Bosa, K.; Allakhverdiev, S.I.; Brestic, M.; Bussotti, F.; Calatayud, A.; Dąbrowski, P.; et al. Frequently Asked Questions about in Vivo Chlorophyll Fluorescence: Practical Issues. Photosynth. Res. 2014, 122, 121–158. [Google Scholar] [CrossRef] [PubMed]
- Wellburn, A.R. The Spectral Determination of Chlorophylls a and b, as Well as Total Carotenoids, Using Various Solvents with Spectrophotometers of Different Resolution. J. Plant Physiol. 1994, 144, 307–313. [Google Scholar] [CrossRef]
- Maglie, M.; Baldisserotto, C.; Guerrini, A.; Sabia, A.; Ferroni, L.; Pancaldi, S. A Co-Cultivation Process of Nannochloropsis Oculata and Tisochrysis Lutea Induces Morpho-Physiological and Biochemical Variations Potentially Useful for Biotechnological Purposes. J. Appl. Phycol. 2021, 33, 2817–2832. [Google Scholar] [CrossRef]
- Giovanardi, M.; Ferroni, L.; Baldisserotto, C.; Tedeschi, P.; Maietti, A.; Pantaleoni, L.; Pancaldi, S. Morphophysiological Analyses of Neochloris oleoabundans (Chlorophyta) Grown Mixotrophically in a Carbon-Rich Waste Product. Protoplasma 2013, 250, 161–174. [Google Scholar] [CrossRef]
- Rossi, S.; Mantovani, M.; Marazzi, F.; Bellucci, M.; Casagli, F.; Mezzanotte, V.; Ficara, E. Microalgal Cultivation on Digestate: Process Efficiency and Economics. Chem. Eng. J. 2023, 460, 141753. [Google Scholar] [CrossRef]
- Sutherland, D.L.; Heubeck, S.; Park, J.; Turnbull, M.H.; Craggs, R.J. Seasonal Performance of a Full-Scale Wastewater Treatment Enhanced Pond System. Water Res. 2018, 136, 150–159. [Google Scholar] [CrossRef]
- Binnal, P.; Babu, P.N. Optimization of Environmental Factors Affecting Tertiary Treatment of Municipal Wastewater by Chlorella Protothecoides in a Lab Scale Photobioreactor. J. Water Process Eng. 2017, 17, 290–298. [Google Scholar] [CrossRef]
- Manjre, S.; Paul, K.; Patil, S.; Pai, P.; Banerjee, A.; Sarkar, P.; Teredesai, A.; Shukla, M.R.; Dasgupta, S. Evaluating the Effect of Seasonal Conditions on Metabolism and Photosynthetic Performance of Picochlorum sp. and Its Influence on Biomass Productivity. Bioresour. Technol. Rep. 2022, 18, 101029. [Google Scholar] [CrossRef]
- Potijun, S.; Yaisamlee, C.; Sirikhachornkit, A. Pigment Production under Cold Stress in the Green Microalga Chlamydomonas Reinhardtii. Agriculture 2021, 11, 564. [Google Scholar] [CrossRef]
- Melis, A. Photosystem-II Damage and Repair Cycle in Chloroplasts: What Modulates the Rate of Photodamage in Vivo? Trends Plant Sci. 1999, 4, 130–135. [Google Scholar] [CrossRef]
- Guidi, L.; Lo Piccolo, E.; Landi, M. Chlorophyll Fluorescence, Photoinhibition and Abiotic Stress: Does It Make Any Difference the Fact to Be a C3 or C4 Species? Front. Plant Sci. 2019, 10, 174. [Google Scholar] [CrossRef] [PubMed]
- Li, X.; Yang, R.; Li, L.; Liu, K.; Harrison, M.T.; Fahad, S.; Wei, M.; Yin, L.; Zhou, M.; Wang, X. Physiological and Molecular Responses of Wheat to Low Light Intensity. Agronomy 2023, 13, 272. [Google Scholar] [CrossRef]
- Torres, R.; Romero, J.M.; Lagorio, M.G. Effects of Sub-Optimal Illumination in Plants. Comprehensive Chlorophyll Fluorescence Analysis. J. Photochem. Photobiol. B 2021, 218, 112182. [Google Scholar] [CrossRef]
- Kong, F.; Ran, Z.; Zhang, J.; Zhang, M.; Wu, K.; Zhang, R.; Liao, K.; Cao, J.; Zhang, L.; Xu, J.; et al. Synergistic Effects of Temperature and Light Intensity on Growth and Physiological Performance in Chaetoceros calcitrans. Aquac. Rep. 2021, 21, 100805. [Google Scholar] [CrossRef]
- Gong, M.; Bassi, A. Carotenoids from Microalgae: A Review of Recent Developments. Biotechnol. Adv. 2016, 34, 1396–1412. [Google Scholar] [CrossRef]
- Aizpuru, A.; González-Sánchez, A. Traditional and New Trend Strategies to Enhance Pigment Contents in Microalgae. World J. Microbiol. Biotechnol. 2024, 40, 272. [Google Scholar] [CrossRef]
- Minhas, A.K.; Gaur, S.; Adholeya, A. Influence of Light Intensity and Photoperiod on the Pigment and, Lipid Production of Dunaliella tertiolecta and Nannochloropsis oculata under Three Different Culture Medium. Heliyon 2023, 9, e12801. [Google Scholar] [CrossRef]
- Li, S.; Xing, D.; Sun, C.; Jin, C.; Zhao, Y.; Gao, M.; Guo, L. Effect of Light Intensity and Photoperiod on High-Value Production and Nutrient Removal Performance with Bacterial-Algal Coupling System. J. Environ. Manag. 2024, 356, 120595. [Google Scholar] [CrossRef]
- Wang, Y.; He, B.; Sun, Z.; Chen, Y.-F. Chemically Enhanced Lipid Production from Microalgae under Low Sub-Optimal Temperature. Algal Res. 2016, 16, 20–27. [Google Scholar] [CrossRef]
- Sánchez-Saavedra, M.P.; Castro-Ochoa, F.Y. Bioprospecting for Lipid Production of Eleven Microalgae Strains for Sustainable Biofuel Production. BioEnergy Res. 2024, 17, 1118–1132. [Google Scholar] [CrossRef]
- Molnar, P. Differences between Soil and Air Temperatures: Implications for Geological Reconstructions of Past Climate. Geosphere 2022, 18, 800–824. [Google Scholar] [CrossRef]
- Lai, Y.; Dzombak, D.A. Assessing the Effect of Changing Ambient Air Temperature on Water Temperature and Quality in Drinking Water Distribution Systems. Water 2021, 13, 1916. [Google Scholar] [CrossRef]
- Graf, R. A Multifaceted Analysis of the Relationship between Daily Temperature of River Water and Air. Acta Geophys. 2019, 67, 905–920. [Google Scholar] [CrossRef]
- Arcila, J.S.; Buitrón, G. Influence of Solar Irradiance Levels on the Formation of Microalgae-Bacteria Aggregates for Municipal Wastewater Treatment. Algal Res. 2017, 27, 190–197. [Google Scholar] [CrossRef]
- Babiak, W.; Krzemińska, I. Extracellular Polymeric Substances (EPS) as Microalgal Bioproducts: A Review of Factors Affecting EPS Synthesis and Application in Flocculation Processes. Energies 2021, 14, 4007. [Google Scholar] [CrossRef]
- Fallahi, A.; Rezvani, F.; Asgharnejad, H.; Khorshidi Nazloo, E.; Hajinajaf, N.; Higgins, B. Interactions of Microalgae-Bacteria Consortia for Nutrient Removal from Wastewater: A Review. Chemosphere 2021, 272, 129878. [Google Scholar] [CrossRef]
- Vu, C.H.T.; Chun, S.-J.; Seo, S.-H.; Cui, Y.; Ahn, C.-Y.; Oh, H.-M. Bacterial Community Enhances Flocculation Efficiency of Ettlia sp. by Altering Extracellular Polymeric Substances Profile. Bioresour. Technol. 2019, 281, 56–65. [Google Scholar] [CrossRef]
- Lee, J.; Cho, D.-H.; Ramanan, R.; Kim, B.-H.; Oh, H.-M.; Kim, H.-S. Microalgae-Associated Bacteria Play a Key Role in the Flocculation of Chlorella Vulgaris. Bioresour. Technol. 2013, 131, 195–201. [Google Scholar] [CrossRef] [PubMed]
- Moreira, J.B.; Kuntzler, S.G.; Bezerra, P.Q.M.; Cassuriaga, A.P.A.; Zaparoli, M.; da Silva, J.L.V.; Costa, J.A.V.; de Morais, M.G. Recent Advances of Microalgae Exopolysaccharides for Application as Bioflocculants. Polysaccharides 2022, 3, 264–276. [Google Scholar] [CrossRef]
- Zhu, C.; Ji, Y.; Du, X.; Kong, F.; Chi, Z.; Zhao, Y. A Smart and Precise Mixing Strategy for Efficient and Cost-Effective Microalgae Production in Open Ponds. Sci. Total Environ. 2022, 852, 158515. [Google Scholar] [CrossRef] [PubMed]
- Ruas, G.; Serejo, M.L.; Farias, S.L.; Scarcelli, P.; Boncz, M.Á. Removal of Pathogens from Domestic Wastewater by Microalgal-Bacterial Systems under Different Cultivation Conditions. Int. J. Environ. Sci. Technol. 2022, 19, 10177–10188. [Google Scholar] [CrossRef]
- Xiong, R.; Yan, J.; Mei, J.; Ye, J.; Xie, J. The Enhanced Expression of Genes Encoding Diguanylate Cyclases under Cold Stress Contributes to the Adhesion and Biofilm Formation of Shewanella putrefsaciens WS13. Front. Nutr. 2022, 9, 1076932. [Google Scholar] [CrossRef]
- Guo, Y.; Wang, Y.; Zhang, Z.; Huang, F.; Chen, S. Physiological and Transcriptomic Insights into the Cold Adaptation Mechanism of a Novel Heterotrophic Nitrifying and Aerobic Denitrifying-like Bacterium Pseudomonas indoloxydans YY-1. Int. Biodeterior. Biodegrad. 2018, 134, 16–24. [Google Scholar] [CrossRef]
- Ahn, C.-Y.; Chung, A.-S.; Oh, H.-M. Diel Rhythm of Algal Phosphate Uptake Rates in P-Limited Cyclostats and Simulation of Its Effect on Growth and Competition1. J. Phycol. 2002, 38, 695–704. [Google Scholar] [CrossRef]
- Bossa, R.; Di Colandrea, M.; Salbitani, G.; Carfagna, S. Phosphorous Utilization in Microalgae: Physiological Aspects and Applied Implications. Plants 2024, 13, 2127. [Google Scholar] [CrossRef]
- Yaakob, M.A.; Mohamed, R.M.S.R.; Al-Gheethi, A.; Aswathnarayana Gokare, R.; Ambati, R.R. Influence of Nitrogen and Phosphorus on Microalgal Growth, Biomass, Lipid, and Fatty Acid Production: An Overview. Cells 2021, 10, 393. [Google Scholar] [CrossRef]
- Saia, S.M.; Carrick, H.J.; Buda, A.R.; Regan, J.M.; Walter, M.T. Critical Review of Polyphosphate and Polyphosphate Accumulating Organisms for Agricultural Water Quality Management. Environ. Sci. Technol. 2021, 55, 2722–2742. [Google Scholar] [CrossRef] [PubMed]
- Direttiva Concernente Indirizzi per l’applicazione Del DLgs 11 Maggio 1999 n 152, Come Modificato Dal DLgs 18 Sgosto 2000 n 258 in Materia Di Tutela Delle Acque Dall’inquinamento. (Pubblicazione—Bollettino Ufficiale Regione Emilia Romagna—Parte Seconda n. 88 Del 24 Giugno 2003). 2003. Available online: https://bur.regione.emilia-romagna.it/archivio/inserzione?anno=2003&num_boll=88&prog_documento=1 (accessed on 12 March 2025).
- Akizuki, S.; Cuevas-Rodríguez, G.; Toda, T. Microalgal-Nitrifying Bacterial Consortium for Energy-Saving Ammonia Removal from Anaerobic Digestate of Slaughterhouse Wastewater. J. Water Process Eng. 2019, 31, 100753. [Google Scholar] [CrossRef]
- Lorick, D.; Macura, B.; Ahlström, M.; Grimvall, A.; Harder, R. Effectiveness of Struvite Precipitation and Ammonia Stripping for Recovery of Phosphorus and Nitrogen from Anaerobic Digestate: A Systematic Review. Environ. Evid. 2020, 9, 27. [Google Scholar] [CrossRef]
- Kinidi, L.; Tan, I.A.W.; Abdul Wahab, N.B.; Tamrin, K.F.B.; Hipolito, C.N.; Salleh, S.F. Recent Development in Ammonia Stripping Process for Industrial Wastewater Treatment. Int. J. Chem. Eng. 2018, 2018, 3181087. [Google Scholar] [CrossRef]
- Oviedo, J.A.; Muñoz, R.; Donoso-Bravo, A.; Bernard, O.; Casagli, F.; Jeison, D. A Half-Century of Research on Microalgae-Bacteria for Wastewater Treatment. Algal Res. 2022, 67, 102828. [Google Scholar] [CrossRef]
- Oh, J.; Silverstein, J. Oxygen Inhibition of Activated Sludge Denitrification. Water Res. 1999, 33, 1925–1937. [Google Scholar] [CrossRef]
- Manser, N.D.; Wang, M.; Ergas, S.J.; Mihelcic, J.R.; Mulder, A.; van de Vossenberg, J.; van Lier, J.B.; van der Steen, P. Biological Nitrogen Removal in a Photosequencing Batch Reactor with an Algal-Nitrifying Bacterial Consortium and Anammox Granules. Environ. Sci. Technol. Lett. 2016, 3, 175–179. [Google Scholar] [CrossRef]


| Algal Species | Cultivation System | Time Period and Location | Ref. |
|---|---|---|---|
| Scenedesmus obliquus | High-rate algal pond and an Airlift tubular photobioreactor both operated in continuous. | From October 2011 to March 2012 in South Spain. | [60] |
| Chlorella sp., Scenedesmus sp. and a pennate diatom | Open raceway pond operated in continuous. | From June 2013 to September 2013 in Perth, Australia. | [61] |
| Co-culture of Chlorella sp., Stigeoclonium sp., Nitzschia sp. and Navicula sp. | Tubular horizontal semi-closed photobioreactor connected to two open tanks. Operated in semi-continuous. | From May 2017 to May 2018 in Barcelona, Spain. | [62] |
| Scenedesmus sp. and Chlorella sp. | Raceway pond operated in semi-continuous cultivation. | From December 2019 to December 2020 in East Australia. | [63] |
| Scenedesmus sp. | Raceway ponds operated in semi-continuous. | Monitored for a whole year. Almería, Spain. | [64] |
| Consortium dominated by Monoraphidium sp. | Four tanks connected in parallel and operated in continuous. | Monitored for a whole year. Greenhouse in Sweden. | [56] |
| Chlorella pyrenoidosa | Rectangular photobioreactor operated in batch. | Winter in Shandong Province, China. | [65] |
| Chlorella sp. and Scenedesmus sp. | Raceway pond operated in batch. | Winter in Qatar. | [66] |
| Parameter | Unit | Method | Value |
|---|---|---|---|
| Total nitrogen | mg N L−1 | UNI EN 12260: 2004 [68] | 25.2 |
| Ammonium | NH4+-N L−1 | APAT CNR IRSA 4030 A1 Man 29 2003 [69] | 24.4 |
| Nitrate | NO3−-N L−1 | APAT CNR IRSA 4020 Man 29 2003 [70] | 1.4 |
| Nitrite | NO2−-N L−1 | APAT CNR IRSA 4050 Man 29 2003 [71] | 0.16 |
| Total phosphorus | mg L−1 P | UNI EN ISO 15587-2: 2002 ISO 17294-2: 2016 [72,73] | 22.1 |
| COD | O2 mg L−1 | ISO 15705 par 10.2: 2002 [74] | 80 |
| BOD5 | O2 mg L−1 | APHA Standard Methods for the Examination of Water and Wastewater 23rd 2017 5210 [75] | 19 |
| Total suspended solids | mg L−1 | APAT CNR IRSA 2090 B Man 29 2003 132 114 [76] | 48 |
| Al | mg L−1 | ISO 15587-2: 2002 + UNI EN ISO 17294-2: 2016 [72,73] | 1.33 |
| Cr | mg L−1 | ISO 15587-2: 2002 + UNI EN ISO 17294-2: 2016 | <0.02 * |
| Cr (VI) | mg L−1 | APAT CNR IRSA 3150 C Man 29 2003 [77] | <0.02 * |
| Cu | mg L−1 | ISO 1187-2_2002 + UNI EN ISO 17294-2: 2016 [73,78] | 0.021 |
| Hg | mg L−1 | ISO 1187-2_2002 + UNI EN ISO 17294-2: 2016 | <0.001 * |
| Pb | mg L−1 | ISO 1187-2_2002 + UNI EN ISO 17294-2: 2016 | <0.005 * |
| Ni | mg L−1 | ISO 1187-2_2002 + UNI EN ISO 17294-2: 2016 | <0.01 * |
| Zn | mg L−1 | ISO 15587-2: 2002 + UNI EN ISO 17294-2: 2016 | 0.06 |
| Escherichia coli | CFU/100 mL | UNI EN ISO 9308-1:2017 [79] | 61,100 |
| Parameter | Unit | Day 0 | Day 20 |
|---|---|---|---|
| COD | O2 mg L−1 | 64 | 38 |
| BOD5 | O2 mg L−1 | 15 | <10 |
| Total suspended solids | mg L−1 | 38 | 8 |
| Escherichia coli | CFU/100 mL | 48,880 | <2 |
| Parameter | Unit | Day 0 | Day 3 | Day 20 |
|---|---|---|---|---|
| COD | O2 mg L−1 | 61 | 62 | 59 |
| BOD5 | O2 mg L−1 | 13 | <10 | <10 |
| Total suspended solids | mg L−1 | 32 | 26 | 27 |
| Escherichia coli | CFU/100 mL | 36,000 | 2600 | 72 |
Disclaimer/Publisher’s Note: The statements, opinions and data contained in all publications are solely those of the individual author(s) and contributor(s) and not of MDPI and/or the editor(s). MDPI and/or the editor(s) disclaim responsibility for any injury to people or property resulting from any ideas, methods, instructions or products referred to in the content. |
© 2025 by the authors. Licensee MDPI, Basel, Switzerland. This article is an open access article distributed under the terms and conditions of the Creative Commons Attribution (CC BY) license (https://creativecommons.org/licenses/by/4.0/).
Share and Cite
Giacò, P.; Baldisserotto, C.; Demaria, S.; Benà, E.; Ferroni, L.; Zanotti, G.; Pancaldi, S. Urban Wastewater Phytoremediation by Autochthonous Microalgae in Winter Season: Indoor and Outdoor Trials. Appl. Sci. 2025, 15, 4235. https://doi.org/10.3390/app15084235
Giacò P, Baldisserotto C, Demaria S, Benà E, Ferroni L, Zanotti G, Pancaldi S. Urban Wastewater Phytoremediation by Autochthonous Microalgae in Winter Season: Indoor and Outdoor Trials. Applied Sciences. 2025; 15(8):4235. https://doi.org/10.3390/app15084235
Chicago/Turabian StyleGiacò, Pierluigi, Costanza Baldisserotto, Sara Demaria, Elisa Benà, Lorenzo Ferroni, Giulia Zanotti, and Simonetta Pancaldi. 2025. "Urban Wastewater Phytoremediation by Autochthonous Microalgae in Winter Season: Indoor and Outdoor Trials" Applied Sciences 15, no. 8: 4235. https://doi.org/10.3390/app15084235
APA StyleGiacò, P., Baldisserotto, C., Demaria, S., Benà, E., Ferroni, L., Zanotti, G., & Pancaldi, S. (2025). Urban Wastewater Phytoremediation by Autochthonous Microalgae in Winter Season: Indoor and Outdoor Trials. Applied Sciences, 15(8), 4235. https://doi.org/10.3390/app15084235