Abstract
In order to explore the potential catalysts for kerogen pyrolysis and to clear away obstacles to product liberation in product recovery, the facilitation effects of acidic chlorinated salts (MnCl2·4H2O, AlCl3·6H2O, CrCl3·6H2O, and MoCl5) on pyrolysis behavior of Huadian oil shale (OS) were investigated. Two different ways of wet mixing and dry mixing were used, and indoor pyrolysis experiments were carried out to characterize the different products collected by multiple analyses. The acidic chloride solution could effectively remove large amounts of calcite from OS during wet mixing, whereas the calcite in the dry-mixed samples decomposed significantly during pyrolysis, releasing significant amounts of CO2. AlCl3 could improve the pore space by removing carbonates, which can promote the pyrolysis of kerogen and increase oil yield. The improved pore space can also promote the conversion of kerogen and the release of hydrocarbon products, while the large amounts of CO2 released during pyrolysis of dry-mixed samples can promote the migration of heavy fractions. This study emphasizes the great potential of acid chlorates in counteracting reservoir blockage and facilitating pyrolysis for OS in situ exploitation.
1. Introduction
Oil shale (OS) is an unconventional fossil energy source rich in kerogen, which has attracted more and more attention due to its huge reserves and wide distribution in the context of the energy crisis [1,2,3]. Kerogen is a mixture of macro-molecular organic matter with no fixed chemical composition, which is dispersed as solid particles in tiny pores in inorganic mineral skeletons [4,5]. This matter is insoluble in non-oxidizing acids, alkali solvents, and organic solvents at low temperatures but can be converted into liquid shale oil and gaseous combustible gas when heated to 300–500 °C [6,7]. As a result, OS resources are currently extracted mainly by heating to pyrolyze the internal kerogen to produce hydrocarbon escapes [8,9,10].
The pyrolysis mechanism of kerogen to oil and gas has been widely studied for more than half a century. In the late 1940s, Hubbard and Robinson studied the conversion of kerogen and established a mechanism of reaction: kerogen > asphaltene > oil + gas + coke [11]. Several subsequent studies have reported similar mechanisms based on the pyrolysis of kerogen in OS and coal [12,13]. Pyrolytic asphaltene is a fluid and soluble intermediate produced during the pyrolysis of kerogen, which is formed by the loss of tiny fragments of kerogen and the retention of basic three-dimensional structures [14,15]. Typically, asphaltenes have large molecular weights and high viscosities, which tend to form precipitates and reduce the fluidity of crude oil. Thus, the large amount of precipitated asphaltene products and its thickening effect on the pyrolysis oil during the in situ conversion can seriously affect the permeability of the reservoir and cause reservoir blockage [16].
Similar phenomena have been reported multiple times in studies of laboratory experiments and field tests, which have become one of the important challenges for OS extraction. For example, Martins et al. conducted core-scale experiments and found that blockage of fluid channels by heavy oil significantly affected core permeability and oil recovery [17,18]. Guo et al. performed high-temperature and high-pressure simulation experiments of OS and found that during the migration of pyrolysis products, the heavy components continuously condensed and blocked at the back location of the sample due to the low temperature (~200 °C). These phenomena resulted in a decrease in core permeability, leading to a significant increase in injection pressure and severely limiting pyrolysis oil production [19]. In addition, similar phenomena were observed in the pilot field tests of OS extraction conducted in the Songliao Basin, China, which seriously affected the in situ conversion process and the recovery of pyrolysis products [20].
In recent years, researchers have committed to using acid catalysts to promote the pyrolysis of kerogen and upgrade oil products, which may offer a potential solution for reservoir blockage during in situ conversion of OS. Previous studies have found that the acid catalytic metal chloride (SnCl2, MoCl5, ZnCl2) can promote the organic conversion to oil and gas at 350 °C and affects the activation energy of the solid residues [21]. The coupling effects between montmorillonite and CoCl2·6H2O promoted the formation of shale oil, leading to a prominent reduction in the kerogen decomposition temperature and a decrease in the apparent activation energy [22]. Furthermore, phosphotungstic acid/boehmite (PWA/B) is used to catalyze OS pyrolysis, where the quality of catalyzed pyrolyzates could be upgraded distinctly [23]. Meanwhile, the addition of FeCl3 increased the yield of subcritical water-extracted shale oil by 58.5% within 20 h and reduced the time required for maximum shale oil yield by 43%. The acidic FeCl3 solution induced the decomposition of carbonate minerals in the OS matrix, providing additional mass transfer channels for the migration of bitumen products [24]. In addition, researchers prepared a catalyst named SO3H-SBA-15 by sulfonic acid grafting of existing mineral-based catalysts, which could reduce the activation energy of OS catalytic pyrolysis and promote the conversion of OS, and there was a significant effect of the amount of catalyst acid on the amount of oil produced [25].
In addition to externally added catalysts, different associated minerals in the OS matrix also play various roles in the pyrolysis of kerogen. The reported research shows that montmorillonite and gypsum promote the formation of oil products and minimize the formation of residue products, and pyrite can promote the pyrolysis and cracking of organic matter [26,27]. However, some reported results show that carbonates have different effects on the pyrolysis of kerogen. Hu et al. found that calcite appears to inhibit the formation of oil during retorting [26]. However, Yang et al. and Guo et al. proved that silicates inhibited, while carbonates catalyzed, the formation of shale oil during the retorting and oxidizing pyrolysis of OS [28,29,30]. These results indicate the complexity of the effects of inorganic minerals on the pyrolysis of OS. It is worth noting that the addition of some acid catalysts not only has a potential catalytic effect for kerogen pyrolysis but can also transform the composition of the minerals in the OS [21,24]. This transformation and removal of mineral matter could also have a potentially important positive impact on reducing reservoir blockage during OS in situ conversion, which has been less well researched.
Therefore, in order to explore the potential catalysts for OS pyrolysis and reduce the reservoir blockage, the facilitation effects of acidic chlorinated salts (MnCl2·4H2O, AlCl3·6H2O, CrCl3·6H2O, and MoCl5) on the pyrolysis behavior of Huadian OS were investigated. Due to the favorable performance in thermogravimetry (TG) experiments and its low price, AlCl3·6H2O was selected to be mixed with OS in two different ways and subjected to indoor pyrolysis experiments. The oil, gas, and residue products were collected and characterized by multiple analyses, thus the effects of AlCl3·6H2O in OS pyrolysis was investigated. The results of this study indicate that AlCl3·6H2O can effectively promote the cracking of kerogen and reduce reservoir blockage, showing significant potential for application in the in situ conversion of OS.
2. Materials and Methods
2.1. Materials
The OS sample used in this study was obtained from Huadian, Jilin province, China. Table 1 shows the results of proximate, ultimate, and Fischer assay analyses of the raw OS. The raw OS was crushed and screened to 0.125–0.178 mm-sized particles and subsequently dried in the oven at 80 °C for 10 h before using. The acid chloride catalysts used in these experiments, including MnCl2·4H2O, AlCl3·6H2O, CrCl3·6H2O, and MoCl5, were purchased from Aladdin with a purity of 99.0%.

Table 1.
The proximate, ultimate, and Fischer assay analyses results of the raw Huadian OS.
2.2. Experiments
Before the start of the experiment, two mixing methods were used to mix the catalyst with OS, including mechanical dry mixing and wet mixing. The dry-mixed sample was obtained by mixing 2 g of chloride with 20 g of OS powder and then shaking for 10 min in an oscillator, which was recorded as DMOS + C (DMOS + AlCl3·6H2O, DMOS + MnCl2·4H2O, DMOS + CrCl3·6H2O, and DMOS + MoCl5). The wet-mixed sample was obtained by the following steps: First, 40 mL of deionized water was mixed with 2 g of catalyst powder to completely dissolve it. Then, 20 g of OS powder was added to the solution and heated and stirred for 30 min to fully mix. Finally, a wet-mixed sample, denoted as WMOS + C (WMOS + AlCl3·6H2O, WMOS + MnCl2·4H2O, WMOS + CrCl3·6H2O, and WMOS + MoCl5), was obtained by drying the mixed solution at 80 °C for 10 h and then grinding it into powder below 80 mesh.
The experimental apparatus used is shown in Figure 1, and the experimental steps are as follows. First, the raw OS (20 g), DMOS + C, or WMOS + C were placed inside a quartz retort (inner diameter of 50 mm and height of 140 mm), respectively. Next, the samples were heated from ambient temperature (30 °C) to the target temperature (400/520 °C) with a heating rate of 10 °C/min by an external heater in an N2 atmosphere and then held for 2 h. The nitrogen flow rate was maintained at 100 mL/min by a flow control device, which could effectively carry the oil and gas products out and avoid the temperature fluctuation caused by heat absorption.
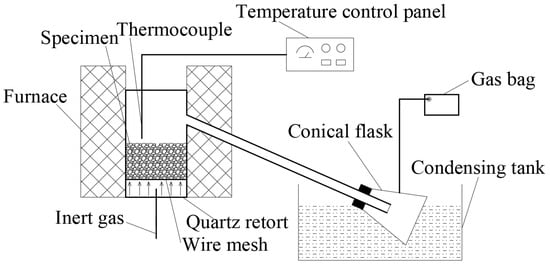
Figure 1.
Schematic diagram of the experimental apparatus.
During the experiment, an ethylene glycol aqueous solution was used to condense the liquid products in a condensation tank at a temperature of −10 °C. Additionally, the shale gas samples were taken at 0, 0.5, and 1 h after reaching the target temperature, respectively. After the experiment, the liquid products and OS residues were successively collected when the apparatus had naturally cooled down to ambient temperature. The obtained oil–water mixture was weighed and subsequently separated by a toluene–water azeotrope for assessment of their yields. For stability and repeatability, each experiment was repeated at least 3 times under the same conditions. Then, the results with a difference of less than 5% among the three groups were chosen, and the average value obtained was the final yield.
The yield of shale oil is calculated as follows:
where η is the yield of shale oil; m is the final mass of shale oil, g; m0 is the initial mass of OS, m0 = 20 g.
It should be noted that MnCl2, CrCl3, AlCl3, and MoCl5 have boiling points of about 1190 °C, 1300 °C, 180 °C, and 270 °C, respectively. So, the pyrolysis temperature will exceed the boiling point of some catalysts during the heating process. However, the solutions of the above catalyst are acidic when mixed by wet mixing. Carbonate minerals such as calcite in OS react in acidic solutions, and the reaction products are further transformed during the subsequent heating process, as experienced in the following Equations (2)–(9). As a result, part of these acidic chloride salt catalysts exist mainly in other forms during the reaction without becoming gaseous and escaping. On the other hand, reactions cannot occur during the dry mixing process. However, during the heating process, the shedding of crystalline water within the catalyst and the generation of water products within the OS can cause an acidic solution environment to form within the matrix, leading to similar reactions. Therefore, the catalysts in the mixed samples obtained from both mixing methods cause a partial removal of carbonates within the OS during the experiment. Moreover, the catalyst itself undergoes transformation into other substances. These can be demonstrated by the subsequent results in Figures 2–4 and Table 2.
2.3. Analytical Methods
2.3.1. OS and Various Mixed Samples
Thermogravimetry (TG) analysis was performed using an STA 449 F3 thermal analyzer (Netzsch, Selb, Germany). Nitrogen was used as the protective gas and carrier gas at flow rates of 20 mL/min and 80 mL/min, respectively. In all tests, 20 mg (±0.5 mg) of the sample was heated from 30 to 900 °C at 10 °C/min. Duplicate experiments were performed to ensure reproducibility with a mass loss and temperature error less than ±0.5 wt% and ±1 °C, respectively. X-ray diffraction (XRD) patterns were determined with a D2 PHASER diffractometer (Bruker, Karlsruhe, Germany) and Cu Kα radiation at 0.02 °/s step length.
2.3.2. Shale Oil
Shale oil was characterized by multiple analytical methods. Ultimate analysis was carried out with a vario MICRO cube elemental analyzer (Elementer, Langenselbold, Germany). The combustion furnace’s temperature was 960 °C, and the pressure of high-purity oxygen was 0.20 MPa. Gas chromatography–mass spectrometry (GC-MS) analysis was performed by an Agilent 7890B-5975C instrument to determine the composition of shale oil. Utilizing the Agilent MSD Chem Station (version F. 01. 01) software workstation, data were acquired and analyzed. The inlet was set to split mode, and the temperature was maintained at 300 °C. The carrier gas was helium, with a flow rate of 2 mL/min and a division ratio of 50:1. The oven was preheated to 60 °C for 3 min and then heated at a rate of 5 °C/min until a final temperature of 280 °C was reached and maintained for 15 min. The oven was equipped with an HP-5MS column (0.32 mm inner radius; 0.25 μm film thickness). The MS detector employed an electron ionization detector with settings of 70 eV and 230 °C. The simulated distillation experiment of shale oil was conducted in accordance with GBT 18611-2001 using an Agilent 7890A gas chromatograph, which had an auto-sampler and an automatic injector. According to SY/T 5119-2016, the quantitative separation of shale oil group components (SARA analysis) was implemented by using an MK-6s rod thin-layer flame ionization analyzer (IATROSCAN, Tokyo, Japan).
Prior to the GC-MS and simulated distillation experiments, 0.04 g of shale oil was dissolved in 2 g of CS2 and stirred to dissolve it completely. Moreover, the ultimate, GC-MS, simulated distillation and SARA analyses were performed several times after the shale oil obtained under the same conditions was fully mixed to ensure stability and reproducibility. The average of two groups’ SARA, simulated distillation, and ultimate analysis results (error less than 5%) served as the basis for analysis and discussion.
2.3.3. Shale Gas
The gas compositions, including the hydrocarbon gases (CH4, C2H6, C2H4, and so on) and the inorganic gases (CO2 and N2), were analyzed by Agilent 7890B gas chromatography (GC) equipped with a flame ionization detector (FID) and two thermal conductivity detectors (TCD). The relative content of each gas product was quantified with an external standard method.
3. Results and Discussion
3.1. Effects on the Pyrolysis Behavior of OS
3.1.1. XRD Analysis
The mineral compositions of different samples before and after mixing and pyrolysis were studied through X-ray diffraction (XRD) analysis. Figure 2 shows the XRD analysis results of various samples, including OS, different mixed samples, and residues at different temperatures. In general, quartz and calcite are the main minerals of OS, with 26.8° for quartz and 29.7° for calcite in the X-ray diffraction spectra [7]. According to Figure 2a, calcite decreased significantly when the OS samples were wet mixed with acidic chloride salts, while calcite did not change much when dry mixed. These suggest that the acidic chloride solution removes most of the calcite from the OS matrix. In addition, during the wet mixing process, a large amount of carbon dioxide clearly bubbled out of the solution, confirming the large-scale decomposition of calcite described above. However, some calcite remains in the wet-mixed sample according to Figure 2a. This may be due to the fact that calcite is uniformly dispersed in the matrix of OS and intermixed with kerogen and other minerals; hence, it is not easily and completely consumed by the acidic chloride salt solution.
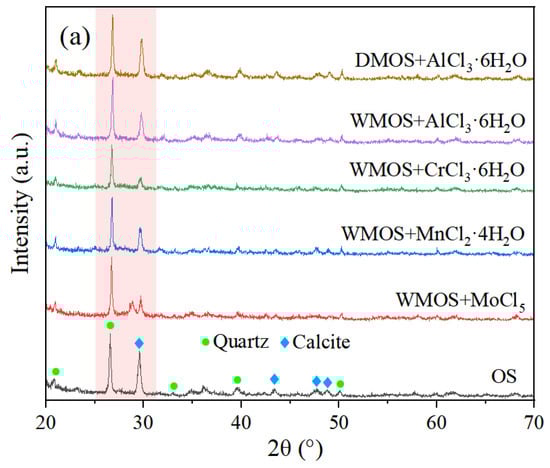
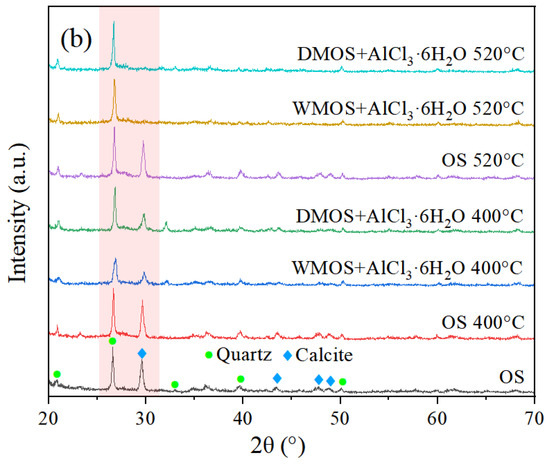
Figure 2.
X-ray diffraction spectra of (a) OS, various mixed samples, and (b) residues.
The various residues of different samples after pyrolysis at different temperatures were also analyzed by XRD analysis, as shown in Figure 2b. The results indicated that the calcite in OS remained almost unchanged before and after pyrolysis. However, after pyrolysis at 400 °C, the calcite content in the mixed samples decreased significantly, especially in DMOS + AlCl3·6H2O. Moreover, the calcite in DMOS + AlCl3·6H2O and WMOS + AlCl3·6H2O completely disappeared after pyrolysis at 520 °C. These results indicate that AlCl3·6H2O can effectively react with calcite in the OS matrix during pyrolysis, and the degree of reaction increases with increasing temperature. This may be due to the continuous decomposition of kerogen and release of hydrocarbon products during pyrolysis, where calcite embedded in the kerogen and matrix is continuously exposed and can be more completely consumed.
3.1.2. TG/DTG Analysis
Generally, the TG curve of OS can be divided into three stages. Stage I (<250 °C) consists of the evaporation of water, including the interlayer water of clay minerals. Stage II (250–600 °C) is mainly the pyrolysis of kerogen, while stage III (>600 °C) involves the decomposition of clay minerals including carbonate minerals [7,8]. Figure 3 shows the TG/DTG curves and weight losses at different stages of OS and various mixed samples. As shown in Figure 3, the weight losses in stage I of the mixed sample are increased compared to OS. The catalyst in wet-mixed samples may crystallize during the drying process, releasing a large amount of crystallization water during heating, which mainly leads to an increase in weight loss. Afterwards, the weight losses in stage II of the mixed samples corresponding to MnCl2·4H2O, AlCl3·6H2O, and CrCl3·6H2O also show significant increases compared to OS. According to Figure 2 and Equations (2)–(9), this may be due to the continuous decomposition of calcite in acidic environments and thermal decomposition of the generated substances, mainly MnCO3, Al(OH)3, and Cr2(CO3)2, etc. Finally, Figure 3a shows that the peak in stage III on the DTG curve almost disappeared, and Figure 3b indicates significant reductions in weight loss of the mixed samples compared to OS. This proves that most of the carbonates in the OS have been removed during wet mixing or previous heating processes.
Figure 3.
(a) TG/DTG curves and (b) weight losses at different stages of OS and various mixed samples.
3.2. Effects on the Pore Evolution of Residues
3.2.1. Pore Structure
The nitrogen adsorption–desorption method is widely used to study the pore shape and structure of fossil fuels [31]. Figure 4 shows the nitrogen adsorption–desorption isotherms of different samples. The adsorption branch of all sample curves gradually increases with relative pressure below 0.8 and sharply increases when P/P0 > 0.8. Even when the relative pressure is close to 1, the adsorption branch does not show a plateau, indicating that the sample has a heterogeneous pore structure, including a wide range of pore sizes from micropores to macropores. According to the International Union of Pure and Applied Chemistry (IUPAC) classification, they all belong to type IV isotherms, indicating the presence of numerous mesopores within the sample [31]. In addition, all hysteresis loops of different curves in Figure 4 are similar to the H3 hysteresis loop based on IUPAC classification, indicating that all studied samples mainly contain irregular slit-shaped pores [31].
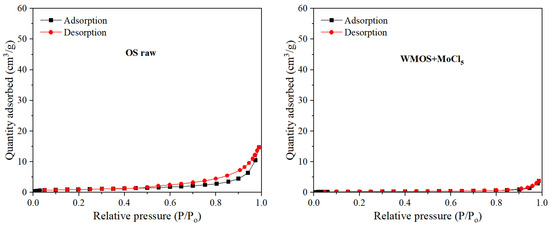
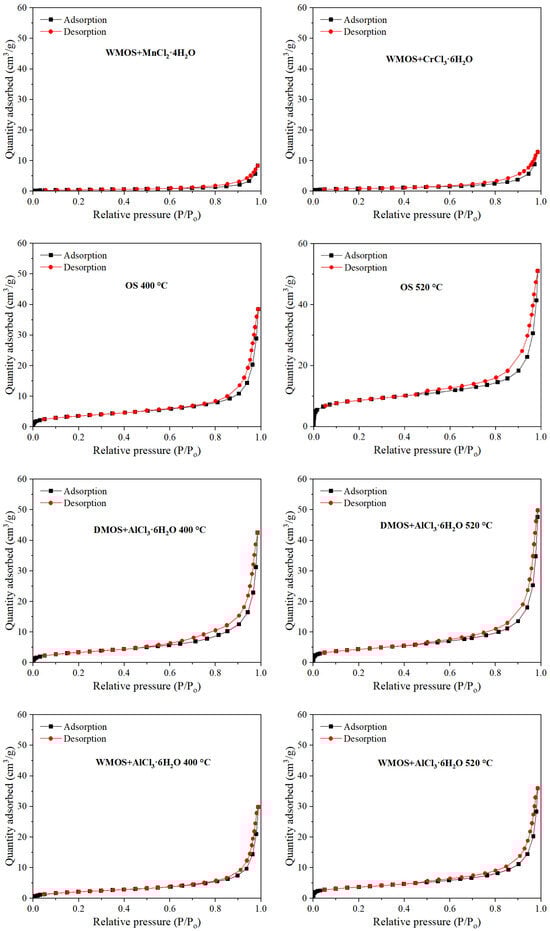
Figure 4.
Adsorption–desorption isotherms of different samples (P: pressure; P0: saturated vapor pressure).
3.2.2. Specific Surface Area and Pore Volume
Figure 5 illustrates the specific surface area (SSA) and pore volume (PV) of different samples. Based on this, the corresponding single-point average pore radii of different samples were obtained, as shown in Figure 6. The results indicate that when the oil shale is wet mixed with chlorate, the SSA and PV of the mixed samples undergo a significant decrease, while their average pore radii show an increasing trend. This phenomenon was more obvious when the chlorates were MnCl2·4H2O and MoCl5. These suggest that acidic chlorate can improve the pore space and increase the pore volume inside the matrix by removing carbonate during wet mixing. In addition, the SSA of the mixed samples all decreased after pyrolysis occurred, especially after higher temperature (520 °C) treatments. The changes in PV show a more complex pattern, which may be influenced by the combined effect of kerogen cracking and the reaction of chlorate with minerals in the matrix. Finally, the average pore radii of the pyrolyzed residues via the mixed samples all show an increasing trend compared to the OS residues, showing a significant improvement effect of AlCl3·6H2O on the pore space.
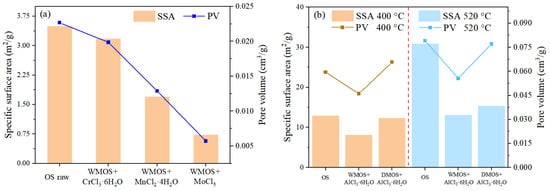
Figure 5.
Total BET (Brunauer–Emmett–Teller) specific surface area (SSA) and pore volume (PV) of (a) OS, various mixed samples, and (b) residues.
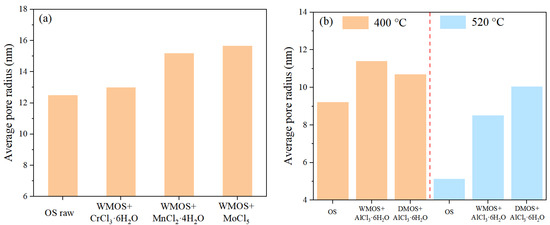
Figure 6.
Single-point average pore radius based on BET model for (a) OS, various mixed samples, and (b) residues.
3.3. Effect on Product Yield and Composition
3.3.1. Effect on Shale Gas Composition
The compositional distribution of the gas products collected after different times at constant temperature in various experiments is shown in Table 2. The results show that AlCl3·6H2O effectively promoted the production of hydrocarbon gas products at 400 °C. While at 520 °C, the addition of AlCl3·6H2O led to an increase in oil products (Figure 7) and an increase in CO2, which resulted in a decrease in the percentage of cracked gas generated at high temperatures. Both at low and high temperatures, the samples obtained by both mixing methods released significant amounts of carbon dioxide during pyrolysis. This suggests that AlCl3·6H2O reacts to a large extent with carbonate minerals during pyrolysis to produce large amounts of CO2. In addition, the DMOS + AlCl3·6H2O sample clearly released more CO2 during pyrolysis, which was caused by its internal carbonate not being consumed during dry mixing. This is consistent with the XRD analysis results.
Table 2.
The contents of the primary components in the gas products at different times in various pyrolysis experiments by gas chromatograms.
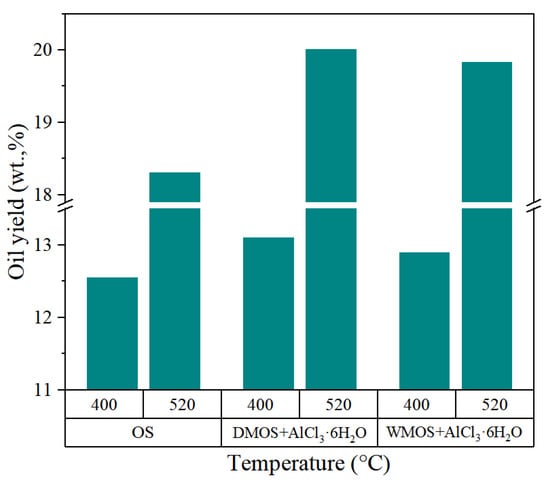
Figure 7.
Shale oil yields at different temperatures in various pyrolysis experiments.
3.3.2. Effect on Shale Oil Yield
Figure 7 displays the oil yields of various samples at different temperatures. The results show that the addition of AlCl3·6H2O to the OS by both mixing methods can increase the production of shale oil, particularly at higher temperatures. Based on the above analysis, this could be attributed to the addition of AlCl3·6H2O for carbonate removal, improvement of pore space, and catalytic effect on kerogen cracking. It is noteworthy that this promoting effect was more pronounced in the dry-mixed samples. This may be due to the fact that more carbon dioxide is produced by decomposition during pyrolysis in the dry-mixed samples, and its carryover effect during the release process also promotes the release of hydrocarbon products. In contrast, much less carbon dioxide is produced from carbonate decomposition in wet-mixed samples, thus weakening the promoting effect.
3.3.3. Effect on Shale Oil Composition
The results of SARA composition analysis of various shale oil samples are presented in Figure 8. After the addition of AlCl3·6H2O by both mixing methods, the saturated hydrocarbon content of shale oil is significantly reduced, the aromatic hydrocarbon and asphaltene contents are slightly increased, and the resin content is significantly increased. These results suggest that the addition of AlCl3·6H2O promotes the breaking of heteroatomic bonds and the transportation of primary products during kerogen pyrolysis. In addition, the substantial removal of carbonate during mixing or pyrolysis resulted in the formation of more pore space. This increase in pore space and the release of carbon dioxide can make it easier for the complex structural products from kerogen cracking to be generated and transported, thus reducing the occurrence of its secondary cracking, leading to a significant increase in the resin content and a considerable decrease in the saturated hydrocarbons content. In addition, the large amount of carbon dioxide produced during pyrolysis at high temperatures in the dry-mixed samples further facilitated the transportation of primary products, leading to a significant increase in the resin content of the shale oil samples obtained by pyrolysis at 520 °C.
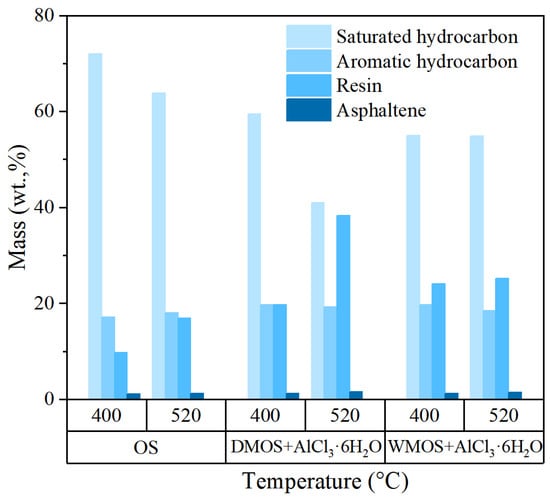
Figure 8.
The SARA composition of various shale oil products.
Table 3 shows the results of ultimate analysis (N, C, H, O, and S) of various shale oil samples. The results show that the addition of AlCl3·6H2O has little effect on the elemental composition of shale oil products. However, a slight reduction in H/C was observed in samples added to AlCl3·6H2O, which is due to the increasing ratios of aromatic hydrocarbons and resins and the decreasing content of saturated hydrocarbons. This is consistent with the results of the SARA analysis.
Table 3.
Ultimate analysis (N, C, H, S, and O) results of various shale oil samples.
Figure 9 shows the fraction composition results of various shale oil samples. It suggests that the compositions of shale oil obtained via DMOS+AlCl3·6H2O and WMOS + AlCl3·6H2O at 400 °C were remarkably different. The shale oil obtained from DMOS + AlCl3·6H2O contains less gasoline and diesel and more distillate and heavy oil. This happens because a significant amount of carbon dioxide escapes during the pyrolysis of the DMOS+AlCl3·6H2O, promoting the release of the heavy fraction and reducing the level of the light fraction. There is no large amount of carbon dioxide produced from WMOS + AlCl3·6H2O, which prolongs the conversion time of heavy hydrocarbons. After that, the shale oil obtained via DMOS+AlCl3·6H2O and WMOS+ AlCl3·6H2O at 520 °C both have lower gasoline, diesel and distillate, but higher heavy oil than the shale oil obtained from OS. This implies that the significant increase in pore space caused by AlCl3 can greatly enhance the generation and transport of heavy components at high temperatures.
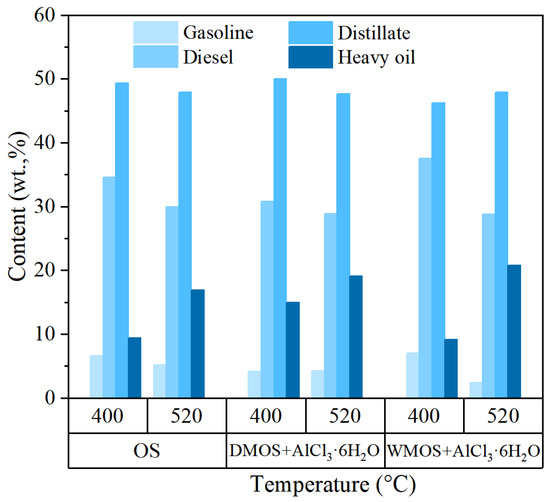
Figure 9.
Simulated distillation analysis results of various shale oil samples.
Figure 10a shows the GC-MS analysis results of various shale oil samples. The normal hydrocarbons are the main components in all shale oil samples, with a bimodal distribution of n-alkanes and n-alkenes in the spectrum, and their chain lengths were marked at intervals. The normal hydrocarbons were divided into two parts based on the chain length: short-chain (C9–C21) and long-chain (C22–C32), and their contents, determined based on the peak area in the above-mentioned spectrums, are shown in Figure 10b.
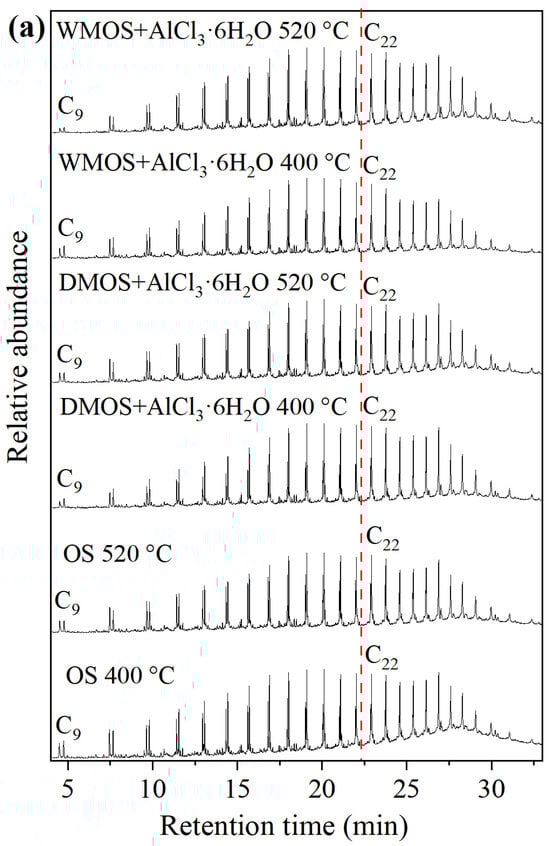
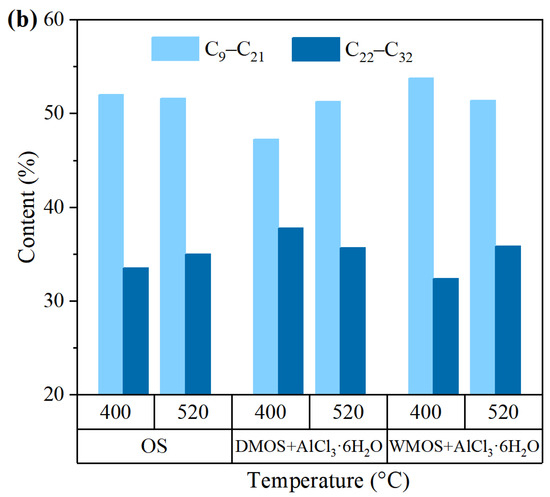
Figure 10.
(a) GC-MS analysis results, and (b) the composition of short- and long-chain normal hydrocarbons of various shale oil samples.
The results show that the shale oil obtained from DMOS + AlCl3·6H2O and WMOS + AlCl3·6H2O at 400 °C have different component distributions. Compared to the shale oil from OS, that obtained from DMOS + AlCl3·6H2O at 400 °C shows a decrease in short- chain hydrocarbons and an increase in long-chain hydrocarbons. In contrast, shale oil obtained from WMOS + AlCl3·6H2O at 400 °C results in an increase in short-chain hydrocarbons and a decrease in long-chain hydrocarbons. These phenomena are similar to the results of the simulated distillation analysis. During the pyrolysis of the DMOS + AlCl3·6H2O, a significant amount of carbon dioxide escaped, promoting the release of the heavy fraction and reducing the light fraction. However, no significant amount of carbon dioxide was produced in WMOS + AlCl3·6H2O, which prolonged the conversion of the heavy hydrocarbons and, together with the catalytic effect of AlCl3·6H2O, resulted in more light fractions. All shale oil samples obtained at 520 °C then have a similar compositional distribution, with fewer lighter fractions as well as more heavy fractions. This suggests that at high temperatures, AlCl3·6H2O can facilitate the initial cracking of kerogen and the release of heavy fractions. This is attributed to the catalytic effect of AlCl3·6H2O and the large amount of pores formed by carbonate removal.
Environmental concerns cannot be ignored when using acid chlorates as catalysts. Generally, the injection of acidic chloride salt catalysts into the ground may cause heavy metal contamination, especially Cr, Mo, and Mn, which are less abundant in the soil. In addition, excessive acidic salts may lead to the acidification of soil and groundwater, etc. However, in OS extraction, minerals such as carbonates in the OS strata can effectively neutralize acidic salts and produce more stable metal oxides or salts at high temperatures. This can greatly reduce the environmental impact of the catalyst. Further, AlCl3 is characterized by low cost and low pollution, and the Al2O3 generated exists in large quantities in the natural environment and has a low environmental impact. This makes it a great potential in OS extraction.
Notwithstanding the above, monitoring and treatment of catalyst impacts during the in situ extraction process is essential. Long-term monitoring of the surrounding soil, water, and atmosphere should be carried out during the extraction process to assess the risk of spreading pollution. In addition, if necessary, low concentrations of weakly alkaline solutions should be injected into the ground for neutralization, or adsorbents (activated carbon) should be used to capture chlorinated organics at the outlet. Moreover, a closed system should be formed in the exploitation area by means of curtain grouting and high-pressure gas drive to minimize the loss of catalyst and to achieve closed control of it for subsequent recovery.
4. Conclusions
In this paper, the facilitation effect of chlorate on the pyrolysis of Huadian OS was investigated. The results show that acidic chlorate can improve the pore space of OS, promote the pyrolysis of kerogen and increase the oil yield. The improved pore space by removing carbonate can also promote the release of hydrocarbon products, while the large amount of carbon dioxide released during the pyrolysis of mixed samples can promote the migration of heavy components. This study demonstrates the great potential of acid chlorates to counter reservoir blockage and promote pyrolysis in in situ OS recovery. In the future, the environmental effects of catalysts in application, the applicability to different samples, and the effectiveness in OS cores under in situ high-temperature and high-pressure environments should be continually investigated.
Author Contributions
Conceptualization, S.X.; methodology, S.W. and H.W. (Han Wang); software, H.W. (Hanxi Wang); validation, S.X., L.X. and H.W. (Han Wang); formal analysis, S.X. and S.D.; investigation, S.X. and S.W.; writing—original draft preparation, S.X.; writing—review and editing, L.X. and H.W. (Han Wang); supervision, L.X.; funding acquisition, S.X., L.X. and S.D. All authors have read and agreed to the published version of the manuscript.
Funding
This research was funded by the China Postdoctoral Science Foundation under Grant Number 2023M743305, the National Funding Program for Postdoctoral Fellows (GZC20232484), the National Natural Science Foundation of China (No. 42472379), and the Key R&D Projects of Jilin Provincial Science and Technology Department (No.20240304152SF).
Institutional Review Board Statement
Not applicable.
Informed Consent Statement
Not applicable.
Data Availability Statement
The original contributions presented in this study are included in this article; further inquiries can be directed to the corresponding authors.
Acknowledgments
I would like to thank one of the anonymous reviewers for the professional and meticulous revision of my first submission. I am deeply impressed by your rich review comments and revision suggestions, which are meticulous to every sentence in the manuscript. In addition, the author would like to thank Guo Mingyi for providing experimental ideas, laboratory, and guidance during the early stage of this study.
Conflicts of Interest
The authors declare no conflicts of interest.
References
- Raul, A. Fossil Fuels, Alternative Energy and Economic Growth. Econ. Model. 2018, 75, 196–220. [Google Scholar]
- Dyni, J. Geology and Resources of Some World Oil-Shale Deposits. Oil Shale 2023, 20, 193–252. [Google Scholar] [CrossRef]
- Jaber, T.; Apostolos, K. A Comprehensive Review of Microwave Application on the Oil Shale: Prospects for Shale Oil Production. Fuel 2021, 305, 121519. [Google Scholar]
- Zachariah, S.; Vahur, O.; Oliver, J. The Composition of Kukersite Shale Oil. Oil Shale 2023, 40, 25–43. [Google Scholar]
- He, W.T.; Sun, Y.H.; Shan, X.L. Organic Matter Evolution in Pyrolysis Experiments of Oil Shale Under High Pressure: Guidance for In Situ Conversion of Oil Shale in the Songliao Basin. J. Anal. Appl. Pyrolysis 2021, 155, 105091. [Google Scholar] [CrossRef]
- Hillier, J.L.; Fletcher, T.H.; Solum, M.S.; Pugmire, R.J. Characterization of Macromolecular Structure of Pyrolysis Products from a Colorado Green River Oil Shale. Ind. Eng. Chem. Res. 2013, 52, 15522–15532. [Google Scholar] [CrossRef]
- Amer, M.; Alhesan, J.; Marshall, M.; Fei, Y.; Jackson, W.; Chaffee, A. Energy Efficient Method of Supercritical Extraction of Oil from Oil Shale. Energy Convers. Manag. 2022, 252, 115108. [Google Scholar] [CrossRef]
- Wang, L.; Yang, D.; Zhang, Y.X.; Li, W.Q.; Kang, Z.Q.; Zhao, Y.S. Research on the Reaction Mechanism and Modification Distance of Oil Shale During High-Temperature Water Vapor Pyrolysis. Energy 2022, 261, 125213. [Google Scholar] [CrossRef]
- Yang, D.; Wang, L.; Zhao, Y.S.; Kang, Z.Q. Investigating Pilot Test of Oil Shale Pyrolysis and Oil and Gas Upgrading by Water Vapor Injection. J. Pet. Sci. Eng. 2021, 196, 108101. [Google Scholar] [CrossRef]
- Kang, Z.Q.; Zhao, Y.S.; Yang, D. Review of Oil Shale In-Situ Conversion Technology. Appl. Energy 2020, 269, 115121. [Google Scholar] [CrossRef]
- Hubbard, A.B.; Robinson, W.E. A Thermal Decomposition Study of Colorado Oil Shale; U.S. Department of the Interior, Bureau of Mines: Washington, DC, USA, 1950. [Google Scholar]
- Braun, R.L.; Rothman, A.U. Oil Shale Pyrolysis: Kinetics and Mechanism of Oil Production. Fuel 1975, 54, 129–131. [Google Scholar] [CrossRef]
- Allred, V.D. Kinetics of Oil Shale Pyrolysis. Chem. Eng. Prog. 1966, 62, 55–60. [Google Scholar]
- He, L.; Ma, Y.; Yue, C.T.; Wu, J.X.; Li, S.Y. Kinetic Modeling of Kukersite Oil Shale Pyrolysis with Thermal Bitumen as an Intermediate. Fuel 2020, 279, 118371. [Google Scholar] [CrossRef]
- Qin, K.Z.; Wu, X.L. Mechanism of Hydrocarbon Formation from Oil Shale Kerogen Viewed by High Magnetic Field Solid State 13C NMR Spectroscopy. Acta Sedimentol. Sin. 1990, 8, 19–27. [Google Scholar]
- Guo, W.; Fan, C.; Deng, S.; Shui, H.; Liu, Z. Secondary Cracking Characteristics of Asphaltenes and Insights into the Reservoir Unblocking During Oil Shale In-Situ Exploitation. Adv. Geo-Energy Res. 2025, 15, 13–29. [Google Scholar] [CrossRef]
- Martins, M.F.; Salvador, S.; Thovert, J.-F.; Debenest, G. Co-Current Combustion of Oil Shale—Part 1: Characterization of the Solid and Gaseous Products. Fuel 2010, 89, 144–151. [Google Scholar] [CrossRef]
- Martins, M.F.; Salvador, S.; Thovert, J.-F.; Debenest, G. Co-Current Combustion of Oil Shale—Part 2: Structure of the Combustion Front. Fuel 2010, 89, 133–143. [Google Scholar] [CrossRef]
- Xu, S.; Sun, Y.; Yang, Q.; Wang, H.; Kang, S.; Guo, W.; Shan, X.; He, W. Product Migration and Regional Reaction Characteristics in the Autothermic Pyrolysis In-Situ Conversion Process of Low-Permeability Huadian Oil Shale Core. Energy 2023, 283, 128525. [Google Scholar] [CrossRef]
- Guo, W.; Sun, Y.H.; Li, Q.; Deng, S.H.; Bai, F.T.; Chen, C.; Zhu, C.F.; Wang, Y.; Liu, Z. Oil Shale In-Situ Conversion Technology Triggered by Topochemical Reaction Method and Pilot Test Project in Songliao Basin. Acta Petrol. Sin. 2024, 45, 1104–1121, 1129. [Google Scholar]
- Abakar, R.; Sun, Y.H.; Han, J.; Guo, M.Y. Catalytic Pyrolysis of Oil Shale in the Presence of Three Kinds of Inorganic Salt. Jilin Univ. J. Earth Sci. 2018, 48, 1043–1049. [Google Scholar]
- Jiang, H.F.; Hong, W.P.; Zhang, Y.; Deng, S.H.; Chen, J.; Yang, C.; Ding, H.S. Behavior, Kinetic and Product Characteristics of the Pyrolysis of Oil Shale Catalyzed by Cobalt-Montmorillonite Catalyst. Fuel 2020, 269, 117468. [Google Scholar] [CrossRef]
- Ren, Z.Y.; Xu, G.J.; Geng, G.W.; Wang, J.J.; Wang, Z.P.; Su, J.Z.; Meng, X.L.; Chen, P.L. Enhanced Production of Thiophenes, Pyrroles, and Olefines via a Catalyst-assisted Pyrolysis of Oil Shale. Thermochim. Acta 2025, 743, 179900. [Google Scholar] [CrossRef]
- Kang, S.J.; Sun, Y.H.; Qiao, M.Y.; Li, S.L.; Deng, S.H.; Guo, W.; Li, J.S.; He, W.T. The Enhancement on Oil Shale Extraction of FeCl3 Catalyst in Subcritical Water. Energy 2022, 238, 121763. [Google Scholar] [CrossRef]
- Song, R.R.; Meng, X.L.; Yu, C.; Bian, J.J.; Su, J.Z. Oil Shale In-Situ Upgrading with Natural Clay-Based Catalysts: Enhancement of Oil Yield and Quality. Fuel 2022, 314, 123076. [Google Scholar] [CrossRef]
- Hu, M.J.; Cheng, Z.Q.; Zhang, M.Y.; Liu, M.Z.; Song, L.H.; Zhang, Y.Q.; Li, J.F. Effect of Calcite, Kaolinite, Gypsum, and Montmorillonite on Huadian Oil Shale Kerogen Pyrolysis. Energy Fuels 2014, 28, 1860–1867. [Google Scholar] [CrossRef]
- Cao, T.T.; Deng, M.; Song, Z.G.; Liu, G.X.; Huang, Y.R.; Hursthouse, A.S. Study on the Effect of Pyrite on the Accumulation of Shale Oil and Gas. Nat. Gas Geosci. 2018, 29, 11. [Google Scholar]
- Yang, Q.C.; Guo, M.Y.; Guo, W. Effects of Associated Minerals on the Co-Current Oxidizing Pyrolysis of Oil Shale in a Low-Temperature Stage. ACS Omega 2021, 6, 23988–23997. [Google Scholar] [CrossRef]
- Guo, H.F.; Lin, J.D.; Yang, Y.D.; Liu, Y.Y. Effect of Minerals on the Self-Heating Retorting of Oil Shale: Self-Heating Effect and Shale-Oil Production. Fuel 2014, 118, 186–193. [Google Scholar] [CrossRef]
- Guo, H.F.; Cheng, Q.X.; Jin, Z.; Wang, D.; Wang, K.K.; Ding, Y.; Zhu, H.; Liu, Y.Y. The Effect of Minerals on the Pyrolysis and the Combustion of Oil Shale. Energy Source Part A 2016, 38, 2963–2970. [Google Scholar] [CrossRef]
- Liu, Z.; Yang, D.; Hu, Y.; Zhang, J.; Shao, J.; Song, S.; Kang, Z. Influence of In Situ Pyrolysis on the Evolution of Pore Structure of Oil Shale. Energies 2018, 11, 755. [Google Scholar] [CrossRef]
Disclaimer/Publisher’s Note: The statements, opinions and data contained in all publications are solely those of the individual author(s) and contributor(s) and not of MDPI and/or the editor(s). MDPI and/or the editor(s) disclaim responsibility for any injury to people or property resulting from any ideas, methods, instructions or products referred to in the content. |
© 2025 by the authors. Licensee MDPI, Basel, Switzerland. This article is an open access article distributed under the terms and conditions of the Creative Commons Attribution (CC BY) license (https://creativecommons.org/licenses/by/4.0/).