Abstract
This study sought to establish machine learning models for forecasting in-hospital mortality in non-ST-segment elevation myocardial infarction (NSTEMI) patients, and focused on model interpretability using Shapley additive explanations (SHAP). Data were gathered from the Medical Information Mart for Intensive Care—IV database. The synthetic minority over-sampling technique and Edited Nearest Neighbors were used to address class imbalance. Four machine learning algorithms were employed, including Adaptive Boosting (AdaBoost), Random Forest (RF), Gradient Boosting Decision Trees (GBDT), and eXtreme Gradient Boosting (XGBoost). SHAP was utilized to improve transparency and credibility. The all-features RF model demonstrated optimal performance, with an accuracy of 0.8513, precision of 0.9016, and AUC of 0.8903. The SHAP summary plot for the RF model revealed that Acute Physiology Score III, lactate dehydrogenase, and lactate were the three most crucial characteristics, with higher values indicating a greater risk. The study demonstrates the applicability of machine learning, particularly RF, in predicting in-hospital mortality for NSTEMI patients, with the use of SHAP enhancing model interpretability and providing clinicians with clearer insights into feature contributions.
1. Introduction
Acute coronary syndrome (ACS) has become the prime cause of mortality and morbidity globally [1], with mortality rates persistently rising in recent years [2,3]. ACS is broadly classified into three main types: ST-elevation myocardial infarction (STEMI), non-ST-elevation myocardial infarction (NSTEMI), and unstable angina (UA) [4]. Recent studies have indicated that in contrast to STEMI, which has a decreasing incidence, the incidence of NSTEMI has been rising [5,6]. As a result, NSTEMI has become the main type of ACS in recent years [7]. It is related to higher rates of mortality, reinfarction, and stroke, as well as a worse unadjusted long-term prognosis, reflecting its significant clinical burden [8]. Patients with NSTEMI are more likely to be older and have more comorbidities compared to those with other forms of ACS [9]. The growing burden emphasizes the urgent need for more precise and adaptable predictive tools to improve risk stratification and patient outcomes. However, research on mortality in NSTEMI patients remains relatively limited compared to other cardiovascular diseases.
Although studies have shown that early intervention in NSTEMI patients can significantly reduce the risk of recurrence and shorten hospitalization, highlighting the importance of timely management, in-hospital mortality is not negligible [10]. In-depth exploration of independent risk factors for in-hospital mortality can not only optimize risk stratification tools but also guide individualized treatment [11,12]. Therefore, the identification of controllable predictors of in-hospital mortality has dual significance for the realization of precision medicine and the rational allocation of medical resources.
The Thrombolysis in Myocardial Infarction (TIMI) and Global Registry of Acute Coronary Events (GRACE) scores have been widely used to predict adverse outcomes in NSTEMI patients [13,14,15,16,17,18,19]. While these tools provide valuable guidance for patient stratification and management, they have significant limitations. These scores typically rely on linear relationships, failing to capture complex, non-linear interactions among variables. Advances in machine learning (ML) have empowered the development of robust predictive tools for estimating mortality risk in patients with NSTEMI. ML models can leverage large datasets to detect complex patterns and higher-order interactions among predictive features, leading to significant improvements in prediction accuracy compared to traditional scoring systems [20]. Studies have shown that ML models outperform traditional risk scoring systems [21]. Sazzli Kasim et al. obtained data from the national cardiovascular disease database for Malaysia, with 39 features and four ML algorithms: Support Vector Machine (SVM), eXtreme Gradient Boosting (XGBoost), Random Forest (RF), and Naive Bayes (NB), and performed a comparison with the TIMI score [22]. The predictive performance, evaluated using the Area Under the Curve (AUC), ranged from 0.73 to 0.89, with all AUCs exceeding that of the TIMI score (0.55). Joon myoung Kwon et al. used deep learning, RF, logistic regression, GRACE, and TIMI to estimate in-hospital mortality for patients with NSTEMI. The results suggested that ML models were better than traditional risk scoring systems [12]. Woojoo Lee et al. employed RF, XGBoost, TIMI, and GRACE to forecast in-hospital mortality for NSTEMI patients [23]. The AUCs were 0.889, 0.888, 0.669, and 0.872, respectively. As demonstrated by these results, ML algorithms surpass traditional risk scoring models. Despite their impressive performance, the ‘black-box’ nature of ML models has hindered their clinical adoption [24,25]. In response to this, Shapley additive explanations (SHAP) was developed to enhance transparency by enabling the identification of critical predictive factors and quantifying the contribution of each feature [26]. However, few studies have utilized SHAP to explain ML models, resulting in a lack of transparency in findings.
This study intends to establish an explainable ML model for the prediction of in-hospital mortality for NSTEMI patients. By incorporating a comprehensive set of clinical, demographic, and laboratory features, and utilizing SHAP for interpretability, the study seeks to provide transparent and reliable support for clinical decision-making, ultimately enhancing care quality and treatment for high-risk patients.
2. Methods
2.1. Data Source
The data source is the Medical Information Mart for Intensive Care (MIMIC)—IV database, v3.0, a large, freely accessible critical care database [27]. Permission was obtained for our research (Record ID: 61,960,249). The study utilized de-identified data to ensure compliance with privacy regulations, thereby eliminating the need for individual informed consent.
2.2. Study Population
The analysis enrolled patients diagnosed with NSTEMI who met the following inclusion criteria: (1) age greater than 18 years; (2) first hospitalization during the study period; and (3) length of stay exceeding 24 h. NSTEMI diagnosis was based on the International Classification of Diseases, 10th Revision (ICD-10) code I214. The final analysis cohort comprised 2085 patients (Figure 1).
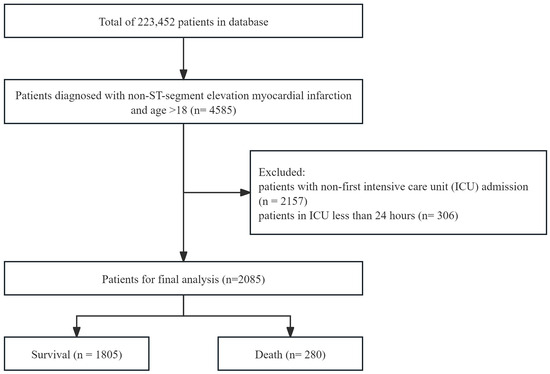
Figure 1.
A flowchart of the study population selection process for patients with non-ST-segment elevation myocardial infarction.
2.3. Variable Extraction
Variable extraction was performed using PostgreSQL software (version 16.4), in combination with Navicat Premium (version 16.2). Structured Query Language (SQL) queries were applied to retrieve data from the database, targeting variables across multiple domains. Demographic information included age, race, weight change during hospitalization, height, weight at admission, body mass index (BMI), and gender. Laboratory measurements encompassed calculated total CO2, glucose, lactate, pH, potassium, sodium, hemoglobin A1c, alanine aminotransferase (ALT), alkaline phosphatase, anion gap, aspartate aminotransferase (AST), bicarbonate, C-reactive protein (CRP), troponin T, calcium, chloride, creatine kinase (CK), creatinine, lactate dehydrogenase (LDH), magnesium, phosphate, hematocrit, creatine kinase-MB index, platelet count, prothrombin time (PT), red cell distribution width (RDW), white blood cell differential counts, etc. Physiological parameters included heart rate, systolic blood pressure (SBP), hemoglobin, temperature, cardiac output, count of atrial fibrillation episodes (AF count), and so on. Data on medication use, including prescriptions for aspirin, antiplatelet drugs, statins, and angiotensin-converting enzyme inhibitors (ACEIs), were gathered. Furthermore, information on comorbidities was gathered, including congestive heart failure, cerebrovascular disease, diabetes, renal disease, and others. Additionally, key variables such as length of stay (LOS), Acute Physiology Score III (APSIII), and the Charlson Comorbidity Index (CCI) were recorded. All variables are systematically documented in Table S1.
2.4. Statistical Analysis
Continuous variables were tested for normality using the Kolmogorov–Smirnov test. Normally distributed variables were summarized as the mean ± standard deviation (SD), and group comparisons were conducted with t-tests. Continuous variables that did not follow a normal distribution were summarized as the median (interquartile range), and analyzed through the Mann–Whitney U test. Categorical variables were expressed as proportions (%), and comparisons were made using the chi-square test. A p-value < 0.001 indicated statistical significance.
To ensure validity and robustness, variables demonstrating over 50% missingness were excluded from the analysis, including CRP, high-density lipoprotein cholesterol, low-density lipoprotein cholesterol, total cholesterol, N-terminal pro-B-type natriuretic peptide, and troponin I. For features with 20–50% missingness, imputation was conducted using the median value, while features with less than 20% missing data underwent K-Nearest Neighbors (KNN) imputation. The distribution of missing data across all features is illustrated in Figure S1, which provides a visual summary of the missing data proportion.
Features were selected using Least Absolute Shrinkage and Selection Operator (Lasso) regression and feature importance, based on RF. Both methods ranked the significance of variables, and the top 20% of features were selected for model development. Lasso regression is a linear model that combines regularization with feature selection. It minimizes the residual sum of squares, while adding a penalty proportional to the absolute values of the coefficients. RF is an ensemble learning method that inherently evaluates feature importance, and was utilized for selecting features.
We employed various data resampling techniques to deal with the issue of class imbalance, including the Synthetic Minority Over-sampling Technique (SMOTE), the Borderline Synthetic Minority Over-sampling Technique (Borderline SMOTE), the Support Vector Machine Synthetic Minority Over-sampling Technique (SVMSMOTE), Adaptive Synthetic Sampling (ADASYN), Synthetic Minority Over-sampling Technique Edited Nearest Neighbors (SMOTEENN), and Synthetic Minority Over-sampling Technique Tomek Links (SMOTETomek). For each resampling method, we utilized the XGBoost classifier to build the model. The training process employed 10-fold cross-validation. The performance was assessed based on the test set, using accuracy, precision, recall, and F1 score. During the data resampling process, the parameters were set to their default values.
Four ML algorithms were implemented for prediction: RF, Adaboost, XGBoost, and Gradient Boosting Decision Trees (GBDT). These methods were selected due to their strong predictive capabilities, robustness to overfitting, and effectiveness in handling structured data [28,29,30]. RF is a bagging method, while AdaBoost, GBDT, and XGBoost are boosting methods, which enables a comparison of the applicability of bagging and boosting to the study. RF is a technique that aggregates multiple decision trees to enhance model performance. It boosts accuracy and mitigates overfitting by combining the outputs of these trees, with the majority voting to make the final decision. Employing a boosting strategy, Adaboost integrates a series of base models (often decision stumps) into a unified predictive system via iterative reweighting, ensuring that each subsequent model compensates for the deficiencies of its predecessor. GBDT employs iterative gradient-based optimization to sequentially construct decision trees, with each successive predictor minimizing residual errors from preceding models. XGBoost is an optimized implementation of gradient boosting, designed for greater efficiency, scalability, and flexibility. The RF, Adaboost, and GBDT models were implemented using scikit-learn, while the XGBoost model was implemented using the XGBoost library. To avoid overfitting, we fine-tuned the model parameters to enhance generalization performance. Specifically, for the RF, we set max_depth = 10 and min_samples_split = 5 to prevent excessively complex trees, while keeping n_estimators = 100 for stability. For AdaBoost, we used n_estimators = 100 to balance bias and variance. For GBDT and XGBoost, we controlled model complexity by setting max_depth = 3, n_estimators = 100, and learning_rate = 0.1, ensuring a balance between training efficiency and generalization. Additionally, random_state = 42 was used across all models to ensure reproducibility.
We randomly split the dataset into training and testing sets, using 80% of the data for training and 20% for testing, and the training process employed 5-fold cross-validation, which guarantees a distinct assessment of performance when applied to unseen data. Model performance was evaluated using accuracy, precision, recall, F1 score, and AUC. Additionally, Receiver Operating Characteristic (ROC) curves were generated to visualize and compare the discriminative ability. Learning curves were used to help identify overfitting by showing the difference between training and validation performance [31].
To elucidate the decision-making processes of ML models, SHAP was utilized. SHAP employs game theory to quantify feature impacts, enabling both global and local interpretability of ML models. SHAP fairly allocates contributions among the features for a given model prediction. It measures how much each feature affects predictions when combined with every possible group of other features. It reveals exactly how individual features influence the model’s decisions, both in overall patterns and specific cases.
3. Results
3.1. Baseline Characteristics
The study included 2085 patients. Table 1 illustrates the baseline demographic and clinical characteristics, ranked by in-hospital survival status. Continuous variables are presented as the mean ± SD or median (interquartile range) according to the data distribution, whereas categorical variables are expressed as proportions. The mortality rate was 13.4% (280/2085). The mean age was 70.27. The percentage of males was 66.24%, significantly greater than the percentage of women. The survivors were more likely to take aspirin and statins, and had a lower AF count. For categorical variables, we applied the chi-square test to analyze differences between groups. For continuous variables, we utilized the Mann–Whitney U test. There were significant differences between survivor and non-survivor groups with regard to several variables, including age, LOS, APSIII, BMI, heart rate, AF count, ACEI, history of congestive heart failure, and history of renal disease (p < 0.001 for all).

Table 1.
Baseline demographic and clinical characteristics of patients diagnosed with NSTEMI included in the study.
3.2. Model Evaluation and Comparison
Feature selection was performed using two methods: Lasso regression and RF, with the top 20% of variables selected for subsequent analysis. Table S2 lists the selected features, ranked by importance, with APSIII, lactate, and RDW appearing in both methods.
A comparative analysis of the six resampling techniques was conducted to evaluate their impact on model performance. The results are summarized in Table S3. Given the study’s primary objective of mortality prediction, recall was prioritized as the key performance metric. SMOTEENN demonstrated superior recall performance (0.6379), leading to its selection as the optimal resampling method for handling class imbalance in our predictive model.
Table 2 outlines the evaluation results for the models, incorporating metrics including RF, AdaBoost, GBDT, and XGBoost, evaluated using different feature selection methods. In general, using all features yielded higher performance metrics compared to using Lasso-selected or RF-selected features. The models incorporating all features showed maximal predictive performance, with the RF model reaching the highest accuracy (0.8513), precision (0.9016), recall (0.8513), F1 score (0.8670), and AUC (8903), outperforming the other models. The accuracy for AdaBoost, GBDT, and XGBoost was 0.8201, 0.8657, and 0.8201, respectively. In terms of precision, all models performed well, with scores above 0.85. As for recall, AdaBoost performed the lowest, with a score of only 0.8201; meanwhile, a score of 0.8345 was achieved with GBDT and 0.8417 with XGBoost. The F1 score was 0.8370, 0.8488, and 0.8550 for AdaBoost, GBDT, and XGBoost, respectively. With regard to AUC, GBDT achieved 0.8689, followed by XGBoost with 0.8659 and AdaBoost with 0.8426. Based on the comprehensive analysis of the above five evaluation indicators, the RF model stands out as the most suitable choice for constructing prediction models.
Table 2.
Performance of prediction models with different feature selection methods.
Figure 2 illustrates the ROC curves of models based on different feature selection methods. The ROC curve plots show the performance of models across various threshold settings. Models incorporating all features exhibited the best performance. Learning curves were plotted for the models incorporating all features, as shown in Figure S2. The curves for both training and validation scores are closely aligned, and stabilize as the training size increases. Finally, RF outperformed all other models, with an accuracy of 0.9467.
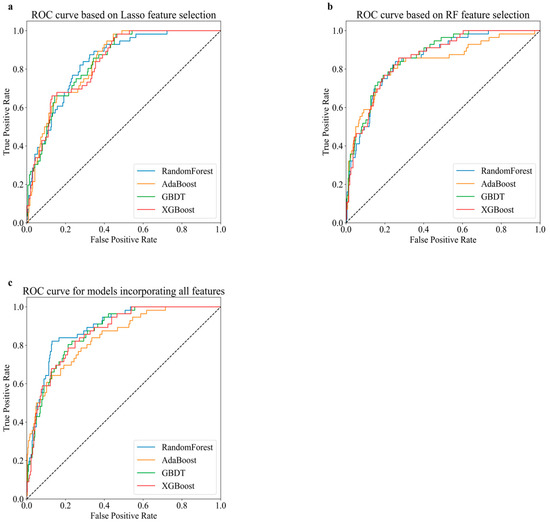
Figure 2.
Receiver operating characteristic (ROC) curve comparison for various predictive models based on different sets of features. (a) ROC curve based on Lasso feature selection. (b) ROC curve based on RF feature selection. (c) ROC curve for models incorporating all features.
A comparative analysis was conducted between our study and existing research utilizing ML for in-hospital mortality prediction in NSTEMI patients with established optimal predictive models. The comparison was structured across three critical dimensions: database characteristics, optimal model architectures, and predictive performance metrics, with detailed comparative outcomes presented in Table 3. The data were derived from datasets across diverse regions. The findings of this study are consistent with Woojoo Lee et al. [23]. Among all models, RF achieved the optimal performance. Although the accuracy obtained in this study (0.8513) is slightly lower than that of the XGBoost model (0.874) constructed by Sazzli Kasim et al. [22], our study obtained the best recall (0.8513) and AUC (0.8903).
Table 3.
Comparison of the performance of in-hospital mortality prediction models for NSTEMI patients in existing studies.
3.3. Interpretability Analysis
The summary plot (Figure 3) demonstrates the RF model with all features combined. Only the top 20% of the features are displayed. The x-axis represents the SHAP values, which indicate how each feature value affects the model output. The y-axis is ordered by each feature’s importance. Features that exert the greatest influence on the model’s predictions occupy positions towards the top of the axis. These include metrics like APSIII, LDH, lactate, and others. Each point stands for a row in the initial dataset. The color of the dots represents the value of the feature. The chromatic scale of the data points, with red signifying greater feature intensity and blue indicating lesser feature intensity, reflects the relative impact of each attribute. For binary classification variables, the scale contains only two colors. As shown in Figure 3, the use of ACEIs can protect patients, while higher values of other variables represent risk factors.
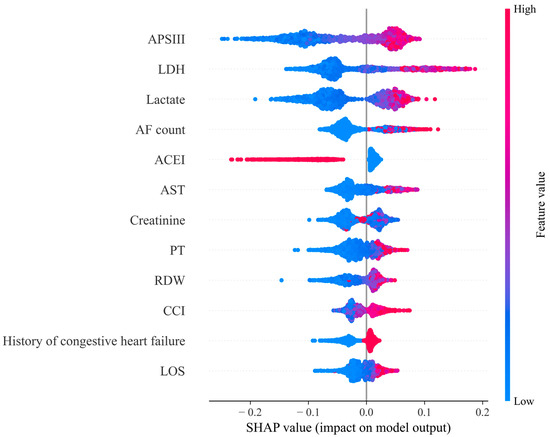
Figure 3.
SHAP summary plot for Random Forest model based on all features. Note: Lactate dehydrogenase (LDH); Aspartate aminotransferase (AST); Prothrombin time (PT); Red cell distribution width (RDW); Charlson comorbidity index (CCI).
Figure 4 displays a SHAP force plot, which provides an explanation of how the RF model makes a prediction for a single observation. As illustrated in Figure 4, the predicted probability for the sample is 0.80. A higher score indicates a tendency towards death, while a lower score indicates a tendency towards survival. Features highlighted in red indicate a positive influence on the model’s predicted value, effectively boosting the probability. Conversely, features colored in blue signify a negative impact on the predicted value, thus decreasing the probability of prediction. The magnitude of the impact is intuitively represented by the length of the corresponding bar. As can be seen, AF count, lactate, APSIII, AST, and LDH have a stronger association with a poorer outcome. The absence of a history of congestive heart failure is considered a protective factor for the patient.
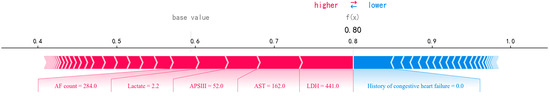
Figure 4.
A SHAP force plot for a single instance, visualizing feature contributions to the predicted outcome.
4. Discussion
ACS continues to contribute to global morbidity and mortality, and NSTEMI has become a significant concern, owing to its rising prevalence and unfavorable outcomes. In this study, we compared four popular ML models and two feature selection methods. Among these, the RF model with all features demonstrated the best performance, with the highest accuracy (0.8561). SHAP for RF demonstrated each feature’s importance ranking and provided insights into individual predictions, helping to explain the decision-making process.
Selecting features is a crucial step in ML, aimed at reducing the dimensionality of the dataset and improving model performance by retaining only the most informative features. In this study, we employed two widely used feature selection techniques: Lasso and feature importance based on RF. Both methods helped to identify the most relevant variables for predicting in-hospital mortality in NSTEMI patients. The top 20% of features selected by both Lasso and RF-based feature importance included variables such as lactate [32], APSIII, and RDW [33], which were consistently identified as strong predictors of mortality. However, surprisingly, the model that utilized all available features, without any feature selection, yielded the best performance. This finding can be attributed to the complexity and heterogeneity of clinical data. In many medical datasets, the relationships between variables are often non-linear and multifaceted, making it difficult to rely solely on a small subset of selected features. While feature selection methods like Lasso and RF-based importance ranking can help in identifying key predictors, they might also exclude important variables that, when combined, offer complementary or hidden insights into patient outcomes. By including all features, the model is able to capture a broader range of patient characteristics, laboratory measurements, and clinical observations, which together provide a more accurate representation of the risk factors influencing mortality [34]. It is also worth noting that the decision to use all features could have been influenced by the high quality and quantity of data available. In our study, missing data were carefully imputed, and appropriate techniques like SMOTEENN were used to balance class distribution, ensuring that the model could leverage the full spectrum of available information without bias. Thus, the result underscores the importance of considering the unique nature of the dataset and the potential benefits of utilizing all available data in complex clinical prediction tasks. While feature selection methods are valuable tools, in some cases, especially with high-dimensional healthcare data, it may be more advantageous to incorporate all features for optimal model performance.
We compared four widely used ensemble learning algorithms: RF, AdaBoost, GBDT, and XGBoost, to predict in-hospital mortality in patients with NSTEMI. Specifically, the RF model outperformed the other algorithms, achieving the highest accuracy (0.8513), precision (0.9016), recall (0.8513), F1 score (0.8670), and AUC (0.8903). Moreover, learning curve analysis demonstrated the superior generalization capability of RF, as evidenced by the convergence of training and test error rates with increasing sample size. This aligns with the existing literature, which has consistently shown that RF performs well on structured clinical data, due to its ability to deal with complex feature interaction relationships [29,35,36].
One of the key innovations in the study is the incorporation of SHAP to enhance the interpretability of the ML. SHAP provides a robust framework for interpreting the contribution of individual features to the model’s predictions, both globally and locally. It is particularly important in clinical settings, where transparency is essential for fostering trust and facilitating decision-making. SHAP demonstrated that several key variables had a substantial impact on the predictions of the RF model. APSIII, LDH, lactate, AF count, ACEI, AST, creatinine, PT, RDW, CCI, history of congestive heart failure, and LOS were identified as the top 12 most important predictors of in-hospital mortality. APSIII, which quantifies the severity of acute illness based on physiological parameters, was identified as the most important predictor. Higher APSIII scores demonstrated a greater risk of in-hospital mortality, reflecting poorer physiological stability at admission. Elevated LDH levels were found to strongly contribute to the model’s prediction of mortality. Increased LDH levels indicate tissue damage and a worse prognosis, which is consistent with the existing literature linking elevated LDH to adverse outcomes in critical illnesses [37,38,39]. High lactate levels are indicative of poor tissue perfusion and oxygenation, which is a known predictor of mortality in NSTEMI patients [40,41,42]. The SHAP analysis confirmed that higher lactate levels significantly increased the risk of death, highlighting the importance of early lactate measurement in the management of these patients. The frequency of atrial fibrillation episodes was another critical factor. The presence of AF, especially when recurrent or sustained, significantly contributed to a higher risk of in-hospital mortality. The use of ACEIs was found to be inversely related to mortality. The SHAP analysis suggested that ACEI-treated cohorts demonstrated reduced odds of in-hospital mortality. This is consistent with clinical guidelines that recommend ACEIs for heart failure and NSTEMI management to improve outcomes [43,44,45]. Elevated AST levels were associated with liver dysfunction and a potentially worse overall health status. In the context of NSTEMI, high AST levels can reflect liver injury or ischemia, thus contributing to higher mortality risk. Elevated serum creatinine levels, indicating impaired renal function, showed an association with heightened mortality risk. Renal dysfunction is a well-established risk factor for poor outcomes in NSTEMI patients, often reflecting multi-organ failure [46]. PT is a marker of coagulation status. Elevated PT indicates heightened risks of both hemorrhagic and thrombotic complications, which are crucial considerations in the care of NSTEMI patients, particularly under anticoagulant therapy. High RDW values increased the risk of death. Increased RDW often reflects systemic inflammation or chronic disease, which may contribute to adverse cardiovascular outcomes [47,48,49]. A higher CCI, which accounts for the burden of comorbidities, was linked to a greater likelihood of mortality during hospitalization, which suggests that patients with multiple pre-existing health conditions are at a greater risk of poor outcomes following NSTEMI. A previous history of congestive heart failure was a key risk factor for mortality, as heart failure can exacerbate the stress on the heart during an NSTEMI event. Longer hospitalization was strongly associated with an increased risk of mortality. Extended stays often reflect complications or the severity of illness, suggesting that patients with prolonged hospitalizations require more intensive care and have worse prognoses. Additionally, the SHAP force plot dissected the attribution of individual features to the model’s decision-making for a specific patient, visualizing how algorithmic reasoning was informed by these variables. The application of SHAP allowed for the quantification of each feature’s contribution to the predicted outcome, thereby enhancing the transparency of the RF model. The results suggest that clinicians should assess APSIII scores upon patient admission. When LDH, lactate, and AST levels are elevated, timely evaluation is recommended. Additionally, increased attention should be given to patients with recurrent atrial fibrillation or a history of heart disease. By integrating these predictive models into clinical practice, healthcare professionals can identify high-risk patients earlier, enabling timely interventions and improving outcomes. This integration also optimizes resource allocation, ensuring intensive care for high-risk patients, while streamlining care for low-risk ones. Furthermore, linking these models with electronic health records systems ensures real-time monitoring and alerts, facilitating proactive adjustments in treatment plans.
Compared to existing studies that use ML to predict in-hospital mortality for NSTEMI patients, our model achieved a higher AUC of 0.8903. However, while some studies, such as that by Sazzli Kasim [22], have conducted model interpretability analysis using SHAP summary plots, we employed SHAP force plot visualization techniques to analyze individual patient predictions, achieving a finer-grained understanding of feature contributions to model outputs. Additionally, existing studies have primarily focused on regions in Asia, such as Korea and Malaysia, and have not yet explored NSTEMI patients based on the MIMIC database, which highlights a unique aspect of our research.
Although the findings are highly encouraging, certain limitations remain. The study relied on a single dataset, MIMIC-IV, which, despite its large size and diversity, may not fully capture the variability observed in other clinical settings. Moreover, the study’s retrospective nature resulted in some incomplete data points, which may have influenced the results. Future work could focus on validating the model using external datasets from diverse clinical settings to enhance its generalizability. Prospective studies with comprehensive data collection are also needed to address the limitations posed by missing variables.
5. Conclusions
In this study, RF with all features achieved the best performance in predicting in-hospital death of NSTEMI patients. SHAP showed that ACEI use reduces the mortality risk during hospitalization for NSTEMI patients, while higher LDH, lactate levels, and AF count increase this risk. These results offer actionable insights for optimizing risk assessment and therapeutic strategies, thereby enhancing care efficacy. Furthermore, SHAP force plots enable precise, individualized predictions for each patient, facilitating personalized clinical decision-making and enhancing interpretability in medical practice.
Supplementary Materials
The following supporting information can be downloaded at https://www.mdpi.com/article/10.3390/app15084226/s1, Figure S1: A heatmap depicting the distribution and proportion of missing values across variables; Figure S2: Learning curves of the models with all features; Table S1: A summary of the variables used in the study; Table S2: Top 12 features selected by Lasso and Random Forest; Table S3: Comparative analysis of the six resampling techniques.
Author Contributions
Conceptualization, M.C. and C.L.; methodology, M.C.; software, M.C.; validation, M.C. and C.L.; formal Analysis, M.C.; resources, M.C.; data curation, M.C.; writing—original draft, M.C.; writing—review and editing, C.L.; visualization, M.C.; supervision, C.L.; project administration, C.L.; funding acquisition, C.L. All authors have read and agreed to the published version of the manuscript.
Funding
This work was supported by the Wuhan Institute of Technology Science Research Foundation (23QD28).
Institutional Review Board Statement
Not applicable.
Informed Consent Statement
Not applicable.
Data Availability Statement
The data used in the study are publicly available and can be accessed through the MIMIC IV database, which is hosted by PhysioNet (https://physionet.org/content/mimiciv/3.0, accessed on 2 August 2024).
Conflicts of Interest
The authors declare no conflicts of interest.
Abbreviations
| Abbreviation | Full Term |
| ACEI | Angiotensin-converting enzyme inhibitors |
| ACS | Acute coronary syndrome |
| AdaBoost | Adaptive Boosting |
| ADASYN | Adaptive Synthetic Sampling |
| AF count | Count of atrial fibrillation episodes |
| ALT | Alanine aminotransferase |
| APSIII | Acute Physiology Score III |
| AST | Aspartate aminotransferase |
| AUC | Area under the curve |
| BMI | Body mass index |
| CCI | Charlson comorbidity index |
| CK | Creatine kinase |
| CRP | C-reactive protein |
| GBDT | Gradient Boosting Decision Tree |
| GRACE | Global Registry of Acute Coronary Events |
| KNN | K-Nearest Neighbors |
| Lasso | Least absolute shrinkage and selection operator |
| LDH | Lactate dehydrogenase |
| LMWH | Low-Molecular-Weight Heparin |
| LR | Logistic regression |
| LOS | Length of stay |
| MIMIC | Medical Information Mart for Intensive Care |
| ML | Machine learning |
| NB | Naive Bayes |
| NSTEMI | Non-ST-elevation myocardial infarction |
| PT | Prothrombin time |
| RDW | Red cell distribution width |
| RF | Random Forest |
| ROC | Receiver operating characteristic |
| SBP | Systolic blood pressure |
| SD | Standard deviation |
| SHAP | SHapley Additive exPlanations |
| SMOTE | Synthetic Minority Over-sampling Technique |
| SMOTEENN | Synthetic Minority Over-sampling Technique and Edited Nearest Neighbors |
| SMOTETomek | Synthetic Minority Over-sampling Technique Tomek Links |
| STEMI | ST-elevation myocardial infarction |
| SVM | Support Vector Machine |
| SVMSMOTE | Support Vector Machine Synthetic Minority Over-sampling Technique |
| TIMI | Thrombolysis in Myocardial Infarction |
| UA | Unstable angina |
| XGBoost | eXtreme Gradient Boosting |
References
- Naghavi, M.; Ong, K.L.; Aali, A.; Ababneh, H.S.; Abate, Y.H.; Abbafati, C.; Abbasgholizadeh, R.; Abbasian, M.; Abbasi-Kangevari, M.; Abbastabar, H.; et al. Global burden of 288 causes of death and life expectancy decomposition in 204 countries and territories and 811 subnational locations, 1990–2021: A systematic analysis for the Global Burden of Disease Study 2021. Lancet 2024, 403, 2100–2132. [Google Scholar] [CrossRef]
- Rahimi, K.; Duncan, M.; Pitcher, A.; Emdin, C.A.; Goldacre, M.J. Mortality from heart failure, acute myocardial infarction and other ischaemic heart disease in England and Oxford: A trend study of multiple-cause-coded death certification. J. Epidemiol. Community Health 2015, 69, 1000–1005. [Google Scholar] [CrossRef] [PubMed]
- Ibanez, B.; James, S.; Agewall, S.; Antunes, M.J.; Bucciarelli-Ducci, C.; Bueno, H.; Caforio, A.L.P.; Crea, F.; Goudevenos, J.A.; Halvorsen, S.; et al. 2017 ESC Guidelines for the management of acute myocardial infarction in patients presenting with ST-segment elevation: The Task Force for the management of acute myocardial infarction in patients presenting with ST-segment elevation of the European Society of Cardiology (ESC). Eur. Heart J. 2018, 39, 119–177. [Google Scholar] [CrossRef]
- Hedayati, T.; Yadav, N.; Khanagavi, J. Non-ST-Segment Acute Coronary Syndromes. Cardiol. Clin. 2018, 36, 37–52. [Google Scholar] [CrossRef]
- Widimsky, P.; Wijns, W.; Fajadet, J.; de Belder, M.; Knot, J.; Aaberge, L.; Andrikopoulos, G.; Baz, J.A.; Betriu, A.; Claeys, M.; et al. Reperfusion therapy for ST elevation acute myocardial infarction in Europe: Description of the current situation in 30 countries. Eur. Heart J. 2010, 31, 943–957. [Google Scholar] [CrossRef]
- McManus, D.D.; Gore, J.; Yarzebski, J.; Spencer, F.; Lessard, D.; Goldberg, R.J. Recent trends in the incidence, treatment, and outcomes of patients with STEMI and NSTEMI. Am. J. Med. 2011, 124, 40–47. [Google Scholar] [CrossRef]
- Liu, Y.; Du, L.; Li, L.; Xiong, L.; Luo, H.; Kwaku, E.; Mei, X.; Wen, C.; Cui, Y.Y.; Zhou, Y.; et al. Development and validation of a machine learning-based readmission risk prediction model for non-ST elevation myocardial infarction patients after percutaneous coronary intervention. Sci. Rep. 2024, 14, 13393. [Google Scholar] [CrossRef] [PubMed]
- Polonski, L.; Gasior, M.; Gierlotka, M.; Osadnik, T.; Kalarus, Z.; Trusz-Gluza, M.; Zembala, M.; Wilczek, K.; Lekston, A.; Zdrojewski, T.; et al. A comparison of ST elevation versus non-ST elevation myocardial infarction outcomes in a large registry database: Are non-ST myocardial infarctions associated with worse long-term prognoses? Int. J. Cardiol. 2011, 152, 70–77. [Google Scholar] [CrossRef]
- D’Souza, M.; Sarkisian, L.; Saaby, L.; Poulsen, T.S.; Gerke, O.; Larsen, T.B.; Diederichsen, A.C.; Jangaard, N.; Diederichsen, S.Z.; Hosbond, S.; et al. Diagnosis of unstable angina pectoris has declined markedly with the advent of more sensitive troponin assays. Am. J. Med. 2015, 128, 852–860. [Google Scholar] [CrossRef]
- Katritsis, D.G.; Siontis, G.C.; Kastrati, A.; van’t Hof, A.W.; Neumann, F.J.; Siontis, K.C.; Ioannidis, J.P. Optimal timing of coronary angiography and potential intervention in non-ST-elevation acute coronary syndromes. Eur. Heart J. 2011, 32, 32–40. [Google Scholar] [CrossRef]
- Kasim, S.; Malek, S.; Song, C.; Wan Ahmad, W.A.; Fong, A.; Ibrahim, K.S.; Safiruz, M.S.; Aziz, F.; Hiew, J.H.; Ibrahim, N. In-hospital mortality risk stratification of Asian ACS patients with artificial intelligence algorithm. PLoS ONE 2022, 17, e0278944. [Google Scholar] [CrossRef] [PubMed]
- Kwon, J.M.; Jeon, K.H.; Kim, H.M.; Kim, M.J.; Lim, S.; Kim, K.H.; Song, P.S.; Park, J.; Choi, R.K.; Oh, B.H. Deep-learning-based risk stratification for mortality of patients with acute myocardial infarction. PLoS ONE 2019, 14, e0224502. [Google Scholar] [CrossRef]
- Yalcin Ocak, N.; Yesilaras, M.; Kilicaslan, B.; Eyler, Y.; Mutlu, İ.; Kutlu, M. Comparing TIMI, HEART, and GRACE Risk Scores to Predict Angiographic Severity of Coronary Artery Disease and 30-Day Major Adverse Cardiac Events in Emergency Department Patients with NSTEACS. Prehospital Disaster Med. 2023, 38, 740–748. [Google Scholar] [CrossRef]
- Sawalha, K.; Khan, S.; Suarez, E.; Beresic, N.; Kamoga, G.R. Is the thrombolysis in myocardial infarction (TIMI) score a reliable source in a rural hospital for the management of unstable angina/non-ST elevated myocardial infarctions (UA/NSTEMI)? J. Community Hosp. Intern. Med. Perspect. 2021, 11, 446–449. [Google Scholar] [CrossRef]
- Akan, A.; Özlü, I. Correlation of osteopontin hormone with TIMI score and cardiac markers in patients with acute coronary syndrome presenting with chest pain. Cardiovasc. J. Afr. 2024, 34, 1–8. [Google Scholar] [CrossRef]
- Krishnamurthy, S.N.; Pocock, S.; Kaul, P.; Owen, R.; Goodman, S.G.; Granger, C.B.; Nicolau, J.C.; Simon, T.; Westermann, D.; Yasuda, S.; et al. Comparing the long-term outcomes in chronic coronary syndrome patients with prior ST-segment and non-ST-segment elevation myocardial infarction: Findings from the TIGRIS registry. BMJ Open 2023, 13, e070237. [Google Scholar] [CrossRef] [PubMed]
- Kumar, D.; Saghir, T.; Zahid, M.; Ashok, A.; Kumar, M.; Ali Shah, A.; Shahid, I.; Ali, S.; Haque, A.; Karim, M. Validity of TIMI Score for Predicting 14-Day Mortality of Non-ST Elevation Myocardial Infarction Patients. Cureus 2021, 13, e12518. [Google Scholar] [CrossRef] [PubMed]
- Chen, X.; Wu, H.; Li, L.; Zhao, X.; Zhang, C.; Wang, W.E. The prognostic utility of GRACE risk score in predictive adverse cardiovascular outcomes in patients with NSTEMI and multivessel disease. BMC Cardiovasc. Disord. 2022, 22, 568. [Google Scholar] [CrossRef]
- Yanqiao, L.; Shen, L.; Yutong, M.; Linghong, S.; Ben, H. Comparison of GRACE and TIMI risk scores in the prediction of in-hospital and long-term outcomes among East Asian non-ST-elevation myocardial infarction patients. BMC Cardiovasc. Disord. 2022, 22, 4. [Google Scholar] [CrossRef]
- Weng, S.F.; Reps, J.; Kai, J.; Garibaldi, J.M.; Qureshi, N. Can machine-learning improve cardiovascular risk prediction using routine clinical data? PLoS ONE 2017, 12, e0174944. [Google Scholar] [CrossRef]
- Liu, W.; Laranjo, L.; Klimis, H.; Chiang, J.; Yue, J.; Marschner, S.; Quiroz, J.C.; Jorm, L.; Chow, C.K. Machine-learning versus traditional approaches for atherosclerotic cardiovascular risk prognostication in primary prevention cohorts: A systematic review and meta-analysis. Eur. Heart J. Qual. Care Clin. Outcomes 2023, 9, 310–322. [Google Scholar] [CrossRef]
- Kasim, S.; Amir Rudin, P.N.F.; Malek, S.; Aziz, F.; Wan Ahmad, W.A.; Ibrahim, K.S.; Muhmad Hamidi, M.H.; Raja Shariff, R.E.; Fong, A.Y.Y.; Song, C. Data analytics approach for short- and long-term mortality prediction following acute non-ST-elevation myocardial infarction (NSTEMI) and Unstable Angina (UA) in Asians. PLoS ONE 2024, 19, e0298036. [Google Scholar] [CrossRef] [PubMed]
- Lee, W.; Lee, J.; Woo, S.I.; Choi, S.H.; Bae, J.W.; Jung, S.; Jeong, M.H.; Lee, W.K. Machine learning enhances the performance of short and long-term mortality prediction model in non-ST-segment elevation myocardial infarction. Sci. Rep. 2021, 11, 12886. [Google Scholar] [CrossRef]
- Petch, J.; Di, S.; Nelson, W. Opening the Black Box: The Promise and Limitations of Explainable Machine Learning in Cardiology. Can. J. Cardiol. 2022, 38, 204–213. [Google Scholar] [CrossRef] [PubMed]
- Cabitza, F.; Rasoini, R.; Gensini, G.F. Unintended Consequences of Machine Learning in Medicine. JAMA 2017, 318, 517–518. [Google Scholar] [CrossRef]
- Lundberg, S.M.; Erion, G.G.; Lee, S.I. Consistent Individualized Feature Attribution for Tree Ensembles. arXiv 2018, arXiv:1802.03888. [Google Scholar]
- Johnson, A.E.W.; Bulgarelli, L.; Shen, L.; Gayles, A.; Shammout, A.; Horng, S.; Pollard, T.J.; Hao, S.; Moody, B.; Gow, B.; et al. MIMIC-IV, a freely accessible electronic health record dataset. Sci. Data 2023, 10, 1. [Google Scholar] [CrossRef] [PubMed]
- Hu, J.; Szymczak, S. A review on longitudinal data analysis with random forest. Brief. Bioinform. 2023, 24, bbad002. [Google Scholar] [CrossRef]
- Silva, G.F.S.; Fagundes, T.P.; Teixeira, B.C.; Chiavegatto Filho, A.D.P. Machine Learning for Hypertension Prediction: A Systematic Review. Curr. Hypertens. Rep. 2022, 24, 523–533. [Google Scholar] [CrossRef]
- Zhou, J.; Xie, M.; Dong, N.; Xie, M.; Liu, J.; Wang, M.; Wang, Y.; Xu, H.G. Machine Learning of Laboratory Data in Predicting 30-Day Mortality for Adult Hemophagocytic Lymphohistiocytosis. J. Clin. Immunol. 2024, 45, 12. [Google Scholar] [CrossRef]
- Géron, A. Hands-On Machine Learning with Scikit-Learn, Keras, and TensorFlow: Concepts, Tools, and Techniques to Build Intelligent Systems; O’Reilly Media Inc.: Sebastopol, CA, USA, 2022. [Google Scholar]
- Kong, S.; Chen, C.; Zheng, G.; Yao, H.; Li, J.; Ye, H.; Wang, X.; Qu, X.; Zhou, X.; Lu, Y.; et al. A prognostic nomogram for long-term major adverse cardiovascular events in patients with acute coronary syndrome after percutaneous coronary intervention. BMC Cardiovasc. Disord. 2021, 21, 253. [Google Scholar] [CrossRef] [PubMed]
- Emakhu, J.; Monplaisir, L.; Aguwa, C.; Arslanturk, S.; Masoud, S.; Nassereddine, H.; Hamam, M.S.; Miller, J.B. Acute coronary syndrome prediction in emergency care: A machine learning approach. Comput. Methods Programs Biomed. 2022, 225, 107080. [Google Scholar] [CrossRef]
- Gomes, B.; Pilz, M.; Reich, C.; Leuschner, F.; Konstandin, M.; Katus, H.A.; Meder, B. Machine learning-based risk prediction of intrahospital clinical outcomes in patients undergoing TAVI. Clin. Res. Cardiol. 2021, 110, 343–356. [Google Scholar] [CrossRef] [PubMed]
- Chopannejad, S.; Sadoughi, F.; Bagherzadeh, R.; Shekarchi, S. Predicting Major Adverse Cardiovascular Events in Acute Coronary Syndrome: A Scoping Review of Machine Learning Approaches. Appl. Clin. Inform. 2022, 13, 720–740. [Google Scholar] [CrossRef] [PubMed]
- Liu, H.; Xing, F.; Jiang, J.; Chen, Z.; Xiang, Z.; Duan, X. Random forest predictive modeling of prolonged hospital length of stay in elderly hip fracture patients. Front. Med. 2024, 11, 1362153. [Google Scholar] [CrossRef]
- Rotenberg, Z.; Davidson, E.; Weinberger, I.; Fuchs, J.; Sperling, O.; Agmon, J. The efficiency of lactate dehydrogenase isoenzyme determination for the diagnosis of acute myocardial infarction. Arch. Pathol. Lab. Med. 1988, 112, 895–897. [Google Scholar]
- Weidner, N. Laboratory diagnosis of acute myocardial infarct: Usefulness of determination of lactate dehydrogenase (LDH)-1 level and of ratio of LDH-1 to total LDH. Arch. Pathol. Lab. Med. 1982, 106, 375–377. [Google Scholar]
- Patschan, D.; Witzke, O.; Duhrsen, U.; Erbel, R.; Philipp, T.; Herget-Rosenthal, S. Acute myocardial infarction in thrombotic microangiopathies--clinical characteristics, risk factors and outcome. Nephrol. Dial. Transplant. 2006, 21, 1549–1554. [Google Scholar] [CrossRef]
- Li, H.; Chen, J.; Xing, X.; Lou, D. Association of lactate detection with in-hospital mortality in critically ill patients with acute myocardial infarction: A retrospective cohort study. BMJ Open 2023, 13, e069129. [Google Scholar] [CrossRef]
- Aleksandar, J.; Vladan, P.; Markovic-Jovanovic, S.; Stolic, R.; Mitic, J.; Smilic, T. Hyperlactatemia and the Outcome of Type 2 Diabetic Patients Suffering Acute Myocardial Infarction. J. Diabetes Res. 2016, 2016, 6901345. [Google Scholar] [CrossRef]
- Gatien, M.; Stiell, I.; Wielgosz, A.; Ooi, D.; Lee, J.S. Diagnostic performance of venous lactate on arrival at the emergency department for myocardial infarction. Acad. Emerg. Med. 2005, 12, 106–113. [Google Scholar] [CrossRef] [PubMed]
- Byun, J.K.; Choi, B.G.; Rha, S.W.; Choi, S.Y.; Jeong, M.H. Comparison of angiotensin-converting enzyme inhibitors and angiotensin II receptor blockers in patients with diabetes mellitus and non-ST-segment elevation myocardial infarction who underwent successful percutaneous coronary intervention. Atherosclerosis 2018, 277, 130–135. [Google Scholar] [CrossRef] [PubMed]
- Nadarajah, R.; Ludman, P.; Appelman, Y.; Brugaletta, S.; Budaj, A.; Bueno, H.; Huber, K.; Kunadian, V.; Leonardi, S.; Lettino, M.; et al. Cohort profile: The ESC EURObservational Research Programme Non-ST-segment elevation myocardial infraction (NSTEMI) Registry. Eur. Heart J. Qual. Care Clin. Outcomes 2022, 9, 8–15. [Google Scholar] [CrossRef]
- González-Cambeiro, M.C.; López-López, A.; Abu-Assi, E.; Raposeiras-Roubín, S.; Peña-Gil, C.; García-Acuña, J.; González-Juanatey, R. Mortality benefit of long-term angiotensin-converting enzyme inhibitors or angiotensin receptor blockers after successful percutaneous coronary intervention in non-ST elevation acute myocardial infarction. Rev. Port. Cardiol. 2016, 35, 645–653. [Google Scholar] [CrossRef] [PubMed]
- de Chickera, S.N.; Bota, S.E.; Kuwornu, J.P.; Wijeysundera, H.C.; Molnar, A.O.; Lam, N.N.; Silver, S.A.; Clark, E.G.; Sood, M.M. Albuminuria, Reduced Kidney Function, and the Risk of ST- and non-ST-segment–elevation myocardial infarction. J. Am. Heart Assoc. 2018, 7, e009995. [Google Scholar] [CrossRef]
- Açıkgöz, S.K.; Akboğa, M.K.; Açıkgöz, E.; Yayla, Ç.; Şensoy, B.; Aydoğdu, S. Red cell distribution width predicts totally occluded infarct-related artery in NSTEMI. Scand. Cardiovasc. J. 2016, 50, 224–229. [Google Scholar] [CrossRef]
- Gul, M.; Uyarel, H.; Ergelen, M.; Karacimen, D.; Ugur, M.; Turer, A.; Bozbay, M.; Ayhan, E.; Akgul, O.; Uslu, N. The relationship between red blood cell distribution width and the clinical outcomes in non-ST elevation myocardial infarction and unstable angina pectoris: A 3-year follow-up. Coron. Artery Dis. 2012, 23, 330–336. [Google Scholar] [CrossRef] [PubMed]
- Polat, N.; Yildiz, A.; Oylumlu, M.; Kaya, H.; Acet, H.; Akil, M.A.; Yuksel, M.; Bilik, M.Z.; Aydin, M.; Ulgen, M.S. Relationship Between Red Cell Distribution Width and the GRACE Risk Score with In-Hospital Death in Patients with Acute Coronary Syndrome. Clin. Appl. Thromb. Hemost. 2014, 20, 577–582. [Google Scholar] [CrossRef]
Disclaimer/Publisher’s Note: The statements, opinions and data contained in all publications are solely those of the individual author(s) and contributor(s) and not of MDPI and/or the editor(s). MDPI and/or the editor(s) disclaim responsibility for any injury to people or property resulting from any ideas, methods, instructions or products referred to in the content. |
© 2025 by the authors. Licensee MDPI, Basel, Switzerland. This article is an open access article distributed under the terms and conditions of the Creative Commons Attribution (CC BY) license (https://creativecommons.org/licenses/by/4.0/).