
Train-Induced Vibration Analysis and Isolation Trench Measures in Metro Depot Structures

Abstract
1. Introduction
2. Environmental Vibration Model of Metro Depot
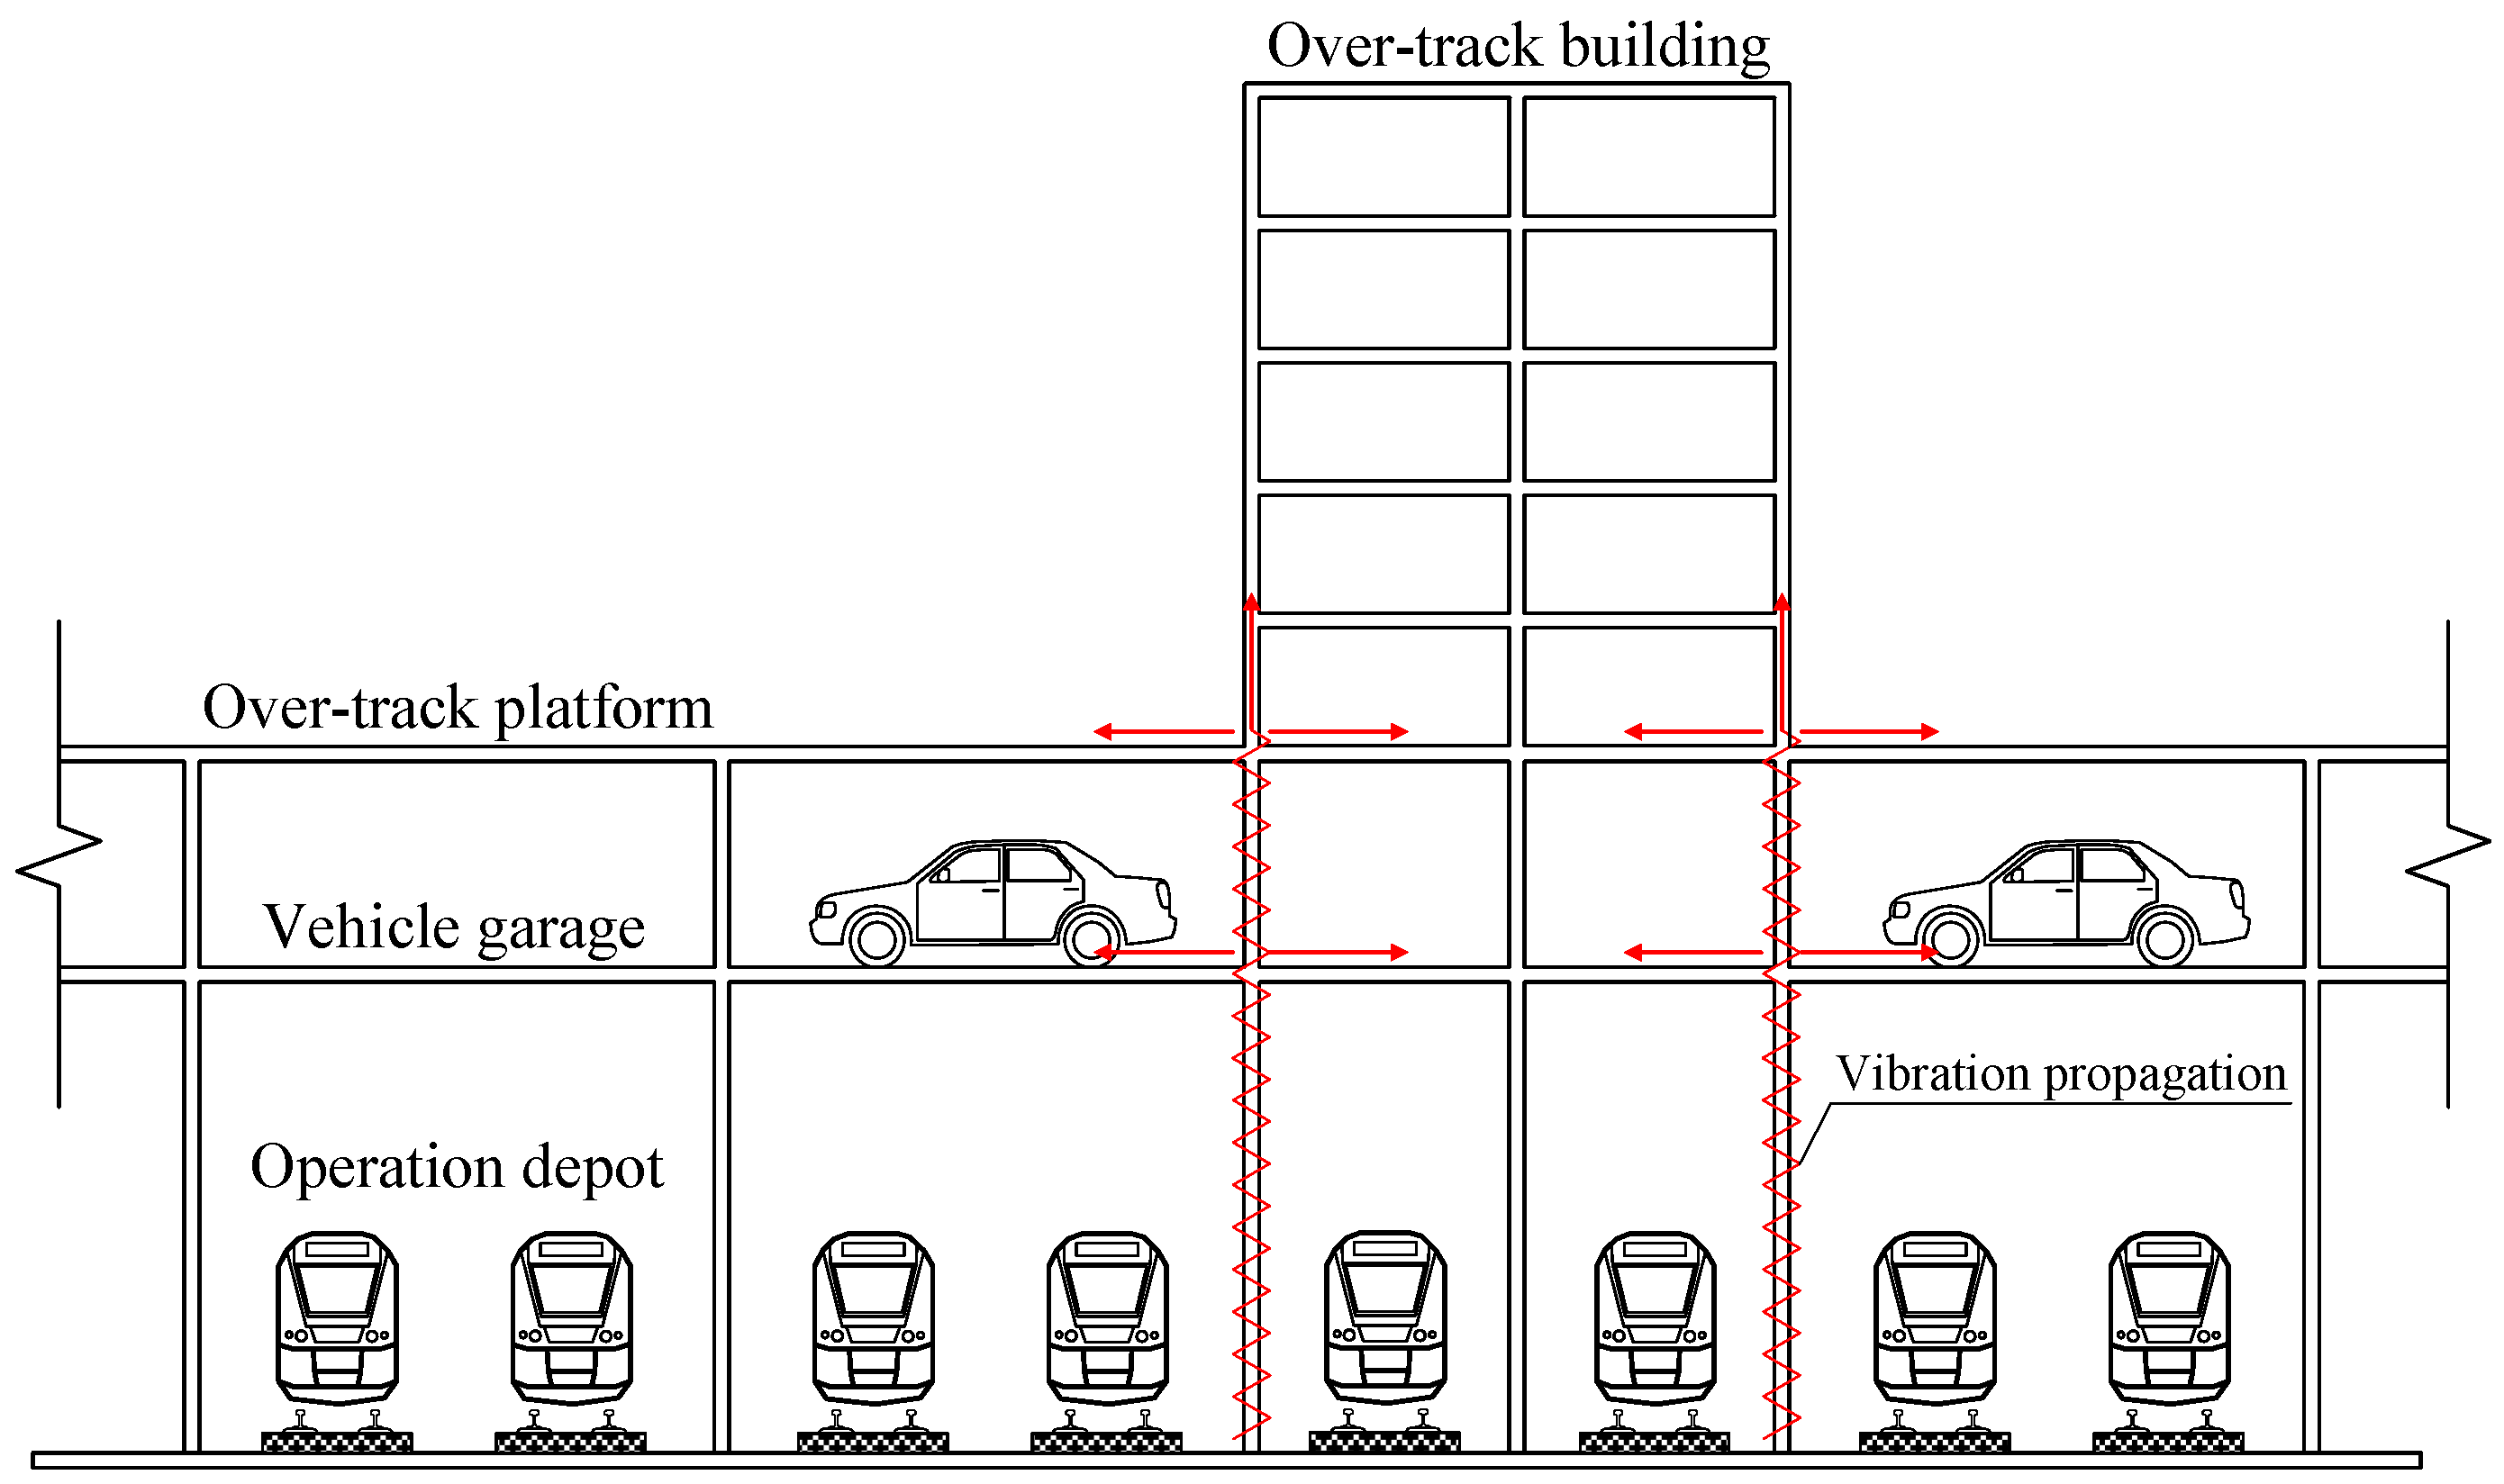
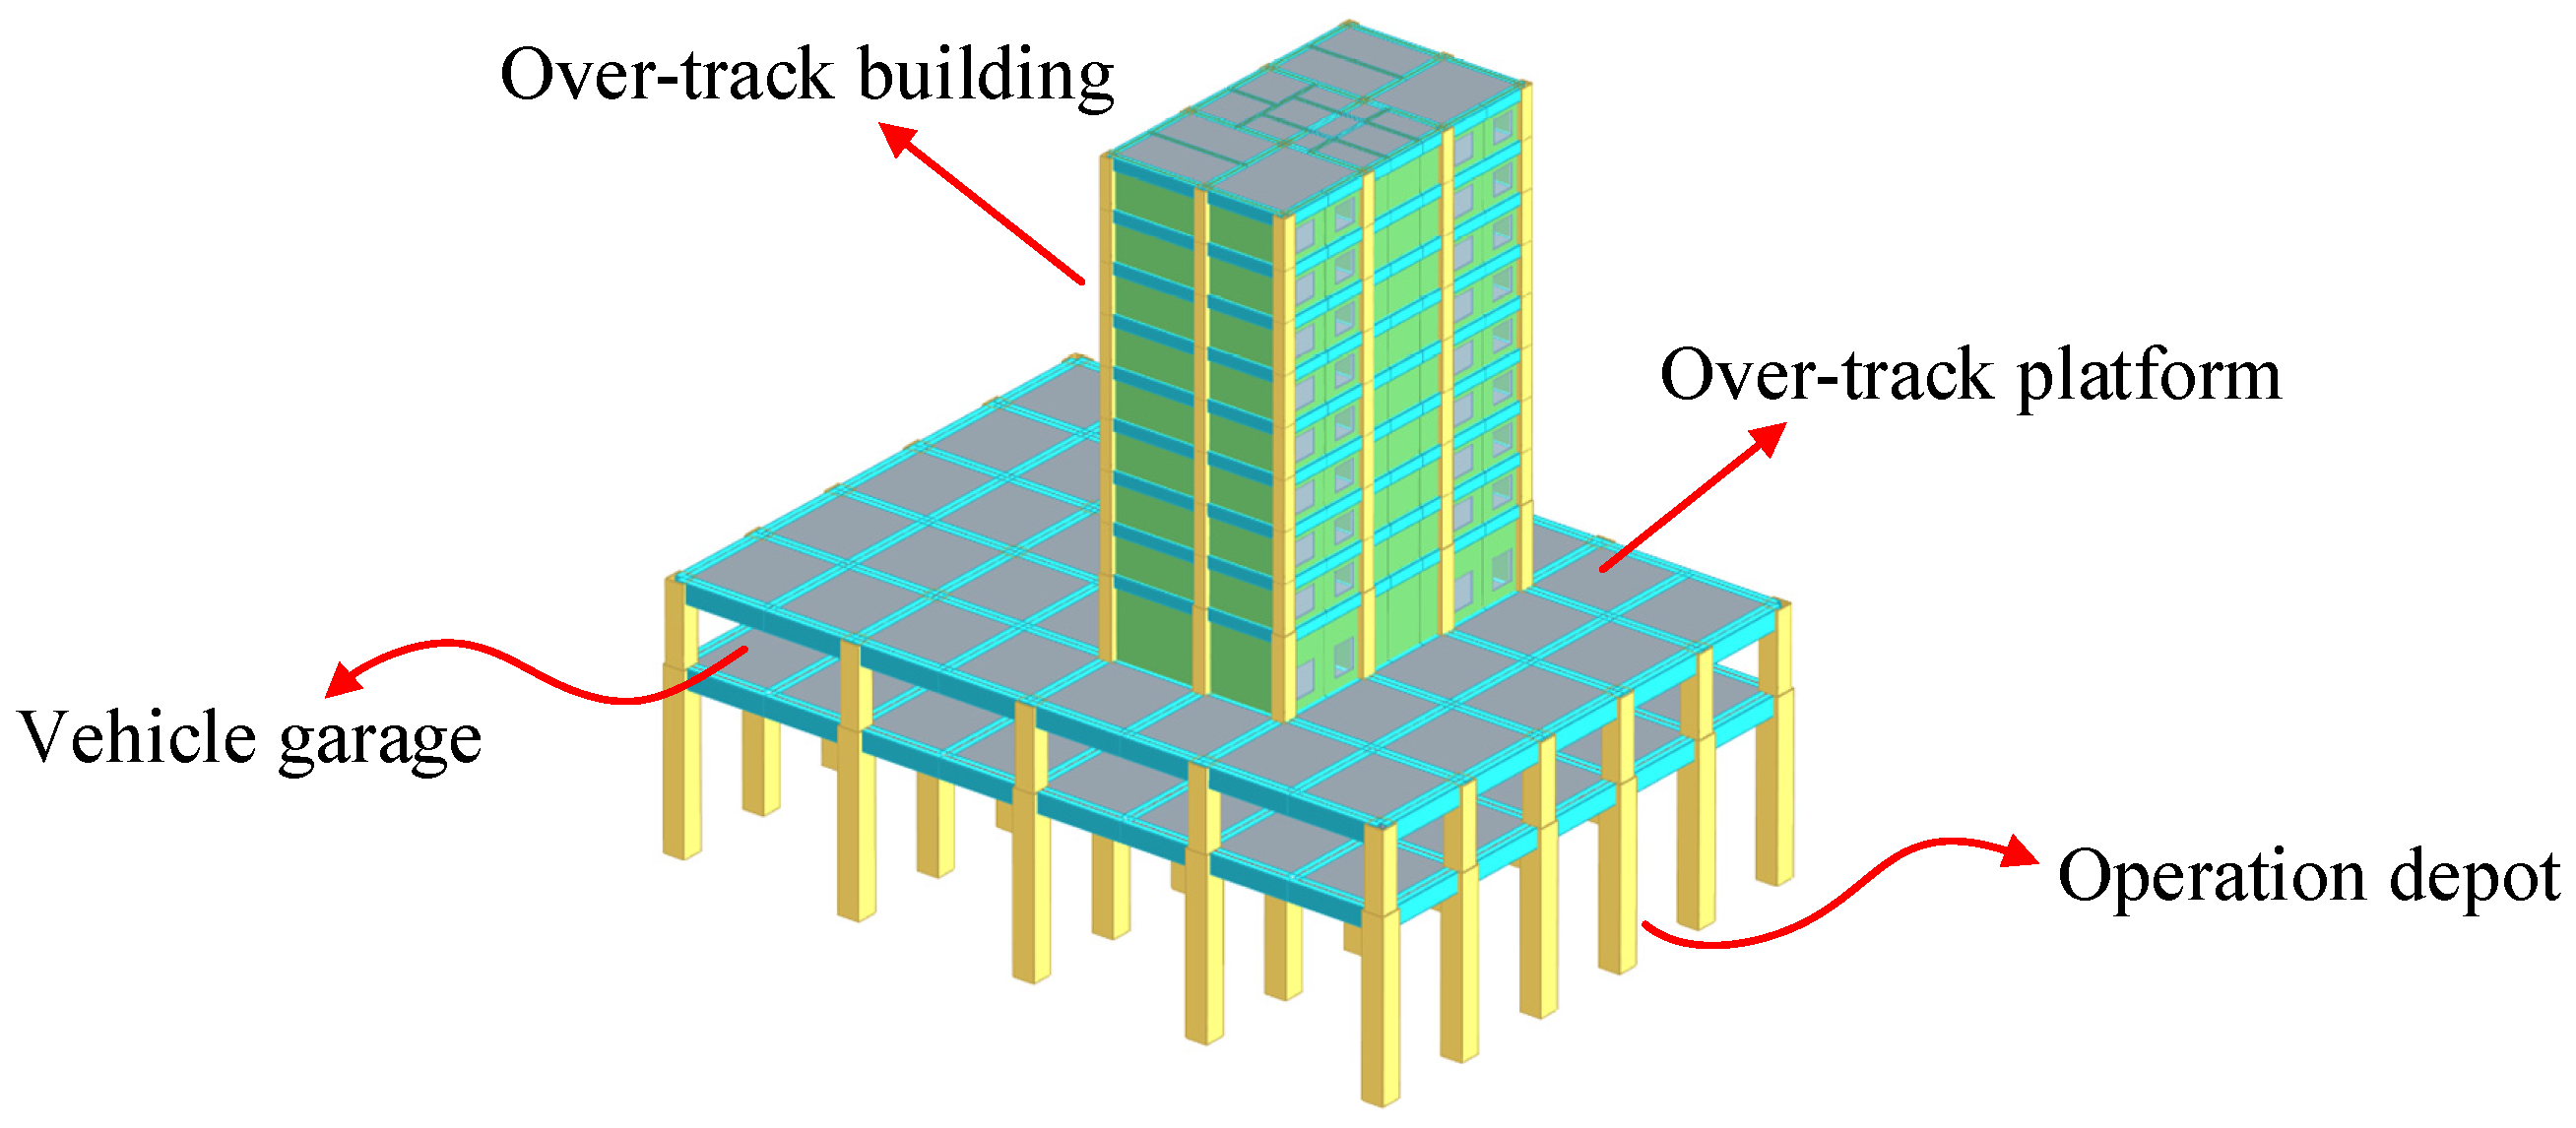
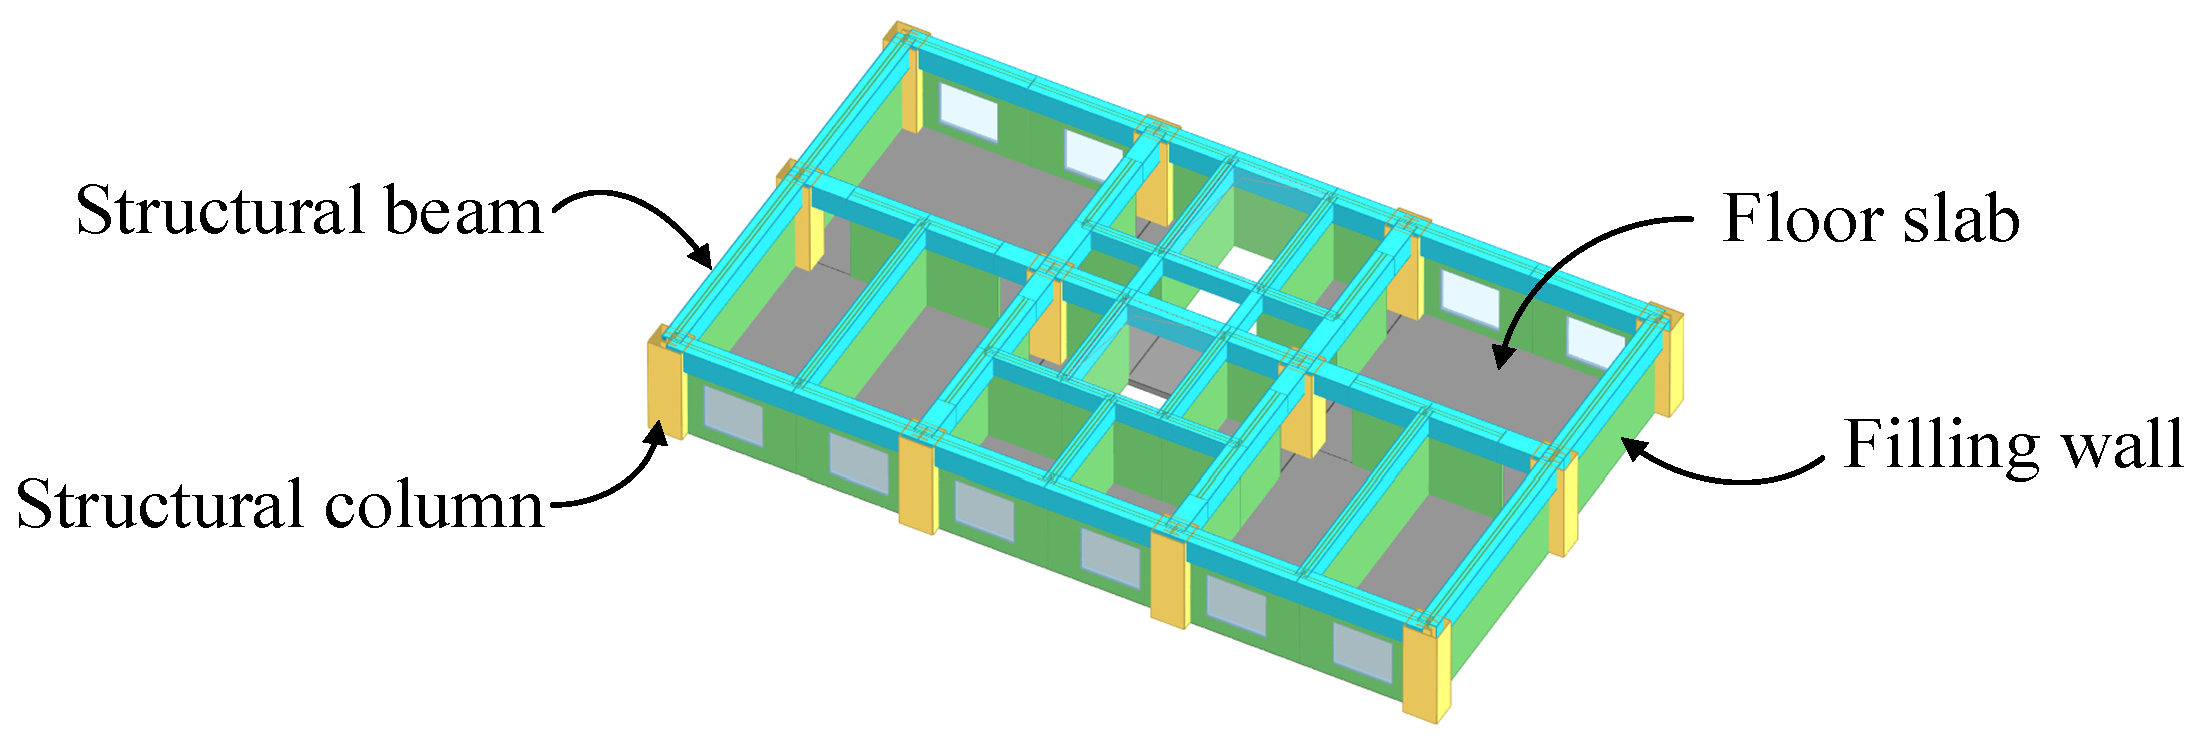
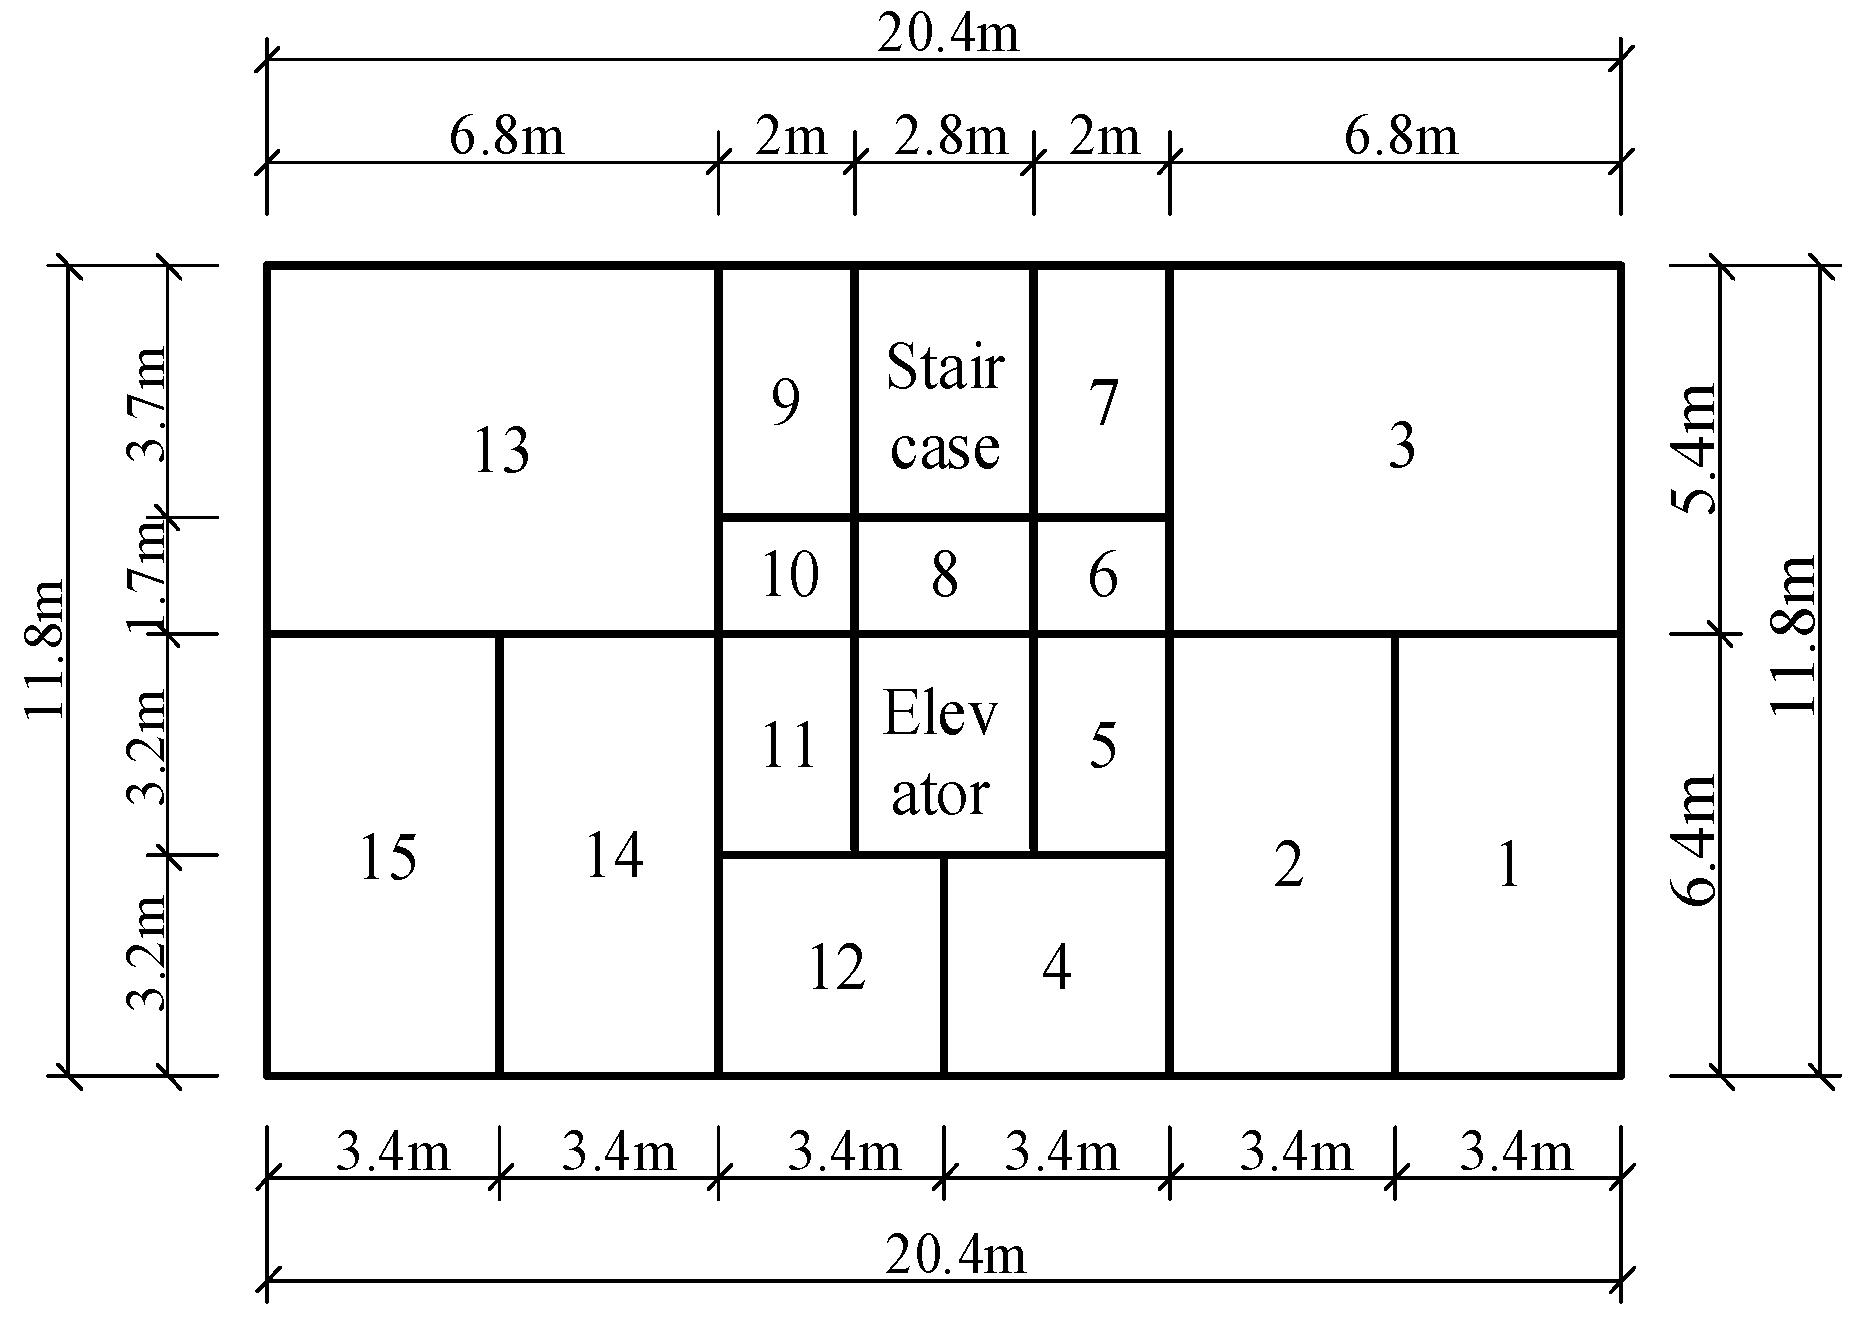
2.1. Over-Track Platform and Building of the Metro Depot
2.2. Track Structure
2.3. Soil Model
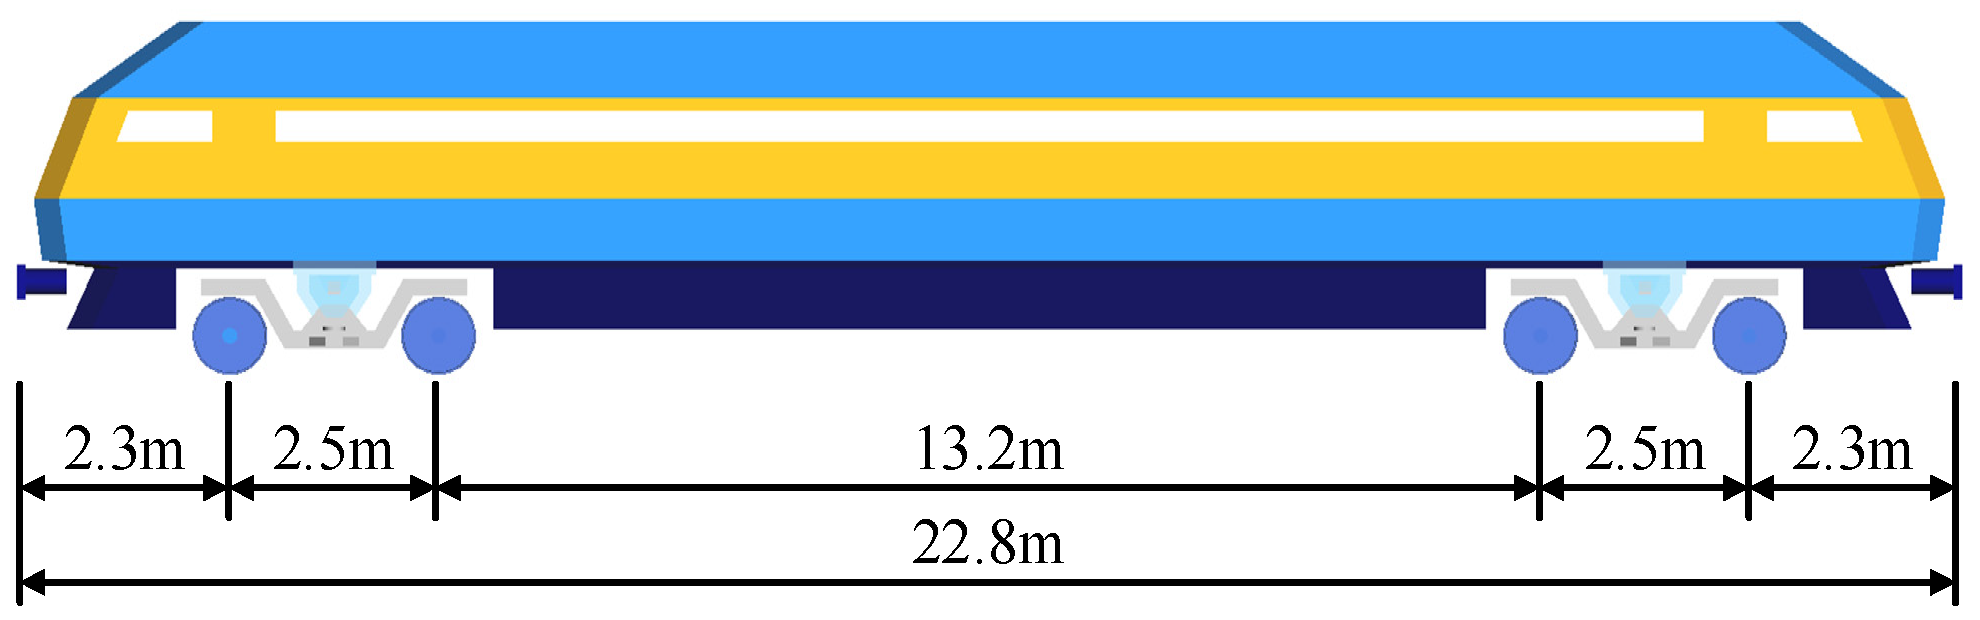
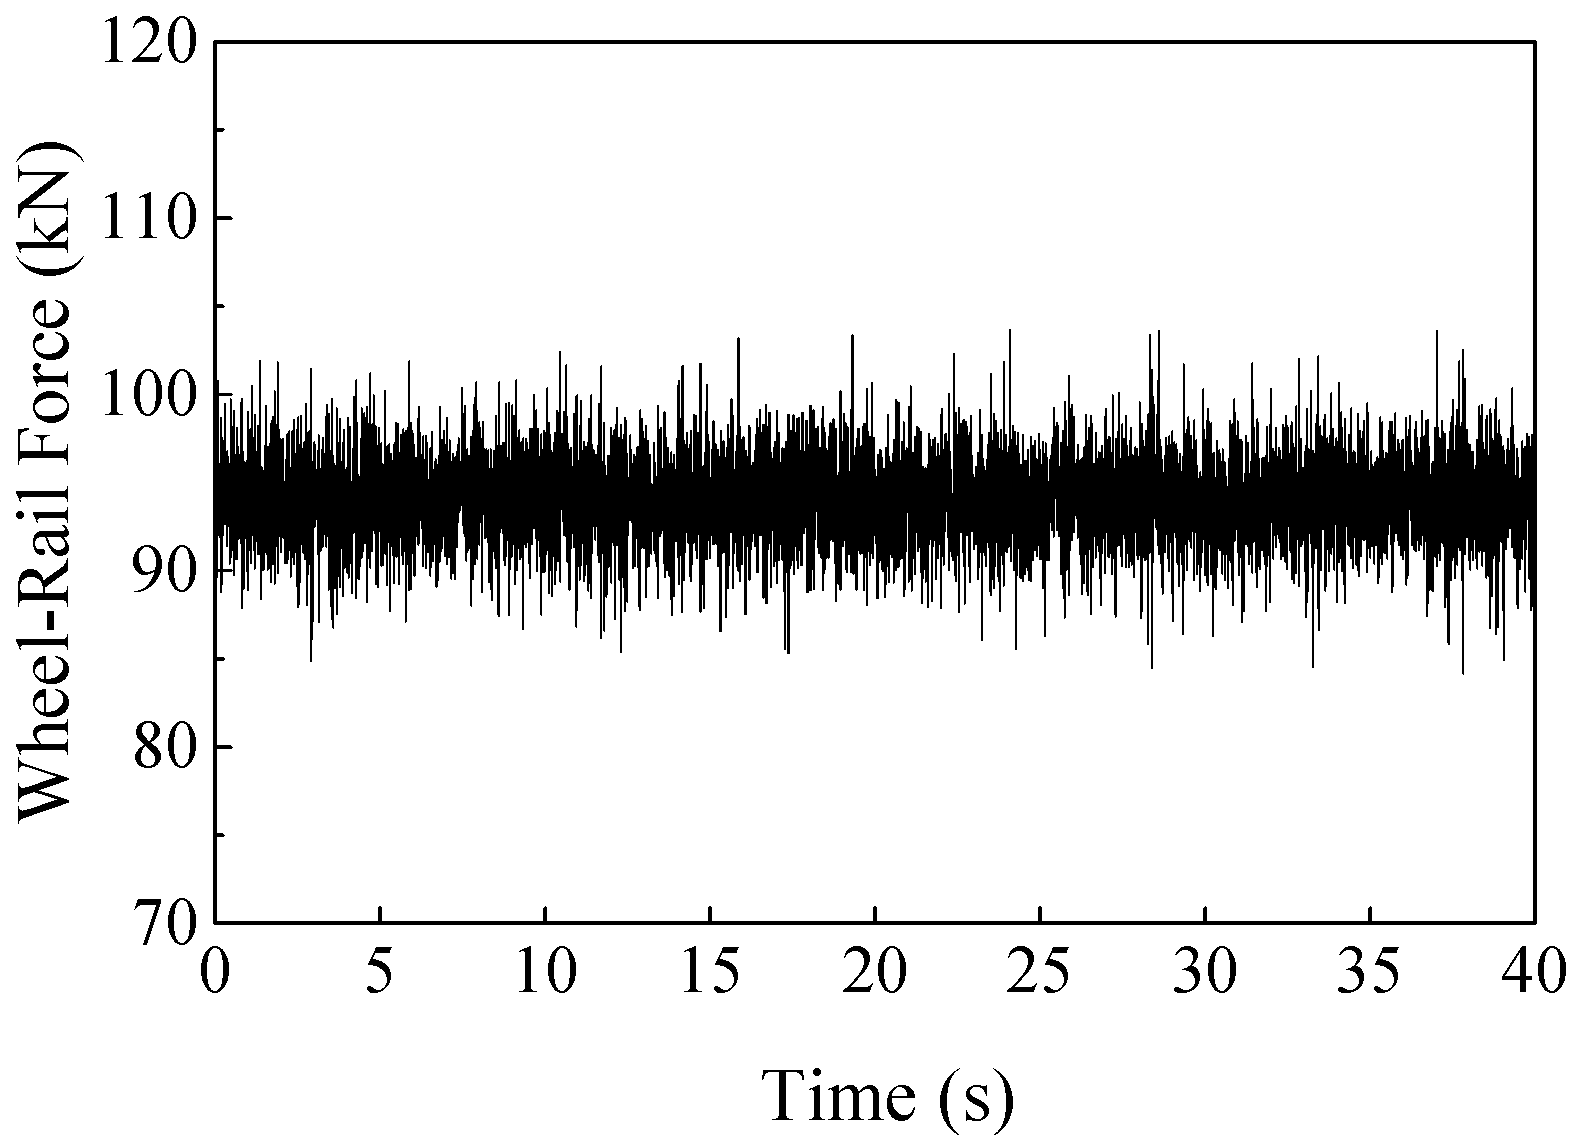
2.4. Train Model
3. Propagation Law of Train-Induced Vibration in Metro Depot
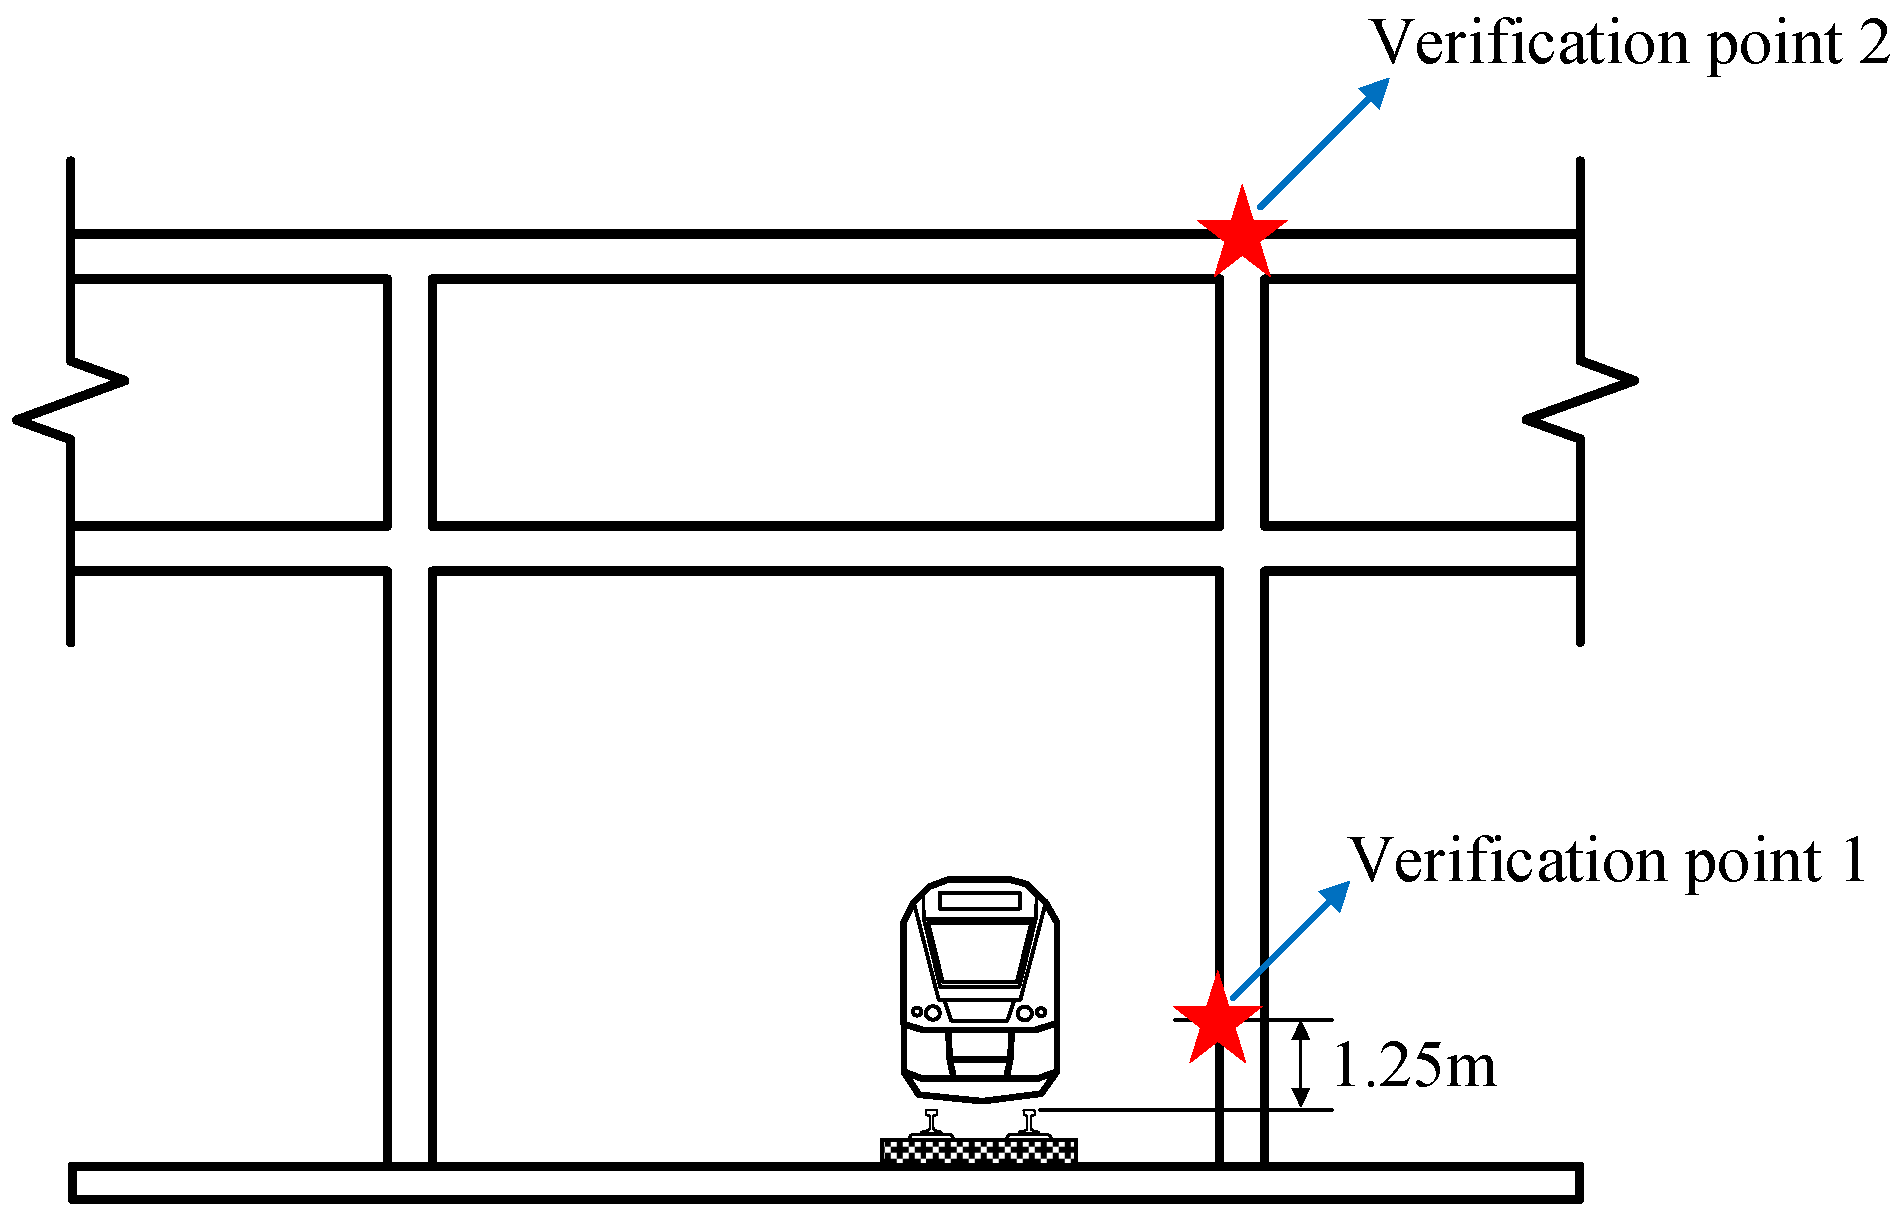
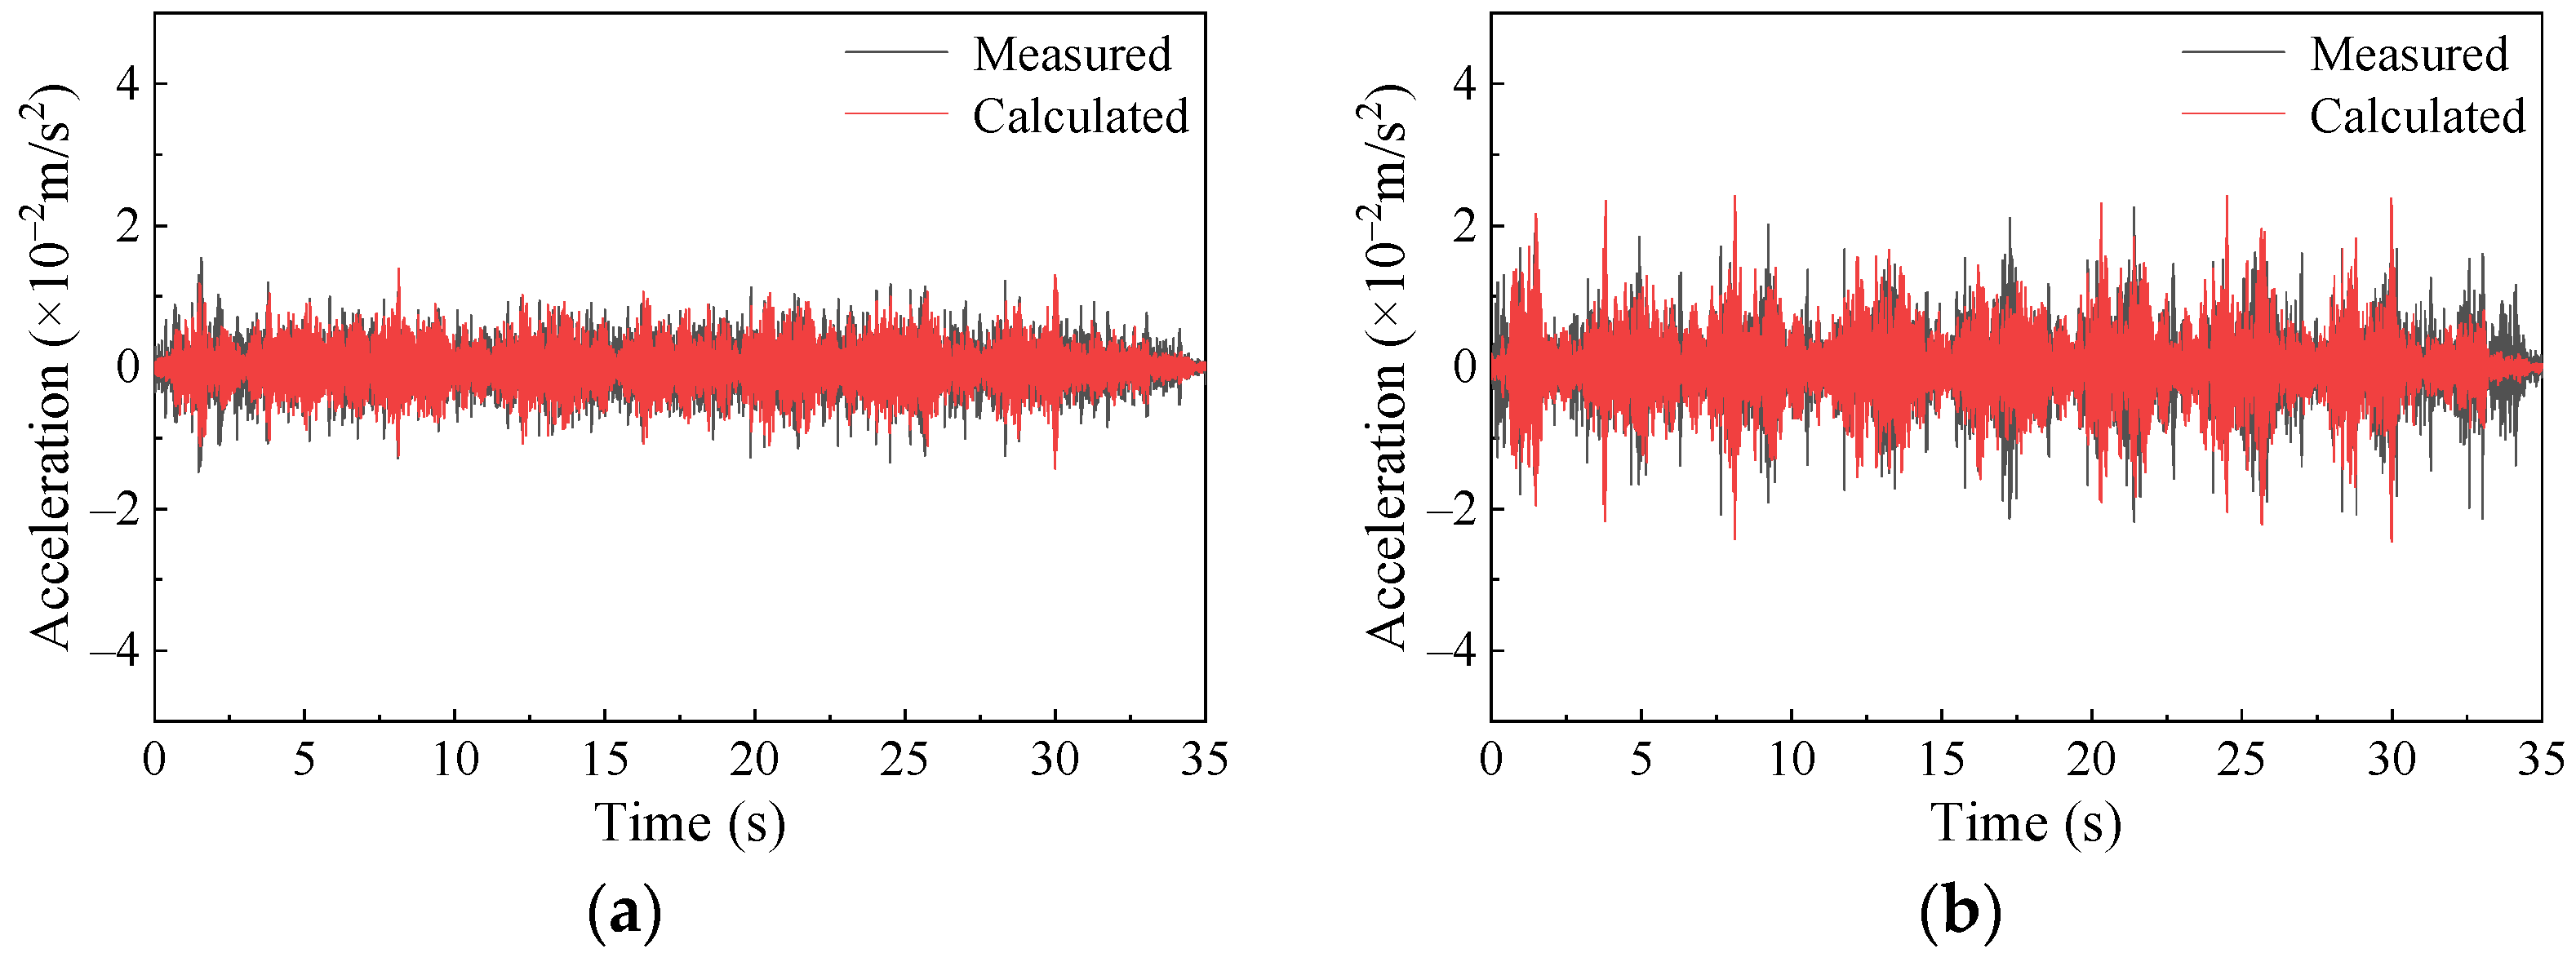
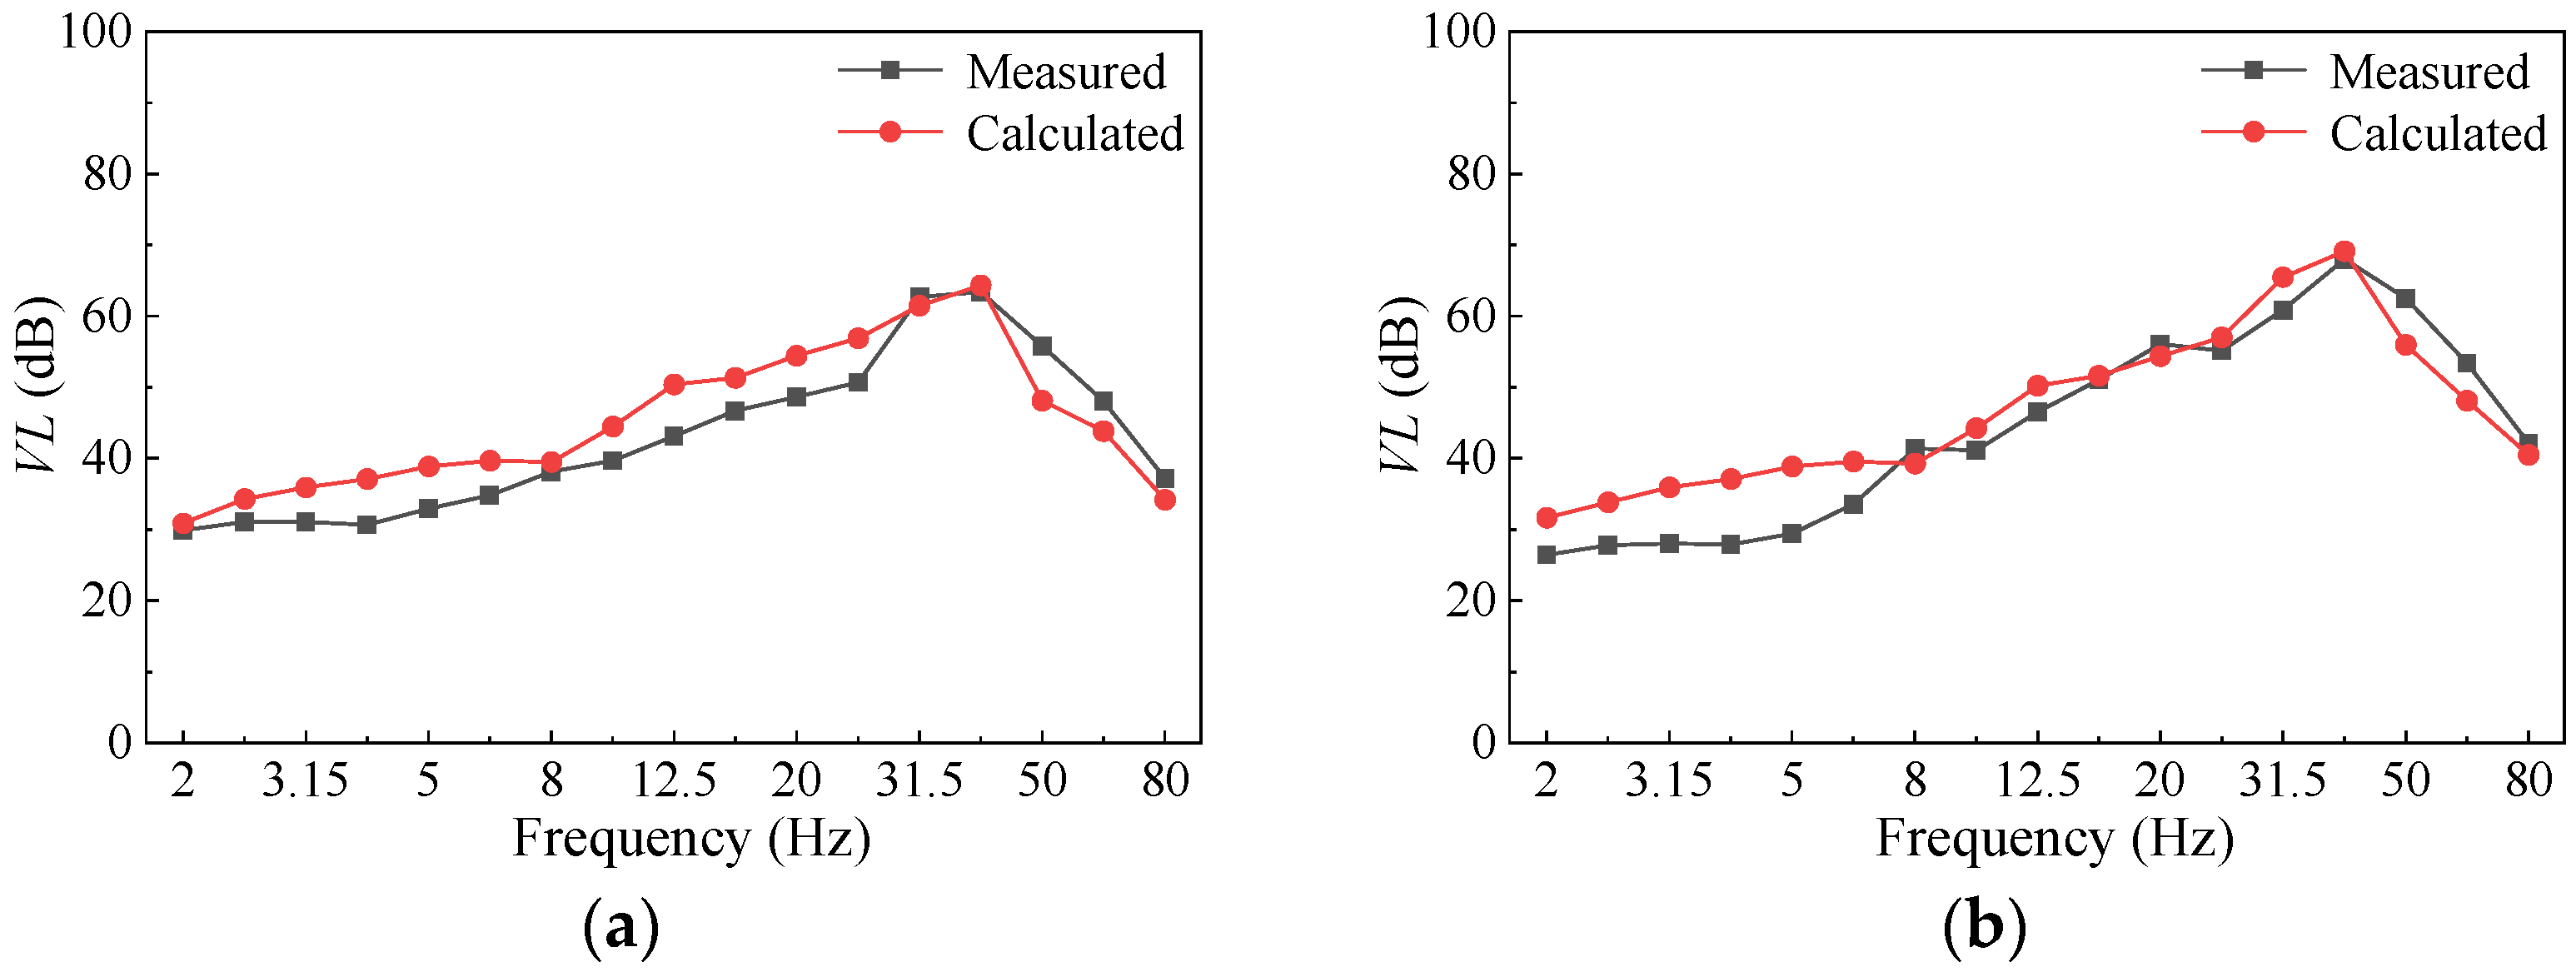
3.1. Verification of Model Calculation Accuracy
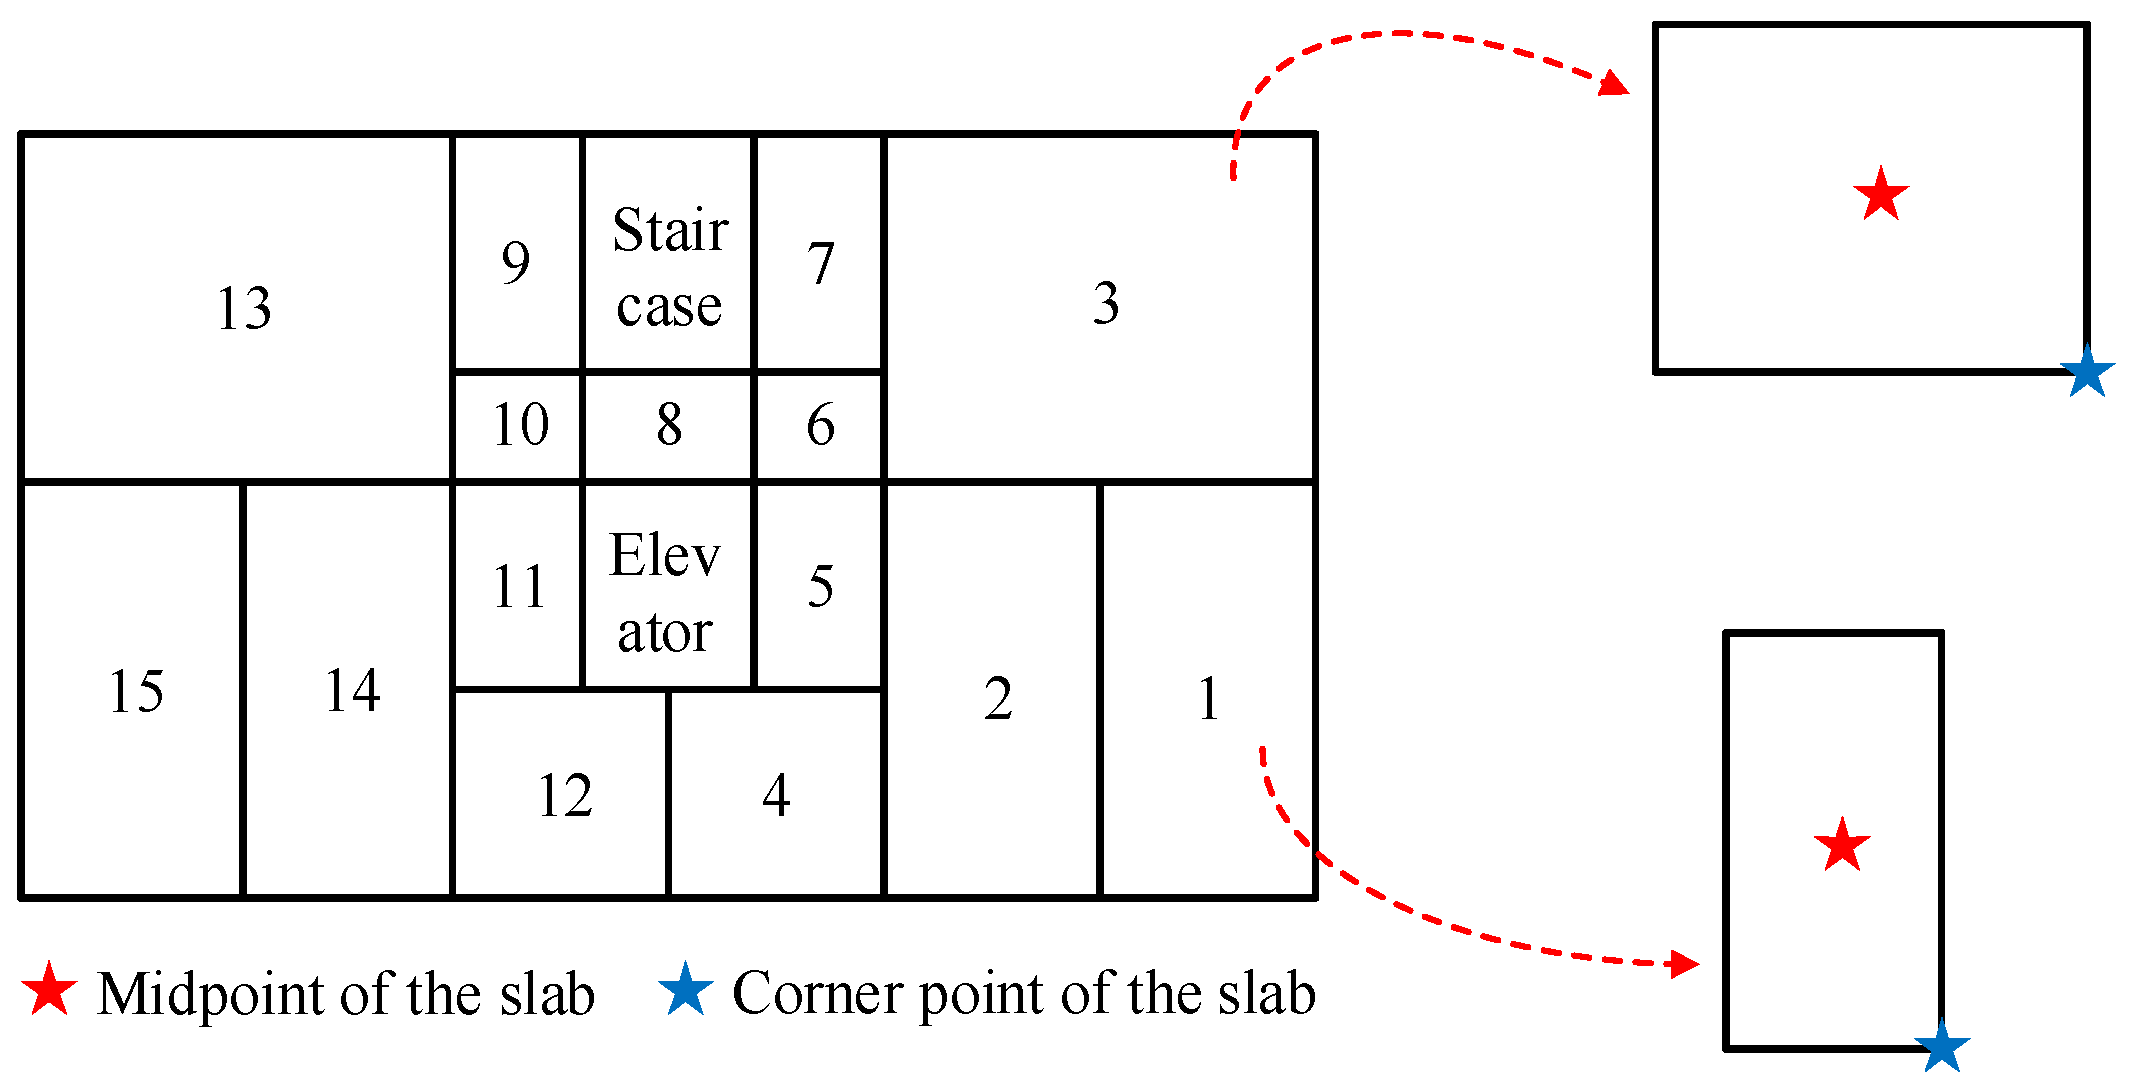
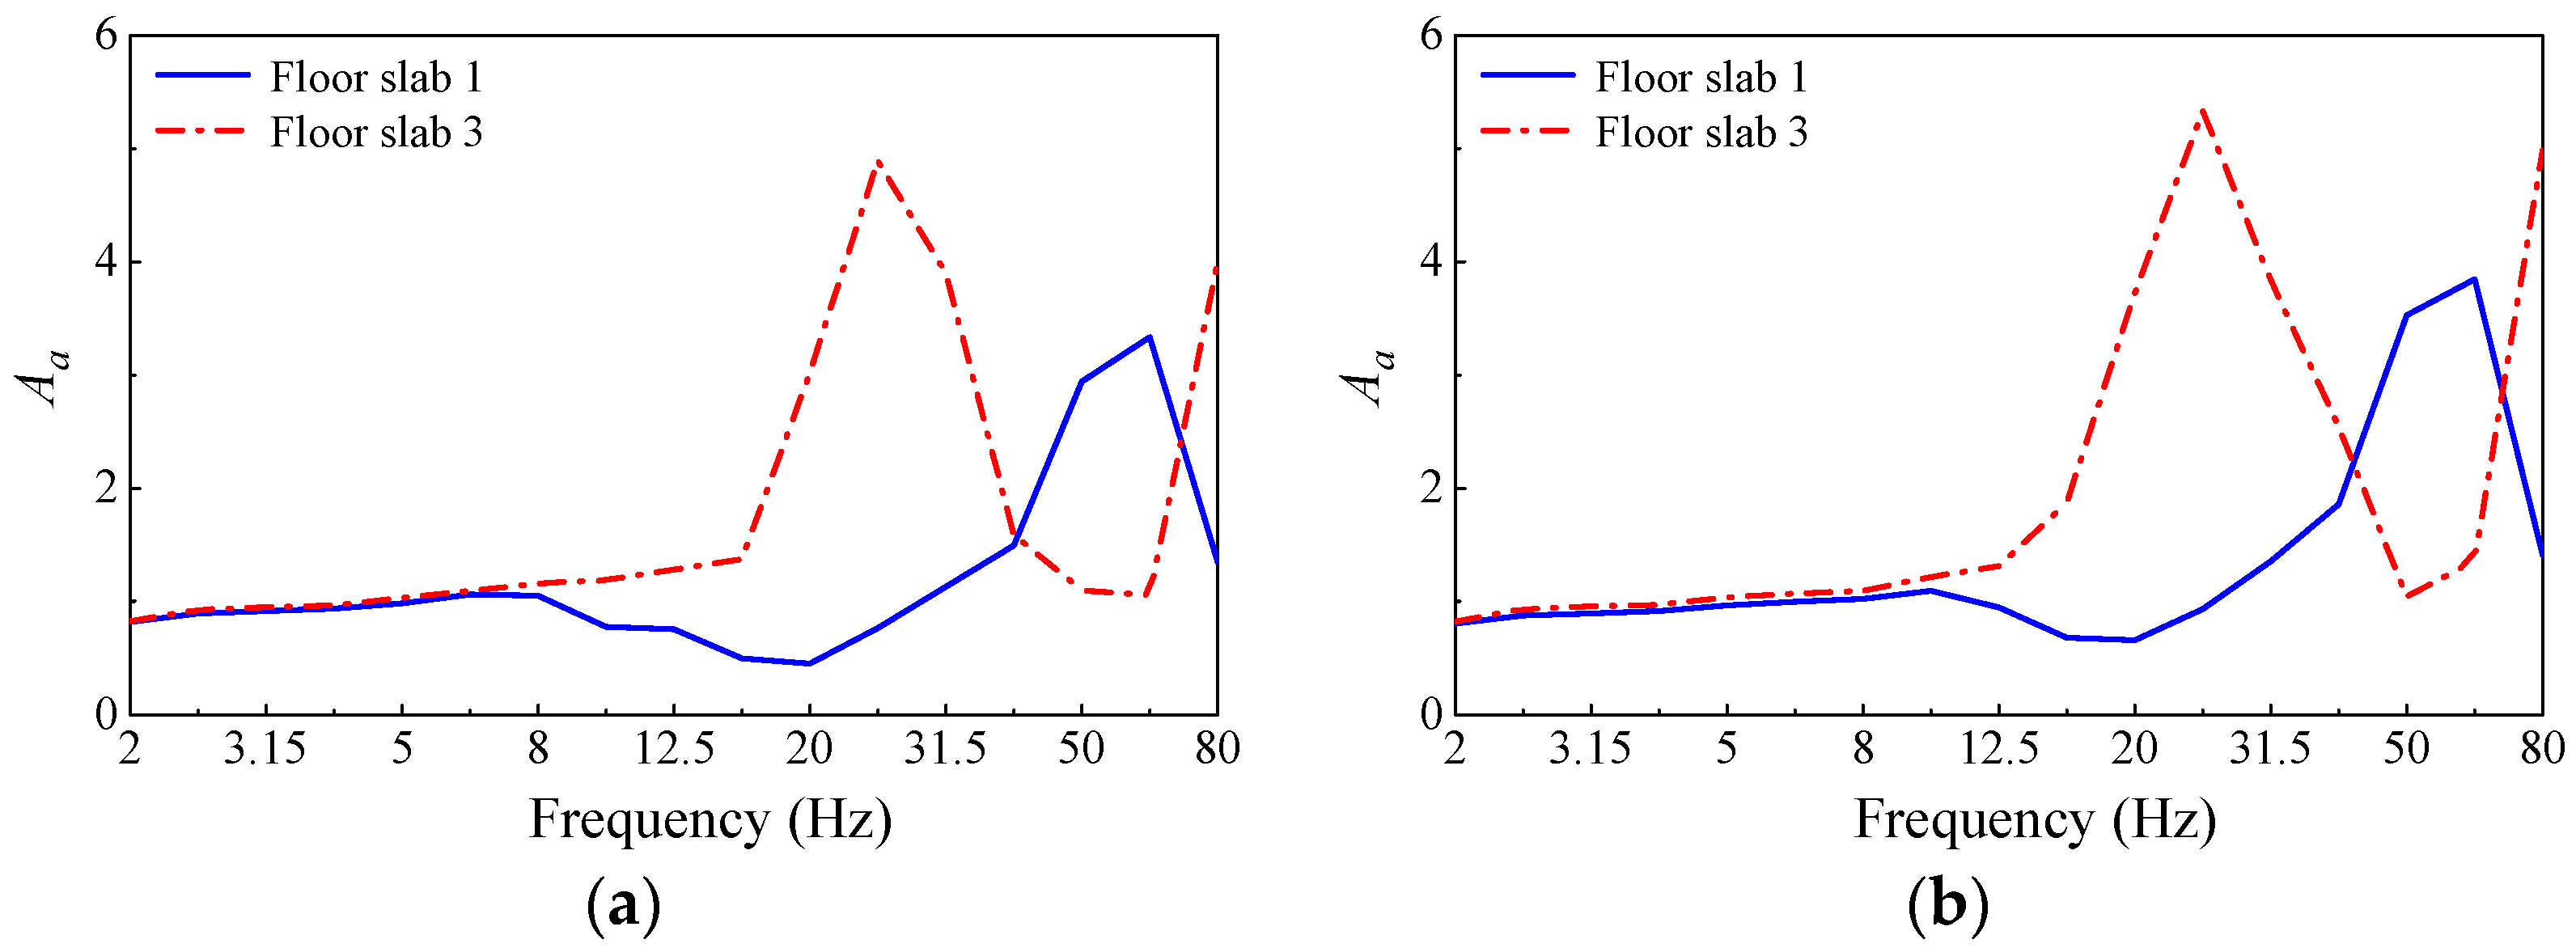
3.2. Vibration Response Analysis of the Floor in the Over-Track Building
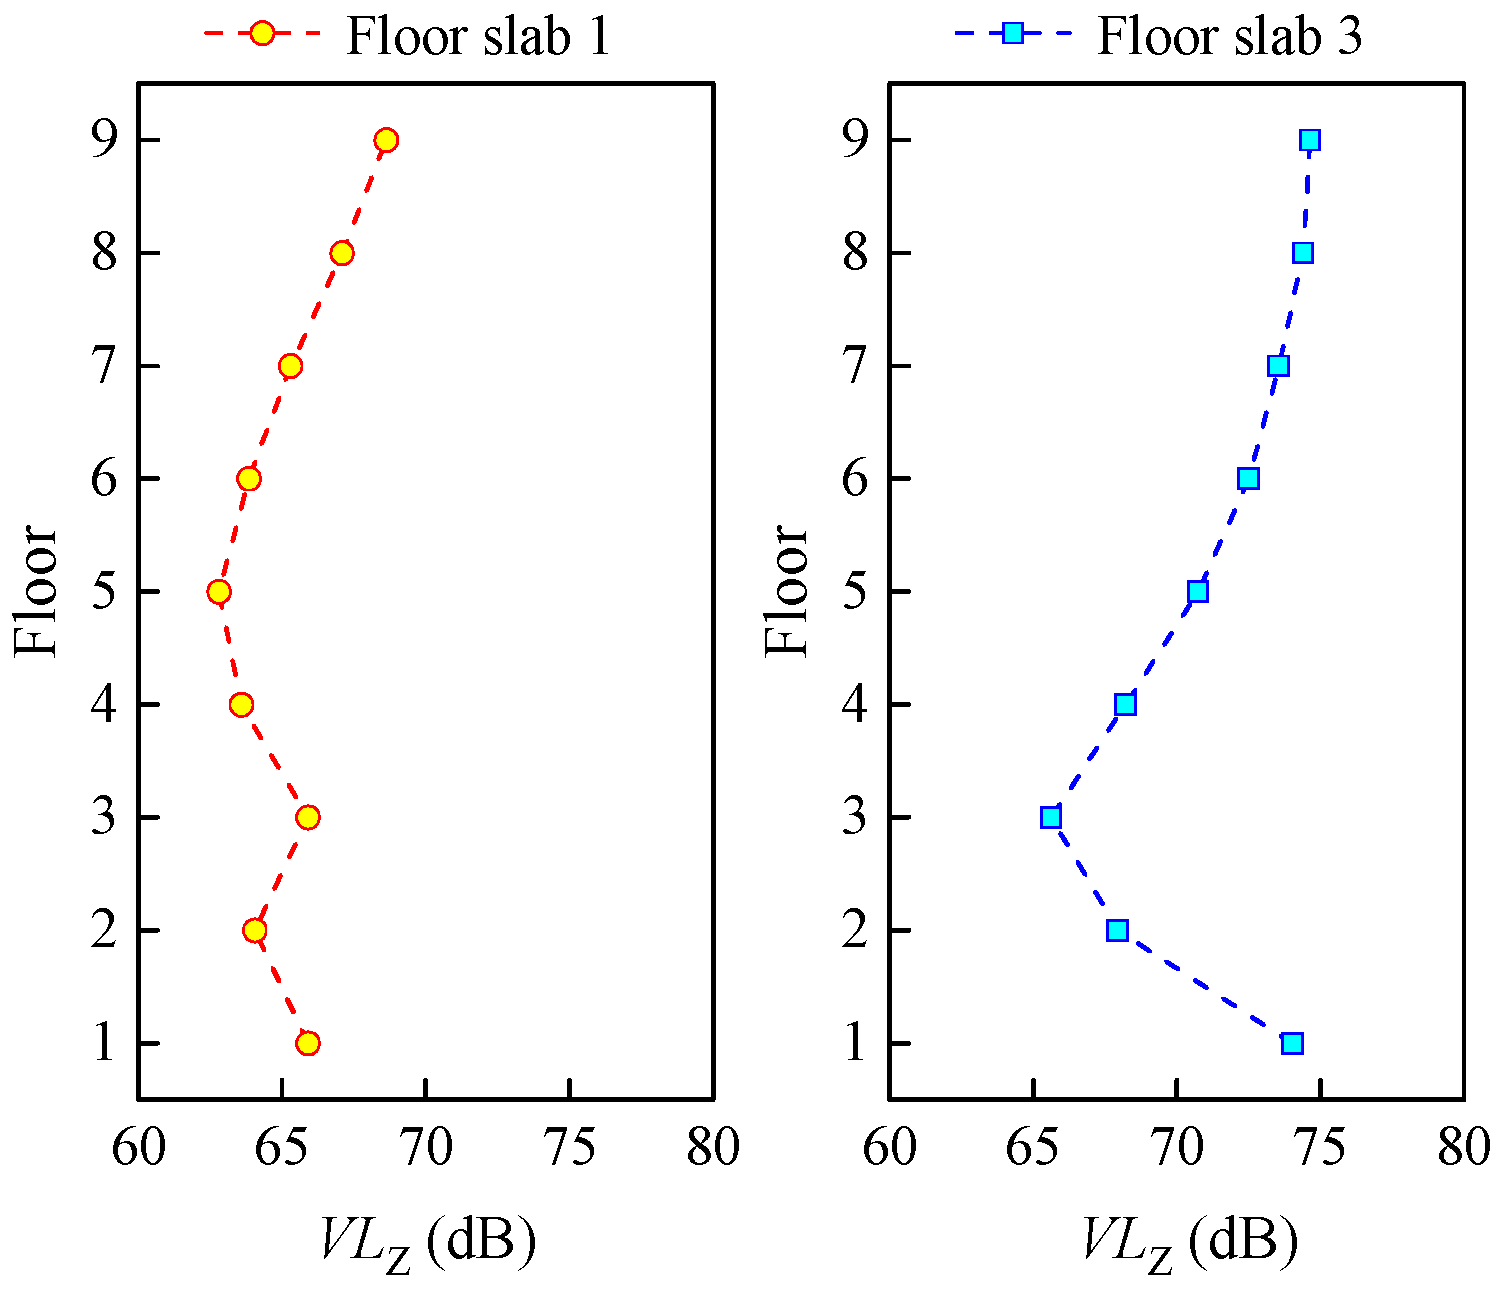
3.3. Vibration Assessment of the Over-Track Building
4. Study on Vibration Isolation Trench Measures for Depot
4.1. The Effect of Open Trench Depth on Vibration Isolation
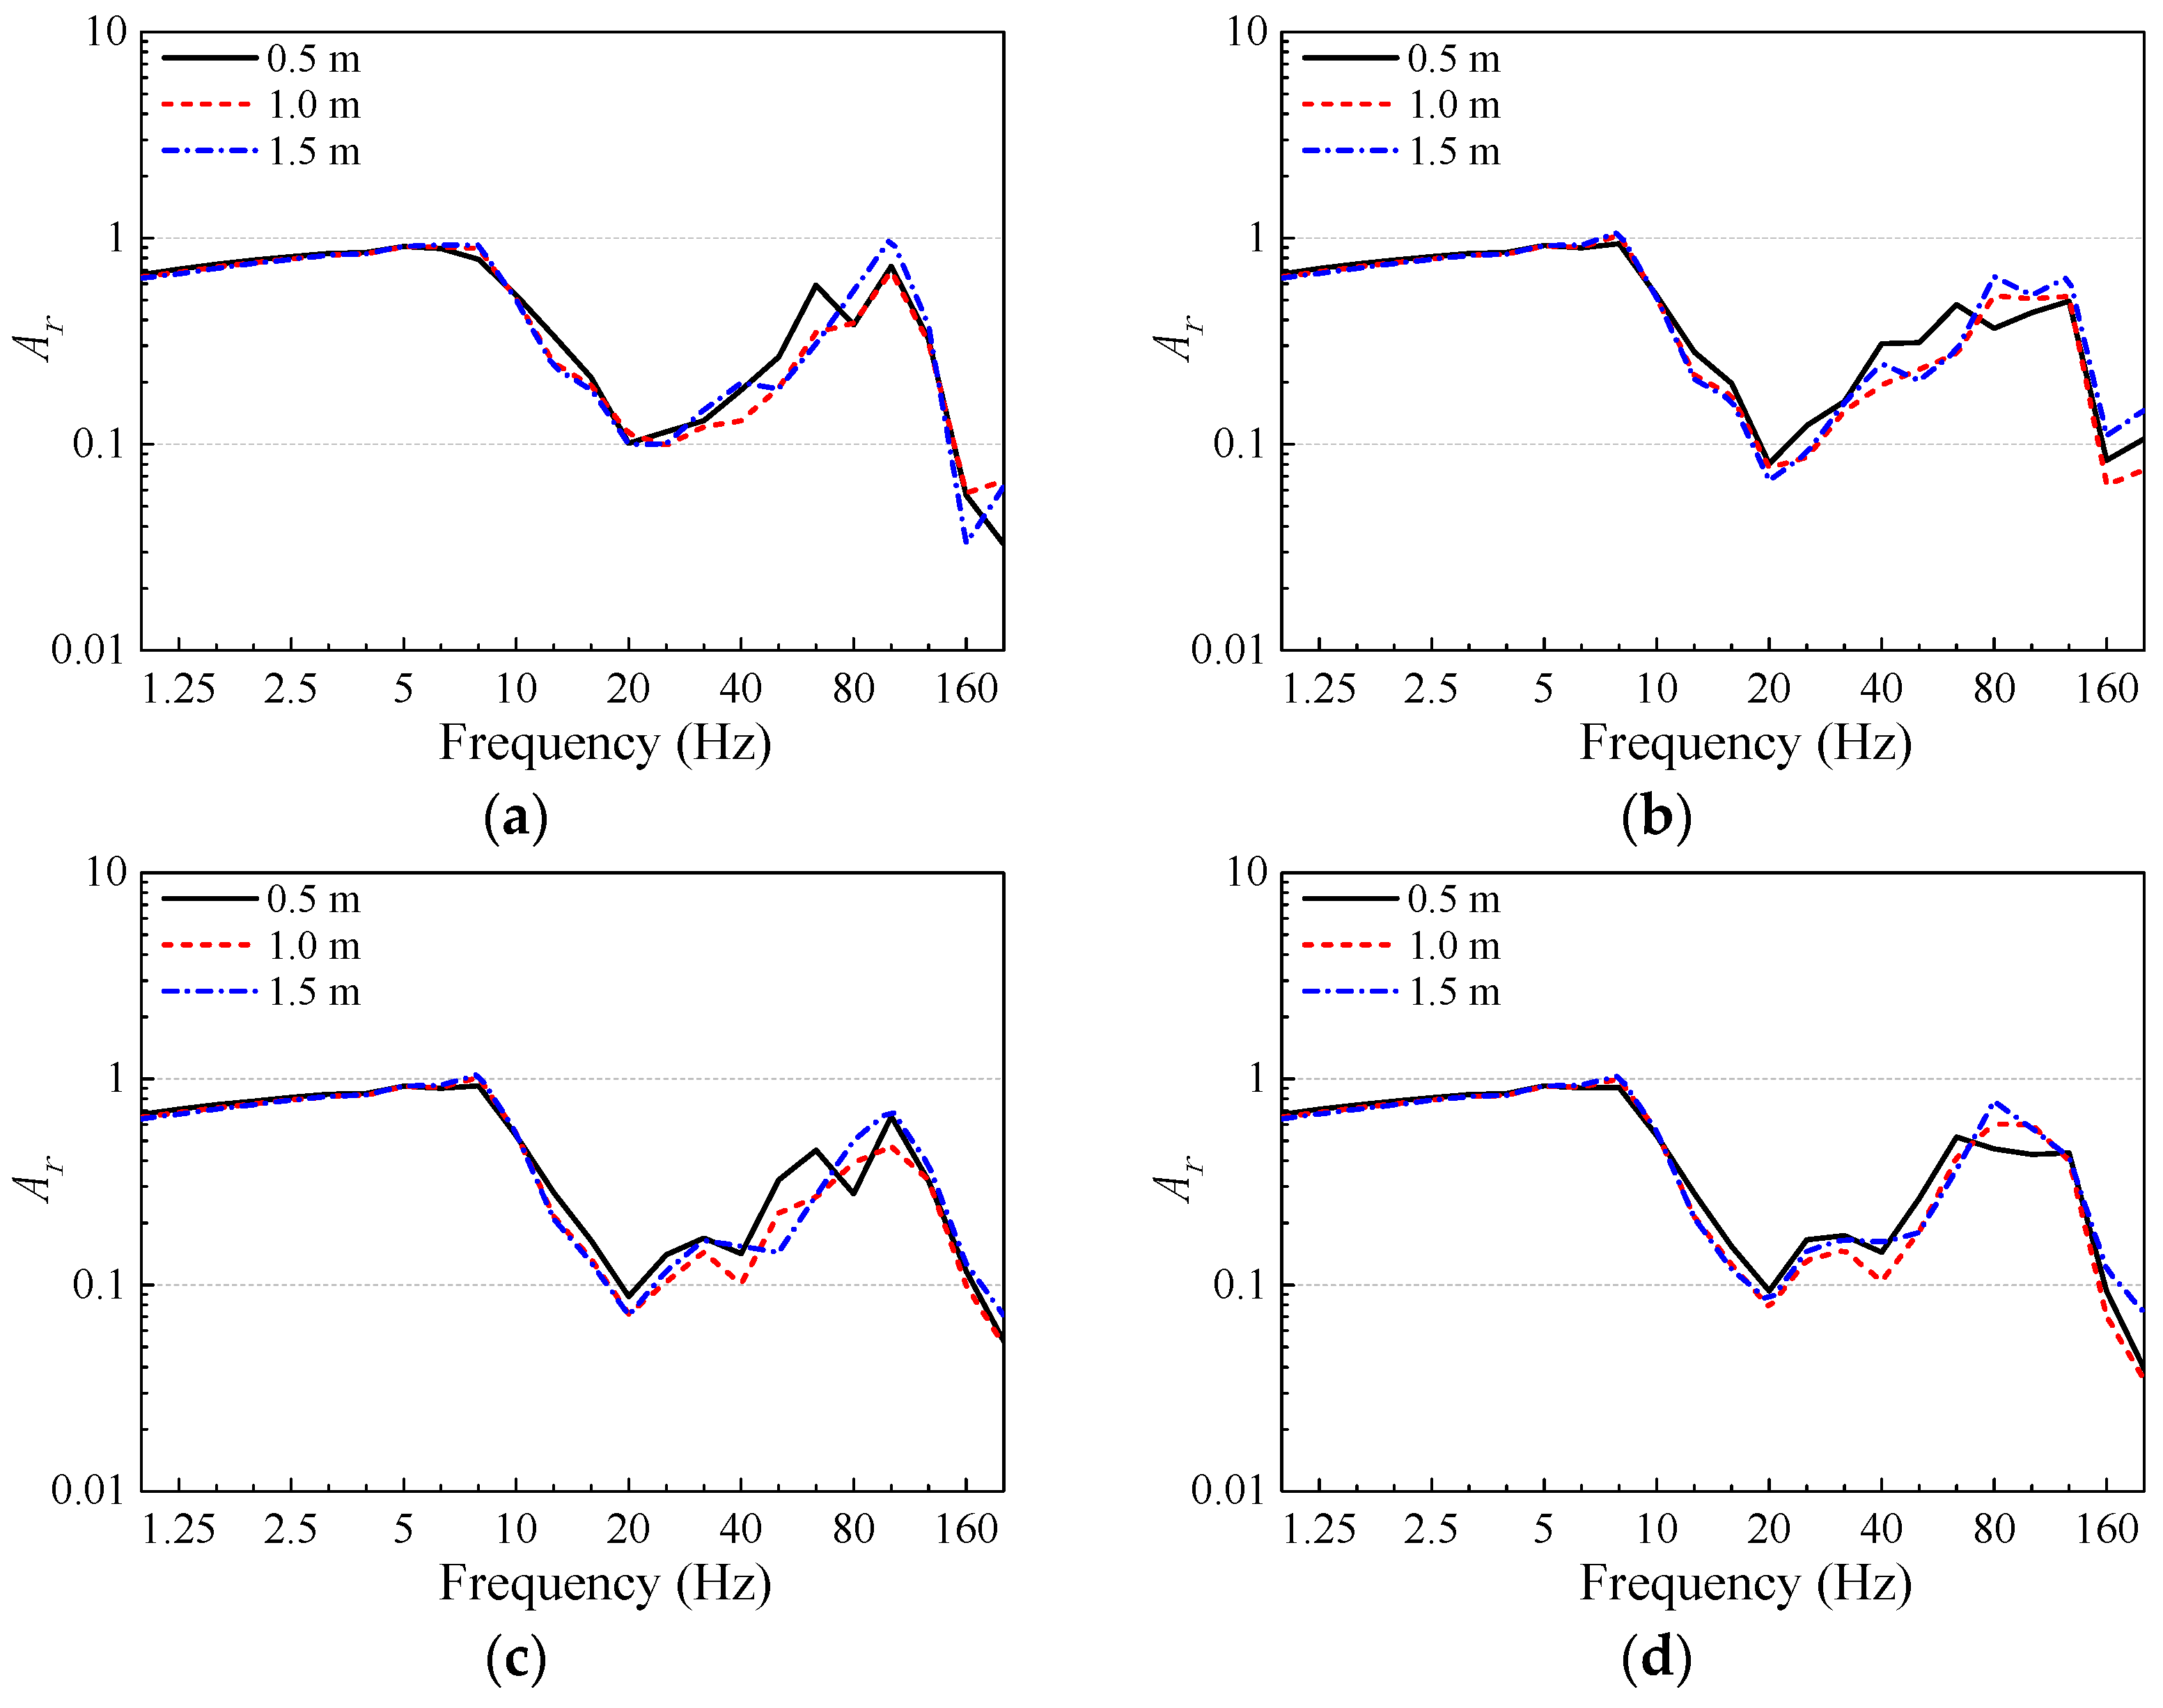
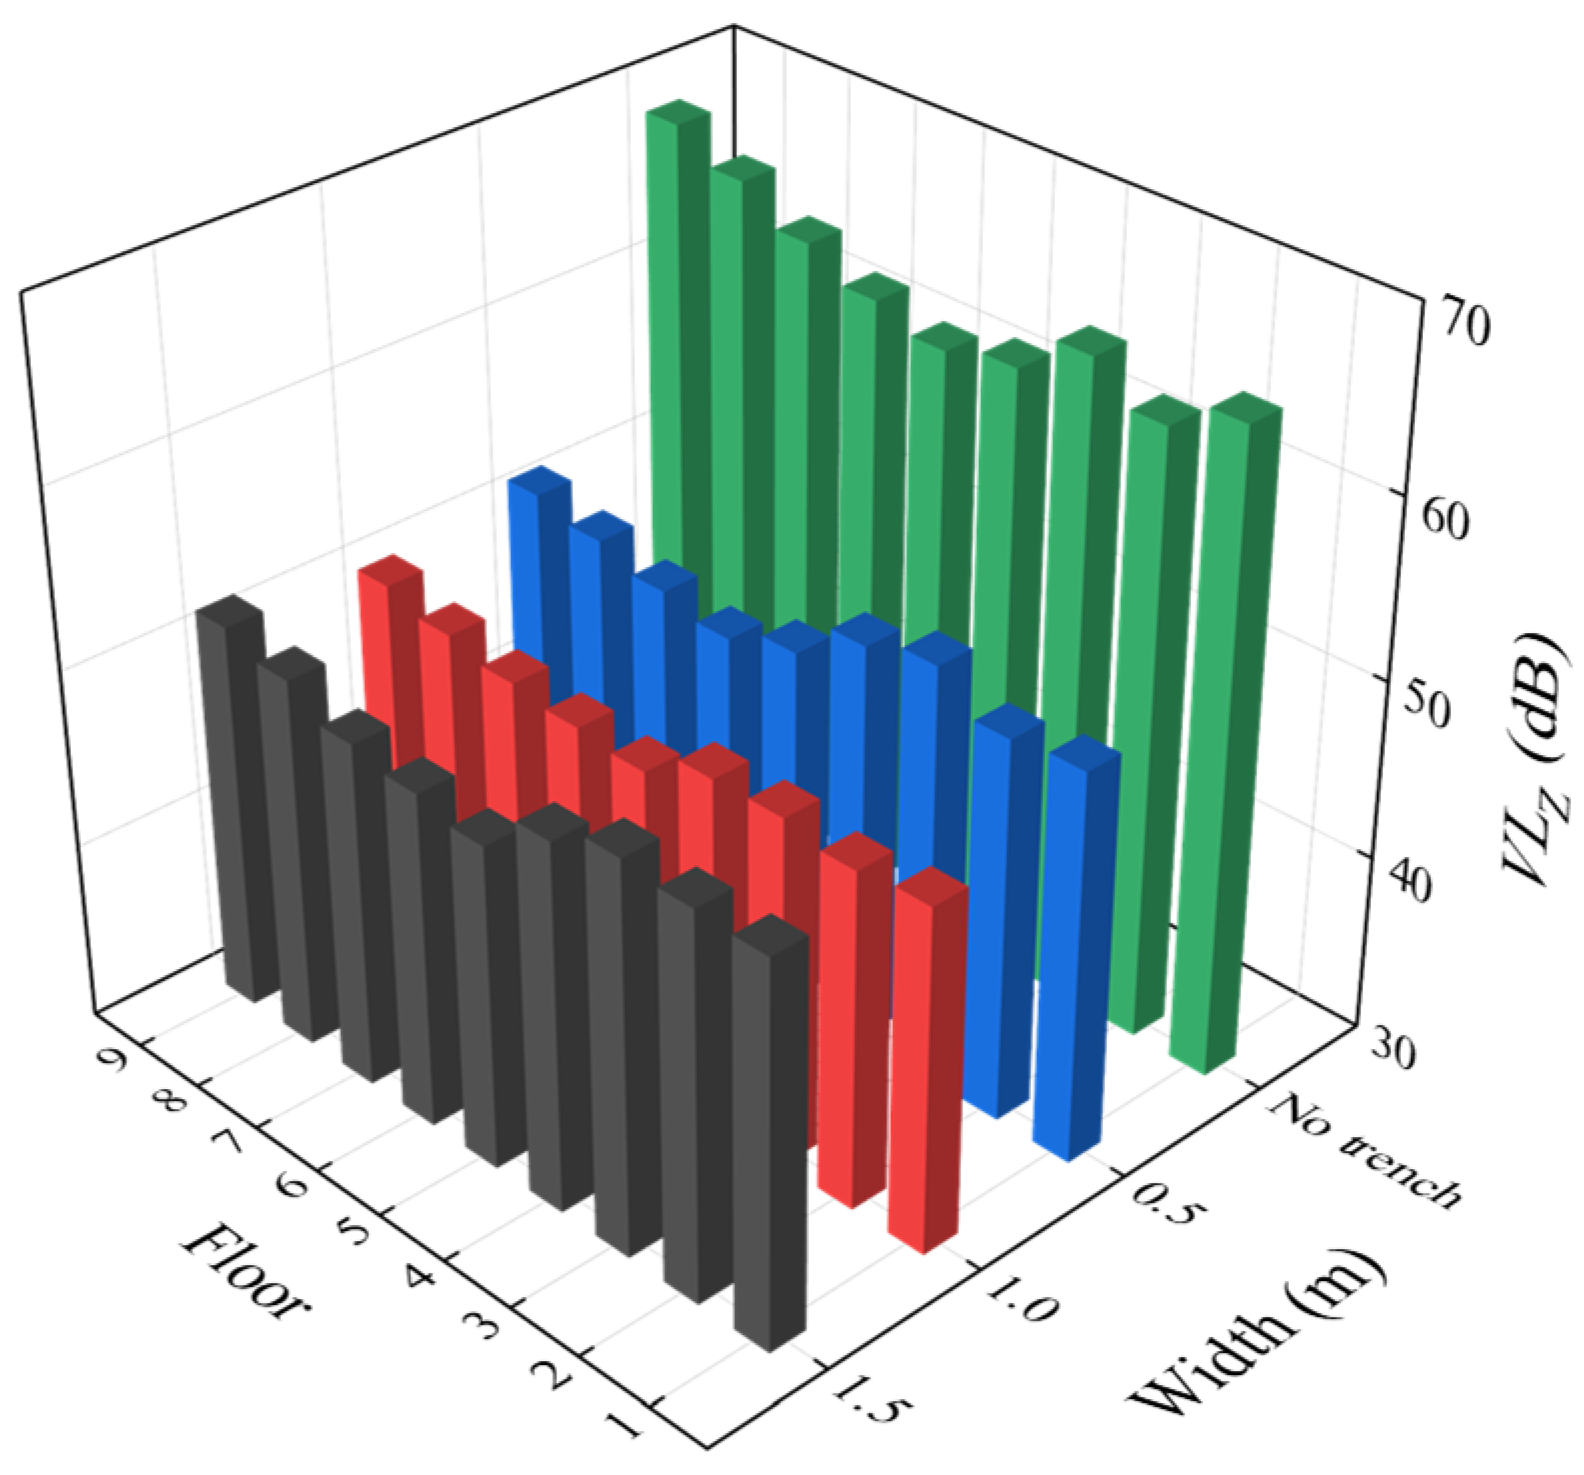
4.2. The Effect of Open Trench Width on Vibration Isolation
4.3. The Effect of Open Trench Position on Vibration Isolation
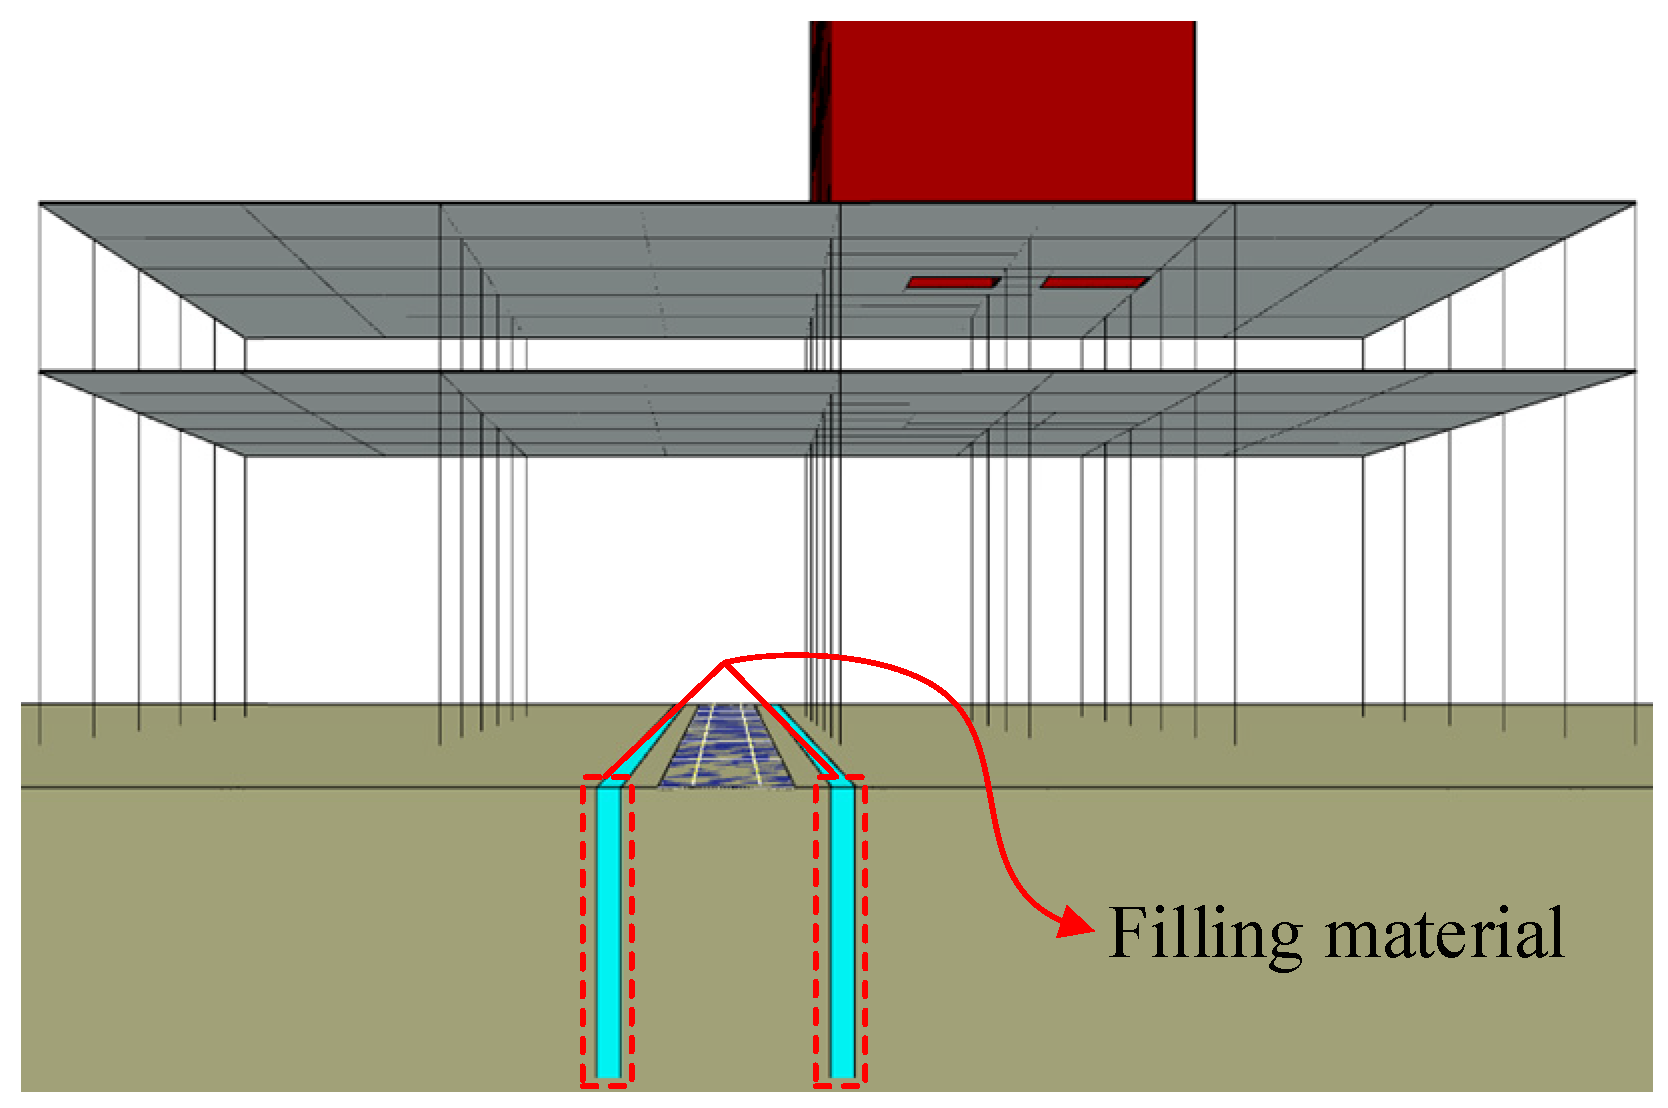
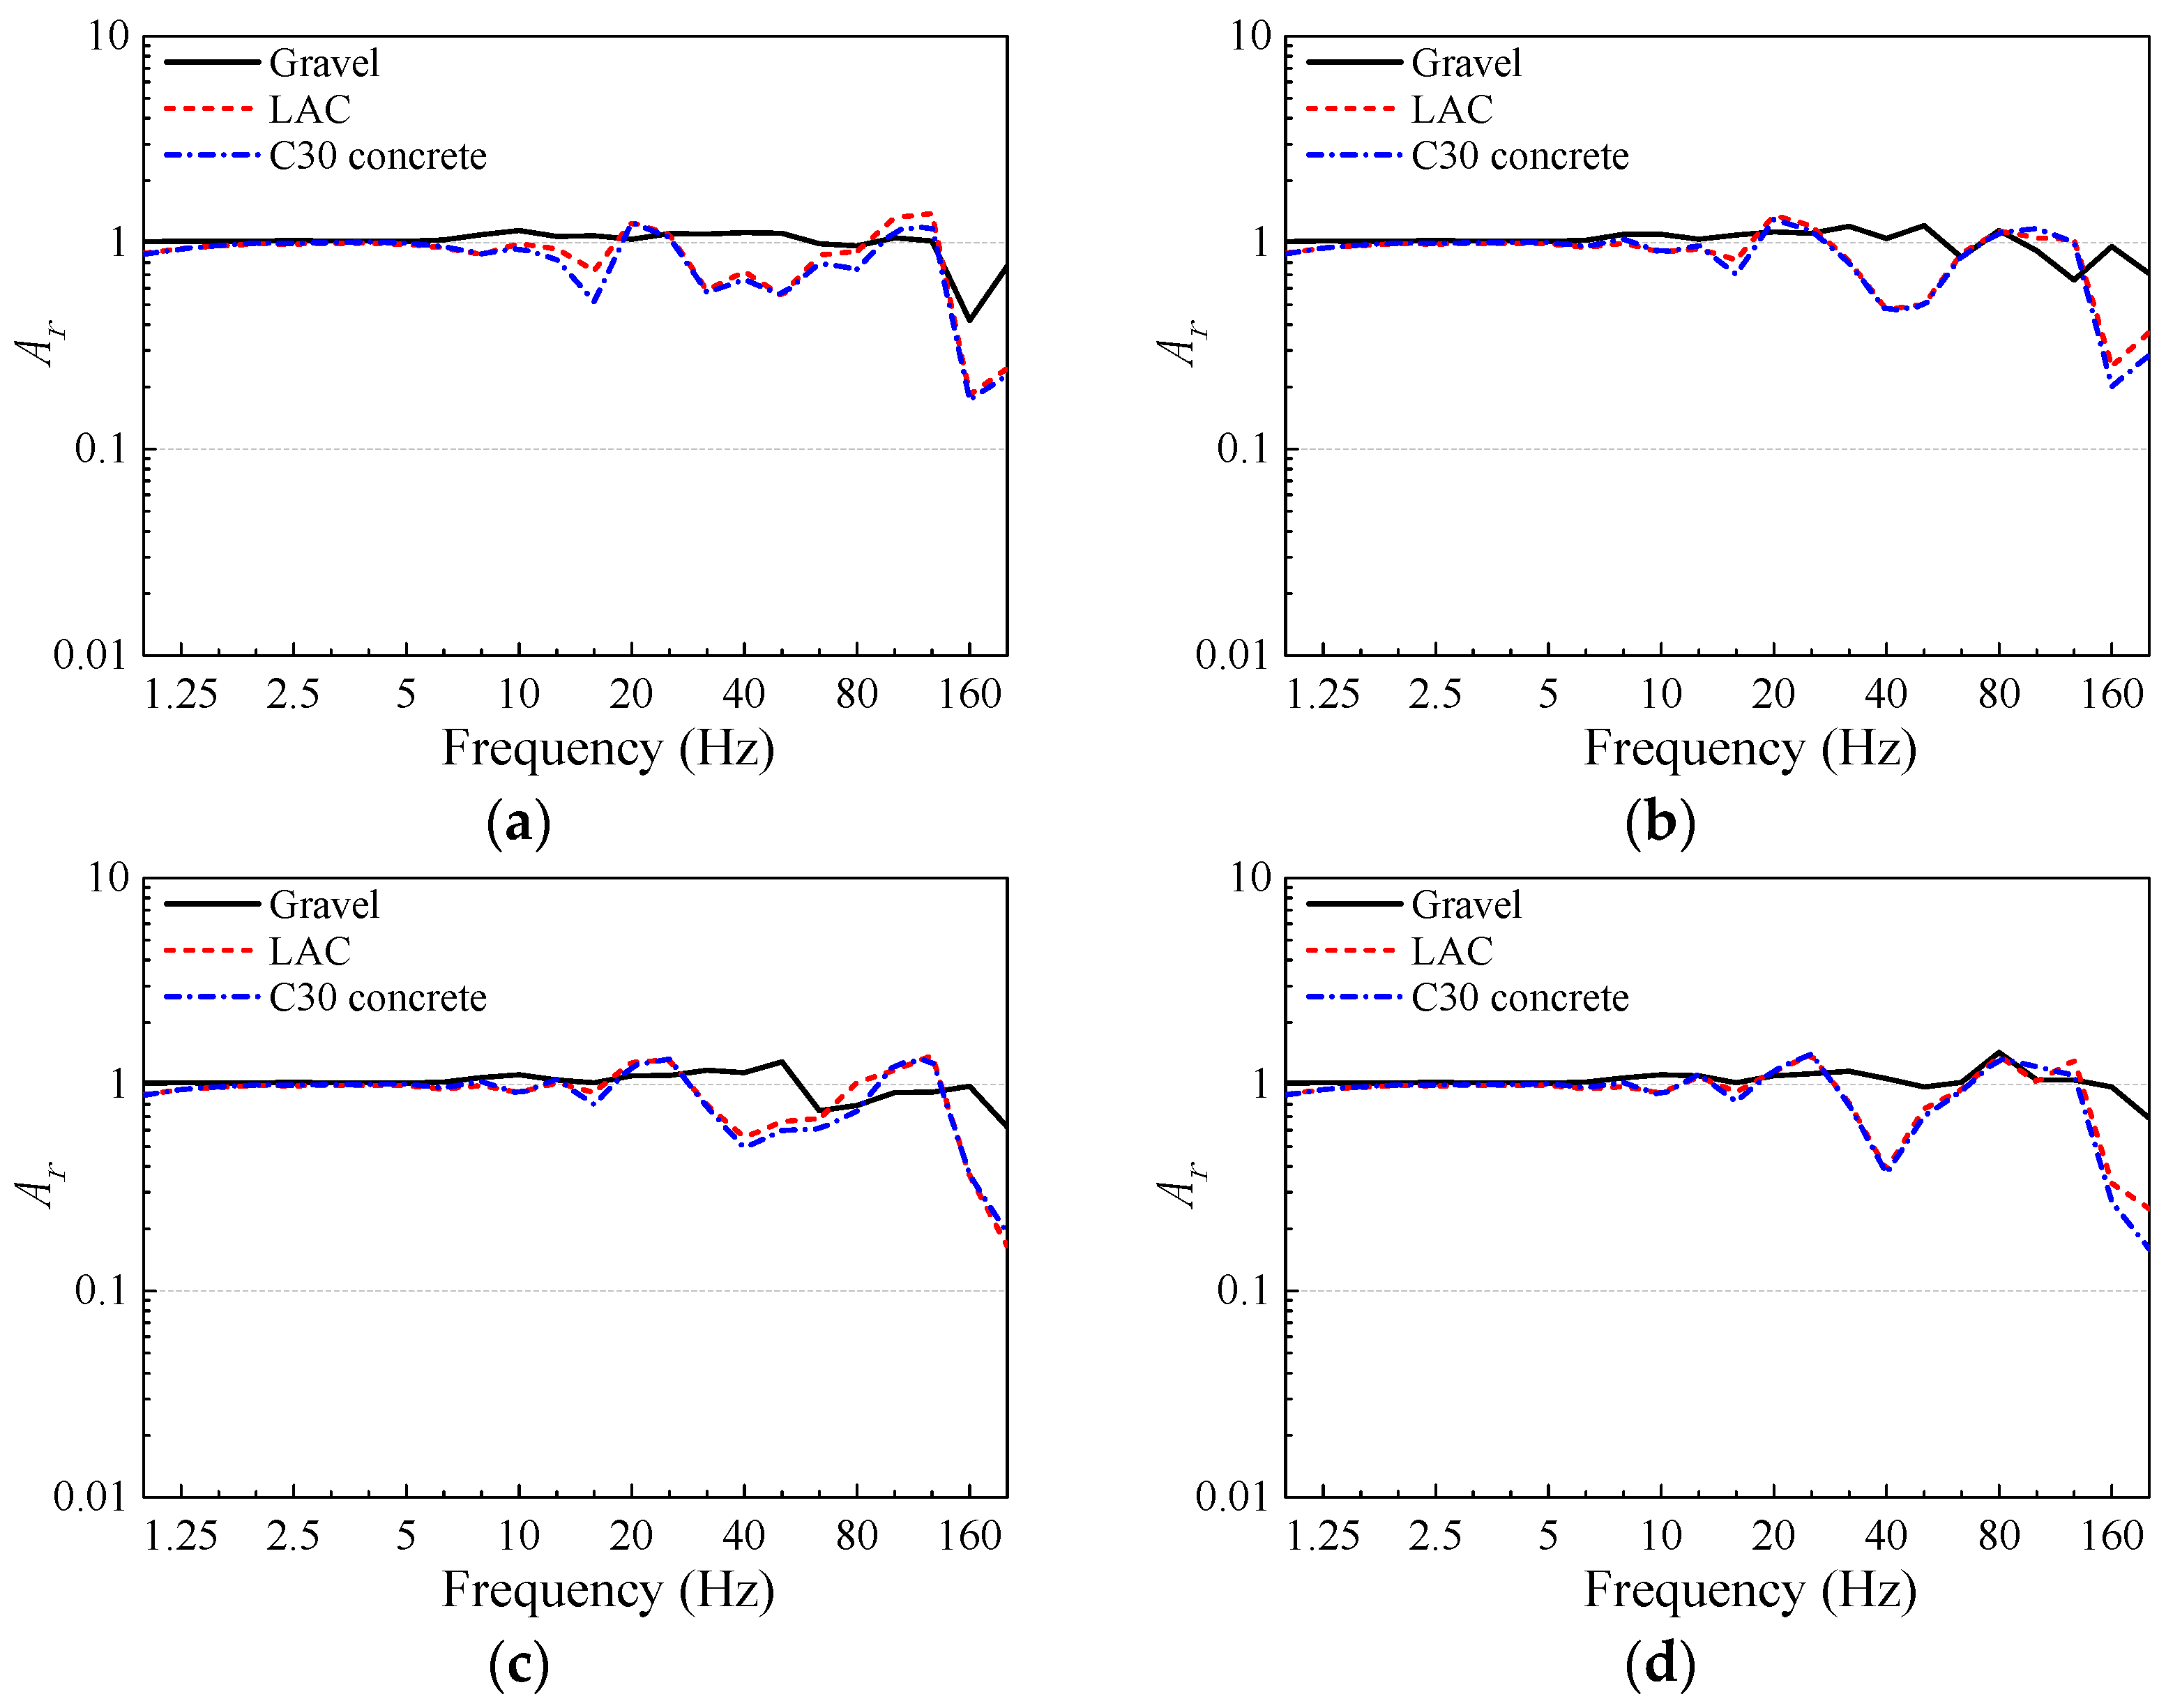
4.4. The Effect of Trench Filling Materials on Vibration Isolation
5. Conclusions
- (1)
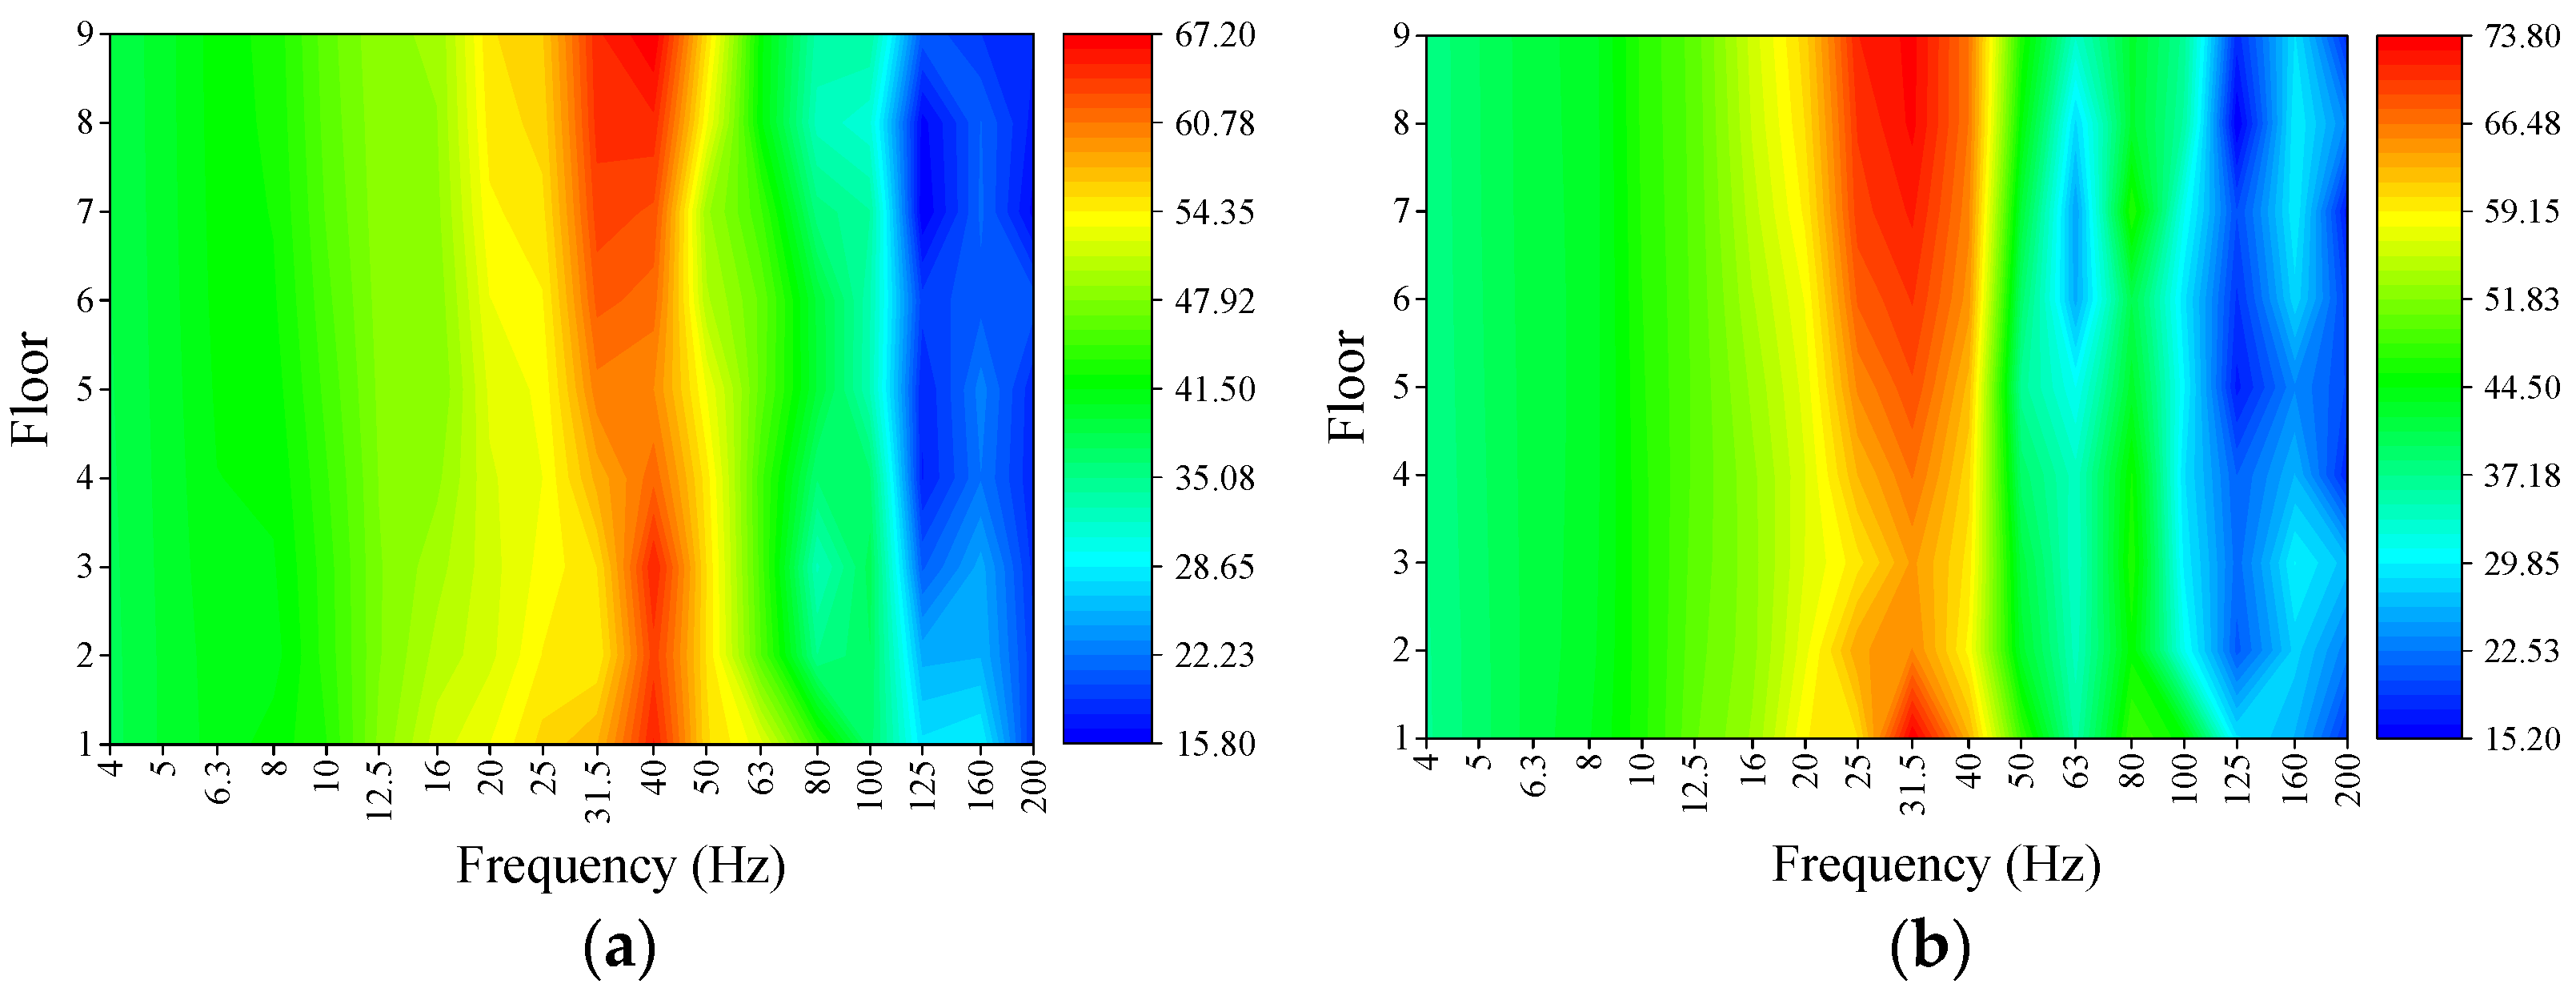
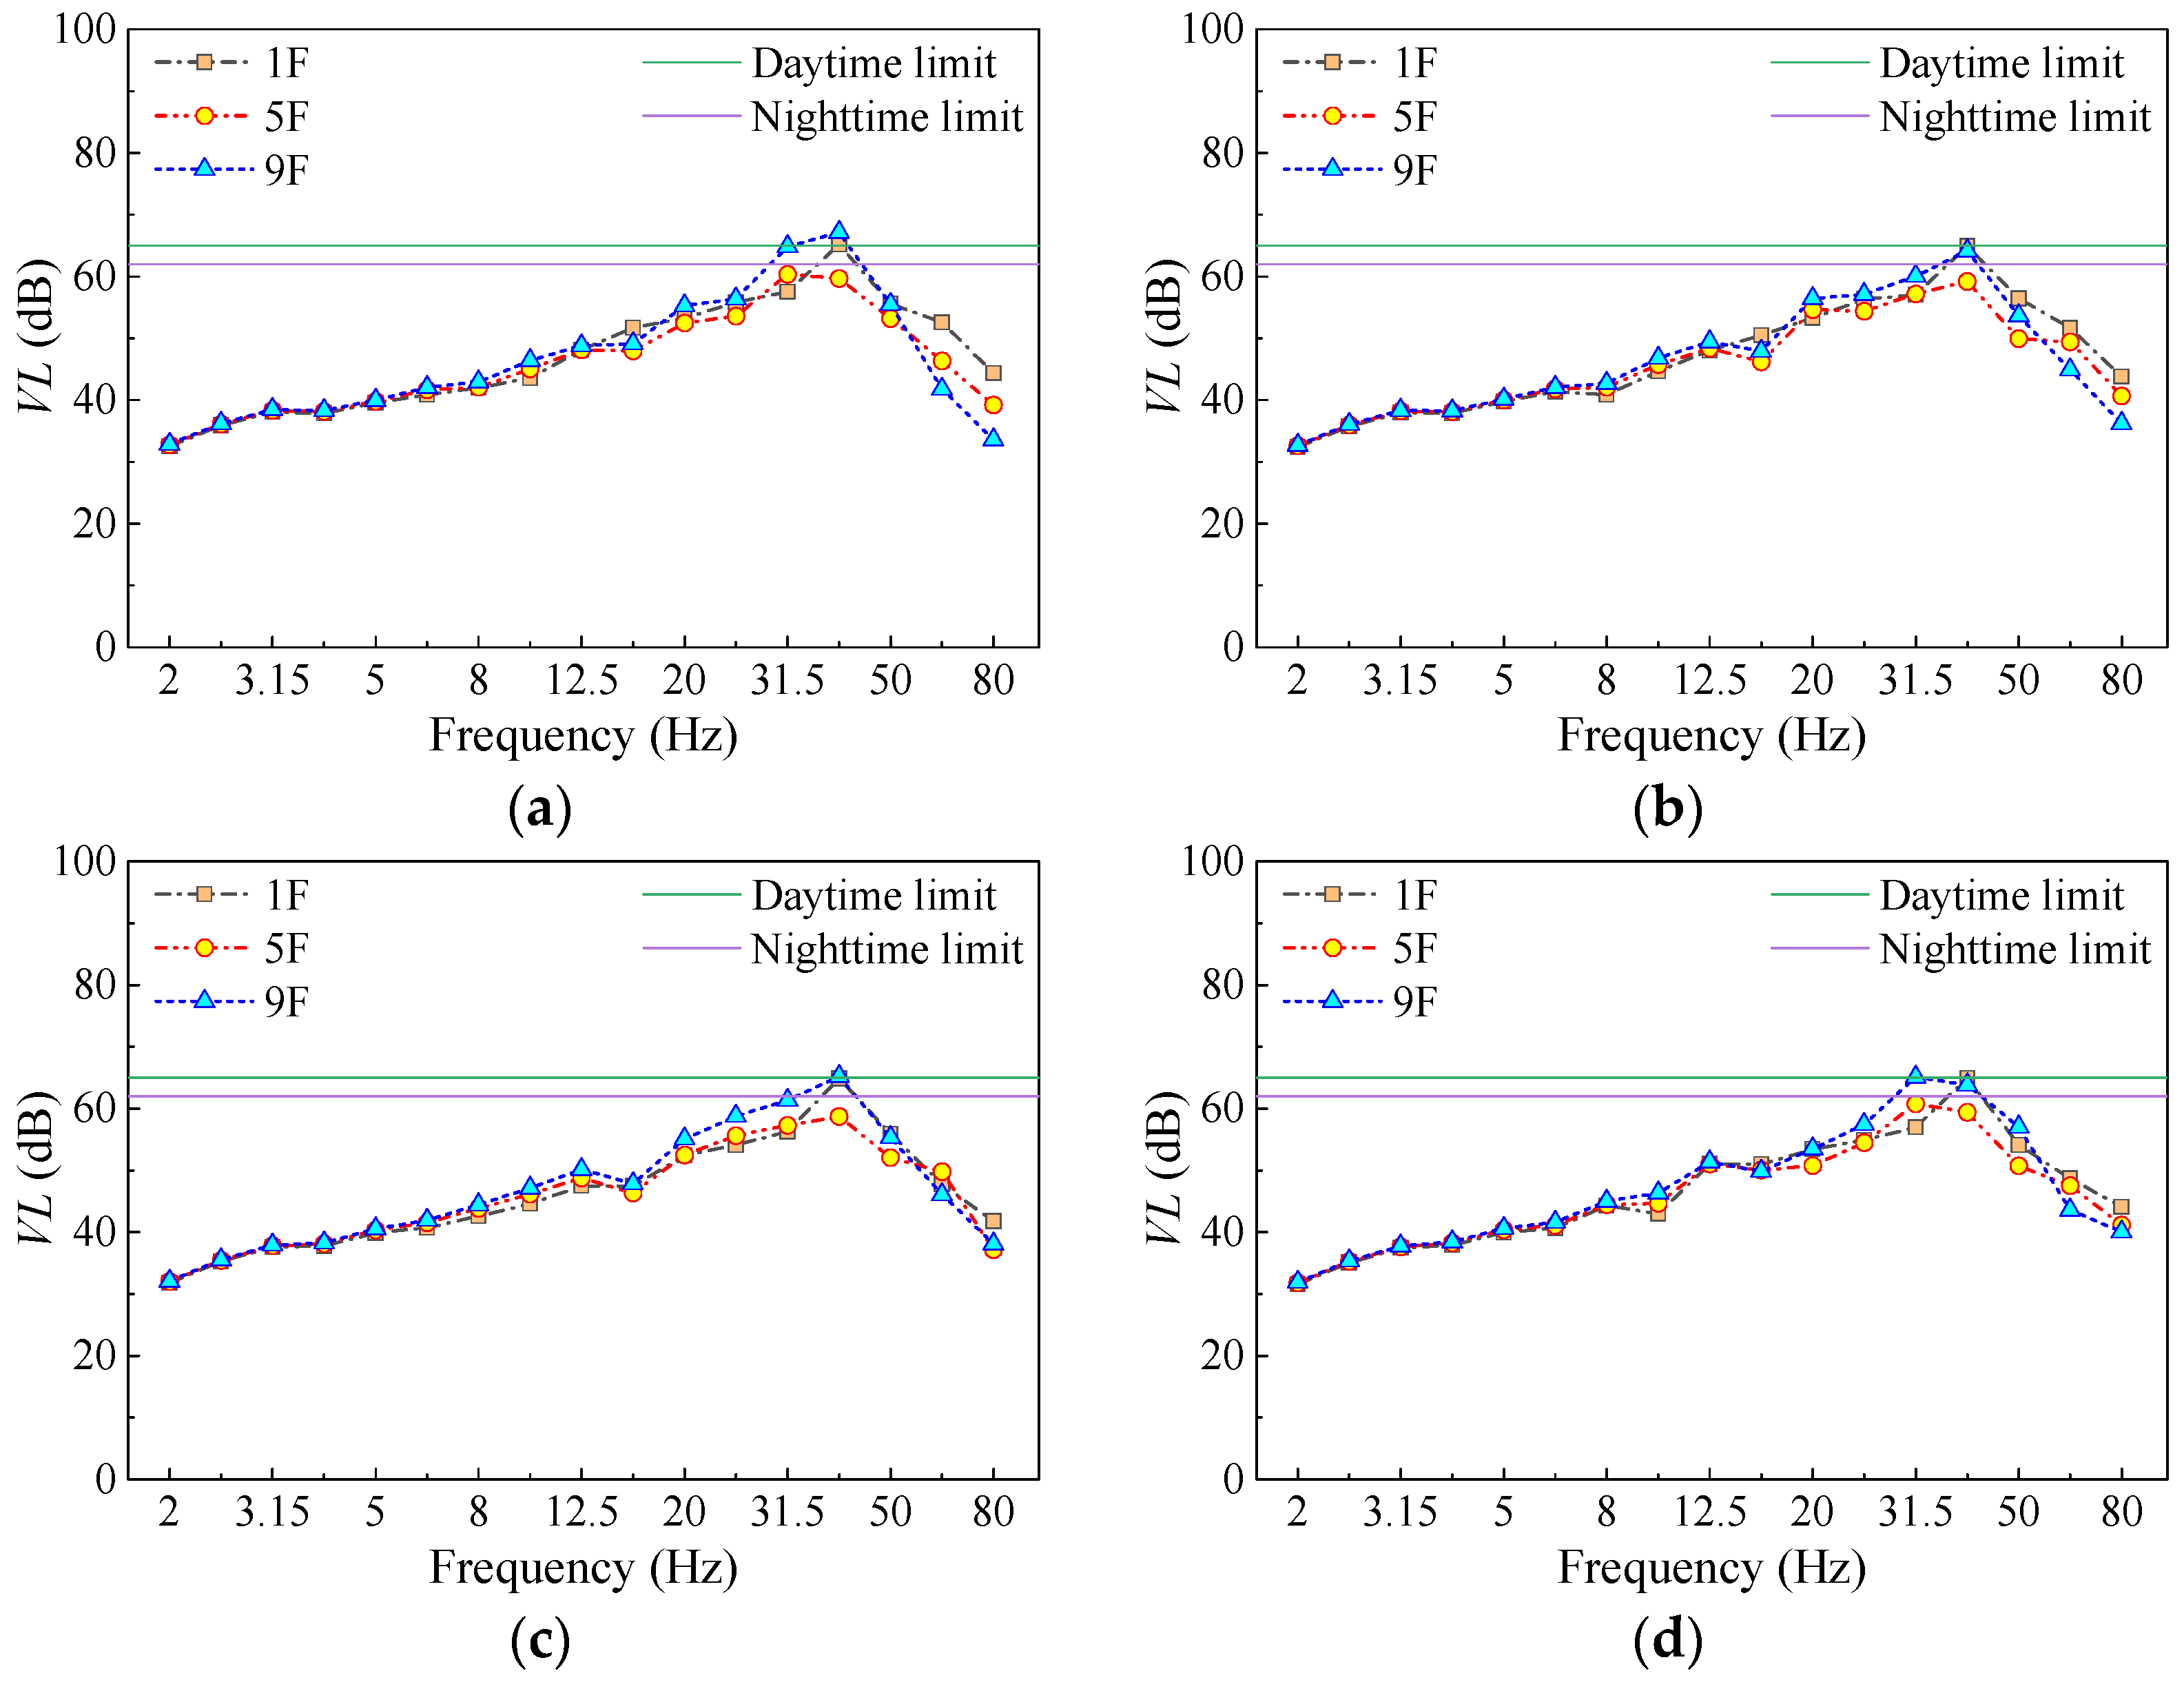
- The vibration response of slabs is significantly influenced by stiffness. When the slab thickness is the same, larger slab areas result in lower vertical natural frequencies. This leads to a wider frequency range under train load excitation, making resonance more likely to occur in the slabs. The dominant frequency range of slab vibration in the over-track building is between 25 and 50 Hz. The maximum vibration level in the 1/3 octave band occurs at 31.5–40 Hz. High-frequency vibration in the range of 63–80 Hz shows a decreasing trend with increasing floor height. In contrast, vibration at certain frequency points within the range of 5–31.5 Hz exhibits amplification as the floor height increases.
- (2)
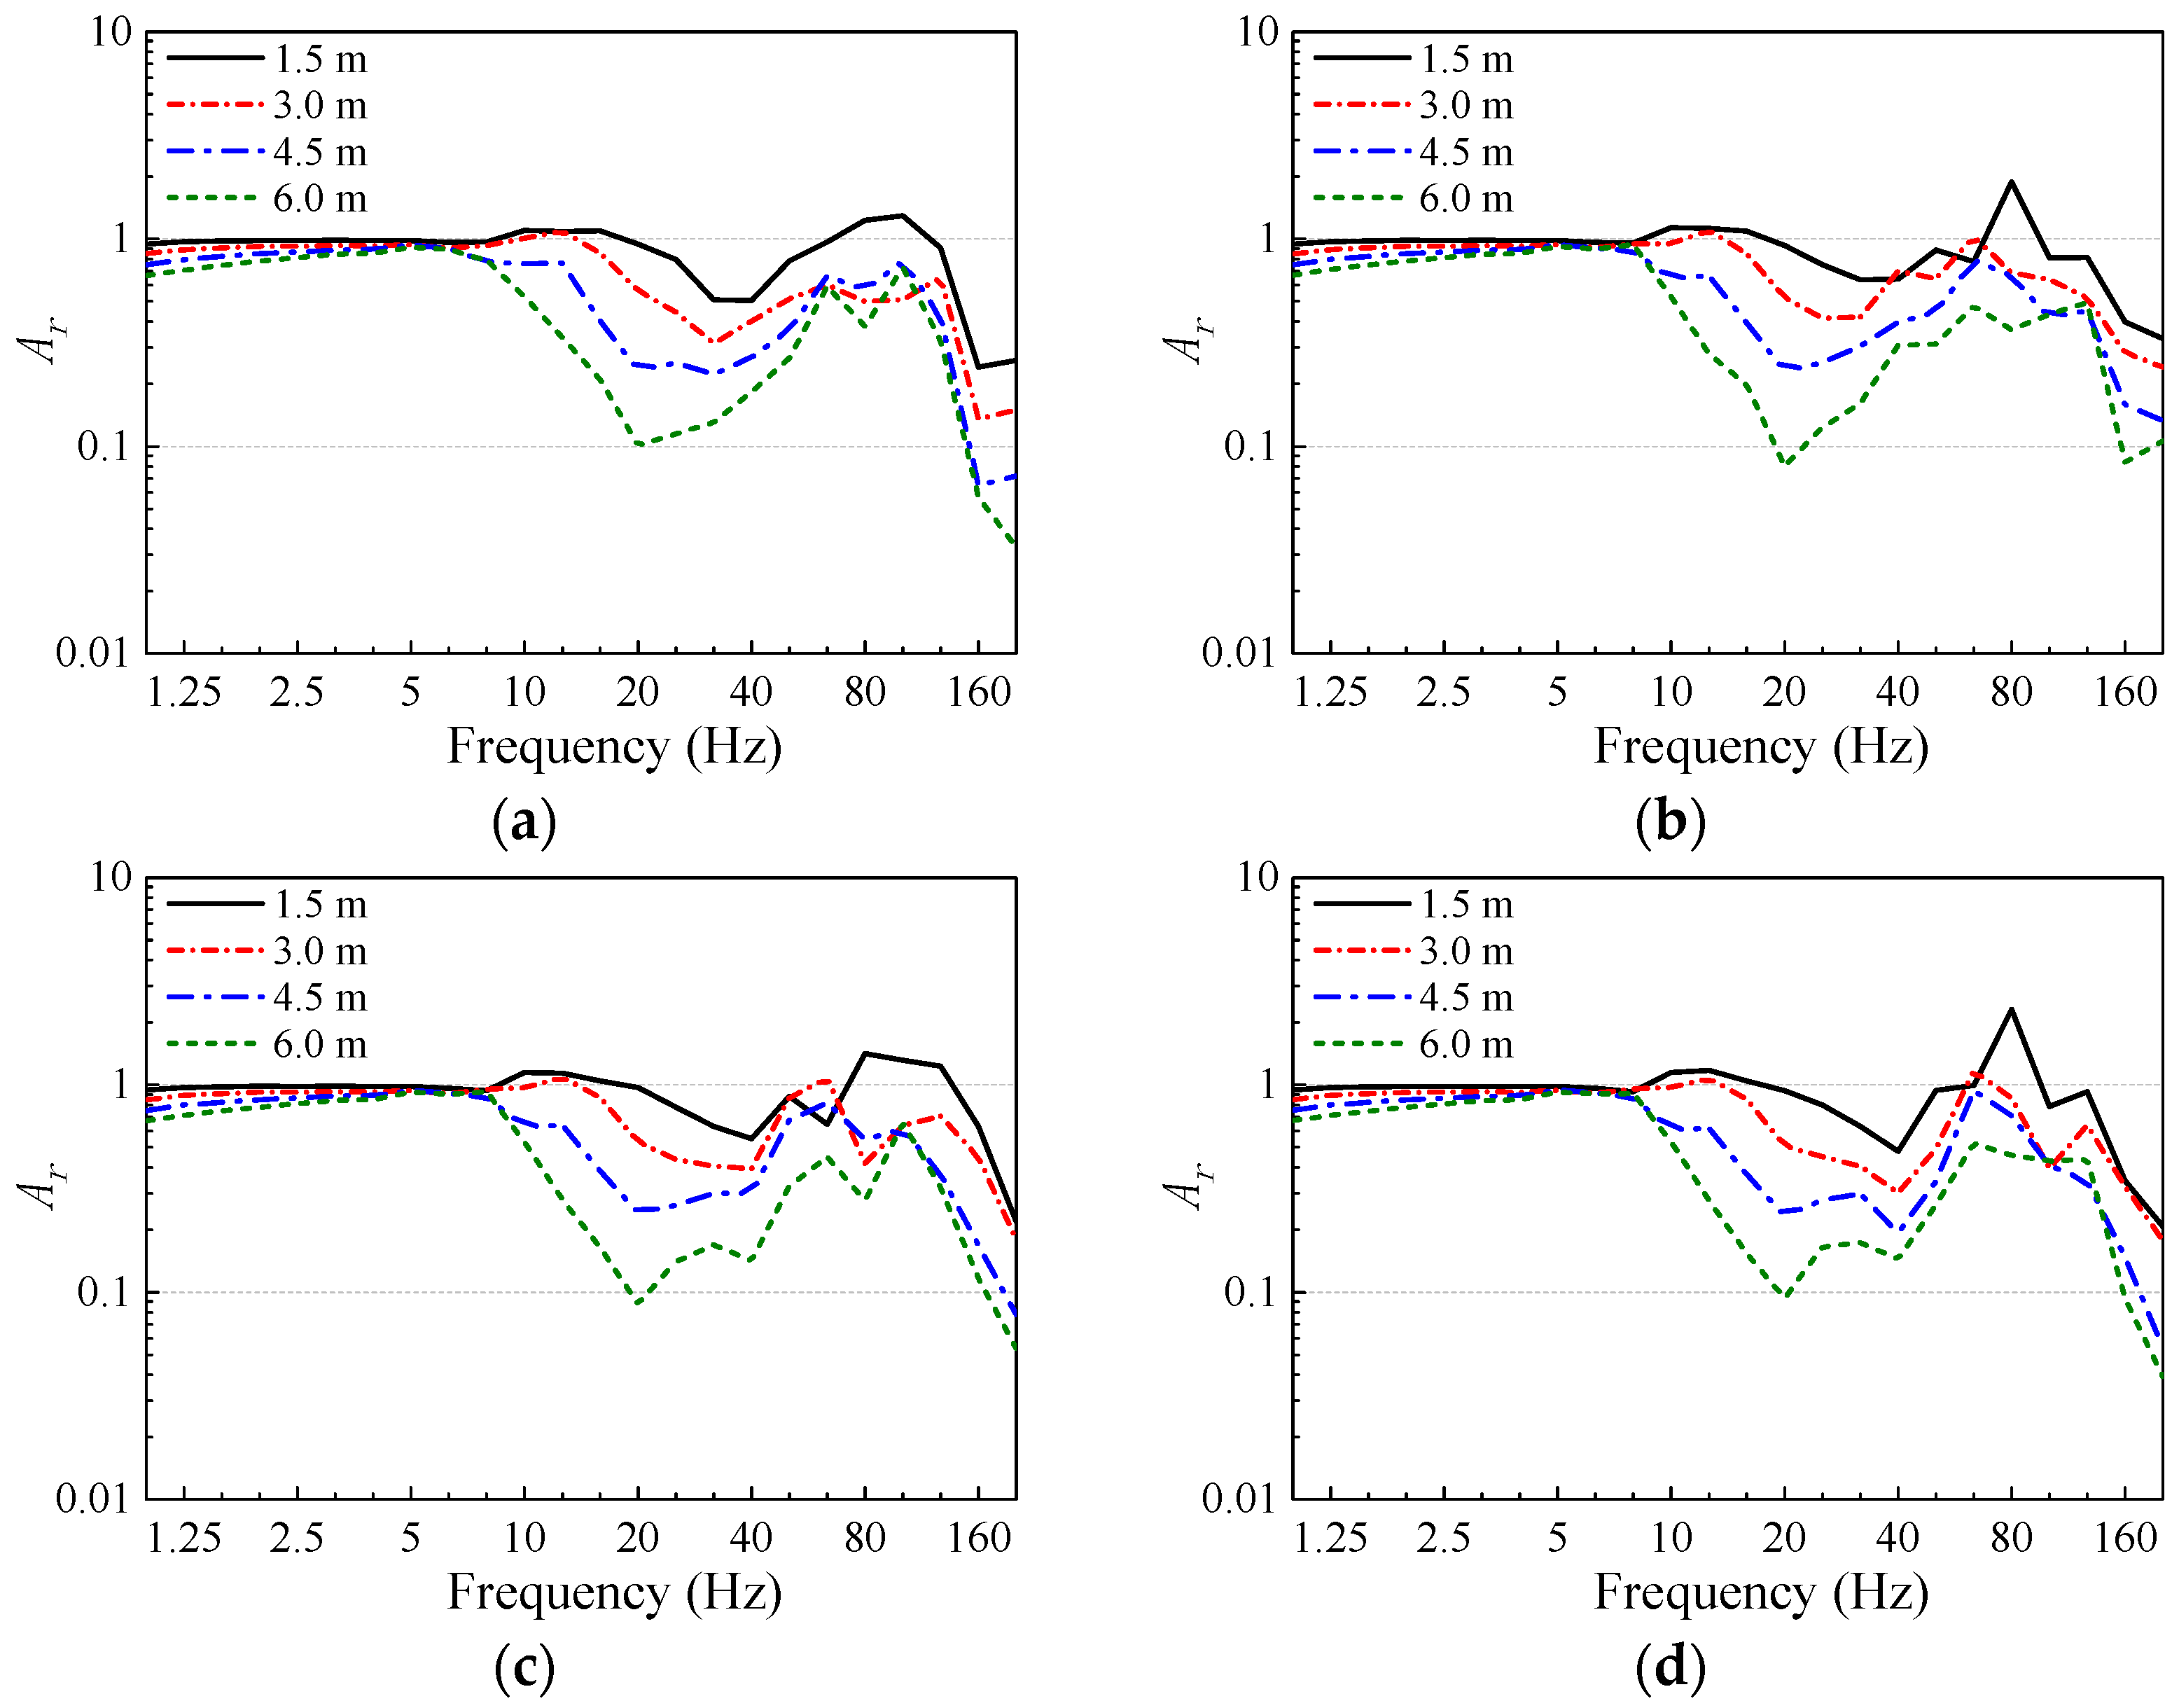
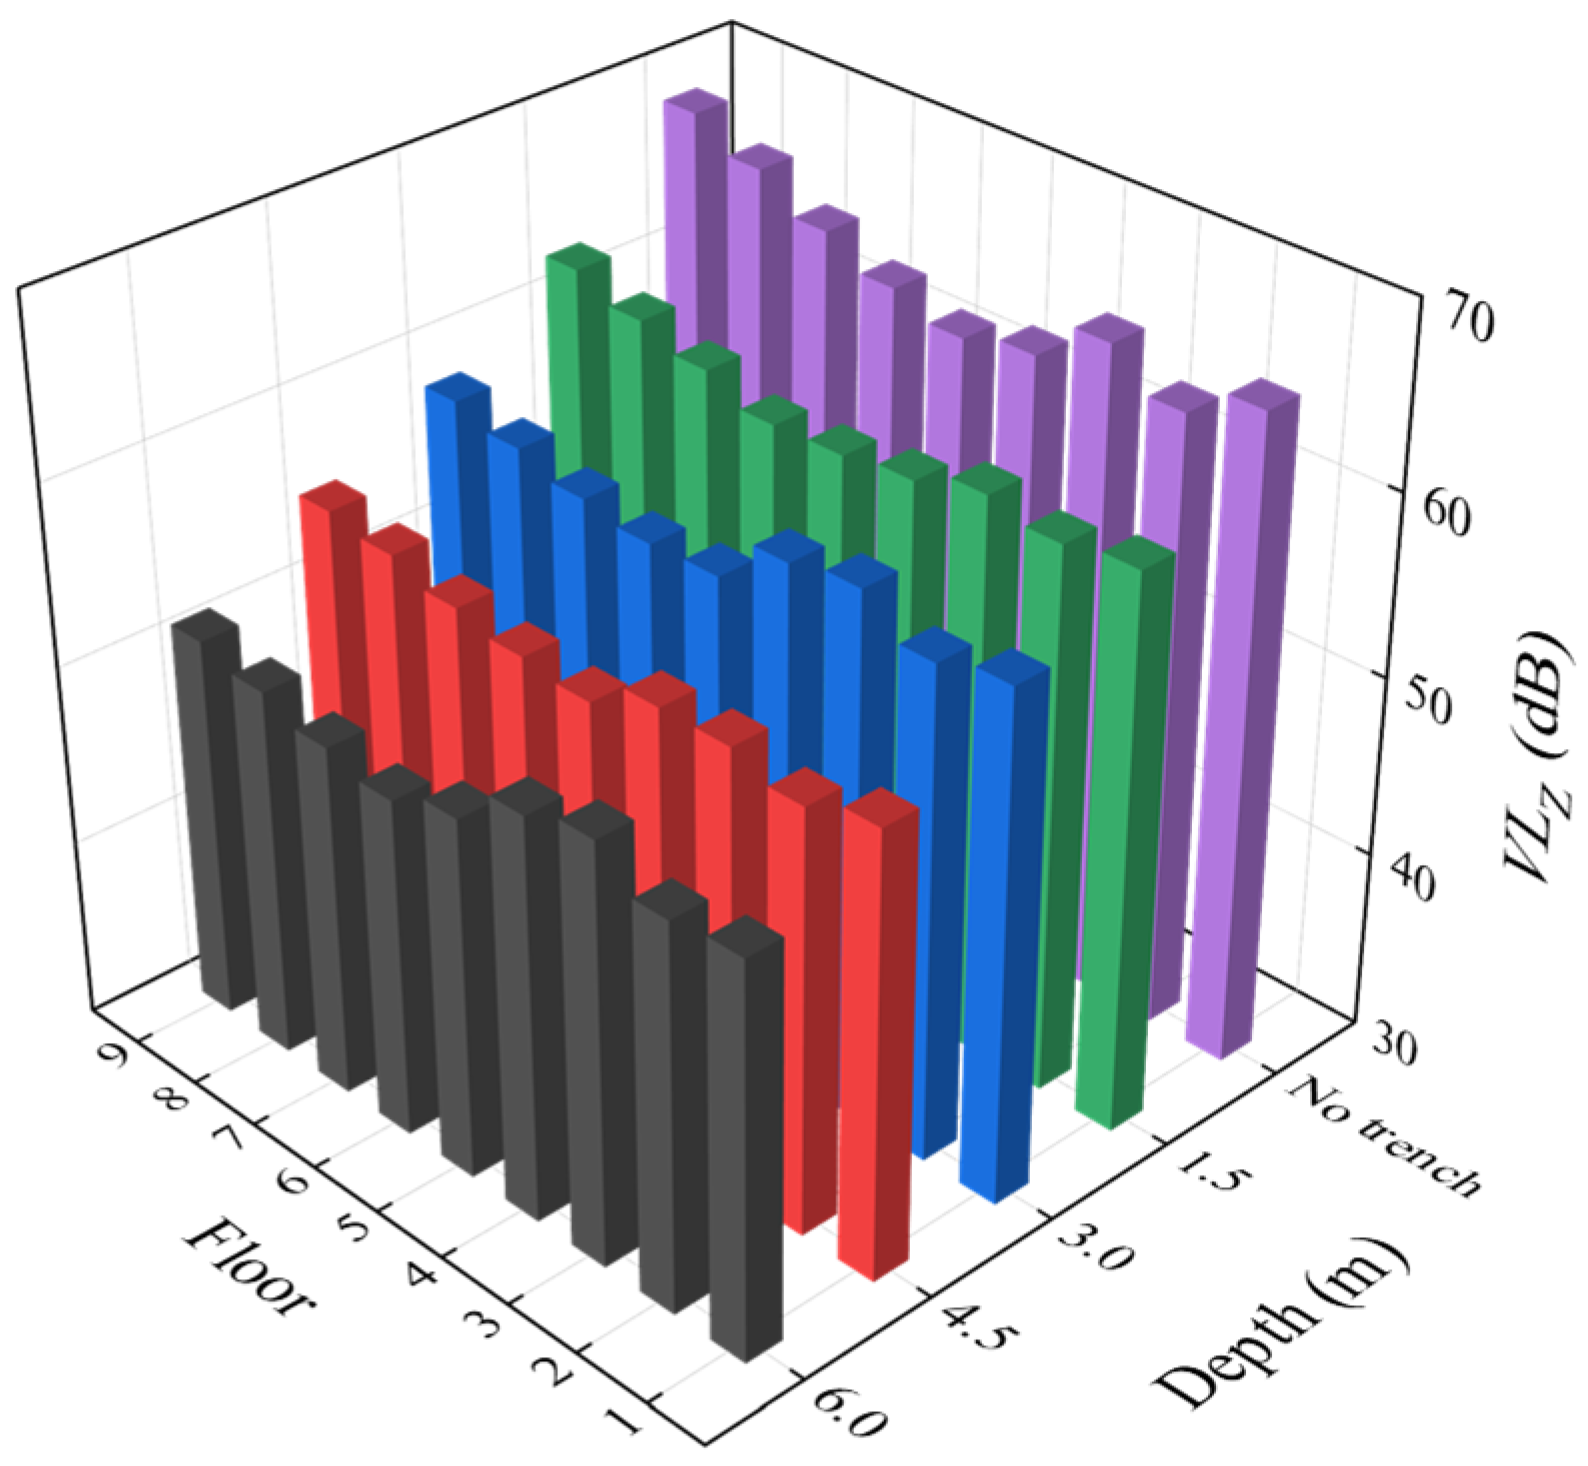
- Within the main frequency range of slab vibration, open trenches exhibit the best vibration isolation performance. Numerical analysis indicates that depth is the primary factor affecting the isolation performance of open trenches. As the depth of the trench increases, the vibration isolation effect improves. When the trench depth reaches one Rayleigh wavelength of the surface soil, the Z-vibration levels of the slabs can be reduced by more than 10 dB. The influence of the position and width of open trenches on their vibration isolation performance is weaker than that of their depth. For the position of open trenches, the vibration isolation performance decreases when the trench is located closer to the track structure. It is recommended that the distance between the trench and the track structure should be greater than 0.4 times the Rayleigh wavelength of the surface soil. Regarding the width of open trenches, due to the limited space in the depot area, the trench width cannot be set too large. Therefore, within the width range of 0.5–1.5 m considered in this study, changes in trench width have a relatively minor influence on the vibration isolation performance.
- (3)
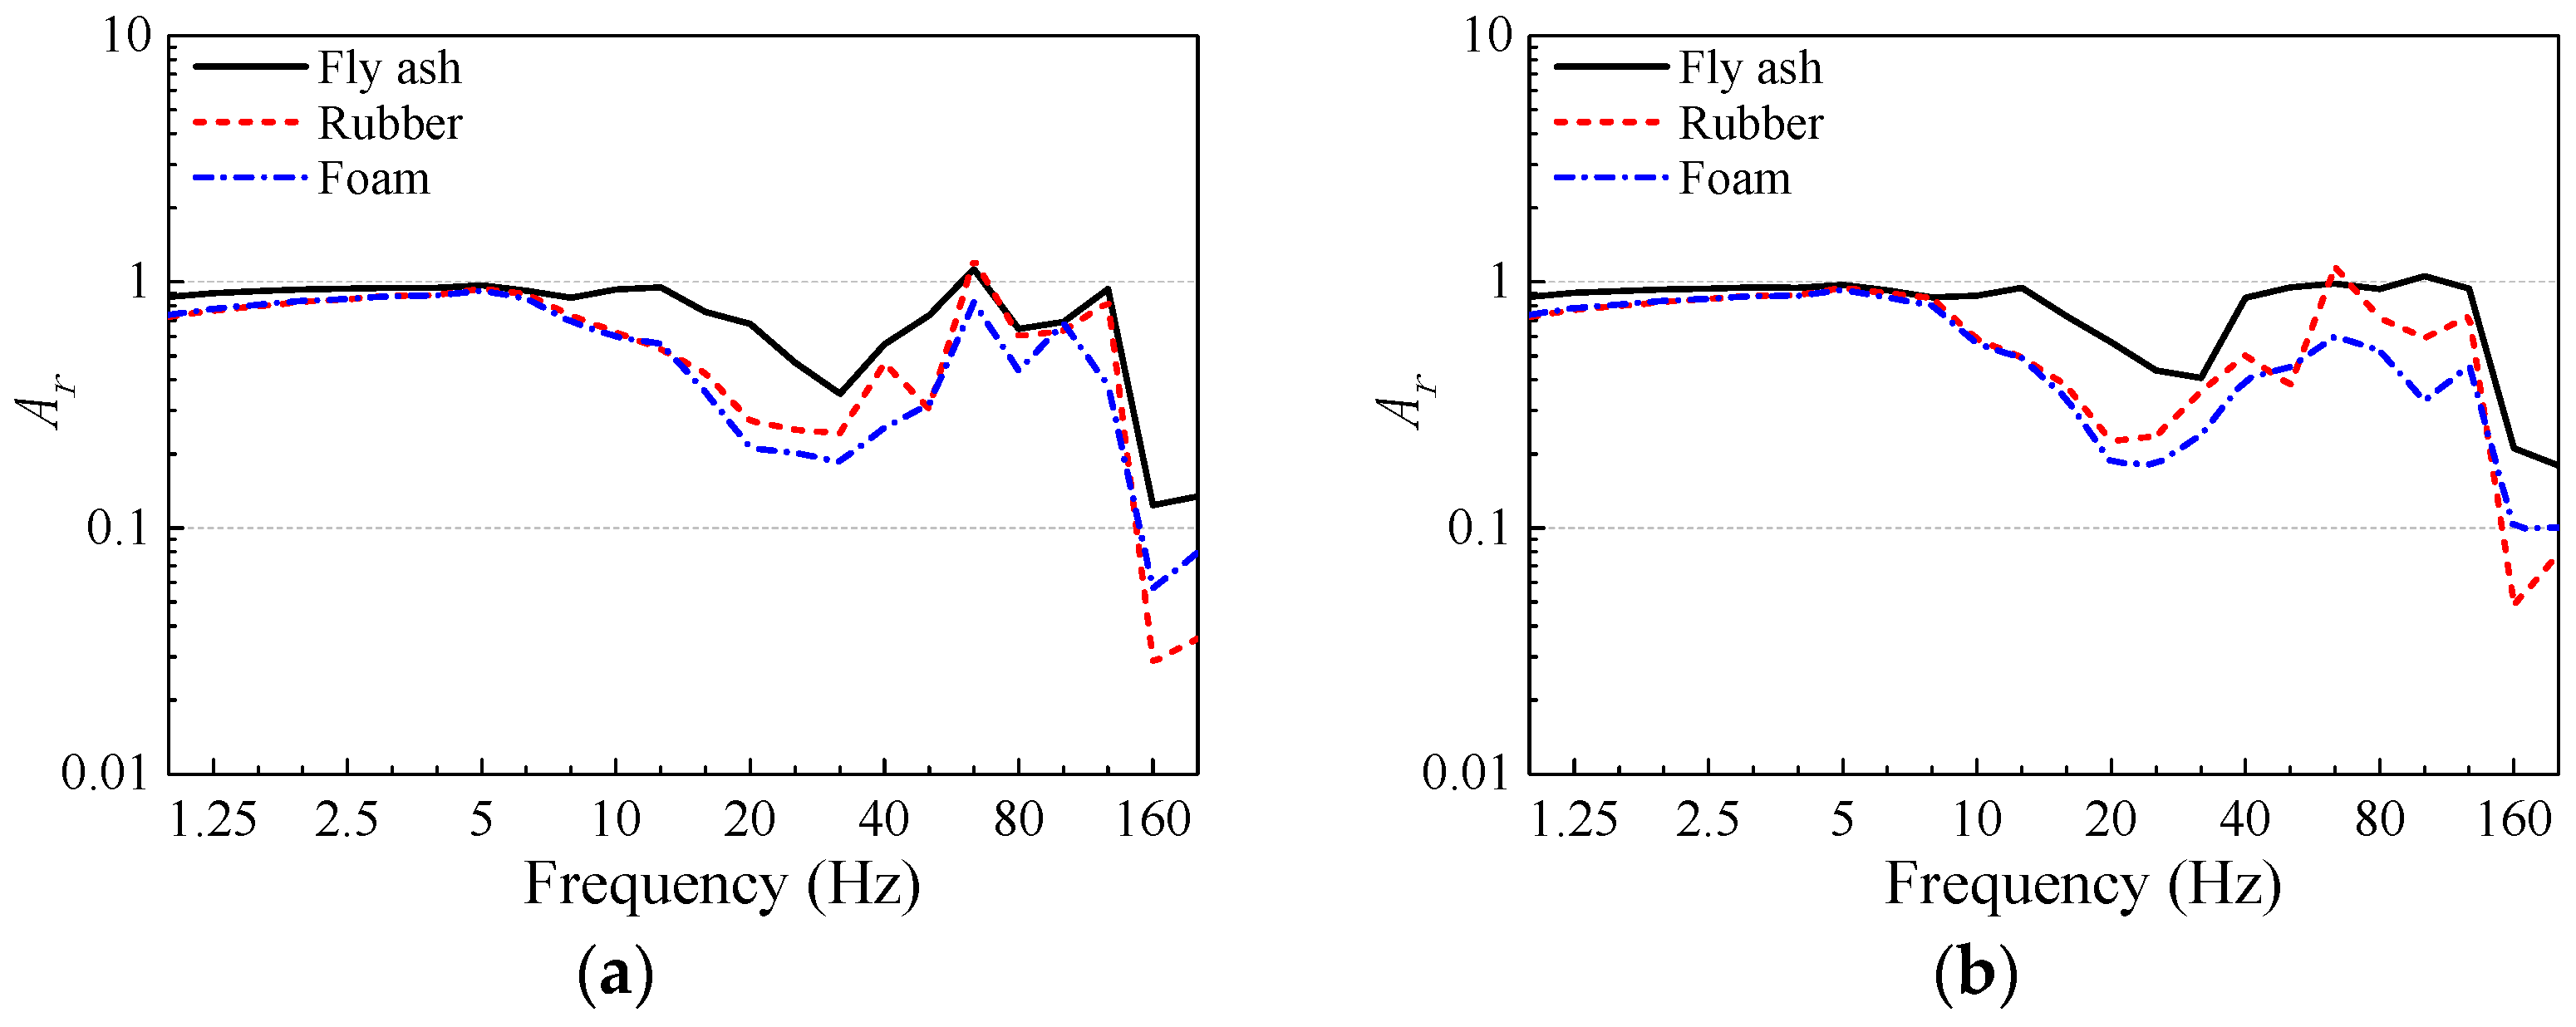
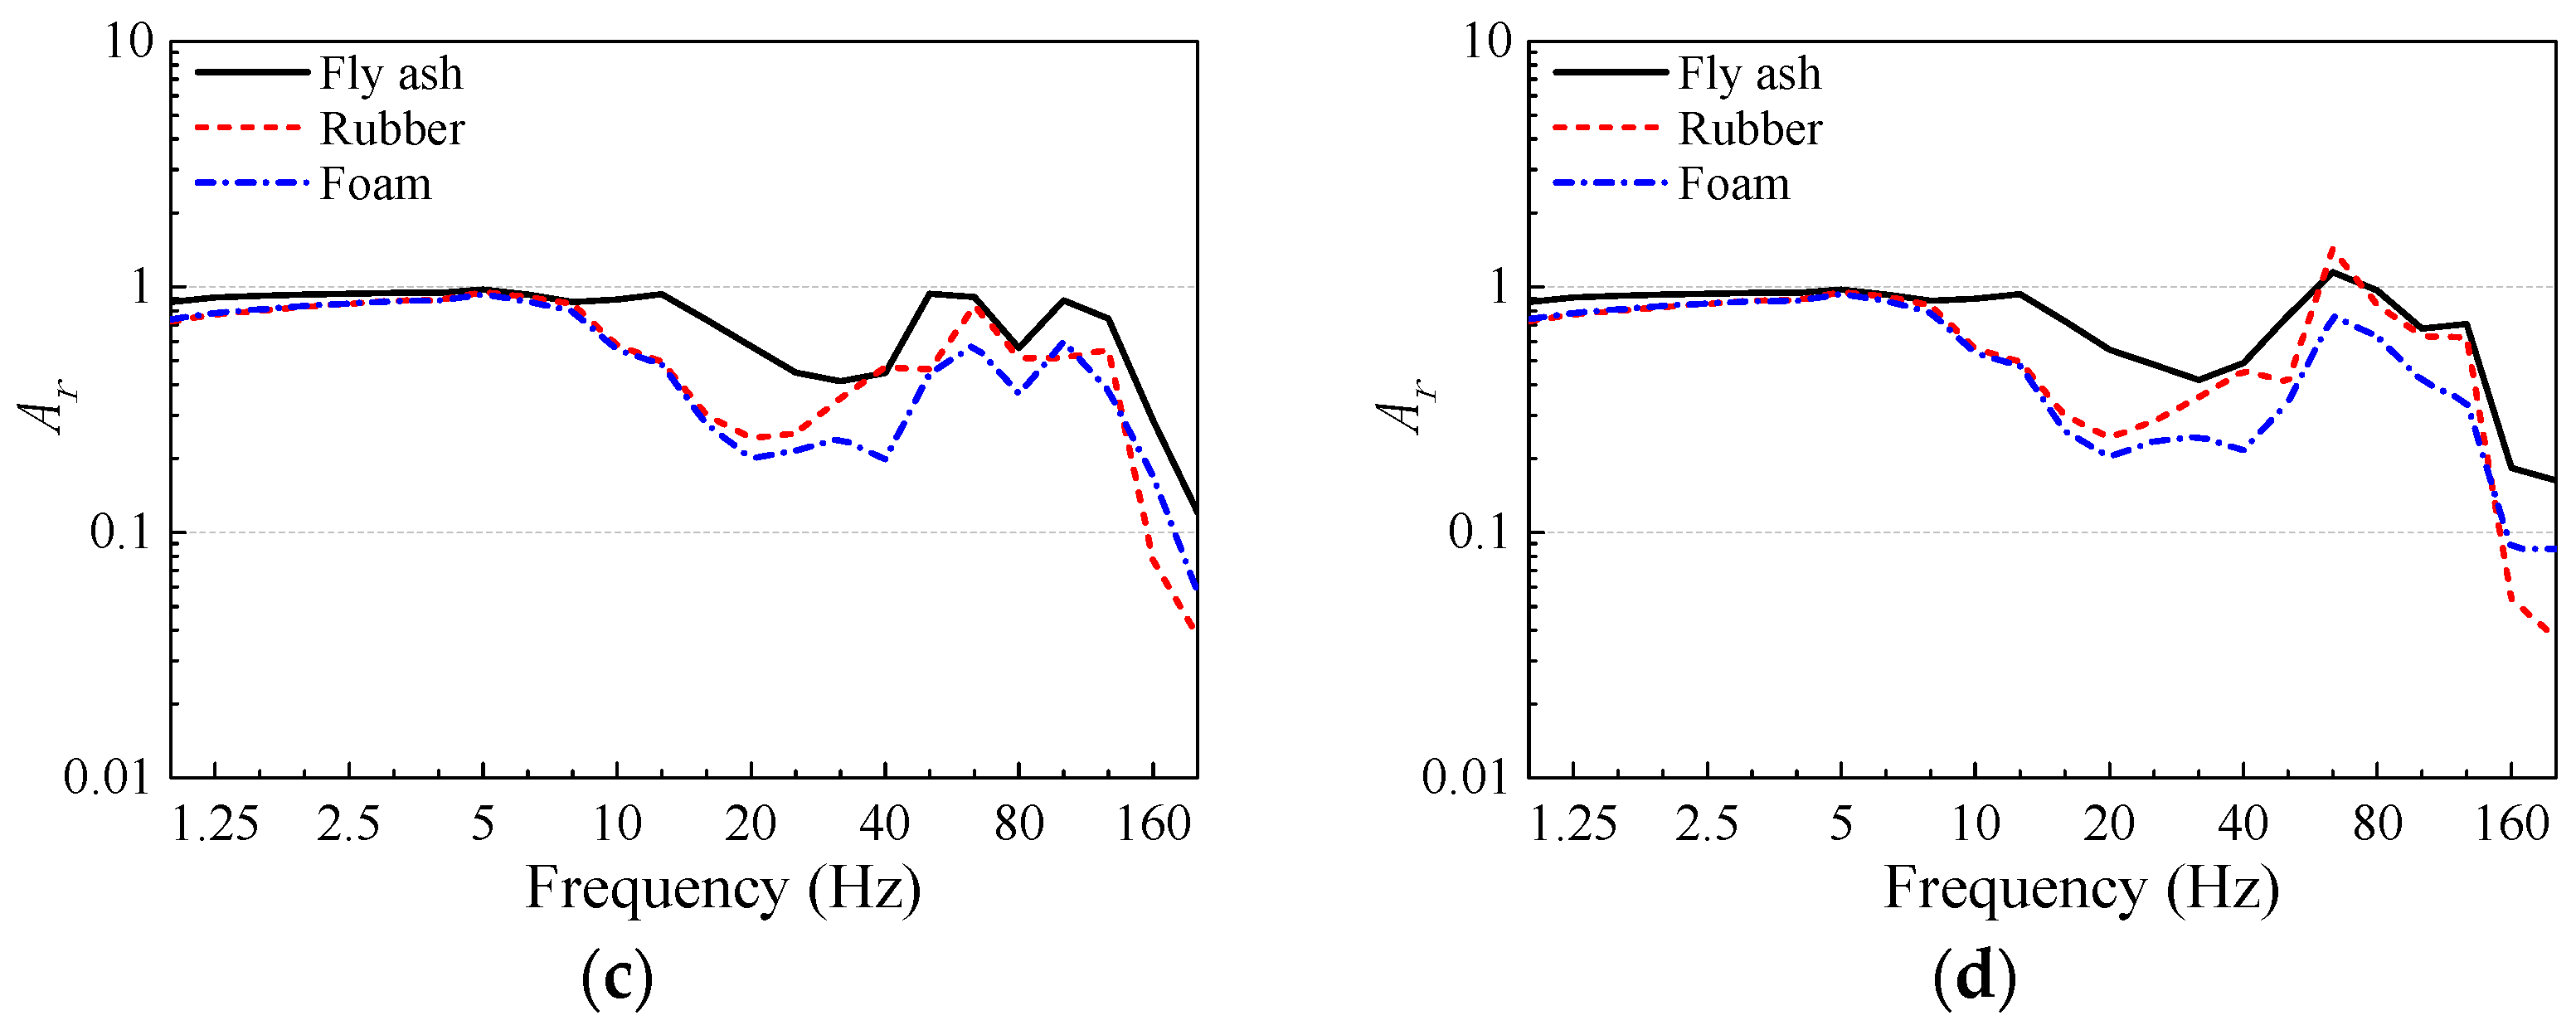
- Within the dominant frequency range of slab vibration, flexible infilled trenches exhibit better overall vibration isolation performance than rigid infilled trenches. The gravel infilled trench shows almost no vibration isolation effect within the 1–80 Hz frequency range of slab vibration, and the Z-vibration levels of the slabs are amplified by 0.3–1.6 dB. The foam infilled trench achieves the best vibration isolation performance. When a foam infilled trench is used, the Z-vibration levels of the slabs can be reduced by 8.6–13.9 dB. The impedance ratio between the filling material and the surrounding soil is an important factor affecting the vibration isolation performance of infilled trenches. When the impedance ratio deviates further from 1, the vibration isolation performance improves. However, when the impedance ratio approaches 1, the vibration isolation effect decreases and may even disappear. For rigid infilled trenches, when the impedance ratio between the filling material and the surface soil reaches 8.7, further increasing the stiffness of the filling material does not significantly enhance the vibration isolation performance.
Author Contributions
Funding
Institutional Review Board Statement
Informed Consent Statement
Data Availability Statement
Acknowledgments
Conflicts of Interest
References
- Di, G.; Li, H.; Guo, J. Predicting the Influence of Vibration from Trains in the Throat Area of a Metro Depot on Over-Track Buildings. Appl. Sci. 2024, 14, 8598. [Google Scholar] [CrossRef]
- Zou, C.; Wang, Y.; Wang, P. Measurement of ground and nearby building vibration and noise induced by trains in a metro depot. Sci. Total Environ. 2015, 536, 761–773. [Google Scholar] [CrossRef] [PubMed]
- Koczwara, K.A.; Pachla, F.; Burdzik, R. Research on Human Exposure to Transport-Induced Vibration in Buildings. Appl. Sci. 2024, 14, 9016. [Google Scholar] [CrossRef]
- Feng, Q.S.; Liao, C.M.; Zhang, L. Evaluation of subway vibration influence on human exposure comfort of whole-body vibration. Noise Vib. Control 2021, 41, 237–243. [Google Scholar]
- Guo, T.; Cao, Z.; Zhang, Z. Numerical simulation of floor vibrations of a metro depot under moving subway trains. J. Vib. Control 2018, 24, 4353–4366. [Google Scholar] [CrossRef]
- Su, L.Y.; Wu, Y.B.; Teng, X.L. Analysis on the variation characteristics and formation mechanism of environmental vibration level caused by metro operation. Railw. Stand. Des. 2024, 68, 204–210. [Google Scholar]
- Remington, P.; Webb, J. Wheel/rail noise reduction through profile modification. J. Sound Vib. 1996, 193, 335–348. [Google Scholar] [CrossRef]
- Nielsen, J.C.O.; Mirza, A.; Cervello, S.; Huber, P.; Müller, R.; Nelain, B.; Ruest, P. Reducing train-induced ground-borne vibration by vehicle design and maintenance. Int. J. Rail Transp. 2015, 3, 17–39. [Google Scholar] [CrossRef]
- Liu, W.; Li, K.F.; Zhang, D.F. Railway Track Vibration and Noise Control for Cigezhuang Depot Property Development of Beijing Daxing International Airport Express First Phase. Railw. Surv. 2020, 46, 104–107. [Google Scholar]
- Ran, L.; Ma, J.J.; Sun, J.L. Development and application of high-grade vibration-absorbing fasteners for rail track in internal line of depot with property development. Railw. Surv. 2020, 46, 146–150. [Google Scholar]
- Ma, X.H.; Qu, C.; Zheng, R.W. Research on technologies of track vibration and noise control for the development of subway depot superstructure. Mod. Transp. Technol. 2021, 18, 83–88. [Google Scholar]
- Wang, Y.G.; Liu, P.H.; Li, T. Tests for effect of track vibration reduction measures in a depot on vibration and noise reduction of a superstructure. J. Vib. Shock 2020, 39, 284–291. [Google Scholar]
- Li, X.; Guo, Z.; Lei, K. Effects of steel spring floating slab on vibration and noise of a rail transit box-girder. Proc. Inst. Civ. Eng.–Transp. 2019, 175, 261–274. [Google Scholar] [CrossRef]
- Rü, P.; Liu, T.C.; Zhang, Z.C. Simulation study on the effect of damping thickness of viscoelastic damping track bed on tunnel and surface vibration attenuation characteristics. Railw. Stand. Des. 2019, 63, 49–54. [Google Scholar]
- Song, R.X.; Zhang, X.G.; Sun, G.D. Discussion on the application of two foundation isolation measures in buildings receiving excessive vibration from adjacent subway lines. Noise Vib. Control 2018, 38, 156–161+172. [Google Scholar]
- Zhou, Y.; Chen, P.; Lu, D.Y. Design and seismic response analysis for multiple buildings with large podium using inter-story isolation technology. J. Civ. Eng. 2016, 49, 84–89. [Google Scholar]
- Pan, P.; Shen, S.; Shen, Z. Experimental investigation on the effectiveness of laminated rubber bearings to isolate metro generated vibration. Measurement 2018, 122, 554–562. [Google Scholar] [CrossRef]
- He, W.F.; Luo, H.J.; Xu, H. Experimental study and application analysis of mechanical performance of 3D isolation/vibration bearings along railway lines. J. Vib. Eng. 2020, 33, 1112–1121. [Google Scholar]
- Ye, P.F.; Liu, W.G.; Tian, K. Measurement and analysis of vibration isolation effect of building floor near subway. Build. Struct. 2020, 50, 72–76. [Google Scholar]
- Fiala, P.; Degrande, G.; Augusztinovicz, F. Numerical modelling of ground-borne noise and vibration in buildings due to surface rail traffic. J. Sound Vib. 2006, 301, 718–738. [Google Scholar] [CrossRef]
- Ahmad, S.; Al-Hussaini, T.M. Simplified Design for Vibration Screening by Open and In-Filled Trenches. J. Geotech. Eng. 1991, 117, 67–88. [Google Scholar] [CrossRef]
- Conte, E.; Dente, G. Screening of Rayleigh Waves by Open Trenches. In Proceedings of the 3rd International Conference on Recent Advances in Geotechnical Earthquake Engineering and Soil Dynamics, St. Louis, MO, USA, 2–7 April 1995. [Google Scholar]
- Alzawi, A.; Naggar, E.H.M. Full scale experimental study on vibration scattering using open and in-filled (GeoFoam) wave barriers. Soil Dyn. Earthq. Eng. 2011, 31, 306–317. [Google Scholar] [CrossRef]
- Ulgen, D.; Toygar, O. Screening effectiveness of open and in-filled wave barriers: A full-scale experimental study. Constr. Build. Mater. 2015, 86, 12–20. [Google Scholar] [CrossRef]
- Sun, L.Q.; Li, J.; Liu, B. Experimental study on vibration-isolation effects of open trench, gravel-filled trench, and piles in a row. J. Earthq. Eng. 2015, 37, 342–348. [Google Scholar]
- Zou, C.; Wang, Y.; Zhang, X. Vibration isolation of over-track buildings in a metro depot by using trackside wave barriers. J. Build. Eng. 2020, 30, 101270. [Google Scholar] [CrossRef]
- François, S.; Schevenels, M.; Thyssen, B. Design and efficiency of a composite vibration isolating screen in soil. Soil Dyn. Earthq. Eng. 2012, 39, 113–127. [Google Scholar] [CrossRef]
- Takemiya, H. Field vibration mitigation by honeycomb WIB for pile foundations of a high-speed train viaduct. Soil Dyn. Earthq. Eng. 2004, 24, 69–87. [Google Scholar] [CrossRef]
- Hung, H.H.; Yang, Y.B.; Chang, D.W. Wave Barriers for Reduction of Train-Induced Vibrations in Soils. J. Geotech. Geoenviron. Eng. 2004, 130, 1283–1291. [Google Scholar] [CrossRef]
- Kattis, S.E.; Polyzos, D.; Beskos, D.E. Vibration isolation by a row of piles using a 3-D frequency domain BEM. Int. J. Numer. Methods Eng. 1999, 46, 713–728. [Google Scholar] [CrossRef]
- Tsai, P.H.; Feng, Z.Y.; Jen, T.L. Three-dimensional analysis of the screening effectiveness of hollow pile barriers for foundation-induced vertical vibration. Comput. Geotech. 2008, 35, 489–499. [Google Scholar] [CrossRef]
- Gao, G.Y.; Li, Z.Y.; Qiu, C. Three-dimensional analysis of rows of piles as passive barriers for ground vibration isolation. Soil Dyn. Earthq. Eng. 2006, 26, 1015–1027. [Google Scholar] [CrossRef]
- Du, X.L.; Zhao, M.; Wang, J.T. A stress artificial boundary in FEA for near-field wave problem. Chin. J. Theor. Appl. Mech. 2006, 38, 49–56. [Google Scholar]
- Lu, D.C.; Ma, Y.D.; Wang, G.S. Numerical Study on Ground Surface Vibration Response Under Train Load in Multi Adjacent Tunnels. J. Jilin Univ. (Earth Sci. Ed.) 2021, 51, 1452–1462. [Google Scholar]
- Majka, M.; Hartnett, M. Dynamic response of bridges to moving trains: A study on effects of random track irregularities and bridge skewness. Comput. Struct. 2009, 87, 1233–1252. [Google Scholar] [CrossRef]
- Medina Santiago, A.; Orozco Torres, J.A.; Hernández Gracidas, C.A.; Garduza, S.H.; Franco, J.D. Diagnosis and Study of Mechanical Vibrations in Cargo Vehicles Using ISO 2631-1:1997. Sensors 2023, 23, 9677. [Google Scholar] [CrossRef]
- Zou, C.; Wang, Y.; Moore, A.J. Train-induced field vibration measurements of ground and over-track buildings. Sci. Total Environ. 2017, 575, 1339–1351. [Google Scholar] [CrossRef]
- Zoccali, P.; Cantisani, G.; Loprencipe, G. Ground-vibrations induced by trains: Filled trenches mitigation capacity and length influence. Constr. Build. Mater. 2015, 74, 1–8. [Google Scholar] [CrossRef]
- Çelebi, E.; Kırtel, O. Non-linear 2-D FE modeling for prediction of screening performance of thin-walled trench barriers in mitigation of train-induced ground vibrations. Constr. Build. Mater. 2013, 42, 122–131. [Google Scholar] [CrossRef]


| Component | Material | Density (kg/m3) | Elastic Modulus (MPa) | Poisson’s Ratio |
|---|---|---|---|---|
| Filling wall | C30 | 2500 | 30,000 | 0.2 |
| Structural beam | C40 | 2500 | 32,500 | 0.2 |
| Floor slab | ||||
| Structural column | C50 | 2500 | 34,500 | 0.2 |
| C60 | 2500 | 36,000 | 0.2 | |
| Reinforcement | HRB400 | 7800 | 200,000 | 0.3 |
| I-beam | Q345 | 7800 | 206,000 | 0.3 |
| Component | Material | Density (kg/m3) | Elastic Modulus (MPa) | Poisson’s Ratio |
|---|---|---|---|---|
| Rail 60 | Q235 | 7800 | 206,000 | 0.3 |
| Sleeper | C30 | 2500 | 30,000 | 0.2 |
| Ballast |
| Fastener Parameters | Numerical Value | Unit |
|---|---|---|
| Vertical stiffness | 3 × 10⁷ | N/m |
| Lateral stiffness | 3 × 10⁷ | N/m |
| Vertical damping | 4 × 10⁴ | N·s/m |
| Lateral damping | 4 × 10⁴ | N·s/m |
| Fastener spacing | 0.6 | m |
| Soil Layer | Thickness (m) | Density (kg/m3) | Elastic Modulus (MPa) | Poisson’s Ratio |
|---|---|---|---|---|
| Artificial fill | 2 | 1950 | 210 | 0.31 |
| Clayey silt | 5.6 | 2040 | 219 | 0.25 |
| Fine sand | 8.5 | 1980 | 364 | 0.3 |
| Silty clay | 7.2 | 2120 | 402 | 0.35 |
| Sandy silt | 16.7 | 2150 | 401 | 0.25 |
| Parameters | Numerical Value | Unit |
|---|---|---|
| Vehicle body mass | 23,825 | kg |
| Bogie frame mass | 3970 | kg |
| Wheelset mass | 1654 | kg |
| Primary suspension vertical stiffness | 1.26 × 10⁶ | N/m |
| Primary suspension longitudinal stiffness | 1.0 × 10⁷ | N/m |
| Primary suspension lateral stiffness | 6.5 × 10⁶ | N/m |
| Secondary suspension vertical stiffness | 4.9 × 10⁵ | N/m |
| Secondary suspension longitudinal stiffness | 2.31 × 10⁵ | N/m |
| Secondary suspension lateral stiffness | 2.31 × 10⁵ | N/m |
| Primary suspension vertical damping | 10,626 | N·s/m |
| Primary suspension longitudinal damping | 0 | N·s/m |
| Primary suspension lateral damping | 0 | N·s/m |
| Secondary suspension vertical damping | 20,590 | N·s/m |
| Secondary suspension lateral damping | 40,000 | N·s/m |
| Modal Order | Natural Frequency (Hz) | |
|---|---|---|
| Floor Slab 1 | Floor Slab 3 | |
| 1 | 45.7 | 29.4 |
| 2 | 49.4 | 44.3 |
| 3 | 49.7 | 44.4 |
| 4 | 54.7 | 51.5 |
| 5 | 56.1 | 54.2 |
| Floor | Floor Slab Number | |||
|---|---|---|---|---|
| 1 | 2 | 14 | 15 | |
| 1 | 65.9 | 65.8 | 65.4 | 65.4 |
| 2 | 64.1 | 65.3 | 63.9 | 64.5 |
| 3 | 65.9 | 62.5 | 61.8 | 64.0 |
| 4 | 63.6 | 60.4 | 61.2 | 63.2 |
| 5 | 62.8 | 60.4 | 61.1 | 63.3 |
| 6 | 63.8 | 61.1 | 62.3 | 64.9 |
| 7 | 65.3 | 62.5 | 64.2 | 66.2 |
| 8 | 67.1 | 64.5 | 65.7 | 67.2 |
| 9 | 68.6 | 65.2 | 66.7 | 67.7 |
| Filling Material | Density (kg/m3) | Elastic Modulus (MPa) | Poisson’s Ratio | Impedance Ratio |
|---|---|---|---|---|
| Gravel | 2100 | 500 | 0.24 | 1.511 |
| LAC | 1800 | 14,000 | 0.2 | 8.712 |
| C30 concrete | 2500 | 30,000 | 0.2 | 13.935 |
| Fly ash | 500 | 25 | 0.35 | 0.174 |
| Rubber | 1480 | 4.5 | 0.48 | 0.123 |
| Foam | 50 | 5 | 0.4 | 0.024 |
Disclaimer/Publisher’s Note: The statements, opinions and data contained in all publications are solely those of the individual author(s) and contributor(s) and not of MDPI and/or the editor(s). MDPI and/or the editor(s) disclaim responsibility for any injury to people or property resulting from any ideas, methods, instructions or products referred to in the content. |
© 2025 by the authors. Licensee MDPI, Basel, Switzerland. This article is an open access article distributed under the terms and conditions of the Creative Commons Attribution (CC BY) license (https://creativecommons.org/licenses/by/4.0/).
Share and Cite
Zhao, S.; Lu, C.; Shen, J.; Zhao, M. Train-Induced Vibration Analysis and Isolation Trench Measures in Metro Depot Structures. Appl. Sci. 2025, 15, 4219. https://doi.org/10.3390/app15084219
Zhao S, Lu C, Shen J, Zhao M. Train-Induced Vibration Analysis and Isolation Trench Measures in Metro Depot Structures. Applied Sciences. 2025; 15(8):4219. https://doi.org/10.3390/app15084219
Chicago/Turabian StyleZhao, Shusong, Chenglin Lu, Jiaxu Shen, and Mi Zhao. 2025. "Train-Induced Vibration Analysis and Isolation Trench Measures in Metro Depot Structures" Applied Sciences 15, no. 8: 4219. https://doi.org/10.3390/app15084219
APA StyleZhao, S., Lu, C., Shen, J., & Zhao, M. (2025). Train-Induced Vibration Analysis and Isolation Trench Measures in Metro Depot Structures. Applied Sciences, 15(8), 4219. https://doi.org/10.3390/app15084219