Article

Artificial Intelligence for Image-Based Identification of Osteoclasts and Assessment of Their Maturation—Using the OC_Identifier

Institute of Materials Science, TUD Dresden University of Technology, 01062 Dresden, Germany
*
Author to whom correspondence should be addressed.
Appl. Sci. 2025, 15(8), 4159; https://doi.org/10.3390/app15084159
Submission received: 19 February 2025 / Revised: 5 March 2025 / Accepted: 10 March 2025 / Published: 10 April 2025

Abstract

:

Featured Application

The OC_Identifier is presented and evaluated with regard to its potential use to extend or even replace the biochemical analysis of osteoclast maturation in cell cultures.

Abstract

A form of AI was developed and trained to classify four different cell types, with a particular focus on identifying, counting, and determining the maturity of osteoclasts. Osteoclasts, formed by the fusion of monocytes, show clear morphological differences in their maturation, from small mononuclear cells to large multinuclear cells. The developed AI used YOLOv5m models to analyze these cell types based on microscopic images. The AI showed a certain degree of correlation with biochemical analyses (TRAP 5b, CAII). Despite this success, several challenges were identified. The homogeneity of the training data, limited by standardized cell culture conditions, limited the coverage of all osteoclast properties. Furthermore, the AI did not take into account the number of cell nuclei or the specific amount of DNA in the cells, which impaired the precision of the analysis of multinucleated osteoclasts. In the future, the introduction of weighting factors for cell nuclei could optimize the agreement of AI results with biochemical analyses. In summary, the developed AI technology offers a promising tool for cell identification and analysis, especially in osteoclast research. With further developments, this technology could significantly increase the efficiency and accuracy of cell analysis and promote practical applications in research and diagnostics.

1. Introduction

AI-Based Image Analysis in (Biomaterials) Research and Medicine

Artificial intelligence (AI) is increasingly being used in biological and biomaterials research to automate image analysis and enhance quantitative assessments. Within AI, computer vision (CV) plays a critical role in cell recognition, classification, and quantification. While traditional approaches for characterizing cell behaviour often rely on biochemical assays [1,2], fluorescence-based marker detection [3,4], quantitative PCR [5,6], and advanced imaging techniques such as ToF- SIMS [7,8], TEM [9], or histomorphometry [10], these methods typically require fixation or significant sample processing. However, the direct visualization of cell morphology remains essential for evaluating cell development and function, particularly in live-cell studies.
AI-based image analysis has emerged as a powerful tool to address these limitations, enabling the real-time, non-destructive evaluation of cell behaviour. AI applications in cell research can be broadly categorized into (1) predicting cell differentiation dynamics, (2) linking morphological and molecular features, and (3) predicting cellular responses to external stimuli. However, in bone research, technical biases in single-cell datasets, the limited profiling of key bone cell types, and insufficient spatial information continue to present challenges [11]. AI has already contributed significantly to biomaterials research, assisting in material synthesis optimization [12,13] and high-throughput drug testing for bone-related diseases [14].
Osteoclasts (OCs), primary bone-resorbing cells, pose unique challenges for automated quantification due to their large size (30–100 µm) and multinucleated nature, containing up to 25 nuclei. OCs are cultured from monocytes (9–17 µm in diameter) [15]. OC maturity can be directly distinguished by the size of the cells in the image—to determine whether they are monocytes (MONs)—and the number of nuclei—to determine whether they are mature OCs with three or more cell nuclei [16,17,18]. The importance of images for cell description is particularly high for OCs. These cells are not only large, but the size difference between the cells (mononuclear MONs [15] and the later multinucleated OCs) is also extremely large. Conventional cell counting techniques, such as Neubauer chambers or automated counters like Scepter® (Merck Millipore, Darmstadt, Germany), are unsuitable for OCs due to their adherence properties and sensitivity to detachment-induced morphological changes. OC characterization often relies on manual counting, which is time-consuming and prone to errors. AI-based analysis offers a viable alternative, provided it is trained with appropriate datasets and validated against established biochemical methods.
Several computational methods for OC identification have been explored. Ilastik-based AI, utilizing a random forest algorithm, has been applied for cell segmentation [19,20], while the OC-Finder employs convolutional neural networks [21,22]. However, segmentation-based methods often struggle with overlapping cells, requiring extensive manual input. ImageJ (latest Version 1.54p), the most commonly used software for cell counting, also faces limitations in detecting interconnected OCs, necessitating manual segmentation before analysis.
To overcome these challenges, we applied the YOLO object detection framework for OC identification and quantification. Unlike segmentation-based approaches, YOLO is well suited for recognizing overlapping cells and provides rapid, high-accuracy detection. Additionally, our model integrates ratio calculations to assess differentiation dynamics more effectively. Given the scarcity of open-access datasets for AI training in biomaterials research, we provide our trained model and annotated dataset for public use, facilitating the broader adoption of AI-based image analysis in osteoclast research. This study aims to establish a robust, reproducible, and non-invasive AI-assisted method for osteoclast quantification, advancing automated biomaterials characterization while minimizing experimental manipulation.

2. Materials and Methods

Three conditions must be met to develop a specific system for OC identification and characterization. First, a suitable training dataset must be available that shows the cells in a suitable way and on which the cells can be labelled correctly for AI training. Second, the AI training must be verified with an image dataset that is excluded from the training and allows a defined verification of cell assignment. Third, a suitable cell cultivation test regime should be used that allows the cells to be influenced in their development to such an extent that an analogy between biochemical analysis and AI image evaluation is permissible. Ultimately, a practical programme is needed for effective usability, which we provide in the form of the OC_Identifier software (Version 1.0.0, Release date 29.01.2025).

2.1. Create an Osteoclast Specific Dataset

Ordinary cell datasets are not really suitable for training an osteoclast AI. OCs exhibit great morphological diversity and can easily be identified as distinct cells. This is mainly because their transition in cell development is continuous. At the same time, it is difficult to find publicly available OC datasets that are described in sufficient detail, represent OC in their various stages, and provide a sufficient number of microscopic images.
In this case, an effective and cost-efficient solution is to cultivate OCs and incorporate their images into a specific dataset.

2.1.1. Culture of Human Monocytes and Osteoclasts

Human monocytes were isolated from human buffy coats by density gradient centrifugation and subsequent magnetic cell sorting. Briefly, buffy coats diluted with PBS/EDTA/BSA (1:1) were centrifuged in leukosep tubes containing Ficoll-Paque PREMIUM 1.073 g/L (GE Healthcare, Munich, Germany) to obtain the PBMC fraction. PBMCs were collected and further purified using an additional density gradient of 1.063 g/mL (PAN-Biotech, Aidenbach, Germany) to remove platelets. Finally, the mononuclear cells were washed with PBS/EDTA/BSA, and the non-monocytes were magnetically labelled using negative selection with a monocyte isolation kit II according to the manufacturer’s instructions (Miltenyi, Bergisch Gladbach, Germany). The monocytes obtained were collected and seeded at a density of 250,000 monocytes/cm2. Alpha mem with 7.5% heat-inactivated fetal calf serum (FCS) and 7.5% human serum, as well as 1% penicillin/streptomycin and 1% L-glutamine, were used in the basic medium. In addition, 25 ng/mL M-CSF (bio-techne, Minneapolis, MN, USA) and 25 ng/mL RANKL (bio-techne, Minneapolis, MN, USA) were added to the basic medium to induce osteoclast differentiation. The medium was changed every 2–3 days.

2.1.2. Monitoring of the Differentiation Process by Microscopic Analysis

The fusion process of MONs to OCs was followed microscopically, and the images were used to train the AI. The images were taken using a phase contrast microscope (Zeiss AxioVert 40CFL with Zeiss Axiocam ERc 5s camera, Carl Zeiss AG, Jena; Germany). The ZEN 2 software provided by Zeiss was used to collect cell images. Four types of cells were categorized (classes) for training and these are exemplarily shown in Figure 1 as ‘1_or_2_nuclei’, ‘3_or_more_nuclei’, ‘undefined cells’, and ‘monocytes’.
Microscopy was performed with a 20× magnification (scale bar: 50 µm). The cells were microscoped alive in a period from day 6 (D6) to day 10 (D10). A total of 5500 cell photos were collected, of which 5150 were used for labelling and training; the remaining photos were randomly selected for the AI tests. In addition, 1000 photos without cells as the background were collected. These data were used to train the Demo_OC_Identifier.pt (AI model), which was made publicly available under a creative commons licence CC BY-NC 4.0: https://opara.zih.tu-dresden.de/handle/123456789/1247 (accessed on 29 January 2025).

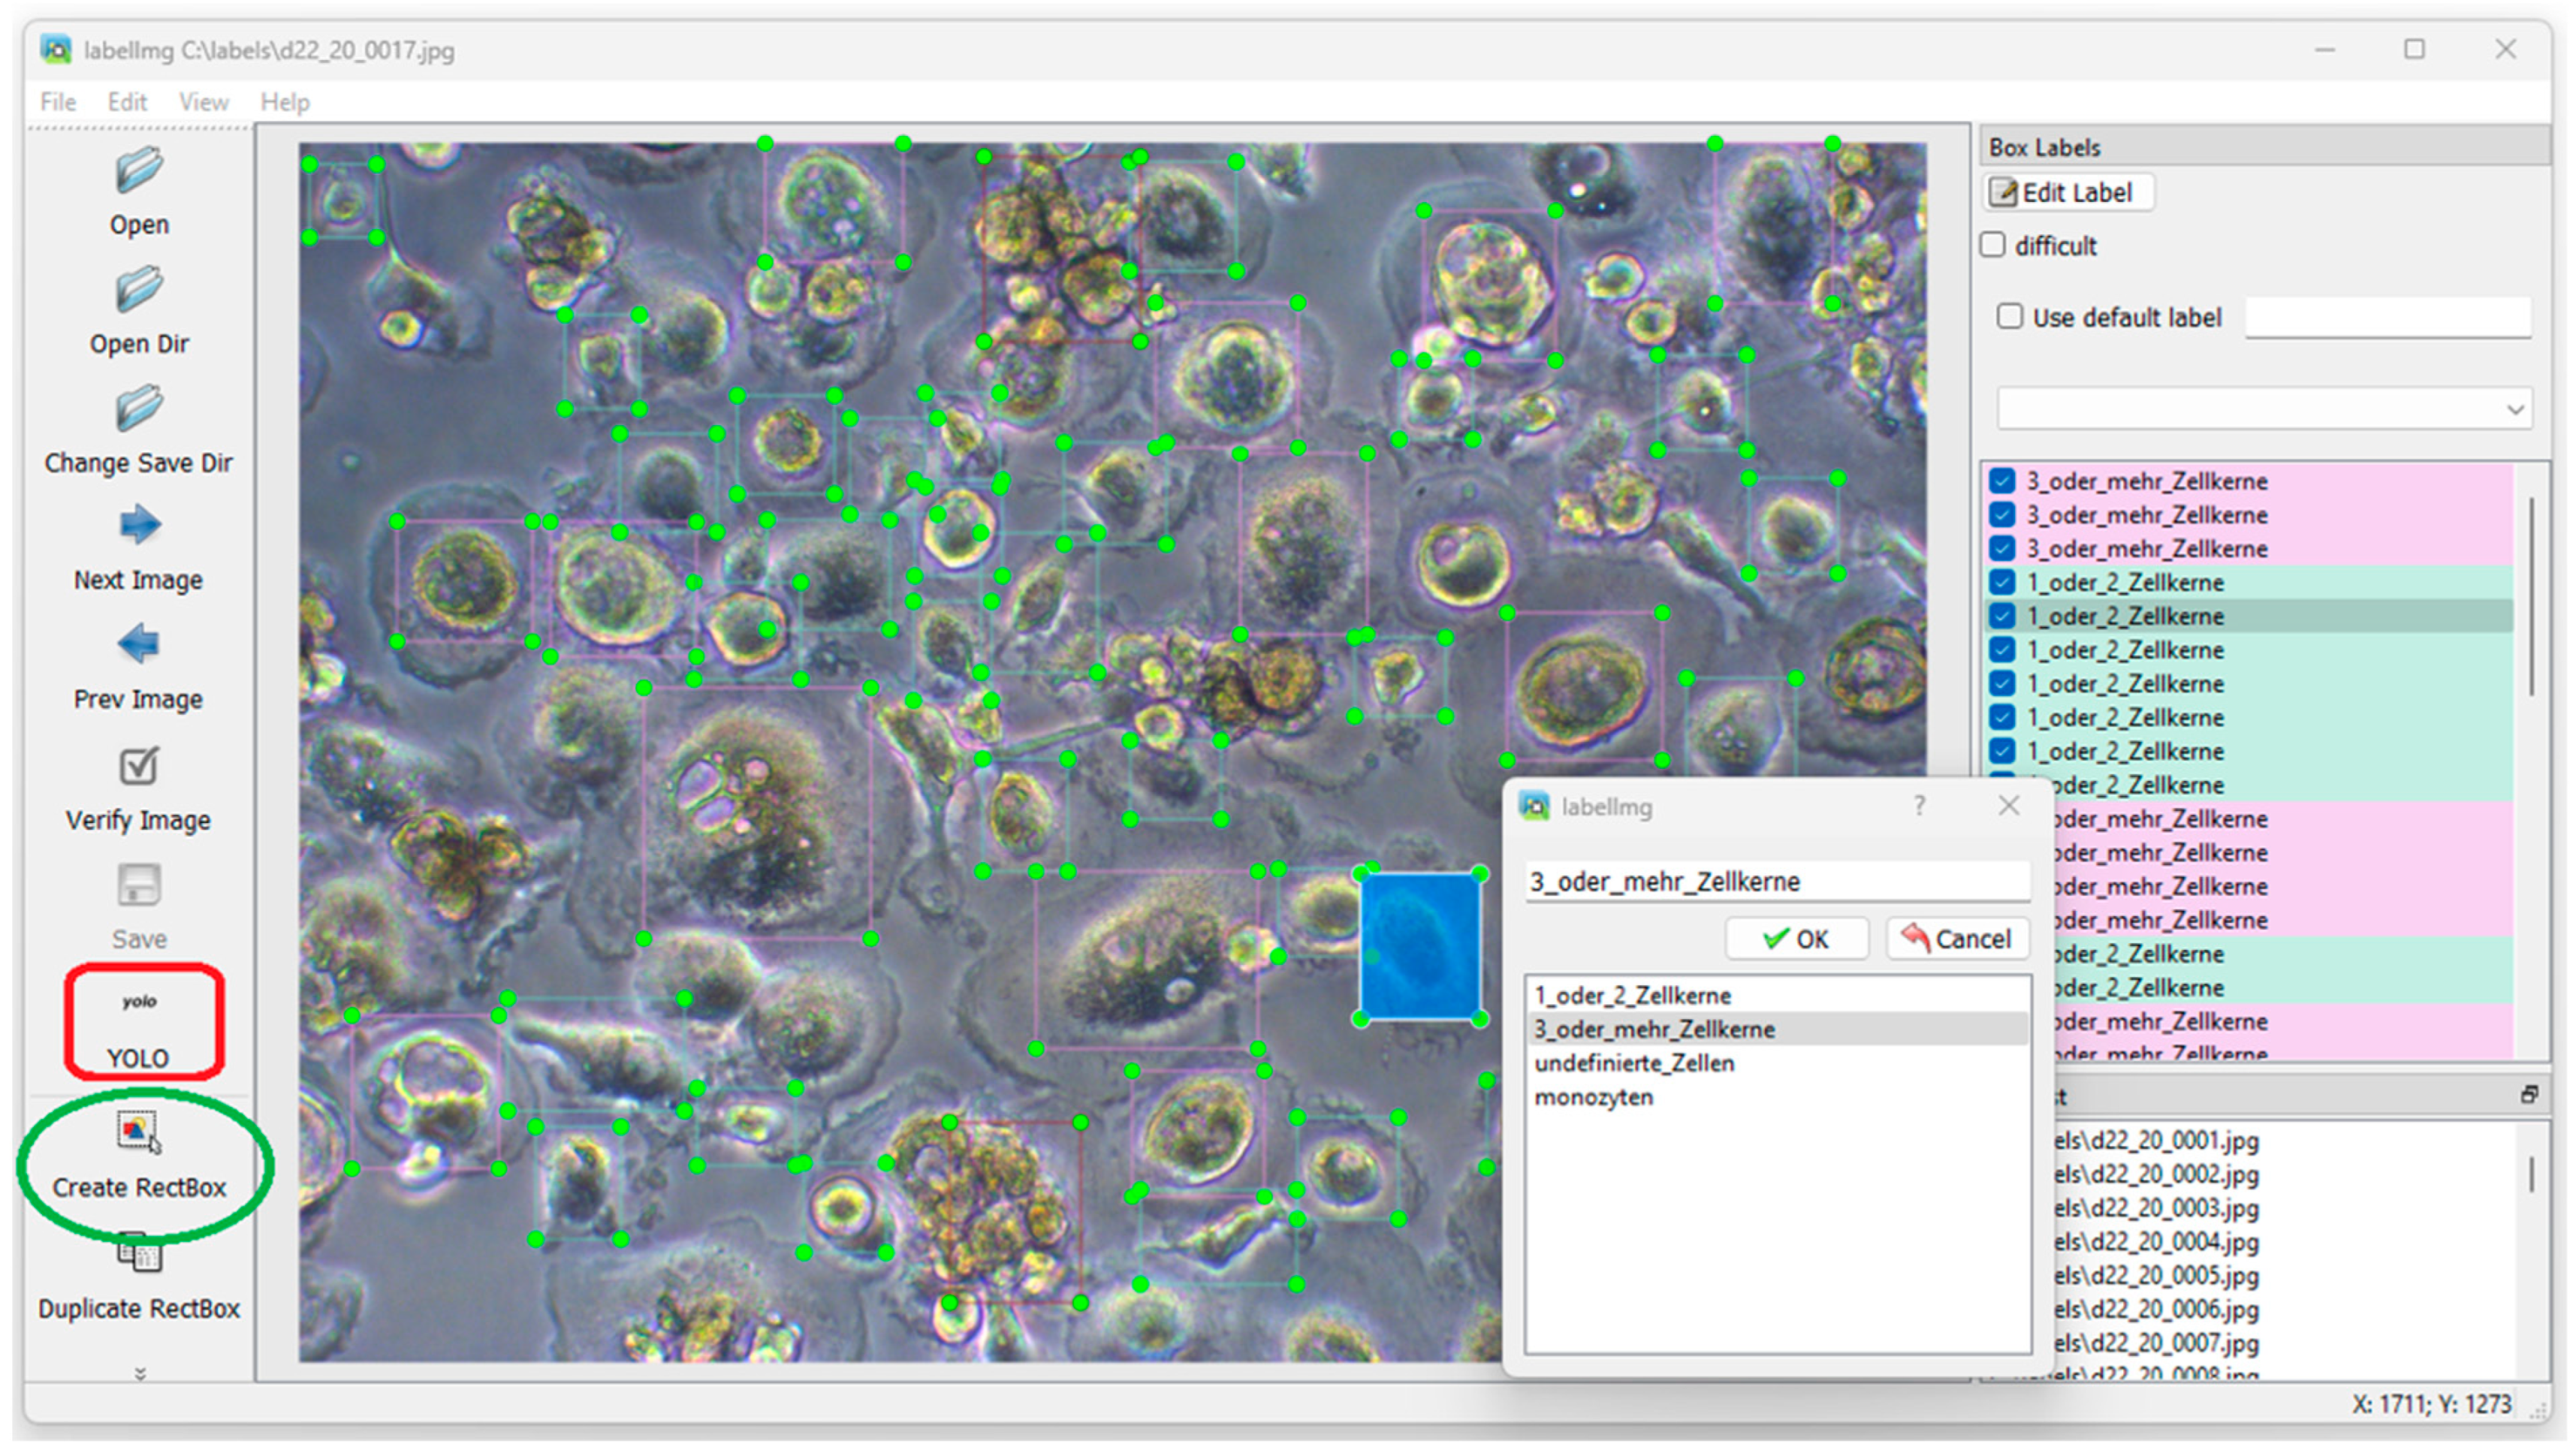
2.1.3. Performing Manual Labelling with LabelImg

After taking the cell images, the preparations for the AI training began. During training, images and labels must be prepared and processed simultaneously. The labelling is performed manually by highly experienced cell culture experts with LabelImg. As shown in Figure 2, the mode was set to YOLO. Then, in the left-hand toolbar, we selected the folder in which the file to be processed was located and the folder in which the generated labels were to be stored.
After that, the cells were marked manually using ‘Create RectBox’ (Figure 2). For this, it is important that the labelling is carried out by trained people with a good knowledge of the various cell development stages. Individual cells must be marked with a green rectangle and assigned to the four classes defined previously in the dialogue box.
When all desired cells have been labelled from an image, whereby poorly identifiable cell agglomerates should also be omitted, the labelled image is saved. At this point, a ‘classes.txt’ file and a label with the same name as the image are created in the selected output folder. In our study, the labelling process was carried out on more than 6100 images and resulted in over 150,000 labelled cells and objects from the four classes.

2.2. Training of Osteoclast AI Based on YOLOv5

This study utilized YOLOv5m as the core machine learning architecture for osteoclast detection, capitalizing on its real-time object detection capabilities and well-established framework. YOLOv5 is an AI open-source framework developed by Ultralytics for computer vision. It should be noted that not all YOLOv5 variants are suitable for actual AI training (YOLOv5n and YOLOv5n6 are only used for testing with trained AI). In the present study, YOLOv5s and YOLOv5m were used because they have the simplest code structures and the fastest training speeds. To achieve better training results, you could use YOLOv5l, YOLOv5x, or higher versions such as YOLOv6 as a framework for training. In this article, a laptop with a 3070 graphics card was used, and the YOLOv5m framework was selected.
The architecture comprises three key components: CSPDarknet53 as the backbone for feature extraction, a Path Aggregation Network (PAN) to enhance feature fusion, and a YOLO detection head responsible for bounding box prediction and classification. No structural modifications were made to the YOLOv5m framework, ensuring full reproducibility. Initially, object counting and ratio calculation functions were integrated into the YOLOv5 code, but they were later transferred to the graphical user interface (GUI) to maintain the integrity of the original YOLOv5 implementation.
A two-stage training strategy was employed to optimize model performance. In the overfitting phase, the training and validation sets contained identical images, allowing the model to capture dataset-specific features thoroughly. In the subsequent generalization phase, a separate validation set composed of entirely new images was introduced. The model was fine-tuned using weights from the overfitting phase, improving its ability to generalize to previously unseen samples. Hyperparameters were set according to standard YOLOv5 configurations, with an image size of 640 × 640, pre-trained YOLOv5m weights (yolov5m.pt), and the Stochastic Gradient Descent (SGD) as the optimizer. The initial learning rate followed YOLOv5’s default settings, while the batch size was set to 8. The training was conducted over 300 epochs per phase, with iterative refinements at 350, 500, and 600 epochs during the generalization phase. Training commands adhered to YOLOv5’s standard workflow, employing train.py for initial training and train_continue.py for subsequent fine-tuning.
To enhance model robustness and mitigate overfitting, YOLOv5’s built-in data augmentation techniques were leveraged without additional manual modifications. This included mosaic augmentation, which combines four images into one to expose the model to varied object scales and backgrounds; HSV colour space transformations were used for hue, saturation, and brightness adjustments; random cropping was used to simulate diverse object placements; scale jittering was used to improve multi-scale detection; and horizontal flipping was used to account for symmetric variations in osteoclast morphology. These augmentation strategies were applied automatically through YOLOv5’s pipeline, ensuring a systematic approach to improve detection accuracy across different imaging conditions.
The training, as the crucial step in developing an OC-specific AI, was carried out with a previously generated dataset. To achieve this, the dataset was placed in the YOLOv5 framework, and the AI model was generated through multiple training rounds. The training was conducted in four rounds, as shown in Table 1. Various hyperparameters, including the number of convolutions and image segmentation techniques, were set to achieve optimal performance. During the training process, the models were regularly checked, and the confusion matrix and precision–recall curves were used to assess whether training should be stopped.

2.3. Osteoclast Cultivation with Varying Differentiation Additives

In order to better evaluate the AI test and compare it with the results of standard biochemical analysis, an experiment was established in which human monocytes were cultured with different concentrations of RANKL as well as two different media. Monocytes, separated as described in Section 2.1.1, were seeded on 48-well Upcell plates (Thermo Fisher Scientific™, Braunschweig, Germany) in a concentration of 3 × 10⁵ MONs in a 500 µL basic medium containing 25 µg/mL M-CSF. After day 3, the cells were further cultivated with different medium compositions, as shown in Table 2. Compared to the standard concentration of 25 µg/mL, RANKL either doubled (50 µg/mL) or halved (25 µg/mL) in the medium (OC-M) in order to investigate the influence on osteoclast differentiation (Table 2). In addition to the basic medium (BM) with M-CSF/RANKL, hBMSC-conditioned medium (HC-M) was also used. The CM is produced by cultivating hBMCS in ALPHA-MEM containing 10% heat-inactivated FCS, 1% P/S and 1% L-glutamine. The medium supernatant was frozen as a stock when the medium changed. For the preparation of the CM for the experiment, the stock was mixed 1:1 with a basic medium, resulting in an identical final concentration of supplements (7.5% heat-inactivated FCS, 7.5% human serum, 1% P/S and 1% L-glutamine) for BM and HC-M. For CM, a combination completely without M-CSF and RANKL was also tested. The medium was changed every 2–3 days. During the experiment, images were taken on days 6, 8 and 10 and analyzed with AI.

2.4. Biochemical Analysis

After days 2, 6 and 10, the cells were washed with PBS and frozen at −80 °C until analysis. Frozen cells were lysed with 1% Triton X-100 (Sigma, Steinheim, Germany) in PBS, and the DNA amount, tartrate-resistant acid phosphatase (TRAP) 5b, and carbonic anhydrase (CA) II activity were determined colorimetrically using a SpectraFluor Plus microplate reader (Tecan, Crailsheim, Germany) as described below.
DNA assay: The number of cell nuclei was determined by a DNA measurement using the Quant-iT™ PicoGreen® dsDNA reagent according to the manufacturer’s instructions. Briefly, 10 µL of the lysate was incubated with 200 µL of the Picogreen working solution. The obtained fluorescence intensity at an excitation/emission wavelength of 485/535 nm was correlated using a calibration curve of known cell (nuclei) numbers of monocytes.
TRAP 5b activity assay: TRAP 5b was measured as described in [23]. A substrate buffer (50 µL) containing naphthol–ASBI phosphate (2.5 mM N-ASBI-P (Sigma), 50 mM Na-tartrate (Sigma), 2% NP-40 (Sigma), 1% ethylene glycol monomethyl ether (Sigma) in 0.1 M Na-acetate (Sigma) buffer, pH 6) was mixed with the lysate (10 µL) and incubated at 37 °C for 1 h. The enzymatic reaction was stopped by adding 0.1 M NaOH, and fluorescence was measured at 405/535 nm. The fluorescence units were calculated for activities using a TRAP-5b standard.
CA II determination: The activity of CA II was measured using 2 mM 4-nitrophenyl acetate (Sigma) in 12.5 mM TRIS (Tris(hydroxymethyl)aminomethan (Carl Roth) and 75 mM NaCl (Sigma) at pH 7.5. For the measurements, the lysate and substrate buffer were mixed 1:1 in microtiter plates, and the absorbance was measured after 5 min of incubation time at 400 nM. Calibration was performed using a dilution series of 4-nitrophenol.

3. Results

In this work, an AI model for analyzing osteoclasts was developed and tested under various experimental conditions. The results include the comparison of cell counts determined by the AI technology with manual counts, the evaluation of training efficiency, and the correlation of biochemical data with the AI models. First, the analyses to evaluate AI training and training epochs are presented.
During microscopy for the training data, both fixed cells on day 5 (D5) and living cells from day 6 to day 28 (D6-D28) were used. The training data, thus, came from a longer cultivation period of up to 28 days, while the actual cultivation period under varied differentiation additives was the usual 10 days for osteoclast experiments. However, since cell morphology changes after fixation, only living cells were subsequently used under the microscope in this study. For this, the times for microscopy had to be kept short so that the change in CO2 partial pressure outside the incubator did not damage cell development. The advantage of this method, however, is that the entire development of the cells could be traced using the same cells. It should be noted that cells were removed in the meantime for biochemical analyses, which meant that fewer and fewer replicates were available for microscopy.

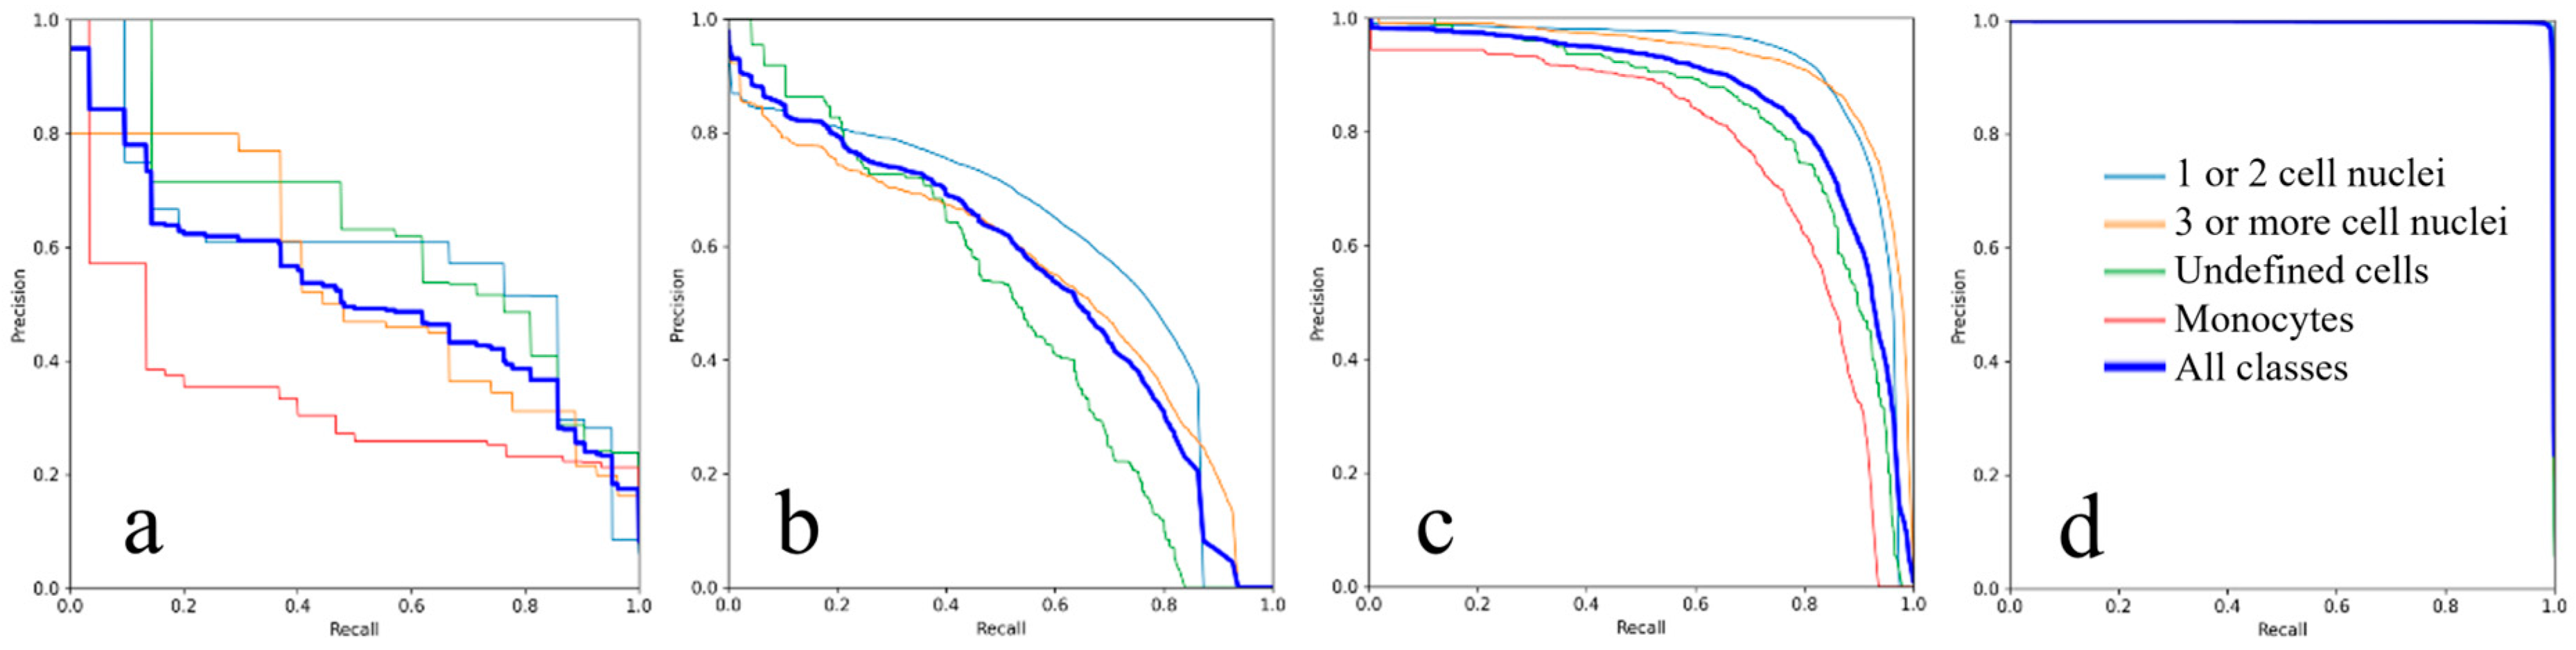
3.1. Evaluation of the AI Training

To test the accuracy of AI, the trained model was applied to unknown cell images that were not part of the training dataset. The model’s predictions were compared with the results of manual cell counting and biochemical tests. A properly trained AI model is the most important result of the training. Each training generates two files: ‘best.pt’ and ‘last.pt’. ‘best.pt’ represents the model with the best training result among the 300 training cycles. ‘last.pt’ is the result of the last training cycle (the 300th cycle), which can be used as a starting point for a new round of AI training. The precision–recall curves for the training modes listed in Table 1 are shown below, giving insight into a suitable amount of training data (‘fitting’).
The training data of all four classes was prepared so that the content of the ‘train’ and ‘val’ folders were identical to start the training. If the model tended towards overfitting (Figure 3d), this indicated that the existing training images were sufficient to extract the relevant features and that no further material needed to be added. If, for example, a curve showed no overfitting in the form of a maximum for precision and recall, this meant that the training material for this cell type needed to be extended. However, overfitting resembles a form of ‘memorisation and reproduction’ and prevents the actual modelling ability from learning. Therefore, if overfitting occurs, the content of the ‘train’ and ‘val’ folders must be completely different in order to retrain and eliminate this undesirable condition. In this step, the curve returns from the state of overfitting to the desired state of the appropriate fitting.

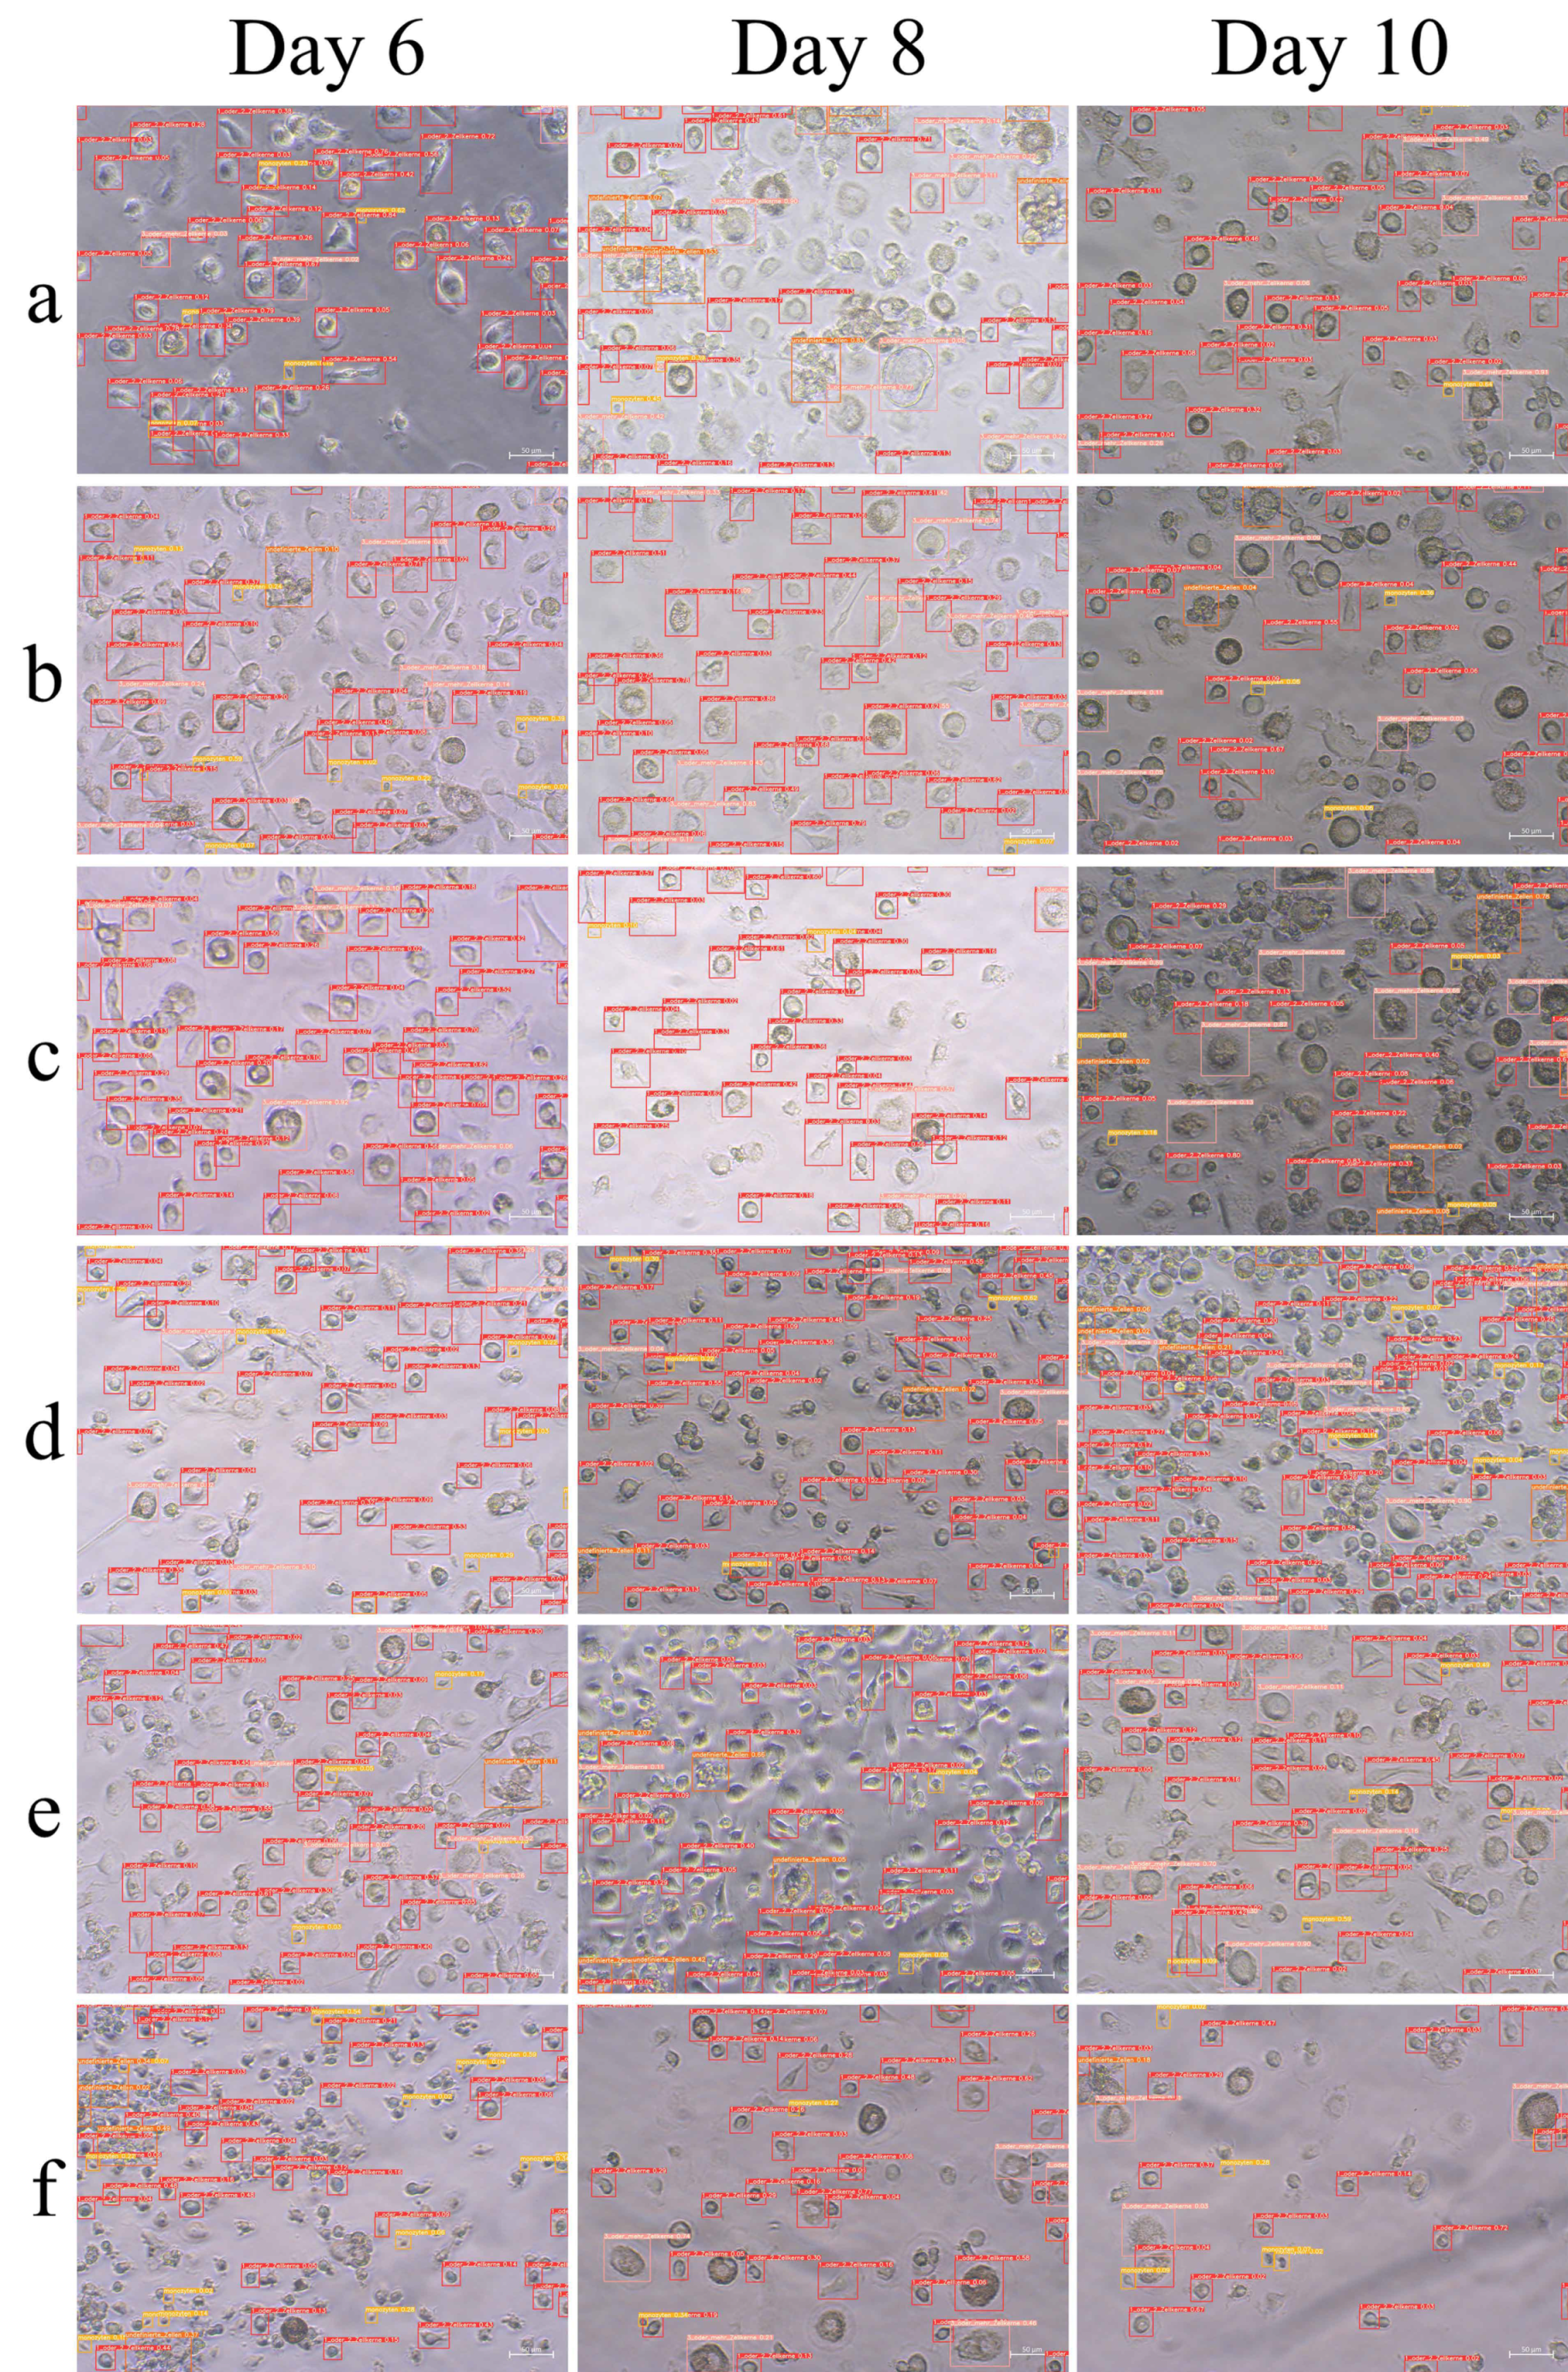
3.2. Comparison of Osteoclast Images: Manual Counting vs. AI Recognition

A crucial aspect of the analysis is the comparison between manual counting and cell counting performed by the AI. Several images (108 in total, out of which 18 are shown here) were counted manually, and these results were compared with the AI analyses. The AI showed a faster speed in cell counting and calculating ratios. It was particularly striking that the AI achieved a significantly higher recognition rate for simpler cell structures, which, for example, achieved a recognition rate of 97% (36 out of 37 OC) in Figure 4a–c. However, for more complex image structures (Figure 4d–f) with cell overlaps, the AI was less precise than manual counting. For example, 27 cells with one or two nuclei and 13 osteoclasts with more than three nuclei were identified here, while the manual count found 28 cells with one or two nuclei and 15 osteoclasts with more than three nuclei.
A total of four rounds of AI training were conducted. The first round comprised 2000 images, while 500 additional images were added in each subsequent round. After each training round, the AI models were tested on the same image series. The results showed a progressive improvement in the AI’s detection performance, particularly in the later rounds, where precision increased and classification errors were reduced.
After this first check, the correctness of the AI was also compared to the manual count for the culture experiment with varied differentiation supplements. In this analysis, 18 images were evaluated by the AI (see Figure 5). The results of the AI-based image analysis were then compared with the manual counts, as shown in Figure 6. It was found that the recognition rate was higher for simpler image structures, but overall, the time points were analyzed without significant differences in precision. Although the recognition rates of the cells were still expandable at 72–88%, this statement is important for evaluating the current performance of the AI. Moreover, based on the similar shape of the precision–recall curves in Figure 3, it can be assumed that all cell classes were identified equally well or poorly.

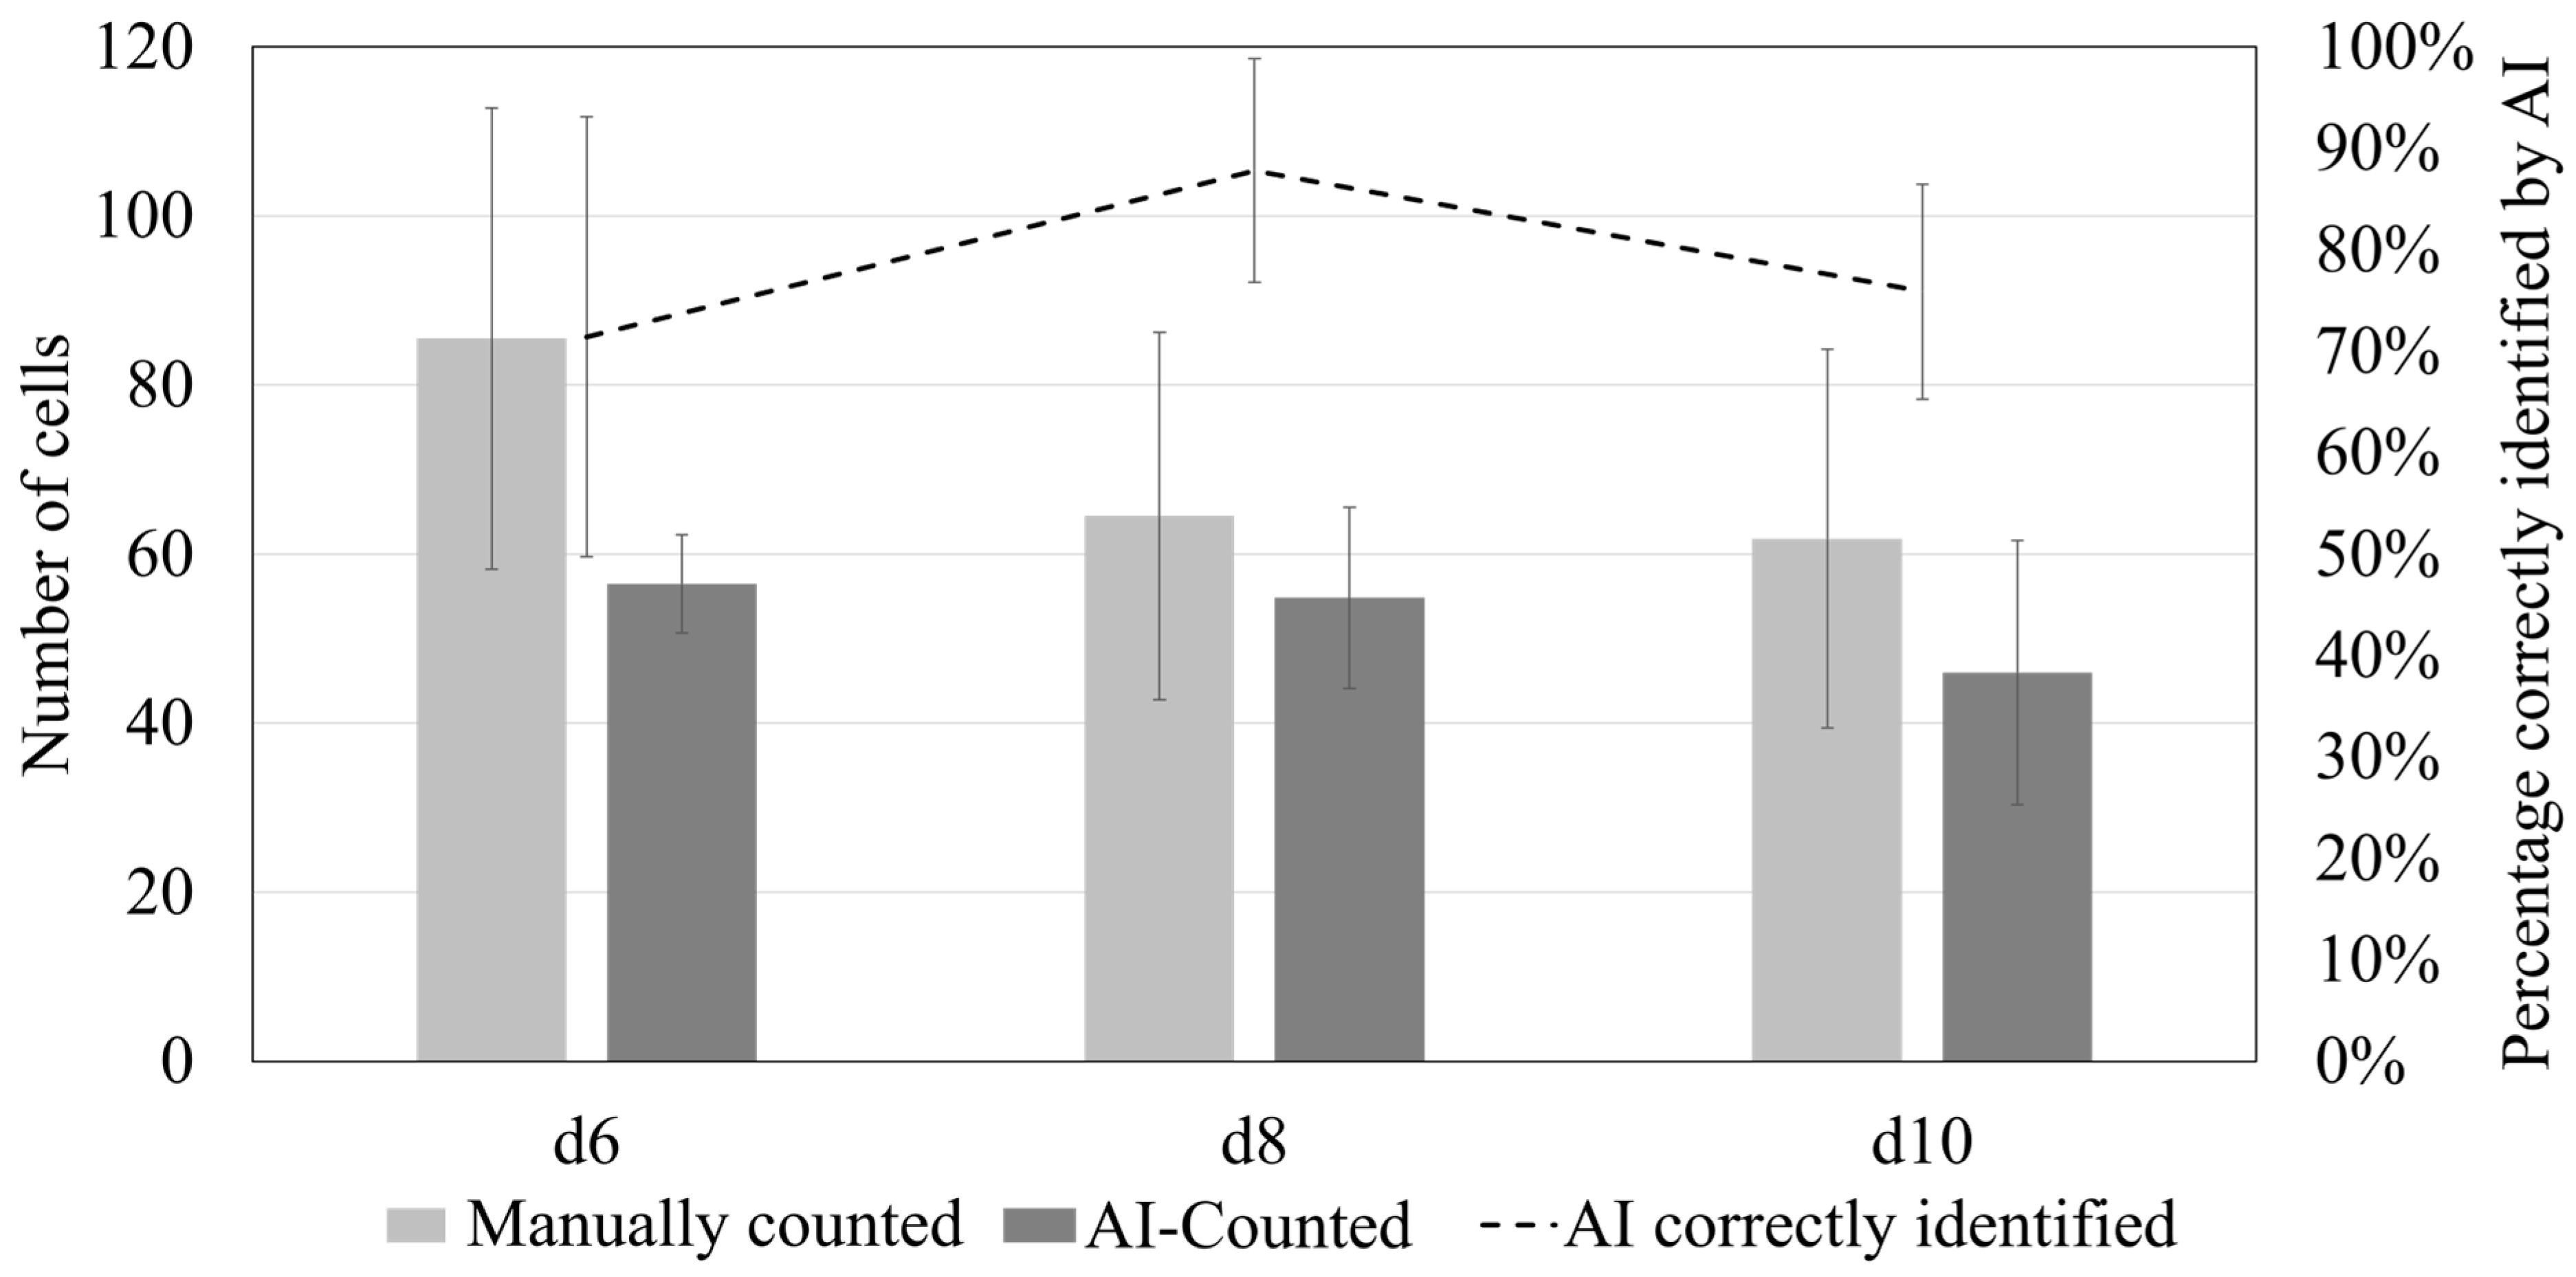
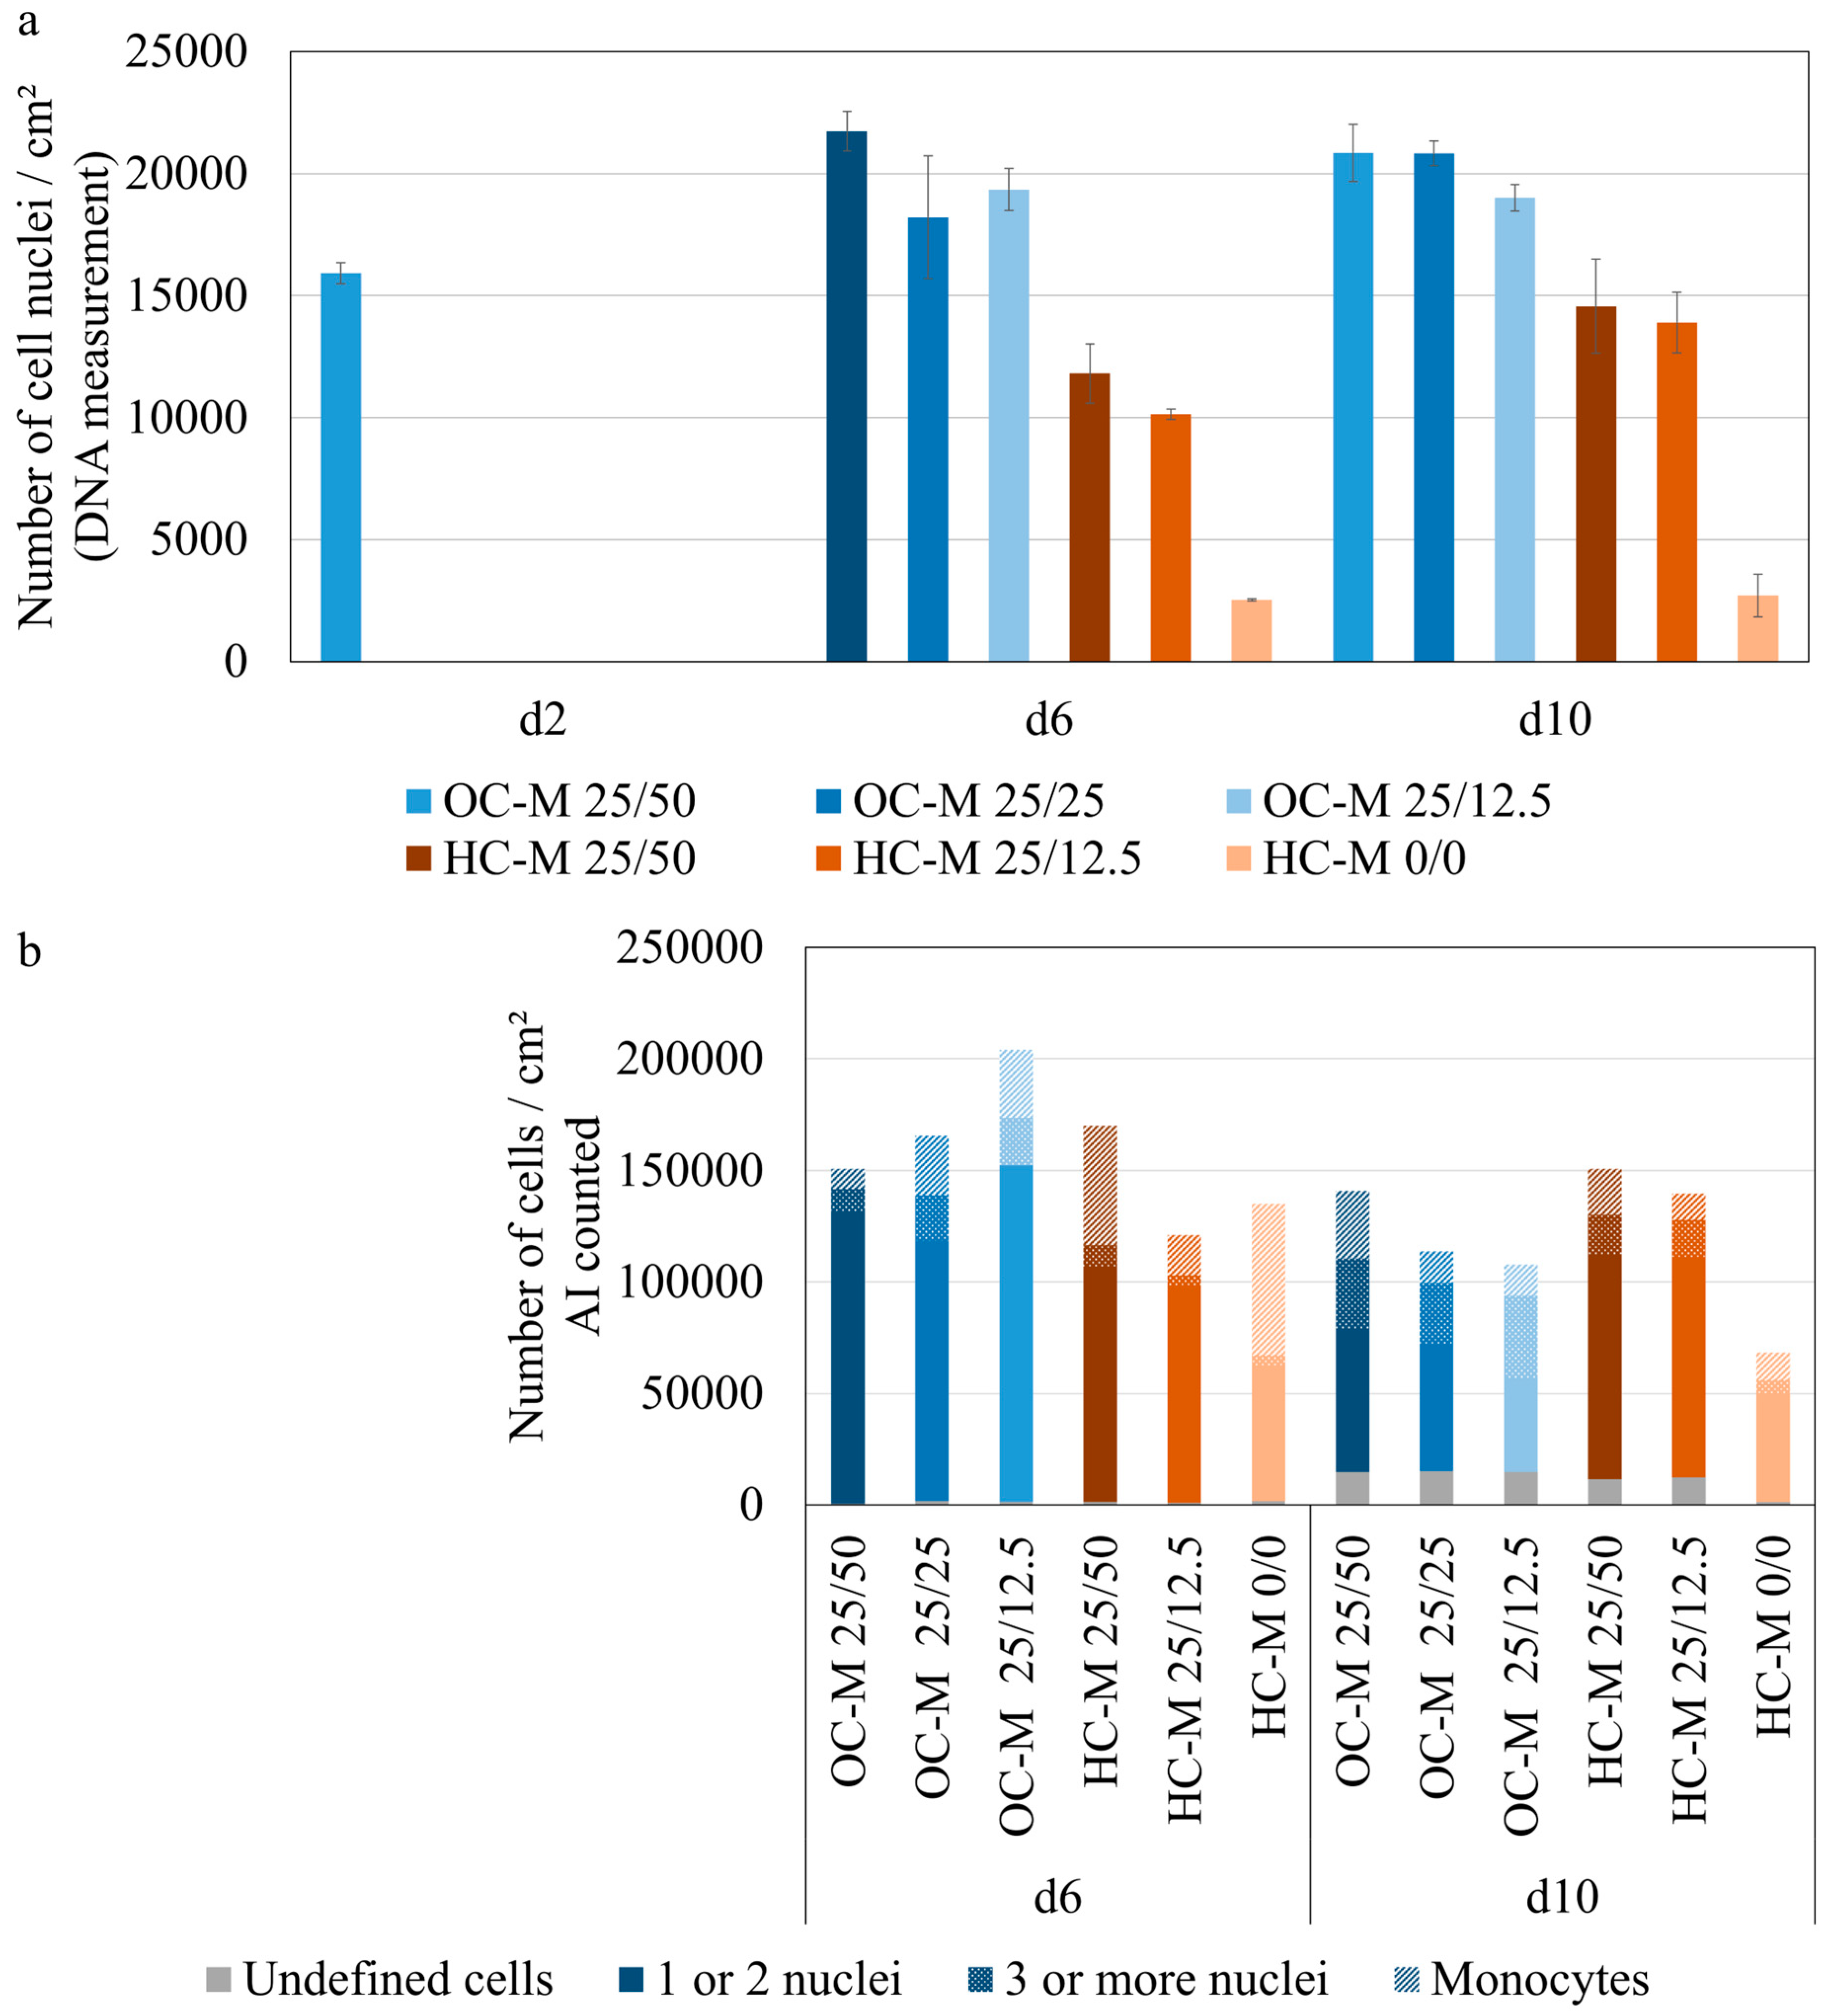
3.3. Evaluation of Osteoclast Image Analysis Using Osteoclast AI

After the AI training, the AI model was used to analyze new cell culture samples in real time. The AI model was used for the automatic counting and classification of cells based on their morphological characteristics compared with the results of biochemical analyses. Generally speaking, the AI model was used to evaluate unknown images. In this work, a total of six different culture conditions for osteoclasts were examined, with biochemical analysis carried out on days 2, 6, and 10. The main difference in this culture is the use of differentiation media in different amounts and proportions. The differentiation medium was always prepared with 25 ng/mL M-CSF, and the addition of RANKL varied. One medium contained the usual amount of 25 ng/mL RANKL as a reference. However, the amount of RANKL was also doubled to 50 ng/mL and halved to 12.5 ng/mL to examine the influence on osteoclast differentiation. In addition, a conditioned medium was used. In this case, the medium was used to culture human mesenchymal stem cells or osteoblasts and then used without additives or with the addition of 25 ng/mL M-CSF and 25 ng/mL RANKL as well as 25 ng/mL M-CSF and 12.5 ng/mL RANKL. Since the induction of osteoclast cell maturation only occurs from day 3, the measurement on day 2 should be considered a control of the initial cell number of monocytes without resorptive activity. Thus, the comparison of osteoclast maturation was based on the biochemical data from days 6 and 10. Since the examination using KI was significantly faster and gentler on the cells, further days could be analysed with ease with microscopy and AI in addition to days 6 and 10.
The cell count from the DNA measurement showed significantly higher values for the standard osteoclast medium (OC-M x/y) and its varied M-CSF/RANKL ratio (Figure 7a), in contrast to the cell counts for the hMSC pre-conditioned media (HC-M x/y). This is due to the reduced nutrients resulting from the pre-cultivation of hMSC. The fact that the MONs do not adhere without M-CSF and without RANKL or die to a certain extent means they can no longer be detected after the media changes, which is also due to a lack of differentiation pressure since only the macrophage/osteoclast line promotes the adherence of the cells, while monocytes circulate in the bloodstream (normally 1–3 days) and are not necessarily adherent [24]. The absolute cell counts refer to the size of a 48-well plate, i.e., 1.1 cm2. Overall, no increase in cell number was expected since MONs and OCs are post-proliferative and only fuse to form larger cells. This makes DNA a fundamentally limited diagnostic tool for osteoclast cell development.
AI-based image analysis immediately reveals an advantage, as it provides additional information that enables the differentiation of cells according to their number of nuclei (Figure 7b).
As can be seen, the number of cells with only 1–2 nuclei decreased over time from the osteoclast culture, and the number of MONs also decreased, with a greater decline in MONs from day 6 to day 8 in particular. Meanwhile, the number of cells with three or more nuclei increased significantly, and a certain increase in undefined objects could also be seen. It should be noted that although the cells were distinguished based on their number of nuclei using the AI-based evaluation, the representation reflected the number of cells, i.e., MONs or mono- and multinuclear OCs. This also resulted in the trend towards lower cell numbers after the AI evaluation of the later time points, while the DNA-based evaluation reflected a number of nuclei that were independent of the cell number. The AI-based method provided a more precise description of the mixture of different cells, which is particularly valuable for the further use of the cells, e.g., in biomaterial characterization, as it provides an indication of the proportion of resorption-competent multinucleated OCs available.
A clear difference can be seen with both measurement methods for the different cultivation conditions. Although the ratios of M-CSF and RANKL do not appear to have a significant influence on OC maturation, the hMSC-conditioned medium causes a lower number of cell nuclei after 6 and 10 days according to the DNA measurement (Figure 7a) and the ability to form three or more multinucleated osteoclasts according to the AI evaluation is significantly reduced (Figure 7b), while especially on day 6 the proportion of MONs is still significantly higher in a standard OC medium. This shows once again that the cells counted in Figure 7b provide a new scope for interpretation according to their type and not just a blunt summation of the cell nuclei. Although the decrease in the number of cells from day 6 to day 10 is confusing at first glance since there is a higher number of fused, i.e., large osteoclasts on day 10, the number of monocytes and so the total number of cells is of course reduced all the more significantly. Thus, a more pronounced drop in the total number of cells after AI counting is a positive sign of osteoclastogenesis. This also explains the lower cell numbers on day 10 for the OC-M compared to the HC-M, which has been shown to have a less pronounced osteoclast-stimulating effect. The nutrient deficiency, combined with the lack of differentiation pressure in the hMSC-conditioned medium without the addition of RANKL and M-CSF, is particularly evident. Here, a significant decrease in DNA can be seen, and on day 10 of the AI evaluation, the total number of cells was significantly lower than in all other culture conditions.
Particularly noteworthy is that the AI was able to analyze osteoclasts without interfering with the cell cultures, highlighting the non-invasive nature of the AI analysis. While biochemical analyses focused on the total number of cell nuclei, AI was able to count the cells as a whole and use their morphological characteristics for classification.

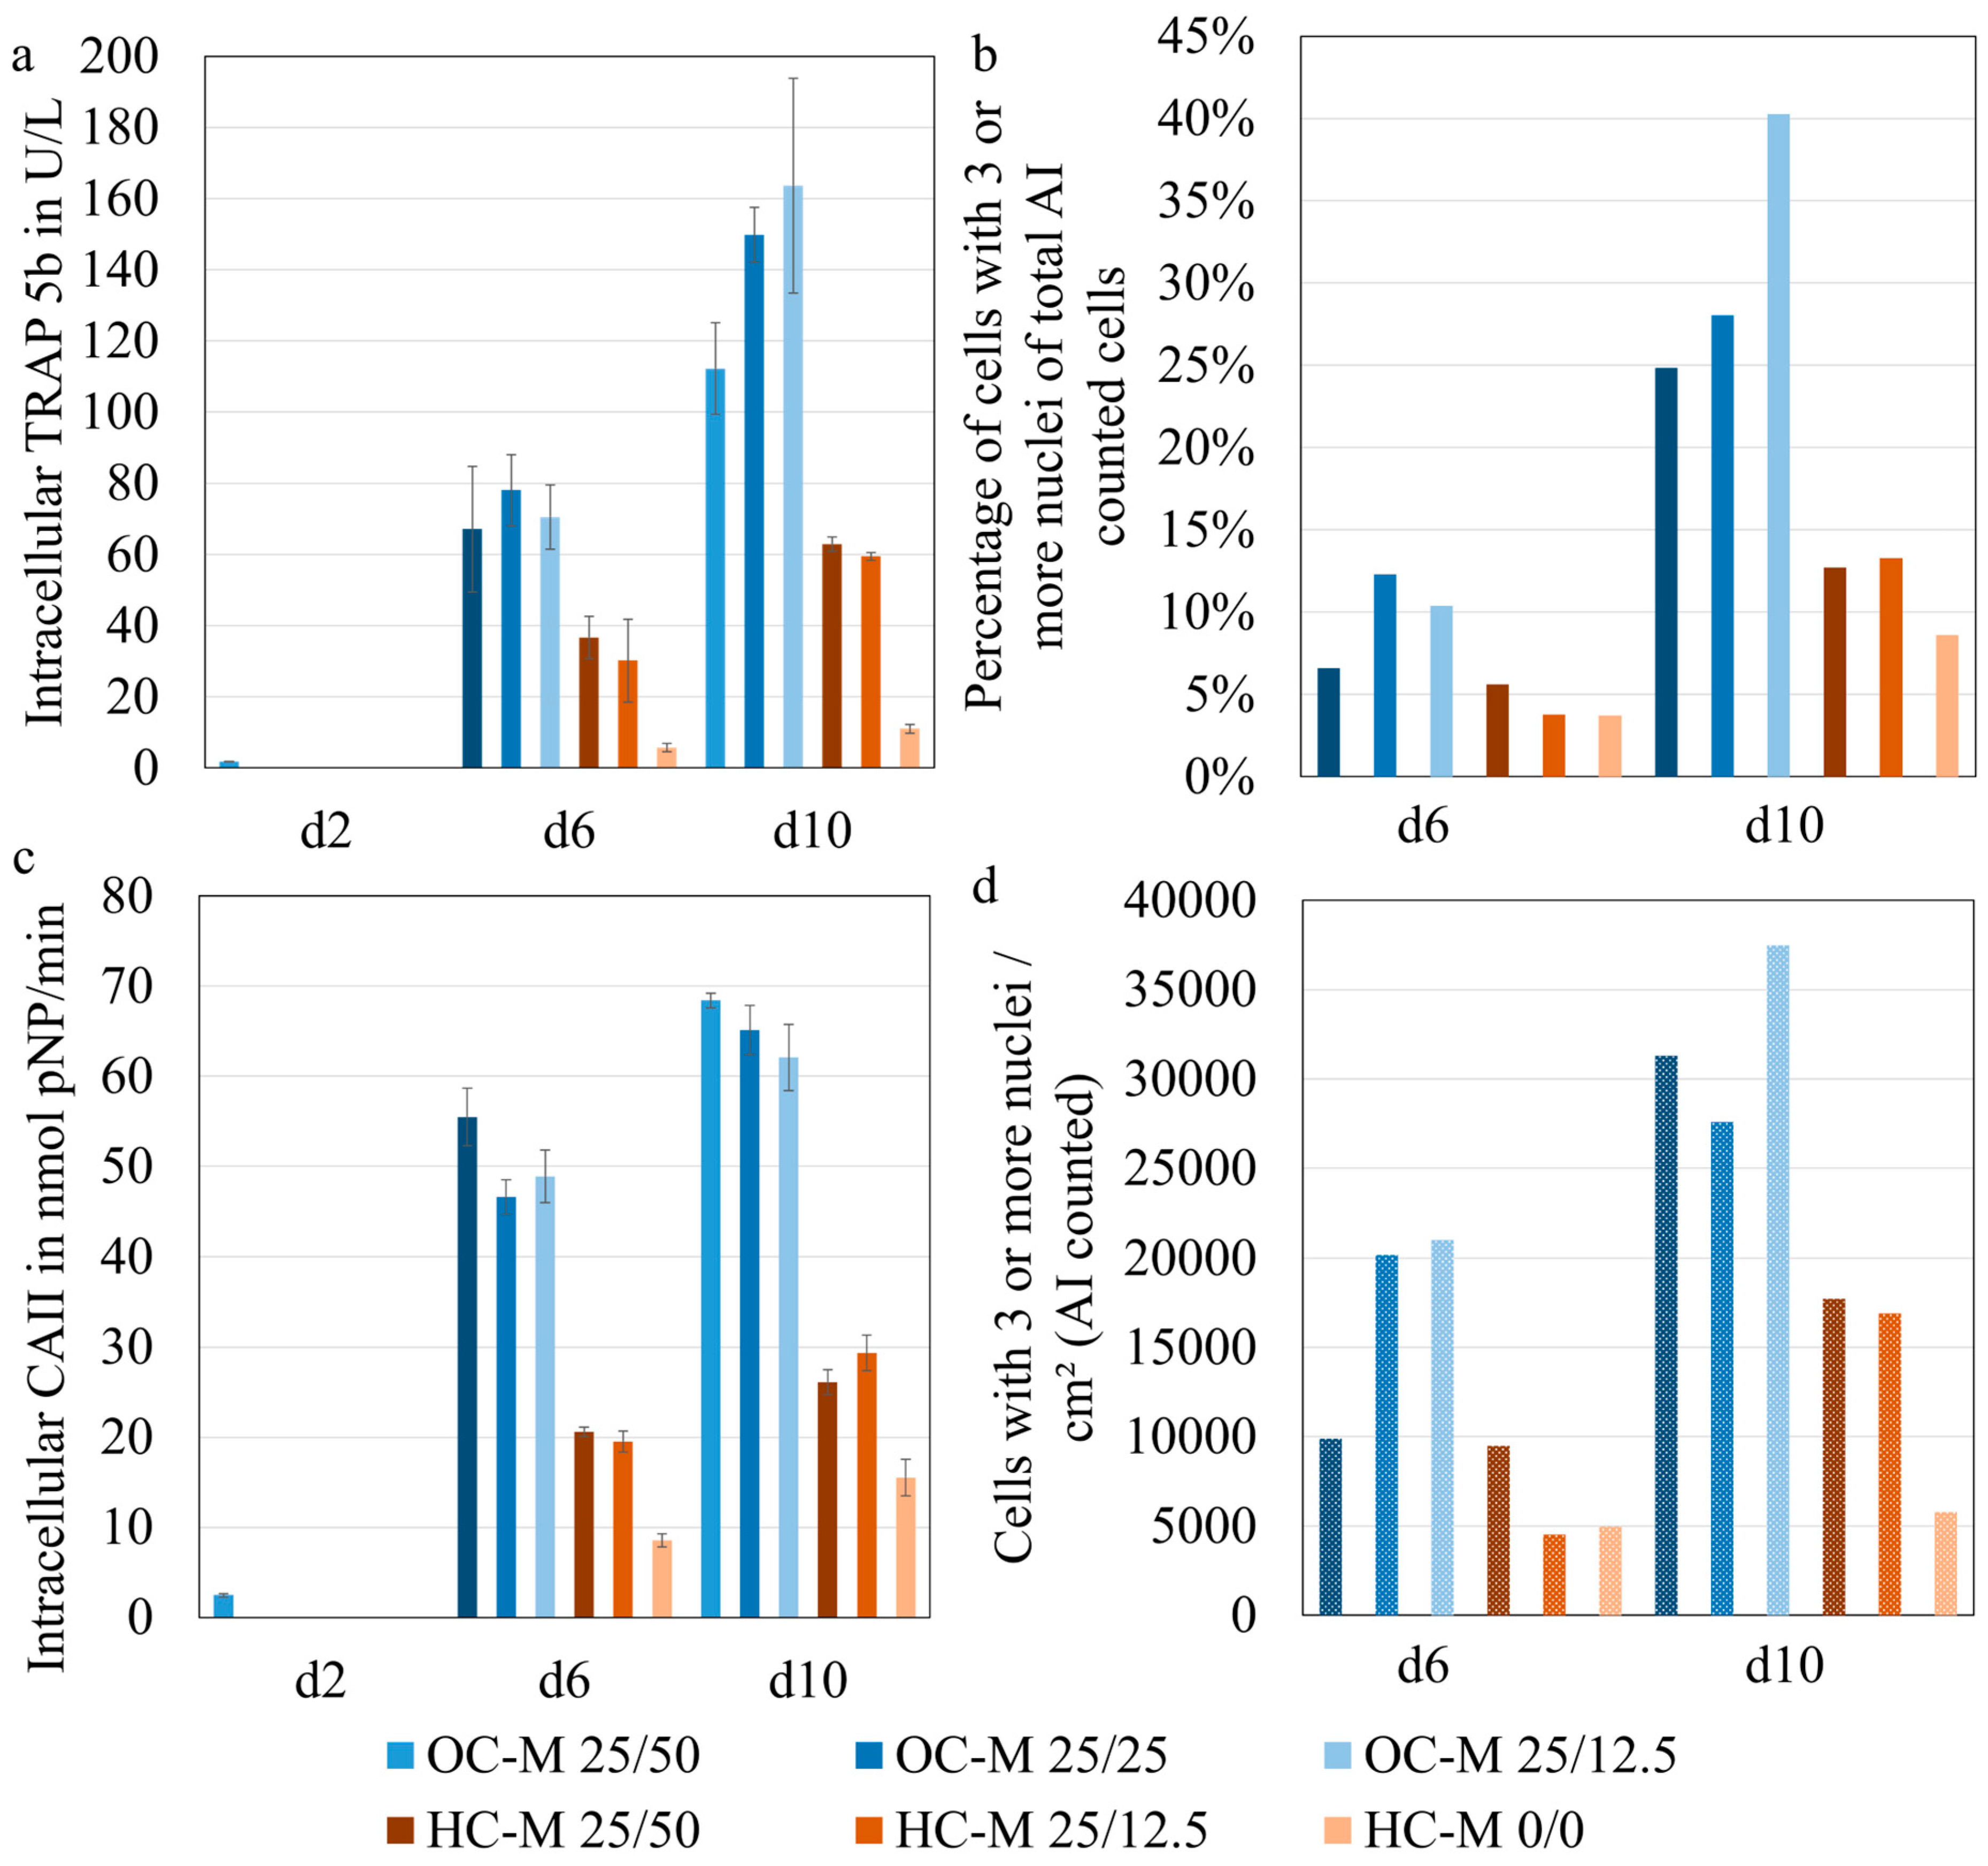
3.4. Determining the Degree of Maturation of Osteoclasts

Another important aspect was determining the maturity of the osteoclasts. The following diagrams show one possible interpretation, which will need to be further developed and evaluated in the future. Based on the available data for the individual cell classes, it seemed particularly useful to compare the maturation and resorption markers with parameters of the three or more nuclei cells, i.e., the assumed mature osteoclasts. In this case, both the time and the conditions of the data showed great similarities for the measured intracellular TRAP 5b activity (Figure 8a) and the percentage of cells with three or more nuclei related to the total number of AI-counted cells (Figure 8b). The isoenzyme 5 b of the enzyme TRAP is most specific for osteoclasts and is considered to reflect the number, but not necessarily the activity of osteoclasts [25].
In the selected comparison of carbonic anhydrase CA II (Figure 8c) and the counted number of osteoclasts with three or more nuclei (Figure 8d), the similarities initially appeared to be slight. However, there was a certain proportional correlation between CA II on day 6 and the number of OCs on day 10. This similarity could indicate that the biochemical markers are only reflected with a delay in morphological features that represent osteoclast maturation.

4. Discussion

4.1. AI for Osteoclast Identification and Determination of Maturation

In the course of developing AI for routine cell culture support, osteoclastic cells, formed from monocytes, have proven to be excellent training and research material. On the one hand, there is a clear difference between the original cells and their condition in the mature and differentiated osteoclastic states. From small mononuclear cells to large multinuclear cells, the difference is very clear.
In accordance with the literature, such as the studies on monocyte images and osteoclast images by Osdoby et al., Muschter, Boyle et al., and Bernhardt et al., the cells cultivated under different conditions also show clear morphological differences [26,27,28,29] that could be evidently identified by AI. These results demonstrate the ability of AI to precisely determine the state of maturation [18,22,26,30]. Furthermore, the fusion of cells is a process that cannot be adequately reflected by simple DNA analysis to determine the number of cell nuclei using a calibration series. Thus, it is also imperative to carry out a better analysis. The size of the cells alone is not sufficiently meaningful either, which means that purely size-based counting methods are also not sufficient. In addition, there is the fact that osteoclasts, for example, are usually only used in the characterization of biomaterials when they have completed the fusion process and are actively resorbing. Therefore, artificial intelligence -based identification and counting is expected to be particularly helpful in the future. Since even the counting of very small monocytes and possibly very large osteoclasts using classical counting methods not only takes a long time but requires trained personnel and is also not usable for large cells, the use of rapidly absorbable light-microscopic images and their analysis could also be very good for time-saving without a major influence on cultivation. This depends on the computer used, wherefore it takes only a few fractions of a second—in our case, with a rather simple computer (as often found in laboratories), the process took on average only 0.2–0.4 s per image.
The selected training data and the four classes for labelling can be considered well chosen with regard to further evaluation. According to Boyle et al., osteoclastogenesis can be divided into four stages [27,29]. Osteoclasts mature from multipotent bone marrow precursor cells via the fusion of specific pre-osteoclasts through sequential stimulation with the macrophage colony-stimulating factor (M-CSF) to fused polykaryons and with the receptor activator of nuclear factor B ligand (RANKL) to activated osteoclasts.
These stages are well represented by the three selected monocyte classes, with one and two nucleated cells and three multinucleated cells. The class of undefined cells is also used to capture culture-related outliers in cell development, for example, if the optimal conditions for osteoclastogenesis are not selected. Furthermore, it is an essential part of AI training to also take pictures of the background, i.e., the polystyrene culture plate with the medium but without cells, but this is not trained as a separate class.
In principle, it should be noted that an increase in the training data (i.e., the labelled cells on the existing images as well as on new images to be created) is of great advantage for the training of AI and for its recognition accuracy. Nevertheless, the precision and recall curves already show that the training quality is very good depending on the epochs of the training.
The six conditions used in this study to cultivate osteoclasts were used in the first round of cell culture to collect photos of cells for use in AI training. In the second round of cell culture, cells were used for biochemical analysis, and photos were collected for the AI test. Finally, the results of the AI analysis and the biochemical analysis were compared. It is important to note that the photos used for the AI test did not come from the AI training or were used for it and were, therefore, ‘unknown’ to the AI. This enabled an objective evaluation of the results of the AI testing.
The results show that the biochemical analytics TRAP 5b and CAII are closely related to the results of the AI analysis. The observed correlation between intracellular TRAP 5b activity and the proportion of cells with three or more nuclei suggests that AI-based classification aligns well with established biochemical markers of osteoclast presence. Given that TRAP 5b is considered a specific marker for osteoclasts but does not directly reflect their resorptive activity [25], this finding supports the validity of AI-based counting in identifying mature osteoclast populations. The other cell classifications (MON, one or two cell nuclei, and undefined) do not show this correlation and are not suitable for assessing the state of maturation.
In contrast, the relationship between carbonic anhydrase II (CA II) expression and the number of mature osteoclasts appears less direct. While the initial comparison suggests weak similarities, the delayed correlation—particularly the alignment between CA II levels on day 6 and osteoclast counts on day 10—raises the possibility that biochemical markers may precede or influence morphological changes detectable by AI. This temporal offset warrants further investigation to determine whether CA II serves as an early indicator of osteoclast maturation. These results emphasize the need for a multi-faceted approach to osteoclast characterization, integrating AI-based morphological analysis with established biochemical methods. It should be noted that the proposed comparisons have not yet been validated. In our opinion, it is necessary for different laboratories to use their own osteoclast images and cultivation conditions to assess the AI we have provided or train their own AI using our Demo_OC_Identifier.pt AI model (https://doi.org/10.25532/OPARA-730; [31]) and to test it in the same way. With the publication of this paper, the OC_Identifier.exe for object recognition and AI models for osteoclasts [32] are now available alongside the segmentation algorithm of the OC_Finder (https://bit.ly/OC_Finder) [22], thus expanding the possibilities for osteoclast analysis.
The similarities and differences explained in our case are mainly due to the fact that biochemical analysis evaluates all cells as a whole, while the photos used in AI analysis only show a small part of the culture dish, i.e., only a few cells in the field of view of the microscope. In addition, Piper et al. demonstrated that the number of nuclei of the multinucleated tartrate-resistant acid phosphatase (TRAP)-positive cells was, on average, 6.92 nuclei per cell, with a median of four [33]. In this case, 47% of the cells had 5 or fewer nuclei, and only 11% had more than 10 nuclei. Furthermore, a correlation was found between the number of nuclei and the volume of the resorption pits using confocal laser microscopy, with the volume resorbed per nucleus decreasing with the increasing number of nuclei per osteoclast.

4.2. The YOLO Framework, Limitations and Future Solutions

Of course, the question of alternative AI models and frameworks arises. Factors such as open-source availability, stability, high speed, energy efficiency, high compatibility, and structural flexibility play the most important roles in the selection process. In addition, one of YOLOv5’s key innovations is the introduction of an adaptive anchor box computation mechanism. Instead of using predefined fixed anchor boxes, this mechanism automatically calculates the optimal anchor box sizes based on the training dataset. This significantly enhances the model’s adaptability to different datasets, performing particularly well when handling domain-specific data. While maintaining high accuracy, YOLOv5 also significantly improves inference speed, making it the ideal deep learning framework for this study.
Nevertheless, there are also important limiting factors, as the quality of AI at the end is directly linked to the number of training cycles and, thus, the performance of the hardware used (especially the GPU). In addition, the fact that the image material used for the osteoclast AI has to be specialized in one’s own laboratory is a limiting factor with regard to training. However, the high costs of powerful GPUs and the lack of specific datasets are challenges that we are addressing primarily because they best suit the constraints of most interested researchers who want to test this technique.
In particular, the possibility of reducing the dataset’s restriction in the future via joint image and label datasets is an incentive for us to disseminate this publication to a broad audience in biomaterial research. A laboratory (like ours) has a large number of publications on material characterization [34,35,36] and material development [37,38], as well as cell culture development [3,23,39] and, consequently, cell images. These can be used as datasets to adapt the AI training material specifically to your own microscopy processes and parameters. This is particularly advantageous because, normally, the datasets of AI models are not open-source. This article offers the possibility of converting your own cell images into AI training datasets and using them as training material. As such, the training material used and specially recorded for this purpose is also made freely available to the public.
The AI training to identify monocytes and osteoclasts, as described in this article, has several limitations that restrict the accuracy and usability of the analysis. One major limitation is the homogeneity of the training data used: all images for AI training were taken from the same cell batch and cell culture round. The status of this cell batch and the chosen differentiation conditions were not sufficient to cover the entire spectrum of osteoclastic properties. Another critical problem arises from the limited consideration of the microscope’s field of view. Since the object of the AI analysis comprises only a small portion of the cells in the field of view, unevenly distributed cells lead to highly variable results. Furthermore, AI only takes the specific properties of osteoclasts into account to a limited extent. Osteoclasts are multinucleated cells, the DNA content of which depends heavily on the number of cell nuclei. The AI used in this article did not calculate the area of individual cells, as would be possible with other segmentation methods [22], nor the number of specific cell nuclei, which affects the precision of the analysis.
Another obstacle is the undifferentiated cell clusters that can occur in cell culture [40,41]. These unexpected cells are not recognized by the AI as osteoclasts, although their DNA is also detected during biochemical analysis. This leads to potential discrepancies between the AI results and the biochemical analysis. Excluding these special cases from the AI analysis or marking them as undefined objects is advantageous since such agglomerates may not be able to contribute to the resorption process to their full extent, as osteoclasts must lie on a more or less flat surface to form a sealing zone with the actin ring [29,42,43].
There are various approaches to addressing these limitations. One possibility is to carry out several rounds of cell culture to capture a broader spectrum of cell properties. Osteoclasts that have not been correctly identified could be marked manually to enable the AI to undergo another training round. To minimize the effects of unevenly distributed cells, photos could be taken from different locations in the cell culture, analyzed, and the results averaged. Adjustments could also be made when evaluating DNA content: since the average DNA value in the cell nucleus is relatively stable, mature and immature osteoclasts could be weighted to better reflect the results of biochemical analysis. These approaches could improve the precision and usability of AI analysis and, thus, make the identification of monocytes and osteoclasts more reliable in the future.

5. Conclusions

In this article, AI was successfully developed and trained to classify four different cell types and calculate their number. This model shows great potential for practical application in cell identification and promises an encouraging future. Nevertheless, there is room for improvement, particularly in terms of training effectiveness and analysis accuracy.
A key challenge is the fact that the training images taken do not cover all stages of osteoclast maturation since the acquisition times were not continuous but rather in line with existing and established standard culture practice. To improve the consistency and quality of the training data, additional cell culture times should be considered and as many images as possible taken of non-standard osteoclasts.
In addition, the YOLOv5m model was used for AI training due to limited computer resources. With a more powerful computer configuration, the more advanced YOLOv5x model could be used to further increase the performance of the AI. Furthermore, a switch to the latest versions of the YOLO framework series from Ultralytics could lead to even better training results. This newer version offers improved algorithms and could help to optimize the efficiency and accuracy of the AI.
Another aspect concerns the interpretation of the cell count. In the current AI analysis, the number of cell nuclei was not taken into account, but they were compared with the DNA-related cell counts from biochemistry. Since the four classes, by definition, have different numbers of cell nuclei and, in particular, category three or multinucleated cells can include significantly more nuclei, weighting factors for the cell counts could be useful for comparison with the DNA readings. Introducing weightings that take into account the differences in DNA content of the cell types could improve the results of the AI to better match the biochemical analyses and increase their accuracy.
In summary, the AI developed in this article shows great potential, but further development requires the improvement of the training materials, the use of more modern software and a more precise consideration of cell-typical properties. This will further increase the applicability and reliability of the AI analysis.

Author Contributions

Conceptualization, C.H. and B.K.; methodology, B.K., C.H. and G.L.; software, G.L.; validation, B.K., C.H. and G.L.; formal analysis, G.L.; investigation, G.L. and C.H.; resources, H.-P.W.; data curation, B.K., C.H. and G.L.; writing—original draft preparation, G.L.; writing—review and editing, B.K. and C.H.; visualization, B.K. and G.L.; supervision, B.K.; project administration, B.K. and H.-P.W.; funding acquisition, B.K. All authors have read and agreed to the published version of the manuscript.

Funding

This research was funded by the German Research Foundation for the research project Osteoclast activation by radiolytic degradation of organic/inorganic double hybrid materials (DHM) for controlled enhanced degradation of bone substitute materials (project number 497439310).

Data Availability Statement

The data presented in this study are openly available as OC_Identifier (A YOLOv5 GUI for object detection), Version 1.0.0) under a creative commons licence CC BY-NC 4.0. in OPARA at https://doi.org/10.25532/OPARA-730, reference number 1247.

Acknowledgments

We acknowledge technical assistance from Heike Zimmermann.

Conflicts of Interest

The authors declare no conflicts of interest.

Abbreviations

The following abbreviations are used in this manuscript:
AIArtificial intelligence
DNADeoxyribonucleic acid
CA IICarbonic anhydrase II
NLPNatural language processing
CVComputer vision
PCRPolymerase chain reaction
GPUGraphics processing unit
BSABovine serum albumin
EDTAEthylenediaminetetraacetic acid
PBSPhosphate-buffered saline
FCSFetal calf serum
hMSCHuman mesenchymal stem cells
OC-MOsteoclast medium
HC-MhMSC-conditioned medium
MONMonocytes
M-CSFMacrophage colony-stimulating factor
RANKLReceptor activator of nuclear factor kappa-Β ligand
TRAPTartrate-resistant acid phosphatase
OCOsteoclast

References

  1. Nijweide, P.J.; van der Plas, A.; Scherft, J.P. Biochemical and histological studies on various bone cell preparations. Calcif. Tissue Int. 1981, 33, 529–540. [Google Scholar] [CrossRef] [PubMed]
  2. Auf’mkolk, B.; Hauschka, P.V.; Schwartz, E.R. Characterization of human bone cells in culture. Calcif. Tissue Int. 1985, 37, 228–235. [Google Scholar] [CrossRef]
  3. Heinemann, C.; Heinemann, S.; Worch, H.; Hanke, T. Development of an osteoblast/osteoclast co-culture derived by human bone marrow stromal cells and human monocytes for biomaterials testing. Eur. Cell Mater. 2011, 21, 80–93. [Google Scholar] [CrossRef] [PubMed]
  4. Zhang, Y.; Schedle, A.; Matejka, M.; Rausch-Fan, X.; Andrukhov, O. The proliferation and differentiation of osteoblasts in co-culture with human umbilical vein endothelial cells: An improved analysis using fluorescence-activated cell sorting. Cell Mol. Biol. Lett. 2010, 15, 517–529. [Google Scholar] [CrossRef]
  5. Okamoto, M.; Inagaki, Y.; Okamura, K.; Uchihara, Y.; Saito, K.; Kawai, A.; Ogawa, M.; Kido, A.; Mori, E.; Tanaka, Y. Identifying the best reference gene for RT-qPCR analyses of the three-dimensional osteogenic differentiation of human induced pluripotent stem cells. Bone Rep. 2024, 23, 101816. [Google Scholar] [CrossRef]
  6. Yang, X.; Hatfield, J.T.; Hinze, S.J.; Mu, X.; Anderson, P.J.; Powell, B.C. Bone to pick: The importance of evaluating reference genes for RT-qPCR quantification of gene expression in craniosynostosis and bone-related tissues and cells. BMC Res. Notes 2012, 5, 222. [Google Scholar] [CrossRef]
  7. Henss, A.; Hild, A.; Rohnke, M.; Wenisch, S.; Janek, J. Time of flight secondary ion mass spectrometry of bone—Impact of sample preparation and measurement conditions. Biointerphases 2016, 11, 02A302. [Google Scholar] [CrossRef] [PubMed]
  8. Kern, C.; Ray, S.; Gelinsky, M.; Bellew, A.T.; Pirkl, A.; Rohnke, M. New insights into ToF-SIMS imaging in osteoporotic bone research. Biointerphases 2020, 15, 031005. [Google Scholar] [CrossRef]
  9. Thomas, J.; Worch, H.; Kruppke, B.; Gemming, T. Contribution to understand the biomineralization of bones. J. Bone Miner. Metab. 2020, 38, 456–468. [Google Scholar] [CrossRef]
  10. Brent, M.B.; Emmanuel, T. Contemporary Advances in Computer-Assisted Bone Histomorphometry and Identification of Bone Cells in Culture. Calcif. Tissue Int. 2022, 112, 1–12. [Google Scholar] [CrossRef]
  11. Lu, L.; Ono, N.; Welch, J.D. Linking transcriptome and morphology in bone cells at cellular resolution with generative AI. J. Bone Miner. Res. 2024, 40, 20–26. [Google Scholar] [CrossRef] [PubMed]
  12. Fan, J.; Xu, J.; Wen, X.; Sun, L.; Xiu, Y.; Zhang, Z.; Liu, T.; Zhang, D.; Wang, P.; Xing, D. The future of bone regeneration: Artificial intelligence in biomaterials discovery. Mater. Today Commun. 2024, 40, 109982. [Google Scholar] [CrossRef]
  13. Kolomenskaya, E.; Butova, V.; Poltavskiy, A.; Soldatov, A.; Butakova, M. Application of Artificial Intelligence at All Stages of Bone Tissue Engineering. Biomedicines 2024, 12, 76. [Google Scholar] [CrossRef] [PubMed]
  14. Paek, K.; Kim, S.; Tak, S.; Kim, M.K.; Park, J.; Chung, S.; Park, T.H.; Kim, J.A. A high-throughput biomimetic bone-on-a-chip platform with artificial intelligence-assisted image analysis for osteoporosis drug testing. Bioeng. Transl. Med. 2023, 8, e10313. [Google Scholar] [CrossRef] [PubMed]
  15. Wang, S.Y.; Mak, K.L.; Chen, L.Y.; Chou, M.P.; Ho, C.K. Heterogeneity of human blood monocyte: Two subpopulations with different sizes, phenotypes and functions. Immunology 1992, 77, 298. Available online: https://pmc.ncbi.nlm.nih.gov/articles/PMC1421624/ (accessed on 22 November 2024). [PubMed]
  16. Bar-Shavit, Z. The osteoclast: A multinucleated; hematopoietic-origin; bone-resorbing osteoimmune cell. J. Cell Biochem. 2007, 102, 1130–1139. [Google Scholar] [CrossRef]
  17. Rubin, J.; Greenfield, E.M. Osteoclast: Origin and Differentiation. Bone Resorpt. 2005, 1–23. Available online: https://api.semanticscholar.org/CorpusID:4681387 (accessed on 27 January 2025).
  18. Xu, F.; Teitelbaum, S.L. Osteoclasts: New insights. Bone Res. 2013, 1, 11–26. [Google Scholar] [CrossRef]
  19. Marie, A.; Ockernahl, Ø. Development of a Proof of Concept for Automatically Counnting Osteoclasts in a Web Application. Master’s Thesis, NTNU Norwegian University of Science and Technology, Trondheim, Norway, 2022. [Google Scholar]
  20. Davies, B.K.; Hibbert, A.P.; Roberts, S.J.; Roberts, H.C.; Tickner, J.C.; Holdsworth, G.; Arnett, T.R.; Orriss, I.R. A Machine Learning-Based Image Segmentation Method to Quantify In Vitro Osteoclast Culture Endpoints. Calcif. Tissue Int. 2023, 113, 437–448. [Google Scholar] [CrossRef]
  21. Wang, X.; Kittaka, M.; He, Y.; Zhang, Y.; Ueki, Y.; Kihara, D. OC_Finder: A deep learning-based software for osteoclast segmentation, counting, and classification. bioRxiv 2021, bioRxiv2021.10.25.465786. [Google Scholar] [CrossRef]
  22. Wang, X.; Kittaka, M.; He, Y.; Zhang, Y.; Ueki, Y.; Kihara, D.; Segmentation, O. Counting, and Classification Using Watershed and Deep Learning. Front. Bioinform. 2022, 2, 819570. [Google Scholar] [CrossRef]
  23. Heinemann, C.; Adam, J.; Kruppke, B.; Hintze, V.; Wiesmann, H.P.; Hanke, T. How to get them off?—Assessment of innovative techniques for generation and detachment of mature osteoclasts for biomaterial resorption studies. Int. J. Mol. Sci. 2021, 22, 1329. [Google Scholar] [CrossRef]
  24. Cavaillon, J.-M.; Adib-Conquy, M. Monocytes/macrophages and sepsis. Crit. Care Med. 2005, 33, S506–S509. [Google Scholar] [CrossRef] [PubMed]
  25. Szulc, P. Bone turnover: Biology and assessment tools. Best. Pract. Res. Clin. Endocrinol. Metab. 2018, 32, 725–738. [Google Scholar] [CrossRef] [PubMed]
  26. Osdoby, P.; Martini, M.C.; Caplan, A.I. Isolated osteoclasts and their presumed progenitor cells, the monocyte, in culture. J. Exp. Zool. 1982, 224, 331–344. [Google Scholar] [CrossRef] [PubMed]
  27. Muschter, D. Modulation der zellulären Eigenschaften und Osteoklastogenese von Knochenmark-Makrophagen durch Kollagen Typ II-induzierte Arthritis und sympathische Neurotransmitterstimulation. Doctoral Dissertation, Universität Regensburg, Regensburg, Germany, 2015. Available online: https://epub.uni-regensburg.de/33660/1/Dissertation_Muschter%20Dominique.pdf (accessed on 23 January 2025).
  28. Bernhardt, A.; Schumacher, M.; Gelinsky, M. Formation of Osteoclasts on Calcium Phosphate Bone Cements and Polystyrene Depends on Monocyte Isolation Conditions. Tissue Eng. Part. C Methods 2015, 21, 160–170. [Google Scholar] [CrossRef]
  29. Boyle, W.J.; Simonet, W.S.; Lacey, D.L. Osteoclast differentiation and activation. Nature 2003, 423, 337–342. [Google Scholar] [CrossRef]
  30. Teitelbaum, S.L. Bone Resorption by Osteoclasts. Science 2000, 289, 1504–1508. [Google Scholar] [CrossRef]
  31. Lv, G. OC_Identifier (A YOLOv5 GUI for Object Detection), Version 1.0.0; TUD Dresden University of Technology: Dresden, Germany, 2024. [CrossRef]
  32. Lv, G. Utilisation of Artificial Intelligence for Image-Based Identification of Osteoclasts and Assessment of Their State of Maturation. Diploma Thesis, TU Dresden, Dresden, Germany, 2024. [Google Scholar]
  33. Piper, K.; Boyde, A.; Jones, S. The relationship between the number of nuclei of an osteoclast and its resorptive capability in vitro. Anat. Embryol. 1992, 186, 291–299. [Google Scholar] [CrossRef]
  34. Heinemann, C.; Brünler, R.; Kreschel, C.; Kruppke, B.; Bernhardt, R.; Aibibu, D.; Cherif, C.; Wiesmann, H.-P.; Hanke, T. Bioinspired calcium phosphate mineralization on net-shape-nonwoven chitosan scaffolds stimulates human bone marrow stromal cell differentiation. Biomed. Mater. 2019, 14, 045017. [Google Scholar] [CrossRef]
  35. Rother, S.; Samsonov, S.A.; Moeller, S.; Schnabelrauch, M.; Rademann, J.; Blaszkiewicz, J.; Köhling, S.; Waltenberger, J.; Pisabarro, M.T.; Scharnweber, D.; et al. Sulfated Hyaluronan Alters Endothelial Cell Activation in Vitro by Controlling the Biological Activity of the Angiogenic Factors Vascular Endothelial Growth Factor-A and Tissue Inhibitor of Metalloproteinase-3. ACS Appl. Mater Interfaces 2017, 9, 9539–9550. [Google Scholar] [CrossRef] [PubMed]
  36. Lee, P.S.; Eckert, H.; Hess, R.; Gelinsky, M.; Rancourt, D.; Krawetz, R.; Cuniberti, G.; Scharnweber, D. Developing a Customized Perfusion Bioreactor Prototype with Controlled Positional Variability in Oxygen Partial Pressure for Bone and Cartilage Tissue Engineering. Tissue Eng. Part. C Methods 2017, 23, 286–297. [Google Scholar] [CrossRef] [PubMed]
  37. Kruppke, B.; Heinemann, C.; Gebert, A.; Rohnke, M.; Weiß, M.; Henß, A.; Wiesmann, H.-P.; Hanke, T. Strontium substitution of gelatin modified calcium hydrogen phosphates as porous hard tissue substitutes. J. Biomed. Mater. Res. A 2021, 109, 722–732. [Google Scholar] [CrossRef]
  38. Kotlarz, M.; Jordan, R.; Wegener, E.; Dobrzyński, P.; Neunzehn, J.; Lederer, A.; Wolf-Brandstetter, C.; Pamula, E.; Scharnweber, D. One step 3D printing of surface functionalized composite scaffolds for tissue engineering applications. Acta Bioeng. Biomech. 2018, 20, 35–45. [Google Scholar] [CrossRef]
  39. Lutter, A.-H.; Hempel, U.; Wolf-Brandstetter, C.; Garbe, A.I.; Goettsch, C.; Hofbauer, L.C.; Jessberger, R.; Dieter, P. A novel resorption assay for osteoclast functionality based on an osteoblast-derived native extracellular matrix. J. Cell Biochem. 2010, 109, 1025–1032. [Google Scholar] [CrossRef] [PubMed]
  40. Wenisch, S.; Stahl, J.-P.J.-P.; Horas, U.; Heiss, C.; Kilian, O.; Trinkaus, K.; Hild, A.; Schnettler, R. In vivo mechanisms of hydroxyapatite ceramic degradation by osteoclasts: Fine structural microscopy. J. Biomed. Mater. Res. 2003, 67A, 713–718. [Google Scholar] [CrossRef]
  41. Trinkaus, J.P.; Groves, P.W. Differentiation in culture of mixed aggregates of dissociated tissue cells. Proc. Natl. Acad. Sci. USA 1955, 41, 787–795. [Google Scholar] [CrossRef]
  42. Kruppke, B.; Wagner, A.-S.; Rohnke, M.; Heinemann, C.; Kreschel, C.; Gebert, A.; Wiesmann, H.-P.; Mazurek, S.; Wenisch, S.; Hanke, T. Biomaterial based treatment of osteoclastic/osteoblastic cell imbalance—Gelatin-modified calcium/strontium phosphates. Mater. Sci. Eng. C 2019, 104, 109933. [Google Scholar] [CrossRef]
  43. Kruppke, B.; Farack, J.; Wagner, A.-S.; Beckmann, S.; Heinemann, C.; Glenske, K.; Rößler, S.; Wiesmann, H.-P.; Wenisch, S.; Hanke, T. Gelatine modified monetite as a bone substitute material: An in vitro assessment of bone biocompatibility. Acta Biomater. 2016, 32, 275–285. [Google Scholar] [CrossRef]
Figure 1. Exemplary cells of the four documented cell variants (classes): (a) ‘1 or 2 cell nuclei’; (b) ‘3 or more cell nuclei’; (c) ‘undefined cells’; and (d) ‘monocytes’ (marked with red arrows).
Applsci 15 04159 g001
Figure 2. The LabelImg software (Version 1.8.5) workspace: an OC image has already been loaded selecting YOLO (red frame), and a cell has been marked using the Create RectBox buttom (green oval) with a rectangle and given a label name.
Applsci 15 04159 g002
Figure 3. Precision–recall curve of different training epoch counts (Table 2): (a) underfitting (insufficient training); (b,c) appropriate fitting (training can be concluded); and (d) overfitting (too many training epochs).
Applsci 15 04159 g003
Figure 4. (a,d) Original image of cells with low and high cell density, (b,e) manual counting of images (a,d) with marking of the cells in consecutive order, (c,f) and AI recognition of images (a,d).
Applsci 15 04159 g004
Figure 5. AI-based osteoclast detection on cell culture of 6 different cell culture samples (af) on days 6, 8, and 10 with varying ratios of RANKL/MCS-F. The cells of class 1 or 2 nuclei are marked with a red frame, those of 3 or more cell nuclei are marked with a pink frame, those of monocytes are marked with a yellow frame, and undefined cells are marked with an orange frame.
Applsci 15 04159 g005
Figure 6. Number of cells per photo from Figure 5 after manual counting and image analysis with AI. The correctness of the osteoclasts identified by the AI is shown as a percentage in relation to the manual count.
Applsci 15 04159 g006
Figure 7. (a) DNA measurement via biochemical analysis and (b) the total number of cells counted using AI, including the 4 classes of identified objects.
Applsci 15 04159 g007
Figure 8. Differentiation markers of osteoclastic cells: (a) intracellular TRAP 5b activity and (c) intracellular carbonic anhydrase II activity compared to AI-counted cells: (b) Percentage of cells with 3 or more nuclei related to the total AI-counted cells and (d) AI-counted cells with 3 or more nuclei/cm2.
Applsci 15 04159 g008
Table 1. Data on the four rounds of AI model training (YOLOv5m).
RoundEpochsTraining TimeImages for Training PartImages for Validation Part
OCMONBackgroundOCMONBackground
1.1–300114.70 Std.380010050080050500
2.301–35026.34 Std.4600100500460050100
3.351–50078.38 Std.4900100500470050100
4.501–60041.31 Std410010050090050100
Table 2. Overview of the culture conditions of monocytes to osteoclasts and their analysis time points.
Times forOsteoclast Medium (OC-M)hMSC-Conditioned Medium (HC-M)
Biochemical AnalysesAI Image AnalysisM-CSF/ng/mLRANKL/ng/mLM-CSF/ng/mLRANKL/ng/mL
(2), 6, 106, 8, 1025502550
25252512.5
2512.500
Disclaimer/Publisher’s Note: The statements, opinions and data contained in all publications are solely those of the individual author(s) and contributor(s) and not of MDPI and/or the editor(s). MDPI and/or the editor(s) disclaim responsibility for any injury to people or property resulting from any ideas, methods, instructions or products referred to in the content.

