1. Introduction
Human activity recognition and monitoring technology, especially that utilizing accelerometers and gyroscopes, has wide-ranging applications across various fields, including healthcare, military, human-computer interaction, sports, smart homes, security, and traffic pattern detection. One of the areas with great potential is health monitoring [
1]. Modern medicine is becoming increasingly reliant on data analysis, and real-time monitoring of human activity provides valuable insights for personalized health management. With the global population aging, the demand for health monitoring for the elderly is rising. Continuous tracking of their activity status enables healthcare providers and family members to stay informed about an individual’s health in real time, helping to prevent incidents such as falls [
2]. The activity recorder, as an industry-standard device for human activity recognition, has been confirmed by numerous studies to be able to accurately monitor a wide range of human activities and has provided a reliable basis for data collection and analysis in a large number of previous studies. With the widespread adoption of smart devices, particularly smartphones equipped with various sensors such as accelerometers and gyroscopes, real-time, continuous, and multi-scenario human activity detection has become achievable. The accelerometer precisely measures an object’s acceleration by detecting the electrical signals generated by the force exerted on an internal mass block, providing essential data for analyzing motion states. In contrast, the gyroscope measures an object’s angular velocity by detecting the relative motion between the rotor and the casing, utilizing the rotor’s stable angular momentum. This allows the gyroscope to assist in identifying complex movement postures. This technology allows us to gain a deeper understanding of human activity patterns, provides valuable decision support for the prevention and management of non-communicable diseases, and helps optimize living and working environments. Many consumer electronics, such as smartphones, smartwatches, and pedometers, now feature inertial sensors. Today’s smartphones have evolved beyond communication devices to become personal intelligent terminals, equipped with computing, sensing, and communication capabilities, enabling seamless human–machine interaction. As accelerometer technology continues to advance, high-performance, cost-effective, and portable accelerometers are being increasingly integrated into products such as smart clothing, smartphones, smartwatches, and fitness bands. This has revolutionized user experiences, enabling individuals to wear these sensor-equipped devices throughout their daily activities [
3]. These sensors can accurately capture acceleration signals from motion, providing insights into human body movements and enhancing the intuitiveness of certain physiological signals [
4]. Their appearance has significantly reduced the cost compared with the activity recognition device. In terms of usability, users do not need to wear specific devices specially. They can achieve human activity recognition merely by relying on the smart devices they carry daily, which results in a lower usage threshold and a broader range of application scenarios.
The field of human movement analysis faces substantial challenges in accurately and comprehensively capturing and interpreting complex human motions in real-world scenarios. Traditional methodologies exhibit limitations in handling the high variability and subtle nuances inherent in human actions, particularly in dynamic daily activities. To overcome these constraints, researchers have explored a range of advanced approaches to improve the efficacy of human activity recognition in everyday contexts. Early human activity detection primarily depends on the use of fixed, bulky sensors in laboratory environments, which limits users’ mobility [
5]. While this method delivers reliable results in controlled settings, it encounters significant challenges in real-world applications. With the advancement of accelerometer technology, sensors have become smaller, more portable, and are now widely utilized for monitoring human movement and health. These compact sensors are increasingly integrated into medical monitoring devices and outdoor sports equipment, offering enhanced versatility and practicality across a wide range of applications [
4]. In the early stages, researchers generally used accelerometer signals to study specific human motion states, particularly for fall detection [
6]. Parkkal et al. designed a system utilizing over 20 different types of sensors, including two accelerometers placed on the chest and wrist, to recognize daily human activities. However, the large number of sensors made the system cumbersome and significantly reduced comfort. As a result, recent studies have shifted toward using fewer sensors to study human motion [
7]. Casale et al. used a single accelerometer placed on the chest and designed a system that integrated data collection and storage, capable of recognizing five different movement states with high accuracy. However, in multi-sensor fusion applications, synchronizing and standardizing data from different sensors present significant challenges. The frequency and resolution of data collected by various sensors may differ, and effectively aligning and standardizing these data to ensure consistency and accuracy remains a critical technical issue that needs to be addressed [
8]. To avoid impacting user comfort, some researchers have embedded sensors into everyday items. For instance, Kamijoh and colleagues installed sensors in a watch [
9], and Almeida placed sensors on a cane to detect falls by measuring the cane’s angular velocity changes [
10]. Many researchers have also explored various movement states in activity recognition. Shoaib utilized smartphones to recognize various daily activities such as smoking, eating, drinking coffee, walking, and cycling [
11]. Hsu proposed a wearable inertial sensor network to recognize 10 common household activities and 11 sports activities, achieving a recognition accuracy of 95% [
12]. Zubair analyzed fused data from smartphone sensors of 30 subjects and recognized 15 different activities [
13].
Since the raw data collected by sensors are complex and high-dimensional, it is quite challenging to directly extract meaningful information. Machine learning algorithms, however, are proficient in handling such complex data. They can automatically learn the patterns and relationships within the sensor data and are applied to develop accurate models for activities such as activity recognition and fall detection. By combining these two aspects, a large amount of raw sensor data can be transformed into useful information, filling the existing research gaps and improving the accuracy and reliability of human movement analysis in real-world scenarios. For example, Paul and George used k-nearest neighbors (KNN) classification and k-means clustering to recognize walking, running, sitting, and standing [
14]. San-Segundo proposed a human motion state sensing system based on a hidden Markov model to classify six human motion states: walking, climbing stairs, descending stairs, sitting, standing, and lying down [
15].
However, these machine learning algorithms were single classifiers. They may suffer from lower recognition accuracy when used in real-world applications. In this work, by combining data preprocessing methods, we carried out feature extraction on time series data in the time domain and frequency domain. Moreover, we established a majority decision model, which integrated multiple machine learning methods and the voting mechanism to effectively recognize human activities. It is more diverse in feature extraction, deriving multi-dimensional complex features in the time domain, frequency domain, etc., which significantly improves the ability to accurately distinguish complex activities and similar activities. Additionally, it can process data in real-time and provide feedback on the recognition results of human activities. This approach reduced the potential biases and limitations of a single model, improved the overall performance of the model, enabled the model to fully utilize multi-dimensional information in the data, and enhanced the accuracy and robustness of classification and regression. As a result, it helps to effectively identify common human activities, assists individuals in formulating scientific and reasonable exercise plans, provides health warnings for medical institutions, and contributes to the improvement of the level of health management.
2. Data Collection and Preprocessing
The accelerometer and gyroscope are used to measure accelerations in three axial directions of human motion and store the data. The collected data are then preprocessed, including filling in missing values and addressing outliers [
16]. Next, data normalization is performed to ensure that each feature is uniformly processed within the same dimensional and distributional range, maintaining consistency for subsequent processing. Afterward, representative time-domain and frequency-domain features are extracted to describe different human activities. These features are used to establish a classification and recognition model [
17]. We calculate the Mahalanobis distance between each pair of groups, which measures the degree of difference between groups in the feature space. To quantify the similarity between groups, we use the reciprocal of the Mahalanobis distance to represent it.
2.1. Data Collection
We utilize accelerometers and gyroscopes to recognize human motion states. These sensors measure linear acceleration and angular velocity changes along the three axes (X, Y, Z) of the human body. When the sensors detect changes in acceleration, the accelerometer captures the data and transmits them to the processor for storage or analysis. By processing the data from both the accelerometer and gyroscope, the processor can identify changes in body posture, angle, and direction, using the appropriate algorithms to determine or track the user’s activity patterns.
We recruited 10 participants to wear motion state sensors, i.e., accelerometer and gyroscope, during their daily activities, allowing us to collect comprehensive movement data.
Table 1 presents the relevant details of the participants. To ensure stability, comfort, and minimal interference with natural movement, accelerometer and gyroscope sensors were securely mounted on their waists. A dedicated data collection system was utilized to initialize the sensors and commence data acquisition from both devices. In order to effectively recognize human activities, when determining the activities chosen by participants, we adhere to a multi-dimensional set of considerations to ensure rationality. On the one hand, the selected activities comprehensively cover human daily behaviors. For instance, walking, which is prominently included, owes its universality to its ability to help us accurately capture the key characteristics of daily activities, ensuring that the research findings can be widely applied to real-world scenarios. On the other hand, including different activities such as walking to the left and walking to the right, which possess subtle yet distinguishable and representative features, contributes to a deeper understanding of the human body’s movement control mechanisms. Additionally, based on the characteristics of the experimental equipment, we selected activities that can be easily and accurately measured by accelerometers and gyroscope sensors. This ensures the reliability of the data, lays a solid foundation for subsequent analysis and model training, and propels the research towards drawing scientific conclusions. Thus, participants were instructed to perform 12 distinct activities: walking forward, walking left, walking right, walking upstairs, walking downstairs, running forward, jumping, sitting down, standing up, lying down, moving up in an elevator, and moving down in an elevator. For each activity, five sets of experimental data were recorded, with each set capturing several seconds of linear acceleration and angular velocity data. The sensors operated at a sampling rate of 100 Hz. The accelerometer measured acceleration within a range of ±6 g, while the gyroscope recorded angular velocity within a range of ±500 degrees per second (dps). Regarding sensor orientation, the X-axis of both the accelerometer and gyroscope aligned with the direction of gravity, the Y-axis corresponded to the participant’s forward direction, and the Z-axis was perpendicular to the XY-plane, pointing toward one side of the body.
2.2. Data Preprocessing
Before modeling, the collected data were preprocessed to address missing values and manage outliers. Subsequently, the data were standardized to ensure that each feature was uniformly processed within the same scale and distribution range, promoting consistency for the subsequent analysis. Representative time-domain and frequency-domain features were then extracted to characterize the activity states of the different groups.
Firstly, missing values were identified and imputed. Next, outliers were detected using the standard deviation method. Below is a brief explanation of how the standard deviation method works for outlier detection. We firstly calculated the mean value and the standard deviation for given dataset x = {.
Next, we determined the outlier threshold, which is based on the standard deviation. A common method is to use the mean (), plus or minus k times the standard deviation (σ), where k is set to 5 in this case. The threshold has been correspondingly determined to be equal to . Finally, the data were examined for outliers by comparing each data point against the threshold. If a data point falls outside the defined range, it is considered an outlier and removed from the dataset.
After removing the outlier data, we proceeded with data standardization. For this, we used the Z-score method, a widely employed technique for data standardization. The Z-score method transforms the data into a standard normal distribution with a mean of 0 and a standard deviation of 1 [
18]. This approach eliminates scaling differences between features, allowing for comparisons under the same criteria. It is commonly used in various machine learning algorithms, as well as in data preprocessing, outlier detection, and feature engineering. Here is a brief introduction to the steps to applying this method. Firstly, we calculated the mean and standard deviation. For each feature
in the dataset, we calculated the mean value
and standard deviation
.Then, we applied the Z-score normalization using Equation (1).
Here, is the jth eigenvalue of the ith sample and n is the total number of samples. The Z-score of each sample is then calculated: the score represents the standard deviation distance from the data point to the mean .
After the data standardization, we need to classify the activity states in each experiment, so we need to extract representative features to represent different activity states. In the time domain, we extract the mean, standard deviation, maximum value, and minimum value as time-domain features. Some of the data are shown in
Table 2. In the frequency domain, we convert the time-domain signal to the frequency domain through the Fourier transform and extract peak values as frequency-domain features.
Table 2 shows some data on the maximum and minimum values of the acceleration on the X, Y, and Z axes obtained from the accelerometer and gyroscope. These data will be used as time-domain features for the recognition of subsequent activities. After that, the similarity between the data points was calculated using Mahalanobis distance. The closer the distance, the higher the similarity between the points. Therefore, we took the reciprocal of the Mahalanobis distance as the measure of similarity and constructed a 60 × 60 matrix to store the data. Mahalanobis distance is a metric used to measure the distance between data points, and it is particularly useful in high-dimensional spaces. Unlike Euclidean distance, Mahalanobis distance accounts for the covariance structure of the data, making it more robust to correlations and varying scales of the features [
19]. Given a data point, the mean vector, and the covariance matrix of the dataset, the Mahalanobis distance is defined as follows:
where
x is the data point to be measured, and
μ is the mean vector of the data.
is the covariance matrix of the data, and
is the inverse of the covariance matrix. The covariance matrix
describes the correlation between the features of the data and the variance of each feature. The elements on the diagonal represent the variance of the individual features, while the off-diagonal elements represent the covariance between different features. The inverse covariance matrix
adjusts for the correlations between the features, allowing the Mahalanobis distance to appropriately account for differences in scale and correlations, thus accurately measuring the distance between the features [
20]. To validate the effectiveness and accuracy of the majority decision model based on multiple machine learning algorithms, we adhered to strict statistical principles and scientifically divided the dataset into a training set, a test set, and a validation set at a ratio of 70:20:10. The following two models were performed based on the above datasets.
3. Methods
Two models have been built for human activity recognition in this work. They are the classification model based on integer programming and the machine learning decision model. In the following, we will introduce these two models in more detail.
3.1. Classification Model Based on Integer Programming
Integer programming is a specialized problem in the field of mathematical optimization, where all decision variables are required to be integers. It includes two main types: pure integer programming (where all variables are integers) and mixed integer programming (where only some variables are integers, while others can be continuous) [
21]. Integer programming is used to solve optimization problems where variables can only take discrete values, typically non-negative integers. It is applicable to practical problems involving discrete selection, arrangement, or combination, such as task assignment, network design, and more. The procedure for integer programming is as follows:
Define the problem: clearly identify the optimization objective and constraints. For example, the objective could be to minimize costs or maximize benefits, and the constraints could be limitations such as resources, time, or capabilities.
Determine variables: define the decision variables in the problem and ensure that their values are integers.
Establish the objective function: construct a mathematical expression to represent the objective to be optimized. For instance, , where are coefficients, and are decision variables.
Set up constraints: write down the limiting conditions to ensure that the solution satisfies all practical constraints. For example, , where , are coefficients and b is the upper limit of the constraint.
Select a solution method: genetic algorithm is used to find feasible solutions close to the optimal solution.
Result verification and analysis: verify whether the obtained solution satisfies all constraints and assess its optimality, and evaluate the practical effectiveness of the solution to ensure it meets the actual requirements within the context of the problem.
Here, the decision variable is represented by a binary matrix X to indicate the classification situation of data points. Here,
is a binary variable. If data point
i belongs to category
j, then
= 1; otherwise,
= 0. The objective function is built as follows. For category
k, define the sum of its similarities as
Therefore, the overall objective function is
Then, the constraints were set up. Each data point can only belong to one category:
Each category must exactly contain 5 data points:
Therefore, by solving this integer programming model, the recognition of the human activities represented in the known dataset can be achieved.
3.2. Classification Model Based on Machine Learning
There are many machine learning algorithms. The following are some of the typical ones involved in this work.
SVM is a class of dichotomy model with supervised learning. Compared with logistic regression and neural network, SVM provides a clearer and powerful way when learning complex nonlinear equations, whose essence is to find the optimal classification hyperplane in the feature space [
22].
is the optimal classification hyperplane to be determined. The hyperplane and are both parallel to and at an equal distance, dividing the two sides of H; the points on and are the sample points closest to , and their geometric distance to is .
This paper uses a Nonlinear Support Vector Machine (SVM) to address complex nonlinear separable problems. When the sample space of the training set is nonlinearly separable, it indicates that the data are linearly inseparable in the original (low-dimensional) space. In such cases, the training set can be mapped from the original space to a higher-dimensional feature space, making the test set linearly separable in the high-dimensional space. However, directly performing classification in the high-dimensional space presents challenges, such as determining the form and parameters of the nonlinear mapping function. Additionally, operations in high-dimensional spaces are computationally intensive, and the results may not always be ideal.
A kernel function can map the raw input data from a low-dimensional space to a high-dimensional space, where the data may become linearly separable, as shown in Equation (10). In this case, we have chosen a polynomial kernel function of degree 3 [
23]. By using the kernel function, we effectively transform the dot product operation in the high-dimensional space into an operation in the lower-dimensional input space, allowing us to efficiently solve the problem and find the optimal hyperplane in the high-dimensional space.
- b.
The k-nearest neighbor algorithm (KNN)
KNN is a supervised learning algorithm with labels. Distance metric, the selection of
k value, and classification decision rules are the three basic elements of KNN. When we input the test set, the output is the corresponding label of the test set. Based on this algorithm, we mainly constructed three discrimination models, namely 1-nearest neighbor algorithm, 5-nearest neighbor algorithm, and 12-nearest neighbor algorithm [
24]. The distance metric is defined as below:
Here, let
p = 2 correspond to the Euclidean distance. The selection of
k is crucial. If
k is too small, the classification result can be easily influenced by noisy points. If
k is too large, the nearest neighbors may include too many points from other categories. Typically,
k is an integer not greater than 20. In practice, we usually select the first
k most similar data points from the training set and classify the new data based on the most frequent category among these
k nearest neighbors [
25]. The 1-nearest neighbor algorithm is the most commonly used. Additionally, since each experimenter has five sets of data for each activity state, the 5-nearest neighbor algorithm is also employed. Given that there are 12 activity states, the 12-nearest neighbor algorithm is also applied. Finally, the classification decision rule for KNN involves taking the input sample point from the test set as the center and determining its category based on the categories of the
k nearest training sample points, which is similar to our subsequent majority decision model.
- c.
Random Forest
In Random Forest, multiple decision trees are combined. Each time, the dataset is randomly selected with replacement, and at the same time, some features are randomly chosen as input. This is why the algorithm is called the Random Forest algorithm. The foundation of Random Forest lies in decision trees, which are tree-like models used for classification or prediction based on feature values. Each internal node represents a test on a feature, each branch represents the outcome of the test, and each leaf node represents the classification result or numerical prediction. Random Forest is an ensemble learning method that improves the performance of a single model by combining the predictions from multiple models. It achieves this by creating multiple decision trees [
26]. The randomness in Random Forest includes both sampling randomness and feature randomness. The former refers to using bootstrap sampling to randomly select different subsets of the original data to train each decision tree. The latter refers to randomly selecting a subset of features at each decision node to determine the best split, which reduces the correlation between the trees.
Problem-solving steps based on Random Forest are as below:
Data Preparation: clean and preprocess the data to ensure there are no missing values and outliers.
Construct training set and test set: divide the dataset into a training set and a test set to evaluate the performance of the model.
Generate decision trees: randomly select multiple subsets from the training set. Train a decision tree for each subset. When building each tree, randomly select a subset of features at each node and choose the best split point based on these features.
Ensemble decision trees: integrate the prediction results of all decision trees. For classification problems, determine the final category through a voting mechanism; for regression problems, usually take the average of the predictions of all trees.
Model evaluation: use the test set to evaluate the model performance, including metrics such as accuracy, precision, and recall rate.
Tuning and optimization: adjust the hyperparameters of the Random Forest, such as the number of trees, the maximum depth of each tree, the minimum number of samples for splitting, etc., to improve the model performance.
The main advantages of Random Forest lie in its strong generalization ability and low overfitting risk, making it suitable for handling large-scale datasets and complex problems.
During the training process for machine learning, we used a carefully curated and diverse dataset that was capable of representing a wide range of human activities and scenarios. This dataset was divided into a training set, a validation set, and a test set. The division process was random and stratified to ensure that each category of human activities was proportionally represented in all subsets. This approach helps to reduce bias, as the data distribution that the model is exposed to during training is balanced.
For validation, we monitored the performance of the model on the validation set after each training cycle. If the performance on the validation set starts to decline while the performance on the training set continues to improve, this is a sign of overfitting. In such cases, we will adjust the hyperparameters of the model.
For testing, we used the held-out test set, which the model has never encountered during the training or validation period. This provides an unbiased estimate of the model’s generalization ability. The final performance of the model is reported based on the results obtained from the test set.
Therefore, through appropriate data partitioning and performance monitoring, we have effectively reduced the risks of overfitting and bias in the machine learning model, thus enhancing the model’s generalization ability in real-world scenarios. Subsequently, we processed the training set using the aforementioned model and established a machine learning decision-making model for 12 types of human activities.
3.3. Majority Decision Model
Aiming at the fact that a single decision model may have decision bias due to its own limitations, we introduce the idea of multi-vote decision and construct a majority decision model based on multiple machine learning models [
27].
There are three advantages: First, by integrating the prediction results from multiple machine learning methods and applying a voting mechanism based on the principle of the minority obeys the majority, the model’s accuracy and robustness can be significantly improved. Second, by evaluating multiple base models and eliminating those with poor discrimination ability, we retain only the models that perform well, minimizing performance discrepancies among them and improving overall prediction accuracy. Third, we ensure that the homogeneity among the base models is relatively low. By incorporating tree models and nonlinear models into the voting process, the results are often more effective than using only numerical or linear models. The voting process includes both hard voting and soft voting. Hard voting directly outputs the class that appears most frequently in the predictions of all models, essentially providing a final class label. In contrast, soft voting calculates the average of the predicted probabilities for each class across all models, and the class with the highest probability becomes the final prediction, effectively outputting class probabilities. Although soft voting incorporates additional prediction probability information, which may improve accuracy, hard voting is preferred in this case because it provides precise class labels for classification tasks [
28].
4. Results and Discussion
For the collected data, we first extract features from both the temporal and spatial domains to ensure that they fully capture the characteristics of the activity state. After extracting the feature data, we process it to compute the similarity and generate the similarity matrix. This is done using integer programming and majority decision models based on multiple machine learning. The accuracy of the classification results is shown in
Table 3 and
Table 4.
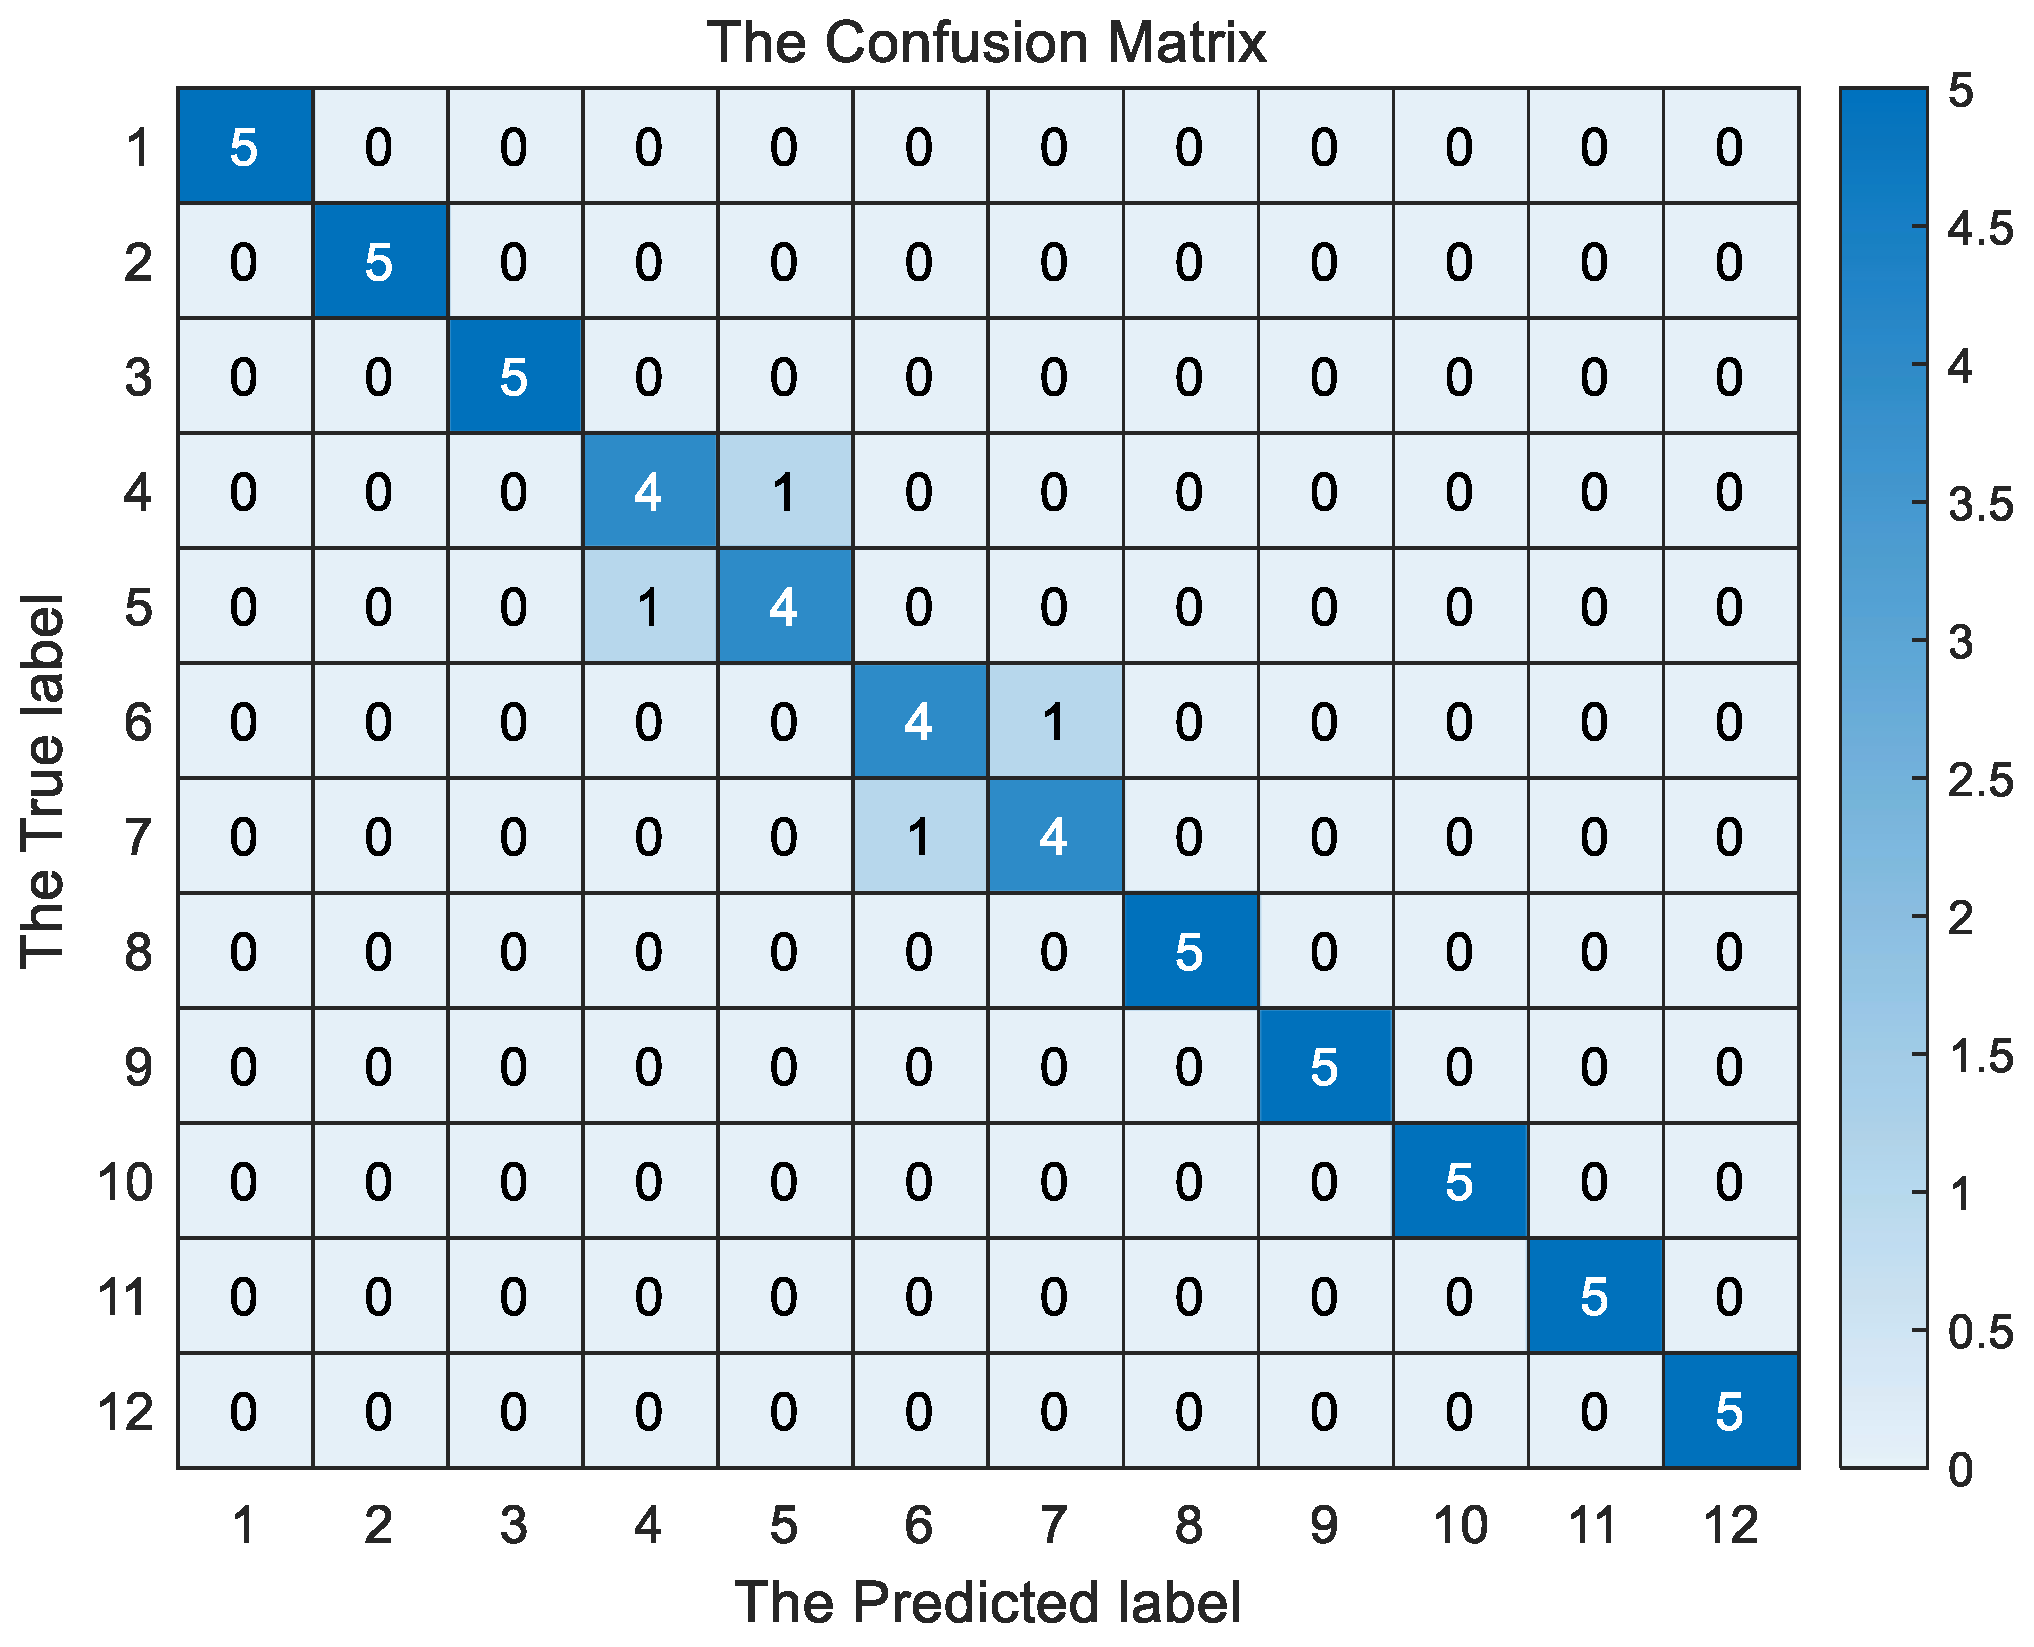
We then tested the majority decision model based on multiple machine learning, and the confusion matrix is shown in
Figure 1. For a more robust evaluation of the model,
k-fold cross-validation (CV) was adopted (where
k = 5 in this study). This approach further partitions the training set into
k subsets. In each iteration,
k-1 subsets are employed for model training, while the remaining 1 subset is used as the validation set. The data were split according to subjects, ensuring that the training and test folds consist of records from different subjects [
29]. This process is repeated
k times, giving each subset an opportunity to serve as the validation set once. By doing so, the data can be utilized more comprehensively. This subject-based cross-validation method can effectively prevent data leakage, guarantee the reliability of model evaluation, and endow the research findings with enhanced interpretability.
Based on the classification accuracy of the two models for 12 types of behavioral activities, it can be known that the integer programming classification model has an average accuracy of 79.17%, while the majority voting classification model has an average accuracy of 91.92%. As is evident from
Figure 1, on the basis of five sets of data for each exercise, the majority decision model exhibits relatively poor performance in recognizing activities such as ascending stairs, descending stairs, running forward, and jumping, when compared to other human activities. In the 5-fold cross-validation, the average accuracy rate is calculated to be 91.67%. It is also evident that, compared to integer programming, the majority decision model demonstrates superior ability in accurately recognizing activities. When comparing the results of the two models, the integer programming classification model struggles to distinguish between walking forward and walking downstairs, whereas the majority voting model performs better. However, we observed that the majority voting model still experiences some misclassification errors, particularly between walking upstairs and walking downstairs. Additionally, there is some confusion between running forward and jumping, which may be attributed to the similarity in acceleration between these motion states, causing their features to be too similar and resulting in misclassification. Overall, we can conclude that the majority decision model, based on multiple machine learning techniques, offers better robustness and accuracy than the integer programming classification model.
In this work, in addition to the basic time-domain features, we also extracted frequency-domain features from the sensors, which enhances the recognition accuracy. A single machine learning classification model may suffer from classification bias due to its inherent limitations. To address this, we introduce the concept of majority voting and construct a majority decision model based on multiple machine learning classifiers. By adhering to the principle of the majority rules, the test set undergoes a voting process, which significantly improves the model’s accuracy and robustness. The classification and recognition strategy integrates data preprocessing, feature extraction, and optimization, with the goal of enhancing both the accuracy and efficiency of data analysis.
However, it is important to note that only a limited number of feature types were selected for human activity state recognition, and only a small number of activity types were identified. During data processing, only acceleration was used as the feature type. Since many feature types change during human motion, it is worth considering additional feature types for more accurate recognition of different activities. Furthermore, the number of sensors used for analyzing human motion posture was relatively small, which only allowed for a rough representation of human posture. Using more sensors could enable more precise recognition of human motion. Additionally, improvements to human motion models are necessary, as the human body structure and motion system are highly complex and cannot be accurately simulated by simple models. Issues such as the degrees of freedom and constraints of body limbs require further in-depth research.
When comparing with analogous research, by referencing the findings of Li et al. in their study on the comparison of multiple feature-learning approaches, where a hybrid deep-learning architecture integrating convolutional neural networks and long short-term memory networks was utilized to capture temporal dependencies within the data, it becomes evident that our majority decision model encounters drawbacks in dealing with intricate activity patterns [
30]. Specifically, it is likely to exhibit suboptimal performance when recognizing activities characterized by complex action sequences. Concurrently, in contrast to the research of Augustinov et al. regarding the recognition of activities of daily living using a transformer-based model, since our majority decision model lacks an attention mechanism to portray global dependencies, its recognition accuracy is likely to be comparatively low in scenarios involving the identification of continuous activities that rely on activity–context dependencies [
31].
Meanwhile, in this study, the relatively small dataset size involving only 10 volunteers can affect the generalization and potential overfitting of the model. There may be some unique movement patterns in the general population that are not represented in this limited dataset, so the model may fail to recognize these patterns. A larger dataset is more likely to capture these nuances across a broader range of individuals. When applied to new individuals or real-world scenarios beyond the scope of these 10 volunteers, the model may perform poorly, thus limiting its generalization. Also, the small dataset provides fewer learning examples for the model, and the model may over-emphasize these features and regard them as universal, resulting in overfitting. Therefore, to improve generalization and reduce overfitting, a larger dataset should be collected in subsequent research.
5. Conclusions
This paper proposes a human activity state recognition method based on machine learning and a majority decision model, utilizing data collected from accelerometers and gyroscopes. The method can accurately recognize 12 different activity states: walking forward, walking left, walking right, walking upstairs, walking downstairs, running forward, jumping, sitting down, standing, lying down, moving upward in an elevator, and moving downward in an elevator. The system’s input consists of a dataset generated by 10 volunteers performing various activities. We conducted a comprehensive analysis of human activity state recognition performance, comparing majority decision models based on different machine learning algorithms with integer programming models, and evaluated the accuracy of the results. We also presented confusion matrices and performed cross-validation for error analysis, which effectively demonstrated the accuracy and superiority of the majority decision models, successfully achieving human activity state recognition.


