Article

Mechanical Performance of Group Stud Connectors in Steel–Concrete Composite Beams with Straddle Monorail

1
College of Fashion and Design, Donghua University, Shanghai 200051, China
2
College of Civil Engineering, Hunan University, Changsha 410082, China
3
College of Civil Engineering, Chongqing University, Chongqing 400044, China
4
College of Civil Engineering, Shanghai Jiao Tong University, Shanghai 200240, China
*
Author to whom correspondence should be addressed.
Appl. Sci. 2025, 15(7), 4051; https://doi.org/10.3390/app15074051
Submission received: 23 February 2025 / Revised: 24 March 2025 / Accepted: 2 April 2025 / Published: 7 April 2025

Abstract

:
A steel–concrete composite beam with a straddle monorail is a lightweight and easily installable structure. The mechanical performance of group stud connectors and their arrangement are key design parameters that govern the beam’s overall performance. This study investigates the behavior of group stud connectors by conducting push-out tests on four specimens, comprising three full-scale models and one 1:3 scaled model. Variables such as the number of connectors, arrangement, and specimen size were explored. The results indicated that all the specimens exhibited ductile failure due to stud shearing. The strain distribution analysis revealed higher strain at the edges and lower in the middle, persisting as the load increased. The group stud effect resulted in a 23.4% to 27.2% reduction in shear capacity for the full-scale specimens and 16.5% for the scaled specimen. The reduction was proportional to the density of the studs, but the size effects were less significant. This study provides valuable insights into the mechanical behavior of group stud connectors and offers design recommendations for practical applications.

1. Introduction

With the acceleration of urbanization, the demand for the construction pace of rail transit systems is increasing rapidly. Among the various structural configurations of transportation systems, the straddle monorail, as a significant representative of medium-capacity rail transit, serves as an economically viable alternative to subways. It helps reduce infrastructure investment and operational costs while catering to the passenger transportation needs of small- and medium-sized cities, and it demonstrates broad prospects for application within urban rail transit networks [1,2]. In a straddle monorail system, the track beam is a critical structural component that not only bears structural loads but also serves as the guiding path for vehicle operation, with its performance directly influencing the safety and operational stability of the straddle monorail system. Compared to traditional concrete beams, steel–concrete composite beams can effectively reduce structural weight, shorten construction periods, and significantly enhance seismic performance. Additionally, in contrast to pure steel beams, steel–concrete composite beams can effectively mitigate vibrations and noise during operation, thereby improving the overall ride comfort of the straddle monorail system [3,4,5,6]. However, the effective application of this structural form largely depends on the design and performance of its shear connectors, particularly the use of group stud connectors, which is essential to ensure the synergy between steel beams and concrete slabs [7,8,9,10].
Unlike the single stud connection, the force distribution in the group stud connectors is more complex. Due to the mechanical interaction between studs, referred to as “group stud effect”, the shear force distribution is often uneven, which affects the overall bearing capacity and deformation performance [11,12,13]. In recent years, international researchers have carried out extensive research on the mechanical properties of pile group connectors, highlighting the significant influence of pile group effect on the shear capacity. Liu et al. [14] employed the three-dimensional finite element model to explore the mechanical behavior of different types of stud connectors, and found that the group stud effect significantly reduced the shear capacity, especially when the studs were densely arranged. Ding et al. [15] conducted a study on the load-bearing behavior of grouped studs embedded in prefabricated UHPC panels under combined loading conditions. Through push-out experiments, they developed predictive models for the shear–tension interaction strength and the shear resistance of UHPC stud connectors under such loading scenarios. Similarly, Kim et al. [16] found that the group stud effect leads to serious local stress concentration under large loads, thus affecting the durability of the structure, especially under high-frequency loads. Yu et al. [17] developed an improved finite element (FE) model to simulate the push-out behavior of shear stud group connectors (SSGCs). Based on this model, they conducted a parametric analysis considering factors such as concrete properties, stud diameter, and the number of studs, and proposed a theoretical formula for calculating the stiffness of SSGCs.
Despite extensive theoretical analyses, numerical simulations, and experimental studies conducted by scholars on the mechanical performance of “group stud connectors, most research has primarily focused on the mechanical behavior of uniform-distributed studs (as shown in Figure 1a) [18]. In order to realize the assembly construction of straddle monorail, cluster-distributed studs (as shown in Figure 1b) are commonly adopted to reduce on-site casting work and shorten the construction period, thereby avoiding the drawbacks of uniform-distributed studs. This arrangement not only facilitates efficient prefabrication and assembly of monorail panels but also minimizes concrete shrinkage and creep effects. In cluster-distributed studs, the number and arrangement of studs are critical factors influencing the mechanical performance of steel–concrete composite beams, yet research on this aspect remains relatively limited. Furthermore, shear connectors in straddle monorail composite beams are typically embedded within prefabricated concrete slabs, making the bonding performance between prefabricated slabs and cast-in-place concrete another key factor determining the overall structural performance. Due to material property differences between the prefabricated and cast-in-place layers, particularly when high-strength steel fiber-reinforced concrete is used, the overall mechanical performance of the structure requires further investigation. The current design codes and mechanical models have yet to fully accommodate these conditions. Therefore, it is essential to carry out experimental research to verify the mechanical properties of group stud connectors in straddle monorail composite beams [19,20].
To address the existing research gaps, this study designs and conducts four push-out tests to further investigate the mechanical performance of group stud connectors in straddle monorail steel–concrete composite beams. By varying the number of studs, their arrangement patterns, and specimen sizes, the study examines the influence of these factors on the mechanical behavior of group stud connectors. The research results not only provide valuable reference data for the engineering design of straddle-type monorail composite beams, but also serve as theoretical support for the optimization and standardized application of group stud connectors.

2. Experimental Overview

2.1. Specimen Design

In this study, four groups of group stud specimens were designed, comprising three full-scale specimens and one 1:3 scaled specimen, named Z-40, Z-32, Z-16, and S-13, respectively. The number following the dash represents the total number of studs in a single slot. The size parameters of the scaled specimen were determined by reducing the Z-16 specimen in accordance with the standards outlined in GB/T 50152-2012 (Standard for Test Methods of Concrete Structures) [21]. Each group of specimens consists of a steel loading beam and two prefabricated concrete slabs on either side, which are connected by group studs and cast-in-place concrete to form a composite structure. Figure 2 provides a detailed illustration of the shear studs, with Figure 2a showing the full-scale specimens and Figure 2b showing the scaled specimens. The shear stud dimensions are in strict accordance with the requirements specified in GB/T 10433-2002 (Cheese Head Studs for Arc Stud Welding) [22], and the specimen design adheres to the guidelines outlined in GB/T 50152-2012 (Standard for Test Methods of Concrete Structures) and JGJ 138-2016 (Technical Specification for Steel–Concrete Composite Structures) [23]. This arrangement ensures that the shear studs conform to the design specifications regarding spacing, welding processes, and material properties, thereby facilitating efficient and reliable shear transfer within composite structures. Figure 3 shows the geometric dimensions of the specimens, and the specific dimensions of each component are listed in Table 1. Each prefabricated slab contains two group stud slots, with the studs arranged as follows:
Specimen Z-40: The studs are arranged in a uniform grid of 10 rows and 4 columns. Each side of the concrete slab contains two slots, with studs arranged in a 10-row by 4-column configuration within each slot, as shown in Figure 3a.
Specimen Z-32: The studs within each slot are symmetrically divided into two regions, each containing a 4-row by 4-column arrangement. The slot shape and overall layout remain identical to those in Z-40, but the studs are uniformly distributed across the two regions within each slot, as shown in Figure 3b.
Specimen Z-16: The studs in each slot are arranged in a diagonal pattern, forming a 4-row by 4-column grid. In all three full-scale specimens, the horizontal spacing between the studs is 50 mm, while the vertical spacing is 100 mm, as shown in Figure 3c.
Scaled Specimen S-13: The studs are similarly arranged in a diagonal pattern within each slot, with 13 studs distributed in a 6-row by 2-column configuration, plus a central stud. The horizontal and vertical spacings between the studs are 40 mm and 50 mm, respectively, as shown in Figure 3d.
Notably, the slots in specimens Z-40 and Z-32 are relatively large, accommodating a higher number of studs. To enhance the overall mechanical integrity of the structure, a stepped shape is adopted in the casting direction to increase the bonding surface between the new and existing concrete. Furthermore, to mitigate the risk of splitting failure, each concrete slab is reinforced with two layers of steel mesh at the top and bottom, and the placement of the steel bars is adjusted according to the stud positions within the slots to avoid potential conflicts during installation.
This study employed high-strength concrete in place of conventional concrete for the prefabricated slab components, while high-strength steel fiber-reinforced concrete was utilized to fill the group stud slot areas to reduce the self-weight of the straddle monorail composite beam and improve its load-bearing capacity. Material property tests indicated that the maximum compressive strength of the prefabricated concrete reached 66.4 MPa, while the cast-in-place concrete in the slots reached 112.2 MPa. For the full-scale specimens, the steel beam exhibited a yield strength of fy = 465.5 MPa and an ultimate strength of fu = 562.8 MPa. For the scaled specimen, the yield and ultimate strengths were fy = 345 MPa and fu = 516 MPa. The specimens used Grade 4.6 studs, and their strength and other material properties are listed in Table 2.
Furthermore, post-welding quality tests were conducted on the selected studs, and all the specimens complied with the relevant standards.

2.2. Test Equipment

The testing system employed in this study has a maximum thrust capacity of 20,000 kN and a displacement range of ±300 mm. The electro-hydraulic servo actuator was software-controlled to apply both load and displacement. For specimens Z-40, Z-32, and Z-16, steel plates with a total thickness of 100 mm were positioned beneath them, whereas a 0.5 m high solid concrete block was utilized for the S-13 specimen to ensure that the actuator stroke remained within the permissible range. Each of the four tests required the use of four displacement meters. Furthermore, a data acquisition system was implemented for each specimen test.
Figure 4 illustrates the test loading device. Figure 4a is a schematic diagram that outlines the structure and key component layout of the loading device. Figure 4b is a physical drawing that visually presents the actual construction of the equipment, aiding in the understanding of the test setup.

2.3. Loading Scheme

A monotonic incremental preload was applied to ensure a tight fit of all parts of the specimen, thereby eliminating the effects of uneven deformation. During the formal test, displacement control was employed. The loading rate was initially set at 1 mm/min, with each increment maintained for 1 min until the specimen reached the large deformation stage. Subsequently, the loading rate was reduced to 0.5 mm/min, with each increment held for 2 min, until the specimen failed.

2.4. Measurement Scheme

The primary objective of this test is to measure the slip at the steel–concrete interface and the strain in the studs of the four push-out specimens. The main physical quantities measured include load–slip curves and stud strain. The specific measurement methods are outlined as follows:
  • Load–Slip: Four displacement meters were placed at the same height (bottom of the steel beam) on each specimen to record displacement, with load data obtained in real-time through the control system.
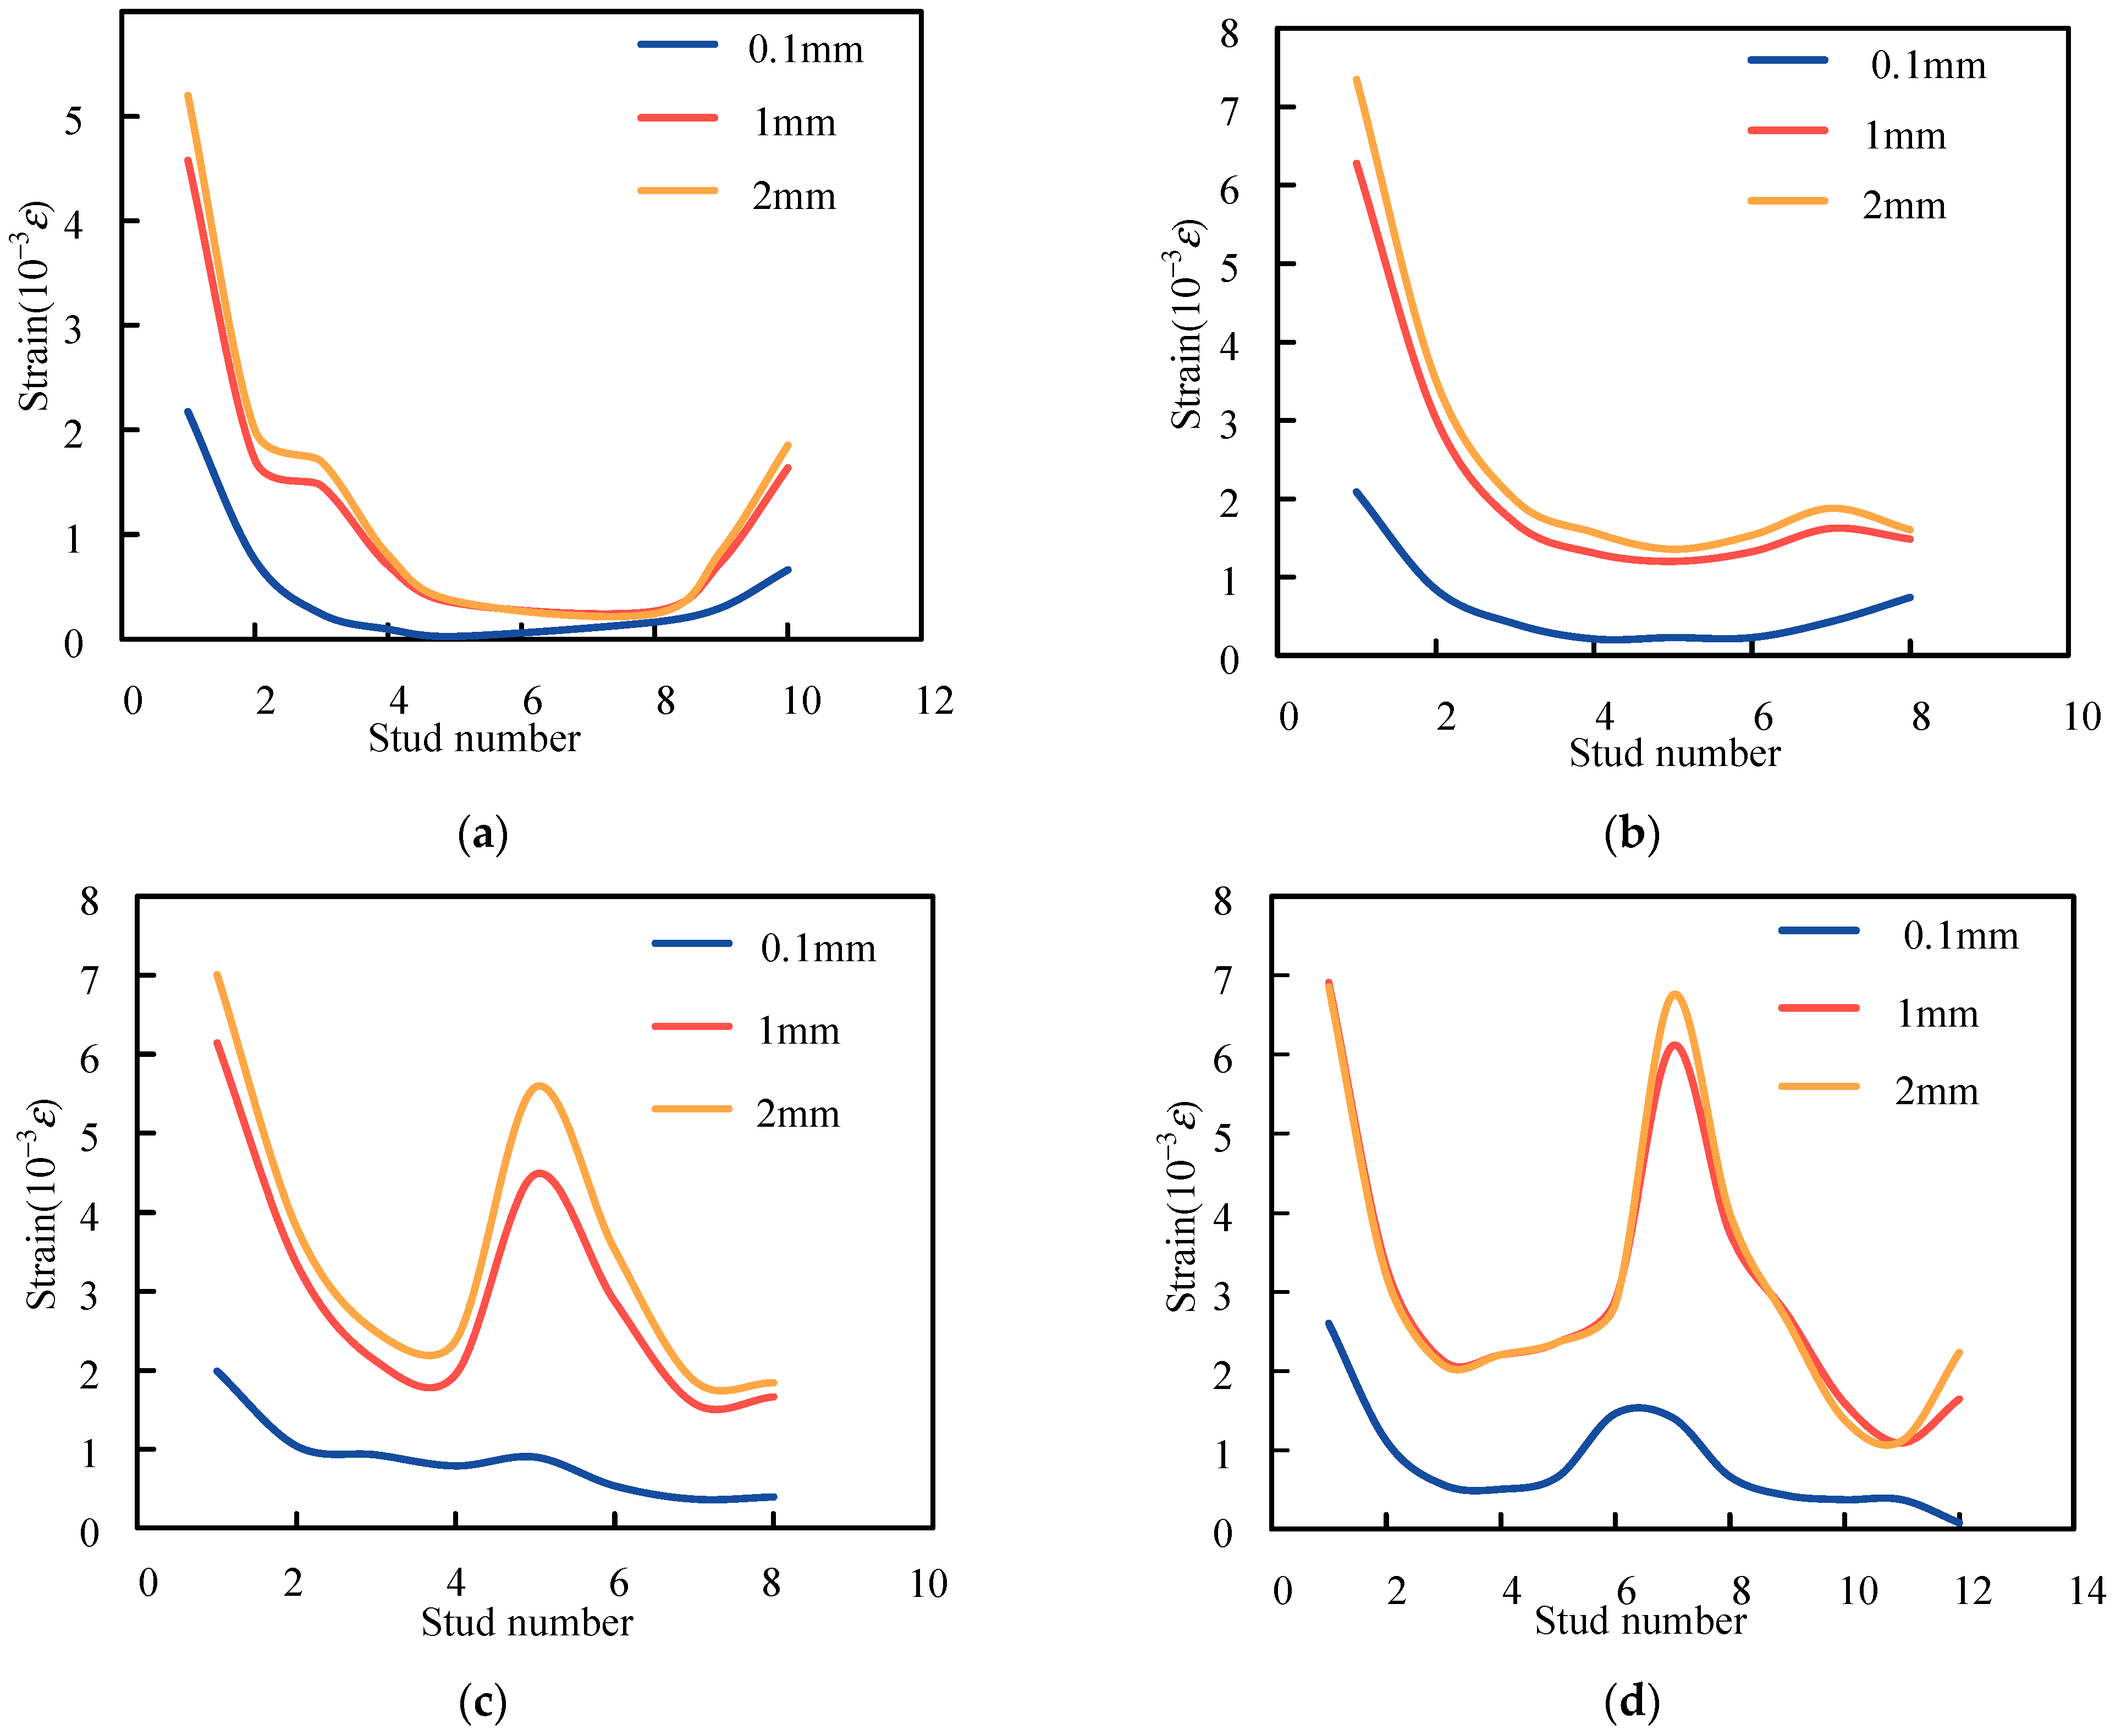
  • Stud Strain: For specimen Z-40, 40 strain gauges were placed on the studs, positioned at the upper ends in the loading direction, where shear deformation is maximized, as illustrated in Figure 5a. For specimen Z-32, one strain gauge was placed on each row of studs in each slot, resulting in a total of 64 strain gauges, as shown in Figure 5b. For specimen Z-16, one strain gauge was placed on each row outside the slots, with a total of 16 strain gauges arranged in 4 rows, as shown in Figure 5c. For specimen S-13, one strain gauge was placed on each external stud in each row, resulting in a total of 24 strain gauges, arranged in 4 rows, as shown in Figure 5d.

2.5. Specimen Construction

Figure 6 illustrates the fabrication and construction process of the specimen, including (Figure 6a) demolding, (Figure 6b) assembling, (Figure 6c) pouring, and (Figure 6d) testing. Before pouring the cast-in-place concrete, the slot surfaces were cleaned using an air gun to remove debris, and then moistened with water to ensure a tight bond between the two parts. The concrete was compacted by manual insertion and vibration. To account for the high shrinkage of the cast-in-place concrete, the concrete was generally overfilled by 2–5 mm as a shrinkage allowance. During the casting process, three 10 cm × 10 cm × 10 cm concrete cubes were reserved for strength testing. Two hours after casting, the specimens were covered with wet burlap and cured for one week. The concrete cubes were cured under the same conditions as the specimens.

3. Results

3.1. Failure Modes

At low loads, all the specimens showed little change compared to their pre-load state. However, as the load increased, slip occurred between the prefabricated concrete slab and the steel beam, and the load–slip curves increased linearly. As the specimens approached the ultimate load, individual studs could be heard shearing, the slip increased, and the load gradually decreased with displacement. Finally, a loud sound indicated failure, and the prefabricated concrete slab separated from the steel beam.
Figure 7a illustrates the typical failure mode of the studs in specimen Z-16, where the studs on one side were completely sheared off, as shown in Figure 7b,c. The failure modes of specimens Z-40 and Z-32 were similar to Z-16. In the initial loading stage of specimen S-13, no significant failure was observed at low load levels. As the displacement increased, at 665 kN, cracks began to form at the bottom corner of the concrete. At a load of 748 kN, a faint sound, resembling the crushing of concrete at the base of the studs, was heard, but no visible damage appeared on the specimen surface. When the load increased to 1163 kN, cracks appeared in the concrete, but the surface of the specimen remained unchanged. At an average displacement of 1.11 mm and a load reading of 1213 kN, horizontal cracks began to appear at the upper slot height of the prefabricated concrete slab. As the displacement continued to increase, these cracks widened, and the test load decreased. However, as the actuator continued to lower, the load gradually increased again. When the average reading of the displacement meter reached 3.27 mm, the load peaked at 1232 kN.

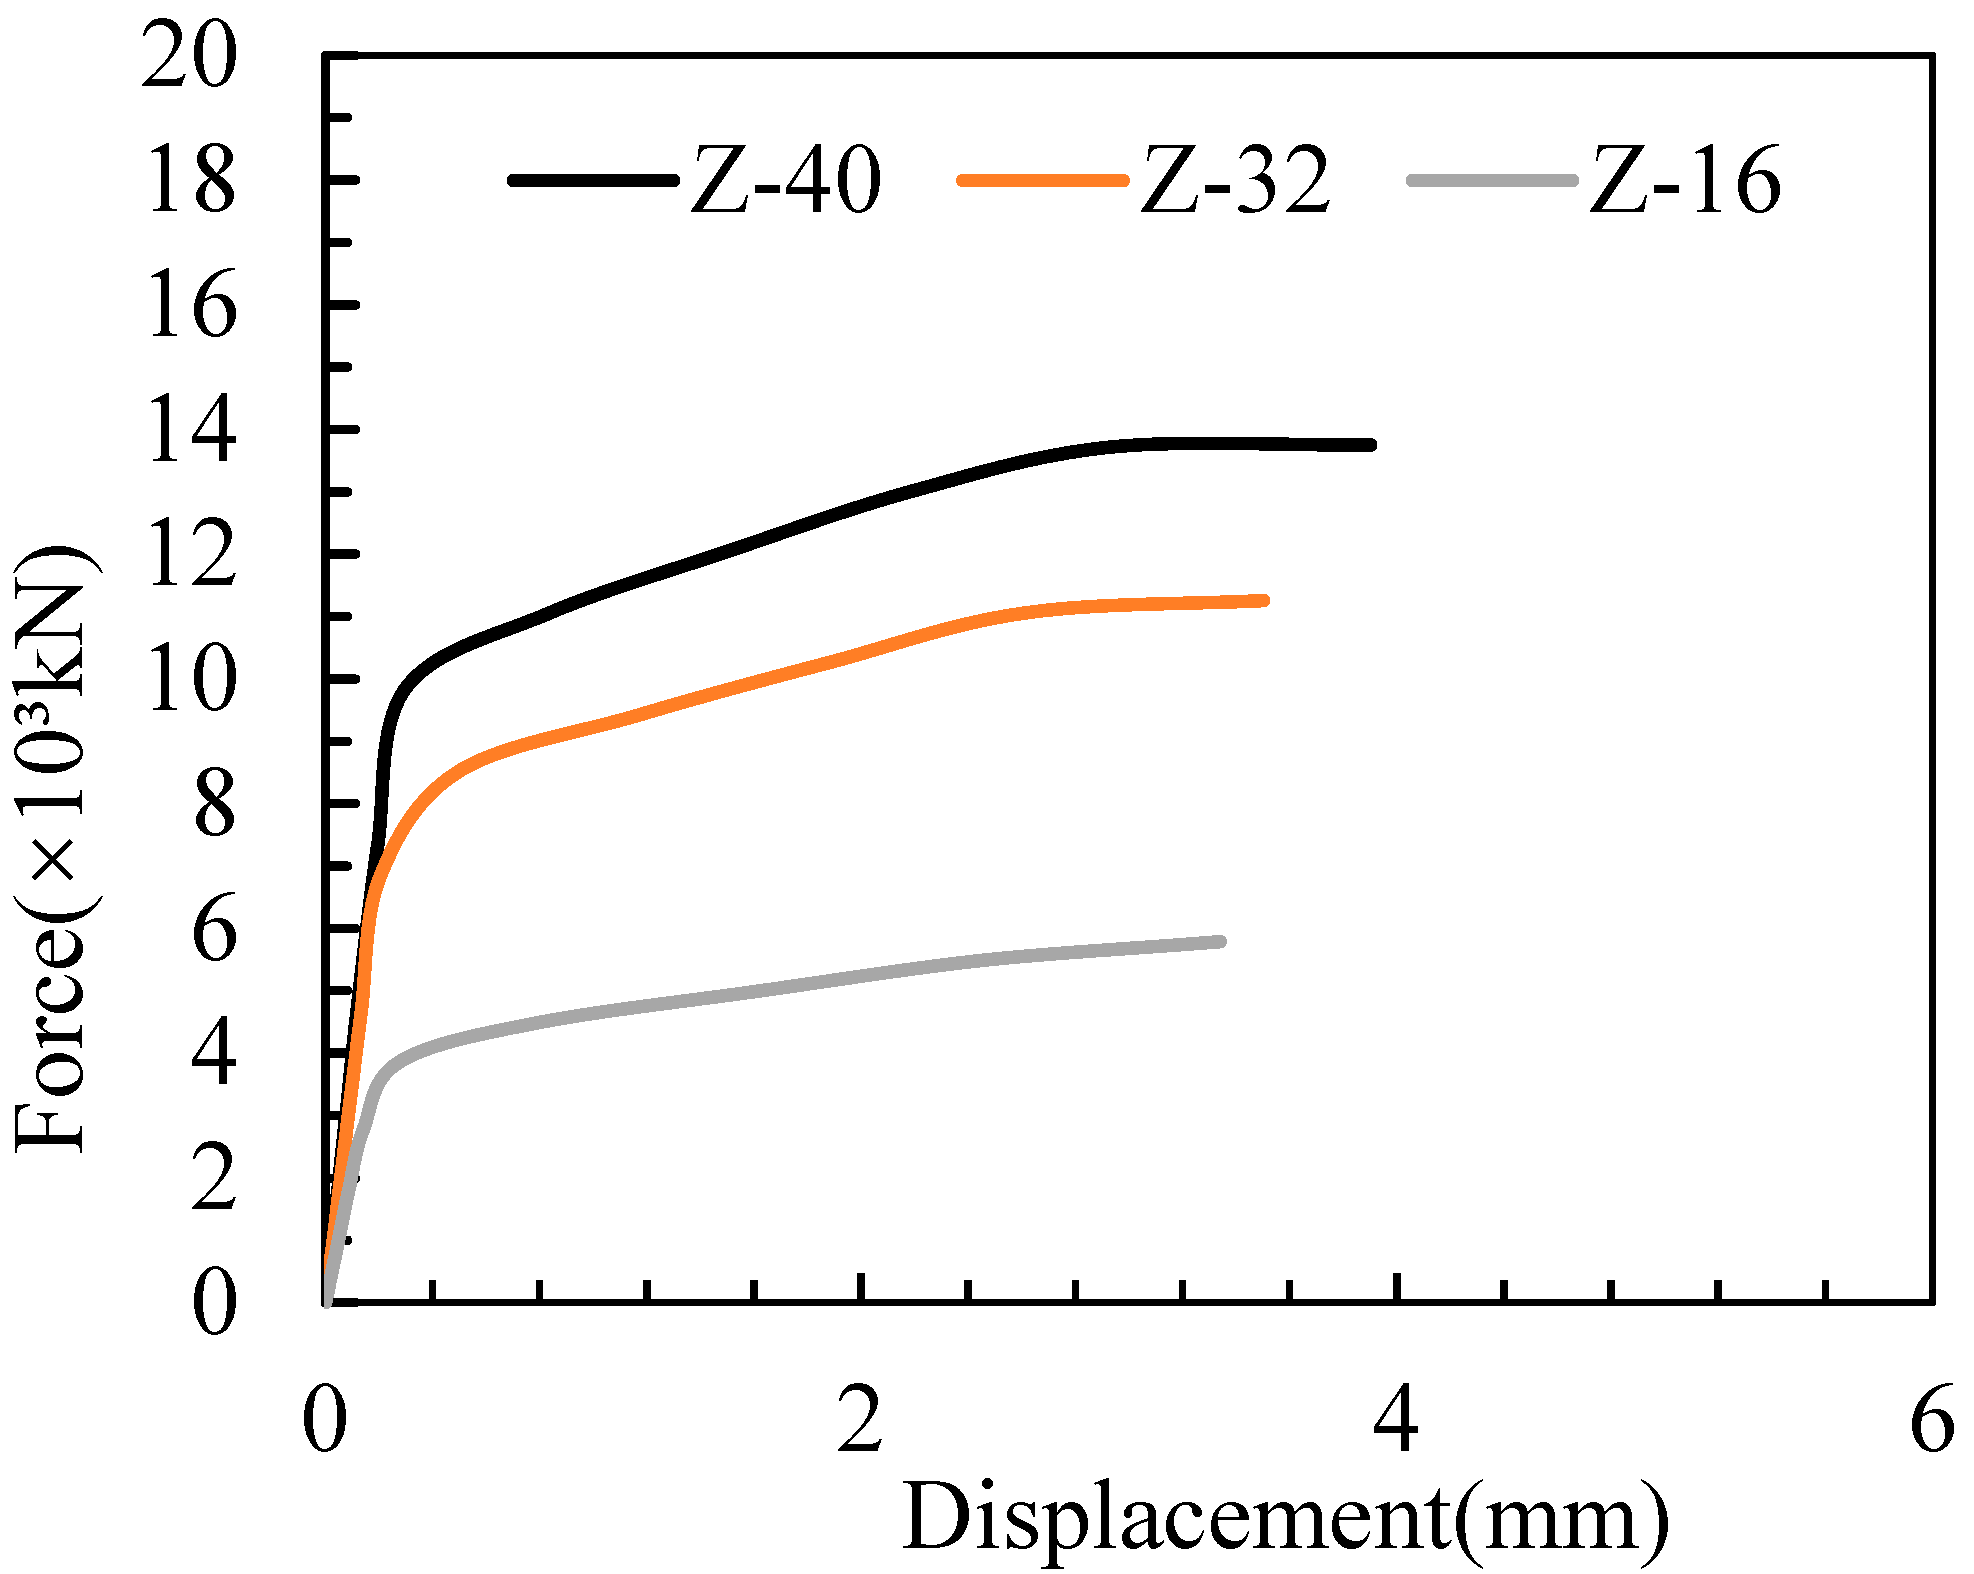
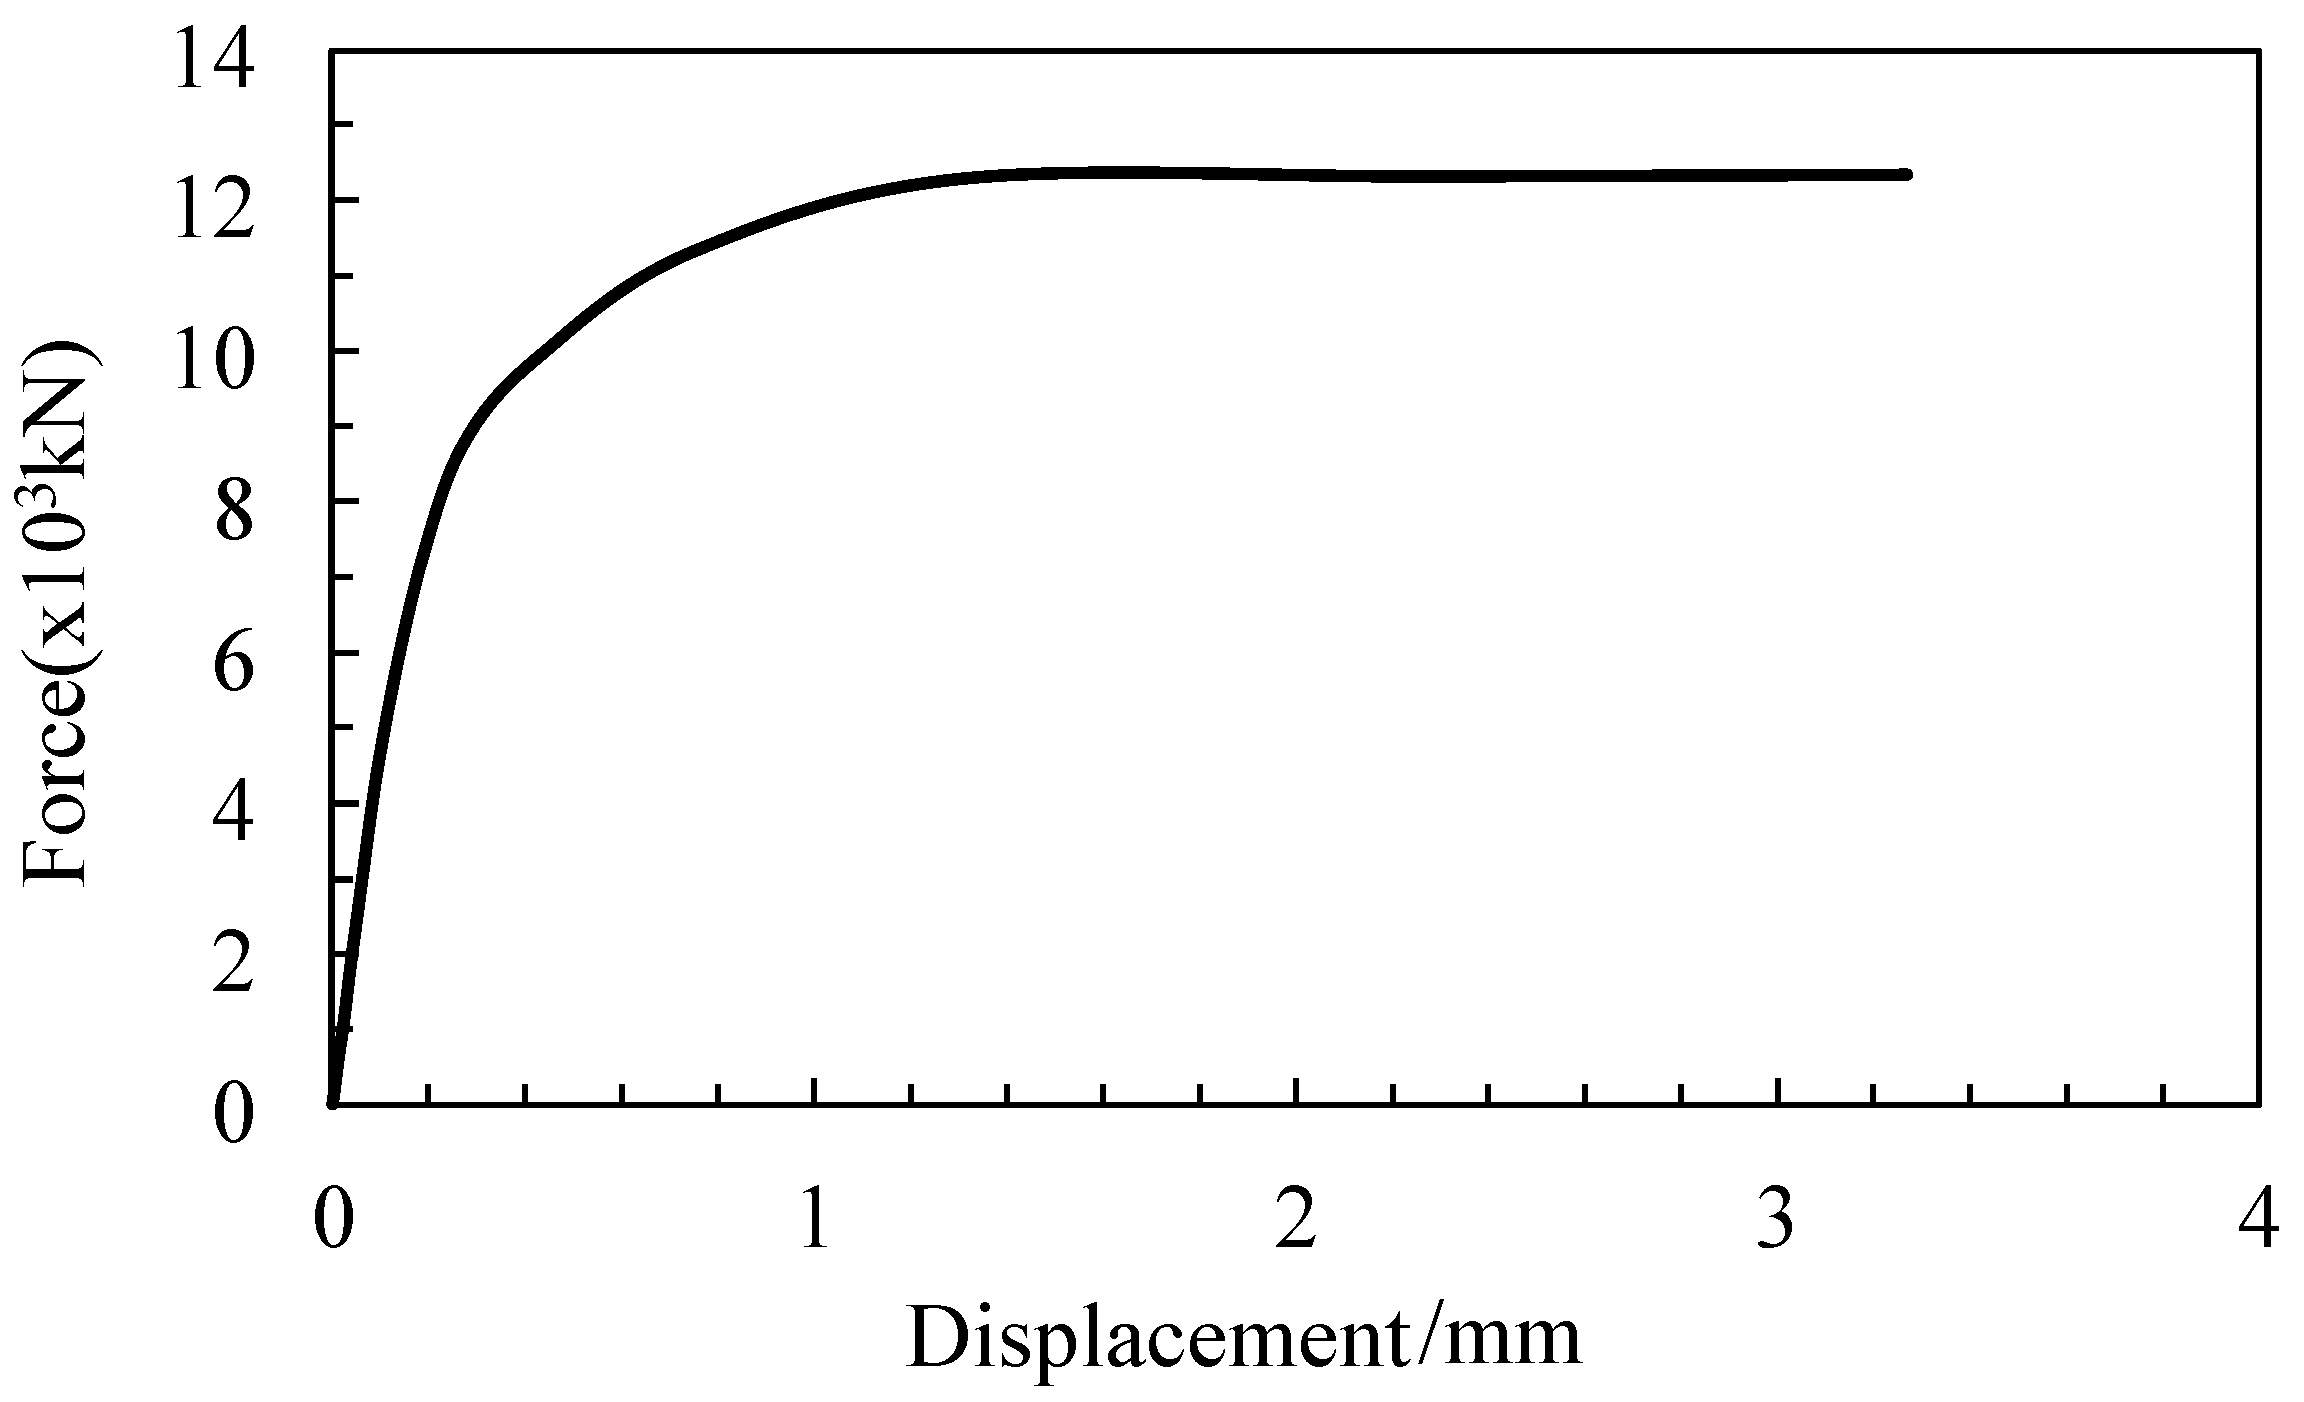
3.2. Load–Slip Curves

The displacement meters placed at the bottom of the full-scale and scaled specimens recorded displacement. Combined with the data from the load sensors, the load–displacement (load–slip) curves for each specimen were plotted, as shown in Figure 8 and Figure 9. At low load levels, the load increased sharply with increasing displacement, while the studs remained in the elastic phase, exhibiting high shear stiffness. After the displacement exceeded 0.2 mm, the stiffness of the specimens decreased significantly due to the yielding of the studs, which was reflected by a noticeable change in the curvature of the load–displacement curves. Despite the reduction in stiffness, the load continued to increase with displacement, but at a much slower rate than before the 0.2 mm displacement point. Once the displacement exceeded 2.4 mm, the studs began to shear off, and no further increase in load was observed thereafter.
The load–slip curves of the scaled specimen S-13 followed a similar pattern to those of the full-scale specimens, though the rate of stiffness reduction was slower after stud yielding, and no significant inflection point was observed.

3.3. Strain Data of Studs

Figure 10a–d illustrate the strain distribution along the height of the studs under various slip levels in the four groups of specimens. The strain data revealed that for the specimens with parallel slot layouts (Z-40 and Z-32), the group of studs displayed a force distribution pattern characterized by “higher strain at both ends and lower strain in the middle.” The strain was greatest in the first row of studs, significantly larger than in the other rows. For specimen Z-32, the strain in the lower four studs of the slot (studs numbered 5, 6, 7, and 8) was generally lower, likely due to the spacing between the upper and lower rows of studs. This gap caused the upper studs to bear more load, while the lower studs were less stressed. In the diagonally arranged slots (Z-16 and S-13), the first row of studs in each slot experienced the highest strain, with the bottom studs also exhibiting relatively high strain, while the strain in the middle studs was lower. Overall, the strain distribution pattern showed that the outermost studs bore more shear force, indicating that the outer studs carried a larger proportion of the total load in the group stud connection.
By comparing the strain distribution patterns at different slip levels shown in Figure 10, it was observed that the difference in strain between the outer and middle studs increased as the slip increased. This suggests that as the load increased, the shear force was redistributed among the group of studs, leading to a more pronounced uneven shear force distribution—demonstrating the increasing significance of the group stud effect. The strain distribution curves at 1 mm and 2 mm displacement exhibited a high degree of overlap, suggesting that the strain distribution pattern stabilized near the ultimate load state.

4. Experimental Result Analysis

This study systematically investigates the mechanical behavior of group stud connectors under different load conditions through four sets of push-out tests. The results provide detailed analyses of the load-bearing capacity, ultimate deformation, size effects, and the influence of stud spacing on the performance of group stud connectors.

4.1. Load-Bearing Capacity of Full-Scale Specimens

The push-out tests provided the failure modes, load–displacement curves, and shear capacities of the studs for the three full-scale specimens (Z-40, Z-32, and Z-16). Table 3 presents the shear capacities of the studs for each specimen. The results indicated that group stud connectors exhibited a significant degree of ductile failure during loading, with the studs undergoing substantial plastic deformation before ultimately shearing off. This failure mode is in agreement with the classical shear failure behavior of studs.
The test data indicated that the ultimate loads for the Z-40, Z-32, and Z-16 specimens were 13,757 kN, 11,261 kN, and 5789 kN, respectively. The shear capacities per stud were 85.98 kN, 87.98 kN, and 90.46 kN, respectively. Although the reduction in the number of studs led to a decrease in the overall load-bearing capacity of the specimens, the shear capacity of individual studs increased slightly. This suggests that the group stud effect became more evident as the number of studs increased. Compared to the theoretically calculated value of 118.1 kN, the shear capacities of the full-scale specimens were reduced by 23.4% to 27.2%, primarily due to the uneven distribution of shear forces among the studs caused by the group stud effect. In denser stud arrangements, such as in the Z-40 specimen, the studs on the outer edges bore significantly more load than those in the center.

4.2. Analysis of Ultimate Deformation of Full-Scale Specimens

In addition to load-bearing capacity, ultimate deformation is a key indicator of the ductility and plastic deformation capacity of the connection. The load–displacement curves and strain data recorded during the tests indicate that the full-scale specimens exhibited good ductility, with large displacements before failure. The displacement ductility coefficients (Du/Dy) were calculated for each specimen, as presented in Table 4. The displacement ductility coefficients for the Z-40, Z-32, and Z-16 specimens were 12.58, 12.06, and 13.92, respectively. This indicates that even with the reduction in shear capacity due to the group stud effect, the specimens maintained a strong deformation capacity.
Specifically, the Z-16 specimen exhibited the highest displacement ductility coefficient, indicating that the reduced number of studs facilitated greater plastic deformation in the structure. In contrast, the Z-40 specimen, although possessing a higher load-bearing capacity, exhibited a more pronounced group stud effect due to the dense arrangement of studs, causing some studs to prematurely enter the plastic phase and thereby limiting the overall ductility of the structure. This suggests that in practical engineering applications, reducing the density of group stud arrangements may serve as an effective strategy for enhancing the structure’s ductility.

4.3. Size Effect Analysis

Size effect was one of the key variables examined in this study. To analyze how reducing specimen size influences the group stud effect and load-bearing capacity, a 1:3 scaled specimen (S-13) was designed and compared with the full-scale specimens.
The test results indicated that the shear capacity per stud for the scaled specimen was 23.7 kN, which is 16.5% lower than the theoretical value of 28.4 kN, and significantly lower than the reduction observed in the full-scale specimens (23.4% to 27.2%). This suggests that the group stud effect diminishes as the specimen size decreases, likely because the mechanical interaction between studs becomes weaker in smaller structures.
Moreover, the displacement ductility coefficient for the scaled specimen was 16.6, which was notably higher than that of the full-scale specimens. This demonstrates that reducing the specimen size not only weakens the group stud effect but also enhances the deformation capacity of the structure. This finding is highly valuable for engineering applications, particularly in the design of smaller components. In such cases, reducing the density of stud arrangements could be considered to minimize the negative effects of the group stud phenomenon while simultaneously improving ductility.

4.4. Influence of Stud Spacing and Arrangement

The arrangement and spacing of the studs significantly impacted the group stud effect and the overall load-bearing capacity of the connection. The experimental results showed that in the more densely arranged specimens (Z-40 and Z-32), the reduction in shear capacity was more pronounced. This was due to the greater influence of the group stud effect in densely packed arrangements, where the outer studs bore more shear force than those located in the center, leading to an uneven distribution of load across the studs.
The strain data further confirmed this observation. The load distribution pattern, characterized by “higher strain at both ends and lower strain in the middle,” persisted throughout the loading process for specimens Z-40 and Z-32. This non-uniform distribution of shear forces is a key characteristic of the group stud effect and directly affects the failure mode and load-bearing capacity of the studs.
In contrast, the diagonal arrangement of studs in specimen Z-16 resulted in a more uniform load distribution, thereby mitigating the group stud effect. The load-bearing capacity and ductility of this specimen were significantly better than those of the specimens with parallel stud arrangements. Similarly, the diagonal arrangement used in the scaled specimen S-13 yielded similar results, although the smaller size of the specimen further reduced the group stud effect.

4.5. Influence of Material Properties on Group Stud Effect

In this experiment, high-strength steel fiber concrete was used for both the prefabricated slabs and the cast-in-place concrete. The material property tests indicated that the compressive strength of the prefabricated concrete reached 66.4 MPa, while the cast-in-place concrete in the slots reached 112.2 MPa. The use of high-strength concrete enhanced the shear capacity of the studs, but also exacerbated the group stud effect. Specifically, the high strength of the concrete allowed the outer studs to bear significantly more load, which led to premature shearing in some of the outer studs during the later stages of loading.
Additionally, the high compressive strength of the concrete contributed to the overall deformation capacity of the specimens, especially in the scaled specimen S-13. The synergy between the high-strength concrete and the studs allowed the specimen to maintain high load-bearing capacity even at larger displacements. This suggests that in applications where high-strength concrete is used, special attention must be given to optimizing the arrangement and density of studs to minimize the negative impacts of the group stud effect on load-bearing capacity.

5. Comparison Between the Shear Capacity Obtained from Tests and Codes

The ultimate shear capacity obtained from tests was analyzed with that obtained from various codes in terms of Eurocode 4, AASHTO, JSCE, and GB 50917-2013 [24,25,26,27] to analyze the applicability of these specifications in predicting the shear capacity of group studs.
(1) Eurocode 4: The design shear capacity of one stud P Rd in Eurocode 4 is calculated as Equations (1) and (2), where γ v is the partial factor, whose recommended value is 1.25. d and h sc are the shank diameter and nominal height of shear studs, respectively. f u , f ck , and E cm are the ultimate tensile strength of shear stud, characteristic cylinder compressive strength of concrete, and Young’s modulus of concrete, respectively.
P Rd = 0.29 α d 2 f ck E cm γ v 0.8 f u π d 2 / 4 γ v
α = 0.2 h sc d + 1   ( 3 h sc / d 4 ) α = 1   ( h sc / d > 4 )
(2) AASHTO: The design stud shear capacity Q n is determined as Equation (3), where A sc is the cross-sectional area of shear studs, E c denotes the elastic modulus of concrete, and f c and F u represent the specified compressive strength of concrete and minimum tensile strength of shear studs, respectively.
Q n = 0.5 A sc f c E c A sc F u
(3) JSCE: The allowable shear capacity Q n of one stud is determined as Equation (4), where d , H denote the shank diameter and height of shear studs, respectively. σ ck represents the design strength of concrete. Noticeably, the ultimate shear capacity of one stud is more than six times the Q n . Therefore, the shear capacity of one stud for comparison is set as six times the Q n
Q n = 9.4 d 2 σ ck   ( H / d 5.5 ) Q n = 1.72 d H σ ck   ( H / d < 5.5 )
(4) GB 50917-2013 [27]: The design shear capacity of one stud in GB 50917-2013 is determined as Equation (5), where A std denotes the cross-sectional area of shear studs, and A std , f std , and E s denote the cross-sectional area, tensile strength, and elastic modulus of shear studs, respectively. f cu , f cd , and E c denote the cube compressive strength, design compressive strength, and elastic modulus of concrete, respectively. η represents the reduction factor of group stud effect, and the value of it is 1.0 when the ratio of longitudinal spacing and shank diameter of shear studs l d / d is larger than 13, while l d / d is smaller than 13, and the value of η is determined by Equation (6).
N v c = min ( 1.19 A std f std ( E c E s ) 0.2 ( f cu f std ) 0.1 , 0.43 η A std f cd E c )
η = 0.021 l d / d + 0.73   ( C 30 - C 40 ) η = 0.016 l d / d + 0.80   ( C 45 ,   C 50 ) η = 0.013 l d / d + 0.84   ( C 55 ,   C 60 )
Table 5 summarizes the shear capacity of a single shear stud obtained from tests and various specifications. For the full-scale specimens Z-40, Z-32, and Z-16, the predictions from the four codes are generally consistent. However, for the scaled-down specimen Z-13, the GB code predicts a lower shear capacity than the other three codes, aligning more closely with the experimental results. This suggests that compared to other codes, the GB code may underestimate the shear capacity of small-diameter shear studs. In summary, the shear capacity predicted by the specifications exceeds the test results by approximately 25% for the full-scaled specimens and by 10–25% for the scaled specimen. This discrepancy indicates that the Eurocode 4, AASHTO, JSCE, and GB codes do not fully account for the impact of cluster-distributed studs on the shear capacity in steel–concrete composite beams with straddle monorail. Consequently, the shear capacity of shear studs calculated using these codes tends to be higher than the experimentally obtained values. Further research is needed to refine the shear stud design formulas to better incorporate the influence of group effects.

6. Conclusions

This study conducted a series of push-out tests on group stud connectors in steel–concrete composite beams for straddle monorail applications. Four sets of specimens were designed, with variables including the number of studs, arrangement patterns, and specimen size. The key findings from the experiments are as follows:
(1)
Ductile Failure Modes: The group stud connectors exhibited ductile failure modes. Analysis of the load–displacement curves reveals that all full-scale specimens achieved displacement ductility coefficients exceeding 12. At failure, a significant slip occurred between the high-strength concrete and the steel beam due to the shear deformation of the studs, highlighting the strong deformation capacity of the straddle monorail composite beam.
(2)
Group Stud Effect: The group stud effect significantly reduced the shear capacity of the studs due to uneven shear force distribution. The outer studs experienced higher loads, while the central studs carried less load. The degree of reduction in shear capacity was proportional to the density of the stud arrangement.
(3)
Size Effect: When specimen size was reduced, the mechanical behavior and failure modes of the group stud connectors remained consistent, but the group stud effect was diminished, and deformation capacity was enhanced.
(4)
The shear capacity obtained from four specifications is larger than the test results with a difference of almost 25% for the full-scaled specimens and 10–25% for the scaled -specimen.
(5)
The finite element analysis and parameter analysis of the structure will be conducted to improve the generalizability. In addition, the long-term performance of group stud connectors will be considered to replicate the performance of the connections under real conditions.

Author Contributions

L.-T.J.: conceptualization, data curation, methodology, writing—original draft, and funding acquisition. Z.-H.W.: investigation. Y.-F.Z.: software and writing—editing. J.-Z.Z.: conceptualization. S.-K.W.: supervision. All authors have read and agreed to the published version of the manuscript.

Funding

This work is supported by the National Key Research and Development Program of China (2024YFF0505400), the China Postdoctoral Science Foundation (2024M763871), and Fundamental Research Funds for the Central Universities (2024CDJYXTD-005).

Institutional Review Board Statement

Not applicable.

Informed Consent Statement

Not applicable.

Data Availability Statement

The original contributions presented in this study are included in the article. Further inquiries can be directed to the corresponding author.

Conflicts of Interest

The authors declare no conflicts of interest.

Nomenclature

Symbols meanings
Duultimate displacement
Dyyield displacement
Du/Dydisplacement ductility coefficient
PrdThe design shear capacity of one stud
γvpartial factor
dshank diameter
hscnominal height of shear studs
fubending moment at the column end
fckcharacteristic cylinder compressive strength of concrete
EcmYoung’s modulus of concrete
Qnthe design stud shear capacity
Ascthe cross-sectional area of shear studs
Ecdenotes the elastic modulus of concrete
fcthe specified compressive strength of concrete
Fuminimum tensile strength of shear studs
Hheight of shear studs
σckthe design strength of concrete
Astdthe cross-sectional area of shear studs
fstdtensile strength
Ecelastic modulus of concrete
ηthe reduction factor of group stud effect
ldlongitudinal spacing of shear studs

References

  1. Shamsi, M.; Ghanbari, A. Seismic retrofit of monorail bridges considering soil-pile-bridge-train interaction. J. Bridge Eng. 2020, 25, 04020075. [Google Scholar]
  2. Li, C.H.; Lu, Z.J. An innovative straddle monorail track switch design for the personal rapid transit. Int. J. Heavy Veh. Syst. 2021, 28, 370. [Google Scholar]
  3. Zhou, S.; Liu, Z.; Fang, C. Study on equivalent stiffness of prefabricated steel-concrete composite track beam with straddle monorail group nail connection. Constr. Technol. 2020, 49, 56–59. (In Chinese) [Google Scholar]
  4. Wang, S.D.; Fang, Z.C.; Chen, G.F.; Teng, S. Numerical Analysis on Shear Behavior of Grouped Head Stud Shear Connectors between Steel Girders and Precast Concrete Slabs with High-Strength Concrete-Filled Shear Pockets. J. Bridge Eng. 2021, 26, 04021030. [Google Scholar] [CrossRef]
  5. Lu, S.; Zhao, W.; Guo, Z. Experimental Study of the New Type Stud Shear Connector for Assembled Steel–Concrete Beams. Iran. J. Sci. Technol. Trans. Civ. Eng. 2022, 46, 3119–3130. [Google Scholar] [CrossRef]
  6. Daou, A.; Mahayri, A.R.; Daou, Y.; Baalbaki, O.; Khatib, M. The Use of Shear Connectors for Enhancing the Performance of Steel–Concrete Composite Beams: Experimental and Numerical Assessment. Int. J. Steel Struct. 2021, 21, 1966–1976. [Google Scholar] [CrossRef]
  7. Zhou, S.; Nie, J.G.; Fang, C. Study on mechanical characteristics of assembled composite track beam connected by group nails. China Railw. Sci. 2021, 42, 59–65. (In Chinese) [Google Scholar]
  8. Fang, Z.; Fang, H.; Huang, J.; Jiang, H.; Chen, G. Static Behavior of Grouped Stud Shear Connectors in Steel–Precast UHPC Composite Structures Containing Thin Full-Depth Slabs. Eng. Struct. 2022, 252, 113484. [Google Scholar]
  9. Zou, Y.; Qin, F.J.; Zhou, J.T.; Zheng, Z.C.; Huang, Z.L.; Zhang, Z.Y. Shear behavior of a novel bearing-shear connector for prefabricated concrete decks. Constr. Build. Mater. 2021, 268, 121090. [Google Scholar] [CrossRef]
  10. Chai, W.; Di, J.; Lu, Y.; Qin, F.; Men, P.; Su, Y. Experimental Investigation on Static Mechanical Performance of Grouped-Stud Shear Connectors in Steel–UHPC Composite Beams. Eng. Struct. 2024, 306, 117836. [Google Scholar] [CrossRef]
  11. Lu, W.; Huang, Y.; Xu, W. Study on the Shear Resistance Performance of Grouped Stud Connectors. Materials 2023, 16, 6625. [Google Scholar] [CrossRef] [PubMed]
  12. Chen, J.; Wang, S.; Zhang, X.; Xu, H.; Xu, F.; Liu, Y.; Yang, C.; Xia, Q.; Wang, H.; Ding, F. Investigations on the Shearing Performance of Composite Beams with Group Studs. Adv. Struct. Eng. 2023, 26, 1783–1802. [Google Scholar] [CrossRef]
  13. Zhao, G.-Y.; Zhu, L.; Liu, W.; Zhao, J.-C.; Huo, J.-X. Numerical Study on the Effect of Interface Dynamic Damage of Steel–Concrete Composite Beam Bridge Caused by High–Frequency Impact Load. Buildings 2023, 13, 545. [Google Scholar] [CrossRef]
  14. Liu, Y. 3D finite element analysis of grouped shear stud connectors in composite beams. J. Constr. Steel Res. 2021, 181, 106652. [Google Scholar]
  15. Ding, J.; Zhu, J.; Shi, T. Performance of Grouped Stud Connectors in Precast Steel-UHPC Composite Bridges under Combined Shear and Tension Loads. Eng. Struct. 2023, 277, 115470. [Google Scholar]
  16. Kim, Y. Influence of grouped shear connectors on the fatigue behavior of composite beams. Int. J. Fatigue 2019, 126, 246–257. [Google Scholar]
  17. Yu, J.; Wang, Y.-H.; Liu, J.-P.; Frank Chen, Y.; Xue, S.-L.; Yu, Z. Stiffness Analysis of Shear Stud Group Connectors in Precast Concrete Deck. Eng. Struct. 2023, 274, 115148. [Google Scholar] [CrossRef]
  18. Zhou, S.; Yu, P.; Nie, J.G. Static and Dynamic Characteristics of Steel-Concrete Composite Track Beam of Straddle Monorail with Cluster-Distributed Studs. Adv. Civ. Eng. 2022, 2022, 9570045. [Google Scholar]
  19. Ding, Y.; Jia, Y.; Zhang, G.; Wang, J. Experimental and Numerical Study of the Flexural Behavior of a Full-Scale Steel-Concrete Composite Beam. Iran. J. Sci. Technol. Trans. Civ. Eng. 2023, 47, 305–314. [Google Scholar] [CrossRef]
  20. Wang, S.; Tang, C.; Fu, Y.; Zhu, J.; Di, J.; Li, G. Methodology for Calculating Load Capacity Reduction and Slip Relationship of Clustered Group Nail Connectors. Adv. Bridg. Eng. 2024, 5, 7. [Google Scholar] [CrossRef]
  21. GB/T 50152; Standard for Test Methods of Concrete Structures. Architecture & Building Press: Beijing, China, 2012. (In Chinese)
  22. GB/T 10433-2002; Cheese Head Studs for Arc Stud Welding. Architecture & Building Press: Beijing, China, 2002. (In Chinese)
  23. JGJ 138-2016; Technical Specification for Steel–Concrete Composite Structures. Architecture & Building Press: Beijing, China, 2016. (In Chinese)
  24. EN 1994; EUROCODE 4: Design of Composite Steel and Concrete Structures. Part 2 General Rules and Rules for Bridges. British Standards Institution (BSI): London, UK, 2005.
  25. AASHTO. LFRD Bridge Design Specifications, 4th ed.; American Association of State Highway and Transportation Officials: Washington, DC, USA, 2007. [Google Scholar]
  26. JSCE. Standard Specification for Steel and Composite Structures (Design Edition); Japan Society of Civil Engineers: Tokyo, Japan, 2007. (In Japanese) [Google Scholar]
  27. GB50917-2013; Code for Design of Steel and Concrete Composite Bridges. Architecture & Building Press: Beijing, China, 2013. (In Chinese)
Figure 1. Plane layout of studs in the composite beam. (a) Uniform-distributed studs; (b) cluster-distributed studs.
Applsci 15 04051 g001
Figure 2. Detailed stud connector arrangements of full-scale and scaled specimens. (a) Full-Scale Specimen; (b) Scaled Specimen.
Applsci 15 04051 g002
Figure 3. Geometric dimensions of specimens. (a) Specimen Z-40; (b) Specimen Z-32; (c) Specimen Z-16; (d) Specimen Z-13.
Applsci 15 04051 g003
Figure 4. Test loading device. (a) Schematic diagram; (b) Physical drawing.
Applsci 15 04051 g004
Figure 5. Layout of stud strain gauge. (a) Specimen Z-40; (b) Specimen Z-32; (c) Specimen Z-16; (d) Specimen Z-13.
Applsci 15 04051 g005
Figure 6. Fabrication and construction of specimen. (a) Specimen demolding; (b) Specimen assembling; (c) Specimen pouring; (d) Specimen test.
Applsci 15 04051 g006
Figure 7. Typical failure modes. (a) Overall drawing; (b) Steel beam; (c) Concrete interface joint.
Applsci 15 04051 g007
Figure 8. Bottom load–slip curve of 3 groups of full-scale specimens.
Applsci 15 04051 g008
Figure 9. Bottom load–slip curve of scaled specimen S-13.
Applsci 15 04051 g009
Figure 10. Comparison of strain distribution patterns at different slip levels. (a) Specimen Z-40; (b) Specimen Z-32; (c) Specimen Z-16; (d) Specimen Z-13.
Applsci 15 04051 g010
Table 1. Component size parameter table (unit: mm).
StudPrecast Concrete SlabSteel Beam Stud Base PlateSteel Beam Web Plate
DiameterHeightHeightWidthThicknessHeightWidthThicknessHeightWidthThickness
Full-scale specimen191601600690320160067014160040012
Scaled
specimen
105410502301071000224610001304
Table 2. Material property test results of concrete and studs.
SpecimenCompressive Strength of Precast Concrete/(MPa)Compressive Strength of Cast-In-Place Concrete for Notch/(MPa)Stud Ultimate Strength/(MPa)Stud Connector Grad
Z-4055.981.25954.6
Z-3262.8108.55954.6
Z-1666.4112.25954.6
Z-1362.8108.55164.6
Table 3. Push-out test results of group studs.
SpecimenZ-40Z-32Z-16
Final load/kN13,75711,2615789
Final deformation/mm3.903.503.34
Shear capacity of single stud/kN85.9887.9890.46
Table 4. Displacement ductility coefficient.
SpecimenDuDyDu/Dy
Z-403.900.3112.58
Z-323.500.2912.06
Z-163.340.2413.92
Table 5. Comparison of the shear capacity of one stud obtained from tests and codes.
SpecimenStud Diameter/(mm)Tests/(kN)EC4/(kN)AASHTO/(kN)JSCE/(kN)GB/(kN)
Z-401986.0108.9105.1106.8107.3
Z-321988.0108.9105.1106.8107.3
Z-161990.5108.9105.1106.8107.3
Z-131023.730.229.129.625.7
Disclaimer/Publisher’s Note: The statements, opinions and data contained in all publications are solely those of the individual author(s) and contributor(s) and not of MDPI and/or the editor(s). MDPI and/or the editor(s) disclaim responsibility for any injury to people or property resulting from any ideas, methods, instructions or products referred to in the content.

