Article

Plant Diversity Characteristics and Environmental Interpretation Under the Land–Sea Gradient in the Yellow River Delta

College of Surveying and Mapping Geo-Informatics, Shandong Jianzhu University, Jinan 250101, China
*
Author to whom correspondence should be addressed.
Appl. Sci. 2025, 15(7), 4030; https://doi.org/10.3390/app15074030
Submission received: 21 February 2025 / Revised: 31 March 2025 / Accepted: 4 April 2025 / Published: 6 April 2025
(This article belongs to the Section Ecology Science and Engineering)

Abstract

:
Understanding the characteristics and key driving factors of plant diversity is of great significance for maintaining biodiversity and the ecosystem. Current studies on plant diversity in the Yellow River Delta are limited to local areas; there is a lack of comprehensive discussion on the spatial heterogeneity of plant diversity and the driving factors at a regional scale. Based on field investigations, this study explored the characteristics of plant composition and diversity under the land–sea gradient, with particular emphasis on the differences of plant diversity under different riverbanks and at a distance from the sea. Using the regression, redundancy, and Mantel test analysis, we analyzed soil properties, environmental factors, and human influence to assess their potential impacts on plant diversity. The results demonstrated that Asteraceae, Poaceae, and Amaranthaceae are the dominant plant families in the Yellow River Delta. As the distance from the sea increases, the community transitions from the monospecies dominance of Suaeda salsa to one dominated by various plants. The species similarity was higher in the adjacent environment and coastal areas. The overall level of plant diversity was not high, and the Margalef, Shannon–Wiener, Simpson, and Pielou index showed a fluctuating downward trend from land to sea. Notably, there was a peak value in the region of 3–17 km and >42 km from the sea. The plant diversity of the main stream bank was higher than that of its tributaries, where the former was more susceptible to human interference and the latter to soil electrical conductivity. In terms of the region, soil electrical conductivity had the greatest influence on plant diversity. This study could provide theoretical support for vegetation restoration and ecological protection in the Yellow River Delta.

1. Introduction

Biodiversity holds a crucial significance in the formation and maintenance of ecological functions. It not only reflects community composition, structure, successional stages, and habitat differences, but measures the interactions between biological communities and environmental factors. In addition, biodiversity optimizes resource allocation in the environment through mechanisms, such as complementarity and redundancy, ensuring ecosystem continuity. These mechanisms are particularly important in ecotones along some gradients. Therefore, studying the relationship between biodiversity and the environment is a focal point in ecological research [1,2]. Currently, in the field of community ecology, the diversity of plant communities holds significant importance, as it better reveals the structural and functional evolution of communities and ecosystems [3,4]. Plants, as vital components of an ecosystem, play an irreplaceable role in protecting the structure and carrying capacity of ecosystems, such as wetlands [5,6]. Plant diversity not only expresses the biodiversity at the species level, but reflects ecological diversity, including habitat heterogeneity, niche differentiation, and environmental complexity and variability. It is based on plant groups and encompasses the complex relationships formed by plants, plant species’ interactions with each other in competition and facilitation, population dynamics, with size and age relationships, and their interactions with the environment, as well as the ecological processes involved [7]. This diversity reflects the functional roles of species within communities, the status of environmental resource utilization, and the mechanisms that sustain community stability, making it a crucial basis for biodiversity conservation [8].
The relationship between plant diversity and the environment, including how environmental controls and external disturbances work together to shape spatial patterns of plant diversity along environmental gradients, represent an important issue in the field of plant ecology [9,10]. Most studies have suggested that environmental factors influence the diversity and distribution of plant communities [11,12]. Among these, soil factors are widely recognized as the dominant influences on vegetation pattern distribution at regional and local scales [13]. Specifically, these factors, such as soil moisture content (SMC), soil pH (SPH), and soil electrical conductivity (SEC), strongly affect nutrient availability and plant physiological processes. Other important factors, like compositional makeup and pore space, also influence plant growth by regulating soil structure stability, water-holding capacity, and root-zone aeration dynamics. Soil can provide vital nutrients for plant survival, and significantly impacts plant physiology and vegetation distribution. Consequently, the effects of soil properties on communities and the spatial patterns of plants have been widely studied [14]. In addition to the physicochemical properties of soil, factors influencing plant diversity also include topography [15], climatic factors [16], and human disturbances [17,18]. Plant diversity is closely linked to environmental factors. Exploring this relationship aids in uncovering the environmental factors that control plant community distribution. This understanding, in turn, can inform the development of appropriate management strategies to promote the conservation of plant diversity and the establishment of healthy, stable communities [19].
The unique geographical environment of river deltas, as a dynamic interface of land–sea interaction, forms a complex ecosystem, which provides ideal conditions for the development of plant community transition zones [20]. Among them, river ecosystems here have both water and land properties, with complex and diverse habitats and structures, and are breeding bases for many endangered plants [21].The Yellow River Delta is located at the interface of land and sea, where the dynamics of terrestrial and marine interactions create a complex and diverse ecological environment [20]. Various ecological processes in this region, such as soil development, water cycling, and vegetation succession, are affected by the combined effects of the Yellow River and marine dynamics. The delta not only features typical estuarine wetland ecosystems but is home to the most intact wetland ecosystems found in the warm temperate zone of China. The wetland vegetation types here are quite diverse, with extensive areas of naturally occurring vegetation in newly formed wetlands [22,23]. Due to coastal influences, the soil exhibits a high degree of salinization and relatively low nutrient levels in the Yellow River Delta. In littoral zones, plant diversity is particularly susceptible to significant impacts from environmental factors such as climate, soil, and water [24]. Some studies have identified the salinity of soil as an important factor influencing the plant diversity in littoral zones [25]. Additionally, the vegetation is characterized by its fragility, making it susceptible to backward and secondary succession caused by natural factors and human interference [26]. Influenced by terrestrial and marine interactions, the Yellow River Delta displays strong environmental heterogeneity, hosting unique habitats and biological diversity [27,28]. It serves as a breeding ground for numerous endangered species, such as the Grus japonensis, Neophocaena sunameri, and Glycine soja. The survival and reproduction of many species in this area are of significant importance for maintaining regional biodiversity. Currently, studies on the plant diversity of the Yellow River Delta, both domestically and internationally, primarily focus on the characteristics and succession of plant communities in estuarine wetlands or within the protected areas of the delta [27,29], as well as the relationship between meadow vegetation and soil factors [30,31,32]. However, in-depth investigations into the spatial heterogeneity of plant diversity in the Yellow River Delta are relatively scarce, particularly along the longitudinal environmental gradient of the land–sea interface. Systematic studies addressing the composition and fundamental characteristics of plants are still lacking in the Yellow River Delta. Exploring the variations in plant community composition and species diversity along the land–sea gradient, as well as the driving mechanisms behind these changes, is crucial for understanding the structure and function of the Yellow River Delta ecosystem and for formulating effective ecological conservation and restoration strategies [29].
Currently, issues such as water resource scarcity [32], human activity interference [22], and soil salinization [33] are threatening the stability and development of ecosystems in the Yellow River Delta. This situation necessitates the implementation of effective measures to enhance conservation and management efforts, ensuring the healthy development of the wetland ecosystem in the Yellow River Delta. In response to these challenges, China introduced the “Ecological Protection and High-Quality Development Plan for the Yellow River Basin” in 2021, emphasizing the need to strengthen the protection and restoration of the wetland ecosystem in the Yellow River Delta, and to enhance the conservation of biological resources in tidal flats, salt marshes, and estuarine coastal wetlands. Therefore, exploring the spatial heterogeneity of plant diversity along the land–sea gradient and their responsive mechanisms to environmental factors is of significant importance for the integrated conservation and restoration of terrestrial and marine ecosystems in the Yellow River Delta.
Based on the above background, this study explored plant species, communities, and habitat factors within the Yellow River Delta under the land–sea gradient using field techniques and multi-scale analysis. It aims to understand the situation of species composition, structural characteristics, and plant diversity in the ecological ecotone of the Yellow River Delta. Additionally, this study aims to elucidate how various factors, such as soil properties, other natural environmental factors, and human interference, influence plant diversity. The ultimate goal is to identify the key influencing factors that maintain plant diversity of the Yellow River Delta in riparian and regional areas, thereby providing theoretical references for restoration and sustainable development of river delta ecosystems.

2. Materials and Methods

2.1. Study Area

The Yellow River Delta (37°00′−38°16′ N, 118°00′−119°30′ E) is located in Shandong Province, China. Bohai Bay and Laizhou Bay are located in the north and east of the region (Figure 1). The climate is a semi-humid continental monsoon climate of the northern temperate zone. The annual average temperature is about 13 °C. The frost-free period is more than 200 days. The precipitation here is unevenly distributed throughout the year and the evaporation is large. There are frequent natural disasters, such as drought, waterlogging, high wind, hail, and storm surge. Under the influence of the Yellow River sedimentation and marine dynamics, the terrain here is higher in the southwest than in the northeast, but the fluctuation is relatively gentle on the whole. The main landform types include terraces, riverbank highlands, depressions, beach lands, flat lands, and tidal flat wetlands. The soil is mainly composed of coastal saline and tidal soil with low nutrient content. The Yellow River Delta belongs to the temperate deciduous broad-leaved forests in the vegetation division, and the floristic components are mostly temperate components. The natural vegetation is mainly meadow vegetation.

2.2. The Investigation Method

From 26 September to 22 October in 2023, samples of plant species, communities, soils, and habitats in the Yellow River Delta were collected and investigated based on a combination of standard quadrat and line survey. The survey area was concentrated in the fan-shaped area surrounded by the main stream and six natural tributaries of the Yellow River. In order to study the spatial heterogeneity of the species composition, structural characteristics, and species diversity along the land–sea gradient in the Yellow River Delta, we set up corresponding investigation routes according to the flow direction and distribution of these seven rivers. The layout of the routes was as follows: the northern region covered three routes of the Tiao River, the ancient route of the Yellow River, and Shenxian Ditch, which constituted the northern survey network; the central part mainly focused on the main stream of the Yellow River, which was the key survey axis connecting the north and south and running through the whole region; the Xiaodao, Yongfeng, and Yihong–Guangli River constituted the southern survey network. The survey area included the four counties of Dongying, Hekou, Kenli, and Lijin. In addition, it also included the Yellow River Delta National Nature Reserve with important ecological value and protection significance.
In order to ensure the representativeness and uniformity of sampling site selection, 33 sampling sites were determined considering the geographical differences under the land–sea gradient (Figure 2). Among them, 14 sampling sites were set up along the main stream of the Yellow River, and 19 sampling sites were set up along 6 tributaries of the Yellow River to explore the characteristics and changes of plant composition and diversity from the longitudinal gradient. According to the hierarchical structure of the community, each sampling site was divided into 3 groups of typical survey areas, and 3 quadrats were randomly set in each group. Since this area was mainly dominated by herbaceous vegetation, the size of the quadrat was set to 1 m × 1 m.
In the survey and collection of plants, a global positioning system (GPS) was used to collect altitude, latitude, and longitude. We investigated and recorded the types, abundance, height, and total coverage of plants, ecological conditions, slope, soil type, and human interference in each quadrat. We referred to the technical flora and species identification software “FlowerMate 2.0”, combined with the dichotomous classification, to identify plant species. The percentage of plant cover was determined by digital photography. Table 1 showed the specific information about the sampling sites. In order to further clarify the differences in composition and diversity of plant under the land–sea gradient, we evenly divided all sampling sites into 5 zones according to the different distances from the sea (Table 2).

2.3. Species Similarity Index

The Jaccard index can be used directly to quantify the species’ composition differences between different places or plant communities. When the Jaccard similarity index between two regions is high, it represents that the species’ composition is similar [34]:
Jaccard = 2 c / ( a + b )
where a is the number of species in sample A, b is the number of species in sample B, and c denotes the number of common species between the two samples. The value ranges from 0 to 1.

2.4. Measures of Plant Diversity

The species diversity has three meanings—species richness, evenness, and diversity [35]. This study selected the Margalef index (R), the Shannon–Wiener diversity index (H), the Simpson index (D), and the Pielou index (J) to evaluate the plant diversity of the Yellow River Delta. The ecological implications of each index are as follows [36,37]:
(1)
The Margalef index (R) reflects species richness. The higher the value, the greater the species’ diversity.
R = ( S 1 ) / ln N
(2)
The Shannon–Wiener index (H) comprehensively reflects the status of species richness and evenness, and can represent the degree of diversity at the location of the quadrat. The higher the value, the greater the species richness, evenness, and community diversity. Therefore, it can better reflect the structural information of various communities.
H = i = 1 S P i ln P i
(3)
The Simpson index (D), while reflecting the species diversity, measures the role of dominant species in the community. The higher the value, the more obvious the dominance, and the higher the species diversity.
D = 1 i = 1 S P i 2
(4)
The Pielou index (J) reflects the aggregation degree of the species distribution. A higher value indicates a more even distribution of species.
J = H / ln S
where S represents the number of species’ types, N denotes the number of all species, and P i denotes the important value of species i , indicating the ratio of the number of species i to the total number of species.
In order to test whether there are statistical differences in plant diversity under different riverbanks and different distances from the sea, we can conduct a one-way analysis of variance (ANOVA) based on IBMSPSS statistics 26.0 software. If the variances are not uniform, the function transformation or non-parametric test will be performed.

2.5. Influencing Factors of Plant Diversity

2.5.1. The Selection of Influencing Factors

Referring to relevant studies and based on field survey in the Yellow River Delta, this study identified nine factors to evaluate their impacts on plant diversity [38,39]. The factors mainly included three aspects—soil properties, environmental factors, and human interference (Table 3). Soil properties mainly included soil pH (SPH), soil electrical conductivity (SEC), and soil moisture content (SMC). Other environmental factors mainly included the nearest distance from the Yellow River (DR), slope, height, longitude (Lon), and latitude (Lat).

2.5.2. Soil Sampling and Determination

Soil electrical conductivity (SEC) is an indicator of the overall salt content or accumulation in the soil, and can be used to indicate the change of soil salinity [40]. Therefore, the SEC was used to characterize the soil salt level in this study. In addition, SMC and SPH was used to characterize the soil moisture content and soil pH, respectively.
To prevent the influence of the surrounding environment on the measurement results, we chose to sample the soil away from the road, without serious vegetation damage and soil pollution. Three points were selected in each sampling site according to the location of typical survey areas. Soil sampling should ensure that no rainfall occurred within three days. After removing the surface soil and debris at the sampling point, we collected the soil at a depth of 0~20 cm, and then took the samples back to the laboratory. Part of the soil samples was put into a closed aluminum box for the determination of SMC, and the other part was naturally air-dried and passed through a 2 mm screen for the analysis of SPH and SEC. The SPH was measured by a PHSJ-5 laboratory pH meter. The SEC was determined by the electrode method. The SMC was determined by the oven drying method.

2.5.3. Human Interference Analysis

Through the field investigation of habitat, this study identified the main human interference factors and contents in the Yellow River Delta (Table 4). The human interference degree was divided into 5 levels by referring to the relevant literature [41] and combining it with the experience of the experts (Table 5).

2.5.4. Data Processing and Analysis

Redundancy analysis (RDA) is a constrained ordination method in quantitative ecology that facilitates the visualization of the relationships between factors and study subjects, as well as the magnitude of their influence [42,43]. It enables a more convenient interpretation of these interactions in a graphical format. The Mantel test is a powerful non-parametric statistical method that effectively analyzes complex multivariate relationships, providing important data support for studies on plant diversity [44]. Stepwise regression is a statistical analysis method that is used to construct a regression model by selecting variables with significant influence on dependent variables from multiple independent variables [45]. Thus, they are widely applied to explore the extent of the factors’ impacts on research subjects.
We used IBMSPSS statistics 26.0 software to perform stepwise regression analysis. The redundancy analysis was carried out using the “vegan” package in R 4.1.2 software, and the contribution of each factor to plant diversity was determined by variance partitioning and hierarchical segmentation. Then, the environmental factors with the largest and smallest explanatory rate were selected to more accurately describe the interaction among quadrat, plant diversity, and influencing factors. The arrow length of each influencing factor represents the degree of correlation between a factor and plant diversity. The included angle of the two arrows could be regarded as the correlation between environmental factors and species diversity—if the included angle is < 90°, there is a positive correlation between them; if = 90°, there is no correlation between them; if > 90°, there is a negative correlation. However, it is necessary to conduct a detrended correspondence analysis (DCA) to determine whether RDA model can be used. The size of the first axis in the DCA sorting results determines the choice of subsequent analysis methods: if > 4.0, we should select the canonical correlation analysis (CCA); if < 3.0, we should select the redundancy analysis (RDA); if between 3.0 and 4.0, both options are available. In addition, the explanatory variables are screened using the variance inflation factor (VIF) method to ensure that the variables do not have multicollinearity problems. The Mantel test analysis of environmental factors and plant diversity need was conducted using the “linkET” package in R 4.1.2 software.

3. Results

3.1. Characteristics of Plant Composition in the Yellow River Delta

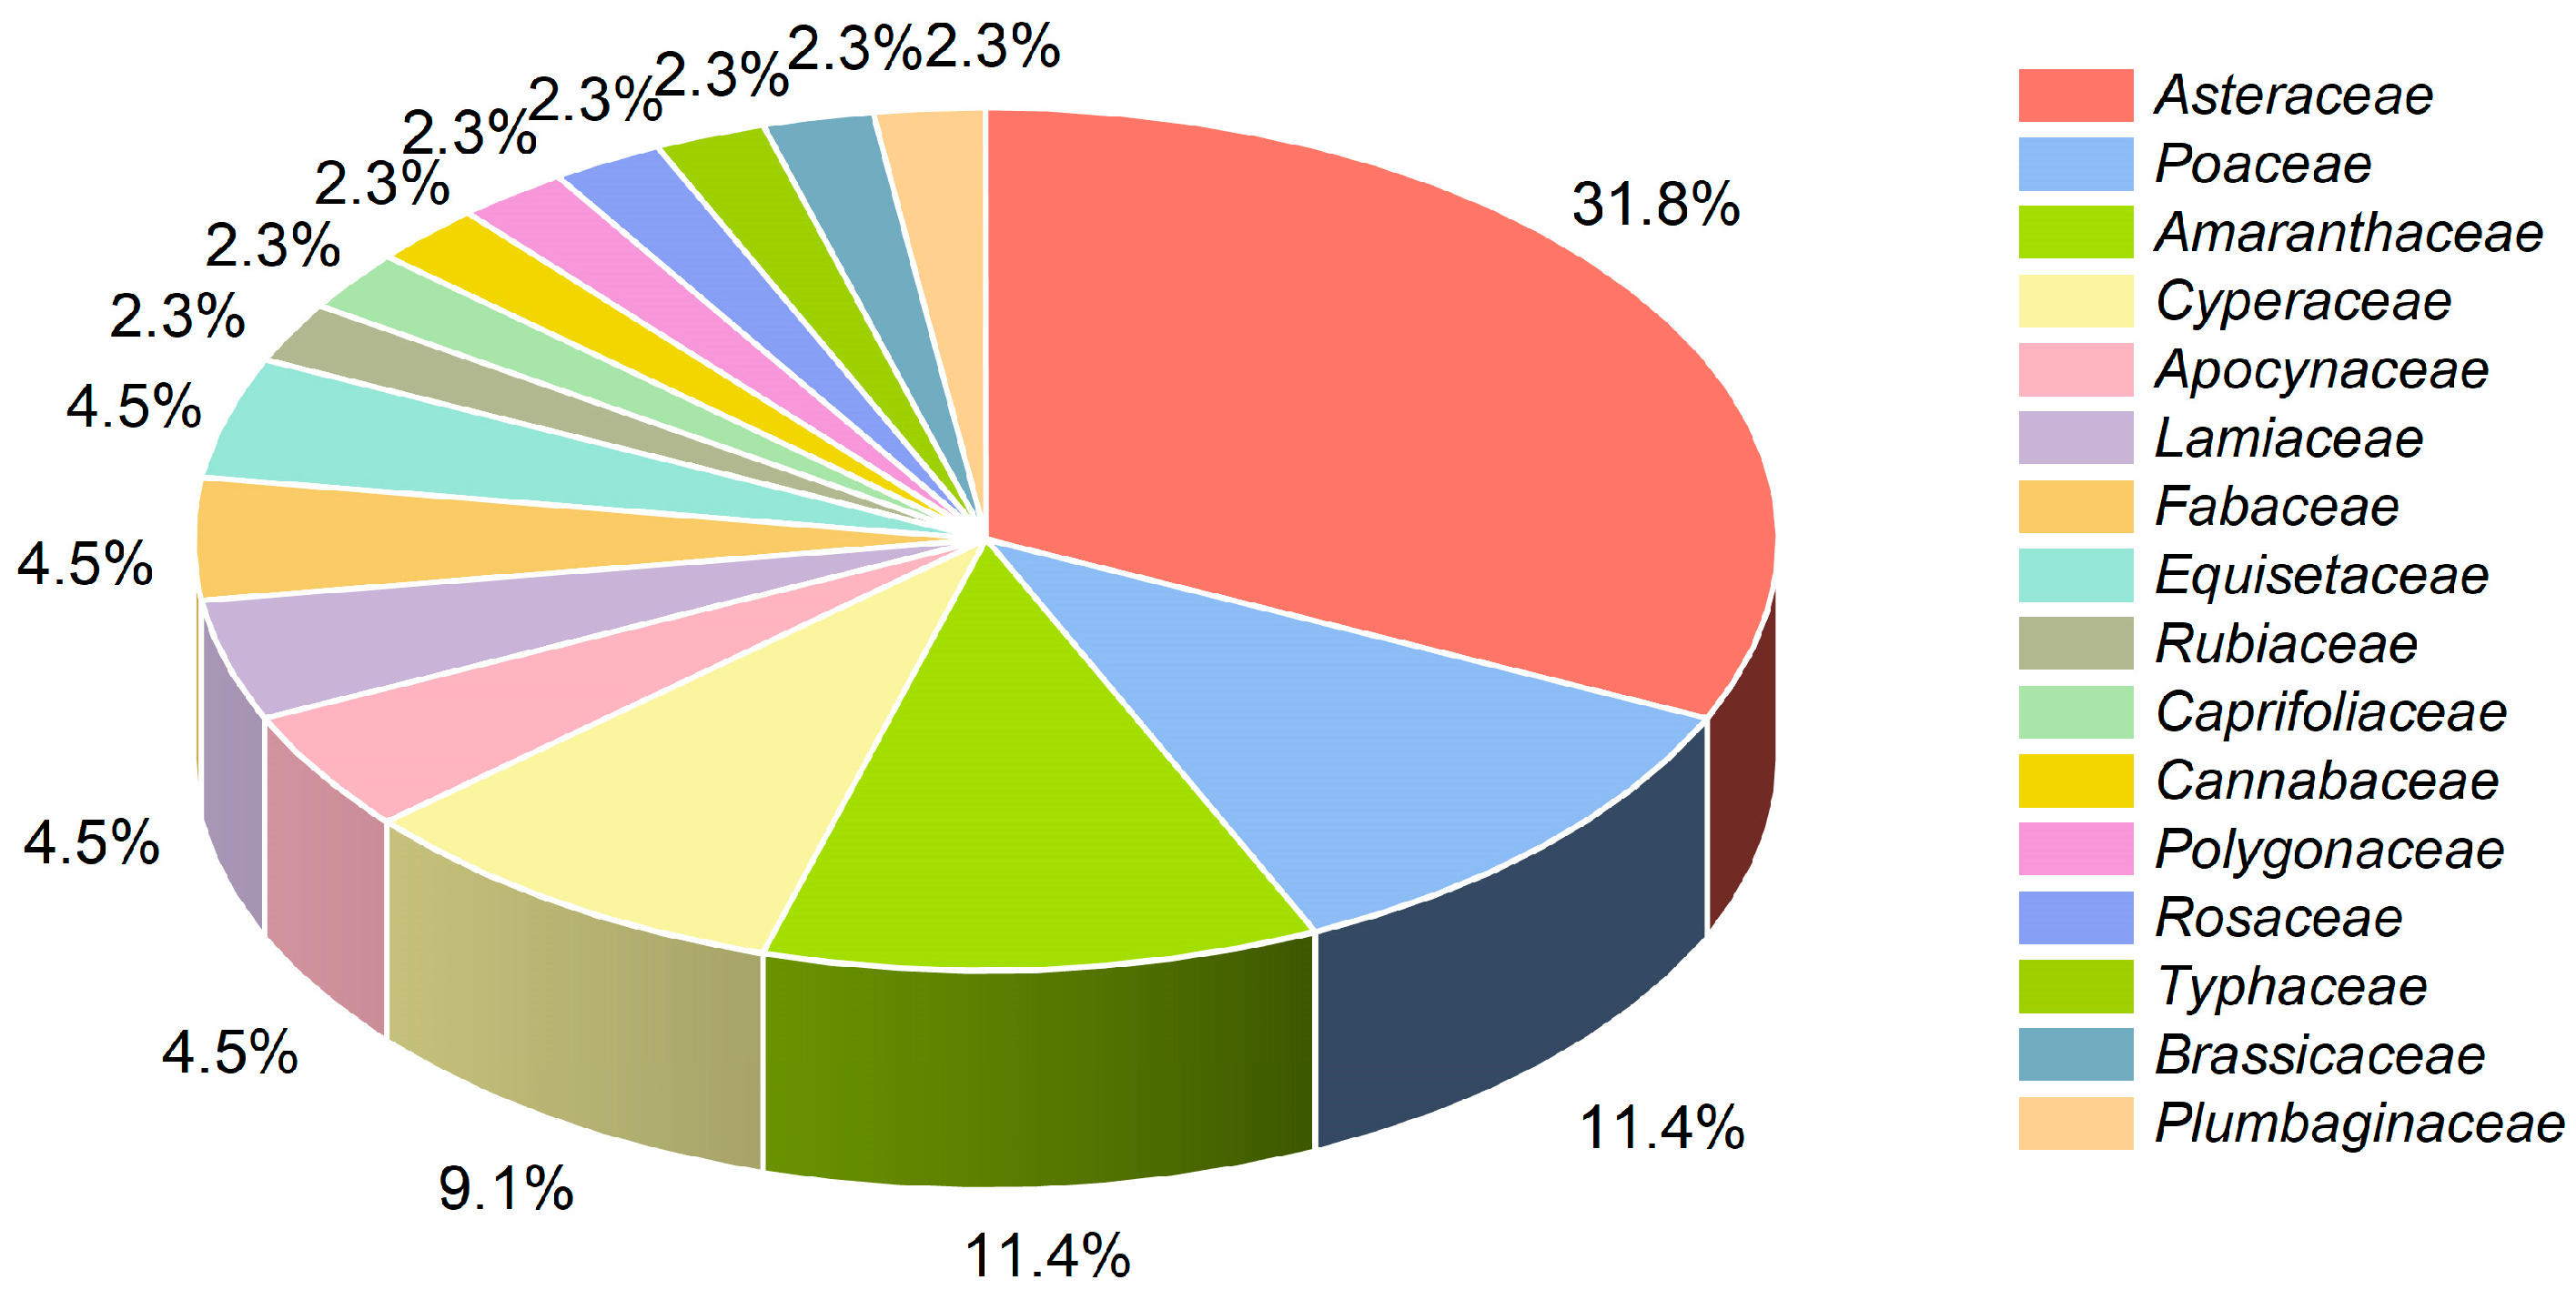
According to the statistical analysis of this survey, a total of 44 species in 36 genera belonging to 16 families of plants were recorded (Table 6). Among them, Asteraceae has the largest number of species (14 species), followed by Poaceae (5 species) and Amaranthaceae (5 species). These families account for 54.6% of the plant species (Figure 3). Moreover, the single family and single genus has a certain proportion. The vegetation ecotypes are mainly hygrophytes and halophytes. The hygrophytes include Phragmites australis, Miscanthus sacchariflorus, and Cyperus rotundus. The halophytes include Suaeda salsa and Salicornia europaea. The number of plants in different sampling sites are different—the M12 plot had the most species (13 species), and the Y3 plot had the fewest species (only Suaeda salsa). In the vegetation survey of the Yellow River Delta National Nature Reserve, 30 species were recorded in 26 genera and 13 families, indicating the relative richness of plant species in the reserve. In this investigation, Glycine soja, a national second-level protected plant, showed a wide distribution in the reserve, involving the M8, M9, M11, and M12 plots. With more than 500 species, it is an excellent germplasm bank of the ecosystem. In terms of species level, the M10–M12 plots had the most plant species. Being closer to the sea, halophytes gradually occupied a dominant position in the DS1 zone, and the Suaeda salsa became the dominant species.
Table 7 shows the differences in plant composition for different distances from the sea. Phragmites australis can be distributed across different habitats and has the best suitability in the whole Yellow River Delta basin. In terms of the characteristics of species change, as the distance from the sea increased, so did the number of plant species. The DS1 zone is closest to the coastline, which was directly affected by the seawater and salt. This zone is mainly dominated by the highly salt-tolerant vegetation, especially Suaeda salsa. With the increasing distance from the sea, the Suaeda salsa gradually decreased or disappeared in the DS4 zone, and the perennial herbaceous species began to dominate. The plant types gradually evolved into communities composed of species such as Phragmites australis, Miscanthus sacchariflorus, and Calamagrostis pseudophragmites. This suggested that soil salinity and moisture conditions changed with further distance from the sea, causing some plants to be unable to adapt and gradually disappear. In summary, with the change of the land–sea gradient, the species and distribution of plants also changed significantly, which may be due to the differences of the soil salinity, moisture, and climatic conditions.
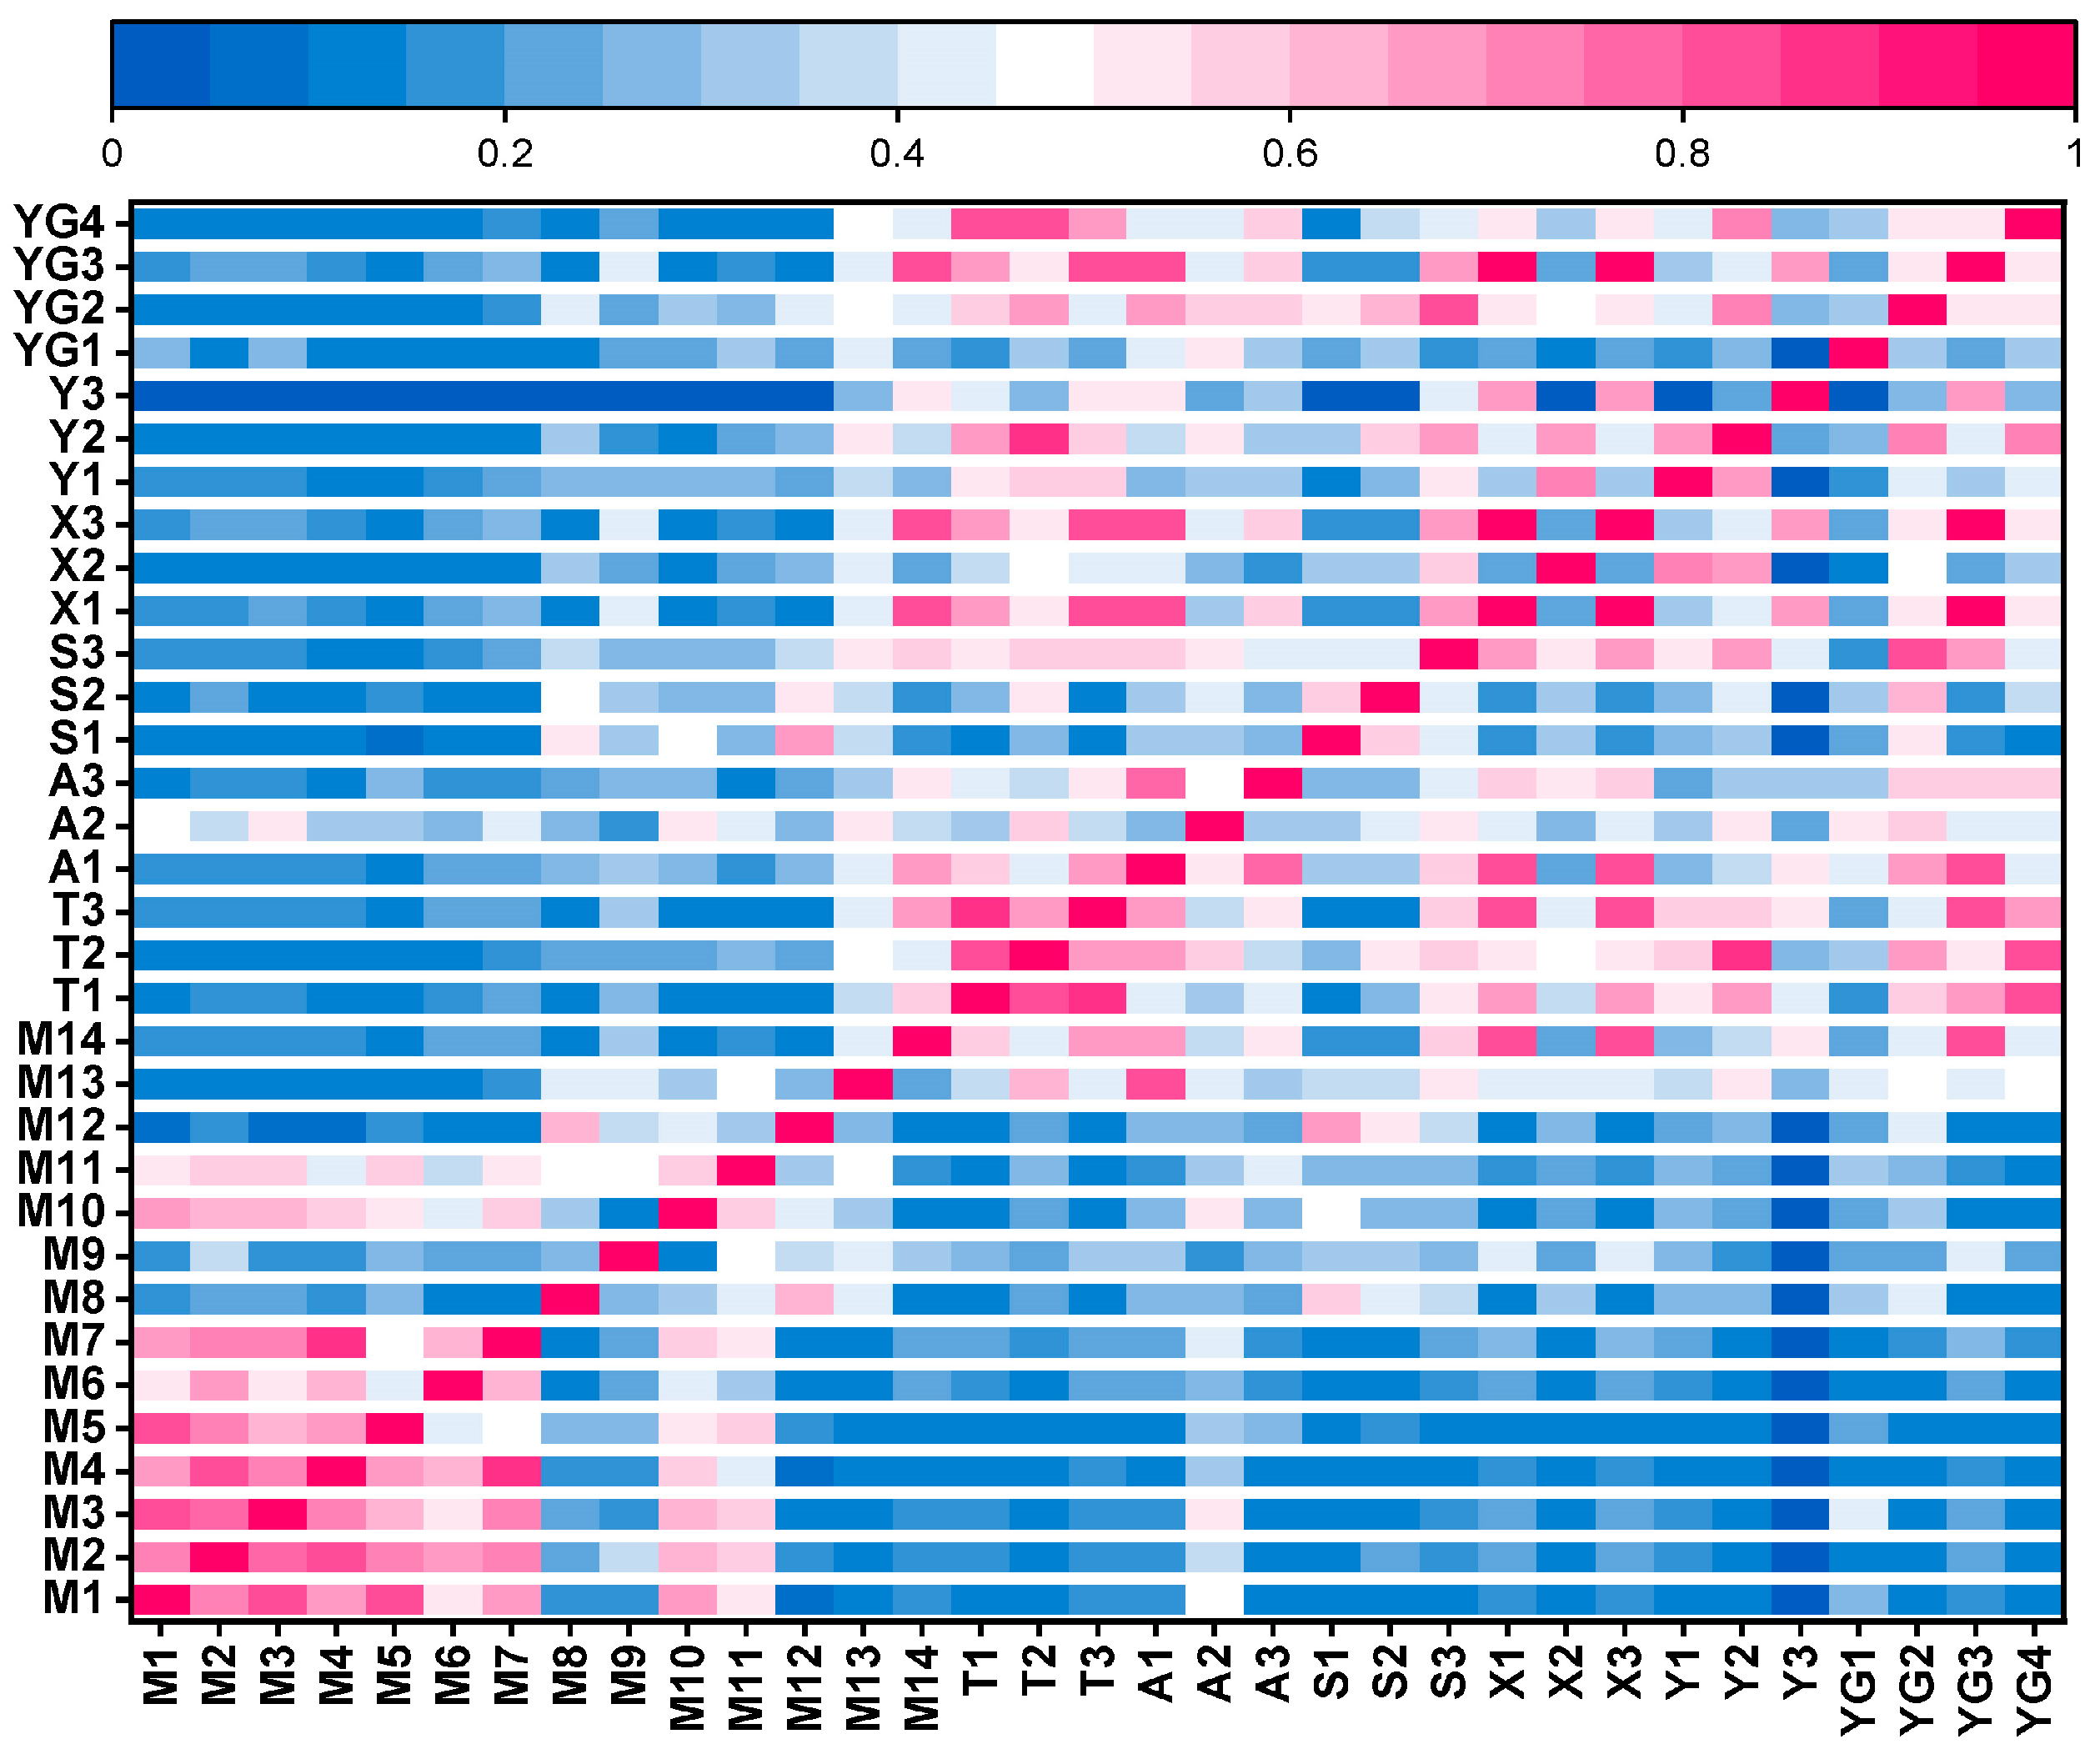
In general, the species composition of the Yellow River Delta varied greatly under the land–sea gradient (Figure 4). From the perspective of the plot level, the Jaccard index between the Y3 plot and the M1–M12, S1, S2, and Y1 plots was 0, indicating that there was no common species between the Y3 plot and the above plots. The Jaccard index reached a peak value of 1 among the YG3, X1, and X3 plots, indicating that the three plots were completely similar at the species level. The high Jaccard value for the M1–M7 plots demonstrated that the biomes of these plots were relatively stable, which reflected that these plots have certain common characteristics in geography, climate, ecological niche, and human disturbance. The above conclusions reflected that the species similarity coefficient of adjacent environments in the Yellow River Delta was higher than that of non-adjacent environments to some extent. From the perspective of land–sea difference, the Jaccard index was high between the M14 plot (closest to the sea) and the plots of T3 (0.67), A3 (0.5), S3 (0.57), X3 (0.8), Y3 (0.52), and YG3 (0.8), indicating that the species similarity was higher in the zones closer to the sea to a certain extent. This was mainly due to the preponderant position of saline-tolerant plants near the sea, which made the plant species relatively simple.

3.2. Spatial Distribution Pattern of Plant Diversity in the Yellow River Delta

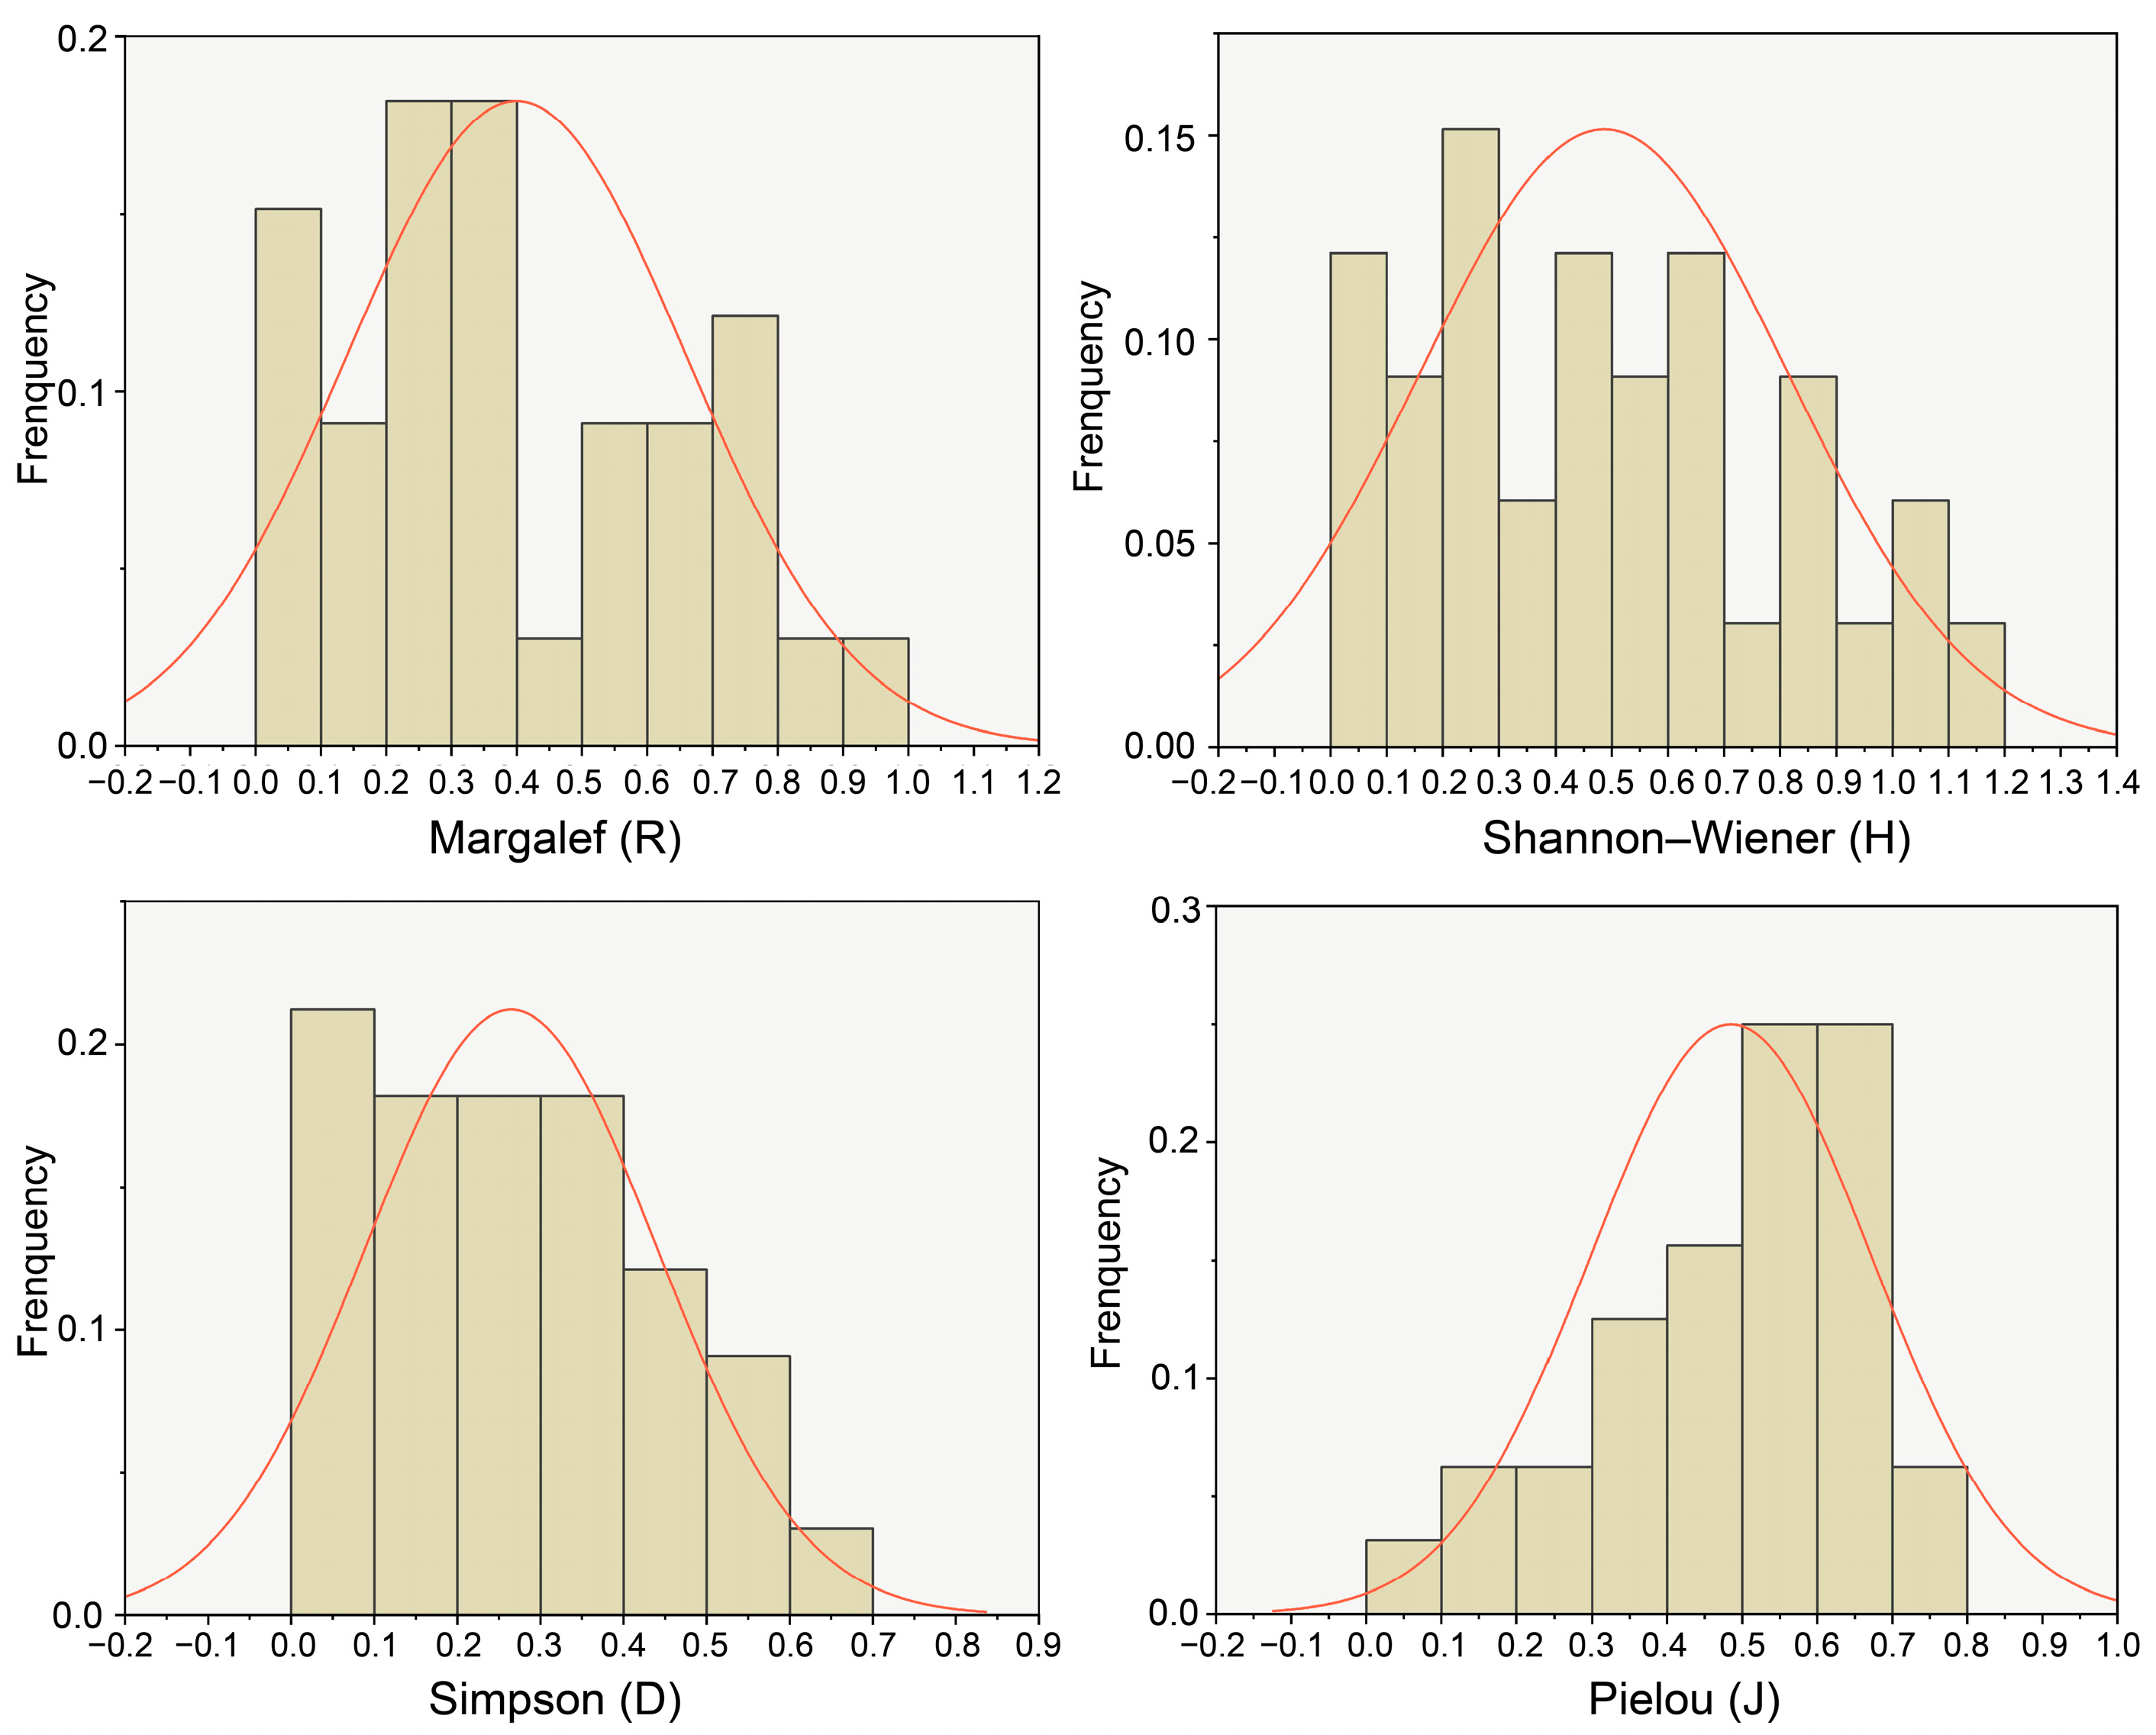
As shown in Figure 5, the value of the plant diversity index is relatively low. The Margalef index (R) value ranges from 0 to 0.939, with an average value of 0.4, indicating relatively low species richness in the study area. The value of the Shannon–Wiener diversity index (H) ranges from 0 to 1.144, with an average value of 0.486, reflecting relatively low diversity. The value of the Simpson index (D) ranges from 0 to 0.644, with an average value of 0.265, suggesting that many plots have limited species dominance and low diversity level. The value of the Pielou index (J) ranges from 0.038 to 0.784, with an average value of 0.485, showing the species distribution evenness among plots was relatively low.
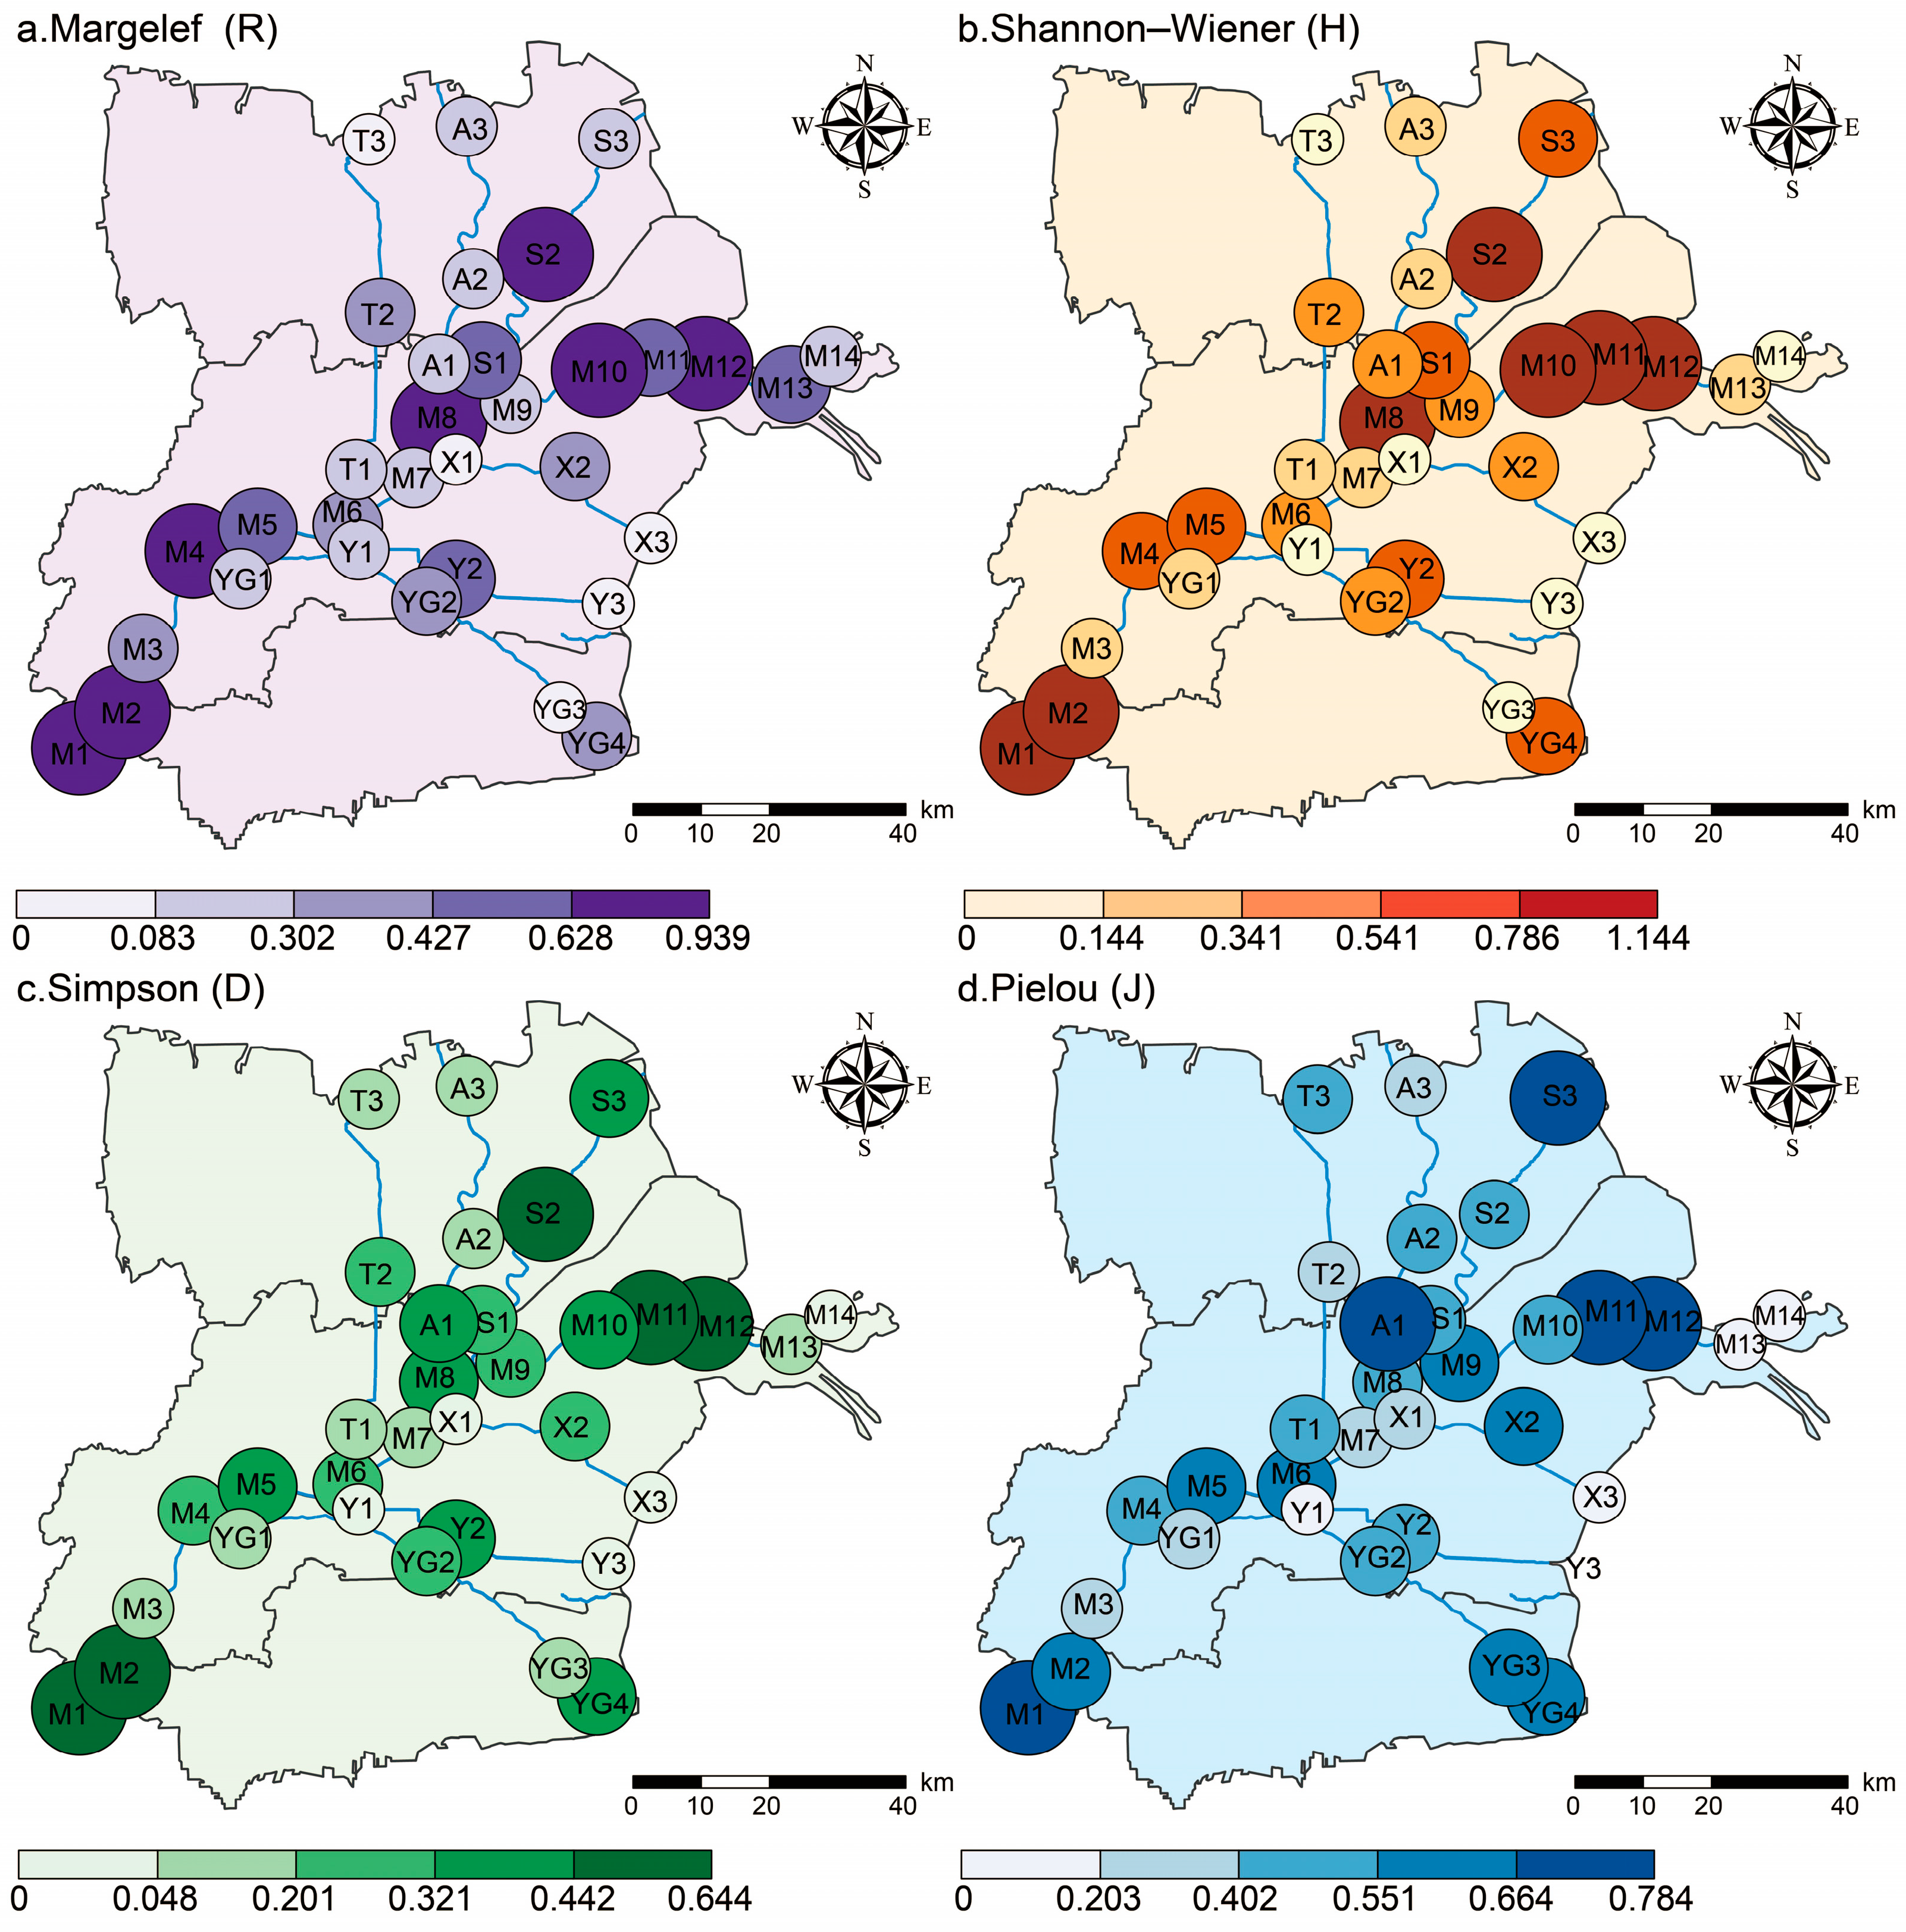
From the spatial characteristics (Figure 6), the longitudinal change trends of the R, H, D, and J indexes were basically the same. In general, they showed a fluctuating downward trend from land to sea, and the plant diversity was poor in the areas closer to the sea. In the national nature reserve, the plant diversity also showed a decreasing trend from land to sea. From the level of the plot, the sampling sites with the highest plant diversity indexes were M12, S2, M8, M1, and M2, while the sampling sites with the lowest plant diversity indexes were X3 and Y3. In addition, we can clearly see from Figure 6 that most of the sampling plots with the greater plant diversity are located in the riverbank of the main stream of the Yellow River. Through one-way ANOVA, there were significant differences in the R, H, and D indexes between the main stream and tributaries of the Yellow River Delta (p < 0.05), but no significant differences in the J index (p > 0.05) (Table 8). The overall species richness, dominance, and diversity were generally higher in the main stream of the Yellow River than in its tributaries.
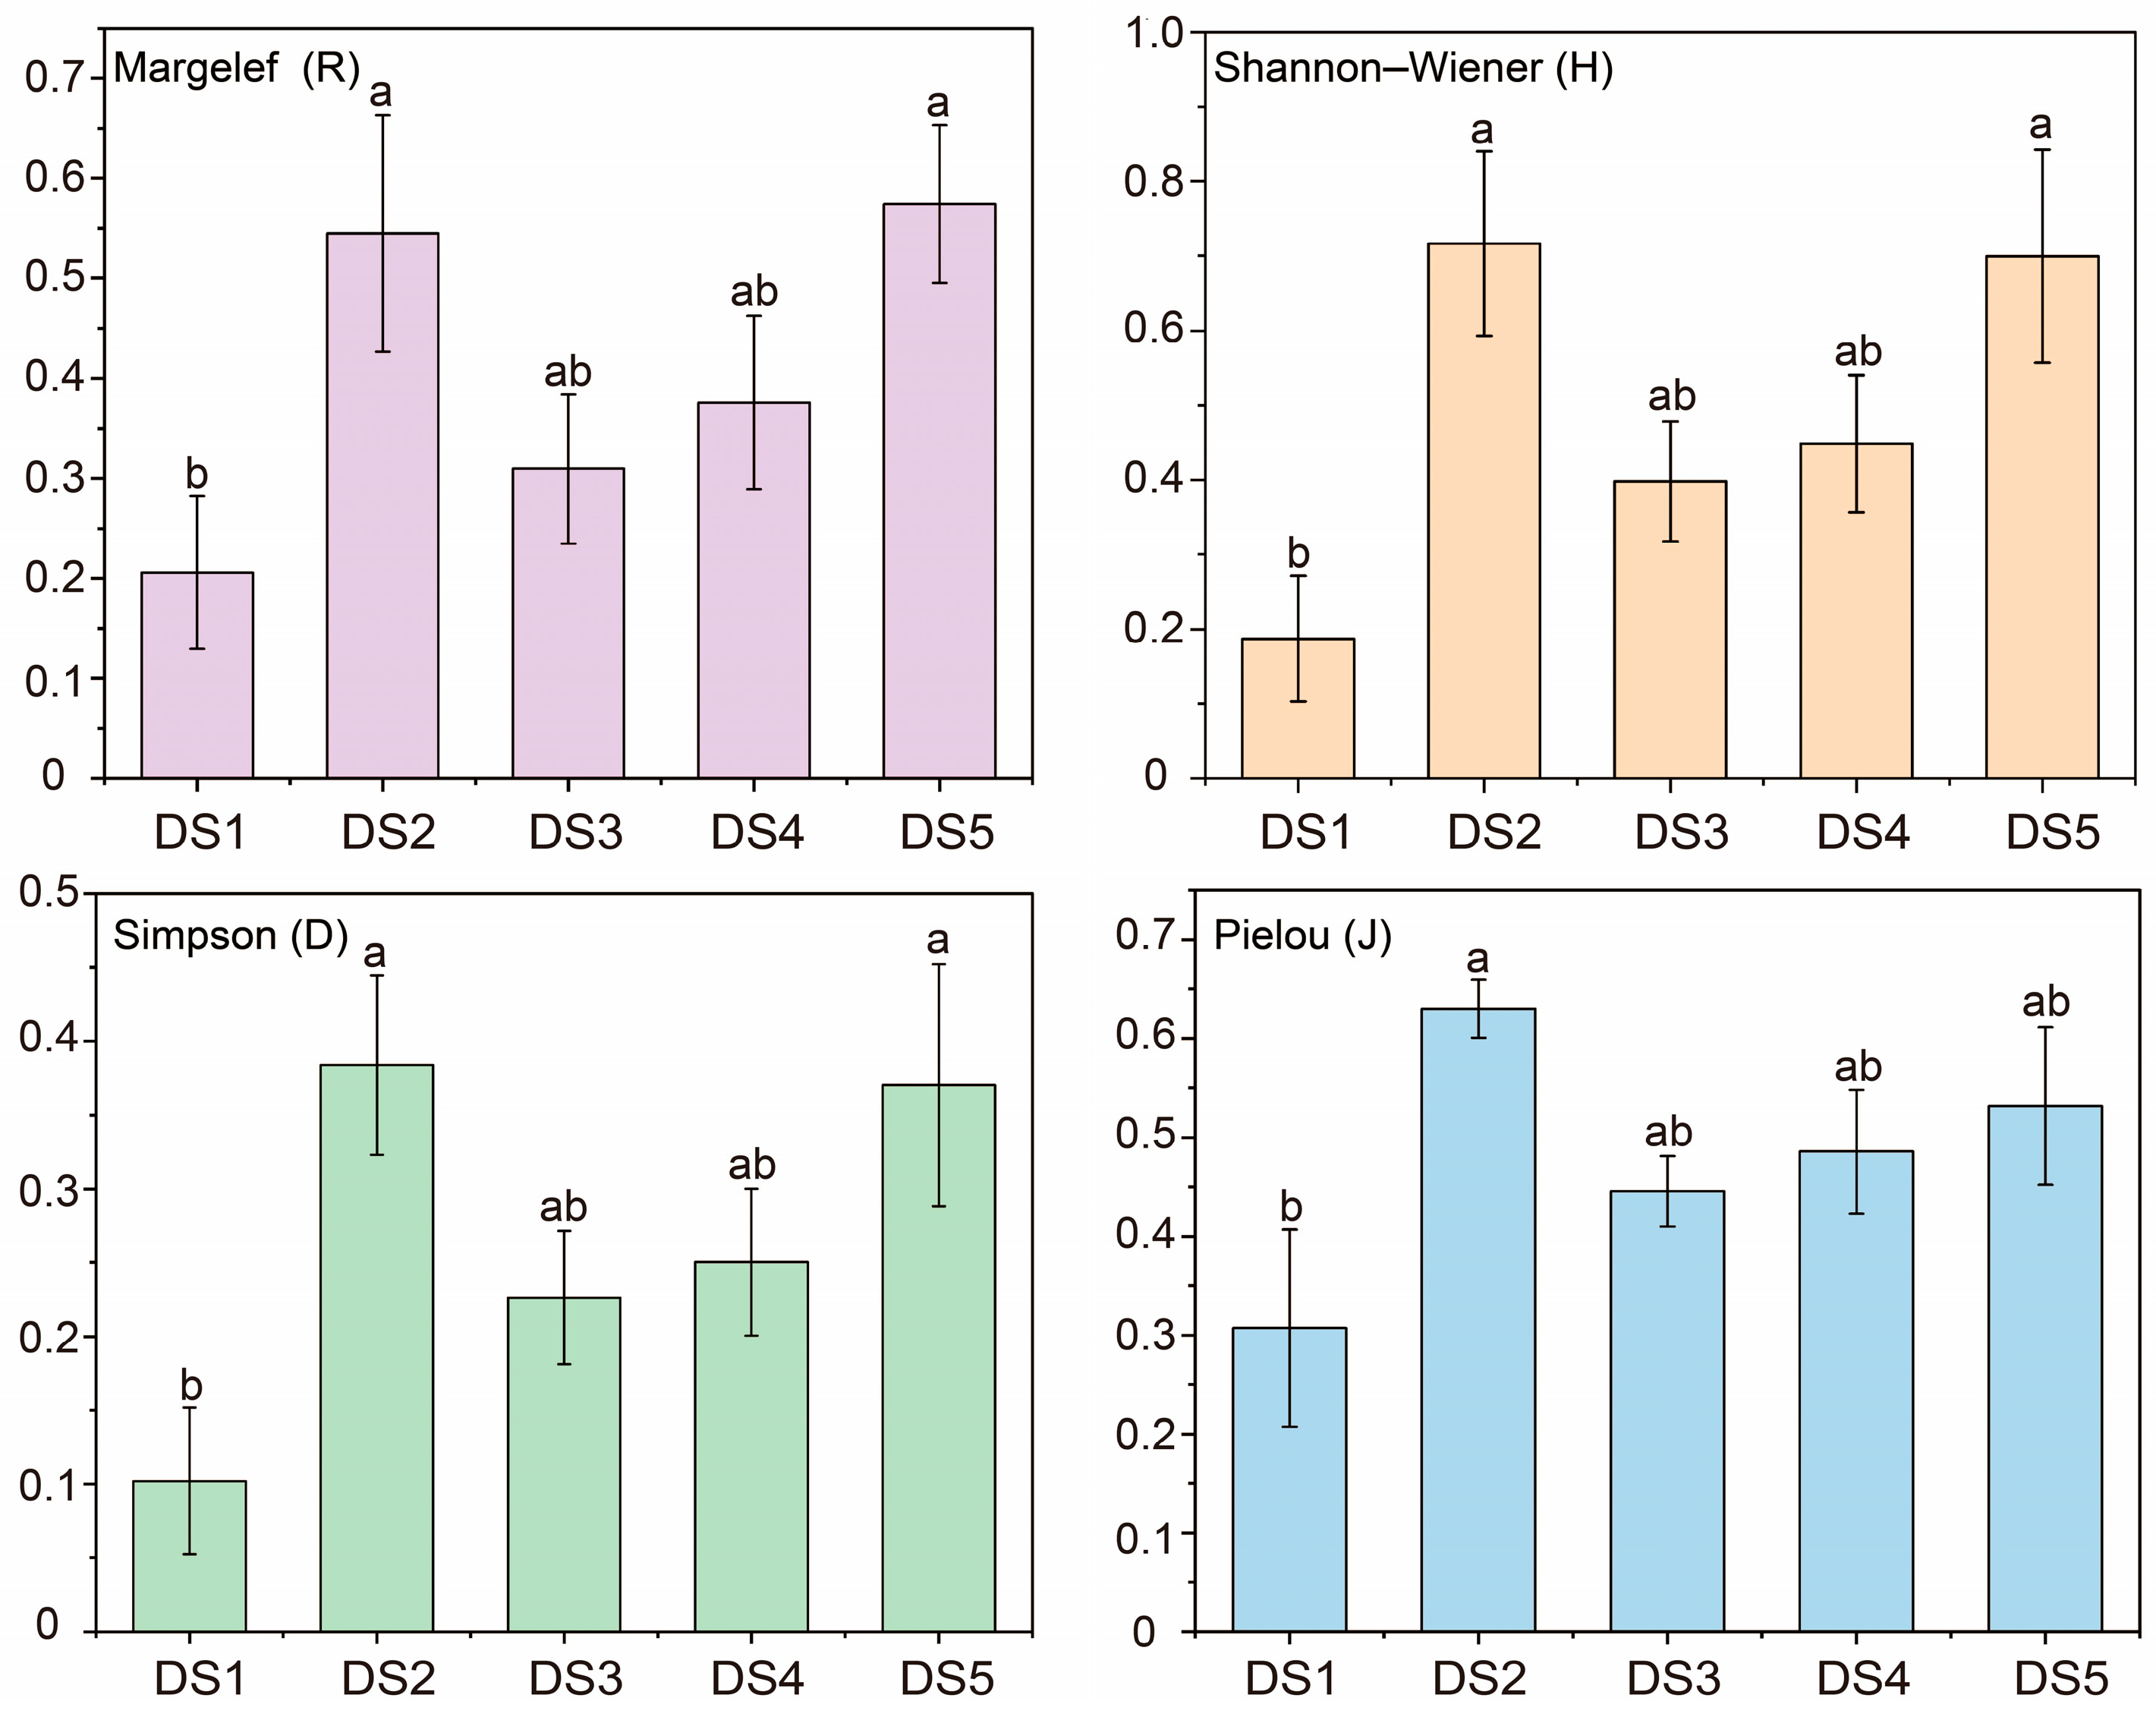
In order to further probe into the land–sea differentiation of plant diversity, the plant diversity indexes were analyzed and evaluated at different distance from the sea (Figure 7). There were significant differences in the four indexes of R, H, D, and J among the different land–sea zones (p < 0.05). In Figure 7, the level of plant diversity was lower in the zones closer to the sea, and higher in the zones further from the sea. The plant diversity indexes showed a peak value in the region of 3–17 km from the sea (DS2) and the region of > 42 km from the sea (DS5). The DS2 zone was affected by multiple factors, such as river siltation, tidal overflow, and salinization, forming a unique ecological environment and breeding a variety of plants adapted to different soil conditions, which made the plant diversity relatively rich. In addition, a part of the sampling sites in this zone was located in the national nature reserve, which was affected by policy protection and less human interference. Therefore, the plant diversity has been protected and restored to a certain extent. As the distance from the sea increased, the soil properties also changed. Due to its suitable climate, terrain, hydrology, and soil conditions, the DS5 zone was suitable for the growth of some plants, and provided suitable living conditions for a variety of plants. It made the plant diversity in this region relatively richer. In conclusion, the plant diversity in the Yellow River Delta represented a fluctuating downward trend from land to sea.

3.3. Analysis on Influencing Factors of Plant Diversity in the Yellow River Delta

3.3.1. Analysis of Soil Properties

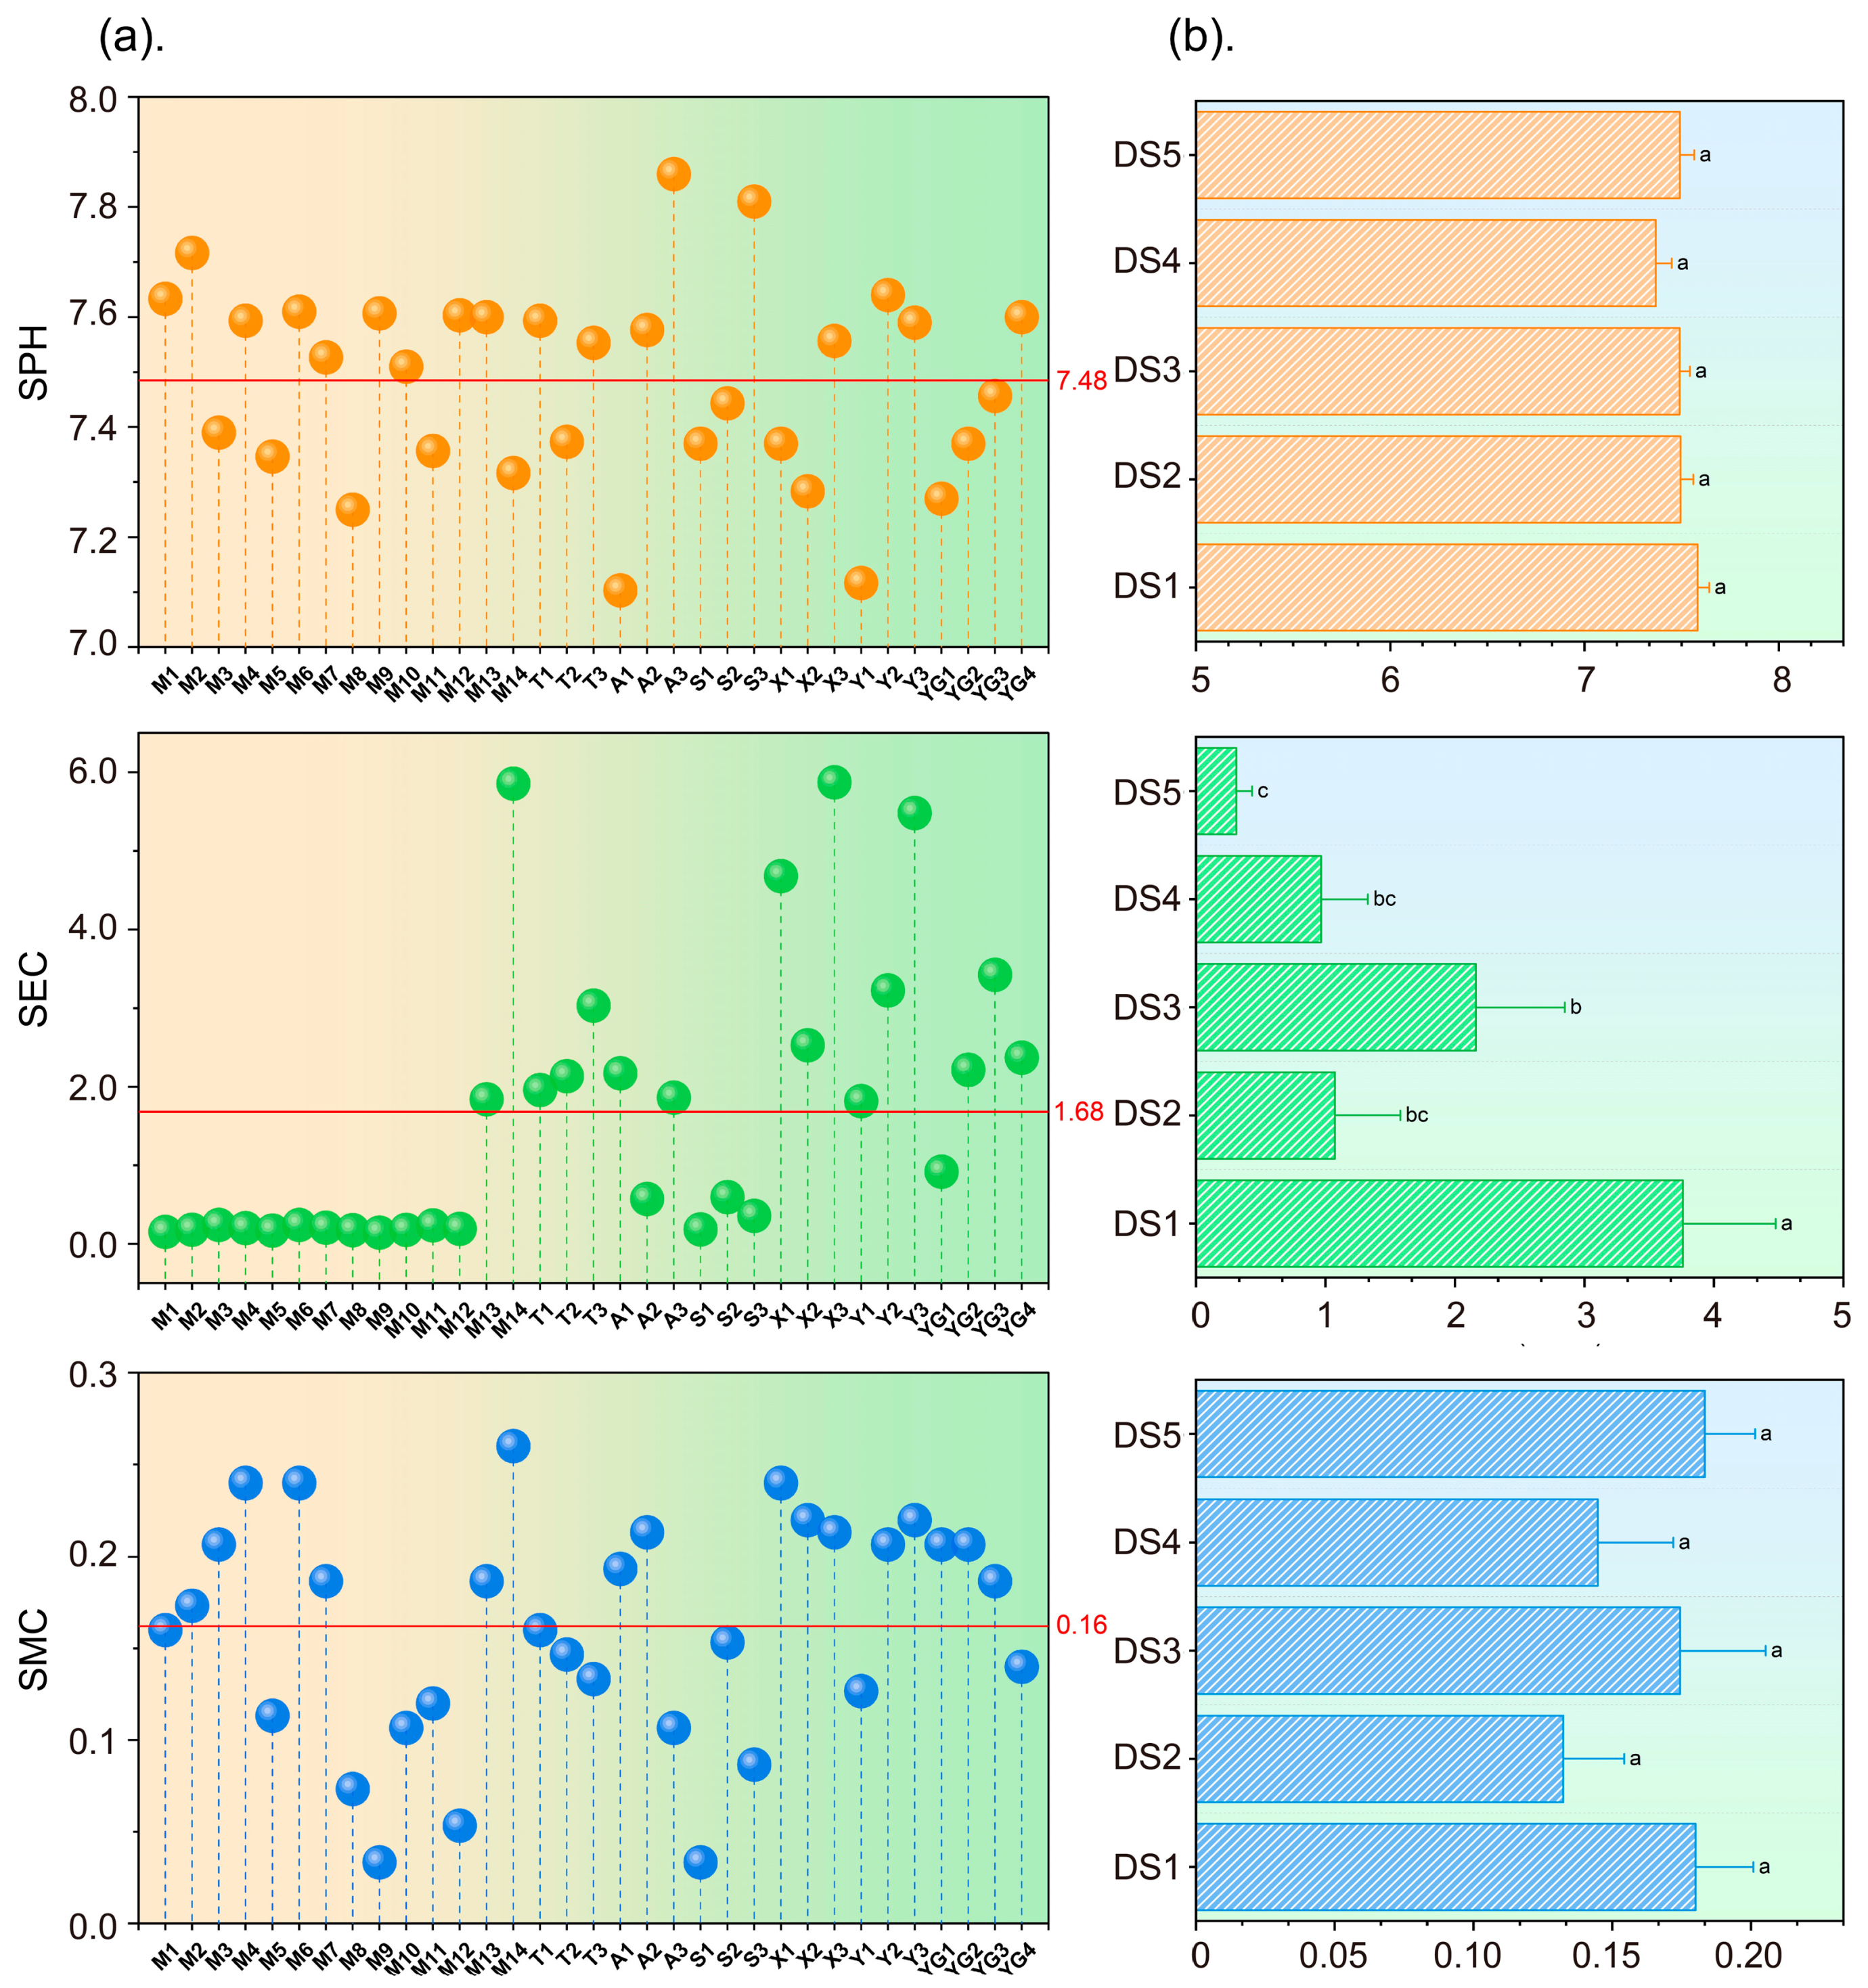
Soil pH (SPH), soil electrical conductivity (SEC), and soil moisture content (SMC) were measured in the laboratory; the results are shown in Figure 8. The SPH value of the Yellow River Delta was more than 7.4, averaging 7.48. According to the Chinese soil pH classification standard, the study area belonged to the alkaline soil type (PH > 7). The average value of the SEC was 1.68 mS/cm, and the SMC was roughly between 10% and 30%, averaging 16%. Figure 8b represents the soil properties at different distances from the sea. There were significant differences in the SEC between different zones (p < 0.01), but no significant differences in the SPH and SMC (p > 0.05). In terms of spatial distribution, the SEC in the DS1 zone was significantly higher, reflecting the frequent land–sea interaction, which was basically consistent with the relevant research conclusion [33]. Because the sampling sites selected in this study were close to the river, the SMC did not show the obvious difference between different land–sea zones. The climate conditions in the Yellow River Delta were relatively consistent, and the soil parent material and topography also had certain similarities. These factors made the soil alkaline, and the SPH showed the relatively consistent characteristics in the region.

3.3.2. Relationship Between Plant Diversity and Influencing Factors

Prior to the influencing analysis, we performed a collinearity analysis of the influencing factors to ensure the stability of the regression model (Table 9). The VIF analysis method showed that there was no collinearity among the factors. First, in order to explore the driving factors of plant diversity in the riverbank of the main stream and tributaries of the Yellow River Delta, we conducted a stepwise regression analysis of plant diversity and influencing factors (Table 10). The human interference degree (HID) was the sole variable entering the models of R, H, and D, with R a d j 2 of 0.554, 0.580, and 0.509, respectively. SEC emerged as the only significant factor explaining variation in the J index. The results indicated that the R, H, and D indexes increased with the decrease of HID, and the J index increased with the decrease of SEC in the main stream. For the tributaries, SEC was the sole factor in all regression models of plant diversity indexes, indicating its predominant role as the key limiting factor for plant diversity in the tributaries.
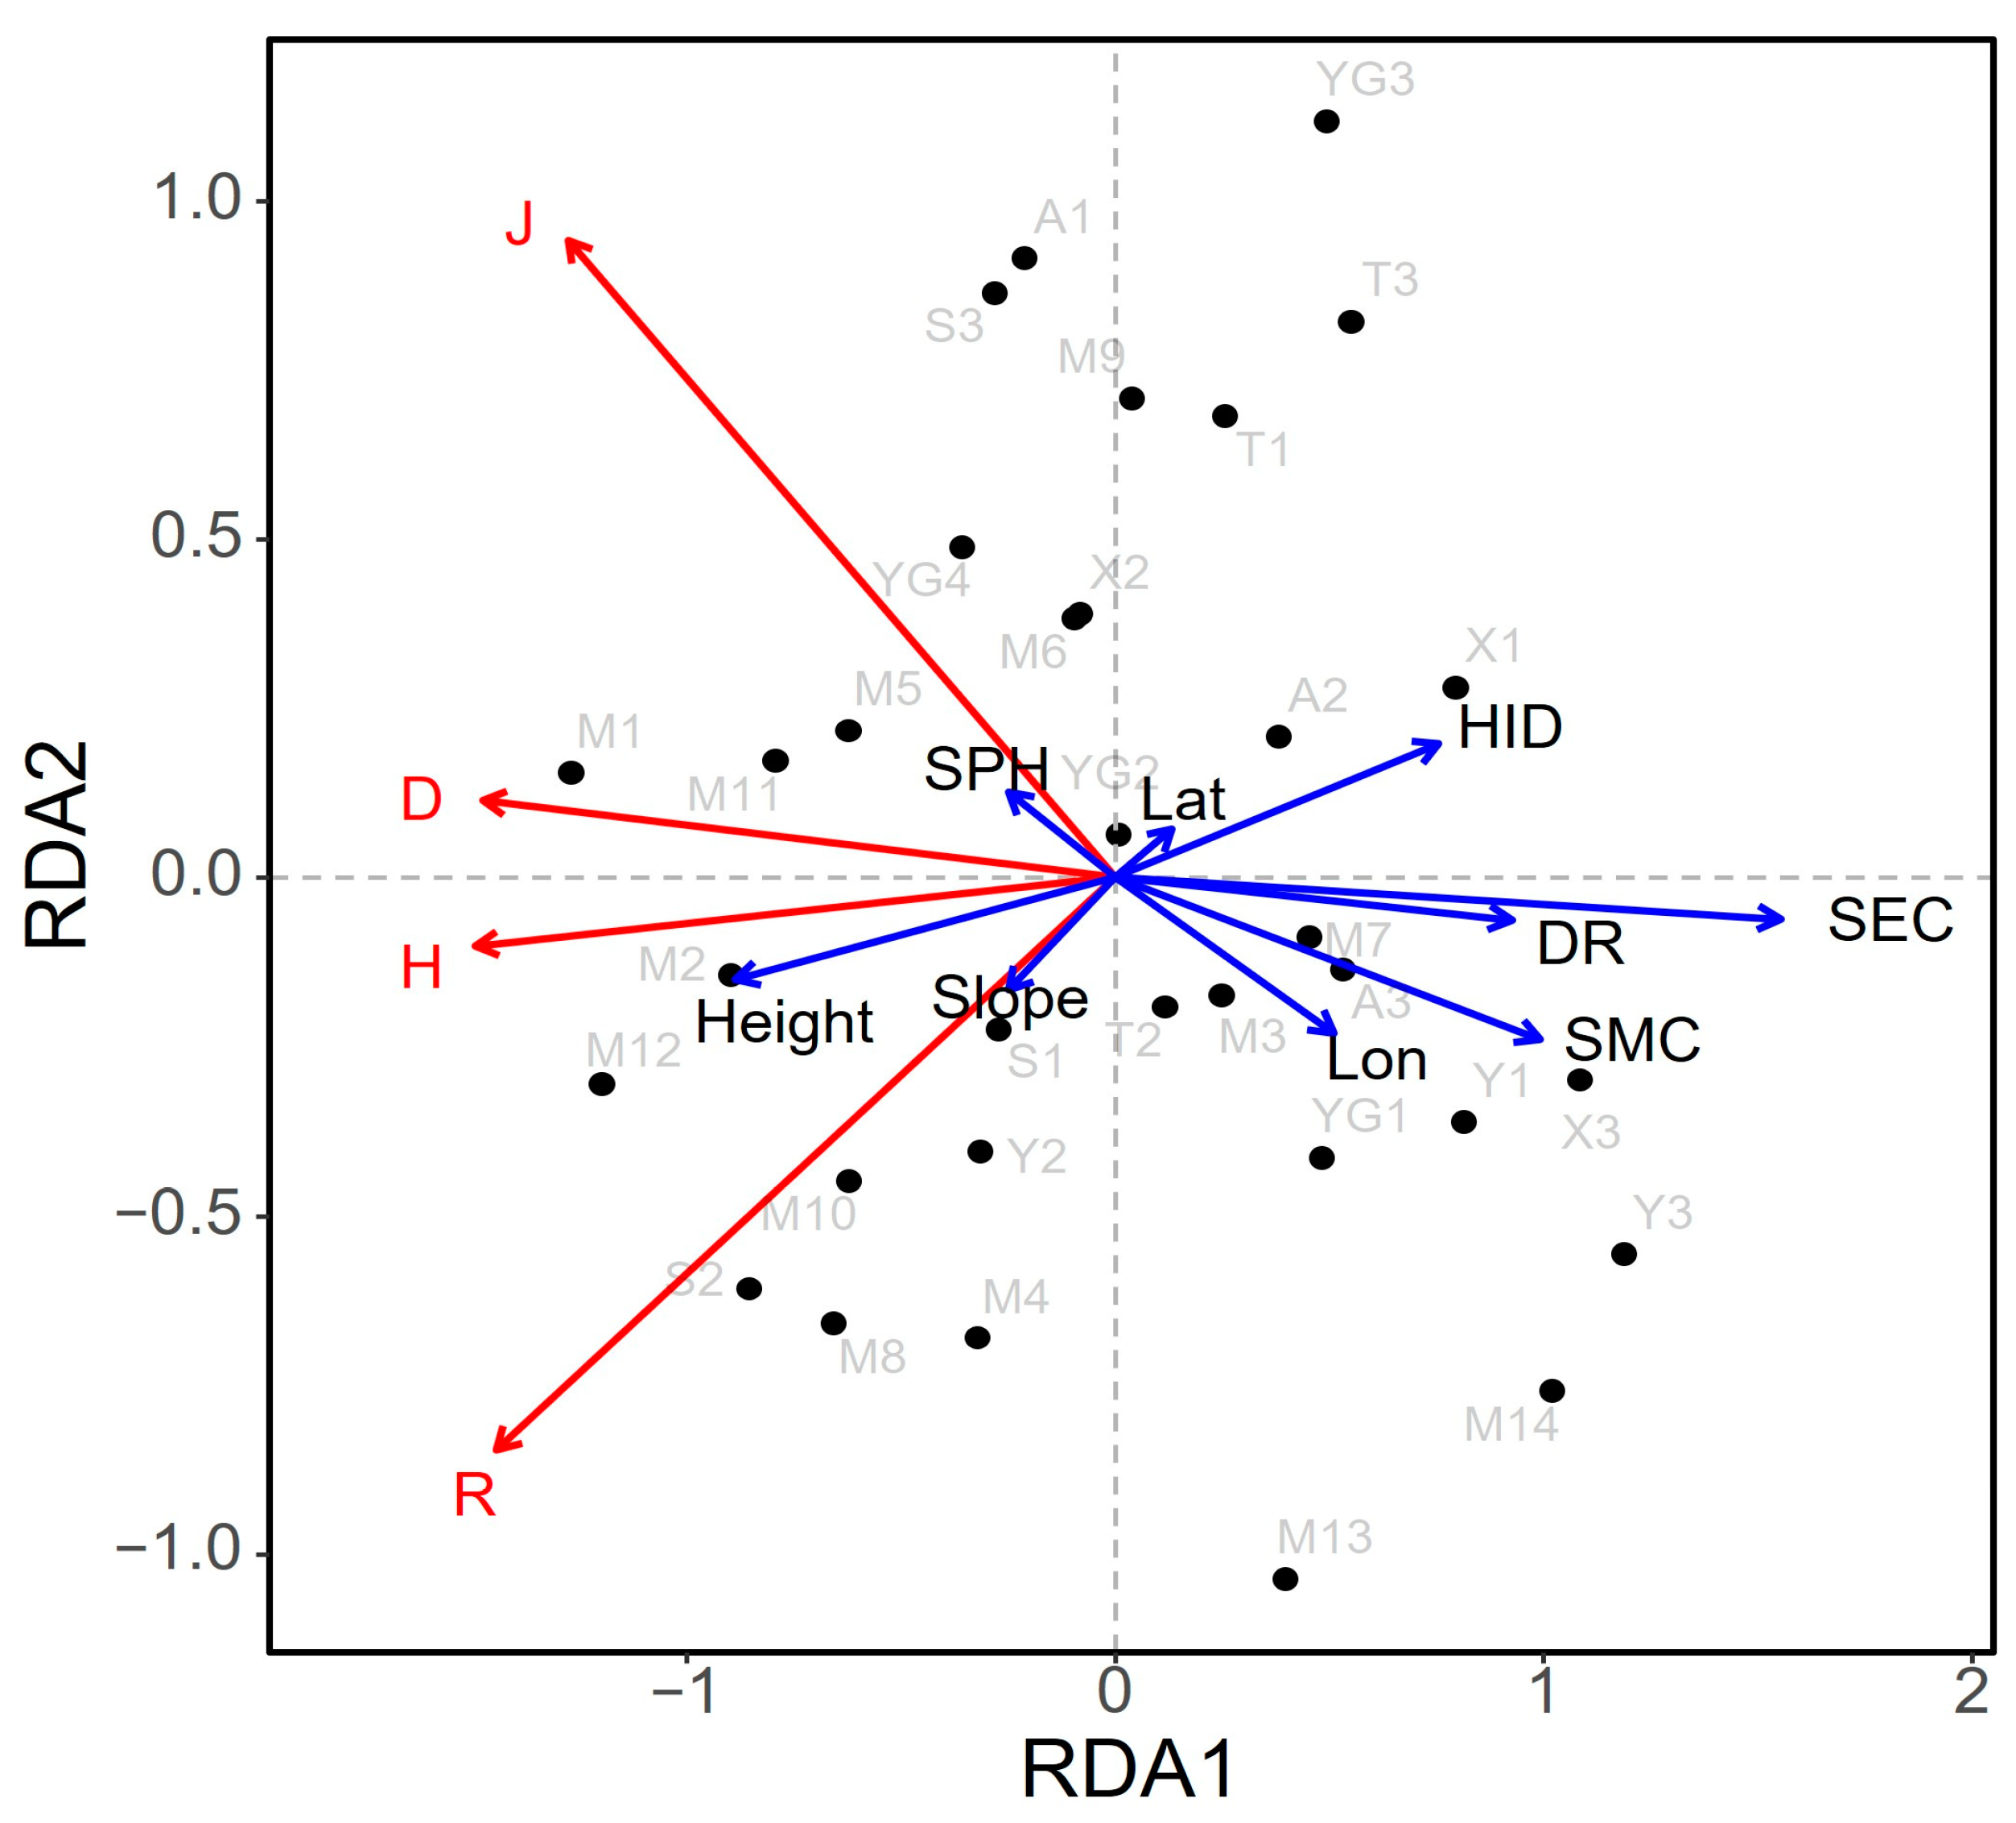
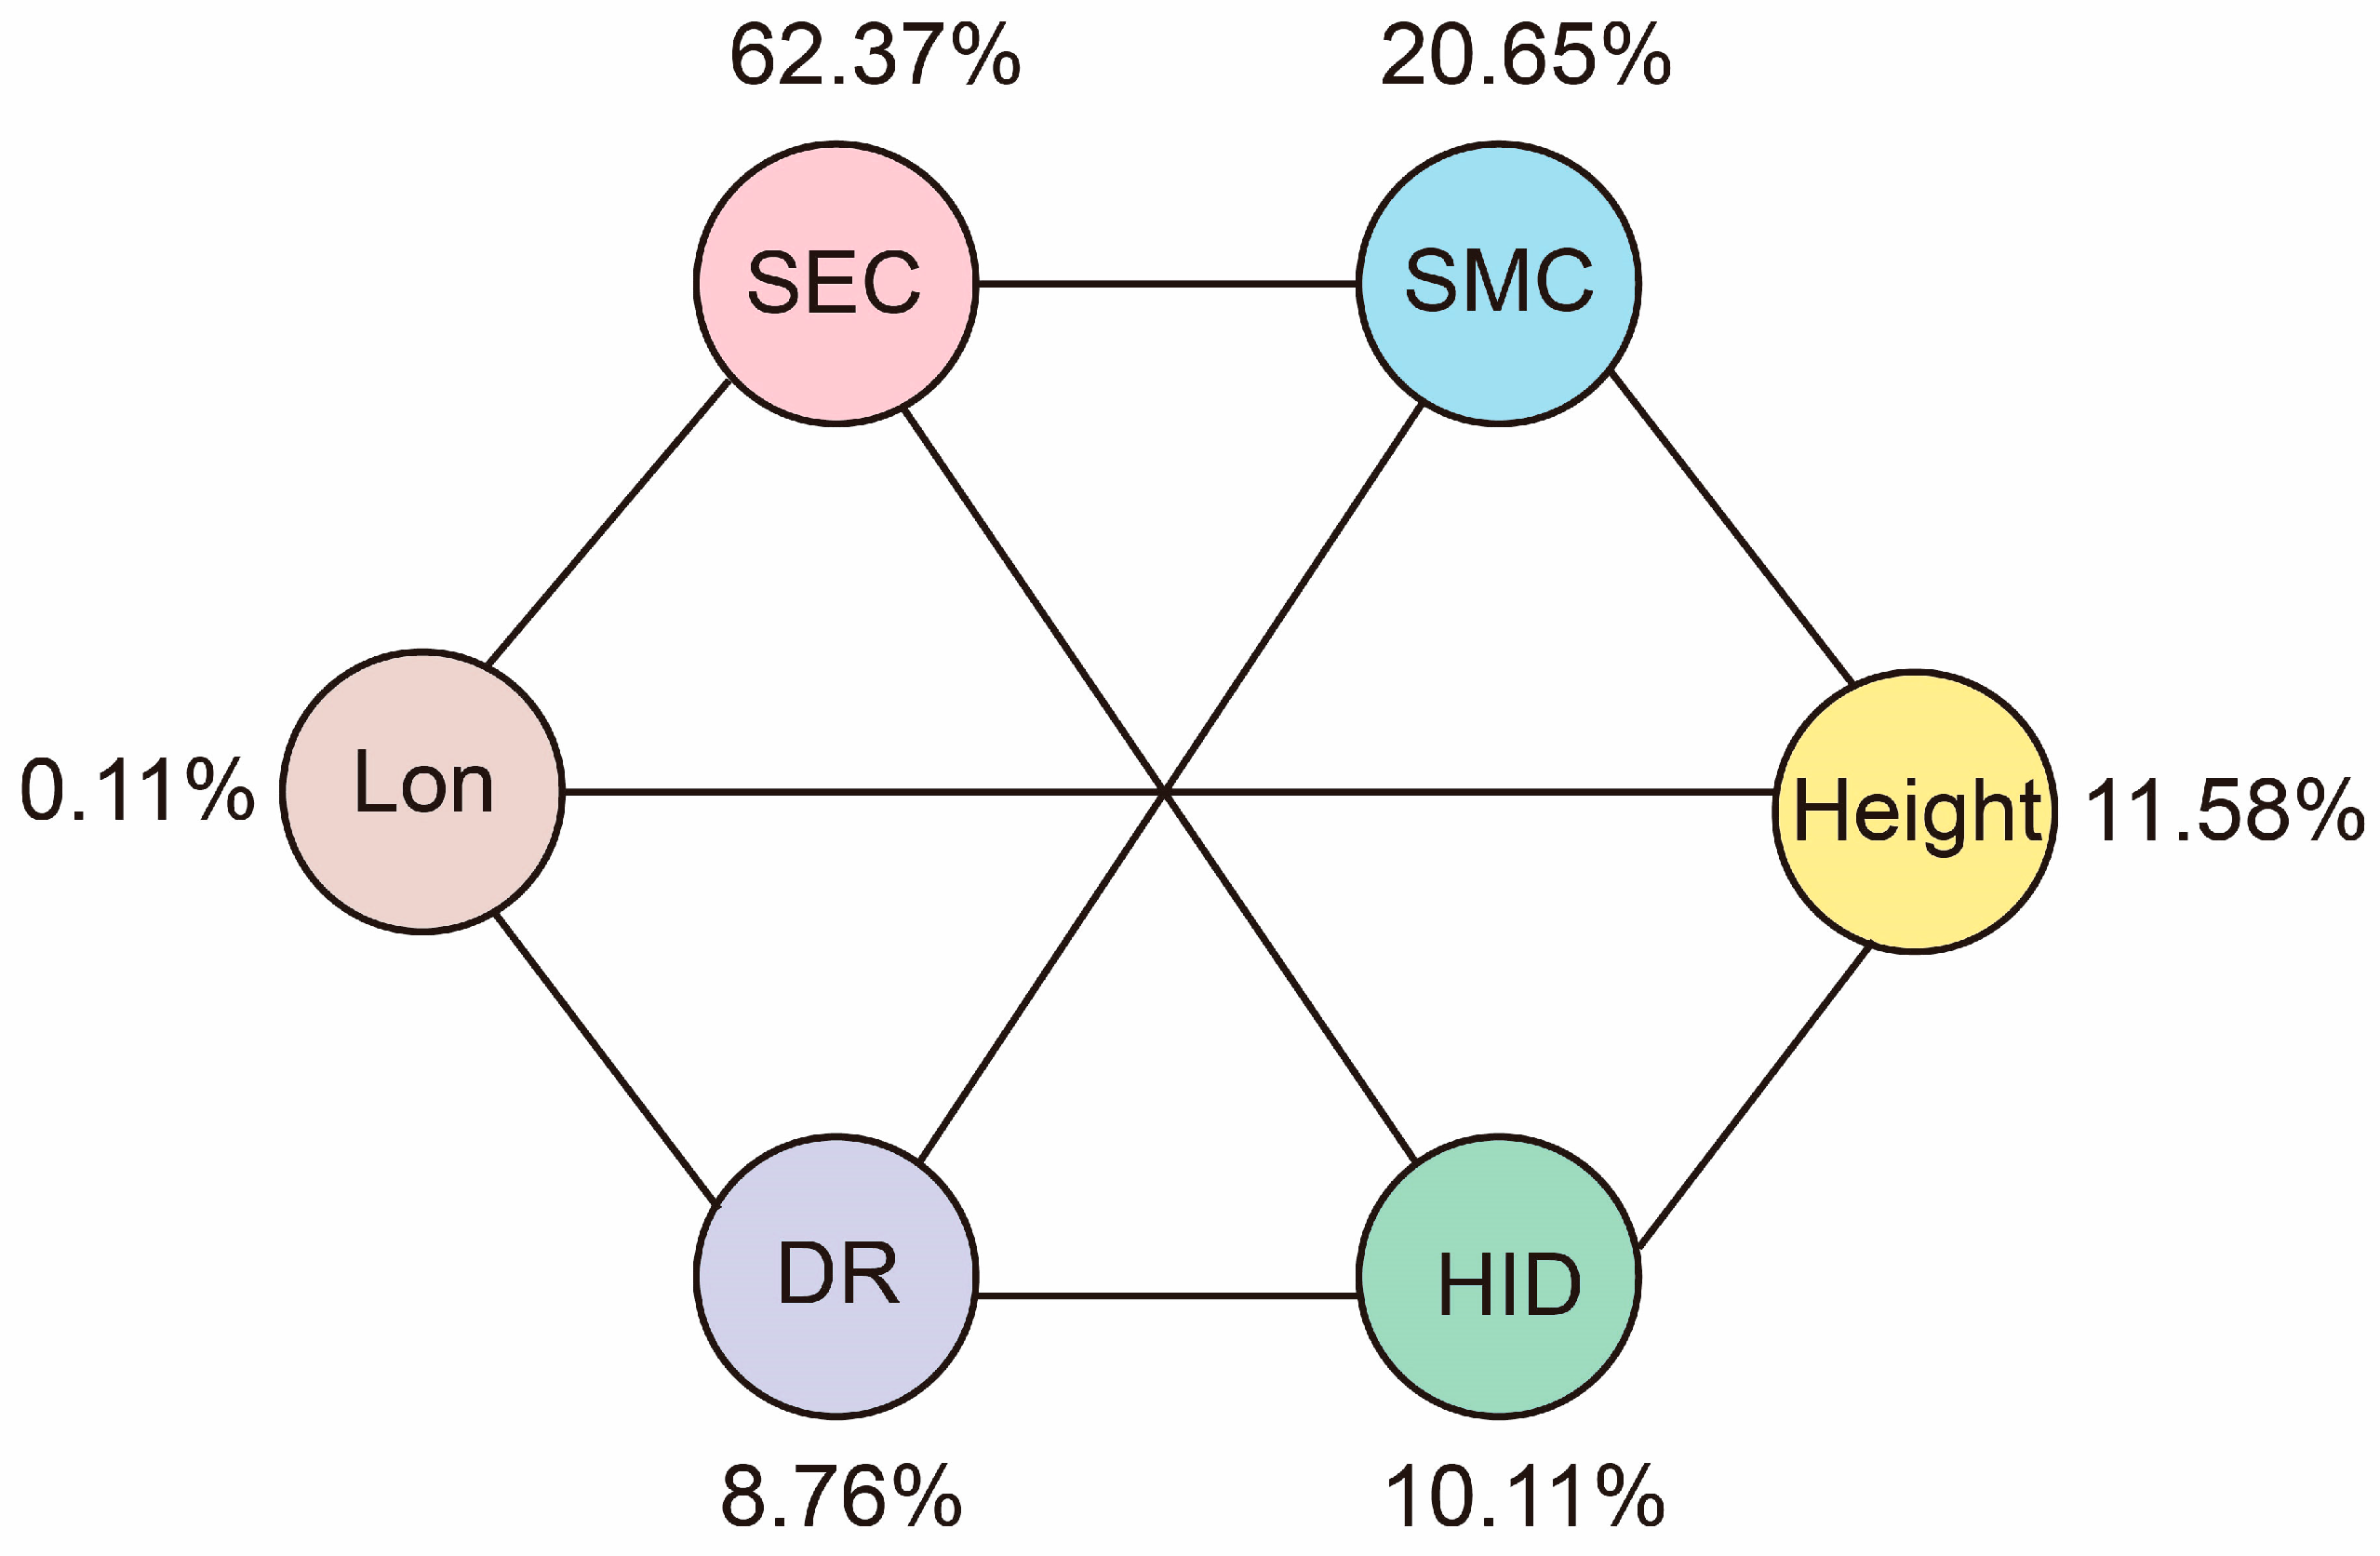
Then, in order to explore the key influencing factors of plant diversity in the Yellow River Delta region under the land–sea gradient, we conducted RDA analysis. Since the DCA results showed that the maximum gradient in the four axes did not exceed three, which was consistent with the RDA model. The RDA results (Figure 9) revealed that the overall explanatory rate of the constraint axis was 35.5%, in which the explanatory rate of the RDA 1 and RDA 2 axes reached 34% and 1.37%, respectively, and the cumulative interpretation rate accounted for 99.72% of the total variance. The projection length of R, H, D, and J were long, showing a strong positive correlation between them. The R index had a strong positive correlation with height, and a strong negative correlation with SEC, the nearest distance from the Yellow River (DR), and HID. The H and D indexes were strongly positively correlated with height, and negatively correlated with SEC, SMC, DR, longitude (Lon), and HID. The J index had a strong negative correlation with SEC, SMC, DR, and Lon. Then, the hierarchical segmentation method was used to analyze the comprehensive contribution of each factor to plant diversity (Figure 10). The results indicated that the explanatory rate of SEC was 62.37%, which had the greatest impact on plant diversity. The next was SMC, which was explained by 20.65%. Latitude (Lat), slope, and SPH had the lowest explanatory rates, which almost had no significant effect on plant diversity. Therefore, the influence of each factor on plant diversity were as follows: SEC > SMC > Height > HID > DR > Lon > Lat ≈ Slope ≈ SPH. In terms of the relationship among sampling sites, plant diversity, and environmental factors, most of the sampling sites along the main stream of the Yellow River (M1–M2, M4–M6, M8, and M10–M12) and the Shenxian Ditch (S1–S3) had a high plant diversity level and were greatly affected by height. Specifically, the plant diversity was positively correlated with height, and negatively correlated with SEC, SMC, HID, and DR. The surrounding environment was conducive to the development of plant diversity. The sampling sites close to the sea (such as Y3, X3, and M14) were more susceptible to SEC, SMC, DR, and HID, resulting in the poor level of plant diversity.
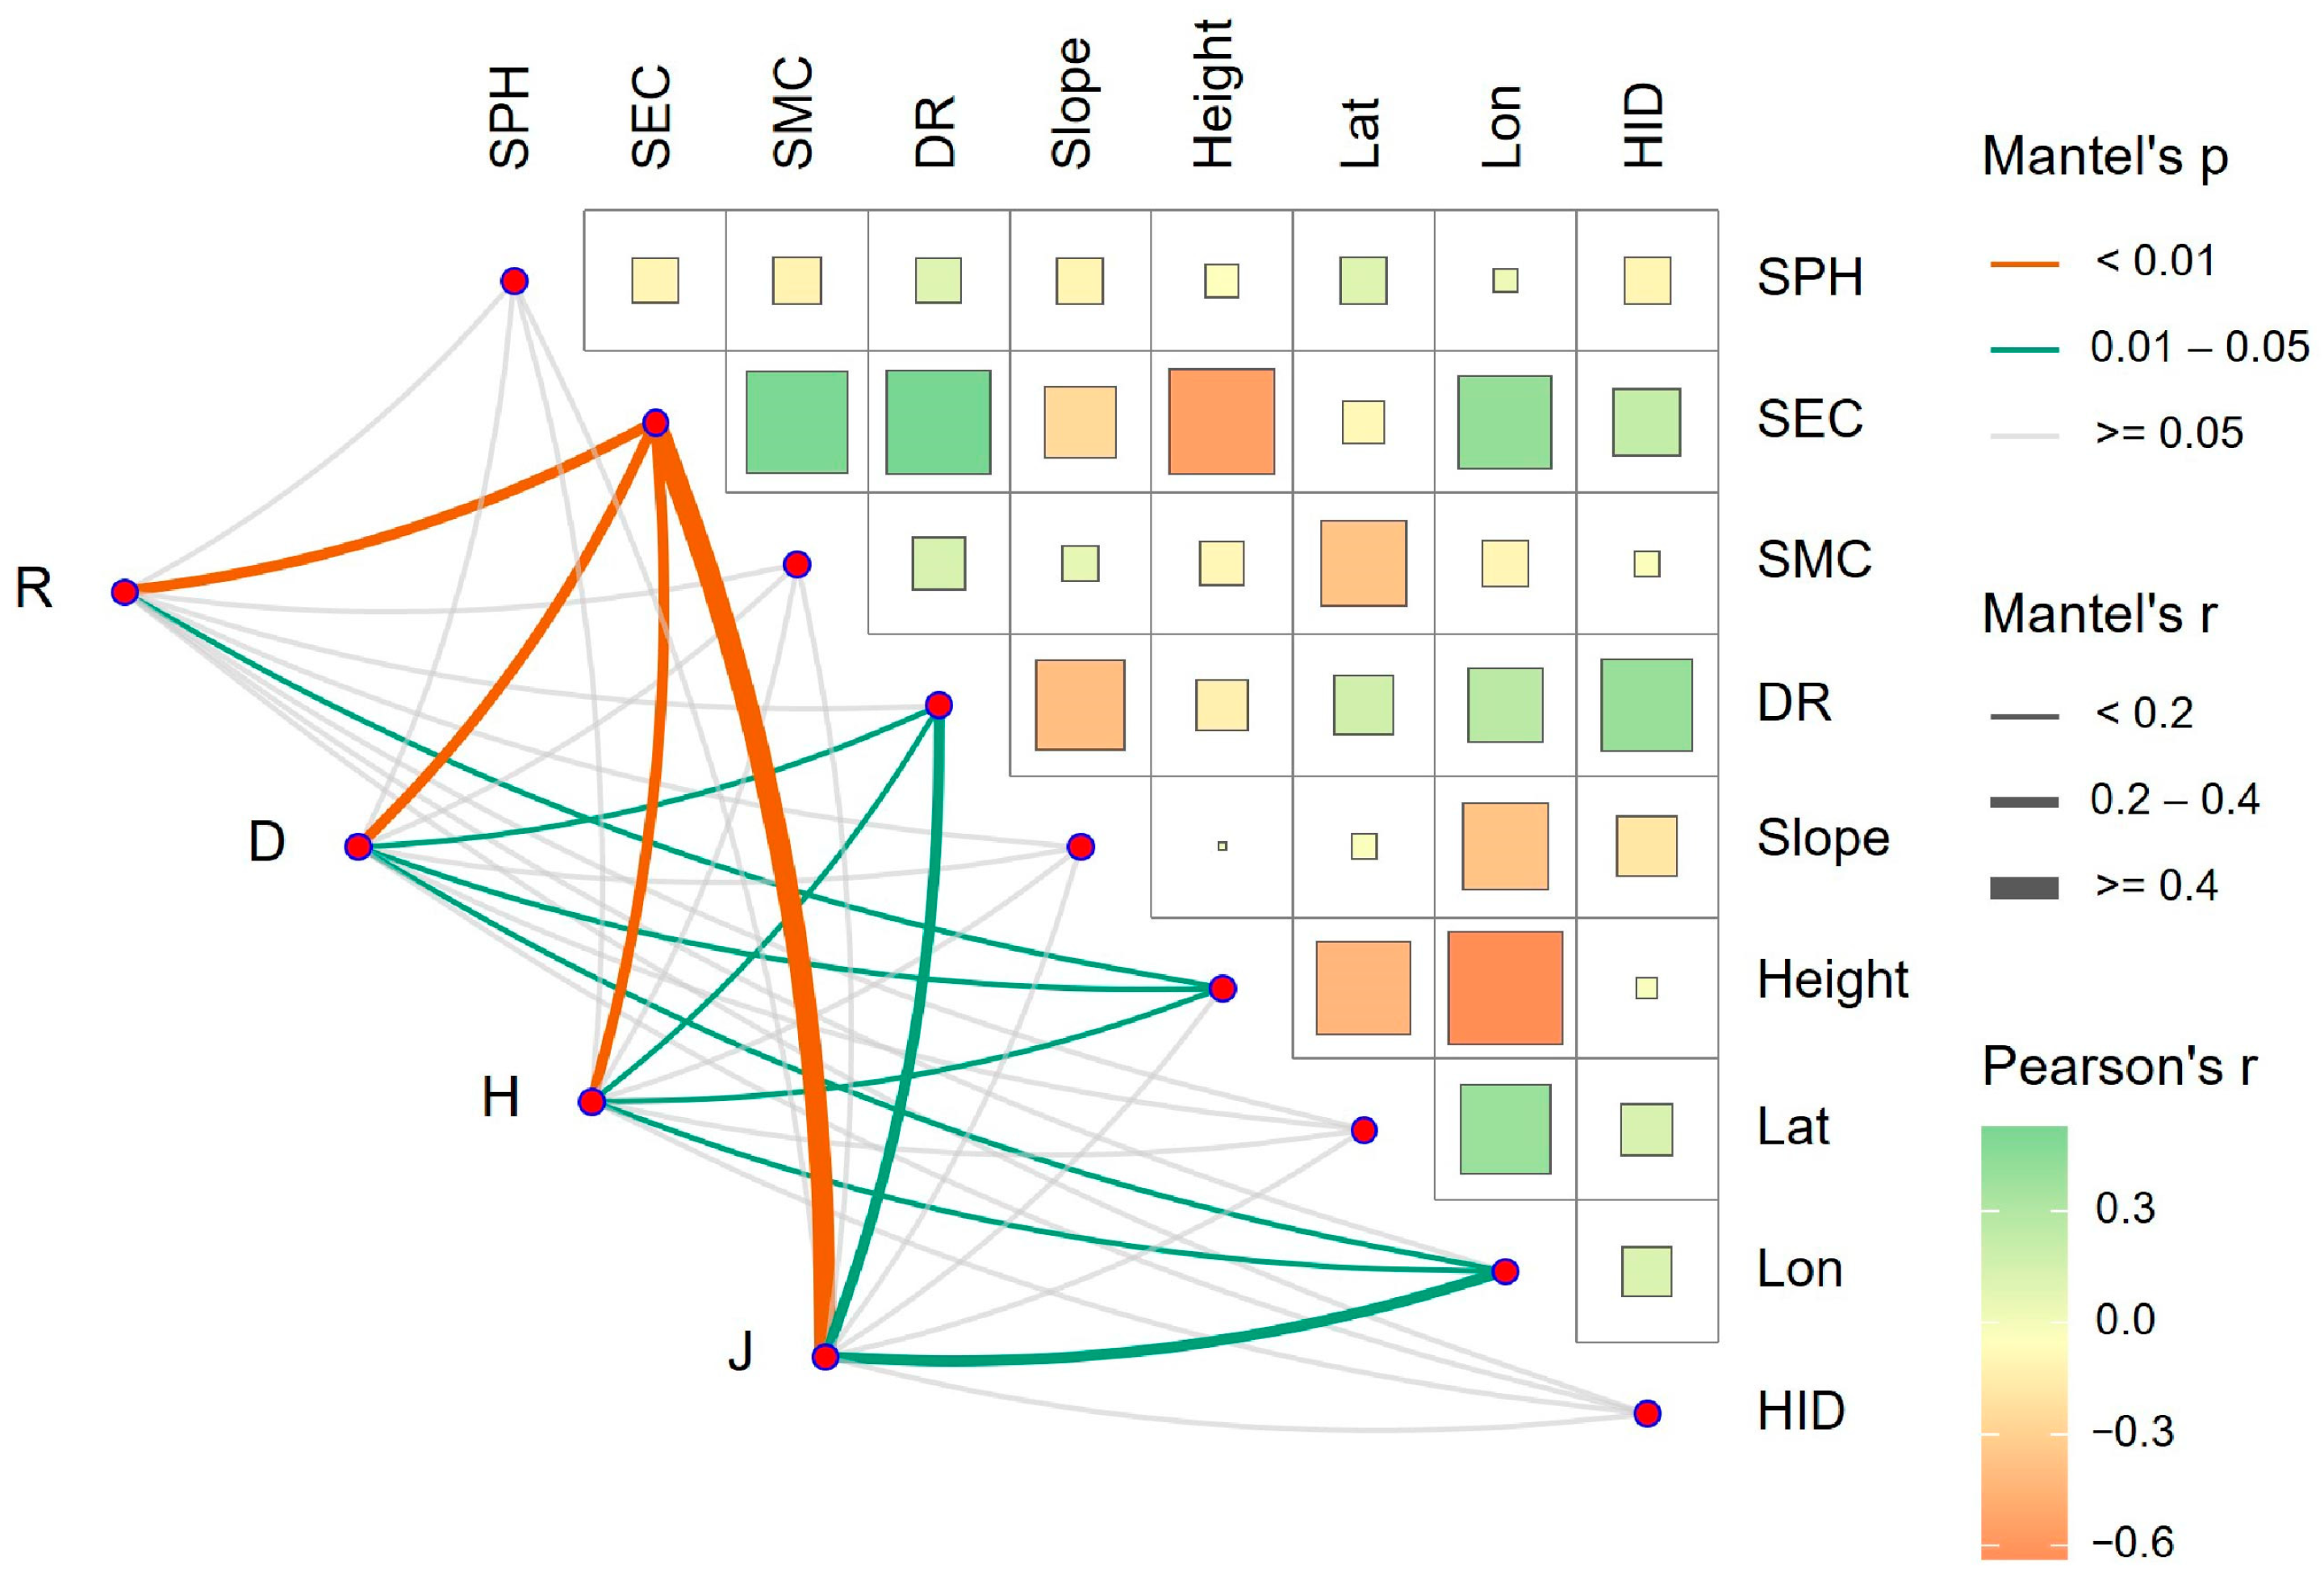
A Mantel test analysis (Figure 11) represented that the SEC had an extremely significant effect on the four diversity indexes (p < 0.01), and the correlation with the four indexes was the largest. The DR and Lon were significantly correlated with the D, H, and J indexes (p < 0.05). The height was significantly correlated with the R, D, and H indexes (p < 0.05). Therefore, the SEC was the key limiting factor of plant diversity, which was consistent with the result of the RDA. Based on the RDA and Mantel test analysis, we found that there were differences in the responses of these plant diversity indexes to environmental factors, but SEC was always the most closely related to plant diversity, which had a very important effect on the development of species diversity.

4. Discussion

4.1. Plant Composition and Diversity Under the Land–Sea Gradient in the Yellow River Delta

Previous studies on changes in plant composition and diversity along land–sea gradients are often limited to specific geographical areas, such as estuarine wetlands or nature reserves [27]. Due to the relatively confined spatial scope, these studies might not comprehensively reflect the overall trends of plant diversity changes along land–sea gradients. By contrast, this study focused on a larger regional scale, establishing different survey routes based on the flow directions and distributions of various rivers. By setting up distinct research areas according to varying land–sea gradients, this study systematically investigated the changes in plant diversity and habitat characteristics across these gradients, thereby contributing to the understanding of the complex mechanisms underlying the changes in plant diversity along the land–sea gradient.
The plant species composition is the result of long-term interactions between plants and their environment, influenced by a combination of biotic and abiotic factors [46]. Variations in community habitat conditions lead to differences in plant composition. In the Yellow River Delta, the predominant plants belonged to the families Poaceae, Asteraceae, Amaranthaceae, and Fabaceae, which were well adapted to the high moisture and salinity conditions of the soil. In the DS1 zone, halophytic plants, such as Suaeda salsa and Salicornia europaea, predominantly grew along the coast and tidal flats in dense patches. With the continuous expansion of the habitat of vigorous Suaeda salsa, the soil salinity in the DS2 zone experienced some regulation and improvement. Under the influence of human protection efforts, species such as Phragmites australis began to grow in smaller areas within this habitat, resulting in relatively rich plant diversity. As the distance from the sea gradually increased, the terrain rose, salinity decreased, and water levels declined, the community transitioned from the monospecies dominance of Suaeda salsa to the herbaceous community dominated by plants of the Poaceae family, such as Phragmites australis, Miscanthus sacchariflorus, and Calamagrostis pseudophragmites. Throughout this process, the community richness gradually increased, with both the variety and number of species rising, while interspecies competition intensified, leading to an overall enhancement of species diversity and evenness. Regarding the similarity of plant compositions, the Jaccard index was higher among plots closer to the ocean, indicating a greater number of shared plant species. Due to their proximity to the sea, these areas shared similar geographical environments, climatic conditions, ecological processes, and mechanisms of plant dispersal. Such similarities contributed to a high degree of overlap in plant species among the coastal regions of the Yellow River Delta, where salt-tolerant and alkaline-tolerant plants flourished abundantly.
This study revealed the characteristics of plant diversity in the Yellow River Delta by calculating different diversity indexes. However, further analysis showed that species richness and distribution uniformity were inconsistent in some sampling plots. Conceptually, the Margalef index (R), the Shannon–Wiener index (H), and the Simpson index (D) mainly focus on the number, dominance, and overall diversity of species, while the Pielou index (J) further measures the evenness of species distribution on the basis of the above. For example, when the R, H, and D indexes are similar in two sampling plots, the J index may be different, indicating that, although species diversity is similar, there may be differences in the evenness of population distribution. By comparing and analyzing the differences of these indexes, the unique value of the J index can be highlighted, which can reveal the distribution pattern of plant diversity more deeply. Meanwhile, this study also fully reflected the comprehensive selection of plant diversity indexes.
From the perspective of space, the longitudinal change trends of the four indexes R, H, D, and J were basically the same, which was consistent with the relevant research [47]. The plant diversity indexes of the Yellow River Delta were relatively low through field investigation, which was consistent with Xu et al. [39]. According to their survey results, there were 30 plants in this region, and the diversity indexes remained at a lower level. But in this study, a total of 44 species were recorded through field investigation, and the diversity index value was also higher. The reason may lie in the primary objective of our study, which was to explore the patterns of plant diversity changes along the land–sea gradient. Consequently, sampling sites were established based on river directions, with these plots located relatively close to the riverbank. Compared to adjacent areas, the riparian zone exhibited a richer composition of plant species, potentially resulting in the higher level of plant diversity [48].

4.2. Influencing Factors of Plant Diversity in the Yellow River Delta

4.2.1. Effects of Soil Properties on Plant Diversity

The distribution of plant communities influences the spatial distribution of soil physicochemical properties, while variations in these properties are crucial for species geographic distribution and biodiversity [49]. Consistent with classical concepts, the salt and moisture content in the soil played a significant role in species composition. Variations in soil salinity and moisture can directly affect changes in plant community diversity, subsequently influencing the multifunctionality of the ecosystem [50,51]. Notably, the soil salinity is an important factor affecting plant diversity in the modern Yellow River Delta. This study found the significant negative correlation between soil electrical conductivity (SEC) and plant diversity, which aligned with most research findings [31,52]. As the SEC decreased and soil conditions improved, a greater variety of herbaceous plant species began to grow and proliferate. Field investigations revealed that areas with high SEC (DS1) primarily consisted of halophytic plant communities, such as Suaeda salsa, characterized by simple community structures that resulted in low plant diversity. By contrast, areas with a lower SEC (DS5) supported communities of Phragmites australis, Miscanthus sacchariflorus, with other plants coexisting, which often exhibited higher levels of plant diversity. The SEC affected not only community structure, species composition, and succession processes, but significantly influenced species abundance, richness, and evenness. Specifically, as the SEC increased, plant species richness significantly decreased, and both plant diversity and evenness declined markedly. This indicated that the dominance of certain species within the community became more pronounced, while the abundance and distribution of other species were severely restricted. This study found a positive correlation trend between soil pH (SPH) and species diversity. However, the correlation was weak and did not reach significance. Previous studies have also reported inconsistent conclusions regarding the relationship between SPH and species diversity in the Yellow River Delta, which may be related to the habitat conditions of the established sampling plots. Some plots, being close to the Yellow River, were subject to freshwater flushing, which reduced the alkalinity of the surface soil, resulting in this phenomenon. The relevant research found no significant correlation between vegetation distribution and SPH in alkaline soils [53]. In this study area, the soil was alkaline, and its distribution did not correlate with salt-tolerant vegetation, which partially corroborated the conclusions.

4.2.2. Comprehensive Analysis of Influencing Factors of Plant Diversity

Firstly, through a systematic analysis of plant diversity level and driving mechanisms in the riverbank of the main stream and tributaries of the Yellow River Delta, we found that the overall plant diversity in the main stream of the Yellow River was significantly higher than that in the tributaries, which was basically consistent with the classical conclusion of Nilsson et al. [54]. But compared to them, this study further revealed the main stream not only dominated in species richness, but had higher diversity, dominance, and evenness. This difference indicated that there are differences in the mechanism of plant diversity construction between the main stream and the tributaries. Further regression analysis showed that plant diversity in the main stream was more susceptible to human interference, and that, in tributaries, it was more susceptible to SEC. Because the main stream bank has more stable hydrological conditions, better soil conditions, and less human disturbance, the plant diversity is relatively high [21]. In the tributaries, the distribution and diversity of plant species are significantly limited due to the high soil salt content. Therefore, these results not only revealed the regional and environment-specific characteristic of plant diversity in the Yellow River Delta, but provided an important reference for the differential conservation and management of river ecosystems.
Compared with previous studies [30,31,32], this study comprehensively considered the effects of geographical location, soil, topography, height, human interference, and other factors on plant diversity. Additionally, this study integrated methods such as redundancy analysis (RDA) and Mantel test analysis to minimize misleading results that may arise from potential interactions between factors. By combining these two methods, a more comprehensive and in-depth understanding of the relationship between diversity and environment was achieved, aiding in the revelation of the complex mechanisms underlying changes in plant diversity along the land–sea gradient. This, in turn, offered a scientific basis for formulating effective ecological protection and management strategies. From the combined results of the RDA and Mantel test analysis, it was evident that different plant diversity indexes responded differently to various environmental factors. However, SEC had the most significant impact on plant diversity, explaining the highest proportion of variance, while other factors exerted a comparatively minor influence. The topography of the Yellow River Delta features a higher elevation in the south and west, and a lower elevation in the north and east. This topographical variation did have some effect on the distribution of plant communities and species diversity across the region. However, due to the generally flat terrain, it might not play a critical driving role. Since the selected sampling sites were primarily distributed along the river, the proximity of each plot to the Yellow River did not vary significantly, which might also be insufficient to exert a critical influence on plant diversity. Furthermore, variations in longitude and frequent human disturbances indeed impacted plant species diversity. However, these effects were sometimes manifested indirectly through alterations in soil characteristics. Influenced by various natural factors and human activities, significant changes in moisture and salinity dynamics were observed in certain areas of the Yellow River Delta [55]. In order to adapt to these ecological changes, the plants in this region have gradually evolved salt–alkali tolerance. Therefore, SEC emerged as a key limiting factor affecting the distribution of plant diversity [56].
Human activities and natural environment changes, such as unreasonable use of soil and water resources and seawater intrusion, have caused the soil salinization in the coastal areas of the Yellow River Delta, which poses a great threat to biodiversity and the maintenance of ecosystem functions. In the future, the monitoring and restoration of soil salinization in the Yellow River Delta should be reinforced, and the cultivation of saline–alkali tolerant plants should be strengthened in areas close to the sea, so as to effectively protect and improve plant diversity and ecosystem stability. In addition, the future should also focus on strengthening riparian vegetation protection, which is critical to maintaining the resilience of ecosystems.

4.3. Limitation

Firstly, since the sampling sites were mainly set up around the river and close to the riverbank, this may have led to this study focusing on specific habitats near the river. Future studies could consider a systematic stratified design to expand the sampling area. This approach would help to ensure the representativeness of the study area, thereby providing a more comprehensive understanding of changes in plant diversity and enhancing the generality and applicability of the study results. Secondly, given the relatively short timeframe of the current investigation, long-term monitoring and dynamic studies should be strengthened for different land–sea zones, because the change of plant communities is often a slow and complex process, requiring the continuous observation and recording to capture its change trend. Finally, although this study selected nine influencing factors from three aspects, there may still be broad space for research on the system of influencing factors of plant diversity. Future studies can further explore the factors affecting plant diversity by increasing the number of factors, considering more variable interactions, and using more advanced statistical methods. Through these comprehensive studies, we hope to provide a basic guarantee for the improvement and efficient utilization of the ecosystem functions in the Yellow River Delta.

5. Conclusions

Based on a field survey and statistical analysis of plant diversity, this study revealed the spatial differentiation of plant diversity in the Yellow River Delta under the land–sea gradients, and identified the key driving factors of plant diversity using regression analysis, redundancy analysis (RDA), and the Mantel test analysis. The results were as follows.
This study investigated 44 species of herbaceous plants of 36 genera and 16 families in the study area. Among them, plants of the Asteraceae, Poaceae, and Amaranthaceae families dominated. We recorded 30 species of plants of 26 genera and 13 families in the Yellow River Delta National Nature Reserve, indicating the richness of plant diversity in the reserve. The plants in the study area were mainly hygrophytes and halophytes, and the dominant communities were Suaeda salsa and Phragmites australis. With the increase of the distance from the sea, the community transitions from the monospecies dominance of Suaeda salsa to the herbaceous community, dominated by plants of the Poaceae family, such as Phragmites australis, Miscanthus sacchariflorus, and Calamagrostis pseudophragmites. Meanwhile, the plant species and distribution changed significantly in this process. The species similarity coefficient of the adjacent environment was higher than that of the non-adjacent environment. Additionally, the species similarity of the coastal area was higher, and the plant composition was mainly halophytes.
Overall, the level of plant diversity in the Yellow River Delta was relatively low. From the perspective of spatial distribution, the longitudinal change trends of the Margalef index (R), the Shannon–Wiener index (H), the Simpson index (D), and the Pielou index (J) were basically the same, and the level of plant diversity showed a fluctuating downward trend from land to sea. The plant diversity in the reserve also showed a decreasing trend from land to sea. Additionally, it indicated a peak value in the region of 3–17 km from the sea (DS2) and the region of > 42 km from the sea (DS5), which may be influenced by such comprehensive factors as habitat level, soil conditions, and policy protection. From the riverbank perspective, the overall plant diversity in the main stream of the Yellow River was significantly higher than that in the tributaries. Human interference was the key factor affecting the level of plant diversity in the main stream, and soil electrical conductivity (SEC) was the key factor affecting the level of plant diversity in the tributaries.
The results of the RDA and Mantel test analysis found that different plant diversity indexes had different responses to different environmental factors. In general, the plant diversity index had a strong negative correlation with SEC, soil moisture content (SMC), the nearest distance from the Yellow River (DR), human interference degree (HID), and longitude (Lon), and a strong positive correlation with height. Among them, SEC had the greatest impact on species diversity in the Yellow River Delta, and its comprehensive contribution rate to plant diversity was 62.37%. Therefore, SEC was a key limiting factor for plant diversity in the Yellow River Delta. Therefore, the implementation of reasonable soil improvement measures to reduce the risk of soil salinization is crucial for the conservation and restoration of ecosystems in the Yellow River Delta.

Author Contributions

Conceptualization, Y.S. (Yingjun Sun), W.M., and F.W.; methodology, Y.S. (Yingjun Sun), W.M., and F.W.; software, Y.S. (Yingjun Sun), W.M., and F.W.; validation, Y.S. (Yingjun Sun), W.M., F.W., and Y.S. (Yanshuang Song); formal analysis, Y.S. (Yingjun Sun) and F.W.; investigation, Y.S. (Yingjun Sun), W.M., F.W., Y.S. (Yanshuang Song), and M.S.; resources, Y.S. (Yingjun Sun) and F.W.; data curation, F.W.; writing—original draft preparation, Y.S. (Yingjun Sun) and W.M.; writing—review and editing, Y.S. (Yingjun Sun), W.M., and F.W.; visualization, Y.S. (Yingjun Sun), W.M., and M.S.; supervision, F.W.; project administration, Y.S. (Yingjun Sun); funding acquisition, Y.S. (Yingjun Sun) and F.W. All authors have read and agreed to the published version of the manuscript.

Funding

This research was funded by the cultivation platform for integrating production, science, and education jointly built by Shandong Province and Peking University (20221830) and the National Natural Science Fund of China (42301320).

Institutional Review Board Statement

Not applicable.

Informed Consent Statement

Not applicable.

Data Availability Statement

The original contributions presented in this study are included in the article. Further inquiries can be directed to the corresponding author.

Acknowledgments

The authors sincerely thank the experts in the reviewing, editing, publishing, and dissemination of this work.

Conflicts of Interest

The authors declare no conflicts of interest.

Abbreviations

The following abbreviations are used in this manuscript:
RMargalef index
HShannon–Wiener index
DSimpson index
JPielou index
SPHSoil pH
SECSoil electrical conductivity
SMCSoil moisture content
DRThe nearest distance from the Yellow River
LonLongitude
LatLatitude
HIDHuman interference degree
ANOVAOne-way analysis of variance
VIFVariance inflation factor
GPSGlobal positioning system
DCADetrended correspondence analysis
CCACanonical correlation analysis
RDARedundancy analysis

References

  1. Isbell, F.; Calcagno, V.; Hector, A.; Connolly, J.; Harpole, W.S.; Reich, P.B.; Scherer-Lorenzen, M.; Schmid, B.; Tilman, D.; Van Ruijven, J. High plant diversity is needed to maintain ecosystem services. Nature 2011, 477, 199–202. [Google Scholar] [CrossRef] [PubMed]
  2. Nelson, P.R.; McCune, B.; Swanson, D.K. Lichen traits and species as indicators of vegetation and environment. Bryologist 2015, 118, 252–263. [Google Scholar] [CrossRef]
  3. Pandey, S.; Shukla, R. Plant diversity in managed sal (Shorea robusta Gaertn.) forests of Gorakhpur, India: Species composition, regeneration and conservation. Biodivers. Conserv. 2003, 12, 2295–2319. [Google Scholar] [CrossRef]
  4. Whittaker, R.H. Evolution and measurement of species diversity. Taxon 1972, 21, 213–251. [Google Scholar] [CrossRef]
  5. Tilman, D.; Reich, P.B.; Knops, J.M. Biodiversity and ecosystem stability in a decade-long grassland experiment. Nature 2006, 441, 629–632. [Google Scholar] [CrossRef]
  6. Sagar, R.; Pandey, A.; Singh, J. Composition, species diversity, and biomass of the herbaceous community in dry tropical forest of northern India in relation to soil moisture and light intensity. Environmentalist 2012, 32, 485–493. [Google Scholar] [CrossRef]
  7. Li, S.H.; Gao, G.Y.; Wang, C.; Li, Z.S.; Feng, X.M.; Fu, B.J. Aridity regulates the impacts of multiple dimensional plant diversity on soil properties in the drylands of northern China. Sci. Total Environ. 2024, 946, 174211. [Google Scholar] [CrossRef]
  8. Li, Q.; Zhao, H.; Zhao, C.Z. Response of main plant community diversity to soil environmental factors in Taohe national wetland park. Acta Ecol. Sin. 2022, 42, 2674–2684. [Google Scholar] [CrossRef]
  9. Wang, Y.J.; Tao, J.P.; Peng, Y. Advances in species diversity of terrestrial plant communities. Guihaia 2006, 26, 406–411. [Google Scholar]
  10. Wei, C.X.; Guo, B.; Fan, Y.W.; Zang, W.Q.; Ji, J.W. The change pattern and its dominant driving factors of wetlands in the Yellow River Delta based on Sentinel-2 images. Remote Sens. 2022, 14, 4388. [Google Scholar] [CrossRef]
  11. Zhang, Q.; Wang, J.; Wang, Q. Effects of abiotic factors on plant diversity and species distribution of alpine meadow plants. Ecol. Inform. 2021, 61, 101210. [Google Scholar] [CrossRef]
  12. Victorero, L.; Robert, K.; Robinson, L.F.; Taylor, M.L.; Huvenne, V.A. Species replacement dominates megabenthos beta diversity in a remote seamount setting. Sci. Rep. 2018, 8, 4152. [Google Scholar] [CrossRef]
  13. Guisan, A.; Zimmermann, N.E. Predictive habitat distribution models in ecology. Ecol. Modell. 2000, 135, 147–186. [Google Scholar] [CrossRef]
  14. Xu, H.W.; Liu, Q.; Wang, S.Y.; Yang, G.S.; Xue, S. A global meta-analysis of the impacts of exotic plant species invasion on plant diversity and soil properties. Sci. Total Environ. 2022, 810, 152286. [Google Scholar] [CrossRef] [PubMed]
  15. Cai, H.L.; Ou, J. Diversity of understory herbaceous plants in urban forest communities and their environmental responses—The case of Guiyang City. Subtrop. Plant Sci. 2023, 52, 433–447. [Google Scholar]
  16. Weigel, R.; Gilles, J.; Klisz, M.; Manthey, M.; Kreyling, J. Forest understory vegetation is more related to soil than to climate towards the cold distribution margin of European beech. J. Veg. Sci. 2019, 30, 746–755. [Google Scholar] [CrossRef]
  17. Huang, S.L.; Fu, G. Impacts of climate change and human activities on plant species α-diversity across the Tibetan grasslands. Remote Sens. 2023, 15, 2947. [Google Scholar] [CrossRef]
  18. Wang, C.X.; Qian, Z.J.; Huang, Y.T.; Mao, Y.; Zhong, Z.F.; Cao, S.X.; Wang, S.S.; Wang, Y.X.; Deng, C.Y. Diversity characteristics of alien invasive plants in different understory herb layers of Pingtan Island and explanation of environmental factors. Chin. J. Appl. Environ. Biol. 2024, 31, 1–15. [Google Scholar] [CrossRef]
  19. Ermakov, N.; Makhatkov, I. Classification and ordination of north boreal light-coniferous forests of the West Siberian Plain. Plant Biosyst. 2011, 145, 199–207. [Google Scholar] [CrossRef]
  20. Yu, J.B.; Zhan, C.; Li, Y.Z.; Zhou, D.; Fu, Y.Q.; Chu, X.J.; Xing, Q.H.; Han, G.X.; Wang, G.M.; Guan, B. Distribution of carbon, nitrogen and phosphorus in coastal wetland soil related land use in the Modern Yellow River Delta. Sci. Rep. 2016, 6, 37940. [Google Scholar] [CrossRef]
  21. Habel, J.C.; Ulrich, W. Ecosystem functions in degraded riparian forests of southeastern Kenya. Ecol. Evol. 2021, 11, 12665–12675. [Google Scholar] [CrossRef] [PubMed]
  22. Yan, J.F.; Zhu, J.; Zhao, S.Y.; Su, F.Z. Coastal wetland degradation and ecosystem service value change in the Yellow River Delta, China. Glob. Ecol. Conserv. 2023, 44, e02501. [Google Scholar] [CrossRef]
  23. Huo, B.B.; Sun, Z.M.; Ou, W.H.; Mao, H.Z.; Hu, A.; Yang, Y.J.; Li, Z.Q. Environmental filtering and dispersal limitation jointly affect wetland plant community assembly in Hubei section of the Yangtze River Basin. Acta Ecol. Sin. 2023, 43, 1804–1811. [Google Scholar] [CrossRef]
  24. Hou, G.Q.; Lai, J.B.; Li, J.; Liu, Z.; Gong, H.R.; Wang, B.; Sun, Z.G.; OuYang, Z.; Hou, R.X. Driving force of soil age on vegetation and microbial succession in the Yellow River Delta. Acta Ecol. Sin. 2022, 42, 8839–8859. [Google Scholar] [CrossRef]
  25. Yin, D.J.; Zhang, J.; Jing, R.; Dong, L. Relationships between plant community and soil chemical factors in coastal saline area of Shandong, China. Chin. J. Appl. Ecol. 2018, 29, 3521–3529. [Google Scholar] [CrossRef]
  26. Zhu, T.; Fang, Q.; Jia, L.H.; Zou, Y.H.; Wang, X.H.; Qu, C.Y.; Yu, J.B.; Yang, J.S. Diversity of soil seed bank and influencing factors in the nascent wetland of the Yellow River Delta. Front. Plant Sci. 2023, 14, 1249139. [Google Scholar] [CrossRef]
  27. Zou, Y.H.; Li, X.; Zhang, X.; Ling, Y.; Yu, J.B.; Li, Y.S.; Wang, X.H. Plant community composition and structure of the nascent wetlands of the Yellow River. Chin. J. Ecol. 2024, 43, 3240. [Google Scholar] [CrossRef]
  28. Zhang, K.; Xia, J.B.; Su, L.; Gao, F.L.; Cui, Q.; Xing, X.S.; Dong, M.M.; Li, C.R. Effects of microtopographic patterns on plant growth and soil improvement in coastal wetlands of the Yellow River Delta. Front. Plant Sci. 2023, 14, 1162013. [Google Scholar] [CrossRef]
  29. Zhang, G.S.; Wang, R.Q.; Song, B.M. Plant community succession in modern Yellow River Delta, China. J. Zhejiang Univ. Sci. B 2007, 8, 540–548. [Google Scholar] [CrossRef]
  30. Tan, X.F.; Du, N.; Ge, X.L.; Wang, W.; Wang, R.Q.; Cai, Y.F.; Wang, Y.; Wang, C.D.; Lu, P.L.; Liu, Y.L. Relationships between coastal meadow distribution and soil characteristics in the Yellow River Delta. Acta Ecol. Sin. 2012, 32, 5998–6005. [Google Scholar] [CrossRef]
  31. Ma, Z.W.; Xie, Z.L.; Duan, X.F.; Zhou, X.; Xu, X.G. Plant-soil relationship and plant niche in the Yellow River Delta National Natural Reserve, China. Acta Sci. Nat. Univ. Pekin. 2012, 48, 801–811. [Google Scholar] [CrossRef]
  32. Li, T.; Sun, J.K.; Fu, Z.Y. Halophytes differ in their adaptation to soil environment in the yellow river delta: Effects of water source, soil depth, and nutrient stoichiometry. Front. Plant Sci. 2021, 12, 675921. [Google Scholar] [CrossRef] [PubMed]
  33. Zhao, Q.Q.; Bai, J.H.; Gao, Y.C.; Wang, L.L.; Zheng, L.W.; Wang, J.N.; Zhang, S.Y. Variations in soil salt ions along a water and salinity gradient in the Yellow River Delta, China. J. Agro-Environ. Sci. 2019, 38, 641–649. [Google Scholar]
  34. Zeng, R.J.; Yang, X.B.; Li, D.H.; Wang, Q.; Wang, H.; Xia, D. Relationship between understory plant diversity and environmental factors in Eucalyptus robusta and Acacia mangium forests. Nat. Sci. J. Hainan Univ. 2024, 42, 155–163. [Google Scholar] [CrossRef]
  35. Liu, Q.F.; Kang, M.Y.; Liu, Q.R. Gradient analysis and environmental interpretation of species diversity of forest vegetation in Hungou. Acta Bot. Boreali-Occident. Sin. 2006, 26, 1686–1692. [Google Scholar]
  36. Zeng, G.Y.; Ye, M.; Li, M.M.; Chen, W.L.; He, Q.Z.; Pan, X.T.; Zhang, X.; Che, J.; Qian, J.R.; Lv, Y.X. The Relationships between Plant Community Stability and Diversity across Different Grassland Types and Their Association with Environmental Factors in the Habahe Forest Area, Xinjiang. Diversity 2024, 16, 499. [Google Scholar] [CrossRef]
  37. Feng, Y.Q.; He, T.H.; Chen, X.Q.; Cui, Q.; He, Y.S. Study on the relationship between plant diversity and soil texture and salinity of saline meadow community. Acta Agrestia Sin. 2020, 28, 1682–1689. [Google Scholar] [CrossRef]
  38. Liu, S.L.; Hou, X.Y.; Yang, M.; Cheng, F.Y.; Coxixo, A.; Wu, X.; Zhang, Y.Q. Factors driving the relationships between vegetation and soil properties in the Yellow River Delta, China. Catena 2018, 165, 279–285. [Google Scholar] [CrossRef]
  39. Xu, Z.; Li, R.Q.; Dou, W.J.; Wen, H.; Yu, S.L.; Wang, P.; Ning, L.H.; Duan, J.Q.; Wang, J.C. Plant Diversity Response to Environmental Factors in Yellow River Delta, China. Land 2024, 13, 264. [Google Scholar] [CrossRef]
  40. Yu, Y.; Wang, H.; Liu, J.; Wang, Q.; Shen, T.L.; Guo, W.H.; Wang, R.Q. Shifts in microbial community function and structure along the successional gradient of coastal wetlands in Yellow River Estuary. Eur. J. Soil Biol. 2012, 49, 12–21. [Google Scholar] [CrossRef]
  41. Sun, Y.Z.; Wang, Z.T.; Bao, Y.; Wei, W.F.; Yang, X.Y. Response of plant community characteristics of urban remnant mountains to different ways and intensity of artificial disturbance. Acta Ecol. Sin. 2023, 43, 4632–4650. [Google Scholar] [CrossRef]
  42. Legorburu, I.; Rodríguez, J.G.; Borja, Á.; Menchaca, I.; Solaun, O.; Valencia, V.; Galparsoro, I.; Larreta, J. Source characterization and spatio–temporal evolution of the metal pollution in the sediments of the Basque estuaries (Bay of Biscay). Mar. Pollut. Bull. 2013, 66, 25–38. [Google Scholar] [CrossRef] [PubMed]
  43. Chen, H.W.; Lin, H.C.; Chuang, Y.H.; Sun, C.T.; Chen, W.Y.; Kao, C.Y. Effects of environmental factors on benthic species in a coastal wetland by redundancy analysis. Ocean Coast Manag. 2019, 169, 37–49. [Google Scholar] [CrossRef]
  44. Meng, X.Y.; Fan, S.X.; Dong, L.; Li, K.; Li, X.L. Response of understory plant diversity to soil physical and chemical properties in urban forests in Beijing, China. Forests 2023, 14, 571. [Google Scholar] [CrossRef]
  45. Fan, J.J.; Zhao, Y.; Wang, D.N.; Zhou, X.; Li, Y.Y.; Zhang, W.W.; Xu, F.F.; Wei, S.B. A Stepwise Multifactor Regression Analysis of the Interactive Effects of Multiple Climate Factors on the Response of Vegetation Recovery to Drought. Atmosphere 2024, 15, 1094. [Google Scholar] [CrossRef]
  46. Hao, L.; Chen, S.; Zhang, Z.X.; Yuan, J.M.; Xiang, Z.; Chen, X. Understory herbaceous composition and diversity patterns of forest community in Fanjingshan mountain. J. Cent. South Univ. For. Technol. 2024, 44, 114–128. [Google Scholar] [CrossRef]
  47. Wang, D.P.; Ji, S.Y.; Chen, F.P. A review on the species diversity of plant community. Chin. J. Ecol. 2001, 4, 55. [Google Scholar]
  48. Fogarty, F.A.; Yen, J.D.; Fleishman, E.; Sollmann, R.; Ke, A. Multiple-region, N-mixture community model to assess associations of riparian area, fragmentation, and species richness. Ecol. Appl. 2022, 32, e2698. [Google Scholar] [CrossRef]
  49. Zheng, C.Z.; Li, Y.Q.; Wang, X.Y.; Wang, L.L.; Duan, Y.L.; Chen, Y.; Lu, J.N. Desertification indirectly affects soil fauna by reducing complexity of soil habitats and diversity of energy sources. Sci. Total Environ. 2024, 954, 176509. [Google Scholar] [CrossRef]
  50. Xue, G.Y.; Zeng, J.; Huang, J.Y.; Huang, X.G.; Liang, F.J.; Wu, J.D.; Zhu, X.P. Effects of Soil Properties and Altitude on Phylogenetic and Species Diversity of Forest Plant Communities in Southern Subtropical China. Sustainability 2024, 16, 11020. [Google Scholar] [CrossRef]
  51. Yuan, X.; Ma, K.M.; Wang, D. Explaining the abundance-distribution relationship of plant species with niche breadth and position in the Yellow River Delta. Acta Ecol. Sin. 2011, 31, 1955–1961. [Google Scholar] [CrossRef]
  52. Wu, T.G.; Wu, M.; Xiao, J.H. Dynamics of community succession and species diversity of vegetations in beach wetlands of Hangzhou Bay. Chin. J. Ecol. 2008, 27, 1284–1289. [Google Scholar] [CrossRef]
  53. Schuster, B.; Diekmann, M. Changes in species density along the soil pH gradient—Evidence from German plant communities. Folia Geobot. 2003, 38, 367–379. [Google Scholar] [CrossRef]
  54. Nilsson, C.; Ekblad, A.; Dynesius, M.; Backe, S.; Gardfjell, M.; Carlberg, B.; Hellqviist, S.; Jansson, R. A comparison of species richness and traits of riparian plants between a main river channel and its tributaries. J. Ecol. 1994, 82, 281–295. [Google Scholar] [CrossRef]
  55. Fang, Y.; Wang, S.J.; Liu, L.; Liang, Y. Specific composition of wetland community in Yellow River Delta under different human-induced disturbances and its causes. J. Northeast For. Univ. (Chin. Ed.) 2009, 37, 67–70. [Google Scholar]
  56. Liu, L.L.; Wu, Y.M.; Yin, M.Q.; Ma, X.Y.; Yu, X.N.; Guo, X.; Du, N.; Eller, F.; Guo, W.H. Soil salinity, not plant genotype or geographical distance, shapes soil microbial community of a reed wetland at a fine scale in the Yellow River Delta. Sci. Total Environ. 2023, 856, 159136. [Google Scholar] [CrossRef]
Figure 1. The overview map of the study area. (a,b) Geographical location of the study area. (c) Typical plant species in the study area.
Applsci 15 04030 g001
Figure 2. The sampling sites layout of the study area. DS1: the distance from the sea is less than 3 km; DS2: the distance from the sea is 3–17 km; DS3: the distance from the sea is 17–26 km; DS4: the distance from the sea is 26–42 km; DS5: the distance from the sea is greater than 42 km.
Applsci 15 04030 g002
Figure 3. The proportion of species in each family to total species.
Applsci 15 04030 g003
Figure 4. The condition of the species similarity.
Applsci 15 04030 g004
Figure 5. The distribution characteristics of the species diversity index.
Applsci 15 04030 g005
Figure 6. The spatial distribution of plant diversity: (a) Margalef index, (b) Shannon–Wiener diversity index, (c) Simpson index, (d) Pielou index.
Applsci 15 04030 g006
Figure 7. Plant diversity level for different distances from the sea. Different lowercase letters indicate significant differences under different distances from the sea. DS1: the distance from the sea is less than 3 km; DS2: the distance from the sea is 3–17 km; DS3: the distance from the sea is 17–26 km; DS4: the distance from the sea is 26–42 km; DS5: the distance from the sea is greater than 42 km.
Applsci 15 04030 g007
Figure 8. Analysis of the soil property: (a) soil properties of all sampling sites; (b) soil properties at different distanced from the sea. Different lowercase letters indicate significant differences between different land–sea zones.
Applsci 15 04030 g008
Figure 9. RDA results of plant diversity index and influencing factors. The red arrows indicate the plant diversity index, and the blue arrows indicate the influencing factor. R: Margalef index; H: Shannon–Wiener diversity index; D: Simpson index; J: Pielou index; SPH: soil pH; SEC: soil electrical conductivity; SMC: soil moisture content; Lat: latitude; Lon: longitude; DR: the nearest distance from the Yellow River; HID: human interference degree.
Applsci 15 04030 g009
Figure 10. The contribution of influencing factors to plant diversity. SEC: soil electrical conductivity; SMC: soil moisture content; HID: human interference degree; DR: the nearest distance from the Yellow River; Lon: longitude.
Applsci 15 04030 g010
Figure 11. The Mantel test analysis of plant diversity and influencing factors. SPH: soil pH; SEC: soil electrical conductivity; SMC: soil moisture content; DR: the nearest distance from the Yellow River; Lat: latitude; Lon: longitude; HID: human interference degree.
Applsci 15 04030 g011
Table 1. Information about the sampling sites.
RoutesSampling SitesDominant SpeciesCommunity Height (m)Plant Cover (%)Soil TypeDistrict
Main stream of the Yellow River (M)M1Phragmites australis, Cyperus serotinus1.575Flood landLijin
M2Phragmites australis, Cyperus serotinus2.480Flood landDongying
M3Phragmites australis1.885Yellow soilLijin
M4Calamagrostis pseudophragmites, Cyperus serotinus1.2595Flood landKenli
M5Calamagrostis pseudophragmites, Erigeron canadensis1.590Flood landLijin
M6Phragmites australis, Cyperus serotinus1.870Flood landLijin
M7Phragmites australis1.975Flood landLijin
M8Phragmites australis, Miscanthus sacchariflorus1.285Yellow soilReserve
M9Phragmites australis, Miscanthus sacchariflorus2.395Yellow soilReserve
M10Phragmites australis, Miscanthus sacchariflorus298Yellow soilReserve
M11Phragmites australis, Glycine soja1.585Yellow soilReserve
M12Miscanthus sacchariflorus, Coreopsis lanceolata195Yellow soilReserve
M13Phragmites australis1.590Saline/alkaline landReserve
M14Suaeda salsa0.4480Saline/alkaline landReserve
Tiao River (T)T1Phragmites australis, Suaeda salsa1.275Saline/alkaline landLijin
T2Phragmites australis, Suaeda salsa1.398Yellow soilHekou
T3Suaeda salsa0.7570Saline/alkaline landHekou
Ancient route of the Yellow River (A)A1Phragmites australis, Suaeda salsa175Saline/alkaline landLijin
A2Phragmites australis, Suaeda salsa1.580Flood landHekou
A3Phragmites australis, Suaeda salsa1.680Saline/alkaline landReserve
Shenxian Ditch (S)S1Phragmites australis, Miscanthus sacchariflorus1.4595Yellow soilHekou
S2Phragmites australis, Setaria viridis1.7595Yellow soilHekou
S3Phragmites australis, Suaeda salsa1.495Saline/alkaline landHekou
Xiaodao River (X)X1Phragmites australis, Suaeda salsa1.2580Saline/alkaline landKenli
X2Phragmites australis, Sonchus brachyotus280Flood landKenli
X3Suaeda salsa0.2550Saline/alkaline landKenli
Yongfeng River (Y)Y1Phragmites australis0.880Yellow soilKenli
Y2Phragmites australis, Suaeda salsa1.680Saline/alkaline landKenli
Y3Suaeda salsa0.2530Saline/alkaline landKenli
Yihong–Guangli River (YG)YG1Phragmites australis285Yellow soilKenli
YG2Phragmites australis, Suaeda salsa1.7590Yellow soilKenli
YG3Phragmites australis, Suaeda salsa1.4380Saline/alkaline landDongying
YG4Phragmites australis, Suaeda salsa175Saline/alkaline landDongying
Table 2. Division of zones at different distances from the sea.
Distance from the Sea (km)ClassificationSampling Plots
<3DS1M13, M14, T3, A3, X3, Y3, YG4
3–17DS2M10–M12, S2, S3, X2, YG3
17–26DS3M9, T2, A2, X1, Y2, YG2
26–42DS4M6–M8, T1, A1, S1, Y1
>42DS5M1–M5, YG1
Table 3. Information of influencing factors.
ClassificationFactorsAbbrUnitMethod
Soil propertiesSoil pHSPH-Field collection and laboratory determination
Soil electrical conductivitySECmS/cm
Soil moisture contentSMC%
Other environmental factorsThe nearest distance from the Yellow RiverDRkmSpatial analysis in ArcGIS 10.6
SlopeSlopeDegreeField measurement
HeightHeightmGPS record
LongitudeLonDegree
LatitudeLatDegree
Human interferenceHuman interference degreeHID-Field record
Table 4. Major human interference in the Yellow River Delta.
FactorsMain ContentSampling Sites
Human tramplingFoot traffic, footpaths, graveyards trampled, and bare soilM2, M3, M5, M7, M9, M13, M14, S3, Y3, YG3
Garbage impactDomestic and industrial wasteM3, M9, M12, YG4
Agricultural activityVegetable fields, farmland, straw backfilling, and fishingM1, M5, M6, M7, M9, M10, M14, S3, X2, Y3
StructuresPylons, poles, floodgates, cell towers, wind power, concrete walls, burial areas, and abandoned buildingsM13, T3, A1, S3, X3, Y3, YG2
Traffic impactParkway, highway, pontoon bridge, and viaductM3, M8, M13, T2, T3, A1, A2, S1, S2, X1, Y1, Y2, YG1, YG4
Table 5. The human interference level of sampling sites.
Interference LevelSampling Sites
SlightestM4, M12, A2, A3, X2
SlightM1, M2, M6, M8, M10, M11, T1, S2, X3, YG1–YG3
ModerateM5, M7, M9, T2, A1, S1, X1, Y2, Y3, YG4
StrongM13, M14, Y1
StrongestM3, T3, S3
Table 6. The information of plant composition.
RouteAbbrFamilyGenusSpecies
Tiao RiverT456
Ancient route of the Yellow RiverA61010
Shenxian DitchS61015
Main stream of the Yellow RiverM153035
Xiaodao RiverX378
Yongfeng RiverY478
Yihong-Guangli RiverYG61213
Sum-163644
Table 7. The plant composition under different distance from the sea.
Distance from the Sea (km)PartitionImportant Plants
<3DS1Suaeda salsa
3–17DS2Phragmites australis, Suaeda salsa, Sonchus brachyotus, Artemisia scoparia, Glycine soja
17–26DS3Phragmites australis, Suaeda salsa, Miscanthus sacchariflorus
26–42DS4Phragmites australis, Miscanthus sacchariflorus, Artemisia scoparia, Cyperus serotinus
>42DS5Phragmites australis, Erigeron canadensis, Potentilla supina, Calamagrostis pseudophragmites, Cyperus rotundus
Table 8. Plant diversity level of the main stream (n = 14) and tributaries (n = 19).
Plant DiversityMain StreamTributariesp
Margalef (R)0.5540.2860.002
Shannon–Wiener (H) 0.6450.3690.014
Simpson (D)0.3430.2070.026
Pielou (J)0.5120.4640.479
Table 9. Results of the collinear analysis.
FactorsSPHSECSMCDRSlopeHeightLatLonHID
VIF1.144.471.772.331.513.652.172.351.28
Notes: “SPH: soil pH; SEC: soil electrical conductivity; SMC: soil moisture content; DR: the nearest distance from the Yellow River; Lat: latitude; Lon: longitude; HID: human interference degree.”.
Table 10. Stepwise regression analysis of plant diversity and influencing factors in the main stream (n = 14) and tributaries (n = 19).
RiverbankPlant DiversityRegression model R a d j 2
Main streamMargalef (R)R = −0.841HID + 0.9270.554
Shannon–Wiener (H) H = −1.201HID + 1.1770.580
Simpson (D)D = −0.639HID + 0.6260.509
Pielou (J)J = −0.104SEC + 0.5860.548
TributariesMargalef (R)R = −0.080SEC + 0.4760.326
Shannon–Wiener (H) H = −0.102SEC + 0.6130.354
Simpson (D)D = −0.055SEC + 0.3380.338
Pielou (J)J = −0.061SEC + 0.5860.255
Note: R a d j 2 represents the adjusted R-squared; HID refers to human interference degree; SEC refers to soil electrical conductivity.
Disclaimer/Publisher’s Note: The statements, opinions and data contained in all publications are solely those of the individual author(s) and contributor(s) and not of MDPI and/or the editor(s). MDPI and/or the editor(s) disclaim responsibility for any injury to people or property resulting from any ideas, methods, instructions or products referred to in the content.