1. Introduction
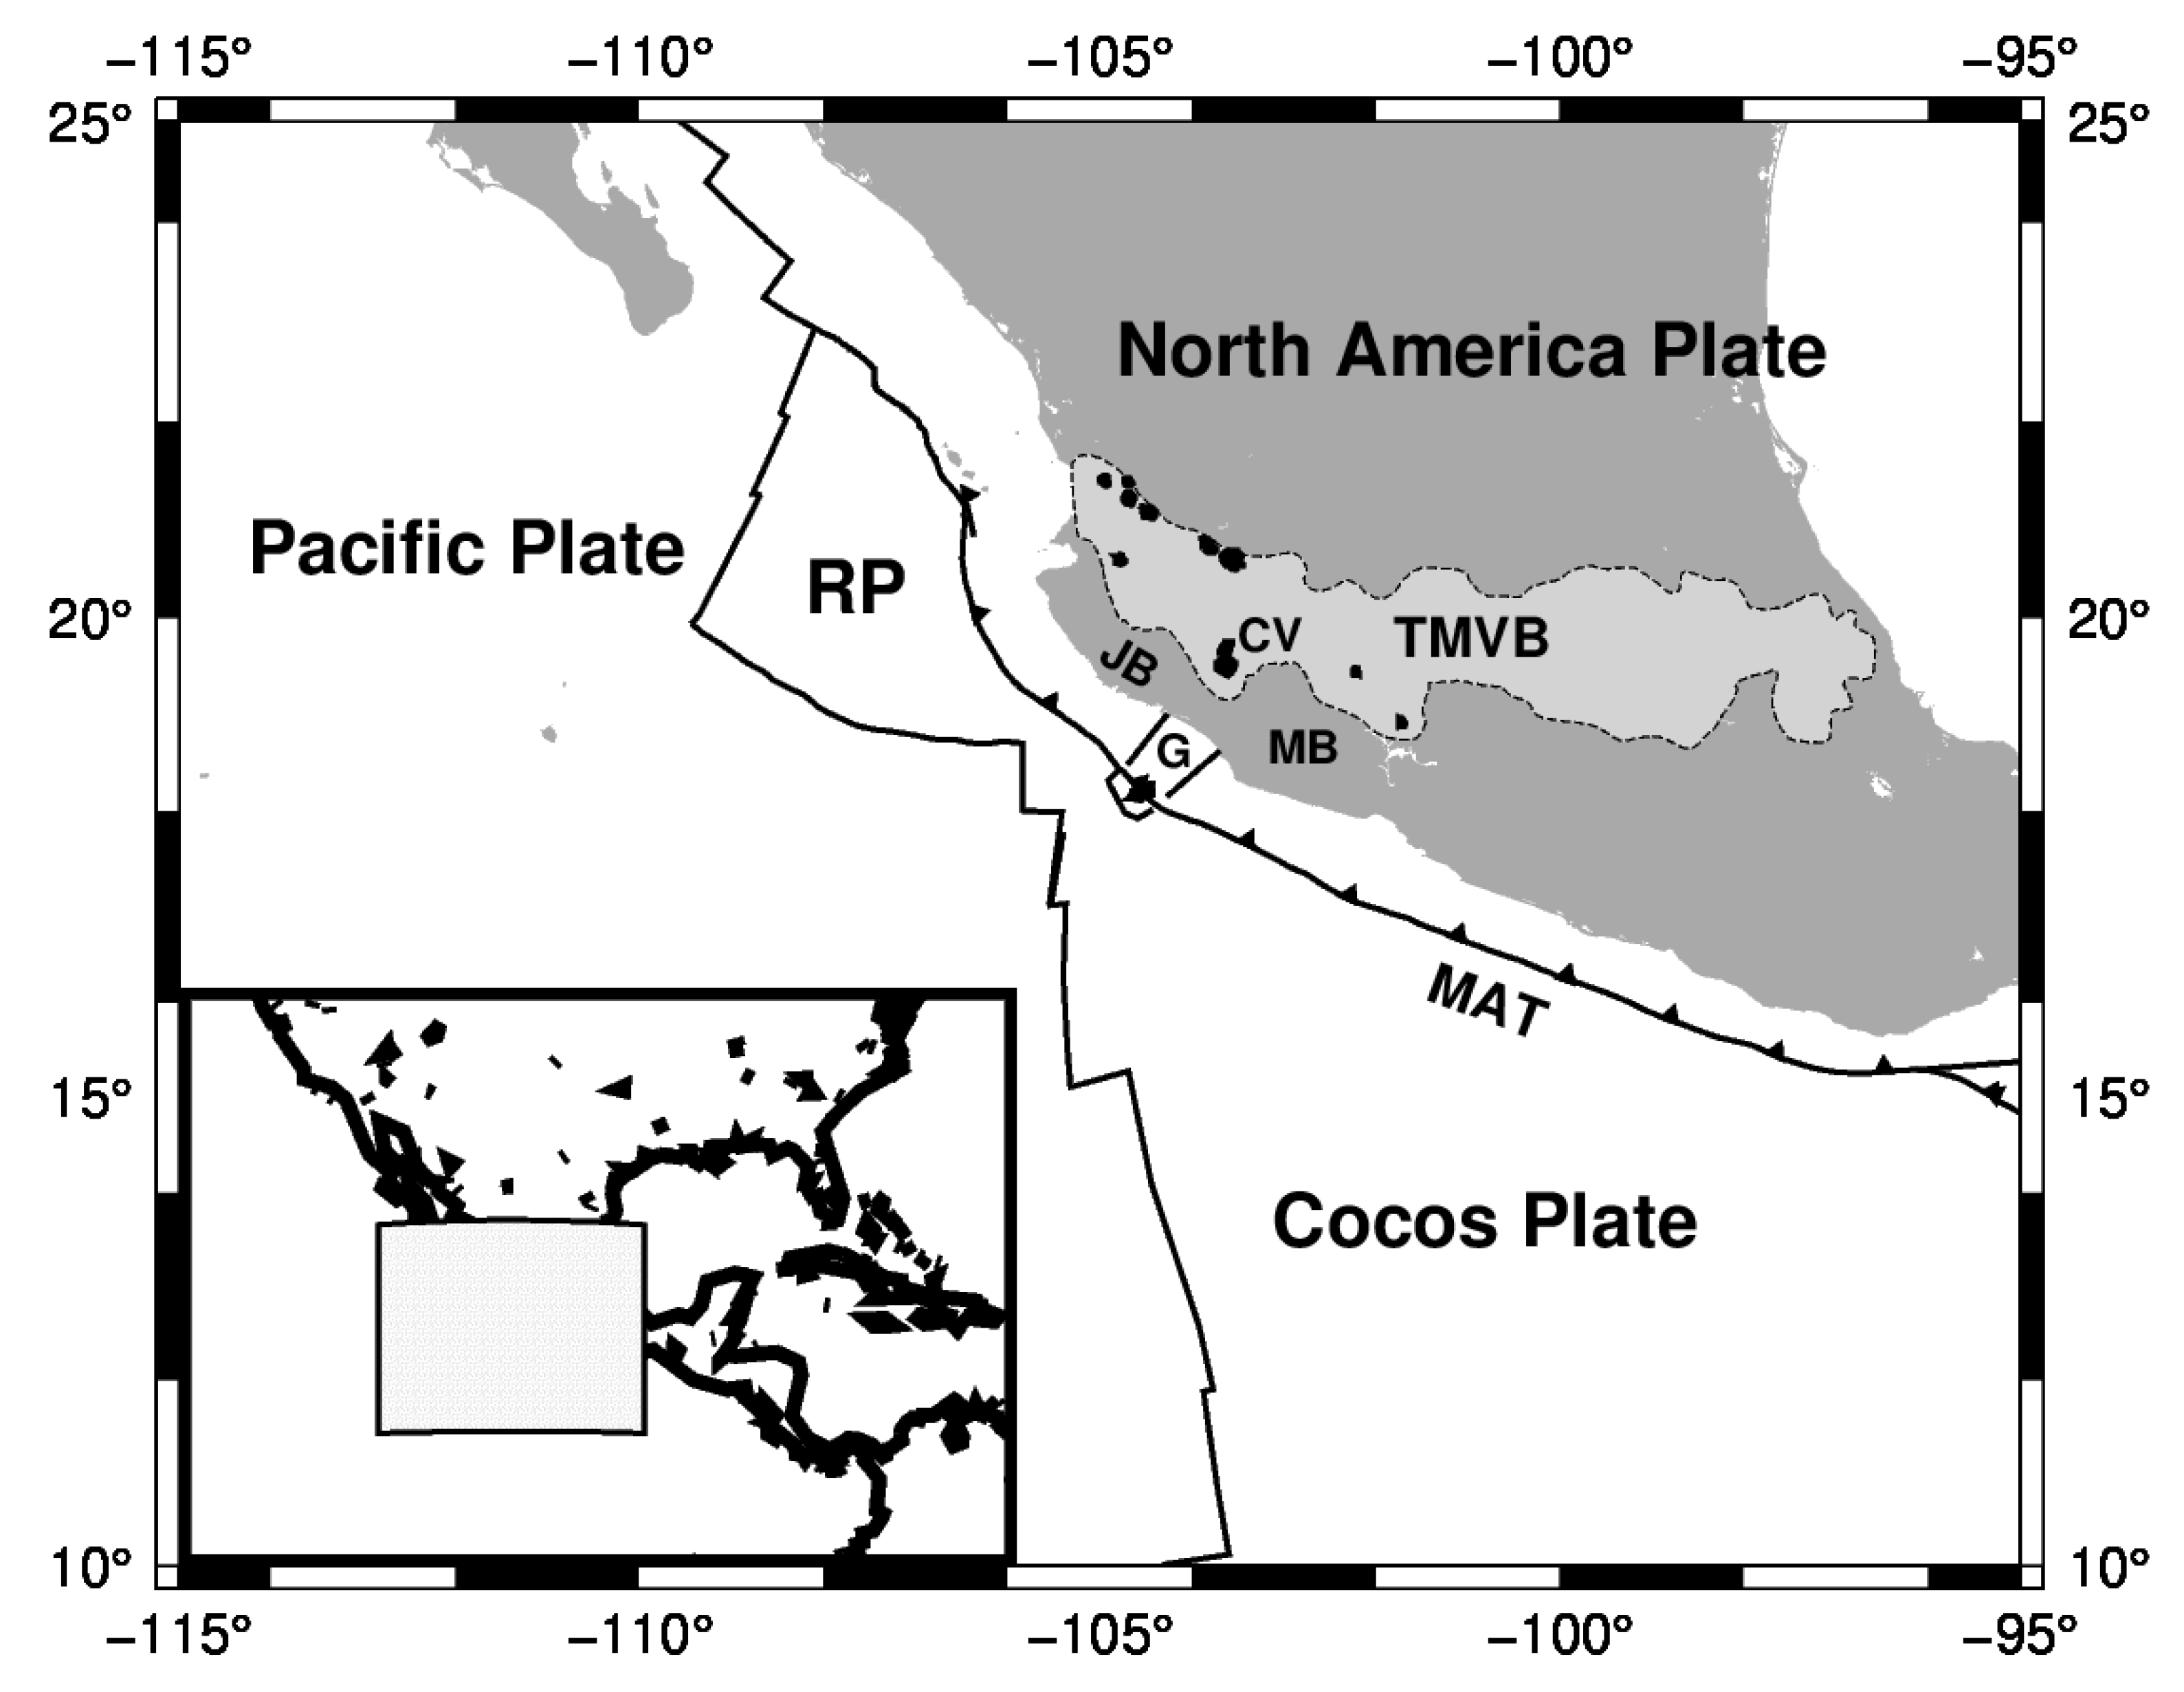
Western Mexico is a complex tectonic setting that involves subduction, volcanism, and continental rifting. In this region, the oceanic Rivera and Cocos plates subduct beneath the continental North American plate (
Figure 1), causing continental rifting [
1,
2], unusual volcanism [
3], and tearing of the subducting slabs [
4]. The Rivera plate is separated from the Cocos plate about 7–10 Ma, and both oceanic plates move with different relative velocities with regarding North America plate [
5]. Although the Rivera and Cocos slabs are well separated at depths below 150 km, the surface boundary is fuzzy [
4]. Seismicity studies show different dip angles for the subducting Rivera plates (∼
) and Cocos (∼
) plates near the Colima rift [
6]. There is also evidence that the Rivera subducting plate has been re-subducted [
7] and a clear gap between the Rivera and Cocos plates is present at depths below 150 km [
4]. Above the tip of this gap lies the Colima volcano in the Colima rift. Since the Colima rift and its offshore extension, El Gordo Graben, is an active tectonic feature, seismicity along its boundaries is recurrent.
Although the region is an active subduction zone, the presence of the Colima rift may induce large strike-slip earthquakes. The Jalisco and Michoacan blocks are separated by the Colima rift (CR). The Colima rift has been explained as passive rifting caused by the differential motion between the Rivera and Cocos slabs and their coupling with the dominant plate [
8,
9]. Active rifting of the CR as a consequence of the relocation of the East Pacific Rise has also been suggested [
1,
2]. The authors in [
10] proposed the existence of a mantle plume as an alternative explanation for CR. A southeastern motion of the Michoacan block with respect to the North American plate has also been suggested to explain the CR [
5,
11]. In this work, the possible effects of a strike-slip earthquake nucleated in the region of the Colima rift on the Michoacan block are evaluated.
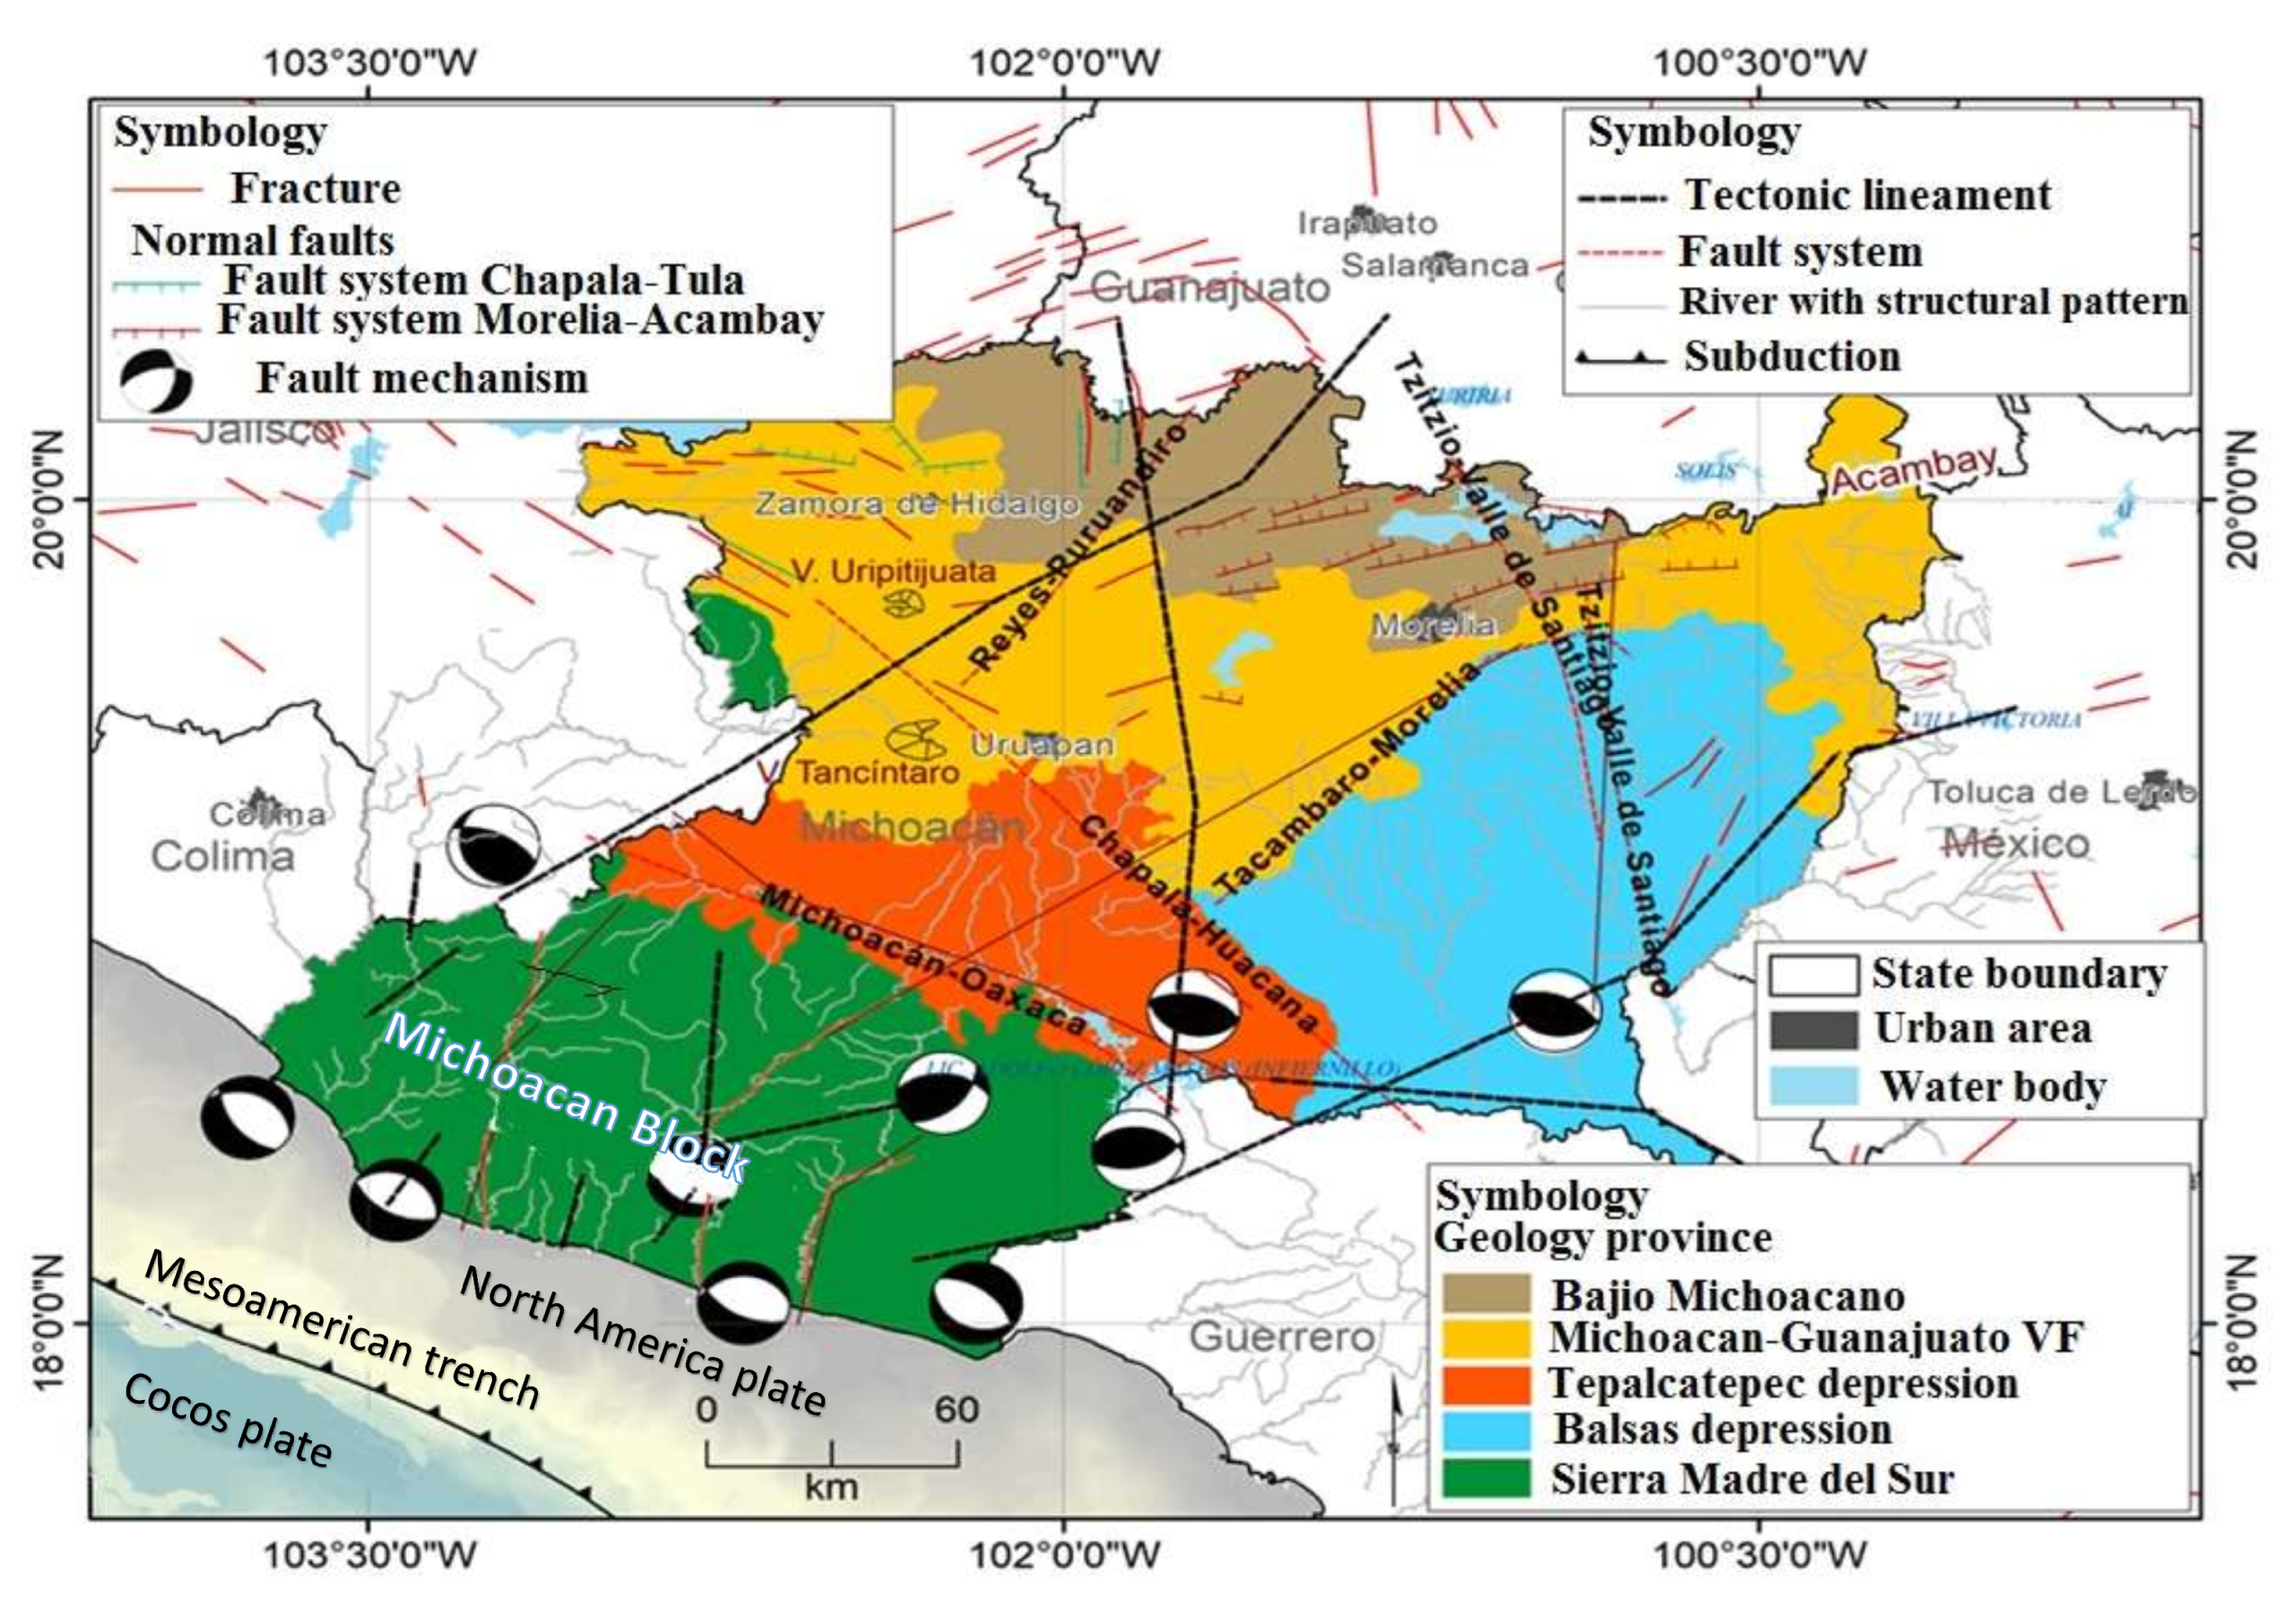
Five main geological provinces have been identified in Michoacan [
12]: the Sierra Madre del Sur, the Tepalcatepec Depression, the Balsas Depression, the Michoacan and Guanajuato Volcanic Field, and the Bajio Michoacano (
Figure 2). The Sierra Madre del Sur is composed of volcanic sedimentary sequences of the Guerrero terrain. These sequences are controlled by N-S and NO-SE structures and large magmatic bodies of 50 Ma. The NO-SE Tepalcatepec Depression presents Quaternary and Tertiary volcanic rock formations and Cretacic volcanic igneous and sedimentary rocks in Infiernillo dam. The Balsas Depression was formed by rock structures of the Guerrero terrain and has the influence of two large fault systems in the Guerrero–Michoacan limits. The Michoacan-Guanajuato Volcanic Field is composed of monogenetic volcanism and the felsic magmatism islands of Patamban, Tzirate, and Cerro la Nieve. The Bajio Michoacano is located in the northern part of Michoacan and has developed large lake basins by faulting or volcanic processes. This region is controlled by the E-O and NE-SO Morelia–Acambay fault system. These five geological provinces are controlled by morphostructural regions driven by fault systems related to the stress field [
13].
Although the tectonic features that generate the most prominent earthquakes in the state of Michoacan are defined by thrust fault earthquakes produced by subduction, there have been occurrences of lateral fault earthquakes produced in the Colima rift (CR) [
14]. The CR region, in the Colima-Michoacan limits, has been a zone of important seismicity. The Tecoman earthquake on 21 January 2003 (M = 7.4) is the largest seismic event of the present century [
15]. The magnitude to measure earthquakes is based on the moment magnitude of the earthquake widely used within the international research community, denoted by
. However, on 9 October 1995, the Manzanillo earthquake off the coast of Colima reached magnitude M = 8.0 [
16]. In this work, the analysis is based on the Empirical Greens’s functions method. The empirical Green’s functions were introduced by [
17], who studied the 1940 earthquake in the Imperial Valley using small earthquakes as empirical Green’s functions. Later, this method was reviewed by [
18,
19,
20,
21]. The empirical Green function method has the advantage of including path and site effects that are not considered by other prediction methods. This method is based on the consideration of the laws of spectral scaling between large and small earthquakes when they follow the
law [
22].
2. Data and Method
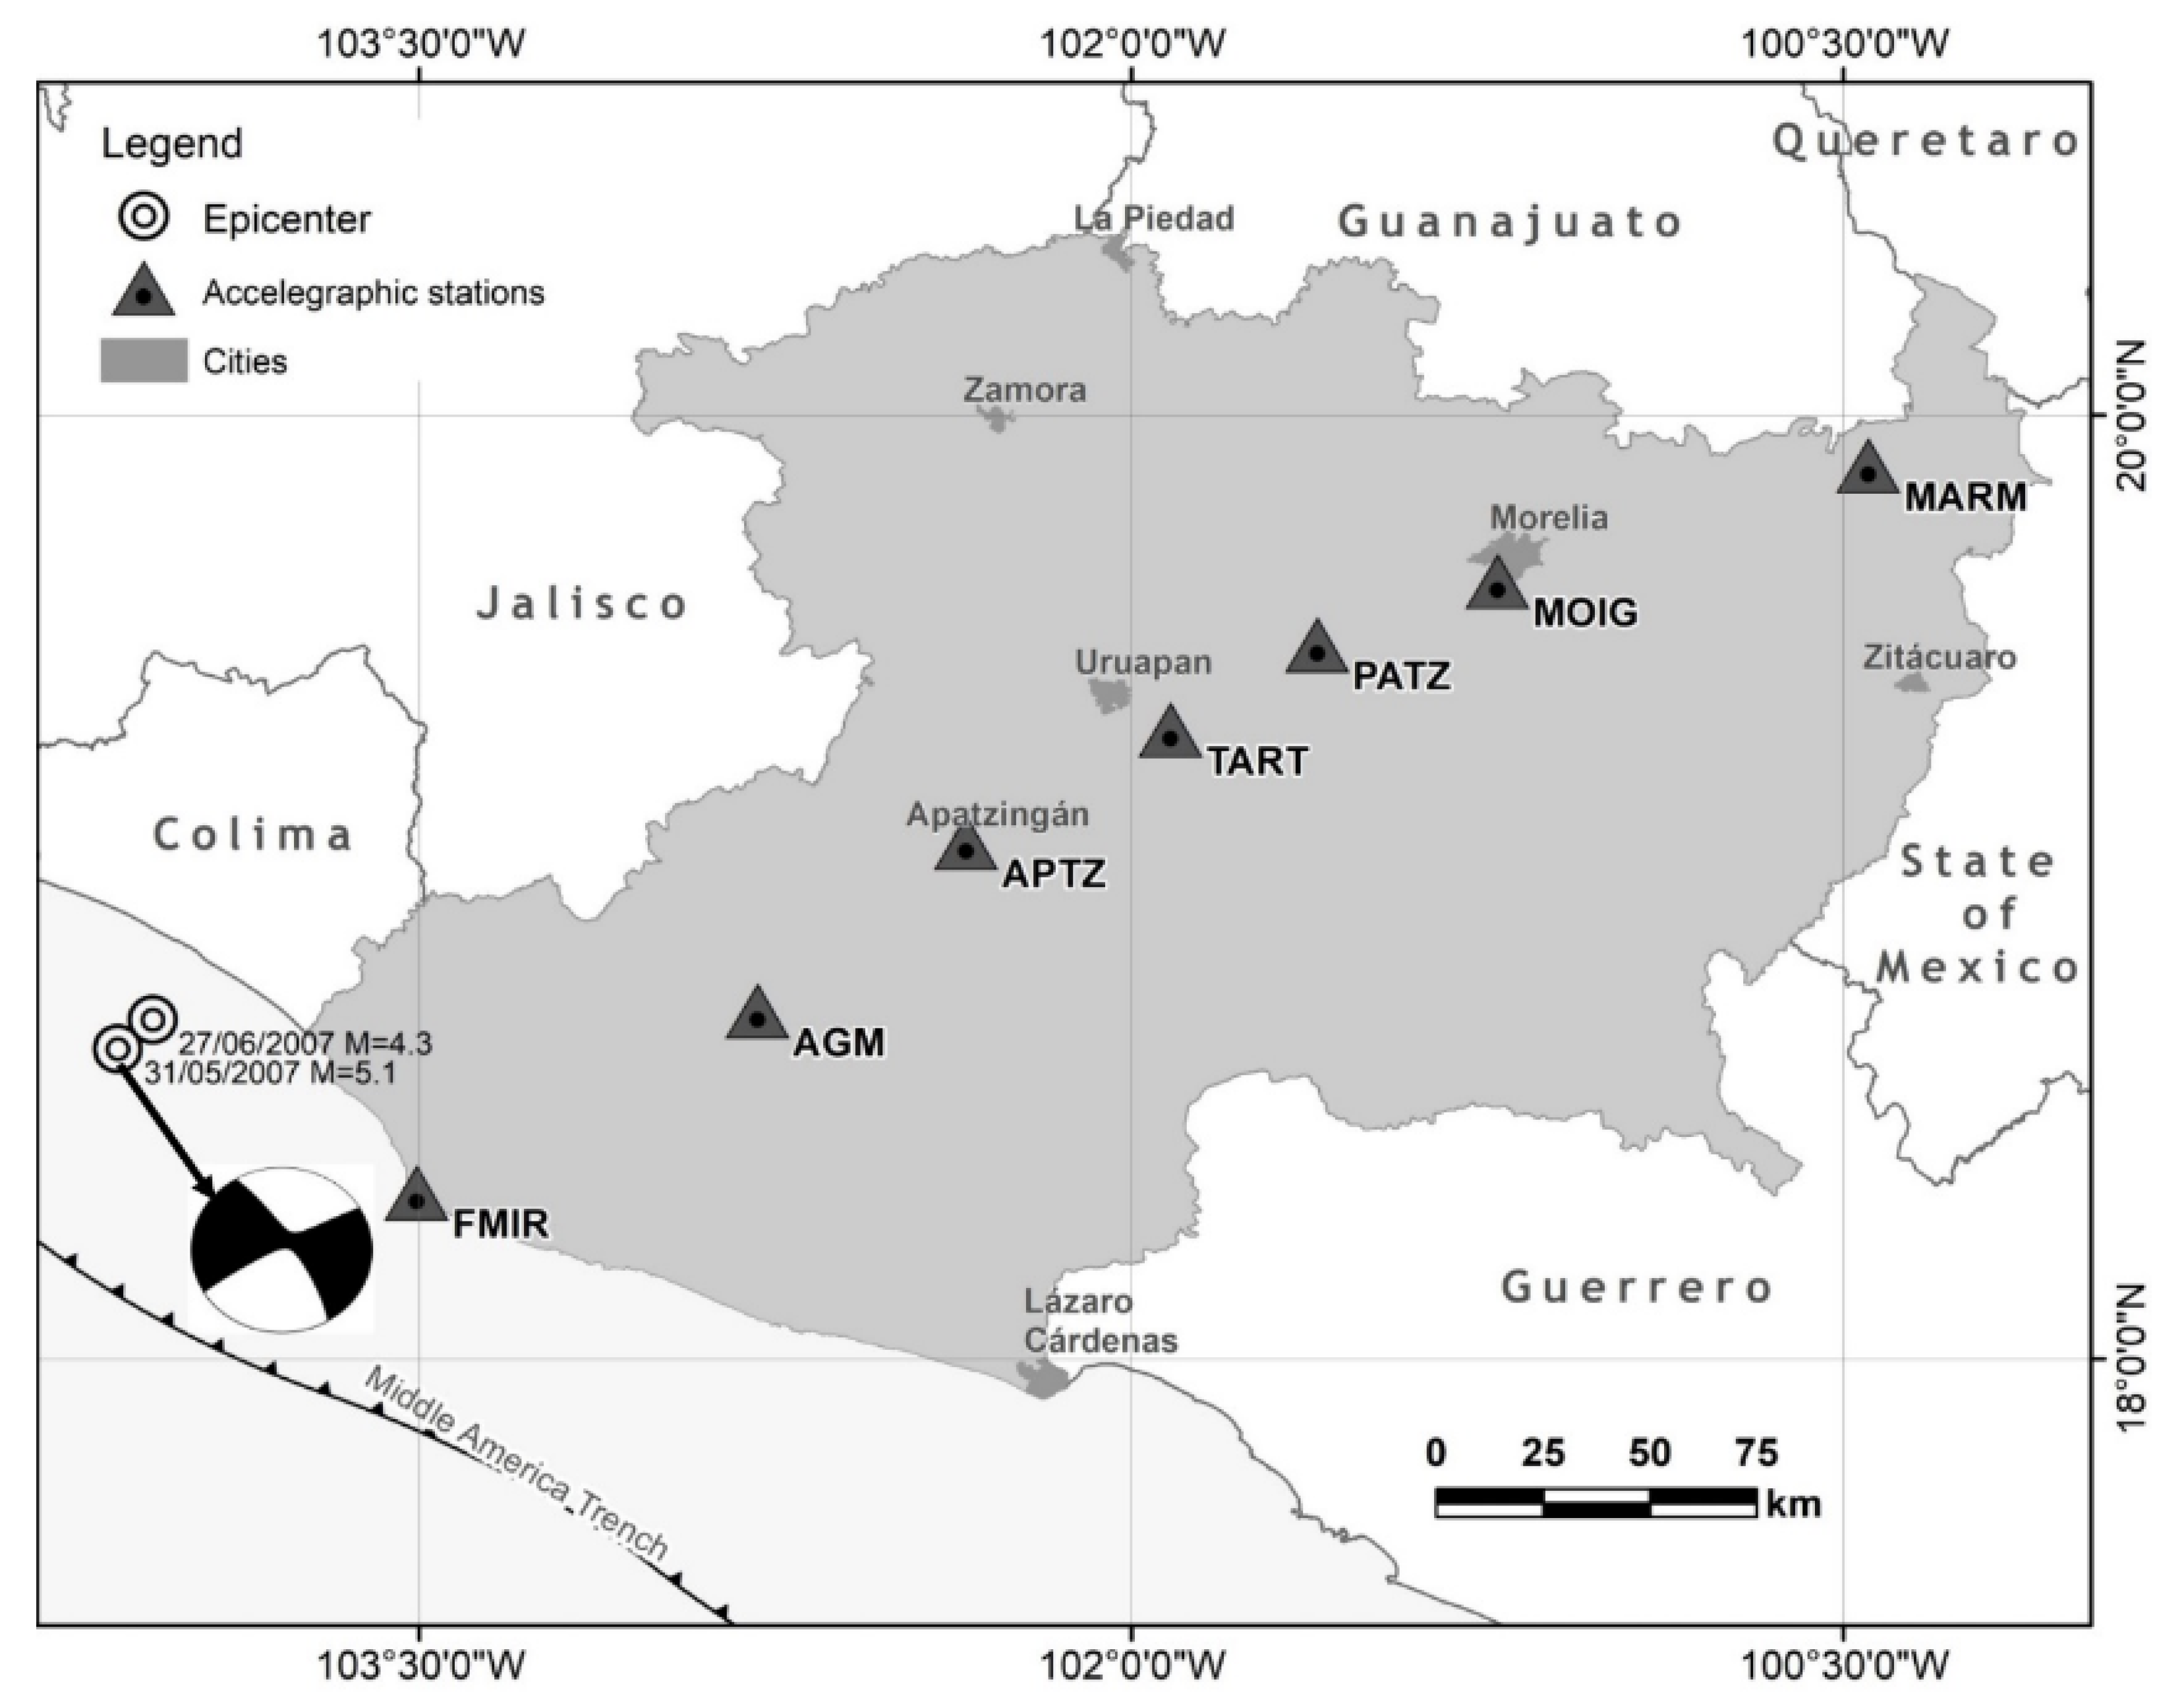
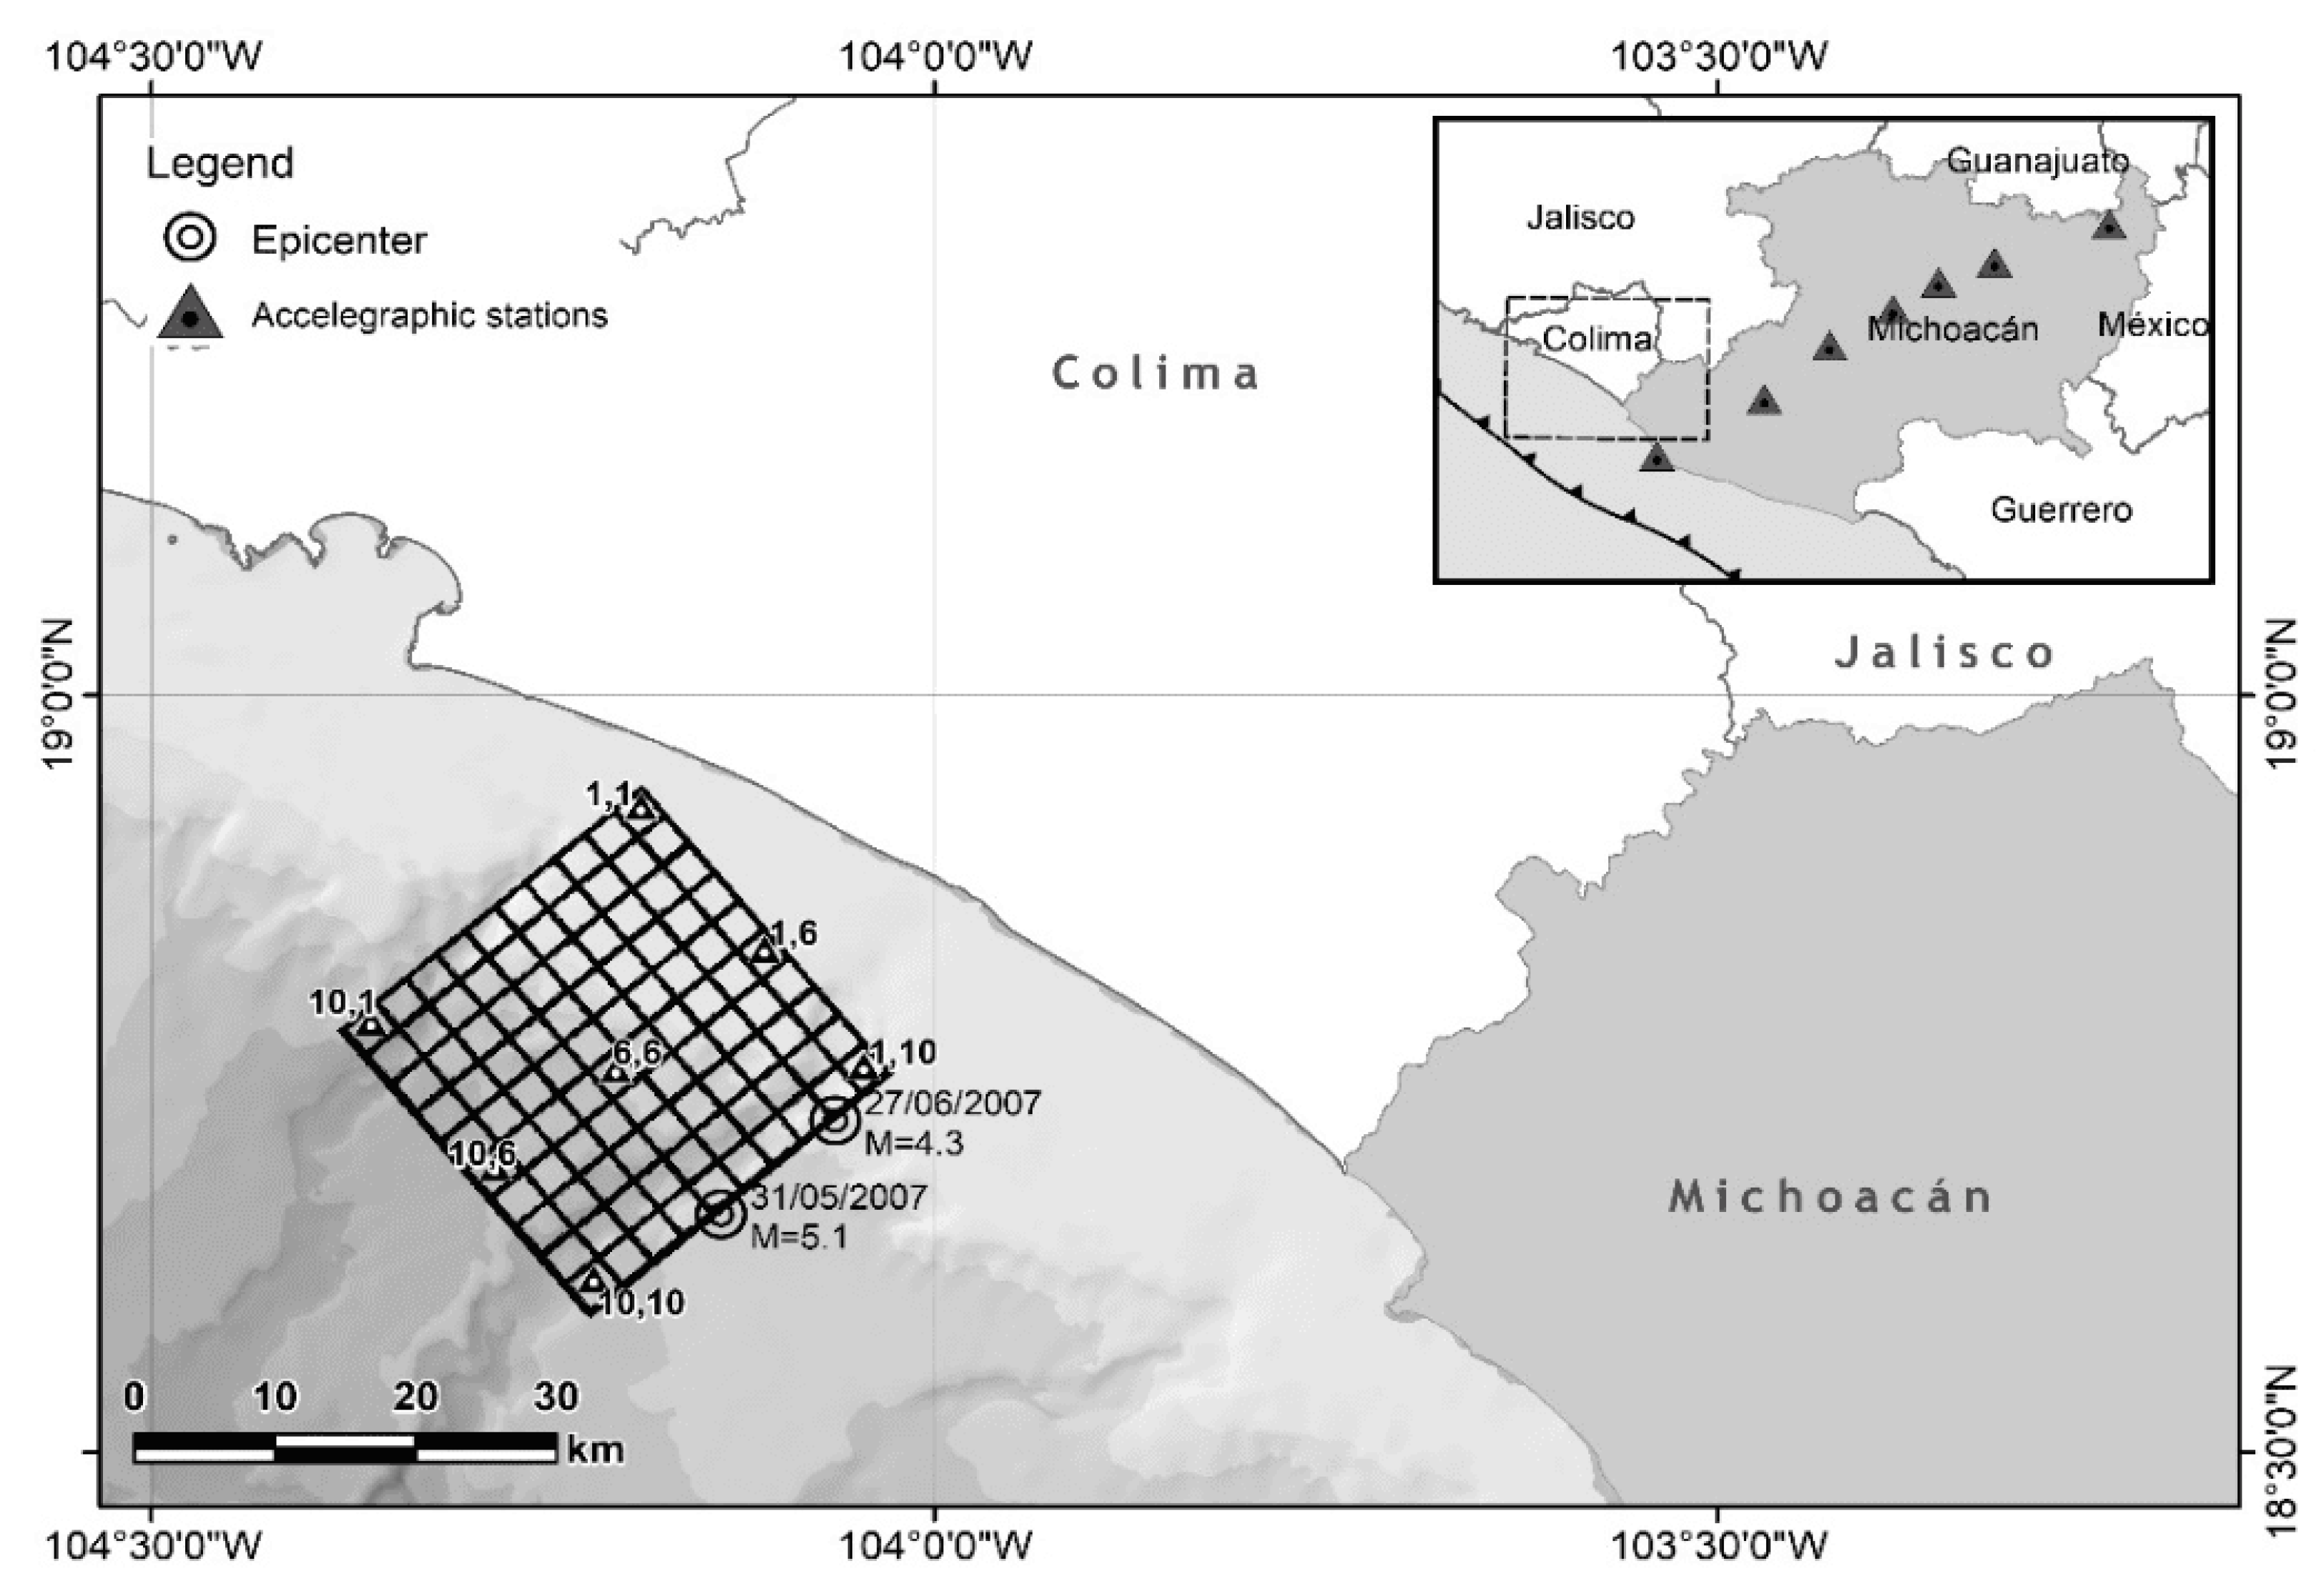
The data set used in this study was provided by a temporal network of 7 accelerograph stations installed in Michoacan state, western Mexico (
Figure 3). The stations were installed at the following locations: Faro de Brucerias (FMIR), Aguililla (AGM), Apatzingan (APTZ), Taretan (TART), Patzcuaro (PATZ), Morelia (MOIG) and Maravatio (MARM). The seismic array formed a nearly perpendicular line to the subduction trench with a total length of 366 km (
Figure 3) with a distance between successive stations between 60 and 80 km.
The method is based on the superposition of events of a small magnitude, as proposed by [
21]. The recording of small and larger nearby events is assumed following the
spectral model with constant stress drop [
21]. Under these assumptions, the number of necessary sub-events,
, is obtained from the ratio of the seismic moment of a large earthquake to the seismic moment of the small event. Ref. [
20] showed that
is equal to the number of subfaults
where each sub-fault is divided by
and
segments in the strike and dip directions, respectively.
is the number of time steps in the process. According to [
22,
23], the scaling laws imply that
and
where
and
are the seismic moments,
and
are the flat levels of the displacement spectra,
and
are the flat levels of the acceleration spectra of the mainshock and the small event, respectively. The synthetic motion of the large earthquake
is given in terms of the observed motion of the small earthquake
by the convolution
where
where
r is the hypocentral distance of the small event,
is the distance between the station and the point
at the fault element of the large earthquake,
is the sum of delay times from the starting point of the rupture element
to the observation point,
is the rise time of the small event. In order to avoid spurious periodicities [
21], an integer
is introduced, which is adequate to move the fictitious periodicity
into a high-frequency outside the frequency range of engineering interest.
is a filter introduced to adjust the difference between the time and dislocation of the large and small earthquakes.
The empirical Green’s function is modified to use a small earthquake motion with a different stress drop from the large event. This difference is corrected by introducing a constant,
C
where the subscripts
and
stand for small earthquakes and large earthquakes, respectively. However, when the spectral level is affected by the same factor
C, the Equations (
2) and (
3) are modified by [
24]
and
The Equation (
4) is modified replacing
by
and
N by
N [
25]
Since the hypothesis that a small earthquake (M 4.3) can be used as an empirical Green’s function as a seed of a large event (M 5.1), under the assumption of equal focal mechanisms and a tendency, then an autosimilarity in the rupture dynamics and in the energy distribution is expected. This means that, even though the magnitude and the total release of energy are different, the spatial distribution of energy (especially in zones of strong motion generation, or SMGA) and the rupture dynamics (as the rupture velocity and rising time) keep properties that can be scaled by corrective parameters such as the C constant and the N parameter in the model.
The empiric Green’s function method depends on the seismic moment
, which is extracted from the frequency spectra. Although some other magnitude scale could be used, the magnitudes depending on the seismic moment do not change the results of the inferred PGA or GPV. A new global magnitude based on the seismic moment was recently proposed, the Das Magnitude [
26,
27], which slightly lowers the value of the magnitudes with respect to moment magnitude. Although this new scale could replace in the future the moment scale, since the results on the overall paper do not rely on magnitudes, but on seismic moment, the use of Das magnitude at the moment was not considered necessary to achieve the goal of this research.
However, the validity of these assumptions is limited by the constraint that the frequency scale of the correction (1–10 Hz) captures the characteristics of the seismic source [
28], the authors mention that small variations in parameters such as rupture velocity, location, and size of the SMGA have a strong impact on synthetic recordings. This means that there is a need to adjust the parameters with precision to properly describe a large earthquake.
3. Results
Two events recorded by the network were selected for this study. Their epicenters were off the coast of Michoacan in May 2007 (
Figure 3). The small event (
) occurred on 27 June 2007, and the large earthquake (
) occurred on 31 May 2007. To calibrate the model, the large-magnitude earthquake was simulated using the small-magnitude event. Based on the focal mechanism of the large earthquake determined by Harvard CMT [
29], and according to the epicenter localization, the second fault plane solution was considered (strike =
and dip =
). Please note that this source mechanism was not a thrust fault associated with the subduction but was a left-lateral displacement mechanism.
From the observed ratios, the values
and
were obtained at low frequencies, which yields an approximate value of
. Then,
,
, and
are obtained, and a constant stress ratio drops
. Taking the adjusted value of the flat levels and correcting for parameters such as stress drop, momentum, and wave velocity of S, an estimated area of 0.42 × 0.42 km
2 was obtained for the M 4.3 earthquake. For the M 5.1 event, it was taken
,
, and
with
km/s for an area of
, which gives a dislocation area of 1.26 × 1.26 km
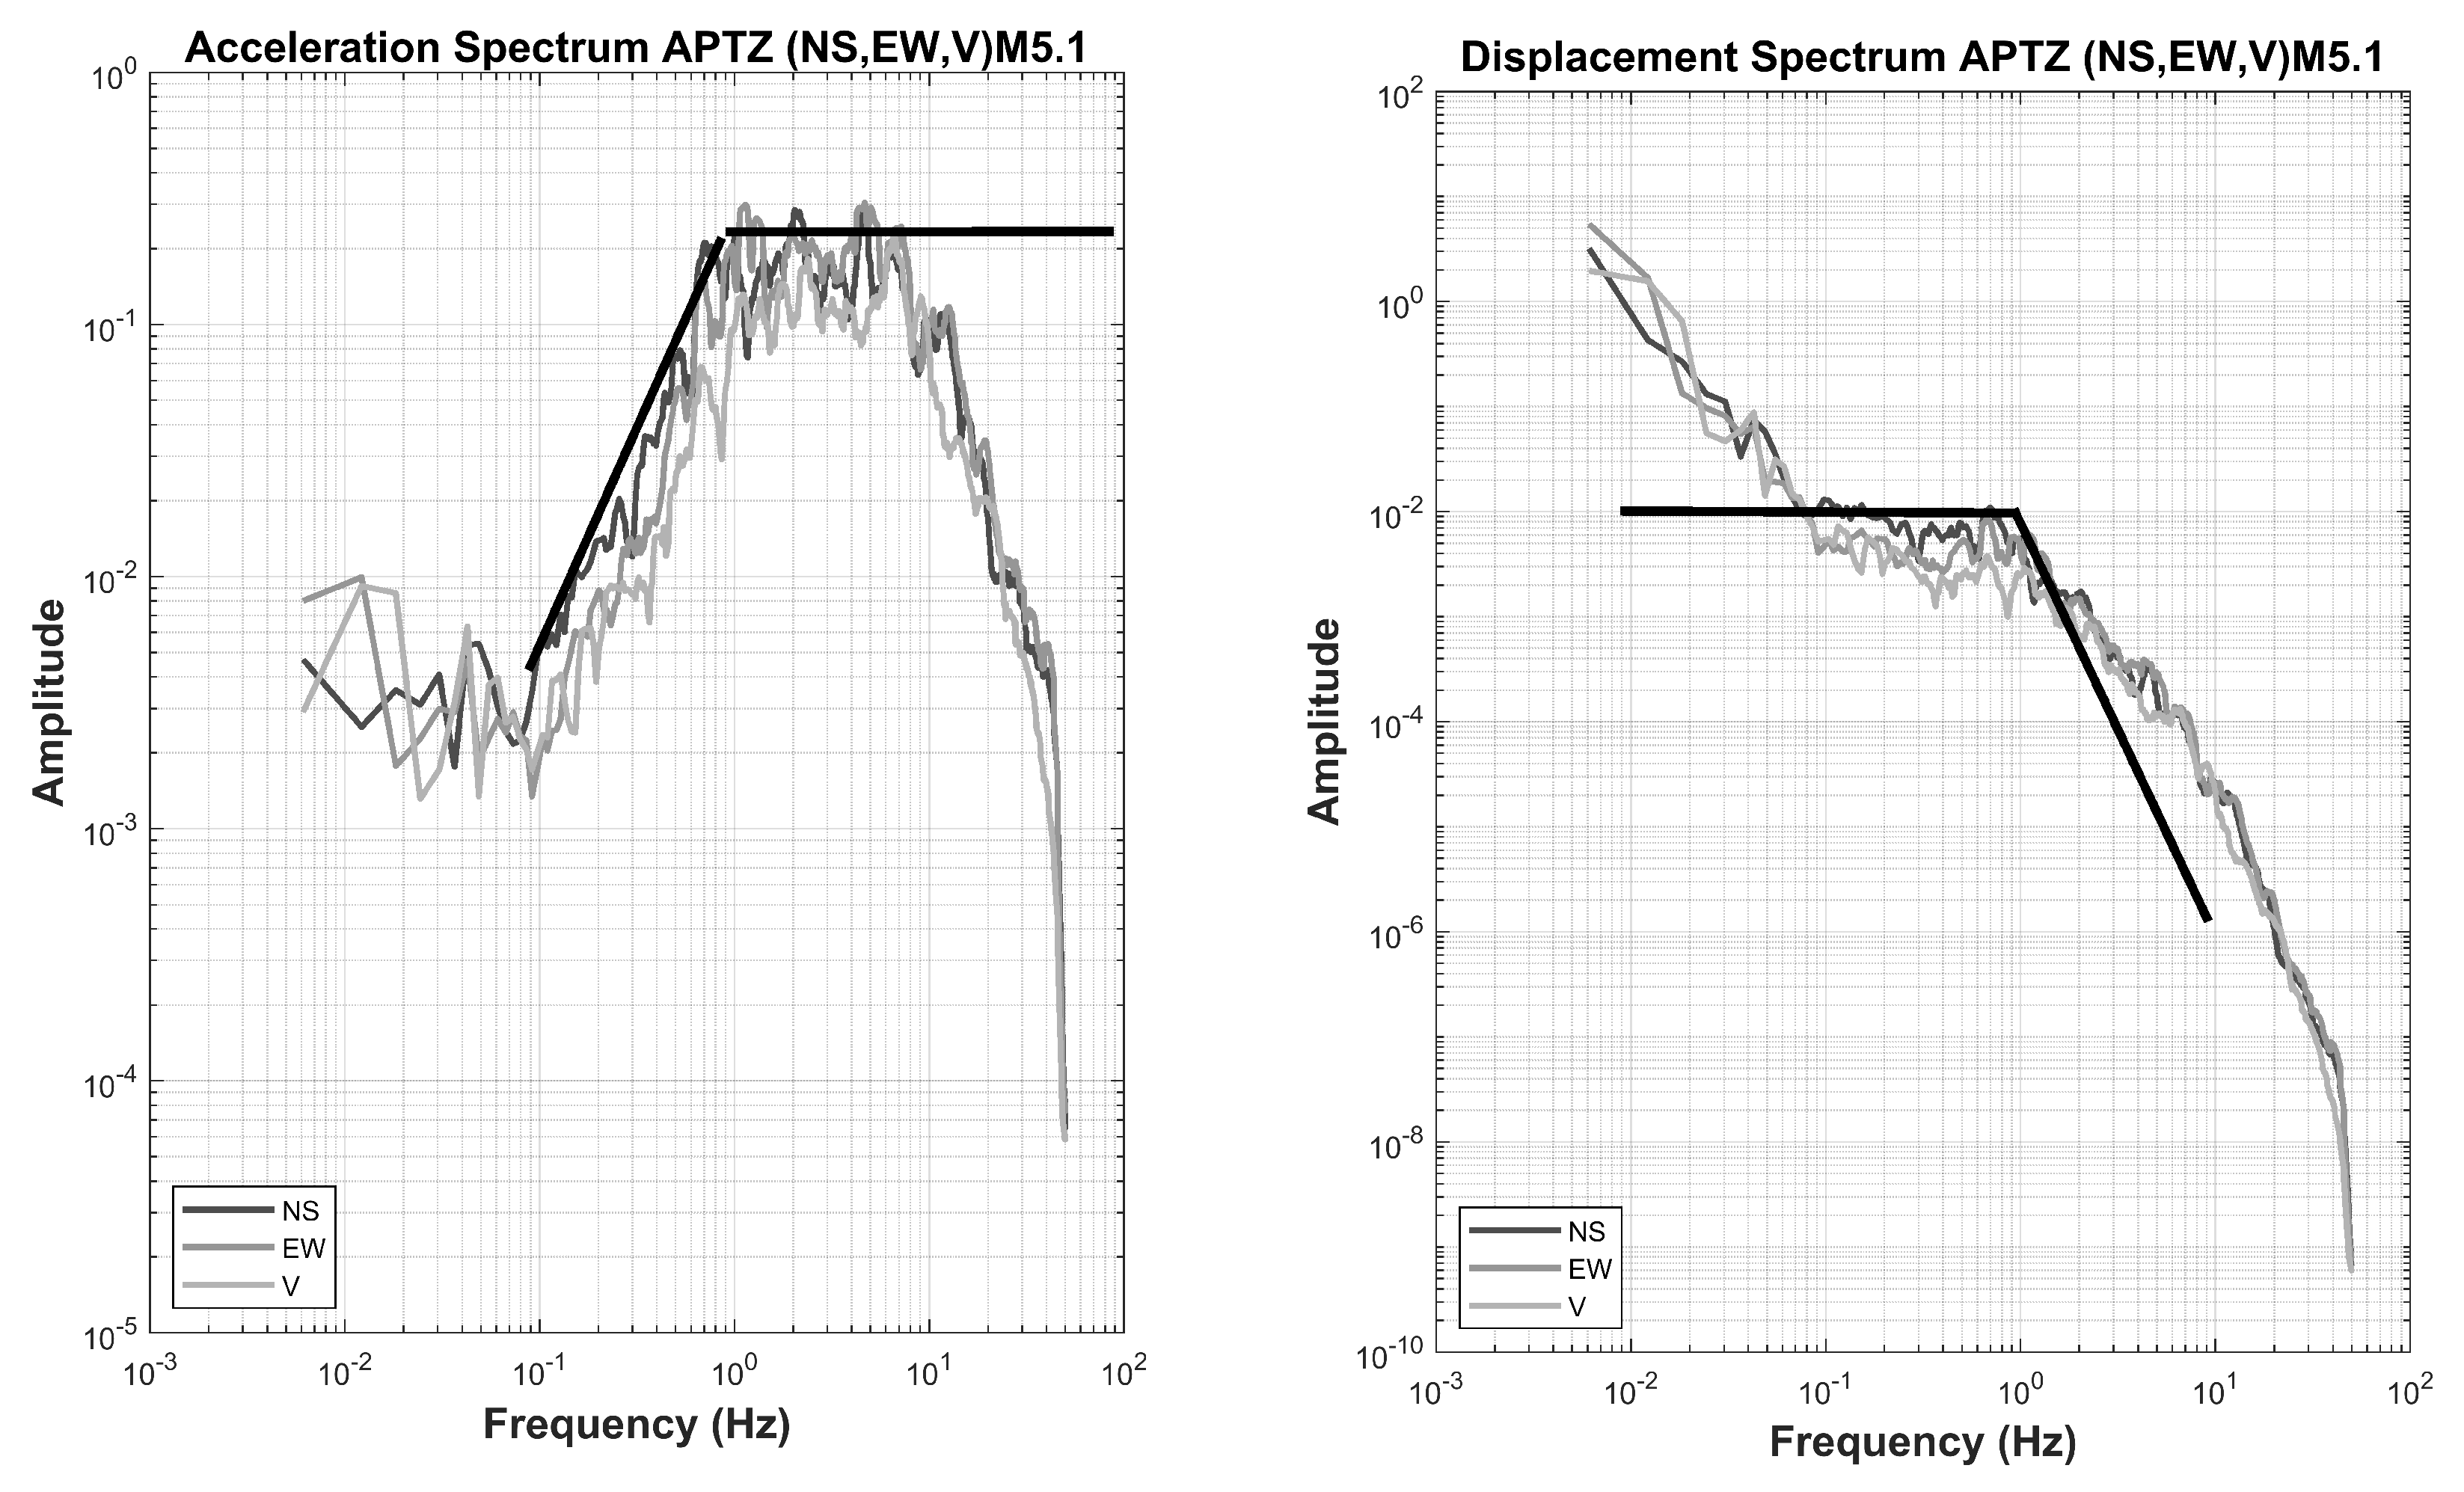
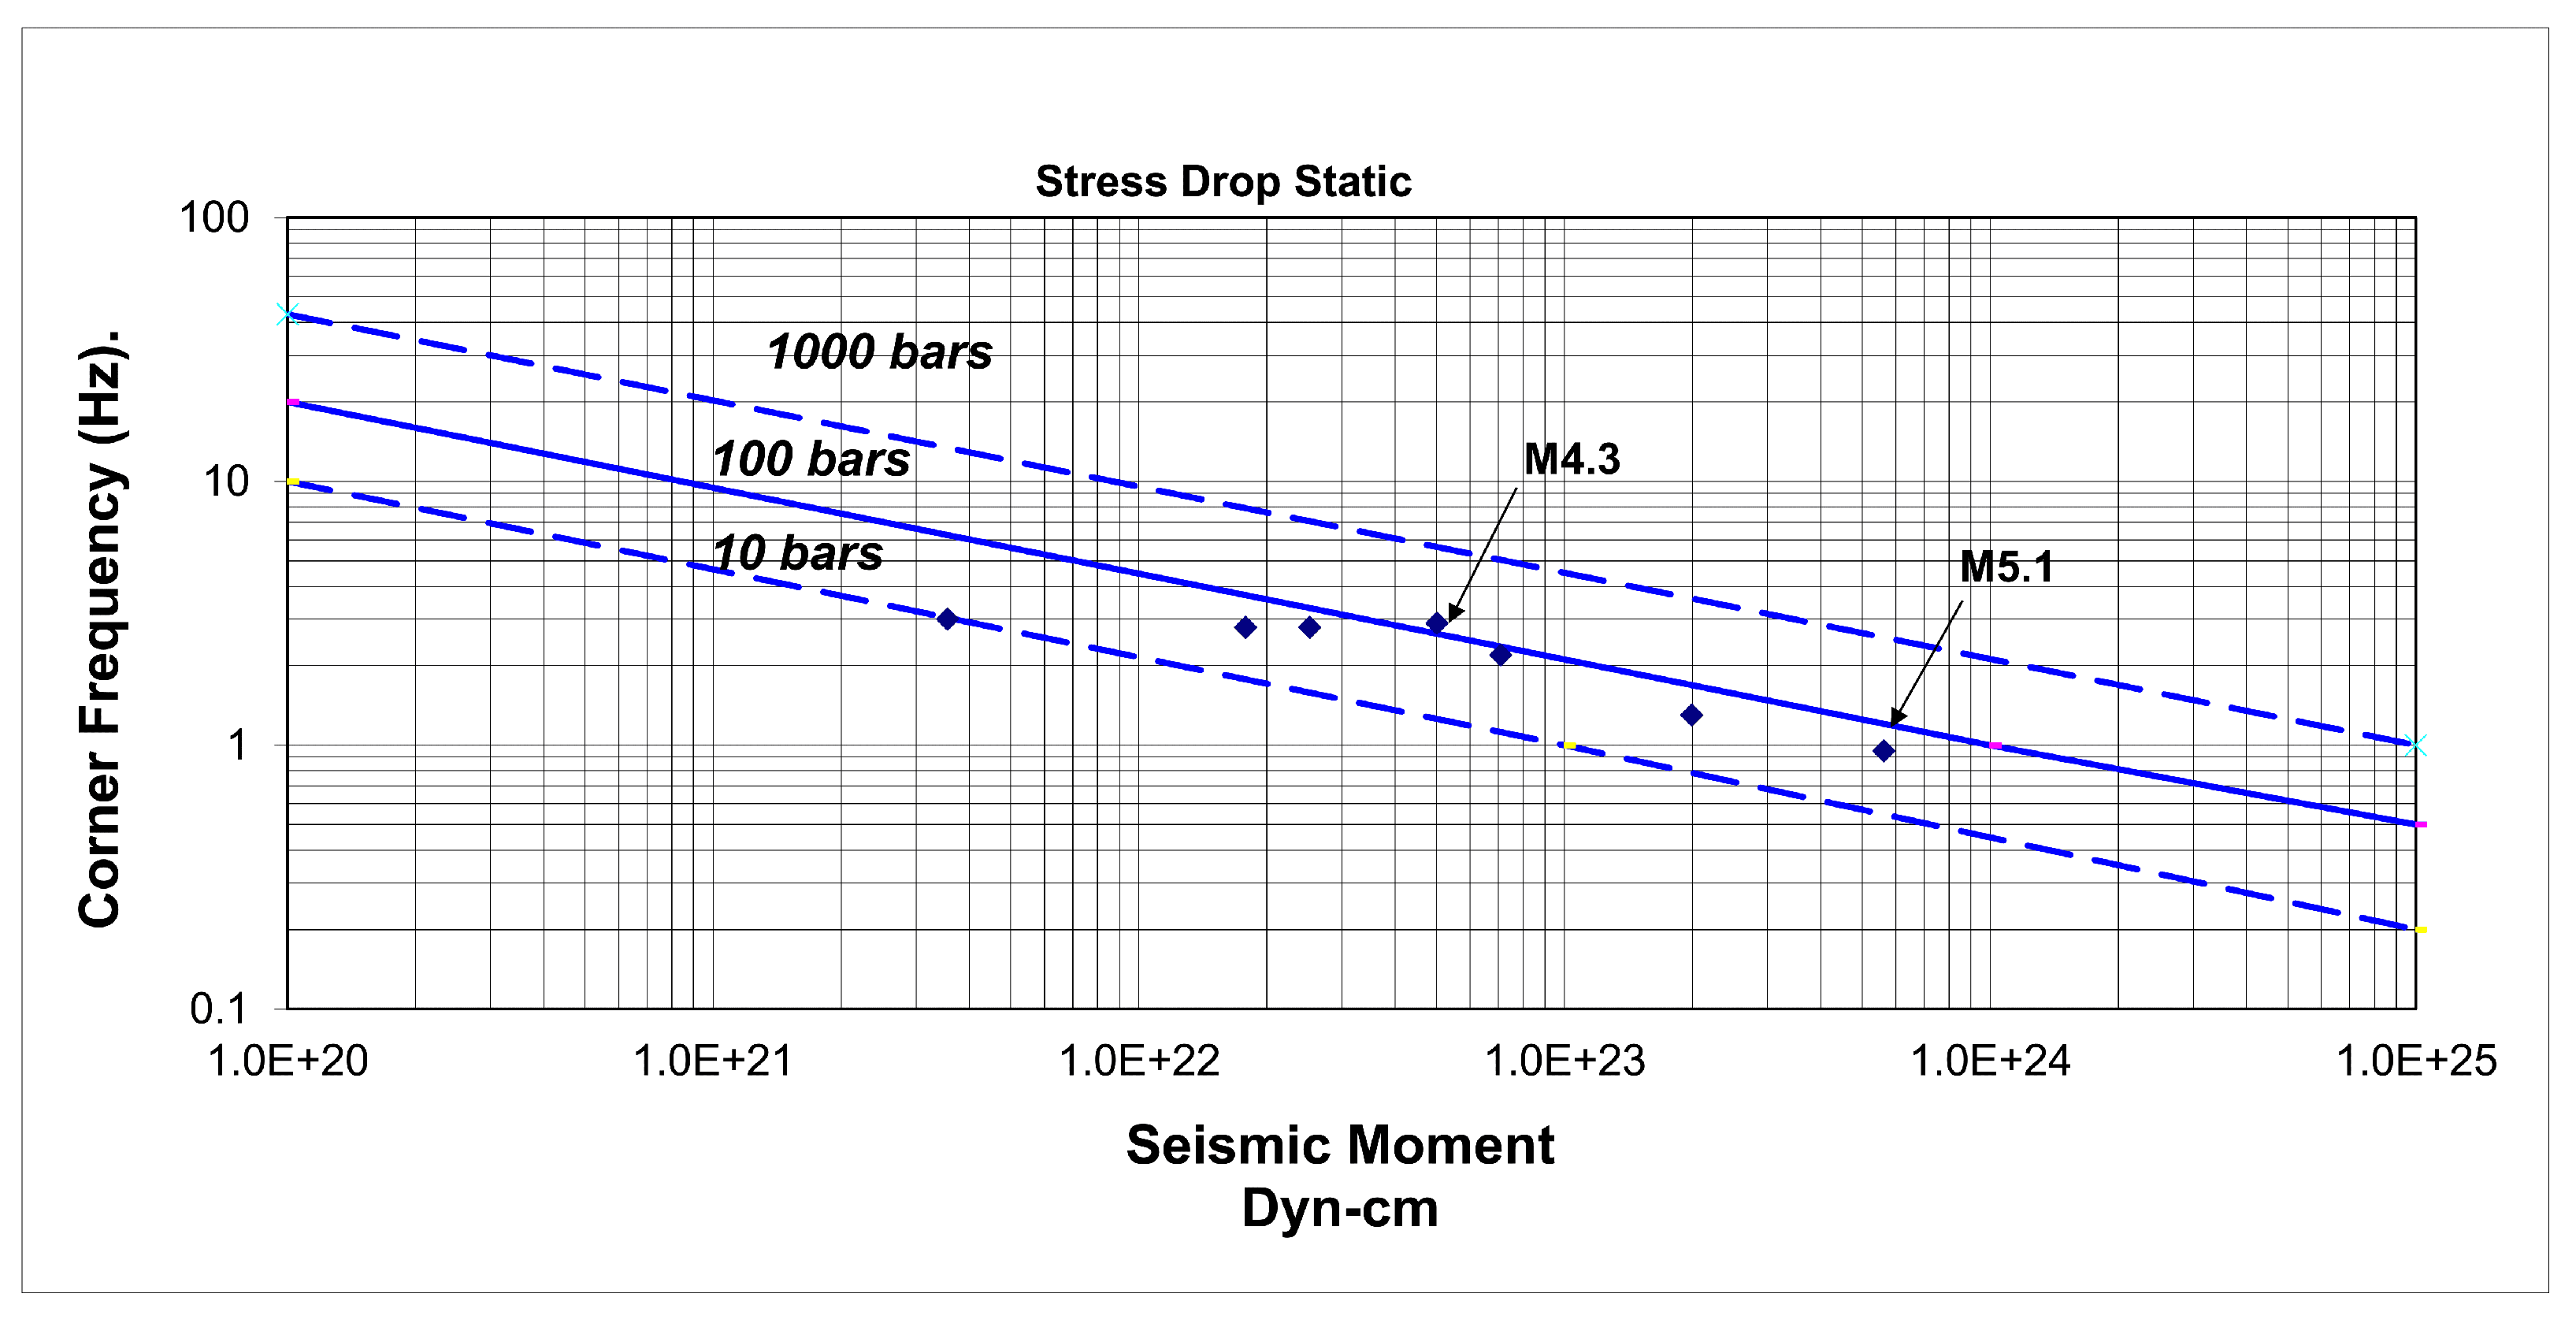
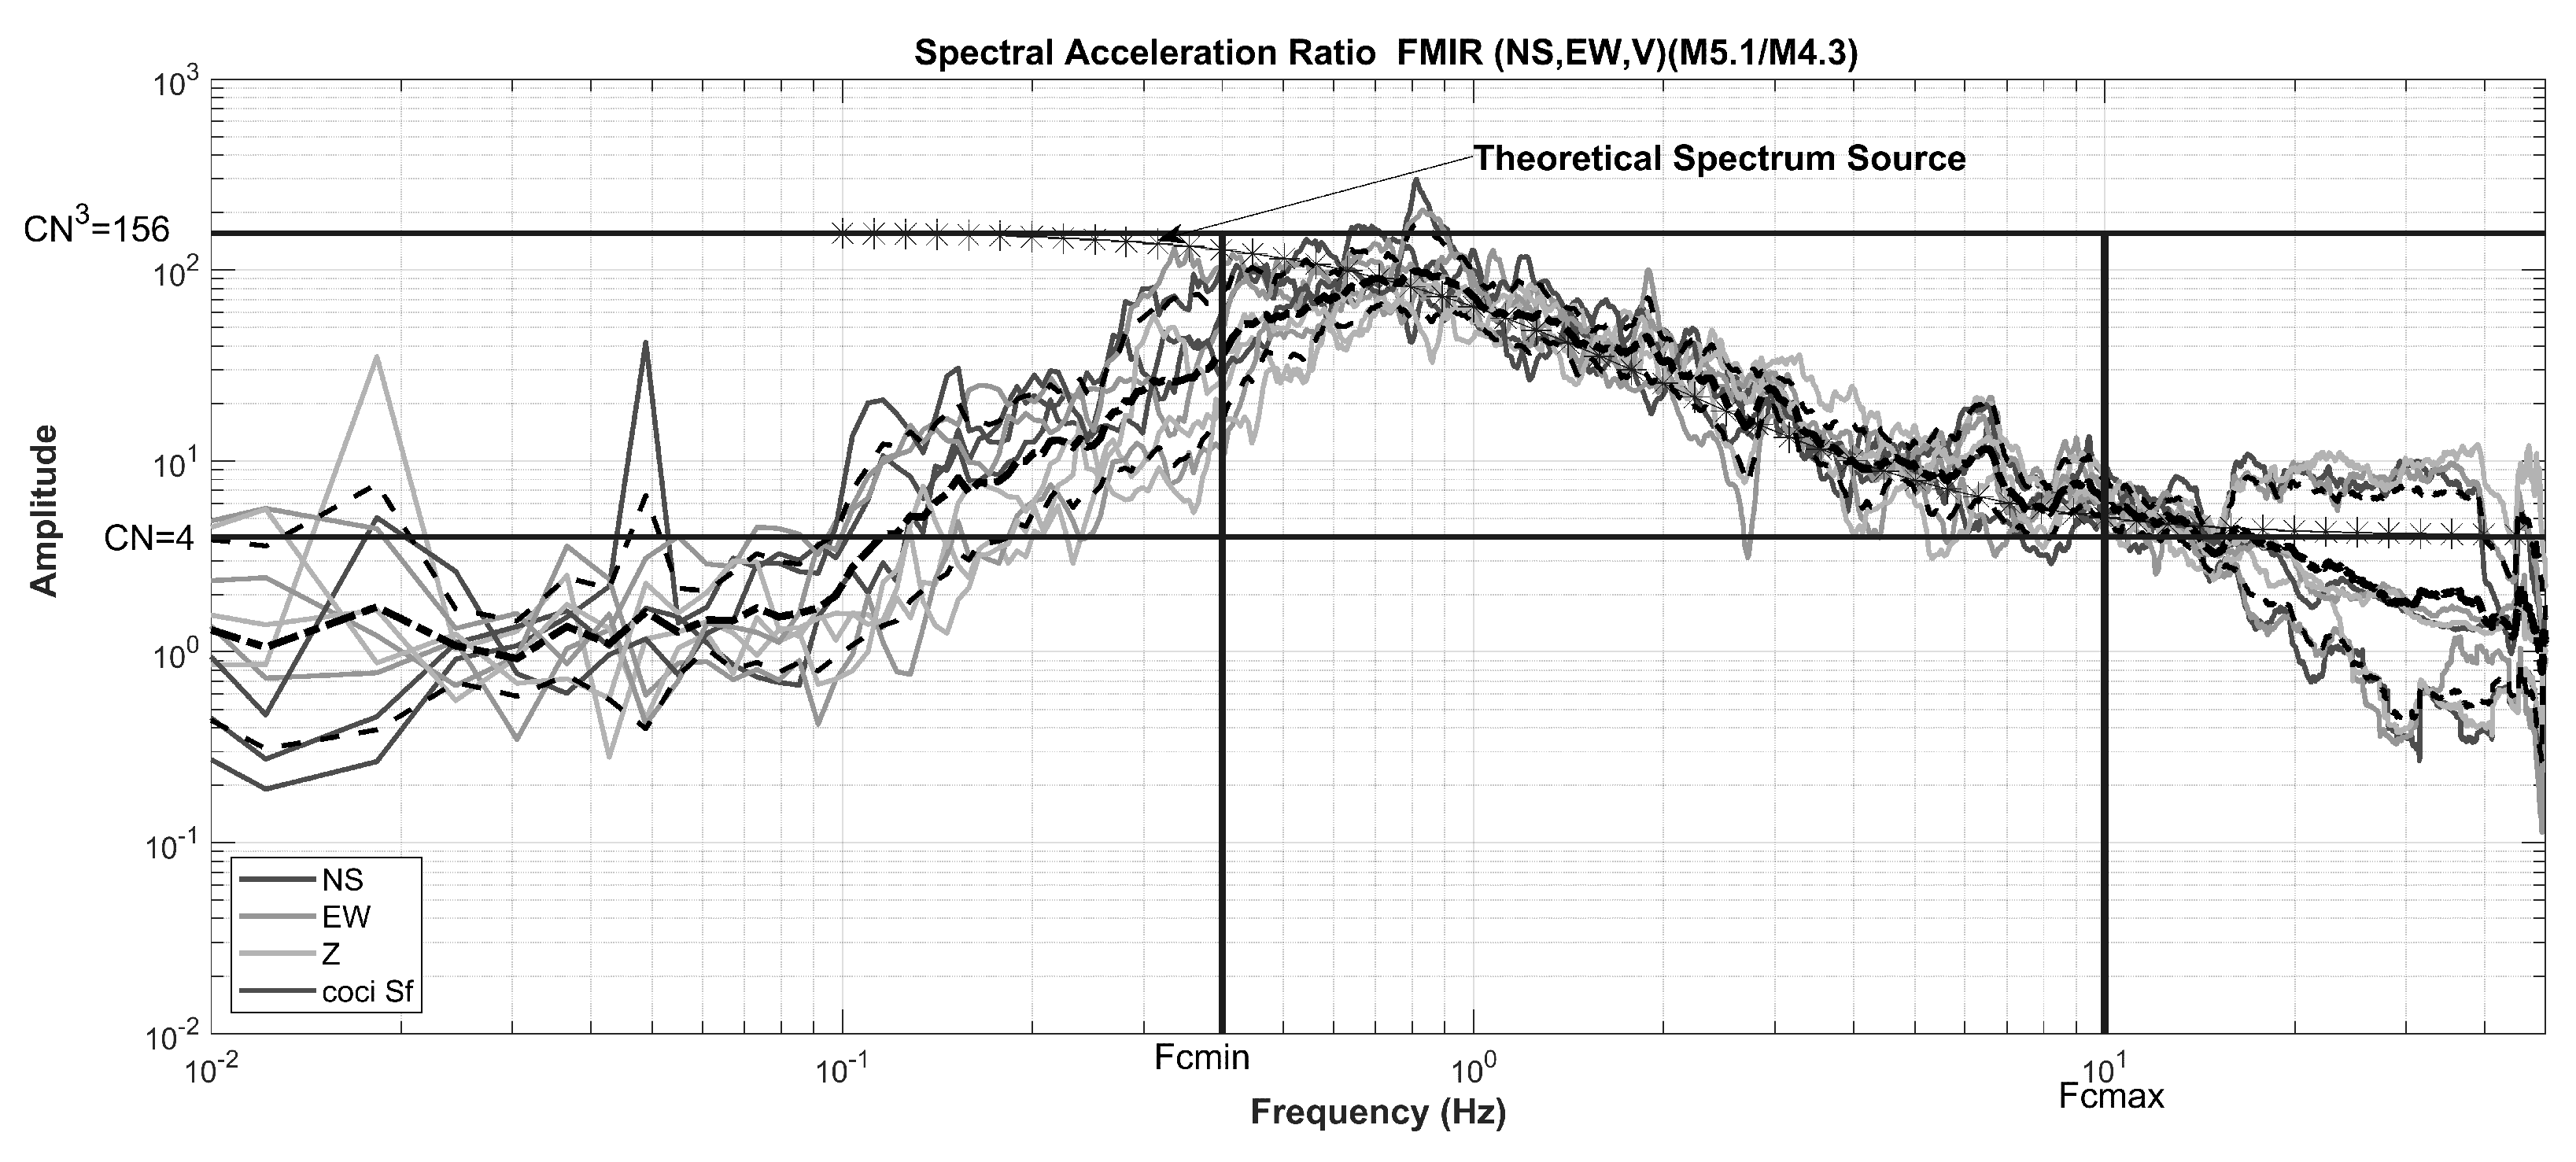
2. Based on the analysis of the acceleration and displacement amplitude spectra, the corner frequency was determined (
Figure 4) and compared with the corner frequencies estimated by [
30],
where
is the displacement spectrum,
is the spectral level at low frequencies, and
is the corner frequency. As can be seen in
Figure 5, the resultant stress drop for this earthquake agreed with most of the Mexican coastal earthquakes that show the 100 bar stress drop, even when this event was not a thrust faulting earthquake [
31].
The corner frequencies,
, and the stress drop,
, were estimated from the flat levels of the acceleration spectrum (at high frequencies) and displacement spectrum (at low frequencies). Starting from relations (
2) and (
3), the parameter
N was estimated from the acceleration and displacement spectral ratios between large and small earthquakes (see
Figure 6). Estimation of
N and
C is obtained by simultaneously solving Equations (
7) and (
8) with flat levels at low and high frequencies (see
Figure 6).
From the spectral ratio, a value was obtained for low frequencies and for high frequencies. In this case, an approximate value of was given and the value for the different stress drops is . Given these values and the initial conditions for the large event, it was assumed that the fault had subfaults with an area of 2.52 × 2.52 km2. With these values, the estimation and calculation of the other parameters, such as the rupture velocity, the rise time, and the initiation point of the fracture, are possible by variation of these parameters.
Corner frequencies, as well as displacement and acceleration spectra, were graphically and theoretically estimated by considering the average value in the modeling. In order to simulate the acceleration recordings of the main shock, other parameters had to be varied, such as the rupture velocity, the rising time, and the rupture initiation point. The method shows a high sensitivity to the rupture velocity and its location in the fault plane.
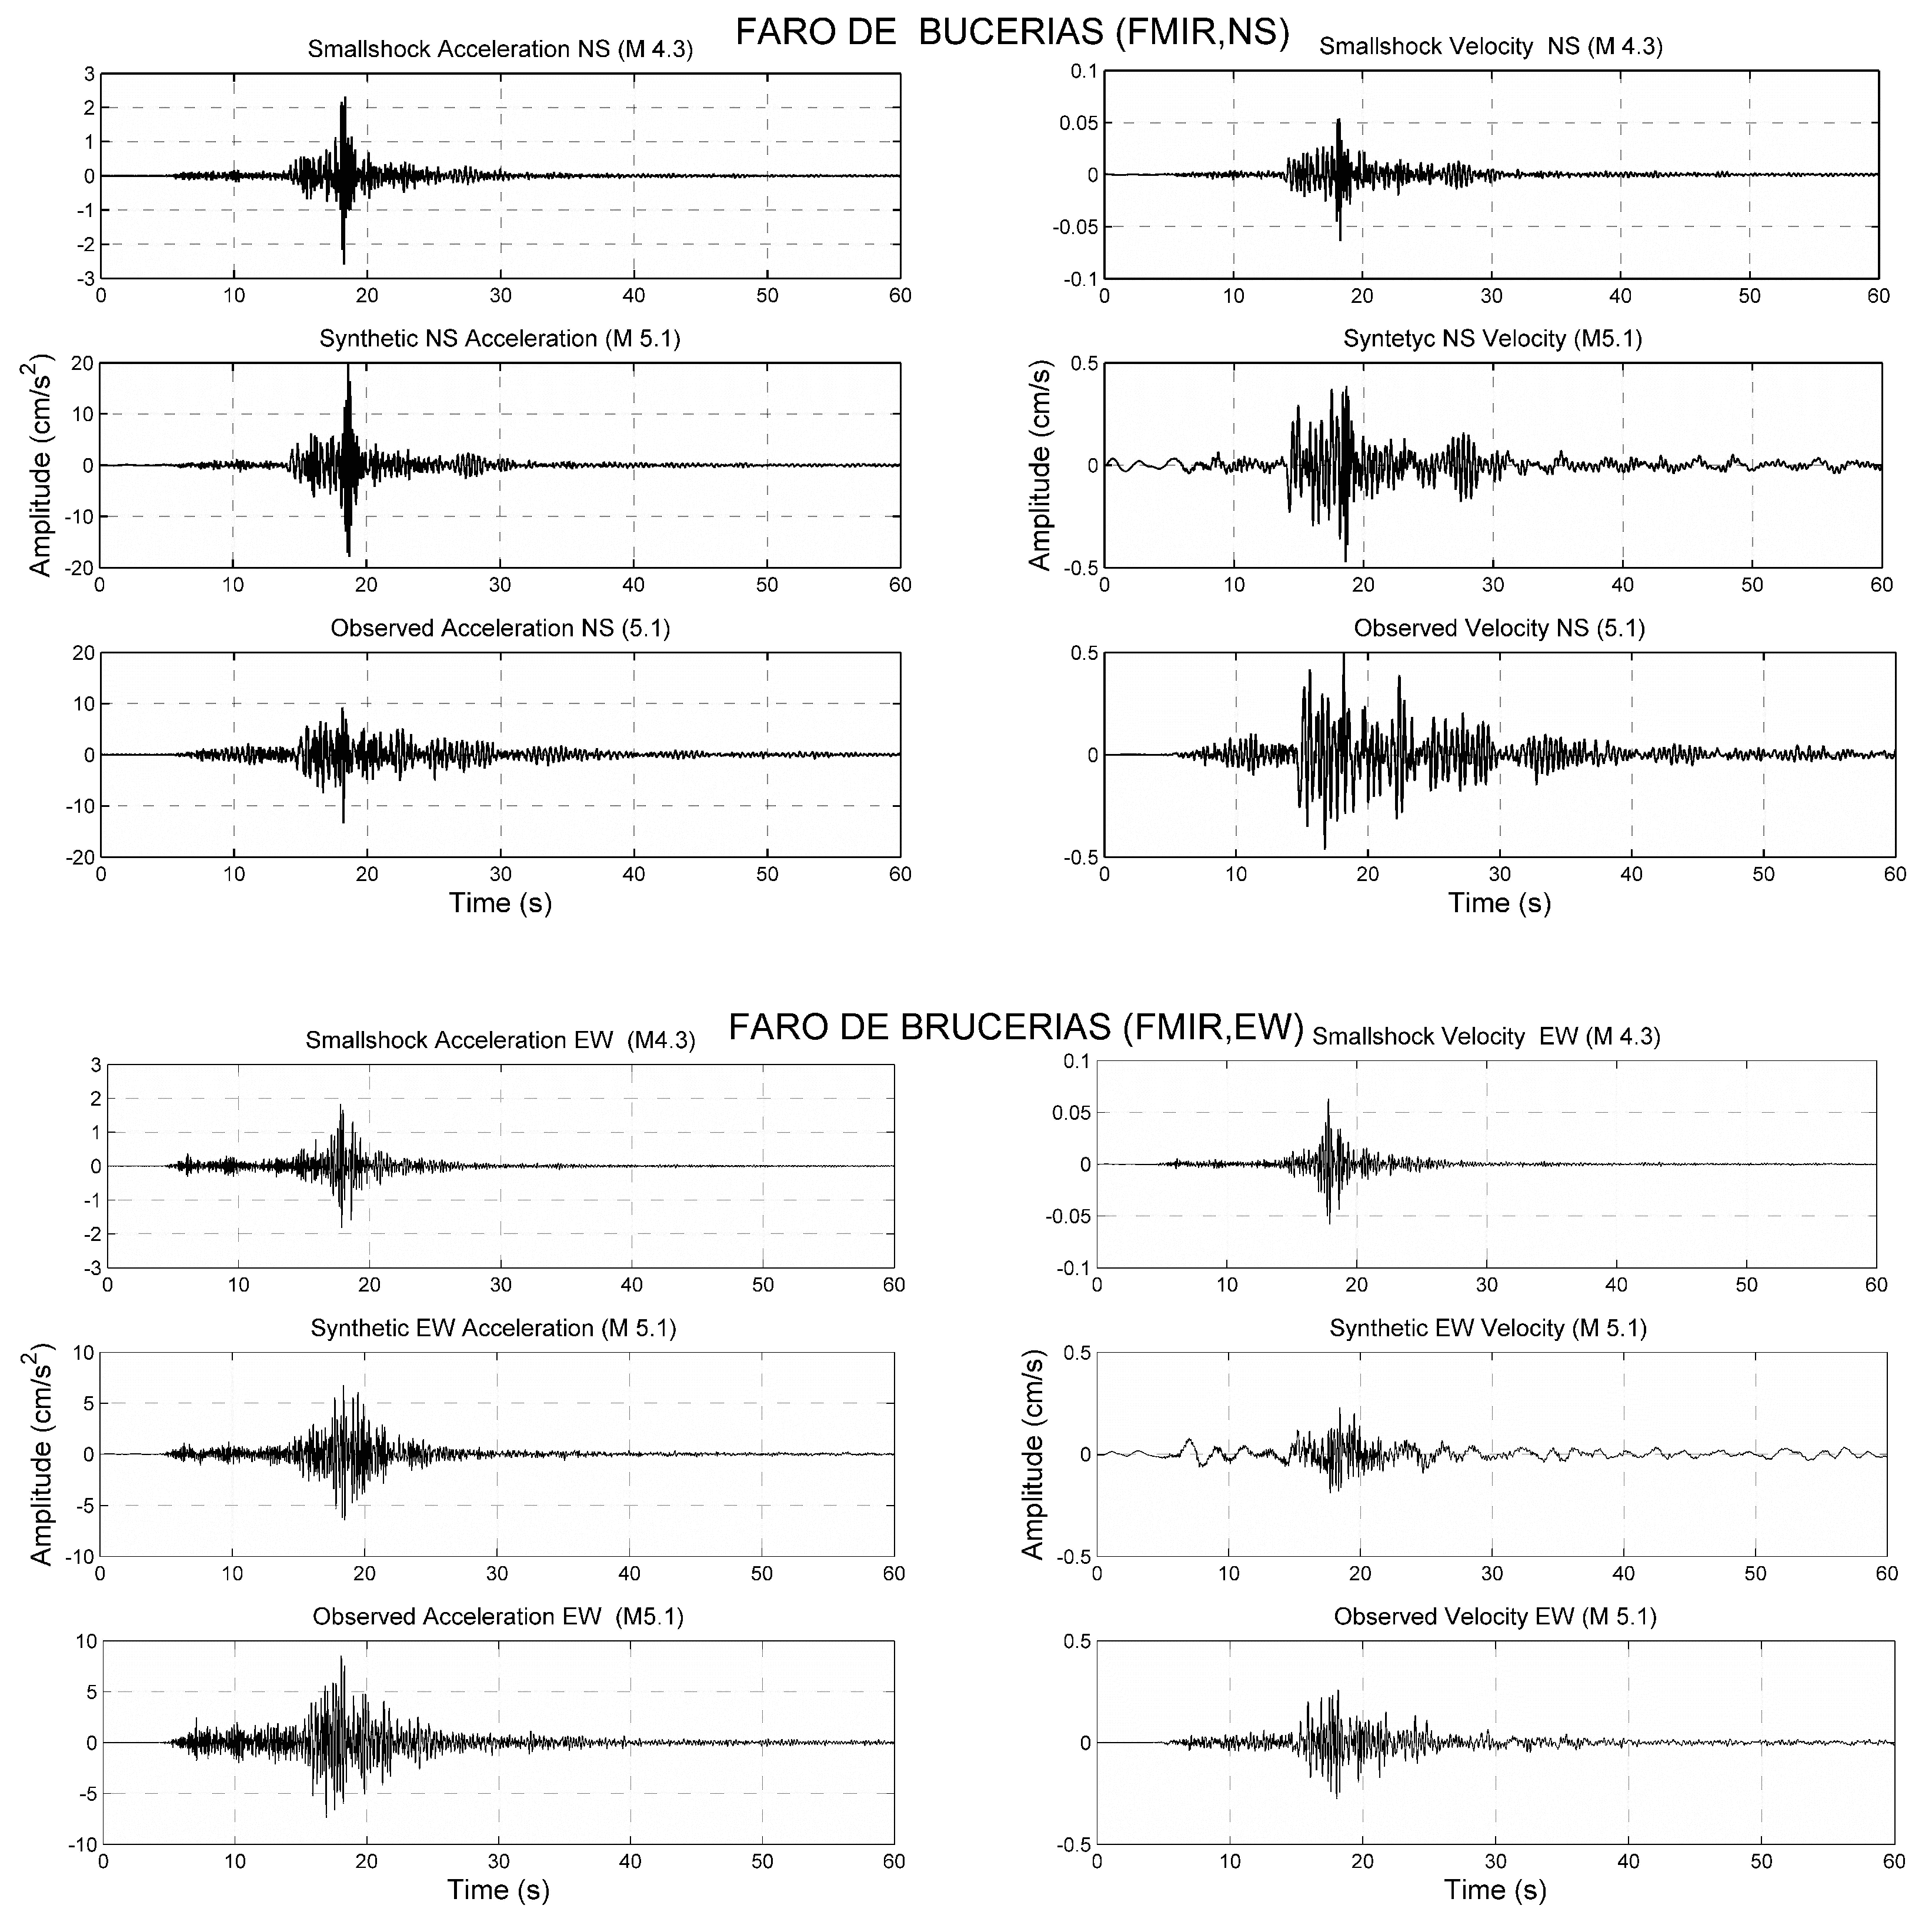
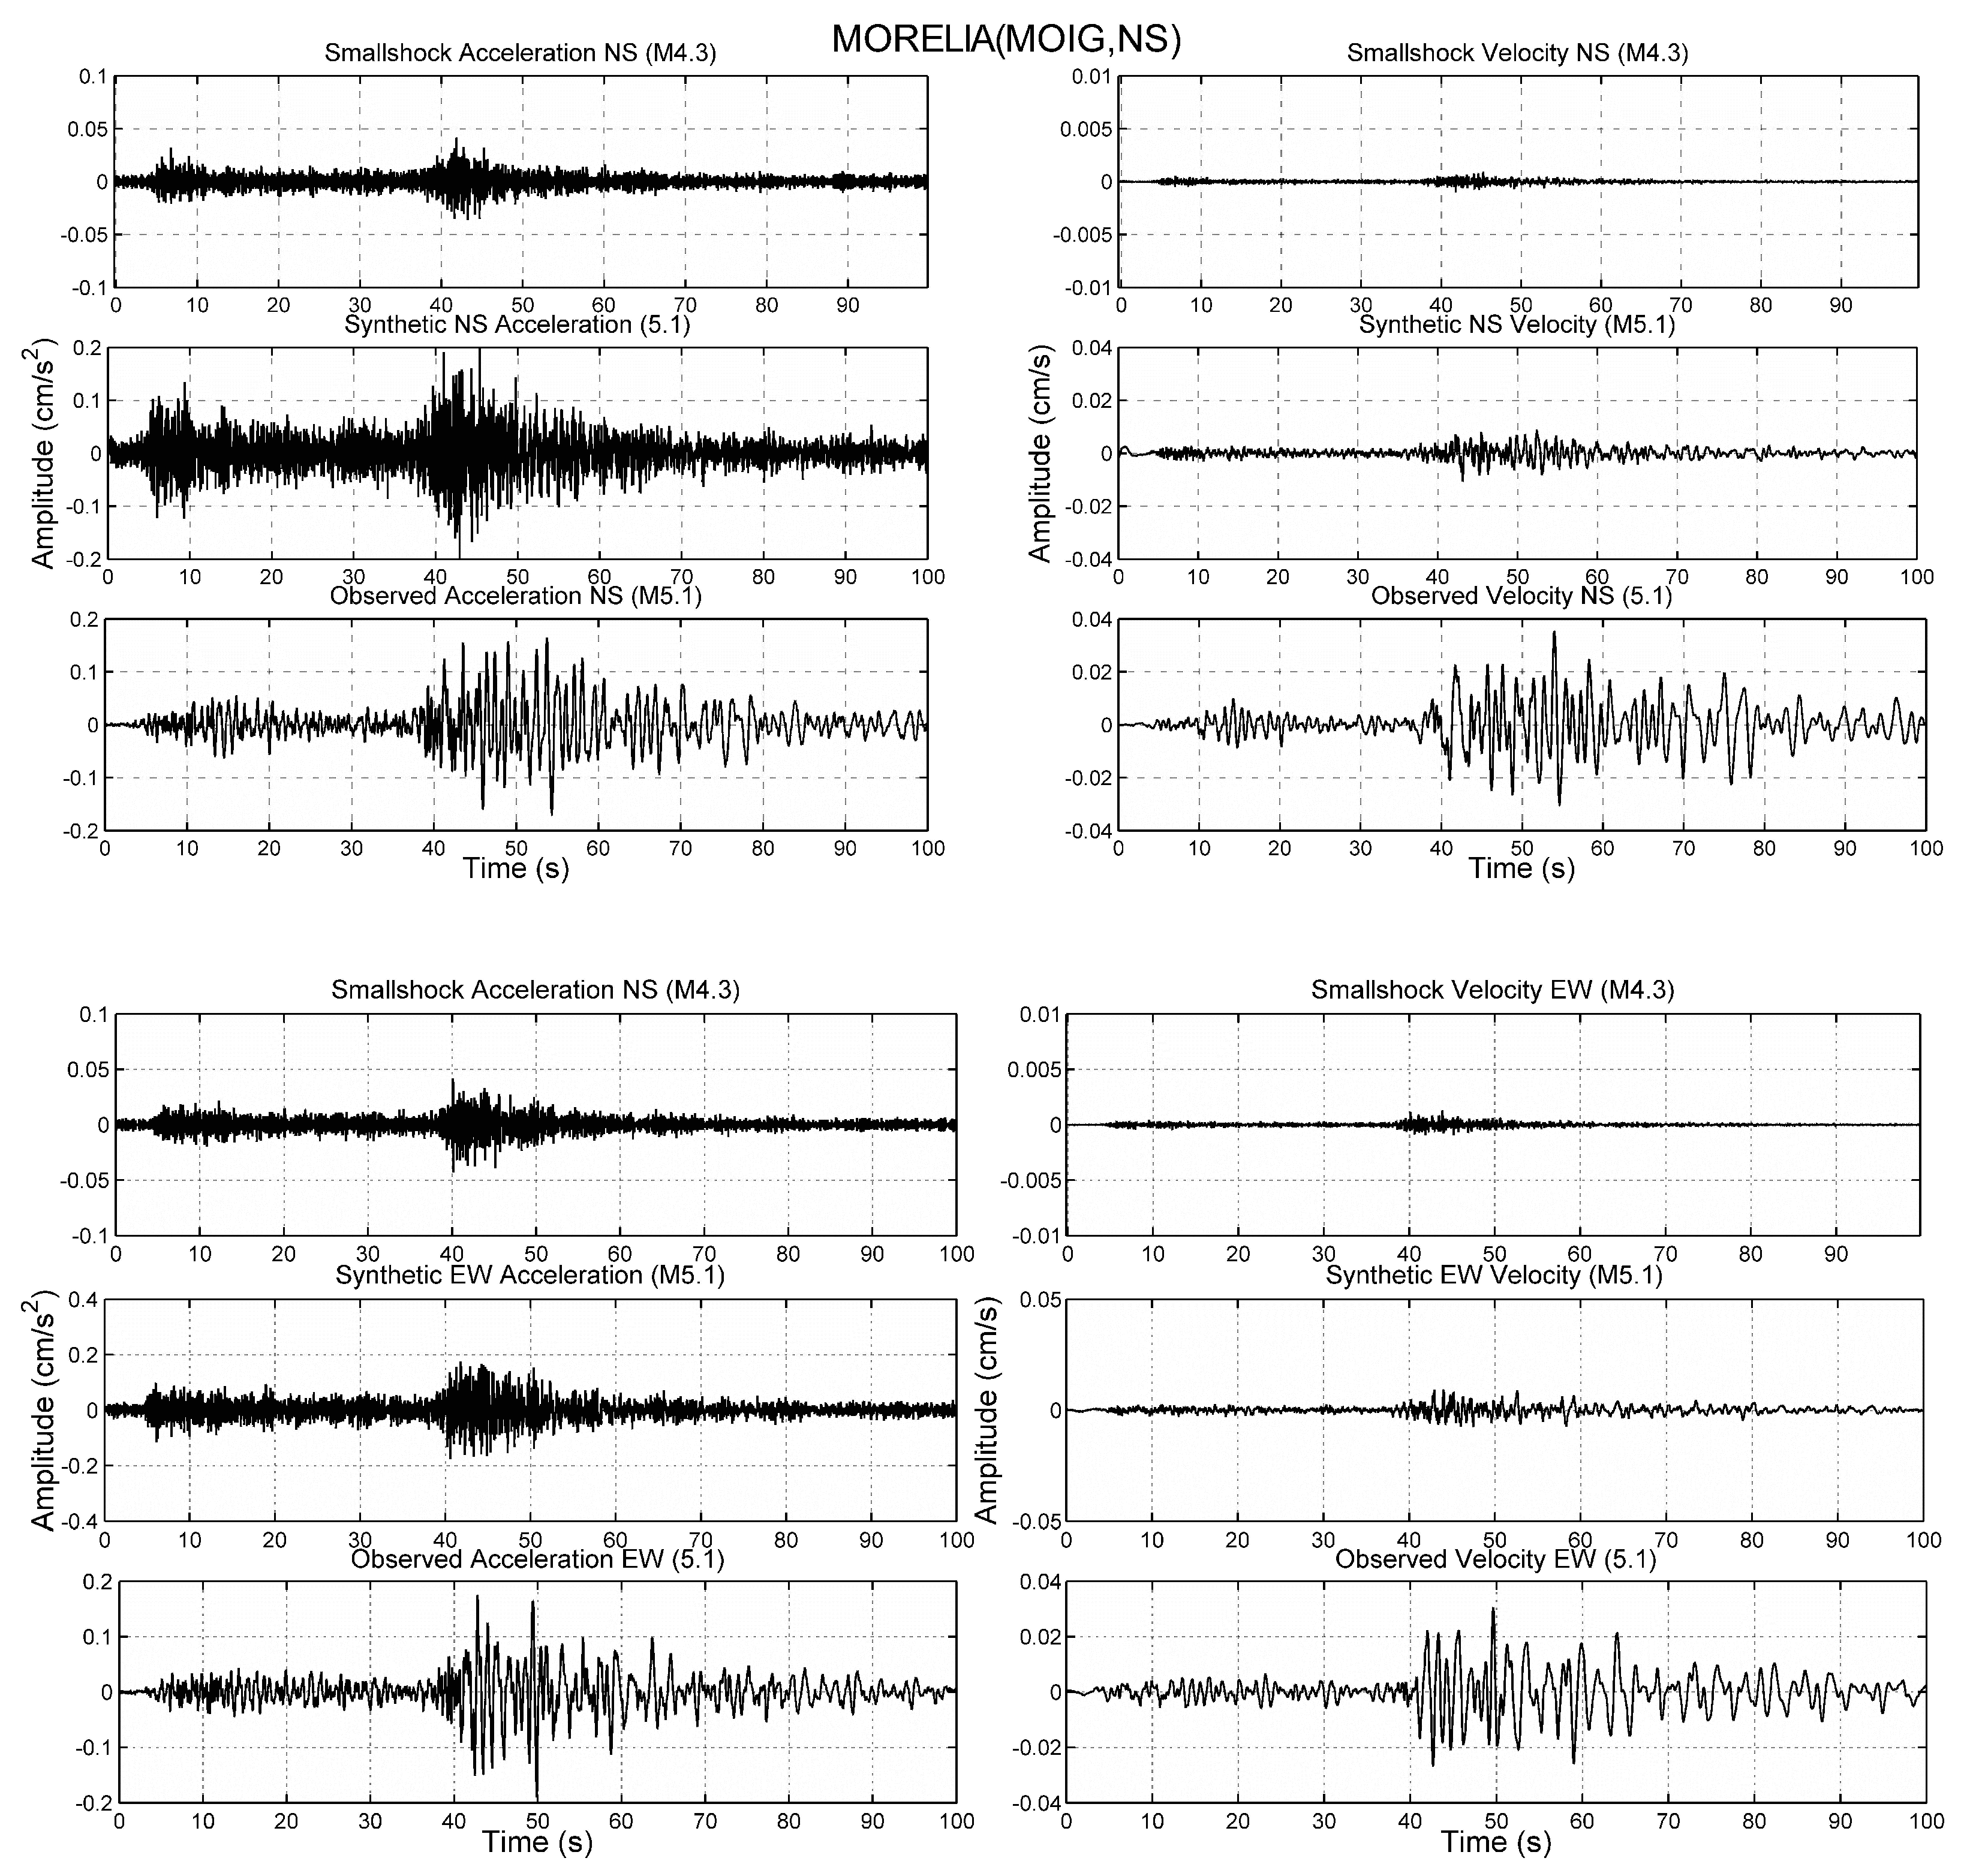
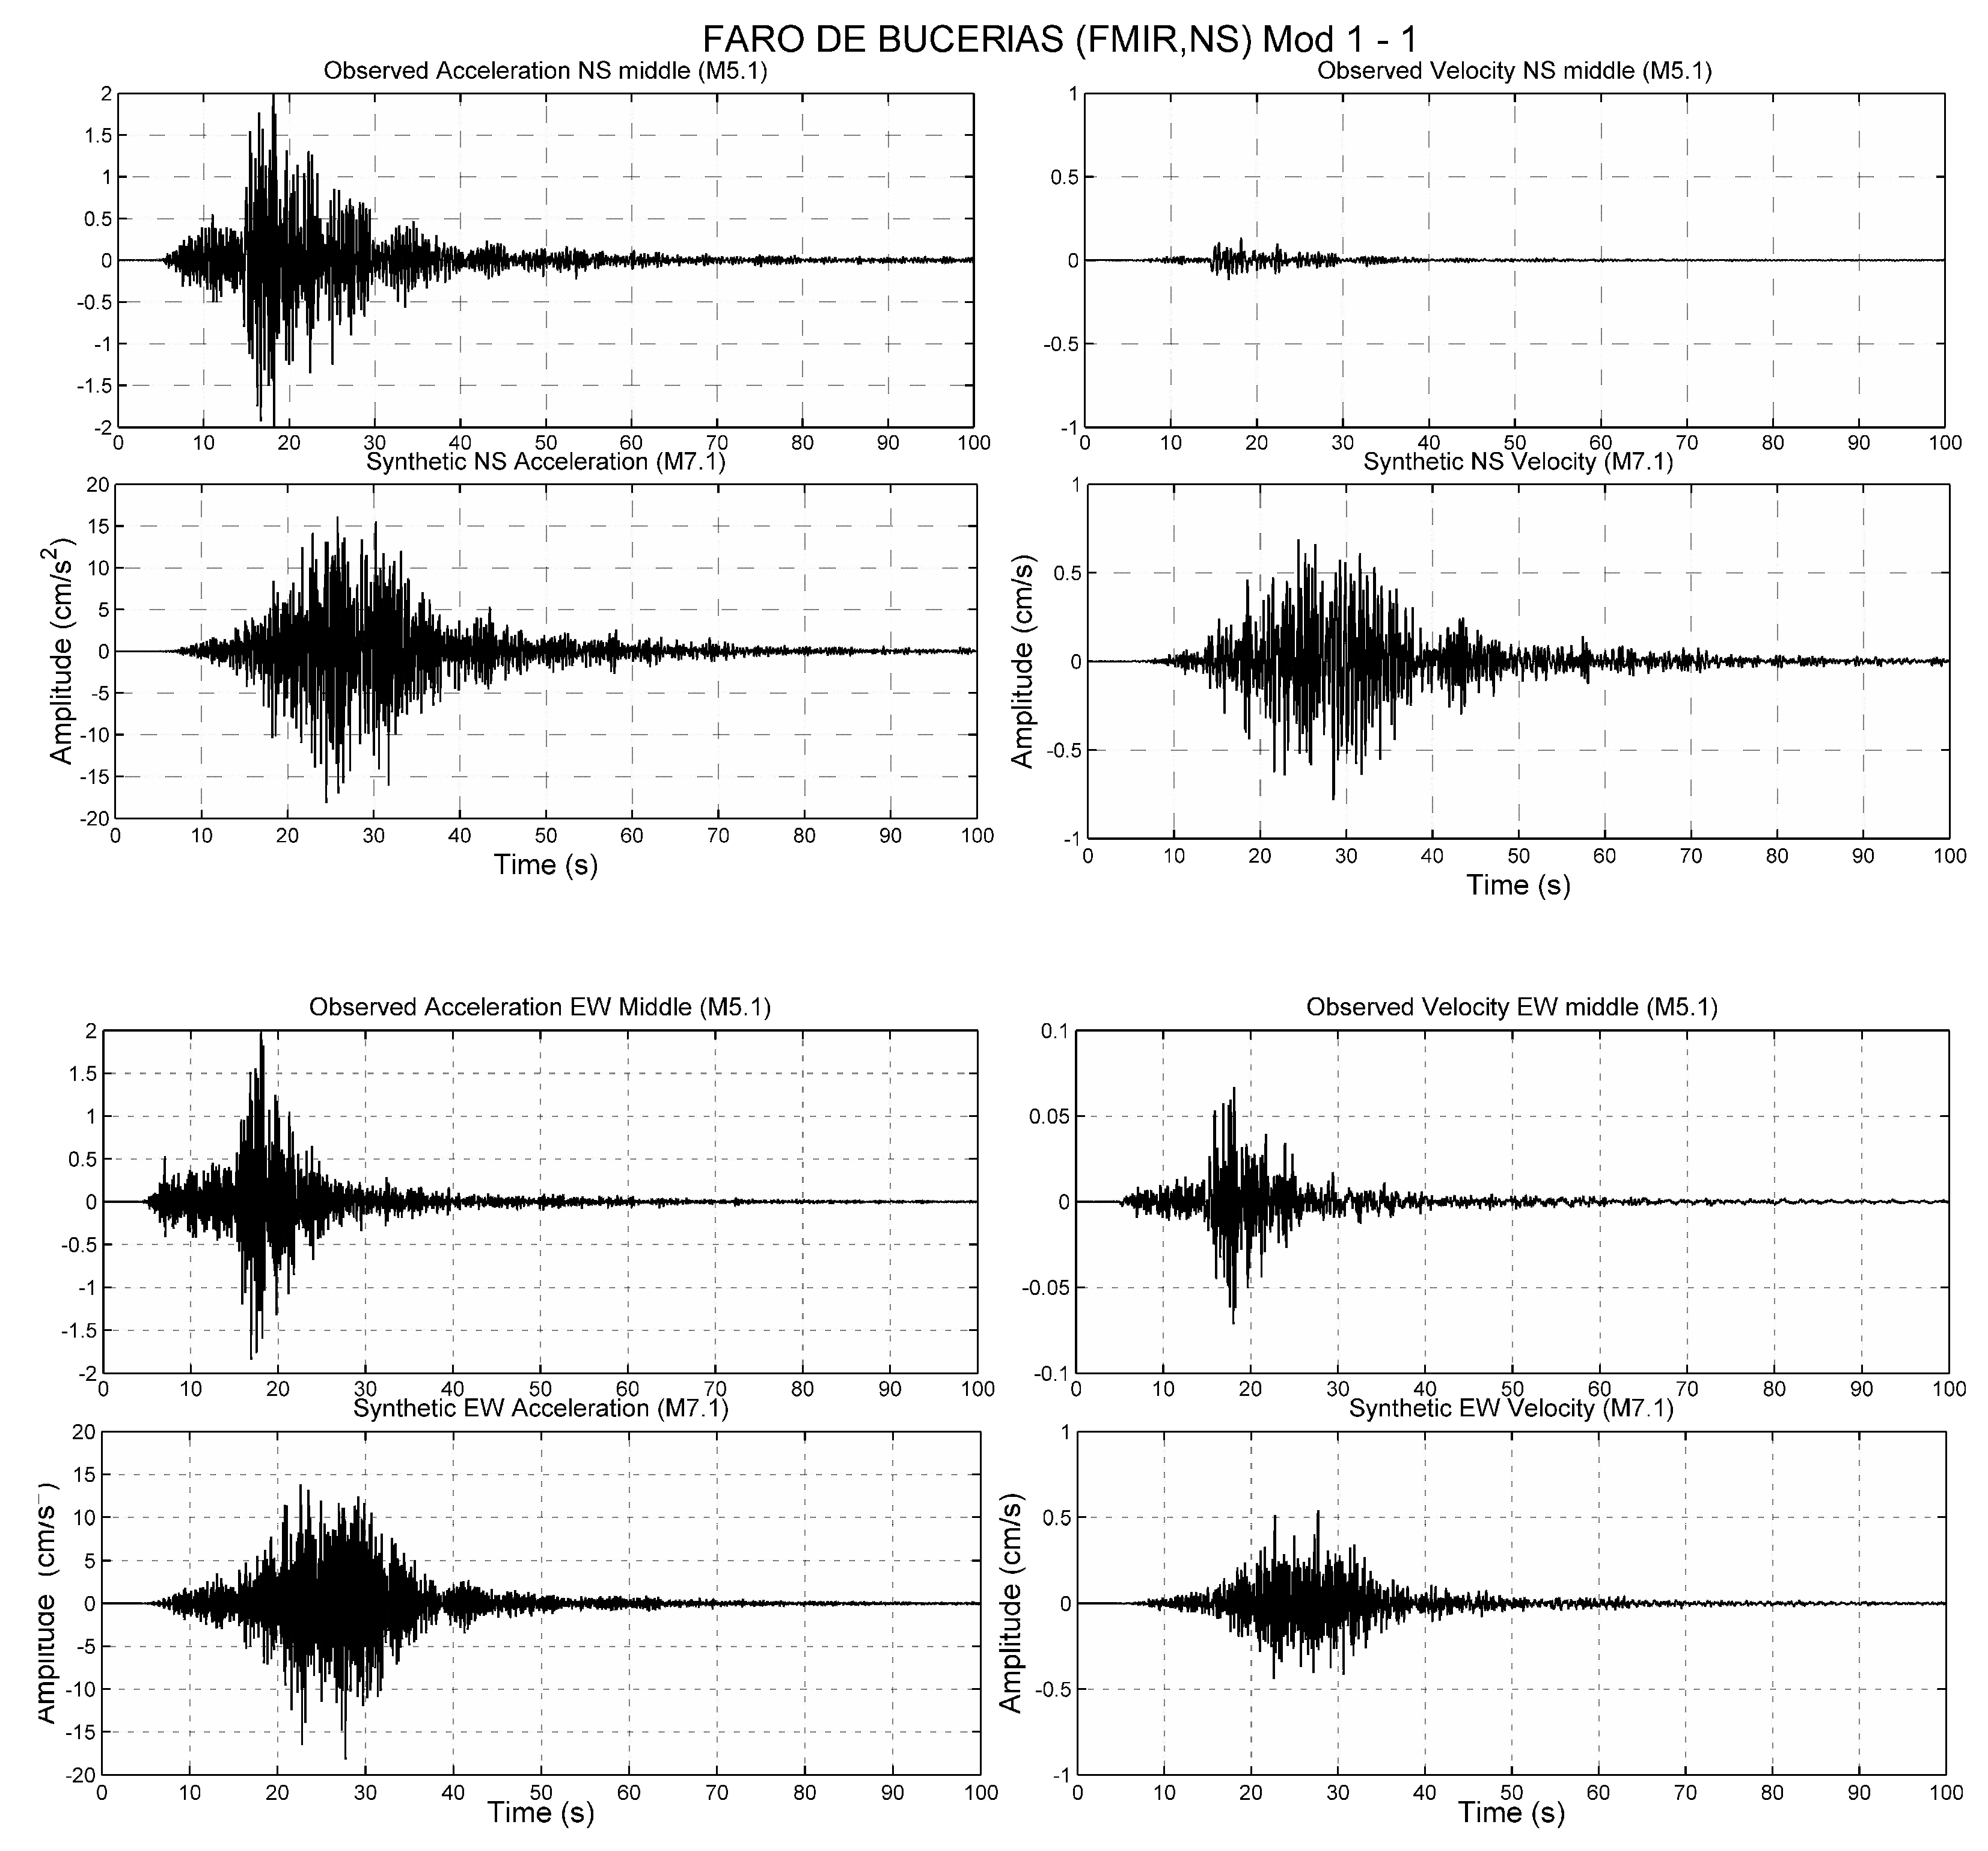
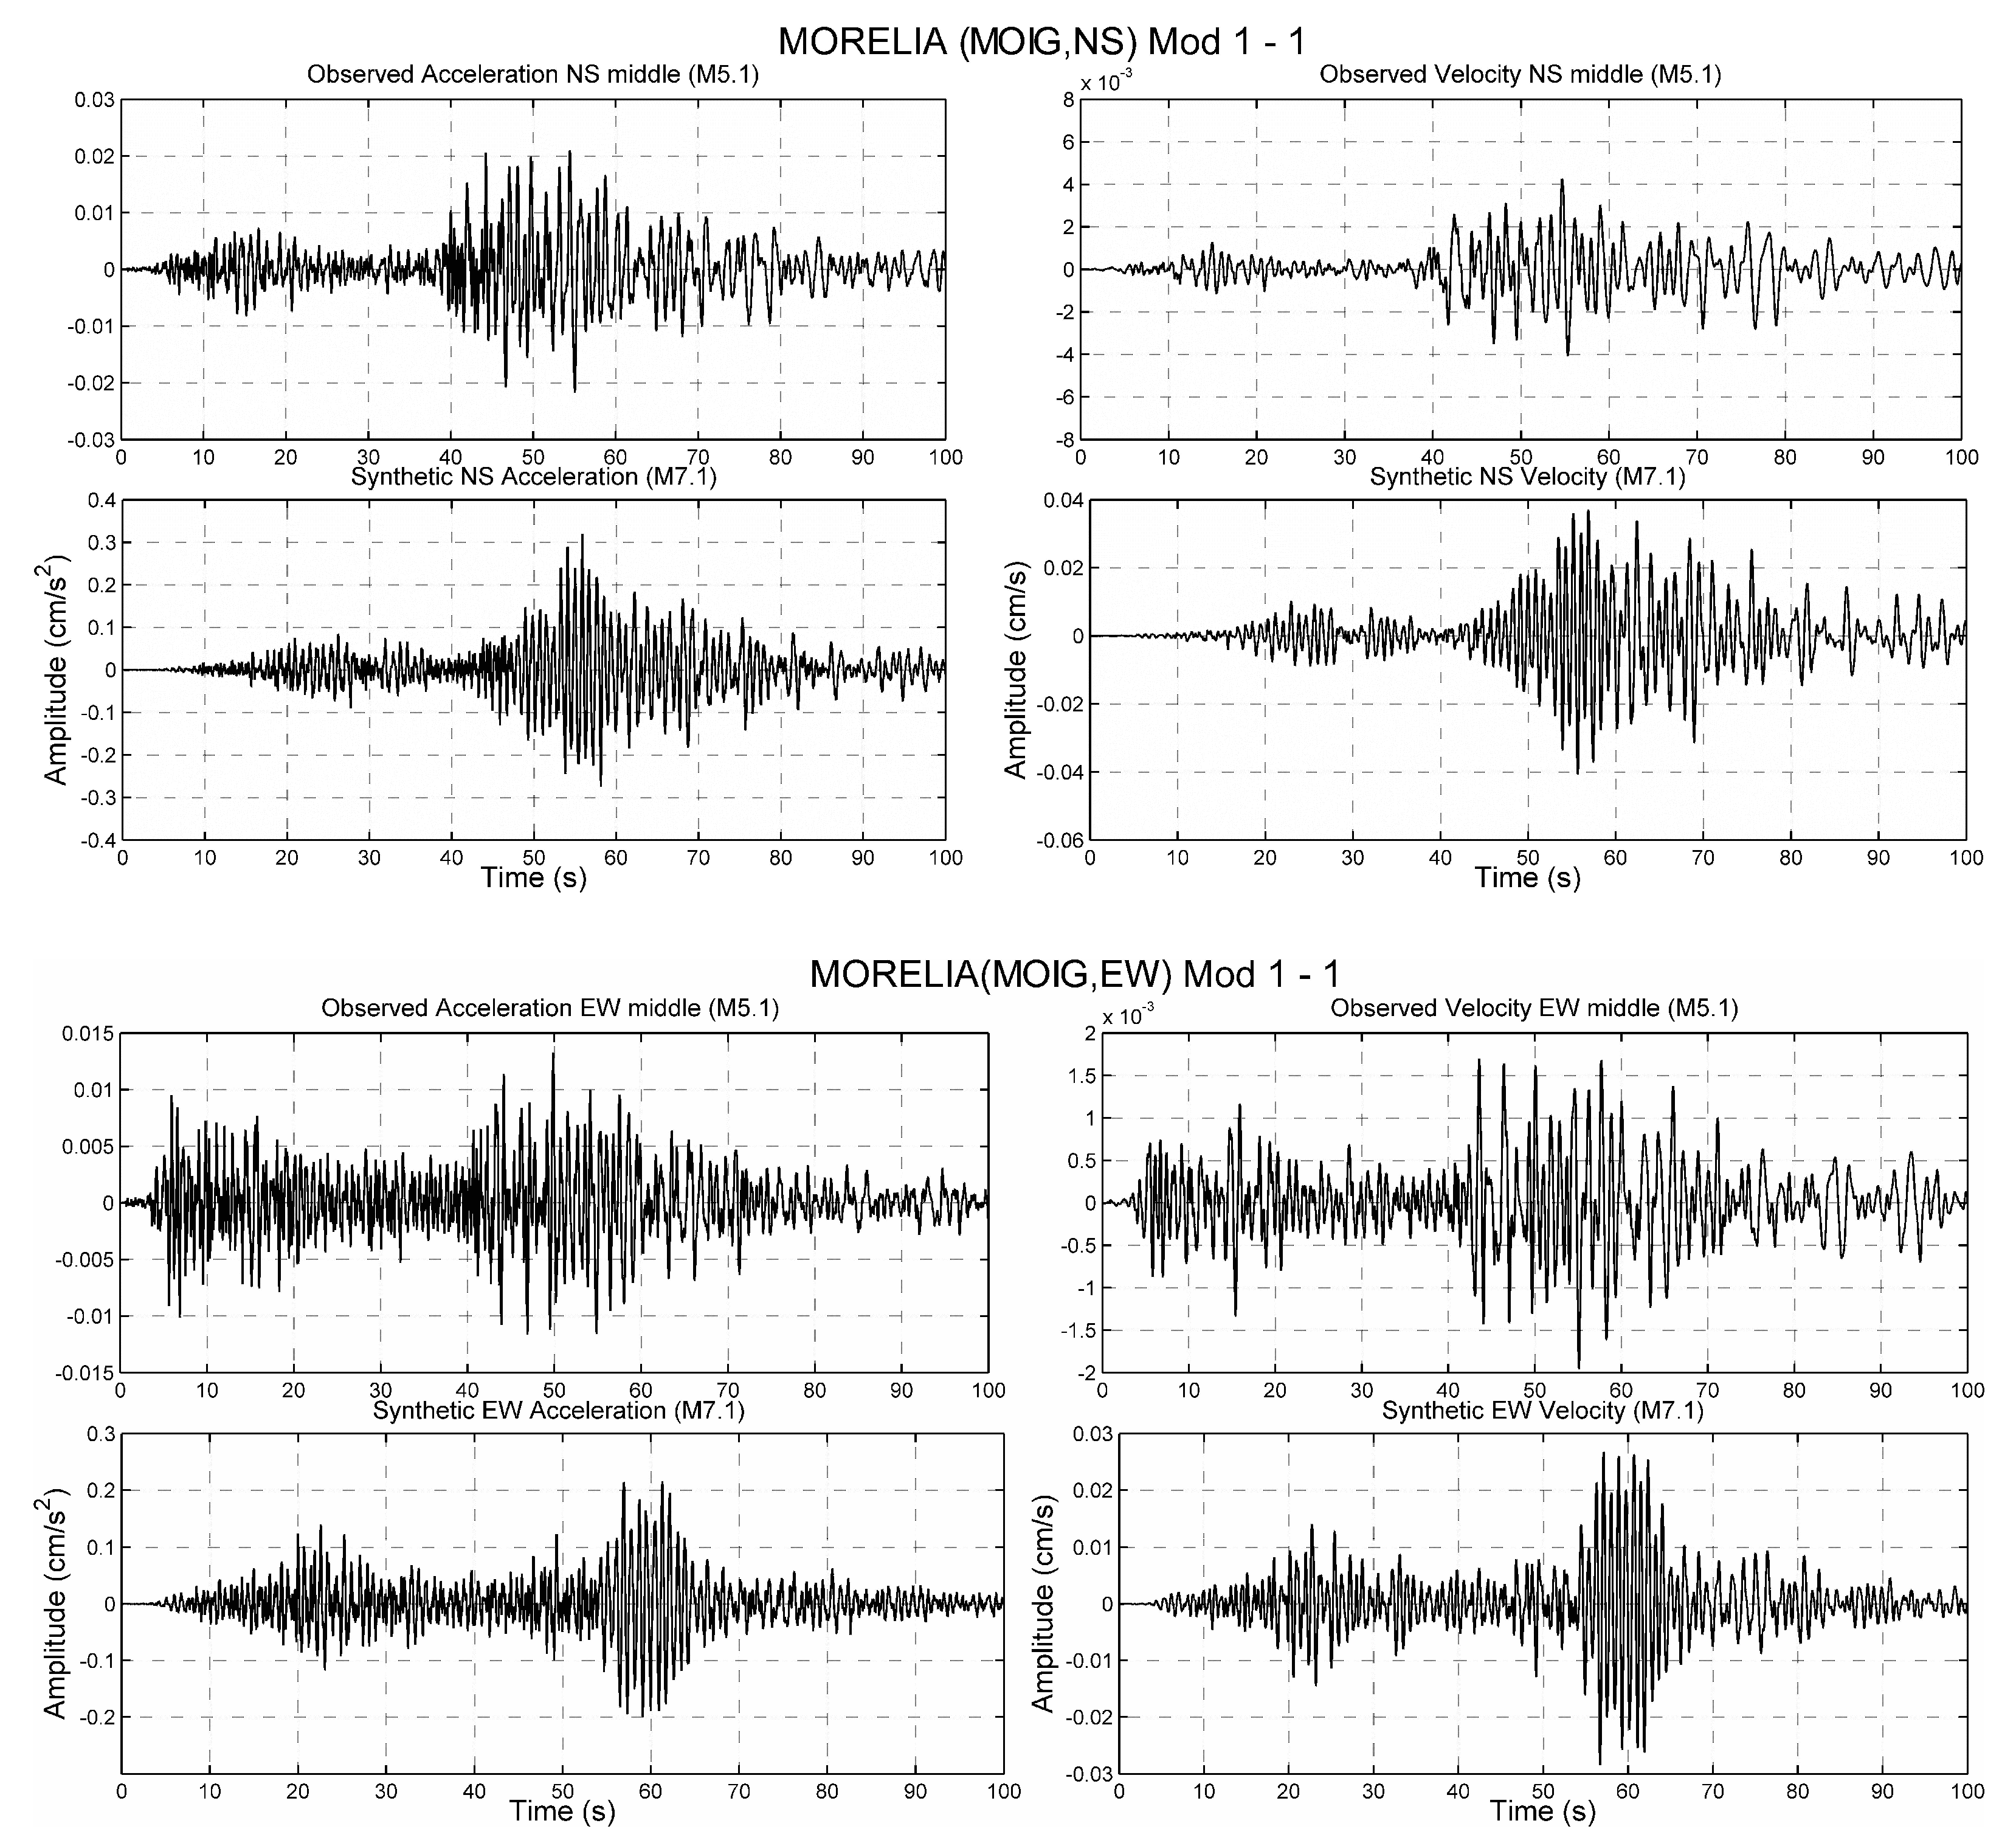
The observed and simulated acceleration and velocity waveforms for the earthquake
(large event) are shown in
Figure 7 and
Figure 8 for FMIR and MOIG stations, respectively. In addition, the observed waveforms of the
earthquake (small event) are shown.
From the results obtained, using the earthquake of to simulate the earthquake, it was observed that for four locations, the best fitting data were obtained after the appropriate rupture velocity, rise time, and starting point were found. This simulation allowed us to validate the estimation of the source parameters, as well as the capability to compare the synthetic and observed waveforms in the temporal network.
Once the validation was completed, a numerical simulation of a higher-magnitude earthquake was computed. In this case, an
earthquake was simulated from the
earthquake. Since this is a possible scenario for a future earthquake, the same type of fault (a left-lateral fault) was assumed. Most earthquakes located in this zone correspond to thrust fault mechanisms as a result of the subduction process. However, the morphology of the seabed shows a fault trace much longer than 25 km perpendicular to the subduction trench. Given that in this region, the crustal thickness is greater than 30 km [
32], the potential rupture area is larger than that considered in this work and might generate an earthquake of magnitude
. Since this kind of event may occur, it is important to estimate the ground motions that such an event could eventually produce.
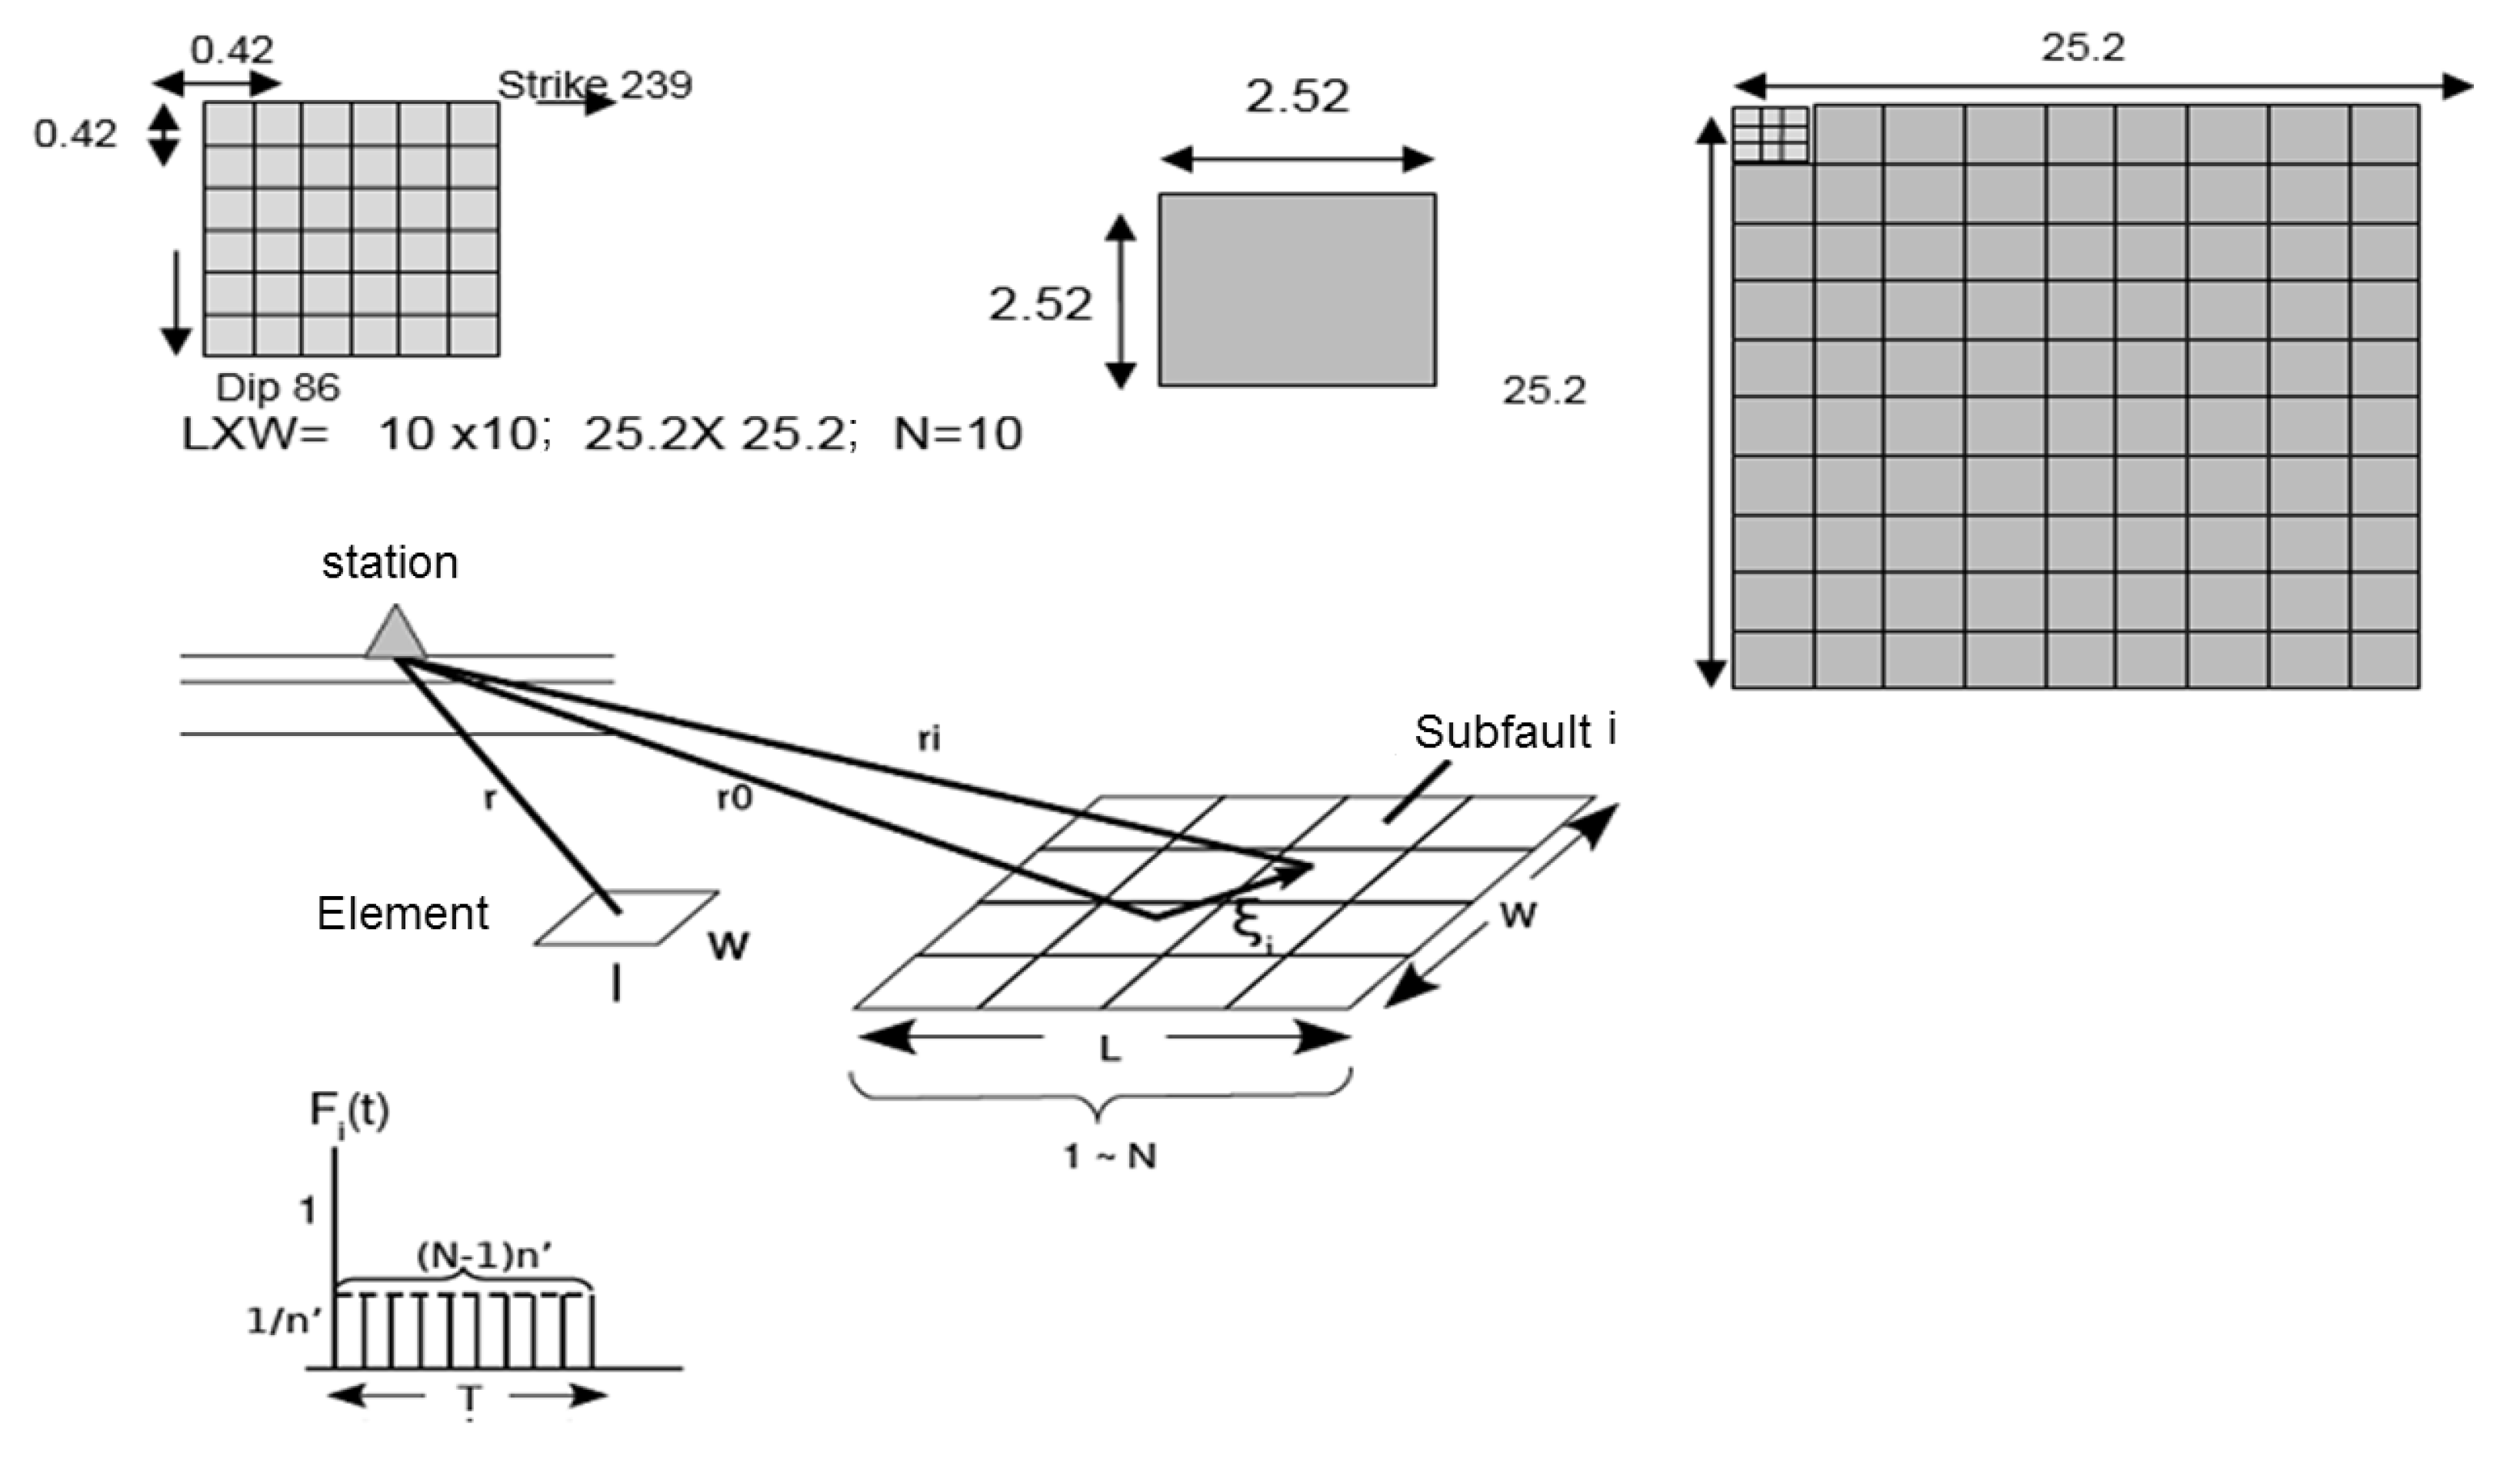
A schematic representation of the system used to simulate the large earthquake is shown in
Figure 9. The number of subfaults,
N, can be estimated from the relations derived by [
23] and Equations (
6)–(
8) that relate the stress drops of both earthquakes and the level of acceleration spectra:
and
where
L and
l are the fault lengths,
W and
w are the fault widths,
T and
t are the rise times, and
D and
d are the fault displacements for the large and small events, respectively. In this case, it is assumed that the stress drop of the large earthquake and the small one is the same, then
. Using the relation between seismic moment and moment magnitude given by [
18], the seismic moment is
Dyne-cm and
Dyne-cm for events
and
, respectively. Then, according to Equations (
2) and (
3),
and
.
The source parameters will be defined on the estimated area 2.52 × 2.52 km
2 of the previous simulation. In schematic form, a procedure was carried out to scale 10 times the length in the strike direction (
) and 10 times the length in the slip direction (
). The total area for the large event is 25.2 × 25.2 km
2. In the previous simulation, the rupture velocity was assumed to be 3.1 km/s, and the wave velocity of S was 3.5 km/s. Taking these values and with the geometry of the fault plane defined, seven simulations with different starting points distributed in the fault plane were proposed, as shown in
Figure 10.
The hypocentral distances must be calculated to every station from each starting point.
Table 1 shows the azimuths and hypocentral distances for each station. The coordinates of the starting point are taken as the number of cells in the strike direction and the number of cells in the dip direction, where the source first moves. The position
indicates the upper and leftmost point of the fault plane.
These numerical simulations were computed for seven starting point positions:
,
,
,
,
,
, and
(only the simulation of point
is shown). Since there are no criteria to determine which model is closer to the hypothetical source
, it is necessary to investigate which model produces the worst intensity scenario in
Figure 11 and
Figure 12, the synthetic acceleration and velocity records for the two horizontal components of the simulated
earthquake are shown at stations FMIR and MOIG.
To investigate the intensity distribution, the maximum horizontal components of each station were chosen.
Table 2 summarizes the maximum intensities found for the seven different starting point simulations. There is no single model producing the largest accelerations in all stations. As expected, the highest accelerations occurred at the nearest station (FMIR). However, the lowest values were not observed at the farthest station (MARM) but at the MOIG station, which is approximately 80 km closer to the source. This behavior is due to a combination of the radiation pattern together with local effects. For the simulations of the starting points
,
,
, and
, the behavior is as expected, where the MARM station shows values lower than MOIG. However, simulations
and
MARM showed values higher than MOIG, even though it is more distant from the source. This means that it depends on the starting point of the rupture, which in turn generates different directive patterns. That is enhanced by the site effects. This can be evident if one simulation is performed at a time, the more distant stations have lower acceleration values than the closer ones, except for MOIG and MARM in the case of the models
,
and
.
The directivity effect also produces the highest intensity due to different models at different stations. In this way, the FMIR station reached its highest intensity of 74.1 cm/s2 with simulation . The APTZ and MOIG stations reached their maximum intensities with the simulation of 12.0 and 0.4 cm/s2, respectively. The PATZ station reached a maximum of 2.8 cm/s2 with simulation , and MARM with simulation reached a value of 0.8 cm/s2.
Since the study region lacks a permanent seismic network, it is hard to compare the acceleration values obtained with standard Ground Motion Predictive Equations (GMPE). However, it is interesting to make a comparison to GMPEs obtained for interplate earthquakes [
33]. At a distance of 60 km, a 7.1 M interplate earthquake has a PGA associated with the GMPE of 82.39 cm/s
2 at the FMIR station. The maximum estimated PGA in our model (rupture point (6.6)) was 74.1 cm/s
2. The farther station (MARM) at 426 km from the source has a PGA associated with GMPE of 0.85 cm/s
2, while our estimation has a PGA of 0.5 cm/s
2. The estimates of PGA obtained were lower than the corresponding PGA reported by [
33]. Although both studies consider a 7.1 M earthquake, the results are consistent since the modeling in [
33] was made with subduction earthquakes with a larger dislocation area than the strike-slip considered in this study.
The location of the initial point of rupture on the fault affects the seismic energy radiation pattern. In some scenarios, this directivity causes remote stations (e.g., MARM) to have stronger accelerations than intermediate-located stations (as MOIG). The local geological and geotechnical activities at each station contribute to the amplification or attenuation of the seismic waves. Factors such as soil type, topography, and the presence of particular geologic structures could modify the local seismic response by enhancing or attenuating the directivity effects. The combination of an asymmetric radiation pattern, as a consequence of variability in the direction and velocity of the rupture, and local site effects may generate a complex distribution in peak accelerations. This has direct consequences in intensity maps and the design of structures, as the response of the soil can vary significantly due to the interaction of these factors. However, our interpretation of the effect of directivity is that when the initiation point of the rupture is varied, the observed acceleration patterns vary in the stations even though the effects of the affected site are the same.
Presently, the study of the distribution of “peak” accelerations and “peak” velocities is an important topic. Sharing this information with the engineering community is also important. From the comparison of the observed intensity maps, ref. [
34] found that the most appropriate regressions are based on the maximum velocity vs intensity and peak acceleration vs intensity. This is consistent with the notion that low intensities are sensitive to the acceleration. Moderate-intensity damage usually occurs in rigid structures (masonry walls, chimneys, etc.), which are also sensitive to high-frequency (acceleration) ground motions. As the intensity increases, the damage also occurs in flexible structures, for which the damage is proportional to the velocity of the ground and not to the acceleration. Relating the soil motions recorded to modified Mercalli intensities with this type of information could reduce the damage in a certain region during the occurrence of an earthquake.
With the maximum acceleration estimated in the simulation of an
earthquake off the coast between Colima and Michoacan, intensities were estimated for the five stations used during the simulation.
Table 3 shows the estimated intensities and their relations as proposed by [
35].
Taking into account this table and considering the maximum values of
Table 2, the model
has the maximum acceleration at the station closest to the source (FMIR), it has an intensity MMI=V (
% g). Apatzingan station (APTZ) shows its maximum acceleration in the model
, with an intensity MMI = II-III (
% g). The maximum intensity for the station located in Patzcuaro (PATZ) was MMI = II-III (
% g) with the model
. The simulation of the intensity for the station located in the main city of Michoacan, Morelia (station MOIG) registered a maximum intensity of MMI = I for the model
. The model
yielded a maximum intensity of MMI = I for the farthest station (MARM). With these results, it is observed that the maximum accelerations were obtained in the station closest to the source around 60 km, and the lowest were after 345 km from the source.
4. Conclusions
In this work, the effects of a hypothetical lateral fault earthquake that could occur in the Colima rift were studied. Some seismic scenarios of a magnitude 7.1 strike-slip earthquake occurring in the Colima rift using the empirical Green’s function method were simulated. Recordings from a temporary acceleration network installed on a line near the coast in the state of Michoacan were used. During its operation, the network recorded two events with the same fault plane, one of M 4.3 and another of M 5.1. Using the latter and through the empirical Green’s function method, the simulation of the M 7.1 earthquake with a rupture area of 25.2 × 25.2 km2 was performed. Seven different models were recreated, varying the rupture starting point. Waveforms in velocity and acceleration were generated for five sites. The maximum acceleration (PGA) and velocity (PGV) of all stations and scenarios were obtained. The maximum intensities for each of the seven models were estimated. The highest PGA was 74.1 cm/s2 and corresponds to an IMM intensity of V at the FMIR station located 60 km from the epicenter.
In the present study, an earthquake with an unusual focal mechanism in a subduction zone is analyzed, i.e., an earthquake with strike-slip faulting. Most of the seismicity in Michoacan is associated with subduction, although some intraplate events are also present. The main difficulties in this region are the lack of a permanent seismic network and the fact that the available temporal data are, in general, not open access.
These records constitute a useful input for seismic hazard studies in the state of Michoacan and for technical standards of earthquake design that could be considered in the corresponding construction regulations. There are studies on seismic hazards in western Mexico; however, these are based on probabilistic estimations [
36]. The current trend is to complement the probabilistic studies with seismic scenarios of potential earthquakes that generate intensities not considered in probabilistic approaches.
Although these simulations are limited to 5 sites, they provide important information in a state that, despite its significant seismic activity, has very few permanent seismic stations. A larger number of seismic stations would provide a better and more complete analysis and may help in obtaining a deeper understanding of the geodynamics of the region. Some other potential limitations of the study could arise from the inherent hypothesis of the method of empirical Green’s functions, which may induce bias in the estimation of the seismic source. This could affect the precision of the wave simulation. The uncertainties in the rupture parameters, such as the distribution of the released energy and the timing rise, may influence the prediction models.
There are studies on seismic hazards in western Mexico; however, these are based on probabilistic estimations. The current trend is to complement the probabilistic studies with seismic scenarios of potential earthquakes that generate intensities not considered in probabilistic approaches. The results of this study are important to improve the seismic hazard analysis and construction codes in Michoacan. In particular, the data obtained, including information on the rupture parameters, variability in seismicity, and limited coverage of the stations, allows a more precise delimitation of the zones with greater vulnerability. Some suggested applications could be updating seismic hazard maps, incorporating them into geographic information systems (GIS), and updating construction codes using performance-based design.
