Article

Deformation-Related Data Mining and Movement Patterns of the Huangtupo Landslide in the Three Gorges Reservoir Area of China

1
Key Laboratory of Geological Survey and Evaluation of Ministry of Education, China University of Geosciences, Wuhan 430074, China
2
Badong National Observation and Research Station of Geohazards (BNORSG), China University of Geosciences, Wuhan 430074, China
3
College of Marine Science and Technology, China University of Geosciences, Wuhan 430074, China
4
Chang Jiang Geotechnical Engineering Co., Ltd., Wuhan 430079, China
*
Author to whom correspondence should be addressed.
Appl. Sci. 2025, 15(7), 4018; https://doi.org/10.3390/app15074018
Submission received: 23 January 2025 / Revised: 28 March 2025 / Accepted: 2 April 2025 / Published: 5 April 2025
(This article belongs to the Section Earth Sciences)

Abstract

:
Large reservoir-induced landslides pose a persistent threat to the safety of the Three Gorges Project and the Yangtze River shipping channel. A comprehensive multi-field monitoring system has been established to observe potential landslide areas within the Three Gorges Reservoir Area. The tasks of effectively utilizing these extensive datasets and exploring the underlying correlation among various monitoring objects have become critical for understanding landslide movement patterns, assessing stability, and informing disaster prevention measures. This study focuses on the No. 1 riverside sliding mass of the Huangtupo landslide, a representative large-scale landslide in the Three Gorges Area. We specifically analyze the deformation characteristics at multiple monitoring points on the landslide surface and within underground tunnels. The analysis reveals a progressive increase in deformation rates from the rear to the front and from west to east. Representative monitoring points were selected from the front, middle, and rear sections of the landslide, along with four hydrological factors, including two reservoir water factors and two rainfall factors. These datasets were classified using the K-means clustering algorithm, while the FP-Growth algorithm was employed to uncover correlations between landslide deformation and hydrological factors. The results indicate significant spatial variability in the impacts of reservoir water levels and rainfall on the sliding mass. Specifically, reservoir water levels influence the overall deformation of the landslide, with medium-to-low water levels (146.32 to 163.23 m) or drawdowns (−18.70 to −2.16 m/month) accelerating deformation, whereas high water levels (165.37 to 175.10 m) or rising water levels (4.45 to 17.33 m/month) tend to mitigate it. In contrast, rainfall has minimal effects on the front of the landslide but significantly impacts the middle and rear areas. Given that landslide deformation is primarily driven by periodic fluctuations in reservoir water levels at the front, the movement pattern of the landslide is identified as retrogressive. The association rules derived from this study were validated using field monitoring data, demonstrating that the data mining method, in contrast to traditional statistical methods, enables the faster and more intuitive identification of reservoir-induced landslide deformation patterns and underlying mechanisms within extensive datasets.

1. Introduction

The Three Gorges Project, recognized as the largest hydraulic and hydropower project globally, is located in a mountainous region along the middle and upper reaches of the Yangtze River, extending from Yichang to Chongqing in China. The reservoir, characterized by its long and narrow shape, spans over 600 km behind the Three Gorges Dam and is considered one of the most geohazard-prone areas in China. This susceptibility is attributed to the complex geological environment and the reservoir’s impoundment since 2003 [1,2]. Over 4000 geological hazards and potential danger points have been identified within the Three Gorges Reservoir Area (TGRA), with nearly 90% classified as landslides and rockfalls [3]. The occurrence and resurgence of potentially catastrophic landslides may induce slope deformation and collapse, trigger debris flows, and even generate impulse waves (or tsunamis), thereby posing significant threats to the safety of residents, property, critical water infrastructure, and the ecological environment of the TGRA [4,5,6]. On 13 July 2003, the Qianjiangping landslide occurred in Zigui County after 43 days of reservoir impoundment. The sliding mass entered the water at a high velocity, generating a wave exceeding 30 m on the opposite bank, which overturned 22 vessels and resulted in 14 fatalities. This incident impacted nearly 1000 individuals, with direct economic losses surpassing CNY 50 million [6].
After more than a decade of prevention and mitigation efforts, most small- and medium-scale landslides in the Three Gorges Reservoir area have been effectively managed. However, large-scale landslides, such as the Huangtupo, Huanglashi, Outang, and Xinpu landslides, remain inadequately addressed due to technological limitations [7,8,9,10], including the complexity of deep-seated and fragmented geology, the limitations of conventional stabilization methods, high costs, and logistical challenges. Real-time monitoring, coupled with timely forecasting and early warning systems, serves as a crucial safeguard against the catastrophic risks posed by these landslides. Extensive monitoring data indicate that the deformation process of large reservoir landslides in the TGRA typically progresses through a phase of creep followed by a sudden “step-like” change [11]. Real-time monitoring not only captures precursor characteristics preceding instability but also provides a reliable foundation for disaster early warning. The generation of extensive multi-field monitoring data during landslide observation has become a significant basis for analyzing movement patterns, assessing stability, and informing disaster prevention measures, allowing researchers to explore the potential relationships among various monitoring objects [12,13,14]. Traditional data analysis methods often struggle to meet the demands of large, multi-source monitoring datasets due to their reliance on predefined models, their limited flexibility in handling heterogeneous data, and the inability to process large datasets effectively. In contrast, data mining technologies can rapidly extract valuable information from extensive landslide monitoring data, leveraging their algorithmic capabilities. These technologies have been widely applied in various aspects of landslide research, such as landslide recognition [15], prediction [16,17], and susceptibility analysis [18,19].
Existing large reservoir-induced landslides in the TGRA, defined as landslides triggered by changes in reservoir conditions and with a volume greater than 1 million m3 according to the national code GB/T 32864–2016 [20], are prone to reactivation or accelerated deformation due to a combination of internal and external triggering factors, including tectonic activity, intense precipitation, water level fluctuations, bank erosion, human activities, and seismic loading [21,22,23,24]. The association rule algorithm in data mining offers a robust approach to exploring the intrinsic correlations between landslide deformation data and triggering factors, making it particularly significant in the study of landslide trigger mechanisms. For instance, Huang et al. [25] investigated the correlation between landslide activity, reservoir water levels, and rainfall intensity in the Three Gorges Reservoir area using data mining techniques. Tan et al. [26] identified the primary factors determining the different deformation stages of the Zhujiadian landslide through Gray Relational Grade Analysis. Miao et al. [27] proposed a data mining method that integrates clustering algorithms, Apriori algorithms, and the decision tree C5.0 model to analyze hydrological factors related to landslide deformation in the TGRA, with results demonstrating high accuracy. Guo et al. [28] employed the Apriori algorithm to analyze the deformation of the Shuping landslide in the TGRA, selecting nine hydrological factors to establish a correlation criterion between triggering factors and landslide deformation, while excavating the threshold for controlling factors based on the decision tree C5.0 model. Li et al. [29] introduced an optimized Apriori algorithm to address the issues of poor adaptability and low computational efficiency associated with standard Apriori algorithms. The performance of this proposed algorithm was validated using monitoring data from the Baishuihe landslide, and it was found to significantly reduce computation time compared to standard Apriori algorithms. Data mining has been extensively applied to analyze the inherent connections between triggering factors and landslide deformation. However, the influence of triggering factors on landslide deformation varies across different spatial locations. Some studies have relied on data from a single monitoring point to represent the overall deformation characteristics of landslides, neglecting the spatial variability inherent in the overall deformation.
In this study, we analyze the deformation characteristics of the Huangtupo No. 1 riverside sliding mass based on the latest multi-source monitoring data obtained from a comprehensive landslide monitoring system. The K-means clustering method is employed to classify the monitoring data, followed by the application of the FP-Growth algorithm to conduct association analysis between deformation at various monitoring points and external triggering factors, such as reservoir water levels and rainfall. Effective association rules influencing landslide deformation are extracted from the extensive monitoring dataset. By integrating these findings with field-measured data analysis, we propose a movement pattern for the Huangtupo No. 1 riverside sliding mass. This research aims to provide a foundational understanding of the deformation mechanisms of reservoir-induced landslides in the TGRA.

2. Background

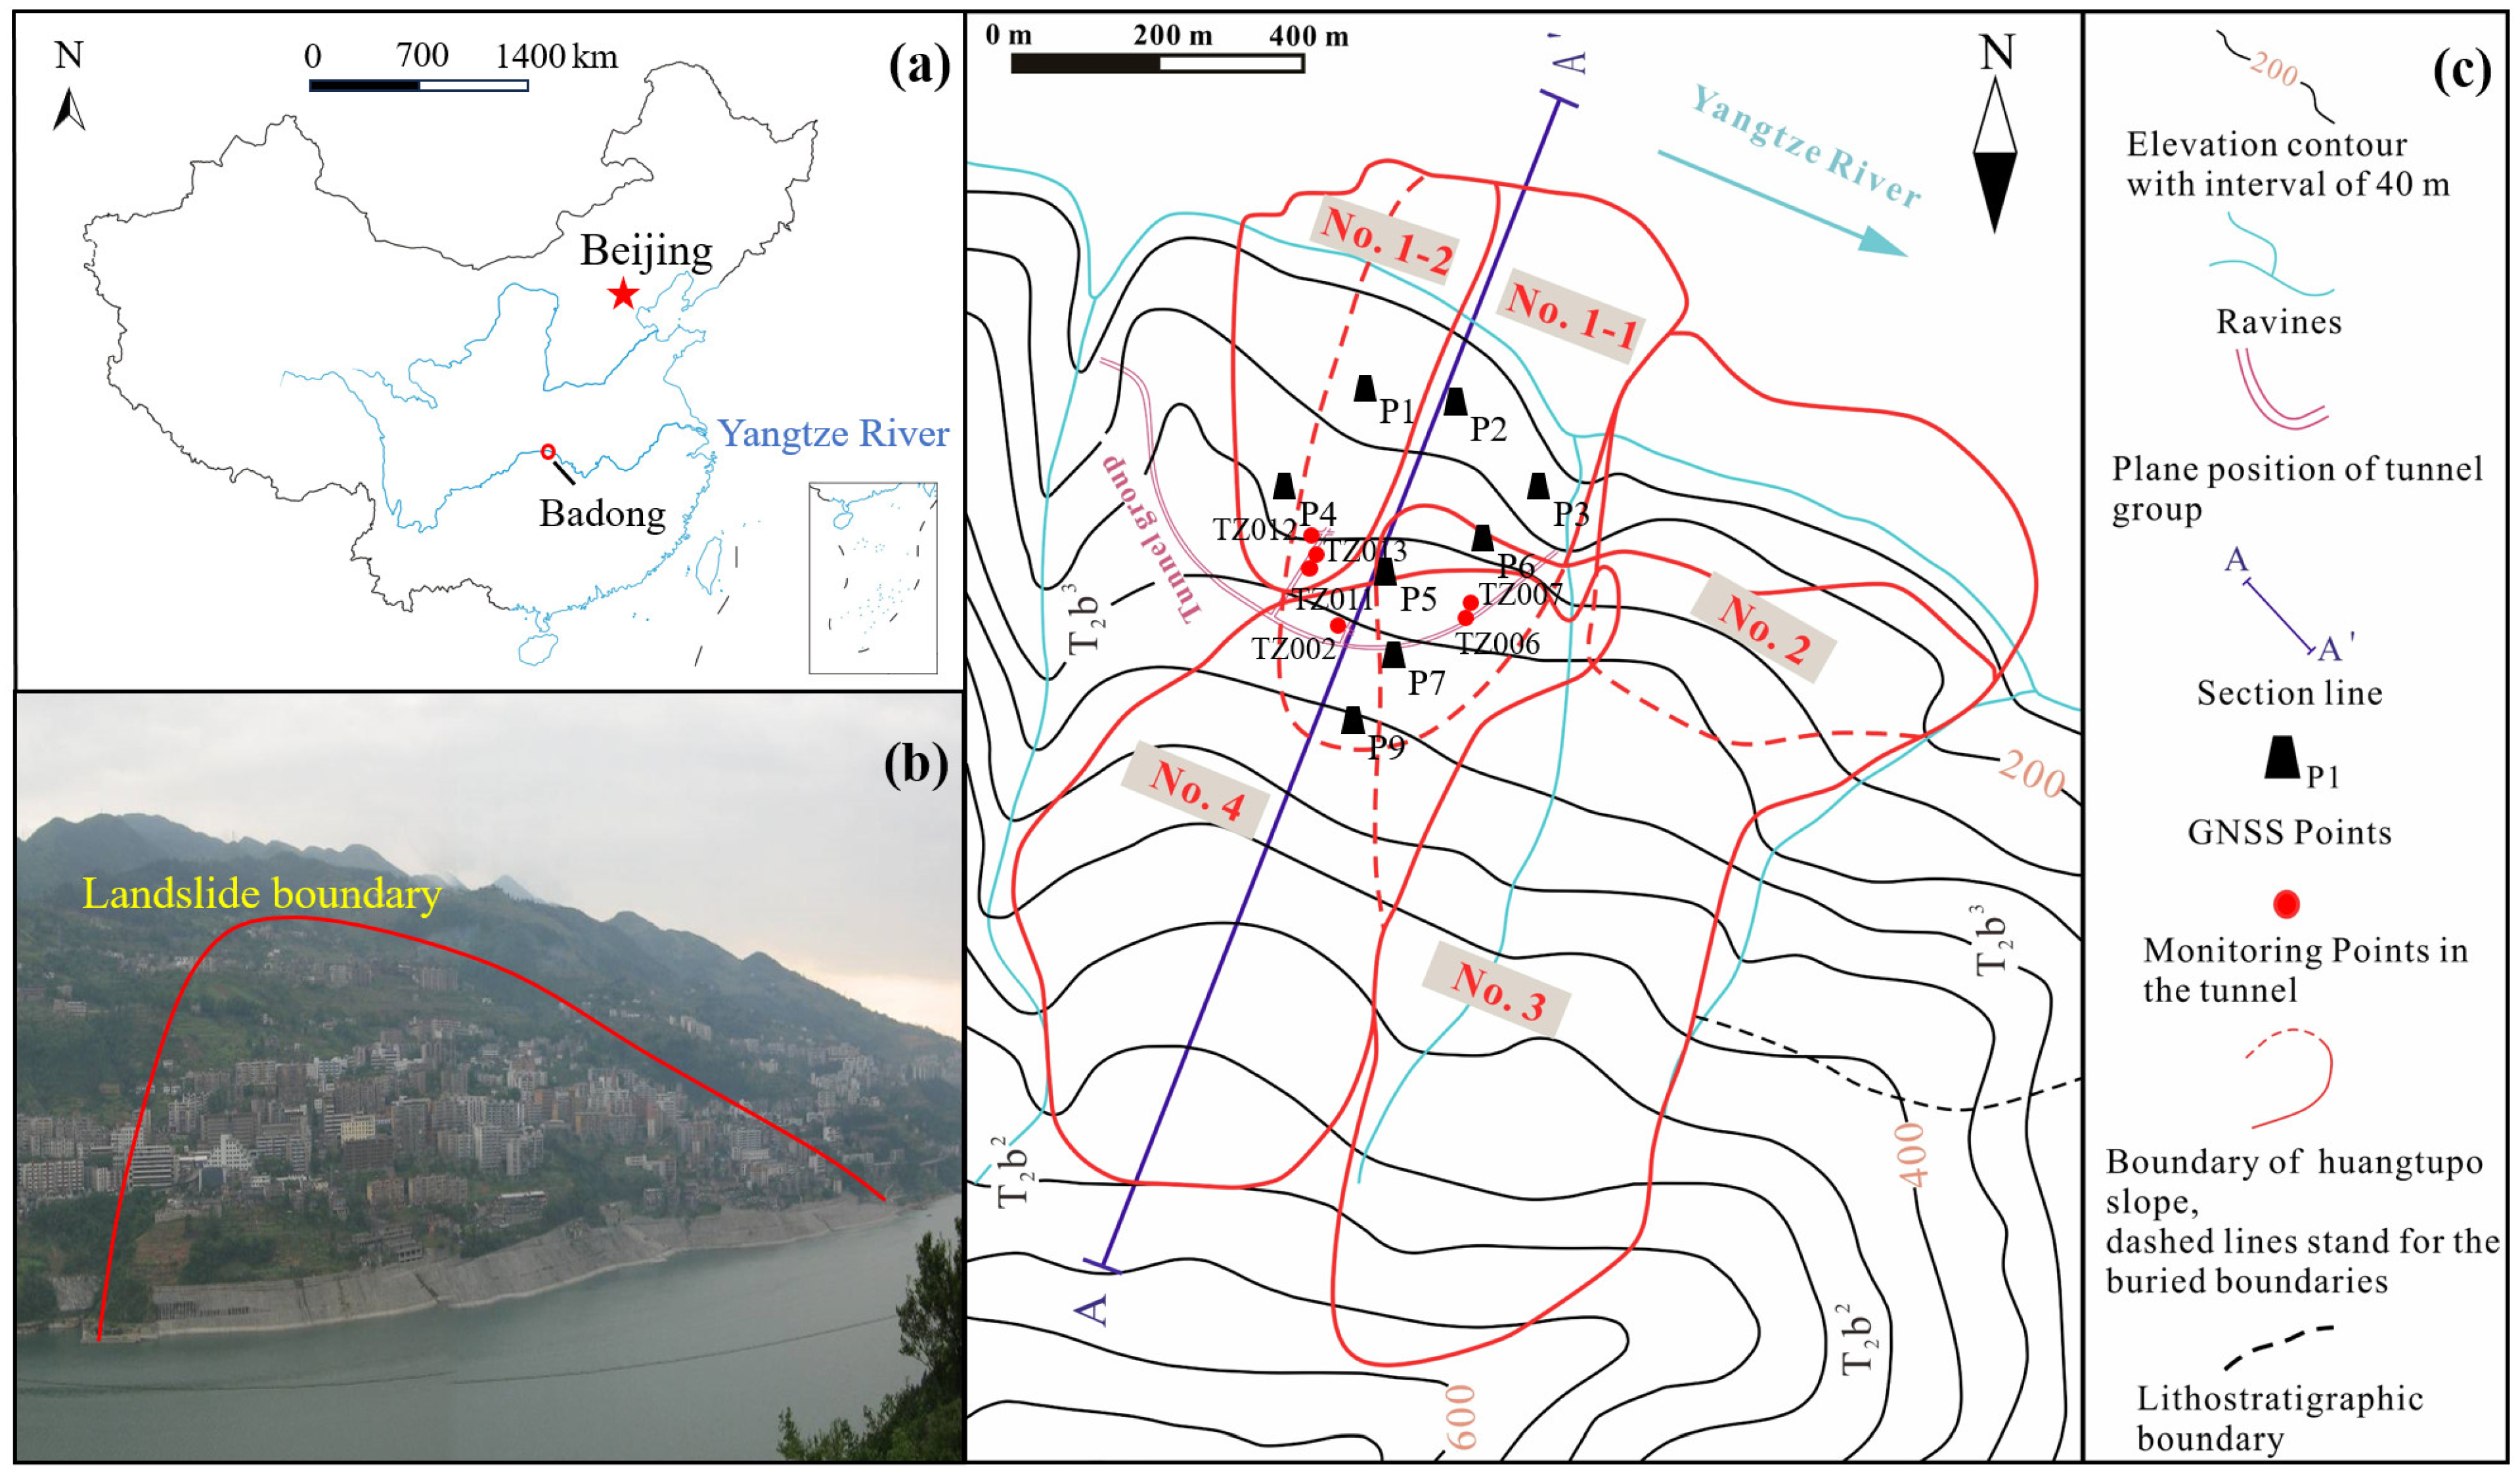
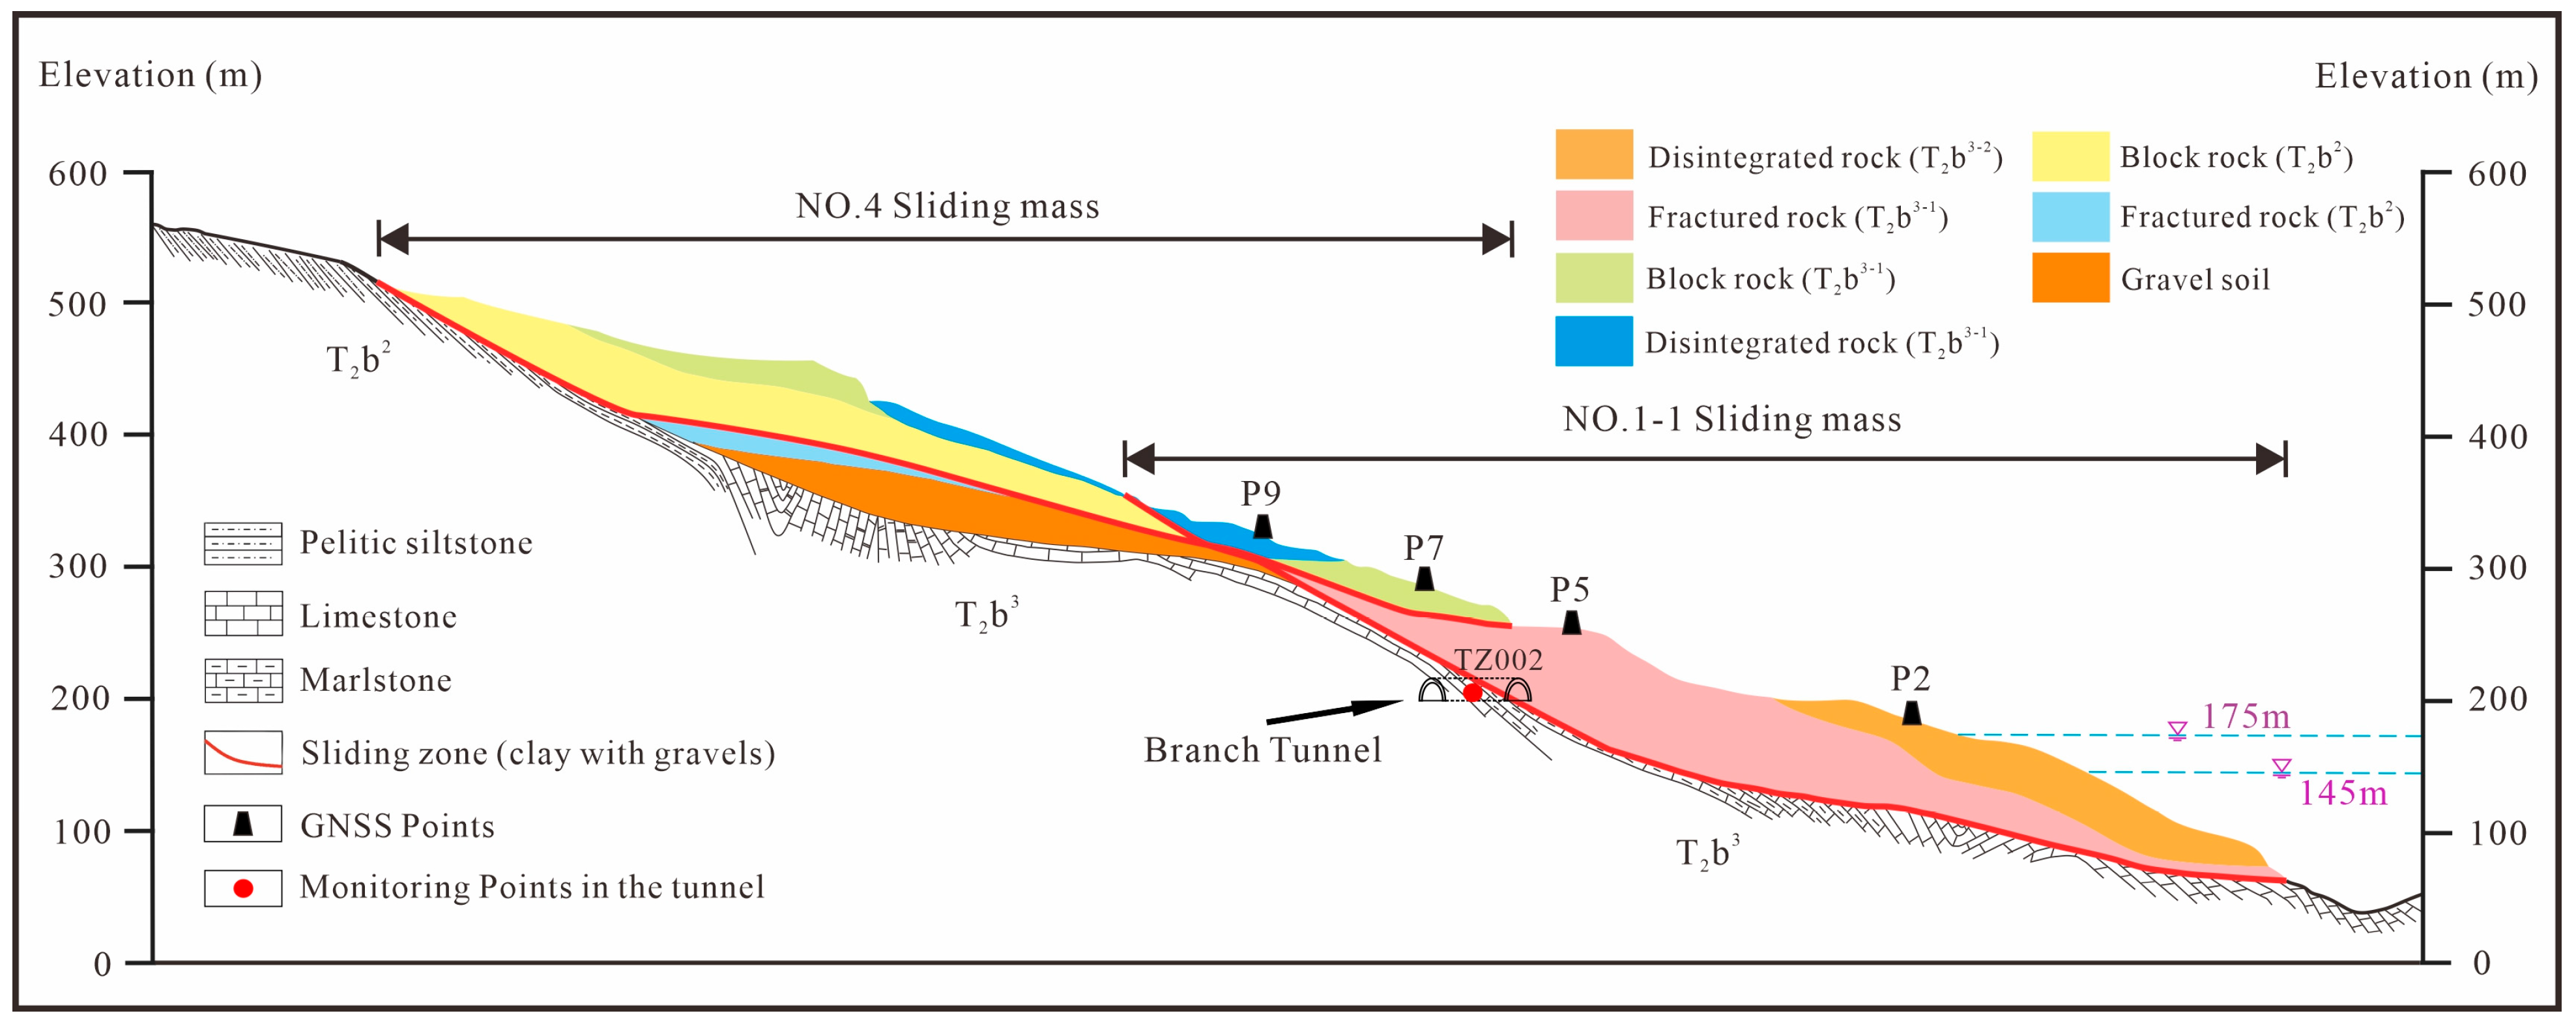
2.1. Geological Setting

The Huangtupo landslide is located in Badong County, Hubei Province, on the southern bank of the Yangtze River, approximately 69 km from the Three Gorges Dam (see Figure 1a). As one of the largest and most destructive landslides within the TGRA, the Huangtupo landslide comprises several sliding masses: the No. 1 (northwest) and the No. 2 (northeast) riverside sliding masses, the No. 3 substation slide (southwest), and the No. 4 garden spot slide (southeast). The No. 1 riverside sliding mass can be further divided into two partially overlapping secondary sliding masses, designated as sliding masses No. 1-1 and No. 1-2, with volumes of approximately 13 and 5 million m3, respectively [30]. In terms of topography, the landslide exhibits a steep morphology at both the front and rear sections, while the central portion is relatively gentle (Figure 1b,c). The elevation of the Huangtupo landslide ranges from 50 m to 600 m above sea level, with the shear outlets of the No. 1 and No. 2 sliding masses submerged in the Yangtze River, where the reservoir water level fluctuates between 145 m and 175 m [31]. The total area of the Huangtupo landslide is 1.35 km2, with a total volume of 69.34 million m3, meaning it can be categorized as a typical giant landslide within the TGRA.
Monitoring data indicate that the No. 1 riverside sliding mass is the most actively deforming area within this large-scale landslide group. Consequently, it has garnered significant attention from governmental, scientific, engineering, and research communities. To systematically investigate the deformation mechanisms, failure processes, and potential deformation trends in the No. 1 riverside sliding mass, the China University of Geosciences established a comprehensive surface and subsurface multi-field monitoring system in the area in December 2012. This system includes an underground observation tunnel group within the No. 1 riverside sliding mass, consisting of one main tunnel and five branch tunnels, with a total length of 1.1 km and tunnel diameters ranging from 3 to 5 m. Additionally, various surface and subsurface monitoring instruments were installed to characterize the internal structure of the landslide and to monitor deep deformation processes.
The Huangtupo landslide is located on the dipping strata of the Badong Group, Middle Triassic Formation (T2b), which contains multiple weak layers and major rupture zones [32]. The material of the sliding mass consists of block rock, fractured rock, and disintegrated rock, along with gravel soils originating from the second and third segments of the Badong Formation (T2b2, T2b3). The sliding zone of the riverside sliding masses is composed of grayish-yellow silty clays with gravel, while the sliding zone of the overlaying No. 3 and No. 4 landslides is formed by brownish-red silty clay with gravel. The underlying stable bedrock of the Huangtupo landslide consists of limestone and dolomitic limestone from the Jialingjiang Group and Lower Triassic Formation (T1j), as well as interlayered clastic and carbonate rocks from the Badong Formation (T2b3) [33]. The dip direction of the bedrock is N25° E, with a dip angle varying between 30° and 50°. The sliding zone generally follows the dip direction of the underlying bedrock [30], as illustrated in Figure 2.

2.2. Deformation Characteristic of the Landslide

Based on systematic investigations and multi-field monitoring data, the unstable area of the Huangtupo landslide is primarily located within the No. 1 riverside sliding mass, which continues to experience relatively rapid and continuous creep. The largest cumulative displacement recorded between January 2016 and July 2017 was observed on the northeast side of the landslide, reaching 90 mm [34,35]. The latest monitoring network consists of eight surface GNSS monitoring points and six precision measurement points within the underground tunnel group, designed to capture deformation data from both the landslide surface and the tunnels. The spatial distribution of these monitoring points, along with field photographs of selected sites, is illustrated in Figure 1c and Figure 3. Specifically, GNSS monitoring points P1, P2, and P3 are situated at the front of the landslide, while P4, P5, and P6 are located in the middle section, and P7 and P9 are positioned at the rear edge. Data for these monitoring points were collected from April 2019 to April 2024. Within the tunnel system, precision measurement point TZ002 is located in the No. 5 branch tunnel in the central part of the sliding mass; TZ011, TZ012, and TZ013 are situated in the No. 3 branch tunnel on the western side; and TZ006 and TZ007 are positioned in the main tunnel on the eastern side. Data collection for the tunnel monitoring points spanned from May 2022 to April 2024.
The impoundment of the Three Gorges Reservoir commenced in 2003; the water level was first raised to its maximum design operating level of 175 m in October 2010. Since then, it has fluctuated annually between 145 m and 175 m. During the flood season, from June to September, the reservoir water level is typically maintained near 145 m to regulate flooding. A comparison of accumulation deformation curves at different monitoring points reveals significant spatial variability. This statement is a qualitative description of the overall landslide deformation (Figure 4). The largest accumulative deformation, recorded during the monitoring period, occurred at P3 at the front of the landslide, reaching 156.5 mm. Deformation values at P1 and P2 in the front section were 92.4 mm and 108.9 mm, respectively. In the middle section, P4, P5, and P6 exhibited deformations of 65.7 mm, 92.4 mm, and 128.6 mm, respectively. At the rear edge, the deformations at P7 and P9 were 49.8 mm and 69.1 mm, respectively. These results demonstrate a progressive decrease in deformation from the front to the rear of the landslide and from the eastern side to the western side.
Monitoring data within the tunnel similarly highlight the spatial variability in deep-seated deformation. On the eastern side, the displacements at TZ006 and TZ007 were 77.85 mm and 33.65 mm, respectively. They were significantly greater than the value of 26.40 mm recorded at TZ002 in the central area. TZ002 exhibited greater displacement than TZ011, TZ012, and TZ013 on the western side, which recorded deformations of 7.37 mm, 10.24 mm, and 22.83 mm, respectively. These deformation trends confirm that the eastern side of the No. 1 riverside sliding mass experiences greater overall deformation than the western side. Recent geological investigations further subdivide the No. 1 riverside sliding mass into two sub-sliding masses with varying sliding plane depths, designated as No. 1-1 and No. 1-2. On the eastern side, No. 1-1 has a sliding zone with a maximum burial depth of nearly 80 m, with sliding activity dating back approximately 100 ka. Conversely, No. 1-2 on the western side has a shallower sliding zone, with a burial depth of about 60 m, and its earliest sliding activity occurred approximately 40 ka ago [7] (Tang et al. 2015). The differential deformation observed between the eastern and western sides of the No. 1 riverside sliding mass corroborates the relative independence of the two sub-sliding masses, further validating the reliability of the monitoring data.
A comparison of reservoir water levels indicates that deformation at monitoring points generally exhibits a “step-like” increase in response to periodic water level fluctuations. During rapid water level drawdown and subsequent low-level fluctuations, the deformation curves show marked increases in deformation rates, displaying distinct “step-like” patterns. The most pronounced accelerated deformation occurred at P2, where cumulative deformation between August and September 2019 reached 29.3 mm. Rainfall, in addition to reservoir water levels, is a critical factor influencing landslide deformation. An analysis of historical rainfall data reveals that the annual rainy season significantly overlaps with phases of deformation increase observed at GNSS monitoring points. This correlation is particularly evident during periods of high rainfall that coincide with the reservoir water level drawdown when deformation increments are most pronounced. For instance, at monitoring point P5, from May to August 2021, the reservoir water level rapidly decreased and operated at a low level, leading to a cumulative deformation increase of 15.6 mm, approximately half of the annual deformation for 2021. In contrast, when the reservoir water level rises or remains high, the influence of rainfall on landslide deformation is relatively weaker. At monitoring point P2, from August to October 2023, despite total rainfall reaching over 40% (588.5 mm) of the annual total, the deformation remained stable due to the rising reservoir water level.
Deformation variations at monitoring points demonstrate a clear correlation with both rainfall and reservoir water levels. However, the temporal overlap between reservoir water level regulation periods and concentrated rainfall months, combined with the variability in the timing of deformation surges across different monitoring points, complicates the precise quantification of the respective contributions of these external factors. These complexities introduce uncertainties in the study of the deformation mechanisms of the No. 1 riverside sliding mass.

3. Method

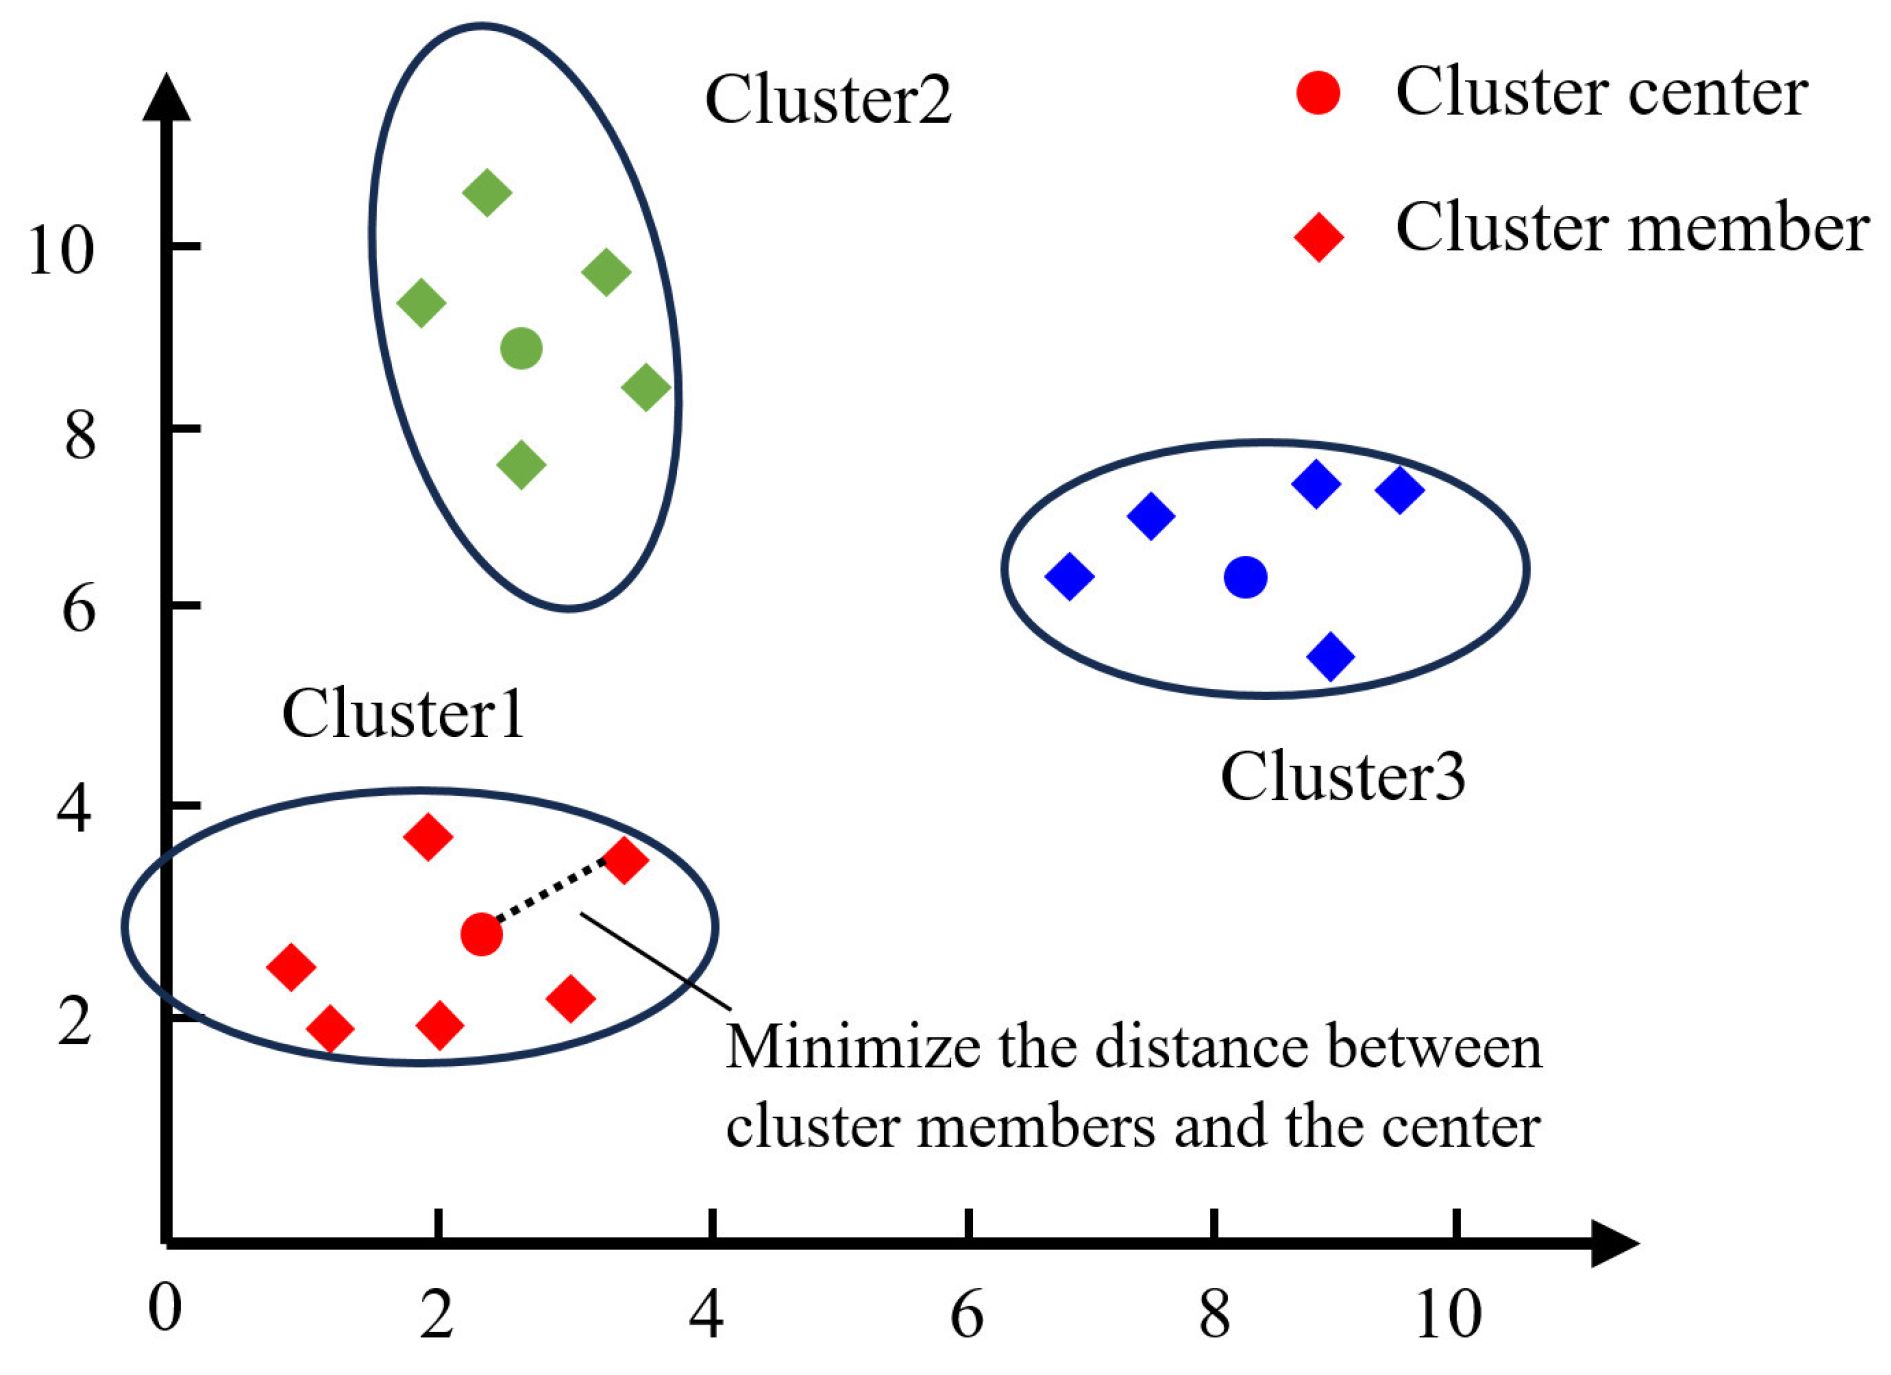
3.1. K-Means Clustering Method

The technical workflow of the data mining method proposed in this study is illustrated in Figure 5. All algorithms are implemented in MATLAB R2019b. The association rules algorithm is not equipped to handle numerical variables, which constitute the majority of landslide monitoring data types. Therefore, it is crucial to convert these numerical variables into the classified variables that the association rules algorithm can process prior to conducting the correlation analysis. K-means clustering is a widely used unsupervised learning algorithm capable of managing large-scale unlabeled data, including both numerical and discrete variables. This algorithm automatically groups data objects with high similarity into several clusters and has been widely applied in data mining research [36]. The core of K-means clustering methods is an optimization expectation maximization algorithm (see Figure 6), with the specific processes outlined as follows:
(1)
The number of clusters (K) is determined using methods such as the Elbow method and Silhouette analysis. K initial cluster centers (C1, C2, …, CK) are randomly selected from the N sample datasets.
(2)
The Euclidean distance (as defined in Equation (1)) between each cluster center Ci and the remaining data objects X is calculated to identify the target objects closest to the cluster center Ci, which are classified as the cluster members of cluster i, where m is the dimension of the data objects, Cij is the value of the jth dimension of the cluster center Ci, and Xj is the value of the jth dimension of the data object X.
D C i , X = j = 1 m C i j X j 2
(3)
For each cluster, i obtains ni samples, ∑ni = N, where i = 1, 2, …, K. The mean vector Mi (Equation (2)) of cluster i is defined as the centroid of the cluster. This is updated to the new cluster center Ci, where Xji is the jth sample belonging to cluster i:
M i = 1 n i j = 1 n i X j i
(4)
The sum of squared errors (SSE, as defined in Equation (3)) for all data objects is an important indicator for measuring clustering performance when aiming to improve the tightness of the cluster by minimizing SSE. SSE is calculated as follows:
S S E = i = 1 K X C i D C i ,   X 2
(5)
It is necessary to repeat steps (2)–(4). The calculations are updated iteratively, depending on the Euclidean distances between cluster members and centers, until a stable position is reached where the cluster centers no longer change. Alternatively, the maximum number of iterations is reached, or the SSE is locally minimized.

3.2. FP-Growth Algorithm

The classified variables obtained from K-means clustering are further analyzed using the FP-Growth algorithm to mine association rules from the monitoring data. The FP-Growth algorithm, proposed by Han and Kamber [37], aims to address the inherent limitations of the Apriori algorithm, particularly its prolonged computation time and low efficiency. Compared to traditional statistical correlation methods, FP-Growth allows for the discovery of complex, non-linear relationships and dependencies between variables without requiring prior assumptions about their distribution.

3.2.1. Basic Concept

The fundamental concepts utilized in the FP-Growth algorithm are defined as follows:
(1)
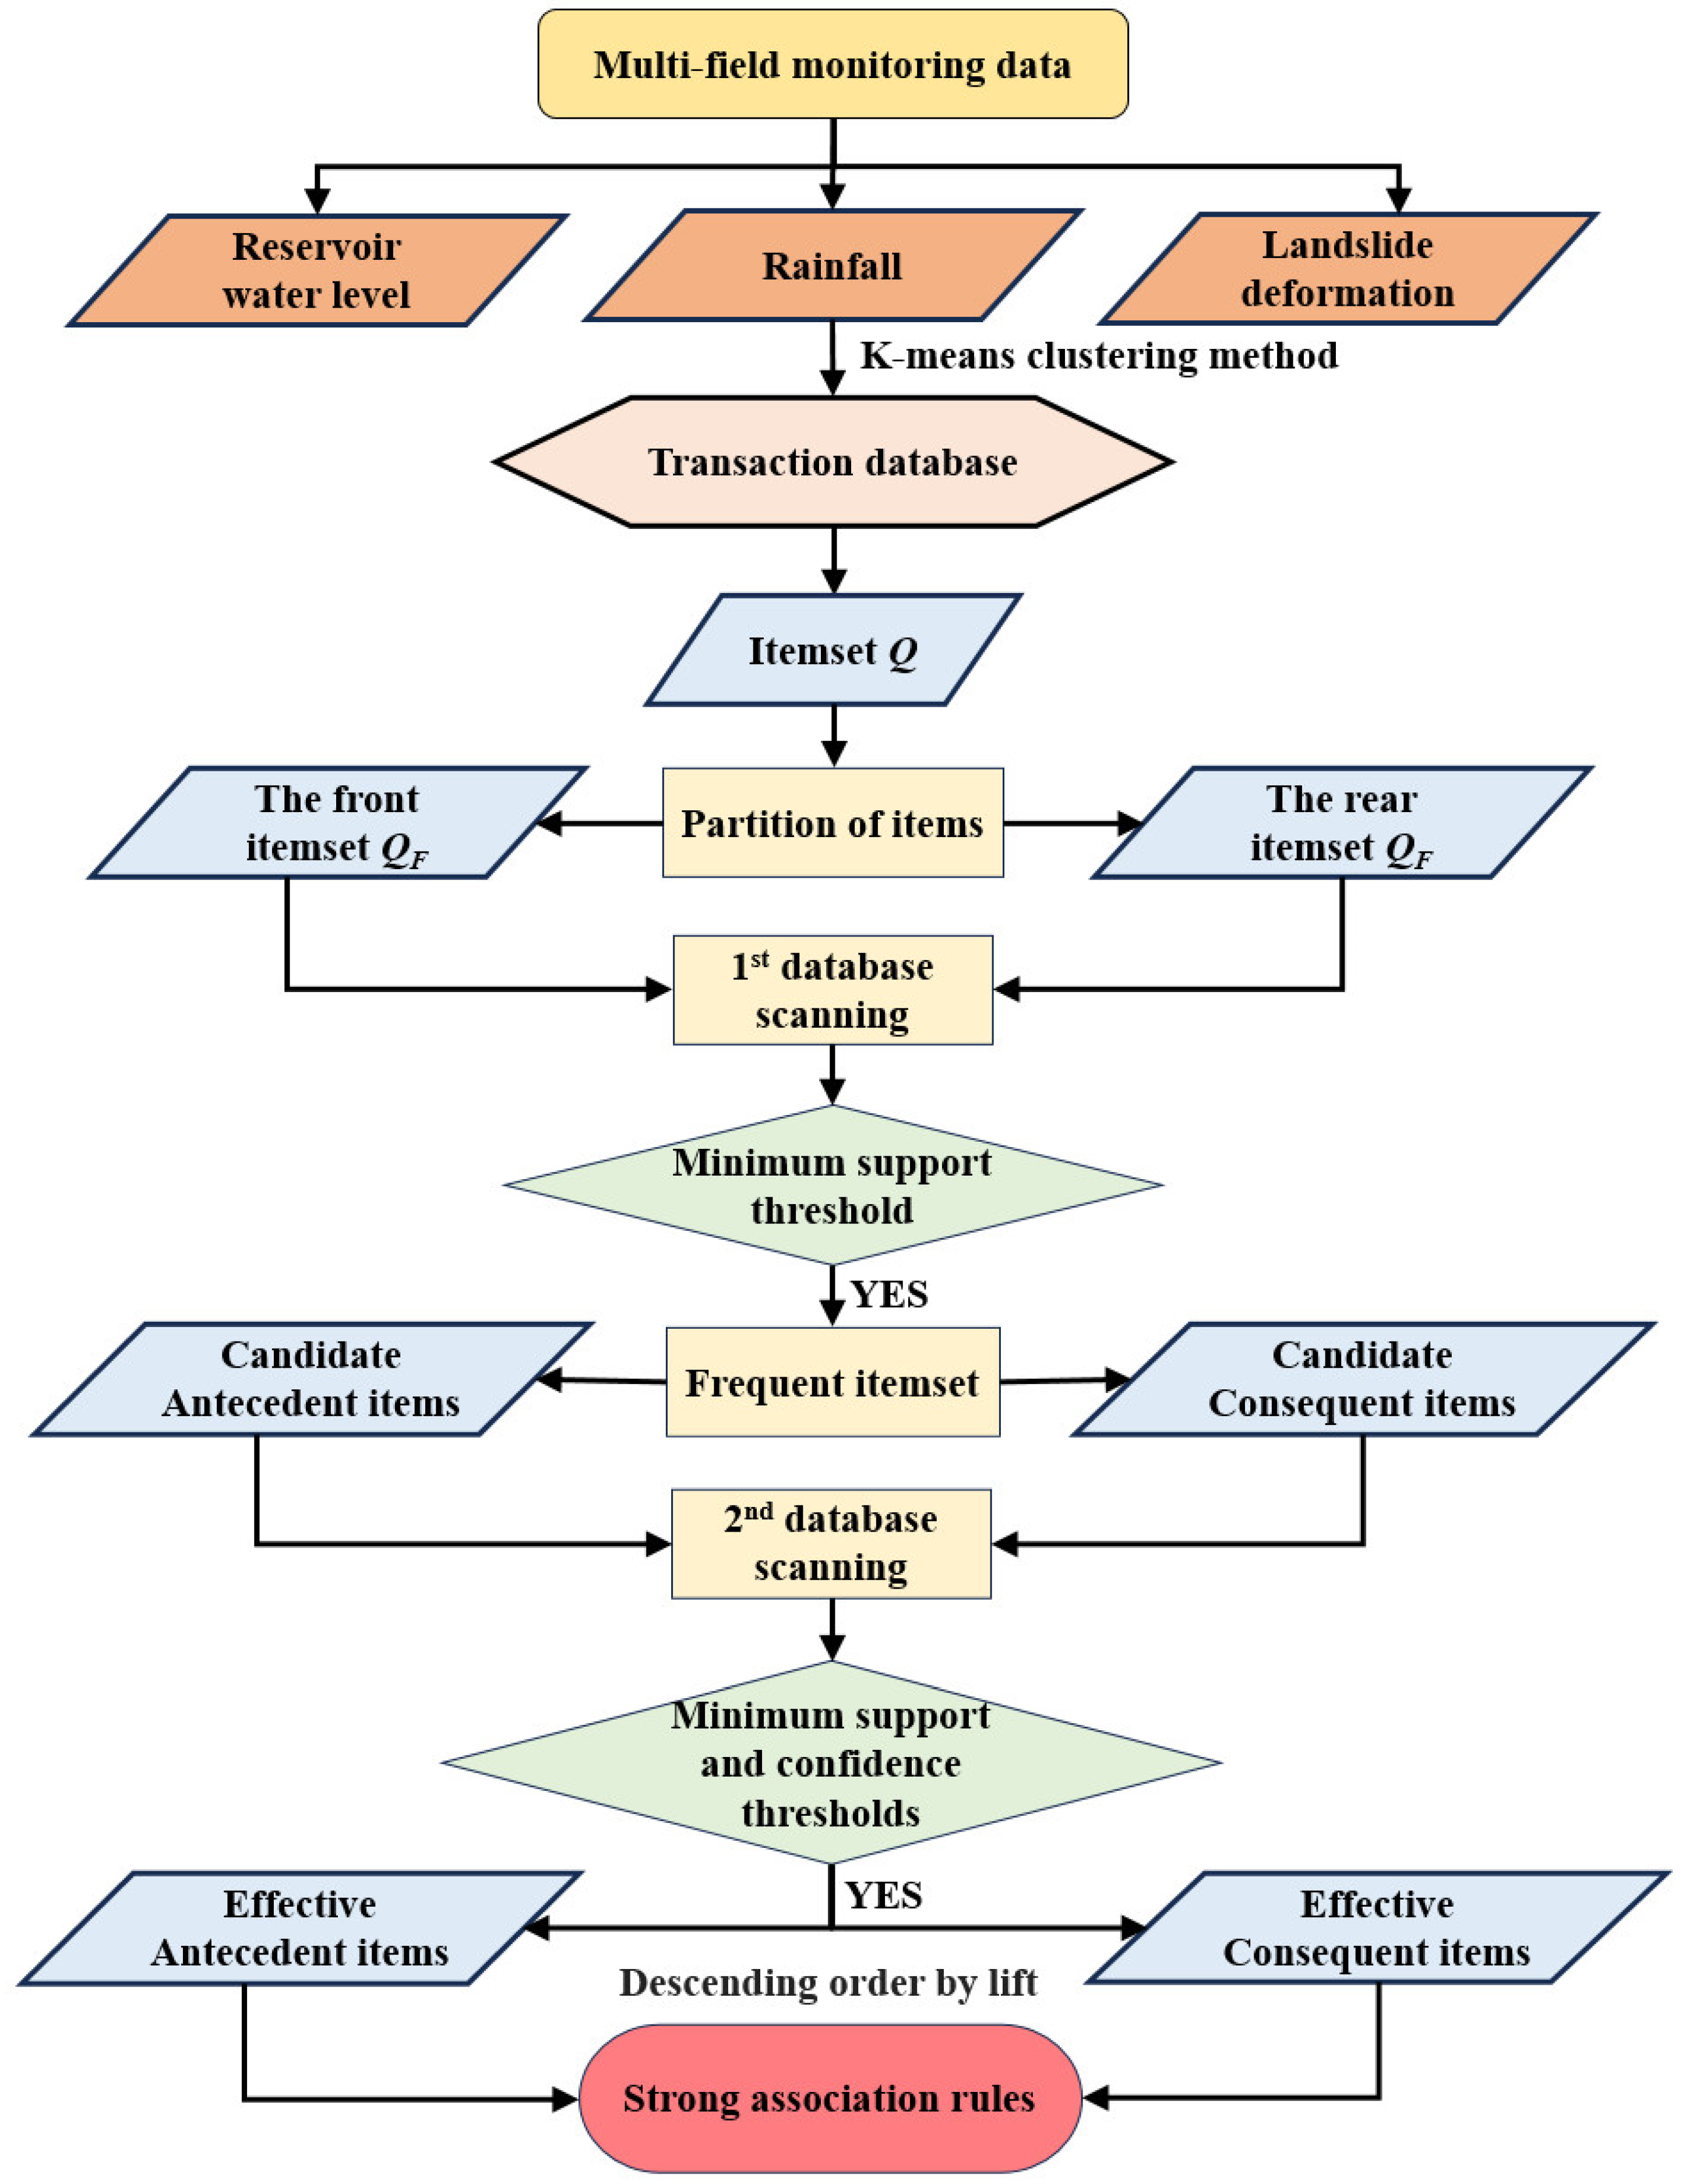
Itemset Q is a collection of items Qi, which is defined as
Q = Q F Q R = Q 1 ,   Q 2 ,   ,   Q m
where QF is the front itemset and QR is the rear itemset, with Q F and Q R . There is no intersection between QF and QR, namely, Q F Q R = . For the landslide deformation response analysis, QF and QR represent the triggering factors and the deformation events, respectively.
(2)
Transaction database P consists of task-related transaction items, with P = {P1, P2, …, Pn}, P k Q 1 k n . Each transaction Pk is a nonempty itemset, containing at least one front item and one rear item.
(3)
The antecedent item X is the nonempty proper subsets of QF, and the consequent item Y is the nonempty proper subsets of QR. The association rule (AR) represents a correlation between items, like AR XY. X is regarded as the condition of AR, while Y is regarded as the conclusion of AR. It means that if item X occurs, item Y will also occur with a certain probability.
(4)
Support refers to the probability of items X and Y appearing simultaneously in the collection of transaction database P, namely, the proportion of transactions containing both X and Y to the total transactions in the database, which is defined as follows:
S u p p ( X Y ) = P X Y P
(5)
Confidence indicates the occurrence probability of Y, assuming that X has already occurred, which is defined as follows:
C o n f ( X Y ) = P X Y P X
(6)
Lift denotes the degree to which the Y is affected by the appearance of X in the collection of transaction database P. The appearance of X promotes the Y when the value of lift is greater than one. The expression is as follows:
L i f t ( X Y ) = P X Y P X / P Y P
The corresponding support, confidence, and lift are required for each association rule, which is utilized to determine the validation of the association rules. If the candidate association rule CAR XY satisfies the threshold of minimum support, indicating that CAR XY is a frequent pattern. The CAR XY is referred to as the strong association rule (SAR) if it satisfies the threshold of minimum support and the threshold of minimum confidence simultaneously, and the lift should be greater than one.

3.2.2. Computation Process

The core principle of the FP-Growth algorithm involves reconstructing the transaction database into a frequent pattern tree (FP-Tree), which has a single root labeled as “null”. The FP-Tree is subsequently divided into several conditional databases, from which frequent itemsets are mined. This structure compresses the original transaction database while retaining associated information, significantly reducing the search space, preventing the explosion of association combinations, and enhancing the efficiency of landslide monitoring data mining. The essential computation process of the FP-Growth algorithm is outlined as follows:
(1)
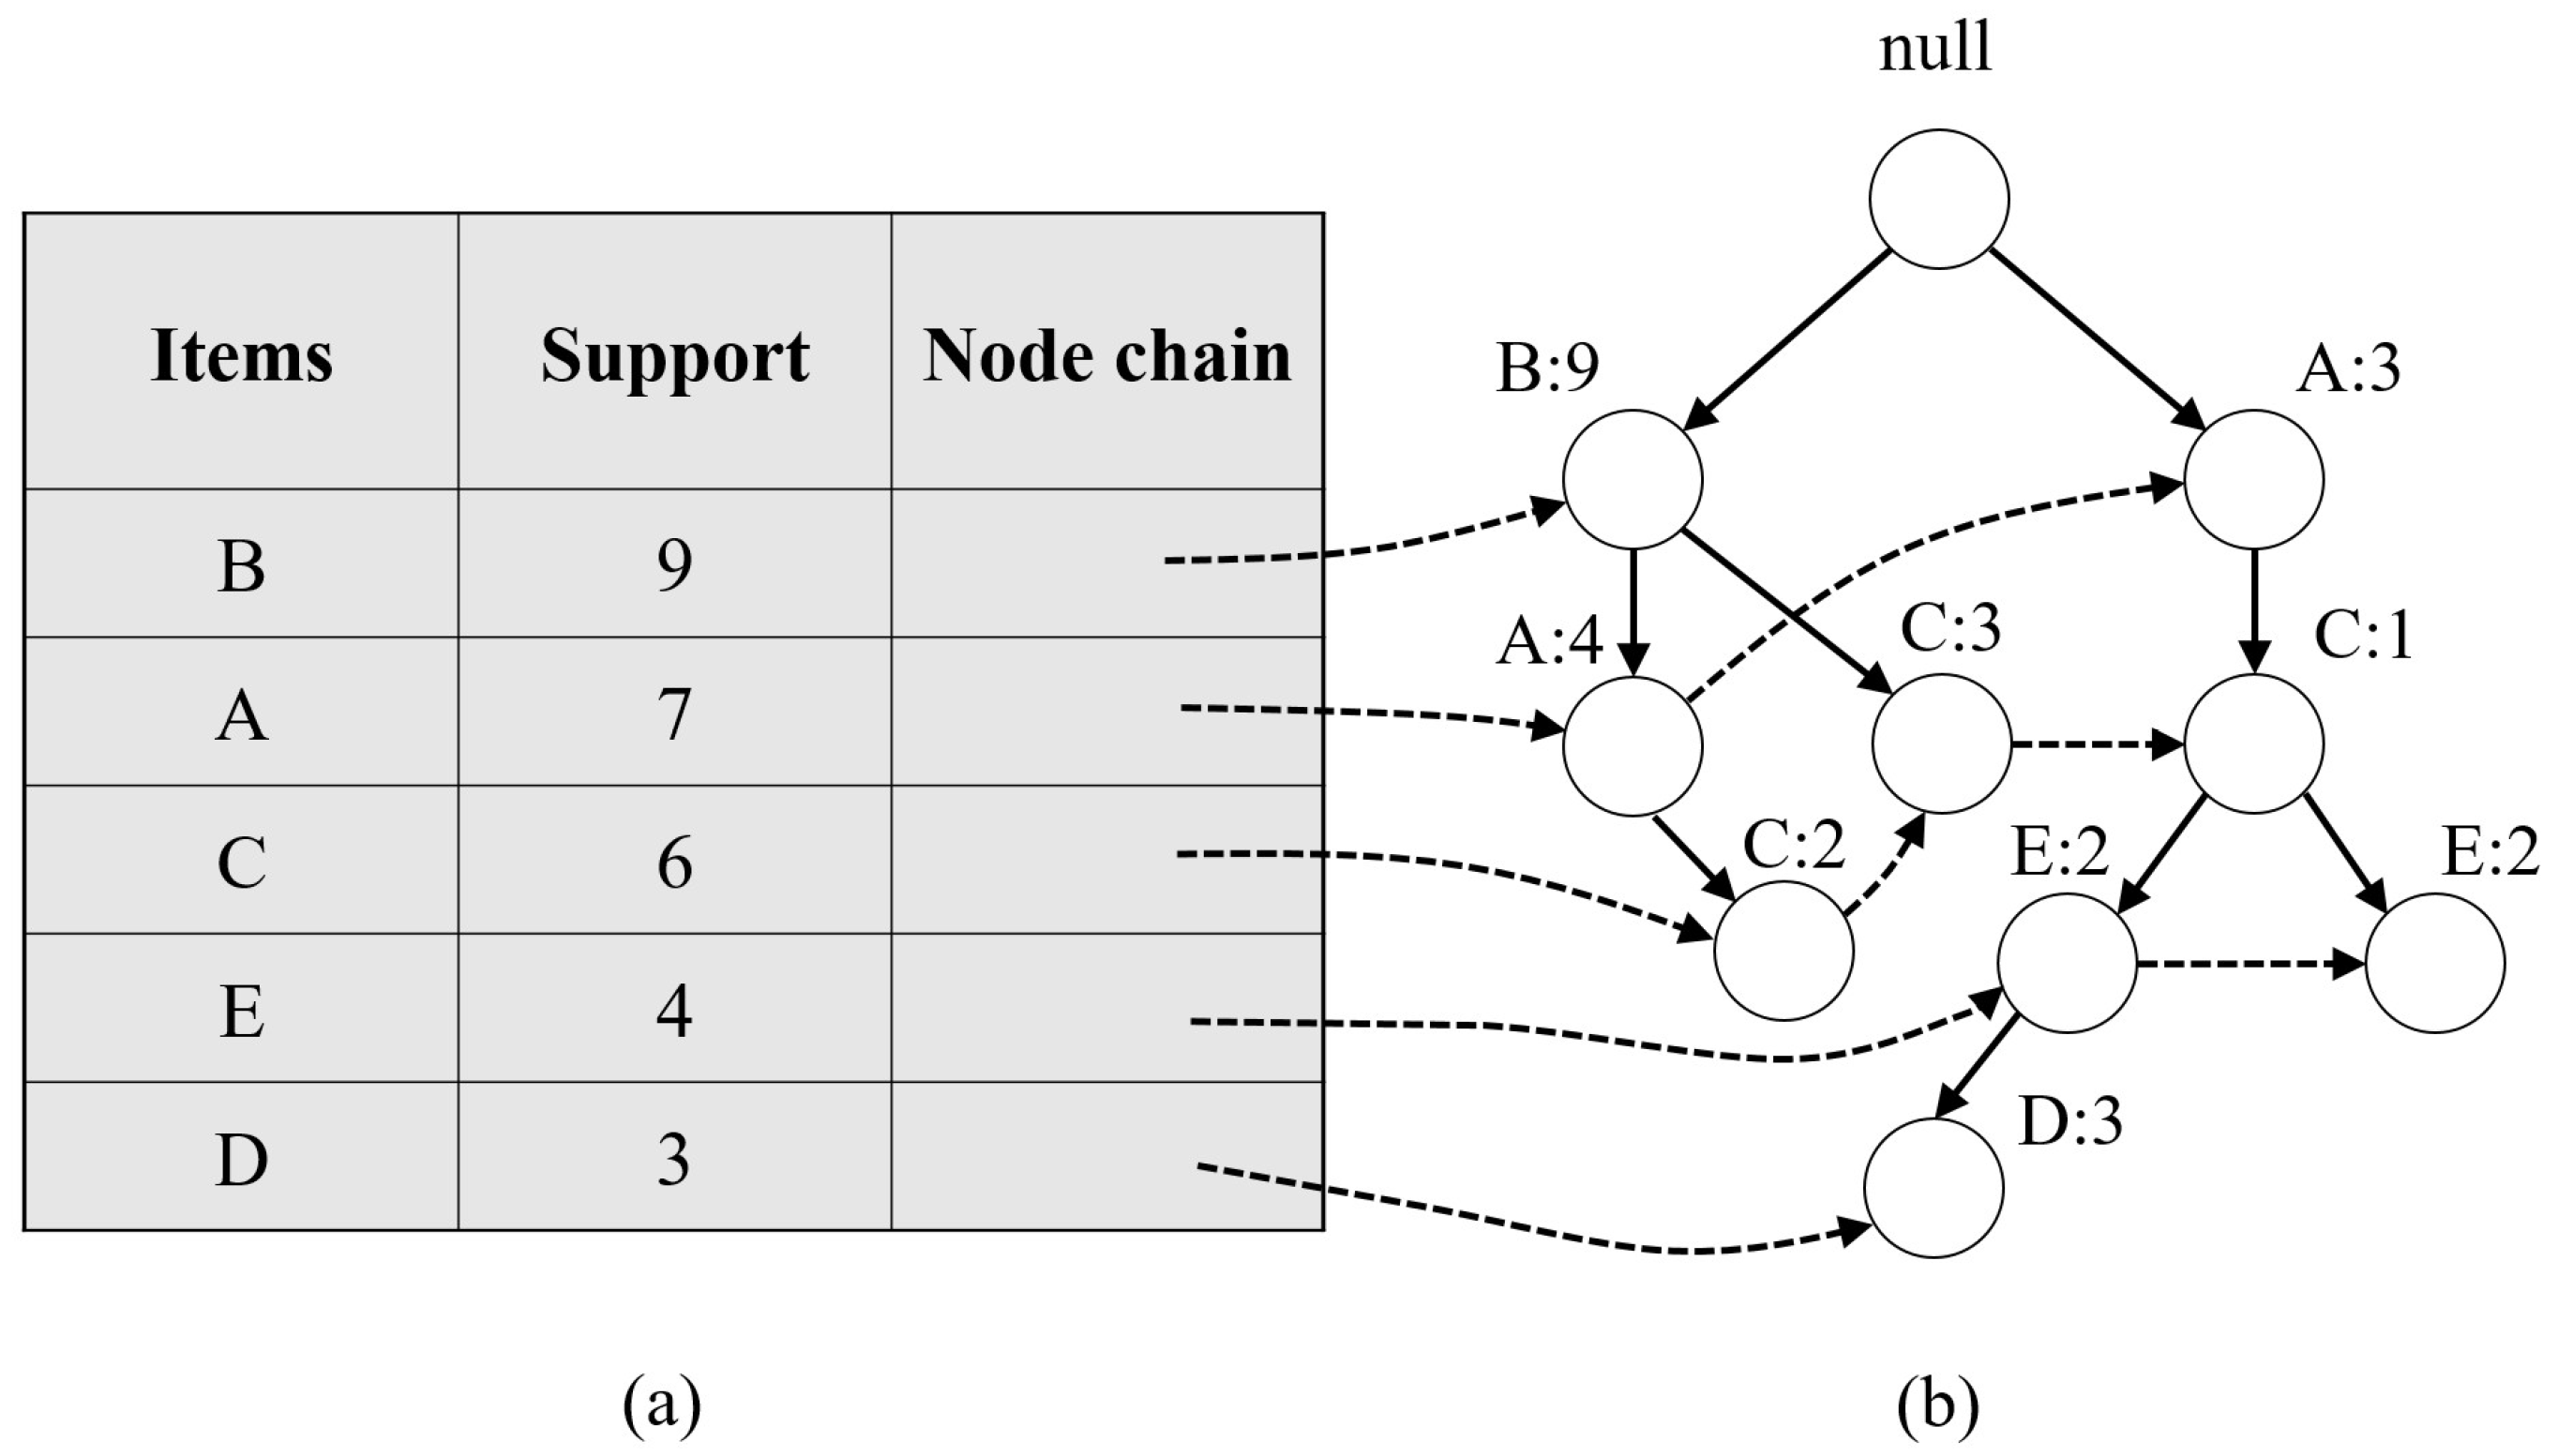
First, the transaction database is scanned overall, calculating the support for each item separately. The minimum support is set to filter the frequent itemset, which will be sorted in the frequent-item header table L in descending order of support count (Figure 7a).
(2)
Second, scan the transaction database, and construct the FP-Tree based on all frequent itemset. The root labeled as “null” will be built first, and then the frequent itemset is inserted into the children of the root by following the order of the frequent-item header table L.
(3)
The head of the node-link is created to facilitate searching FP-Tree (Figure 7b) by connecting each frequent itemset to the tree node of the FP-Tree.
(4)
Based on the links between the frequent-item header table L and the tree nodes, a bottom-up approach is adopted to mine the strong association rules for the priority tree.

4. Results

4.1. Deformation Correlation Factors

Landslide deformation in reservoir areas is significantly influenced by hydrological factors, particularly rainfall and reservoir water level fluctuations [11,38]. The limited sample size of precision measurement data from the underground tunnel group poses challenges in establishing robust correlation criteria for deep-seated deformation. Future research should prioritize the collection of long-term monitoring data to further investigate the relationship between deep-seated landslide deformation and external triggering factors. This study employs monitoring data from multiple GNSS monitoring points on the earth’s surface, as well as hydrometeorological monitoring points, encompassing deformation, rainfall, and reservoir water levels. From the perspectives of rainfall and reservoir water levels, four hydrological factors are selected as antecedent items of association rules, while the monthly cumulative deformation increment at the monitoring points serves as the consequent items. The specific details are as follows:
(1)
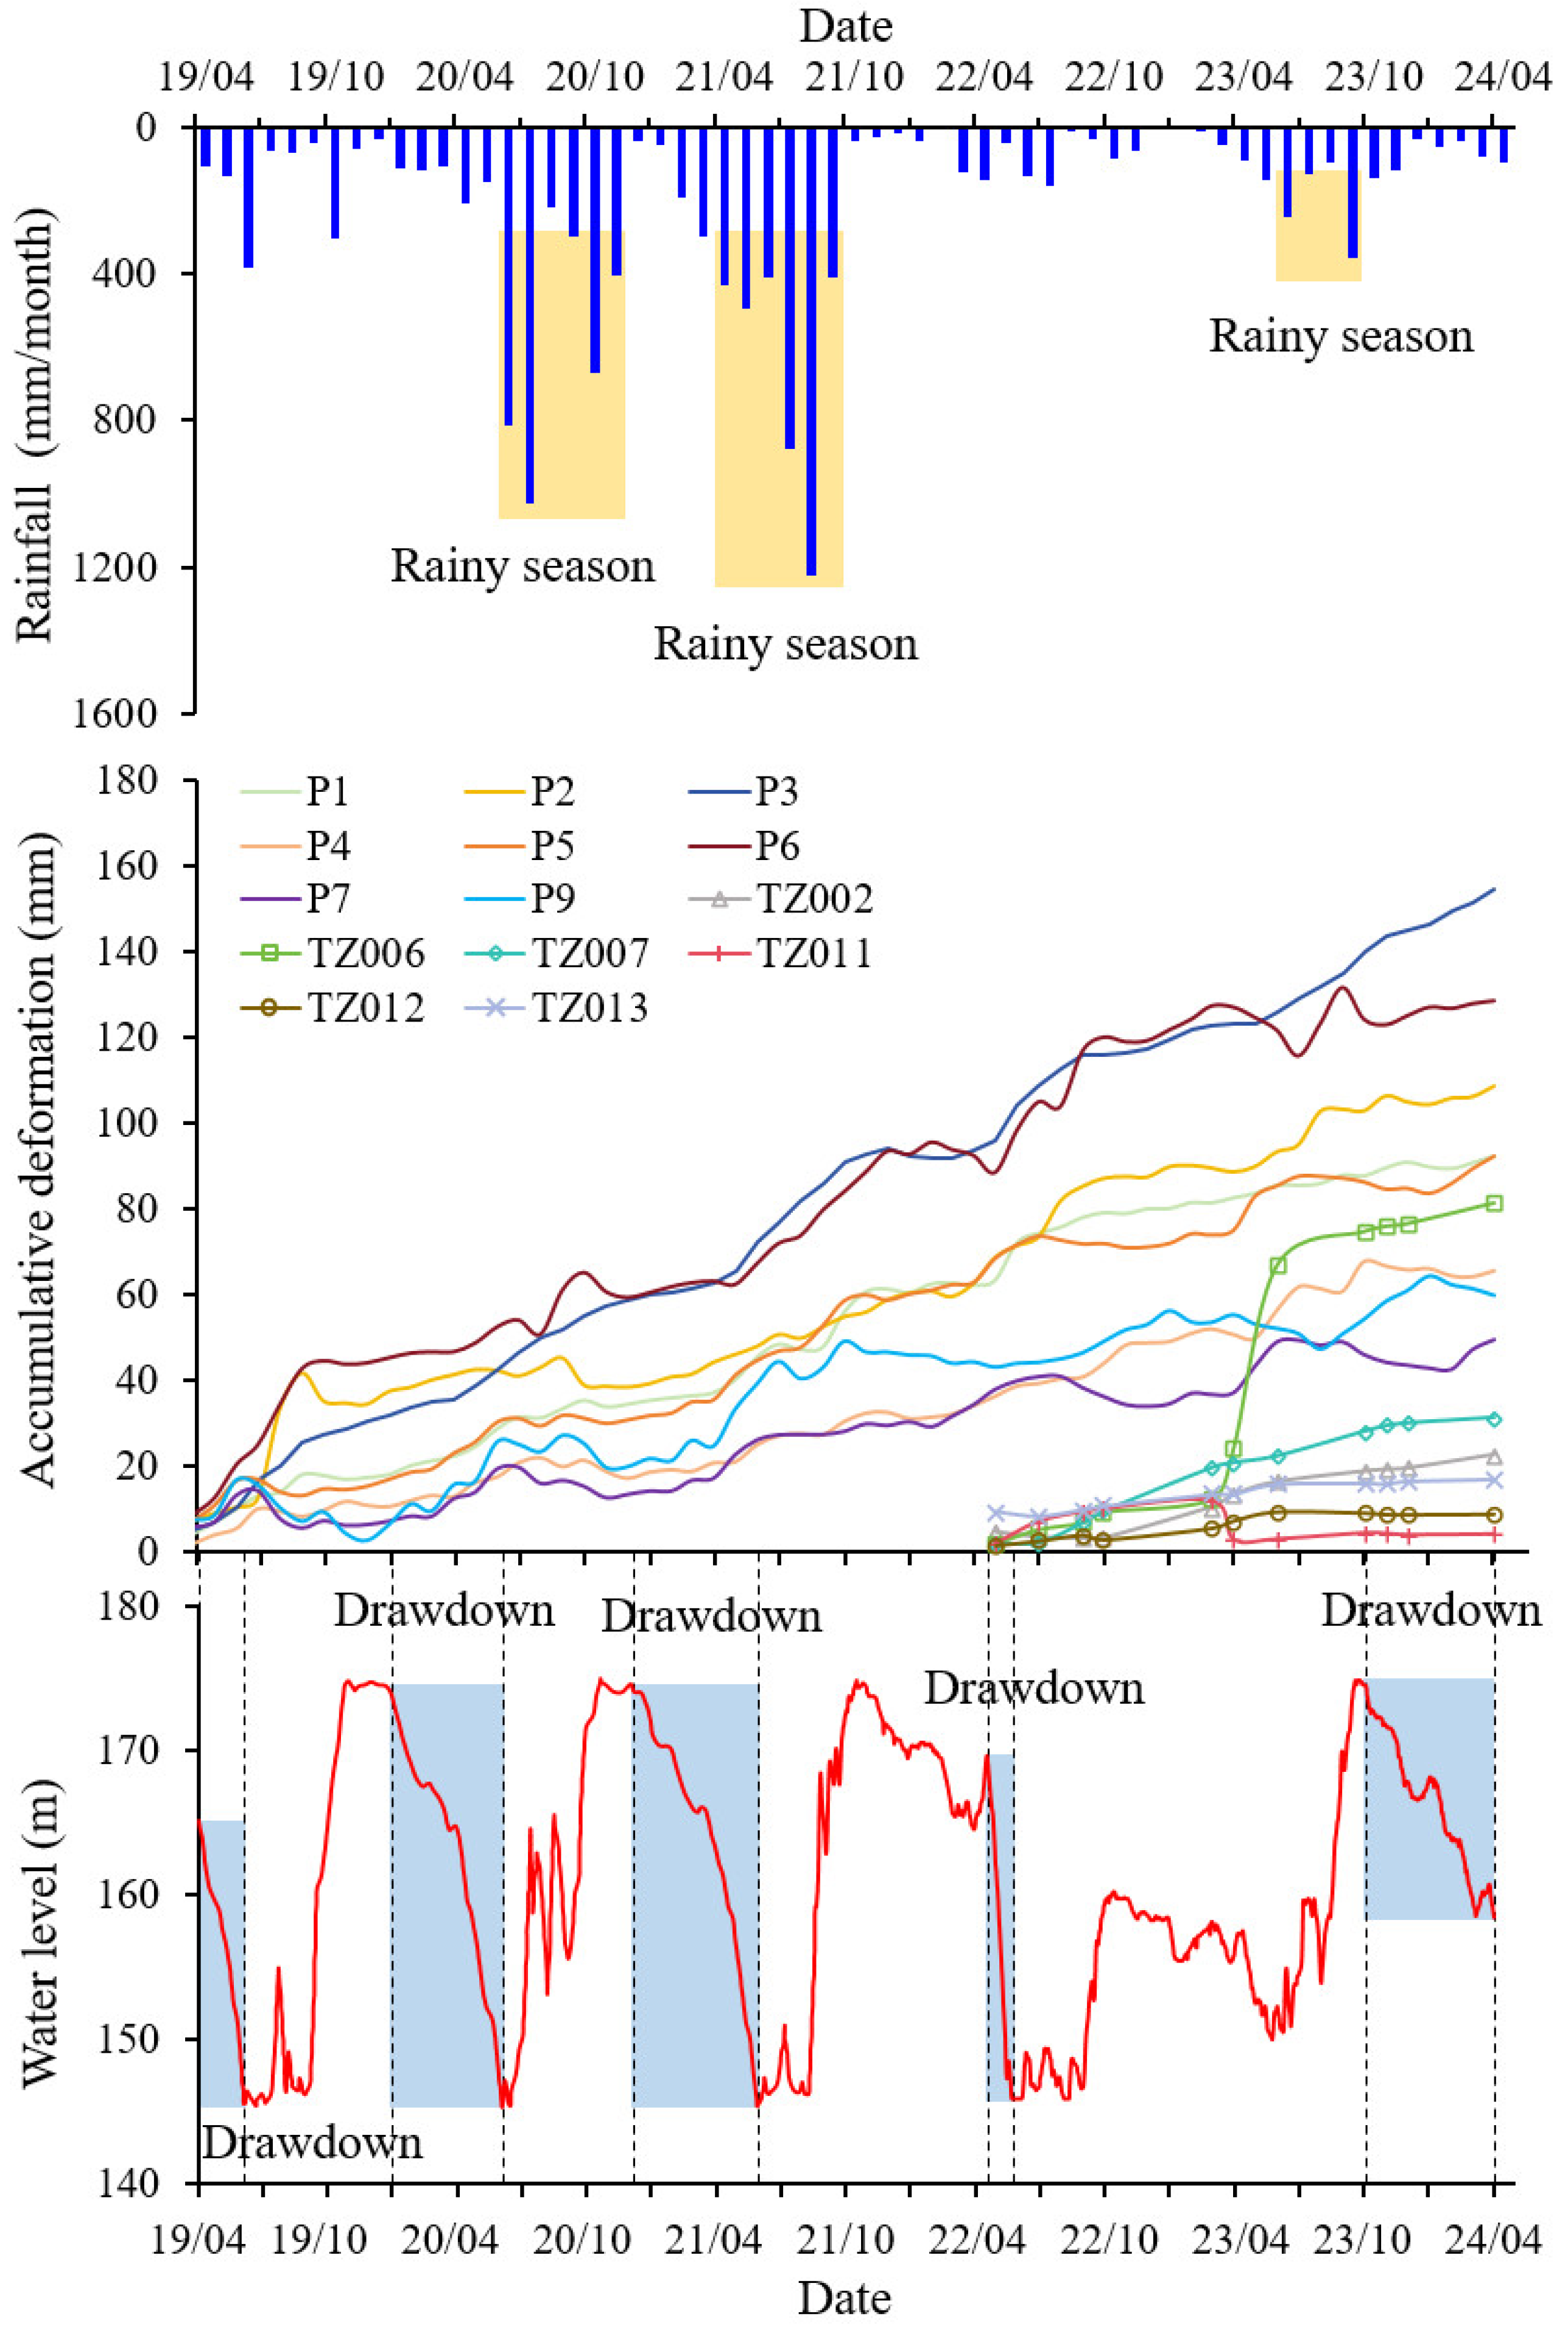
Reservoir Water Level
Fluctuations in reservoir water levels can alter the hydrostatic pressure acting on the sliding mass and induce changes in the groundwater table. These changes result in wet-dry cycles in the sliding-zone soils, leading to material softening, reduced shear strength, and a diminished anti-sliding force. This influence exhibits a pronounced lag effect; in the study by Zhang et al. [39], a lag time of up to 31 days was reported for the Majiagou landslide, a typical reservoir-induced landslide in the TGRA. Those findings provide valuable reference for the analysis undertaken in this work. Consequently, monthly reservoir water levels are preprocessed, correlating the previous month’s reservoir water level with the landslide deformation of the current month. Two hydrological factors are selected to assess the effects of reservoir water levels on landslide deformation: the monthly average reservoir water level ( R ¯ /month) and the monthly reservoir water level variation (ΔR/month).
(2)
Rainfall
Rainfall infiltration primarily affects landslide deformation by altering the groundwater table. Some research indicates that the effect of rainfall on landslide deformation is delayed, typically by approximately 10 days [40]. Therefore, two monthly rainfall-related variables are selected as hydrological factors to analyze their impact on landslide deformation: monthly cumulative rainfall (∑qmonth/mm) and maximum daily rainfall within a month ( q max d a y /mm).
(3)
Surface Deformation
To evaluate the spatial variation in the impact of external hydrological factors on landslide deformation, three representative GNSS monitoring points were selected near cross-section A–A’ (Figure 1c). These points, located at the front (P2), middle (P5), and rear (P7) of the landslide, provide monthly cumulative deformation increments (D/mm), which serve as indicators of deformation rates at different spatial locations.

4.2. Clustering Results

Since the FP-growth algorithm is only applicable to discrete data, it is necessary to classify the landslide monitoring data before performing association rule mining. The K-means method was utilized to cluster the four hydrological factors, as shown in Table 1. The number of clusters was manually determined based on the data analysis requirements while ensuring that the clustering criterion satisfied the Bayesian Information Criterion (BIC). Specifically, the monthly average reservoir water level ( R ¯ /month) is categorized into three levels: Low-Water-Level, Medium-Water-Level, and High-Water-Level. The monthly reservoir water level variation (ΔR/month) is divided into five categories: Sharply Drop, Slowly Drop, Stable-Fluctuation, Slowly Rise, and Sharply Rise. The monthly cumulative rainfall (∑qmonth/mm) is grouped into three categories: Light-Rainfall, Moderate-Rainfall, and Heavy-Rainfall. The maximum daily rainfall within a month ( q max d a y /mm) is similarly classified into Light Daily Rainfall, Moderate Daily Rainfall, and Heavy Daily Rainfall.
Figure 8 displays the count of clustering results of the selected monitoring points. There are significant differences in the monthly cumulative deformation increments at various spatial locations of the landslide. Using the K-means clustering method, the monthly cumulative deformation increments (D/mm) at the P2, P5, and P7 monitoring points, representing the front, middle, and rear sections of the landslide, are clustered into three categories: low, medium, and high. The results indicate that moderate and small deformations predominate across the deformation classifications of all three monitoring points.

4.3. Association Rules Mining

The FP-Growth algorithm was employed to conduct association rule mining on the database constructed in the previous section. The antecedent items for the association rules include the monthly average reservoir water level ( R ¯ /month), monthly reservoir water level variation (ΔR/month), monthly cumulative rainfall (∑qmonth/mm), and maximum daily rainfall within a month ( q max d a y /mm). The monthly cumulative deformation increments (D/mm) at the monitoring points P2, P5, and P7 are used as the consequent items of the association rules, respectively. For instance, when mining association rules for deformation at the P2 monitoring point, the monthly cumulative deformation increments at the P5 and P7 are utilized as antecedent items. To ensure the acceptance of training data and scenes, the parameters of the FP-Growth algorithm were set with a minimum support threshold of 5% and a minimum confidence threshold of 60%. Given that landslide deformation predominantly occurs at medium-to-low levels, the resulting association rules primarily reflect medium and low levels of deformation. In this analysis, valid rules are extracted based on the lift value and sorted in descending order. Ultimately, rules with higher lift values were selected as the valid rules for the analysis.
Table 2 presents the results of the association rule for P2. Rules 1~4 reflect association rules for low-level deformation, indicating that the front of the landslide primarily experiences stable deformation under medium-to-high reservoir water levels, with corresponding stability observed at the middle and rear sections. Rules 1 and 4 suggest that when the reservoir water level is at medium-to-high levels and the water level variation displays stable fluctuation or slowly rises, deformation at the front remains stable, even with monthly cumulative rainfall and maximum daily rainfall of moderate-to-heavy levels. Rules 5~7 represent association rules for middle-level deformations, showing that when the front of the landslide experiences middle deformation, the reservoir water level is at medium-to-low levels, with the water level in a drop state and the corresponding rainfall predominantly at moderate-to-light levels. Rules 8~10 reflect association rules for high-level deformation, indicating that significant deformation occurs during periods when the reservoir water level is low, and no moderate or heavy rainfall is observed in the antecedent items. This demonstrates that reservoir water level regulation plays a dominant role in controlling deformation at the front of the landslide, while rainfall has a less distinct influence. Notably, when deformation at the front is high, the associated rules indicate that deformation at the middle and rear sections remains low, exhibiting a different trend from the front. This implies that the impact of external hydrological factors on landslide deformation is spatially variable, with different intrinsic mechanisms influencing deformation depending on location.
The association rules of the P5 are illustrated in Table 3. Rules 1~3 indicate that low-level deformation occurs exclusively under medium-to-high reservoir water levels. Rule 2 demonstrates that when the reservoir water level is high and slowly rising, deformation remains stable, even during short periods of heavy rainfall. This behavior aligns with the deformation trend observed at the front of the landslide, further suggesting that the impact of rainfall on landslide deformation is significantly reduced during periods of high reservoir water level. Rules 4~6 involve the slowly declining reservoir water level, with the monthly average reservoir water level remaining at a medium level. None of these rules involve moderate or heavy rainfall in the antecedent items, indicating that when middle-to-low-level deformation occurs in the middle of the landslide, the reservoir water level is the primary factor regulating deformation rates. Rules 7 and 8 are associated with low reservoir water levels, sharply declining water level variation, and moderate-to-heavy rainfall. These rules suggest that the significant deformation in the middle of the landslide results from the combined effects of reservoir water level and rainfall.
Table 4 presents the results of the association rule for P7. In Rules 1~3, the reservoir water level is medium to high, with both monthly cumulative rainfall and maximum daily rainfall being light. Rule 3 indicates that when the reservoir water level is high, even if it undergoes a slow decline, it does not significantly affect deformation at the rear of the landslide. Rules 4~6 involve medium and slowly declining reservoir water levels, clearly indicating that a gradual decline in water level accelerates deformation at the rear of the landslide under medium-to-low reservoir water levels. Compared to Rules 7~9 with the association rules for middle-to-low levels deformation, it is evident that as the reservoir water level continues to drop to low, the influence of rainfall on landslide deformation becomes increasingly prominent. All rules indicate that when significant deformation occurs, the landslide is under conditions of low and sharply declining reservoir water levels, as well as conditions of moderate-to-heavy rainfall, with both reservoir water levels and rainfall jointly regulating rapid deformation at the rear part. Additionally, the high-level deformation phase at the rear section is strongly consistent with that at the middle, but it differs from the trend at the front, highlighting the spatial variability in the deformation mechanisms of the No. 1 riverside sliding mass, as confirmed by the association rules derived from the three monitoring points at different locations.

5. Discussion

To validate the accuracy of the association rule results, the monthly deformation velocities at P2, P5, and P7 were plotted against the reservoir water level elevation and the monthly reservoir fluctuation velocity (Figure 9). The x-axis represents the monthly reservoir fluctuation velocity, while the y-axis represents the monthly deformation velocity. The color grading of the scatter points indicates the reservoir water level elevation. The coordinate plane is divided into four regions based on the sign of the reservoir fluctuation velocity and the deformation level, specifically whether it is classified as high-level deformation. For instance, in Region A, the scatter points correspond to a declining reservoir water level and high-level deformation. The front, middle, and rear sections of the landslide are all significantly influenced by the elevation and fluctuation velocity of the reservoir water level. Notably, during periods of high-level landslide deformation, the scatter points are predominantly concentrated in Region A, which corresponds to a drop in the reservoir water level, typically associated with medium-to-low water levels. Conversely, during periods of high reservoir water levels or rising water levels, the landslide deformation velocity is markedly suppressed. This pattern is consistent with the association rule results related to reservoir water levels presented in Table 2, Table 3 and Table 4.
Figure 10 illustrates the relationship between deformation velocity, reservoir water level, and monthly cumulative rainfall. The coordinate plane is divided into four regions based on the signs of reservoir fluctuation velocity and rainfall intensity (whether it is moderate-to-heavy rainfall). During high-level deformation, the scatter points of P2 are exclusively concentrated in Region A, indicating that the intensification of landslide deformation is largely independent of moderate-to-heavy rainfall. In contrast, the scatter points for P5 and P7 are distributed across both Region A and Region B, highlighting the influence of rainfall on deformation. This suggests that the reservoir water level and rainfall jointly control deformation velocity in the middle and rear sections of the landslide. This observation aligns with the association rules for the high-level deformation phase presented in Table 3 and Table 4, where rules involving moderate-to-heavy rainfall are also evident. Furthermore, the scatter points for P5 and P7 in Regions B and C indicate that deformation velocity under medium-to-low reservoir water levels is generally higher than that under high reservoir water levels, reflecting the significant attenuation of the rainfall effect seen under high water levels. This pattern is consistent with the results from Rule 2 in Table 3, further validating the accuracy of the association rule mining results presented in this study.
Over time, the deformation velocities at P2, P5, and P7 (Figure 11) reveal that the peak values of the displacement velocity curves typically emerge during the water level drop or the stable-fluctuation phase following a decline to low levels. A comparison of the trends around the peak values indicates that the variation trends at P5 and P7 are largely consistent, demonstrating a high degree of agreement. In contrast, the variation trend at P2 diverges from that at the other two monitoring points in most cases, with the peak deformation velocity occurring later than at the others. These results further confirm that the reservoir water levels exert relatively uniform influence across the landslide; a decline in reservoir water level under medium-to-low levels can significantly accelerate overall landslide deformation, while high reservoir water levels and rising water levels can somewhat suppress deformation. Rainfall has a negligible impact on deformation at the front of the landslide, but positively affects the middle and rear sections. Additionally, there is a gradual increase in deformation from the rear to the front, indicating that the impact of rainfall infiltration is relatively weaker, with reservoir water level fluctuations playing a dominant role in accelerating landslide deformation. Several terms have been defined and used to describe the movement pattern of landslides, such as retrogressive, thrust, successive, etc. [41]. Retrogressive-type deformation is characterized by movement being initiated at the front of the landslide due to erosion or load, with the deformation gradually increasing from rear to front. Thus, it can be inferred that the movement pattern of the Huangtupo No. 1 riverside sliding mass is typically retrogressive, where periodic fluctuations in the reservoir water level trigger stress adjustments in the front of the landslide, leading to instability and creeping. These factors in turn induce sliding at the middle and rear sections, resulting in retrogressive-type deformation (Figure 12a), similar to what was observed in the Quchi landslide within the TGRA [42].
Based on the proposed movement pattern of the No. 1 riverside sliding mass under the influence of reservoir water levels and rainfall, the mechanisms of landslide deformation can be further elucidated as follows:
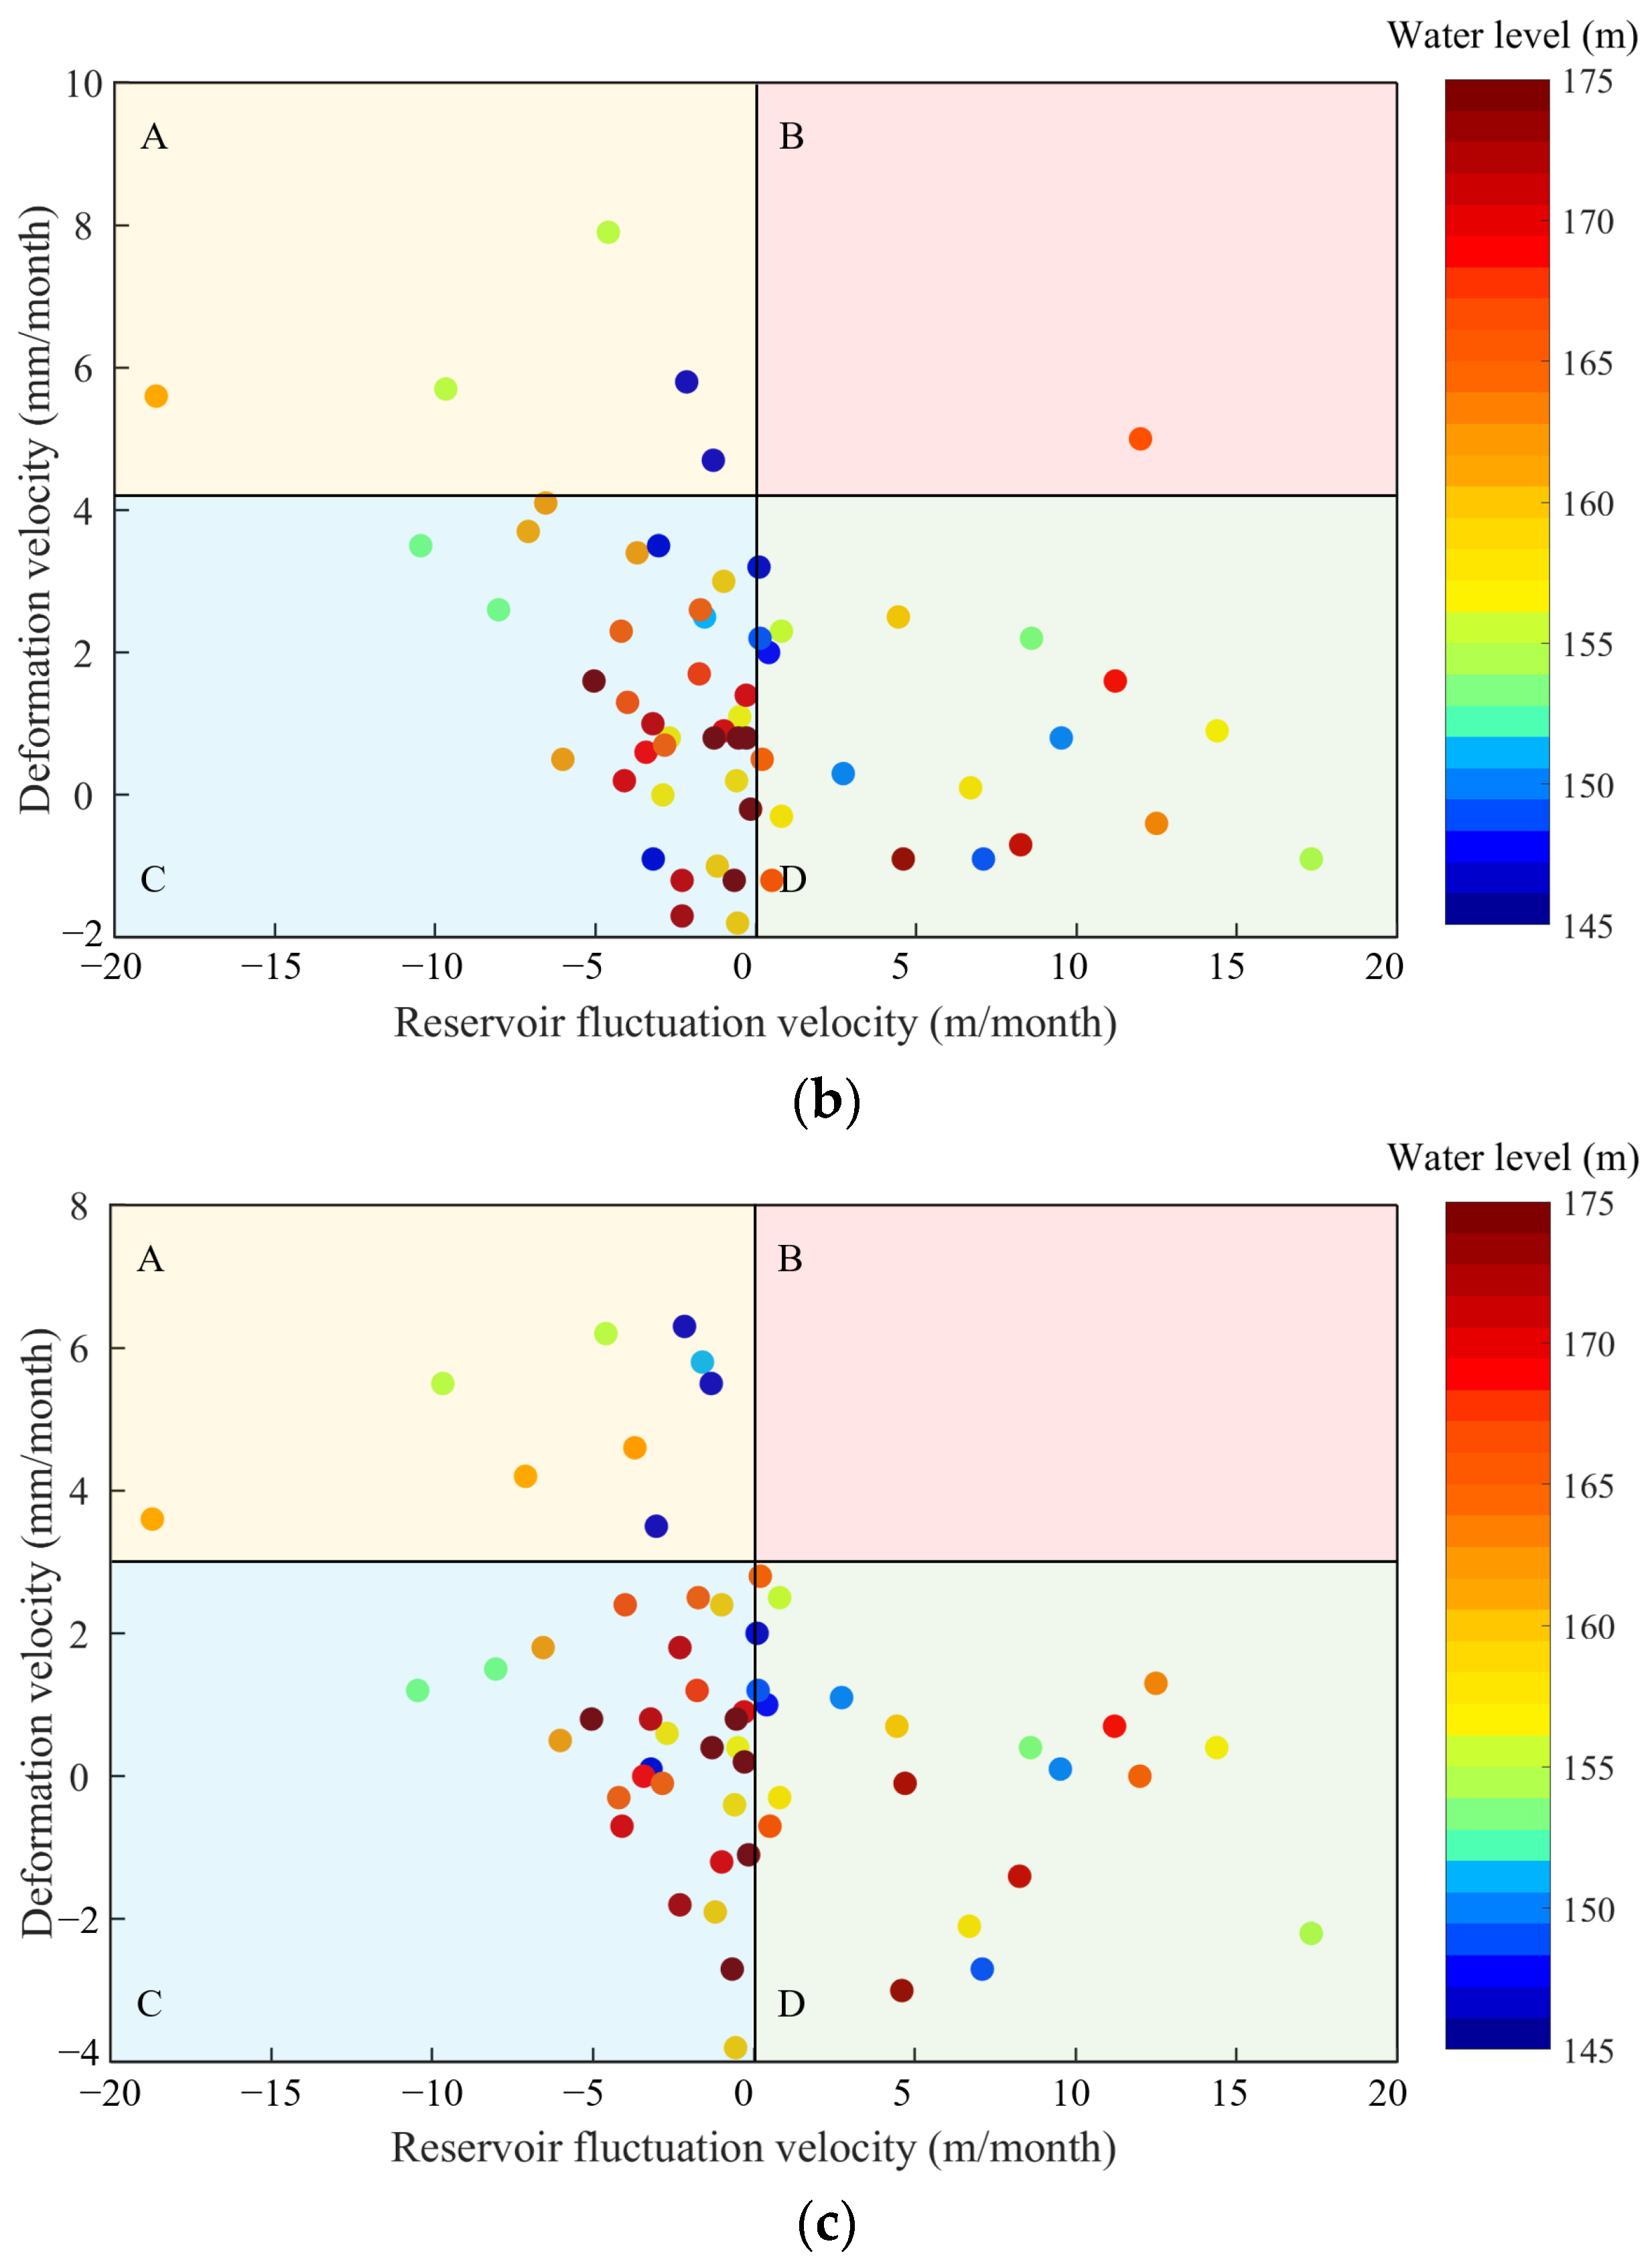
  • The influence of reservoir water levels is characterized by the following features: (i) a decline in the reservoir water level reduces the hydrostatic pressure on the landslide, decreasing the normal pressure σ on the sliding surface, thereby reducing the resistance force τf. This increases the tendency for the sliding mass to slide downward along the sliding surface. (ii) The decline in the groundwater table within the slope lags behind that in the reservoir water level, generating a downslope-directed seepage pressure Pw (Figure 12b), which increases the sliding force of the shallow sliding mass; (iii) when the reservoir water level is rising, the aforementioned influences exert the opposite effects, effectively reducing the deformation velocity (Figure 12c).
  • The influence of rainfall is characterized by the following: (i) rainfall infiltration generates a downslope-directed seepage pressure Pr, which increases the sliding force of the landslide; (ii) rainfall infiltration raises the groundwater table, increasing the saturated zone within the slope. This induces an increase in pore water pressure, dissipating the suction stress [43], thereby lowering the resistance force τf and accelerating landslide deformation (Figure 12d).
Rainfall has a subtle effect on the front of the landslide, but a greater effect on the middle and rear sections, which are farther from the reservoir. We speculate that this phenomenon can be illustrated by the seepage front of the groundwater table. The groundwater table at the front is minimally affected by rainfall infiltration, resulting in little variation in the saturated region, which has a slight effect on deformation. In contrast, the groundwater table in the middle and rear sections varies considerably under rainfall infiltration, leading to a more noticeable effect. Additionally, during variations in the saturated region caused by reservoir water level fluctuations, the effect is similarly smaller in the middle and rear sections, while it is more pronounced at the front. This leads to the deformation velocity at the front exhibiting another peak at a low reservoir water level following a decline, with the downslope-directed seepage pressure Pw dominating the acceleration of deformation at the front. Groundwater variations are intimately linked to the spatial variability of landslide deformation, and detailed groundwater data can further enhance the understanding of the mechanism of landslide deformation in future research.

6. Conclusions

Based on the multi-field monitoring data collected, clustering and data mining algorithms were employed to derive association rules among reservoir water levels, rainfall, and landslide deformation. Through a comprehensive analysis of the monitoring data, we reached the following conclusions:
(1)
The clustering analysis and data mining algorithms utilized in this study effectively extracted association rules from a substantial volume of monitoring data, thereby revealing potential relationships among reservoir water levels, rainfall, and landslide deformation. The reliability of these findings has been thoroughly validated, and the methodologies can be applied to analyze the deformation characteristics and triggering factors of reservoir-induced landslides based on monitoring data. By identifying key correlations between triggering factors and landslide deformation, this approach is expected to support real-time monitoring systems, enabling the timely detection of risk factors for potential landslides.
(2)
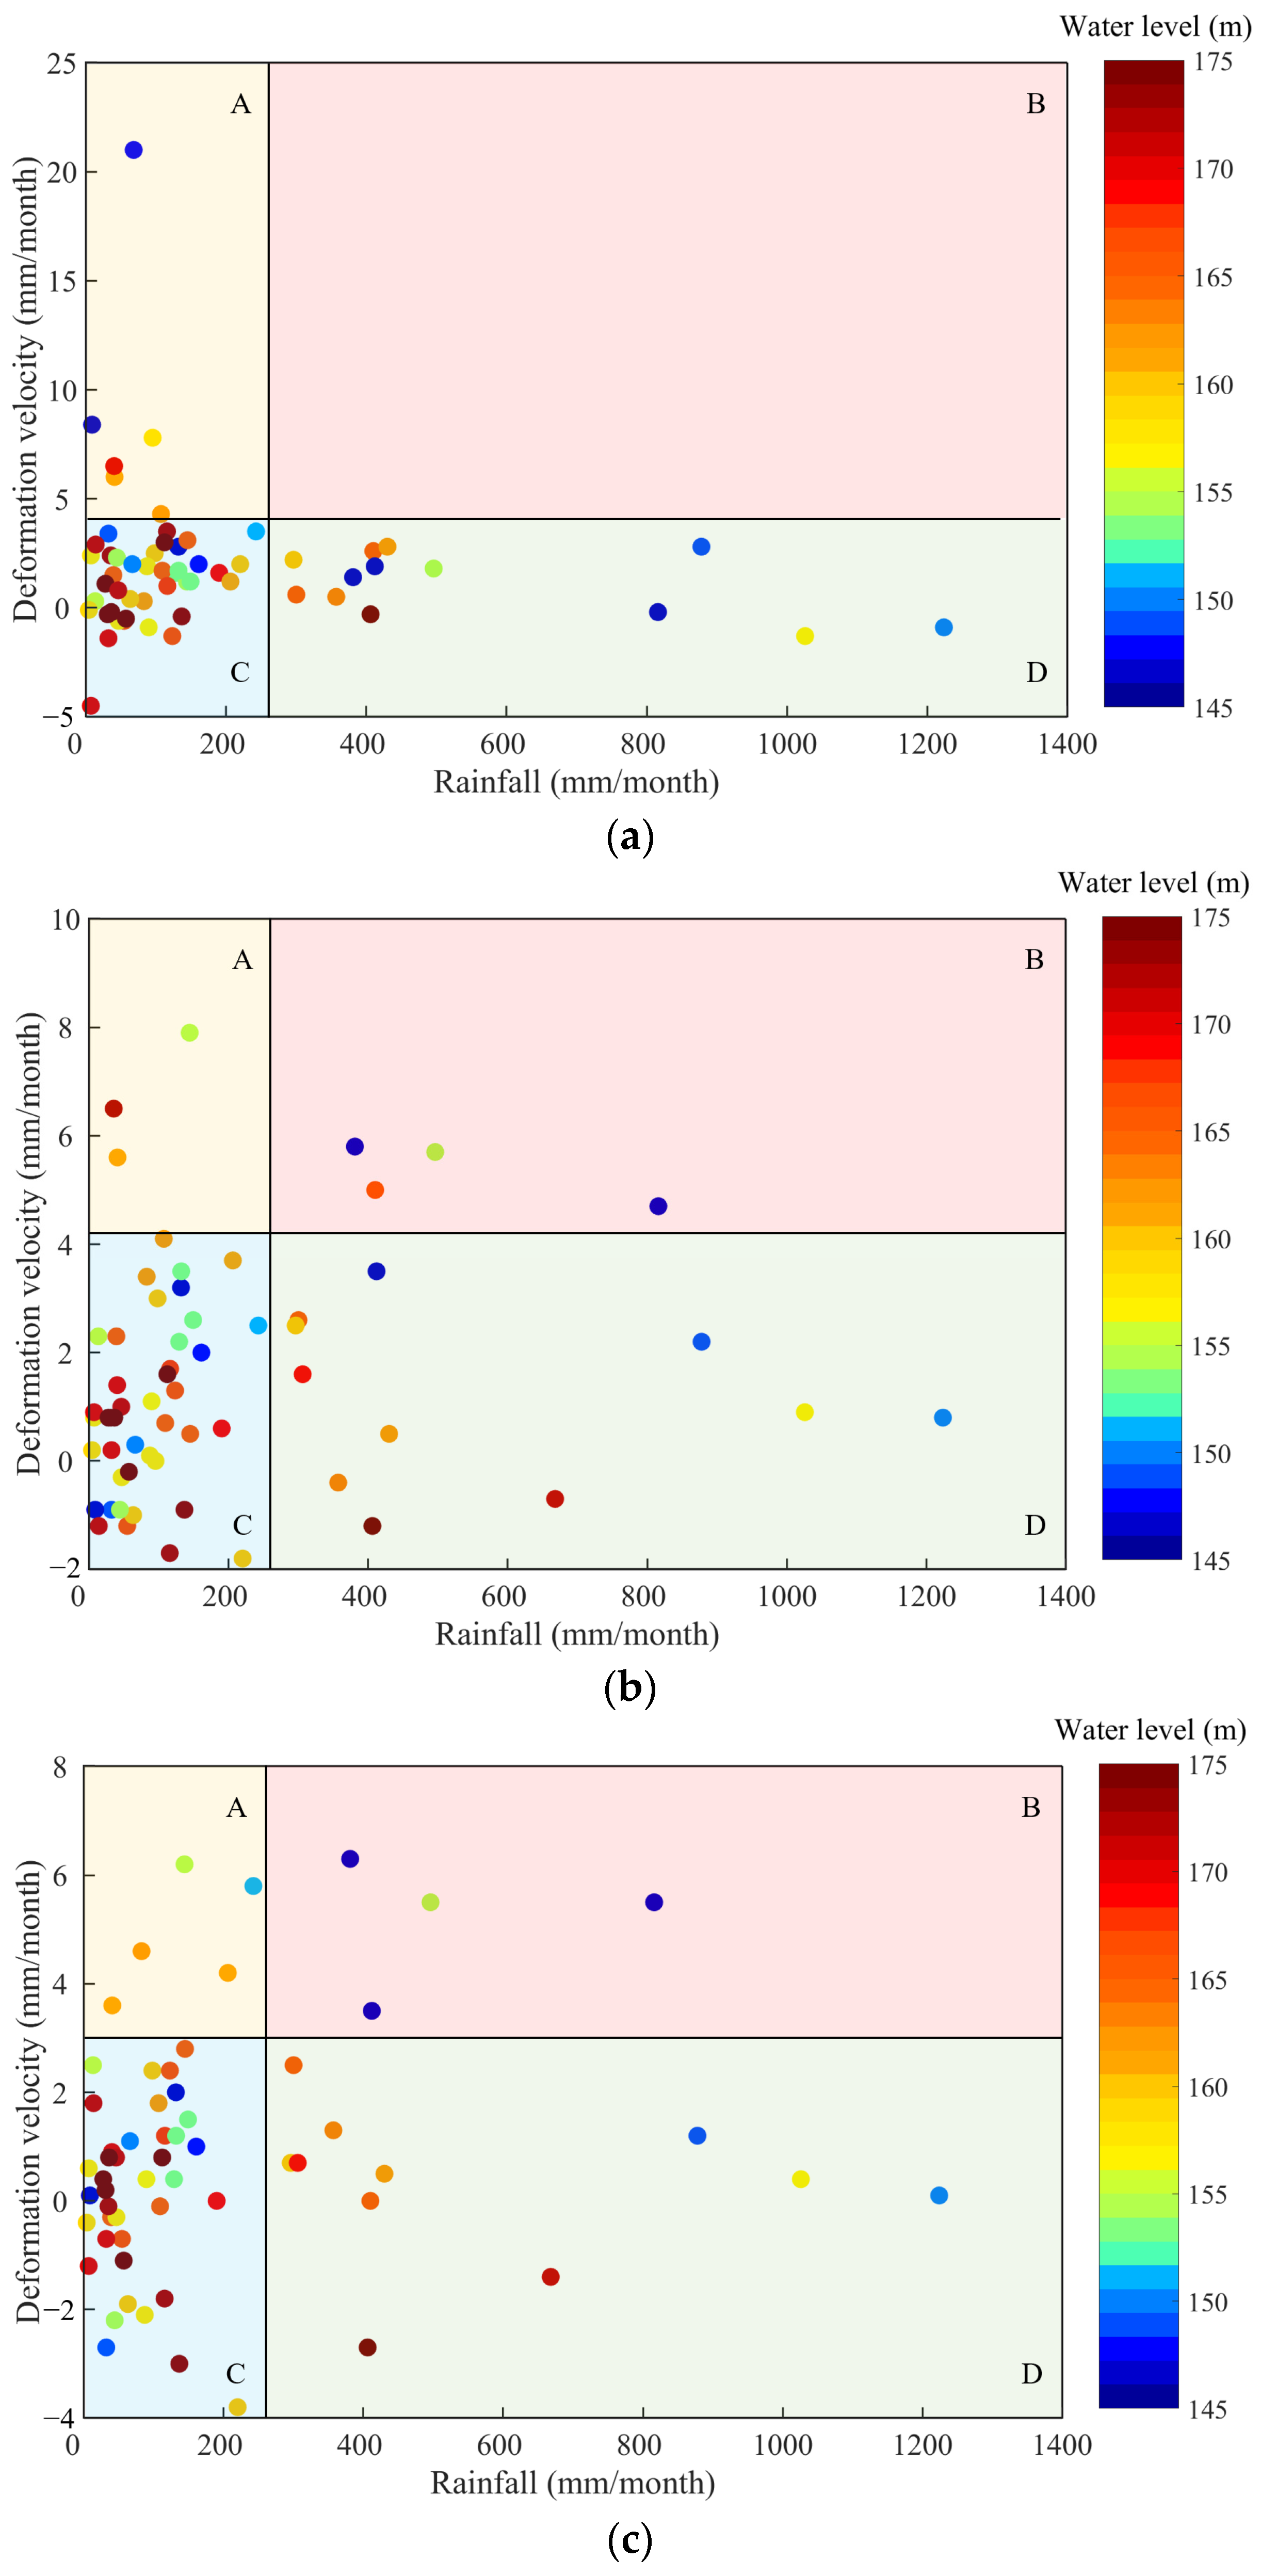
The results of the association rule analysis indicate that reservoir water levels exert a relatively uniform influence on overall landslide behavior. Specifically, declines in reservoir water levels (−18.70 to −2.16 m/month) under medium-to-low levels (146.43 to 163.23 m) can significantly accelerate landslide deformation, whereas high reservoir water levels (165.37 to 175.10 m) and rising water levels (4.45 to 17.33 m/month) tend to suppress it. Rainfall appears to have a negligible effect on the front of the landslide but positively influences deformation in the middle and rear sections. Additionally, the high-level deformation phase at the rear section (3.5 to 6.3 m) is strongly consistent with that at the middle (5.0 to 7.9 m), but it differs from the trend at the front (6.0 to 21.0 m), highlighting the spatial variability in the deformation mechanisms.
(3)
The deformation velocity trends at monitoring points P5 and P7 are generally consistent, while P2 exhibits less consistency with these points. We hypothesize that this discrepancy is attributable to the proximity of the groundwater table to the front monitoring point and its greater distance from the middle and rear sections. The downslope-directed seepage pressure Pw significantly affects the front, resulting in an additional peak in velocity at low reservoir water levels following a decline.
(4)
Landslide deformation demonstrates a gradual increase from the rear to the front and from west to east, indicating that the reservoir water level near the front of the landslide plays a crucial role in accelerating landslide deformation. The movement pattern is in accordance with the behavior of a retrogressive landslide, supporting the classification of the No. 1 riverside sliding mass as a retrogressive type. This characteristic provides valuable insights for managing similar landslides that exhibit comparable geological and hydrological conditions, suggesting that priority should be given to drainage systems, such as drainage ditches and geo-drains, and support structures, like retaining walls and soil nails, at the landslide front to mitigate retrogressive-type deformation. In addition, these findings are expected to advance research on landslide deformation forecasting and the development of early warning systems.

Author Contributions

Conceptualization, Z.L., J.W. and G.C.; Methodology, Z.L.; Formal analysis, Z.L.; Investigation, Y.L.; Resources, G.C.; Data curation, Y.L.; Writing—original draft, Z.L.; Writing—review & editing, J.W.; Visualization, Z.L.; Supervision, J.W.; Project administration, G.C.; Funding acquisition, G.C. All authors have read and agreed to the published version of the manuscript.

Funding

The work was funded by the Department of Natural Resources of Hubei Province, China (Grant No. ZRZY2024KJ03).

Data Availability Statement

The original contributions presented in this study are included in the article. Further inquiries can be directed to the corresponding author.

Acknowledgments

The contributions of the researchers and graduate students of China University of Geosciences during the surveying work at the Badong field test site are sincerely appreciated.

Conflicts of Interest

Author Yizhe Li was employed by the company Chang Jiang Geotechnical Engineering Co, Ltd. The remaining authors declare that the research was conducted in the absence of any commercial or financial relationships that could be construed as a potential conflict of interest.

References

  1. Li, K.; Zhu, C.; Wu, L.; Huang, L. Problems caused by the Three Gorges Dam construction in the Yangtze River basin: A review. Environ. Rev. 2013, 21, 127–135. [Google Scholar] [CrossRef]
  2. Ma, J.; Wang, Y.; Niu, X.; Jiang, S.; Liu, Z. A comparative study of mutual information-based input variable selection strategies for the displacement prediction of seepage-driven landslides using optimized support vector regression. Stoch. Environ. Res. Risk Assess. 2022, 36, 3109–3129. [Google Scholar] [CrossRef]
  3. Tang, H.; Wasowski, J.; Juang, C.H. Geohazards in the Three Gorges Reservoir Area, China-Lessons learned from decades of research. Eng. Geol. 2019, 261, 105267. [Google Scholar] [CrossRef]
  4. Huang, B.; Yin, Y.; Liu, G.; Wang, S.; Chen, X.; Huo, Z. Analysis of waves generated by Gongjiafang landslide in Wu Gorge, three Gorges reservoir, on 23 November 2008. Landslides 2012, 9, 395–405. [Google Scholar] [CrossRef]
  5. Luo, S.; Huang, D. Deformation characteristics and reactivation mechanisms of the Outang ancient landslide in the Three Gorges Reservoir, China. Bull. Eng. Geol. Environ. 2020, 79, 3943–3958. [Google Scholar] [CrossRef]
  6. Wang, F.; Zhang, Y.; Huo, Z.; Peng, X.; Wang, S.; Yamasaki, S. Mechanism for the rapid motion of the Qianjiangping landslide during reactivation by the first impoundment of the Three Gorges Dam reservoir, China. Landslides 2008, 5, 379–386. [Google Scholar] [CrossRef]
  7. Tang, H.; Li, C.; Hu, X.; Su, A.; Wang, L.; Wu, Y.; Criss, R.; Xiong, C.; Li, Y. Evolution characteristics of the Huangtupo landslide based on in situ tunneling and monitoring. Landslides 2015, 12, 511–521. [Google Scholar] [CrossRef]
  8. Deng, Q.; Fu, M.; Ren, X.; Liu, F.; Tang, H. Precedent long-term gravitational deformation of large scale landslides in the Three Gorges reservoir area, China. Eng. Geol. 2017, 221, 170–183. [Google Scholar] [CrossRef]
  9. Luo, S.; Jin, X.; Huang, D.; Kuang, X.; Song, Y.; Gu, D. Reactivation of a huge, deep-seated, ancient landslide: Formation mechanism, deformation characteristics, and stability. Water 2020, 12, 1960. [Google Scholar] [CrossRef]
  10. Zheng, W.; Sun, Q.; Hu, J.; Lu, Z.; Zhu, K.; Ye, X.; Huang, G.; Hu, M.; Zhu, J.; Li, Z. Investigating kinematics and triggers of slow-moving reservoir landslide using an improved MT-InSAR method. Geomat. Nat. Hazards Risk 2023, 14, 2289835. [Google Scholar] [CrossRef]
  11. Xu, Q.; Liu, H.; Ran, J.; Li, W.; Sun, X. Field monitoring of groundwater responses to heavy rainfalls and the early warning of the Kualiangzi landslide in Sichuan Basin, southwestern China. Landslides 2016, 13, 1555–1570. [Google Scholar] [CrossRef]
  12. Crosta, G.B.; Agliardi, F. Failure forecast for large rock slides by surface displacement measurements. Can. Geotech. J. 2003, 40, 176–191. [Google Scholar] [CrossRef]
  13. Uhlemann, S.; Smith, A.; Chambers, J.; Dixon, N.; Dijkstra, T.; Haslam, E.; Meldrum, P.; Merritt, A.; Gunn, D.; Mackay, J. Assessment of ground-based monitoring techniques applied to landslide investigations. Geomorphology 2016, 253, 438–451. [Google Scholar] [CrossRef]
  14. Xu, Q.; Peng, D.; Zhang, S.; Zhu, X.; He, C.; Qi, X.; Zhao, K.; Xiu, D.; Ju, N. Successful implementations of a real-time and intelligent early warning system for loess landslides on the Heifangtai terrace, China. Eng. Geol. 2020, 278, 105817. [Google Scholar] [CrossRef]
  15. Franceschini, R.; Rosi, A.; Catani, F.; Casagli, N. Exploring a landslide inventory created by automated web data mining: The case of Italy. Landslides 2022, 19, 841–853. [Google Scholar] [CrossRef]
  16. Ma, J.; Tang, H.; Liu, X.; Hu, X.; Sun, M.; Song, Y. Establishment of a deformation forecasting model for a step-like landslide based on decision tree C5.0 and two-step cluster algorithms: A case study in the Three Gorges Reservoir area, China. Landslides 2017, 14, 1275–1281. [Google Scholar] [CrossRef]
  17. Zhang, Y.; Tang, J.; He, Z.; Tan, J.; Li, C. A novel displacement prediction method using gated recurrent unit model with time series analysis in the Erdaohe landslide. Nat. Hazards 2020, 105, 783–813. [Google Scholar] [CrossRef]
  18. Lee, S.; Lee, M.J.; Jung, H.S. Data mining approaches for landslide susceptibility mapping in Umyeonsan, Seoul, South Korea. Appl. Sci. 2017, 7, 683. [Google Scholar] [CrossRef]
  19. Zhao, X.; Chen, W. GIS-based evaluation of landslide susceptibility models using certainty factors and functional trees-based ensemble techniques. Appl. Sci. 2019, 10, 16. [Google Scholar] [CrossRef]
  20. GB T 32864–2006; People’s Republic of China National Standard. Code for Geological Investigation of Landslide Prevention. China Standardization Press: Beijing, China, 2016.
  21. Petley, D.; Hearn, G.; Hart, A.; Rosser, N.; Dunning, S.; Mitchell, W. Trends in landslide occurrence in Nepal. Nat. Hazards 2007, 42, 44. [Google Scholar] [CrossRef]
  22. Yin, Y.; Wang, H.; Gao, Y.; Li, X. Real-time monitoring and early warning of landslides at relocated Wushan Town, the Three Gorges Reservoir, China. Landslides 2010, 7, 339–349. [Google Scholar] [CrossRef]
  23. Du, J.; Yin, K.; Lacasse, S. Displacement prediction in colluvial landslides, Three Gorges Reservoir, China. Landslides 2013, 10, 203–218. [Google Scholar] [CrossRef]
  24. Huang, D.; Gu, D.; Song, Y.; Cen, D.; Zeng, B. Towards a complete understanding of the triggering mechanism of a large reactivated landslide in the Three Gorges Reservoir. Eng. Geol. 2018, 238, 36–51. [Google Scholar] [CrossRef]
  25. Huang, H.; Yi, W.; Lu, S.; Yi, Q.; Zhang, G. Use of monitoring data to interpret active landslide movements and hydrological triggers in three gorges reservoir. J. Perform. Constr. Fac. 2016, 30, C4014005. [Google Scholar] [CrossRef]
  26. Tan, F.; Hu, X.; He, C.; Zhang, Y.; Zhang, H.; Zhou, C.; Wang, Q. Identifying the main control factors for different deformation stages of landslide. Geotech. Geol. Eng. 2018, 36, 469–482. [Google Scholar] [CrossRef]
  27. Miao, F.; Wu, Y.; Li, L.; Liao, K.; Xue, Y. Triggering factors and threshold analysis of baishuihe landslide based on the data mining methods. Nat. Hazards 2021, 105, 2677–2696. [Google Scholar] [CrossRef]
  28. Guo, L.; Miao, F.; Zhao, F.; Wu, Y. Data mining technology for the identification and threshold of governing factors of landslide in the Three Gorges Reservoir area. Stoch. Environ. Res. Risk Assess. 2022, 36, 3997–4012. [Google Scholar] [CrossRef]
  29. Li, L.; Wu, Y.; Huang, Y.; Li, B.; Miao, F.; Deng, Z. Optimized Apriori algorithm for deformation response analysis of landslide hazards. Comput. Geosci. 2023, 170, 105261. [Google Scholar] [CrossRef]
  30. Wang, J.; Su, A.; Liu, Q.; Xiang, W.; Yeh, H.-F.; Xiong, C.; Zou, Z.; Zhong, C.; Liu, J.; Cao, S. Three-dimensional analyses of the sliding surface distribution in the Huangtupo No. 1 riverside sliding mass in the Three Gorges Reservoir area of China. Landslides 2018, 15, 1425–1435. [Google Scholar] [CrossRef]
  31. Wang, S.; Wang, J.; Wu, W.; Cui, D.; Su, A.; Xiang, W. Creep properties of clastic soil in a reactivated slow-moving landslide in the Three Gorges Reservoir Region, China. Eng. Geol. 2020, 267, 105493. [Google Scholar] [CrossRef]
  32. Deng, Q.; Zhu, Z.; Cui, Z.; Wang, X. Mass rock creep and landsliding on the Huangtupo slope in the reservoir area of the Three Gorges Project, Yangtze River. Eng. Geol. 2000, 58, 67–83. [Google Scholar] [CrossRef]
  33. Li, C.; Tang, H.; Han, D.; Zou, Z. Exploration of the creep properties of undisturbed shear zone soil of the Huangtupo landslide. Bull. Eng. Geol. Environ. 2019, 78, 1237–1248. [Google Scholar] [CrossRef]
  34. Tang, H.; Li, C.; Hu, X.; Wang, L.; Criss, R.; Su, A.; Wu, Y.; Xiong, C. Deformation response of the Huangtupo landslide to rainfall and the changing levels of the Three Gorges Reservoir. Bull. Eng. Geol. Environ. 2014, 74, 933–942. [Google Scholar] [CrossRef]
  35. Toma’s, R.; Li, Z.; Liu, P.; Singleton, A.; Hoey, T.; Cheng, X. Spatiotemporal characteristics of the Huangtupo landslide in the Three Gorges region (China) constrained by radar interferometry. Geophys. J. Int. 2014, 197, 213–232. [Google Scholar] [CrossRef]
  36. MacQueen, J.B. On the Asymptotic Behavior of k-Means; Defense Technical Information Center: Fort Belvoir, VA, USA, 1965. [Google Scholar]
  37. Han, J.; Kamber, M. Data Mining: Concepts and Techniques//Data Mining Concepts Models Methods & Algorithms, 2nd ed.; Morgan Kaufmann Publishers Inc.: San Francisco, CA, USA, 2005. [Google Scholar]
  38. Sun, G.; Zheng, H.; Tang, H.; Dai, F. Huangtupo landslide stability under water level Fluctuations of the Three Gorges reservoir. Landslides 2016, 13, 1167–1179. [Google Scholar] [CrossRef]
  39. Zhang, L.; Shi, B.; Zhu, H.; Yu, X.; Han, H.; Fan, X. PSO-SVM-based deep displacement prediction of Majiagou landslide considering the deformation hysteresis effect. Landslides 2021, 18, 179–193. [Google Scholar] [CrossRef]
  40. Tsironi, V.; Ganas, A.; Karamitros, I.; Efstathiou, E.; Koukouvelas, I.; Sokos, E. Kinematics of active landslides in Achaia (Peloponnese, Greece) through InSAR time series analysis and relation to rainfall patterns. Remote Sens. 2022, 14, 844. [Google Scholar] [CrossRef]
  41. Hungr, O.; Leroueil, S.; Picarelli, L. The Varnes classification of landslide types, an update. Landslides 2014, 11, 167–194. [Google Scholar] [CrossRef]
  42. Luo, S.L.; Jin, X.G.; Huang, D. Long-term coupled effects of hydrological factors on kinematic responses of a reactivated landslide in the Three Gorges Reservoir. Eng. Geol. 2019, 261, 105271. [Google Scholar] [CrossRef]
  43. Lu, N.; Likos, W.J. Suction stress characteristic curve for unsaturated soil. J. Geotech. Geoenviron. 2006, 132, 131–142. [Google Scholar] [CrossRef]
Figure 1. Location (a), photo (b), and plan view (c) of the Huangtupo landslide.
Applsci 15 04018 g001
Figure 2. A typical cross-section of the Huangtupo landslide (A–A’).
Applsci 15 04018 g002
Figure 3. Photographs of partial deformation monitoring points in NO. 1 riverside sliding mass: (a) GNSS monitoring points; (b) precise measurement points inside the tunnel group.
Applsci 15 04018 g003
Figure 4. Time series monitoring data of No. 1 riverside sliding mass from 2019 to 2024.
Applsci 15 04018 g004
Figure 5. Workflow of data mining method.
Applsci 15 04018 g005
Figure 6. Schematic diagram of K-means clustering.
Applsci 15 04018 g006
Figure 7. The schematic diagram of the FP-Growth algorithm shows (a) the frequent-item header table L, and (b) the FP-Tree formation.
Applsci 15 04018 g007
Figure 8. The count of the clustering results of the P2, P5, and P7 monitoring points.
Applsci 15 04018 g008
Figure 9. Relationship of monthly deformation velocity at monitoring points in (a) P2, (b) P5, and (c) P7 with reservoir fluctuation velocity and water level.
Applsci 15 04018 g009aApplsci 15 04018 g009b
Figure 10. Relationship of monthly deformation velocity at monitoring points in (a) P2, (b) P5, and (c) P7 with rainfall and water level.
Applsci 15 04018 g010
Figure 11. Monthly deformation velocity in P2, P5, and P7 monitoring points.
Applsci 15 04018 g011
Figure 12. A conceptual model of the movement pattern (a) and the physical mechanism of the sliding mass under water level fluctuation (b,c) and rainfall (d).
Applsci 15 04018 g012
Table 1. Clustering results of hydrological factors based on the K-means clustering.
CategoryFactorsClustering Results Count
Water level R ¯ /month(146.32, 154.95)Low-Water-Level18
(155.87, 163.23)Medium-Water-Level17
(165.37, 175.10)High-Water-Level26
ΔR/month(−18.70, −8.02)Sharply Drop4
(−7.10, −2.16)Slowly Drop21
(−1.76, 2.73)Stable-Fluctuation23
(4.45, 9.53)Slowly Rise8
(11.21, 17.33)Sharply Rise5
Rainfallqmonth/mm(0, 220)Light-Rainfall45
(242, 496)Moderate-Rainfall11
(668, 1224)Heavy-Rainfall5
q max d a y /mm(2.7, 68.2)Light Daily Rainfall43
(76, 172)Moderate Daily Rainfall12
(200, 296)Heavy Daily Rainfall6
Table 2. Association rules of P2 monitoring point.
Rule IDAntecedent ItemsConsequent ItemsSupport
/%
Confidence/%Lift
1 R ¯ = Medium-Water-Level, ΔR = Slowly Rise, ∑qmonth  = Heavy-Rainfall ,   q max d a y = Heavy Daily Rainfall, D (P5)= Low, D (P7)= LowD = Low6.61002.65
2 R ¯   = Medium-Water-Level ,   q max d a y  = Light Daily Rainfall, D (P5) = Low8.283.32.21
3 R ¯ = High-Water-Level, ΔR = Stable-Fluctuation, ∑qmonth = Light-Rainfall, D (P5) = Low6.666.71.77
4 R ¯ = High-Water-Level, ΔR = Slowly Rise, ∑qmonth   = Moderate-Rainfall ,   q max d a y = Moderate Daily Rainfall6.666.71.77
5 R ¯ = Medium-Water-Level, ΔR = Sharply Drop, ∑qmonth   = Light-Rainfall ,   q max d a y   = Moderate Daily Rainfall, D (P7) = MediumD = Medium6.61001.91
6 R ¯ =   Medium-Water-Level ,   q max d a y = Light Daily Rainfall, D (P5) = Medium, D (P7) = Medium6.6801.53
7 R ¯ = Low-Water-Level, ΔR = Slowly Drop6.6801.53
8 R ¯ = Low-Water-Level, ΔR   =   Slowly   Drop ,   q max d a y = Light Daily Rainfall, D (P7) = LowD = High6.682.56.78
9 R ¯ = Low-Water-Level, ∑qmonth = Light-Rainfall, D (P5) = Low, D (P7) = Low6.666.76.78
10 R ¯ = Low-Water-Level, ΔR = Stable-Fluctuation, ∑qmonth   = Light-Rainfall ,   q max d a y  = Light Daily Rainfall, D (P7) = Low6.666.76.78
Table 3. Association rules of P5 monitoring point.
Rule IDAntecedent ItemsConsequent ItemsSupport
/%
Confidence/%Lift
1 R ¯ = Medium-Water-Level, Δ R   =   Stable-Fluctuation ,   q max d a y   = Light Daily Rainfall, D (P7) = LowD = Low6.61001.85
2 R ¯ = High-Water-Level, Δ R = Slowly   Rise ,   q max d a y = Heavy Daily Rainfall, D (P2) = Low, D (P7) = Low6.61001.85
3 R ¯ = High-Water-Level, ΔR = Stable-Fluctuation, ∑qmonth = Light-Rainfall, D (P2) = Low6.6801.48
4 R ¯ = Medium-Water-Level, ΔR = Slowly Drop, ∑qmonth = Light-Rainfall, D (P7) = MediumD = Middle6.61002.91
5 R ¯ = Medium-Water-Level, ΔR = Slowly Drop, ∑qmonth = Light-Rainfall ,   q max d a y = Light Daily Rainfall6.61002.91
6ΔR = Slowly Drop, D (P2) = Medium, D (P7) = Medium9.8752.18
7 R ¯ = Low-Water-Level, Δ R = Sharply   Drop ,   q max d a y = Moderate Daily Rainfall, D (P2) = Medium, D (P7) = HighD = High6.687.52.18
8 R ¯ = Low-Water-Level, ΔR = Sharply Drop, ∑qmonth = Heavy-Rainfall ,   q max d a y = Moderate Daily Rainfall, D (P2) = Low6.666.71.68
Table 4. Association rules of P7 monitoring point.
Rule IDAntecedent ItemsConsequent ItemsSupport
/%
Confidence/%Lift
1 R ¯ = Medium-Water-Level, ΔR = Stable-Fluctuation, ∑qmonth   = Light-Rainfall ,   q max d a y = Light Daily Rainfall, D (P5) = LowD = Low6.61001.91
2 R ¯ = Medium-Water-Level, ∑qmonth = Light-Rainfall, D (P5) = Low, D (P7) = Low8.21001.91
3 R ¯ = High-Water-Level, ΔR = Slowly Drop, ∑qmonth = Light-Rainfall, D (P5) = Low8.271.41.36
4 R ¯ = Medium-Water-Level, ΔR = Slowly Drop, ∑qmonth = Light-RainfallD = Middle6.61003.21
5 R ¯ = Medium-Water-Level, ΔR = Slowly   Drop ,   q max d a y = Light Daily Rainfall, D (P5) = Medium6.61003.21
6ΔR = Slowly Drop, ∑qmonth   = Light-Rainfall ,   q max d a y = Light Daily Rainfall, D (P2) = Medium11.587.52.81
7 R ¯ = Low-Water-Level, ΔR = Sharply Drop, ∑qmonth = Moderate-Rainfall, D (P5) = HighD = High6.6804.88
8 R ¯ = Low-Water-Level, ΔR = Sharply Drop, ∑qmonth = Heavy-Rainfall, D (P2) = Low6.271.41.68
9 R ¯   = Low-Water-Level, ΔR   = Sharply   Drop ,   q max d a y = Heavy Daily Rainfall, D (P2) = Medium6.271.41.51
Disclaimer/Publisher’s Note: The statements, opinions and data contained in all publications are solely those of the individual author(s) and contributor(s) and not of MDPI and/or the editor(s). MDPI and/or the editor(s) disclaim responsibility for any injury to people or property resulting from any ideas, methods, instructions or products referred to in the content.

