1. Introduction
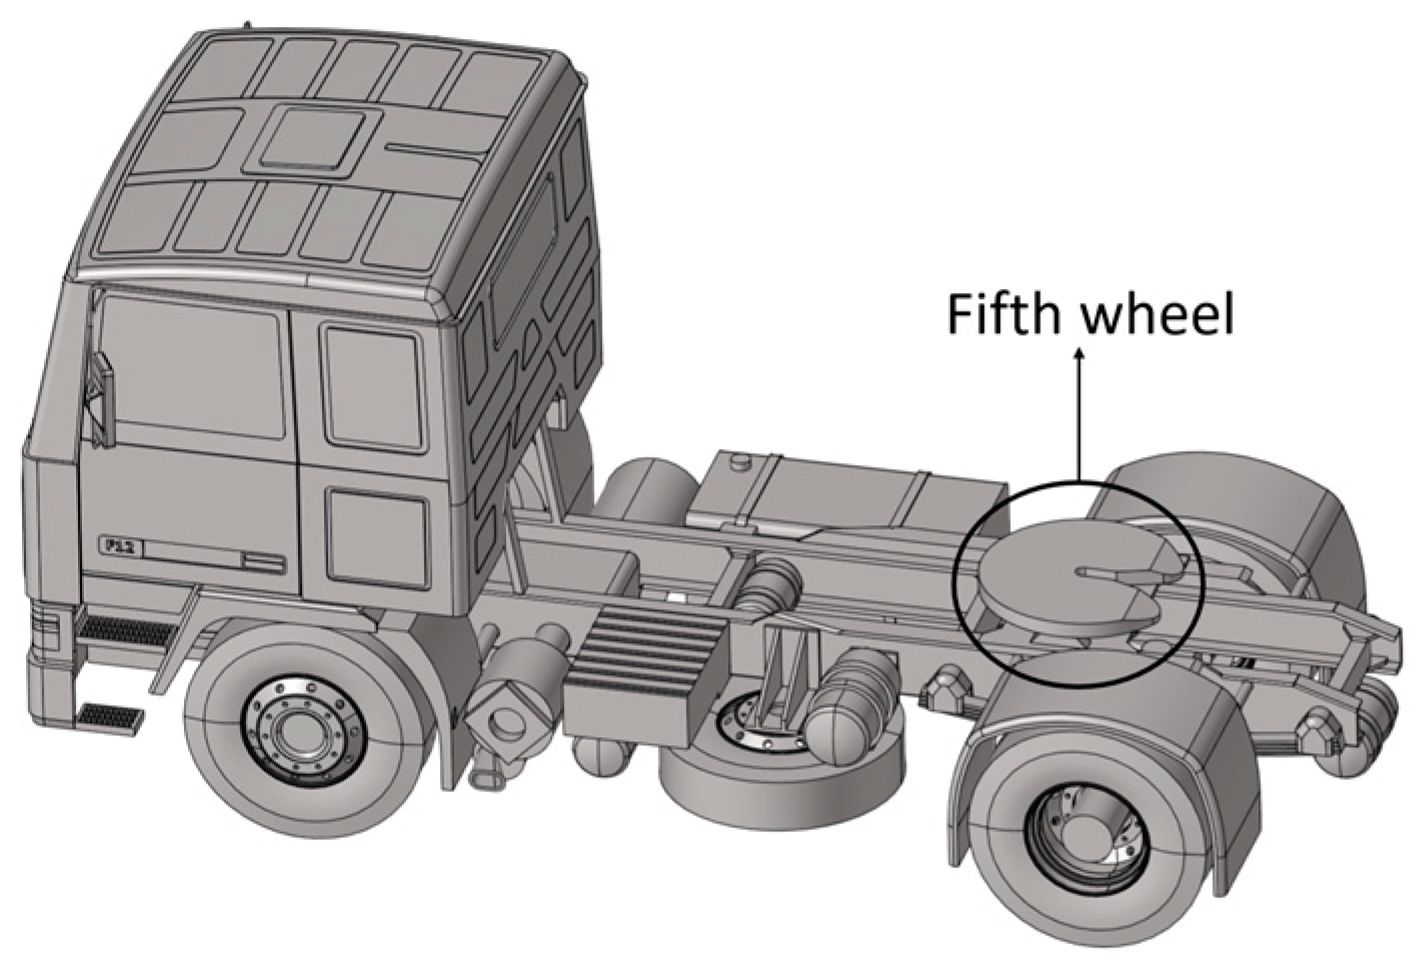
With the continuous development of commercial vehicles and the ongoing expansion of the transport market, semi-trailers (as shown in
Figure 1) have become increasingly dominant in transporting goods. Compared to ordinary trucks, semi-trailers offer a significant improvement: Their transport efficiency can be increased by up to 30–50%, while reducing both transportation costs (by 30–40%) and fuel consumption (by 20–30%). The results of relevant experiments indicate that for every 100 kg reduction in overall vehicle weight, the fuel consumption per 100 km decreases by approximately 0.3 to 0.6 liters [
1]. As a critical component of semi-trailers, the fifth wheel plays an essential role in connecting the tractor and the trailer, which is vital for ensuring the vehicle’s safety, stability, and reliability. To enhance these aspects further, optimizing the lightweight design of the fifth wheel represents an important area of research [
2].
The fatigue performances of the fifth wheels of tractors have been studied. The mounting position of the fifth wheel on a semi-trailer largely determines the dynamics of the cab and durability of the components [
3]. As the forward offset of the fifth wheel increases, the axle loads on the first, fourth, fifth, and sixth wheels increase, whereas the axle loads on the second and third wheels decrease [
4]. The tractor–semi-trailer with the Split fifth wheel coupling (SFWC) model has less deviation tracking and better wear resistance than the conventional tractor–semi-trailer [
5]. By building a finite element model of the semi-trailer’s fifth wheel, suspension, mechanical spring, pneumatic spring, and press components and performing fatigue analysis, it was determined that the location of the saddle where the fatigue damage occurred was in the connection area of the second beam and the force-transferring components [
6,
7]. According to the corresponding fatigue damage areas, combined with the layout characteristics of the semi-trailer traction seat, it is possible to perform reasonable maintenance of the fifth wheel to ensure its service life [
8].
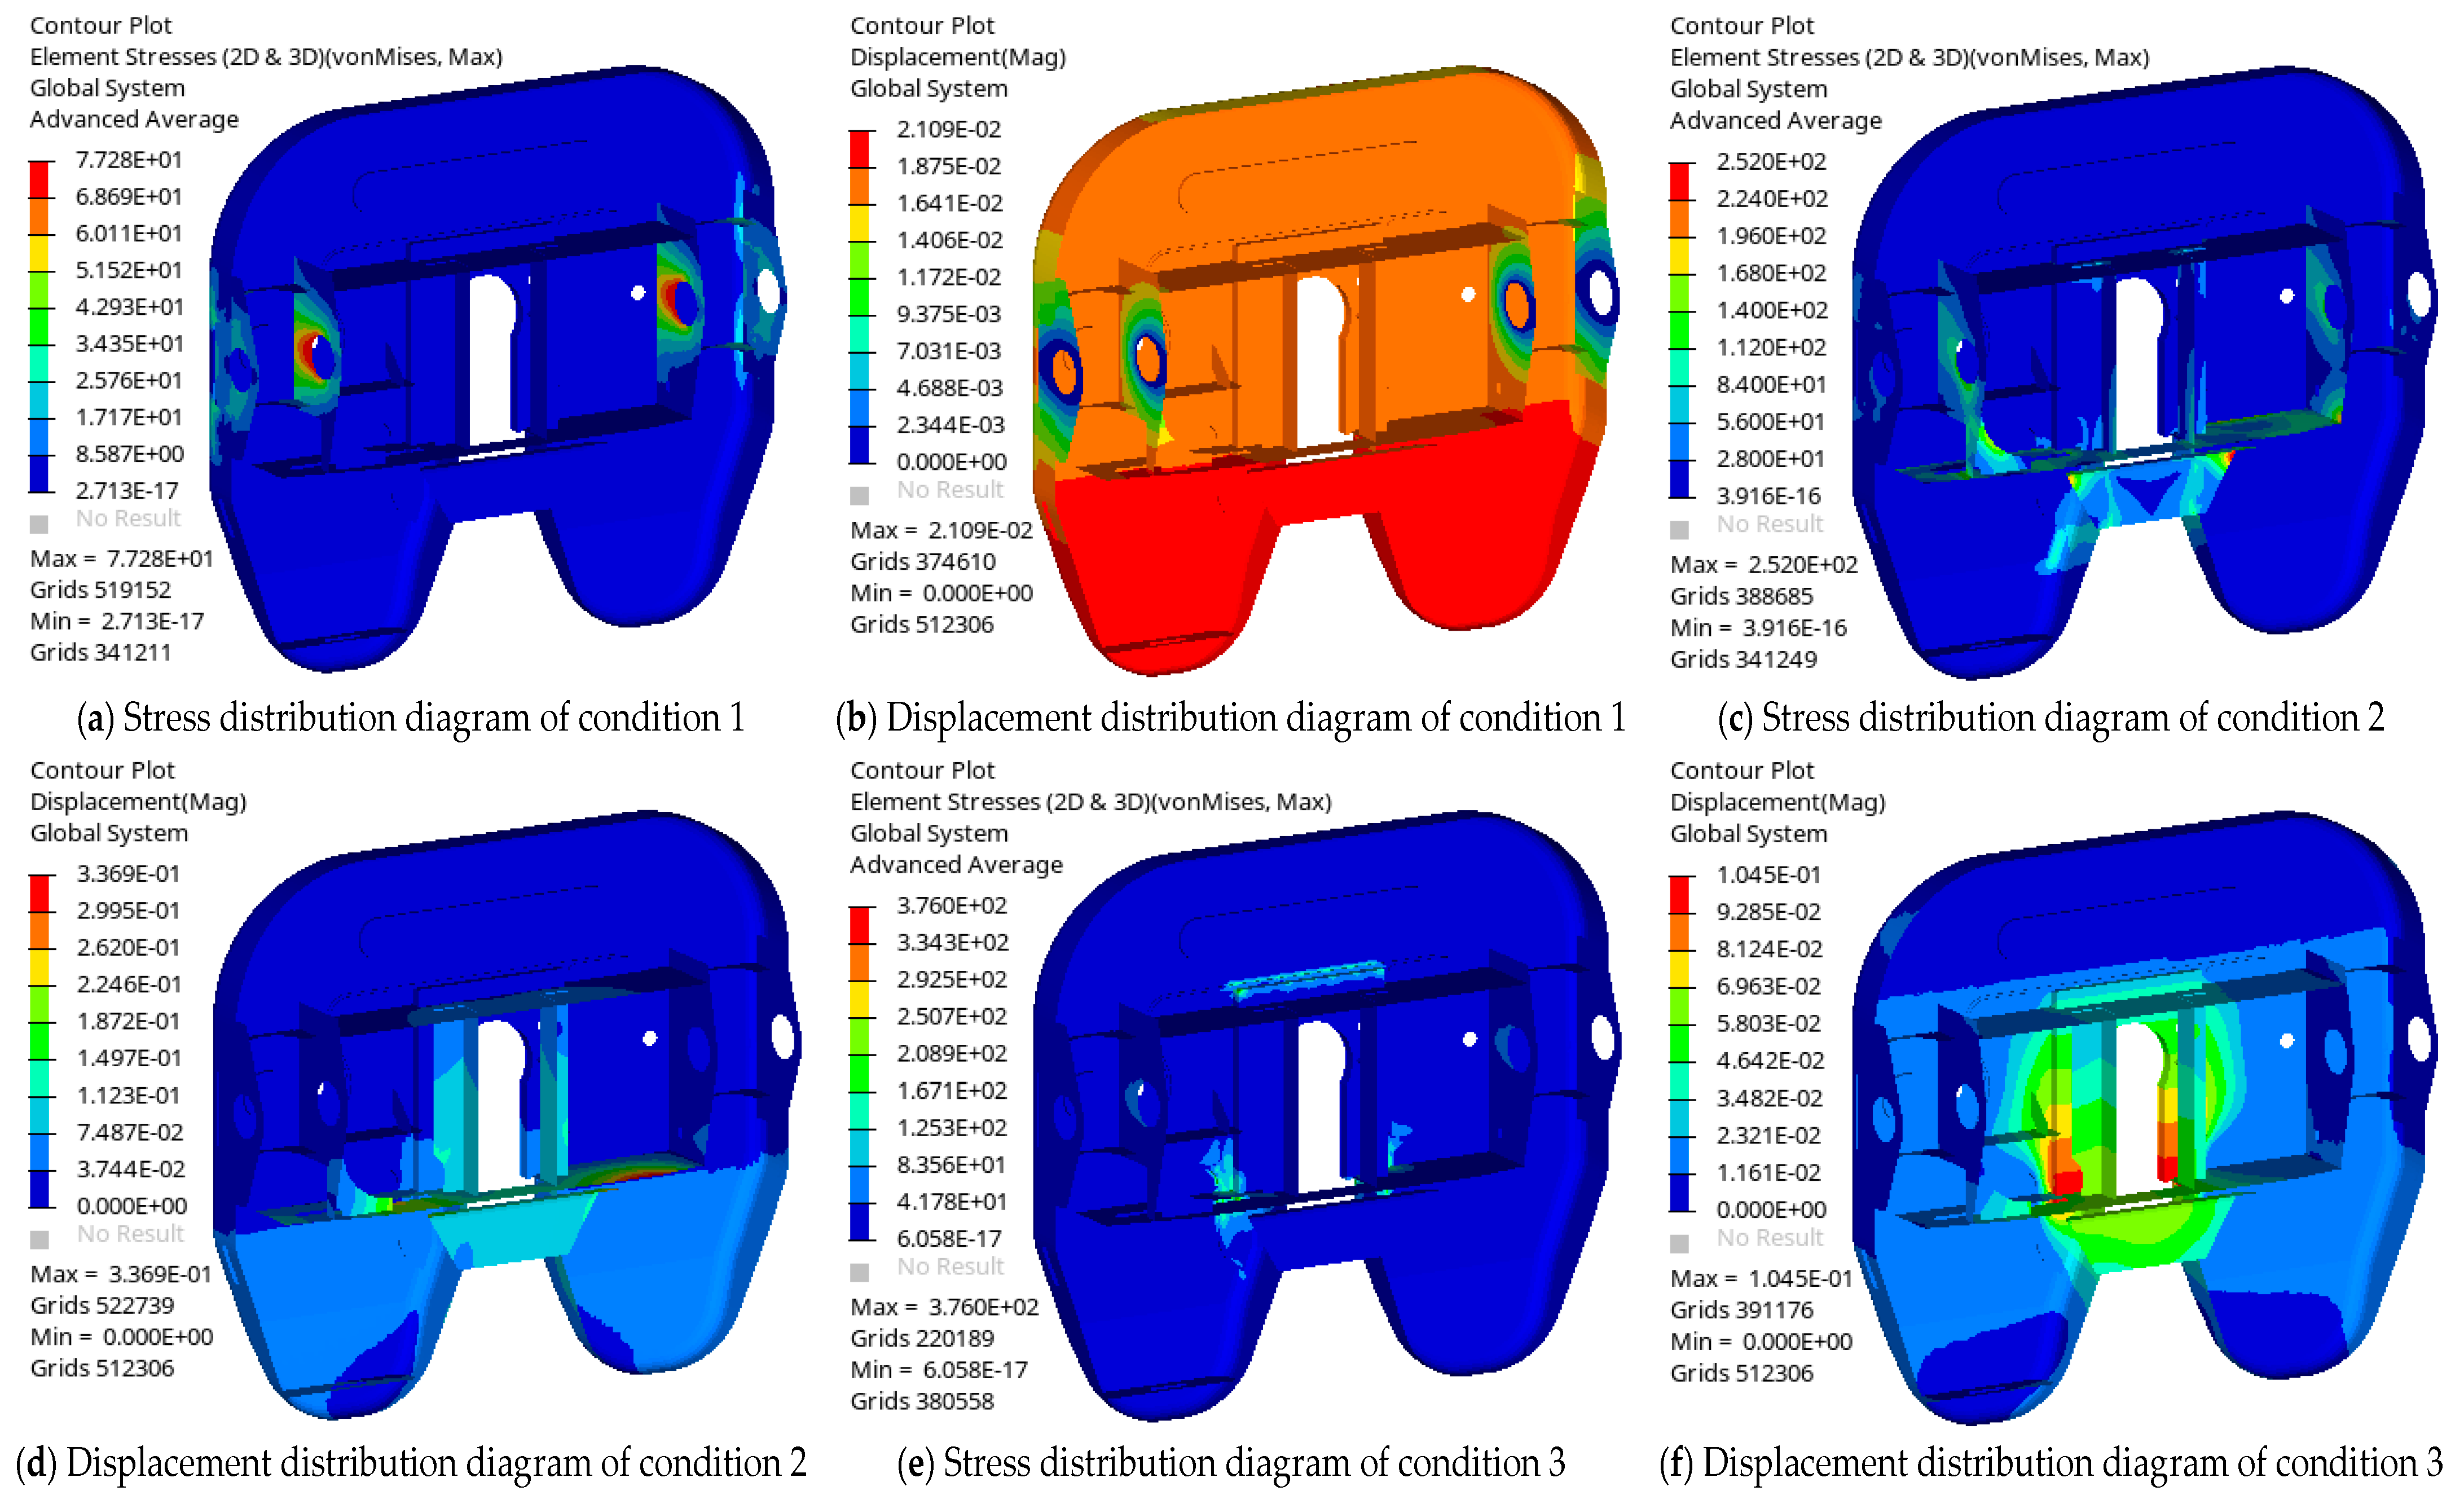
For the lightweight design and structural optimization of the fifth wheel, it is necessary to determine the corresponding conditions to verify its strength and safety performance. According to the actual condition of the fifth wheel, the stress–strain distribution is obtained, in which the maximum equivalent stress of the fifth wheel is located in the contact area of the rear reinforcement, and the maximum deformation is located at the rear top of the saddle body, which provides a basis and reference for the structural improvement and optimization of the fifth wheel [
9,
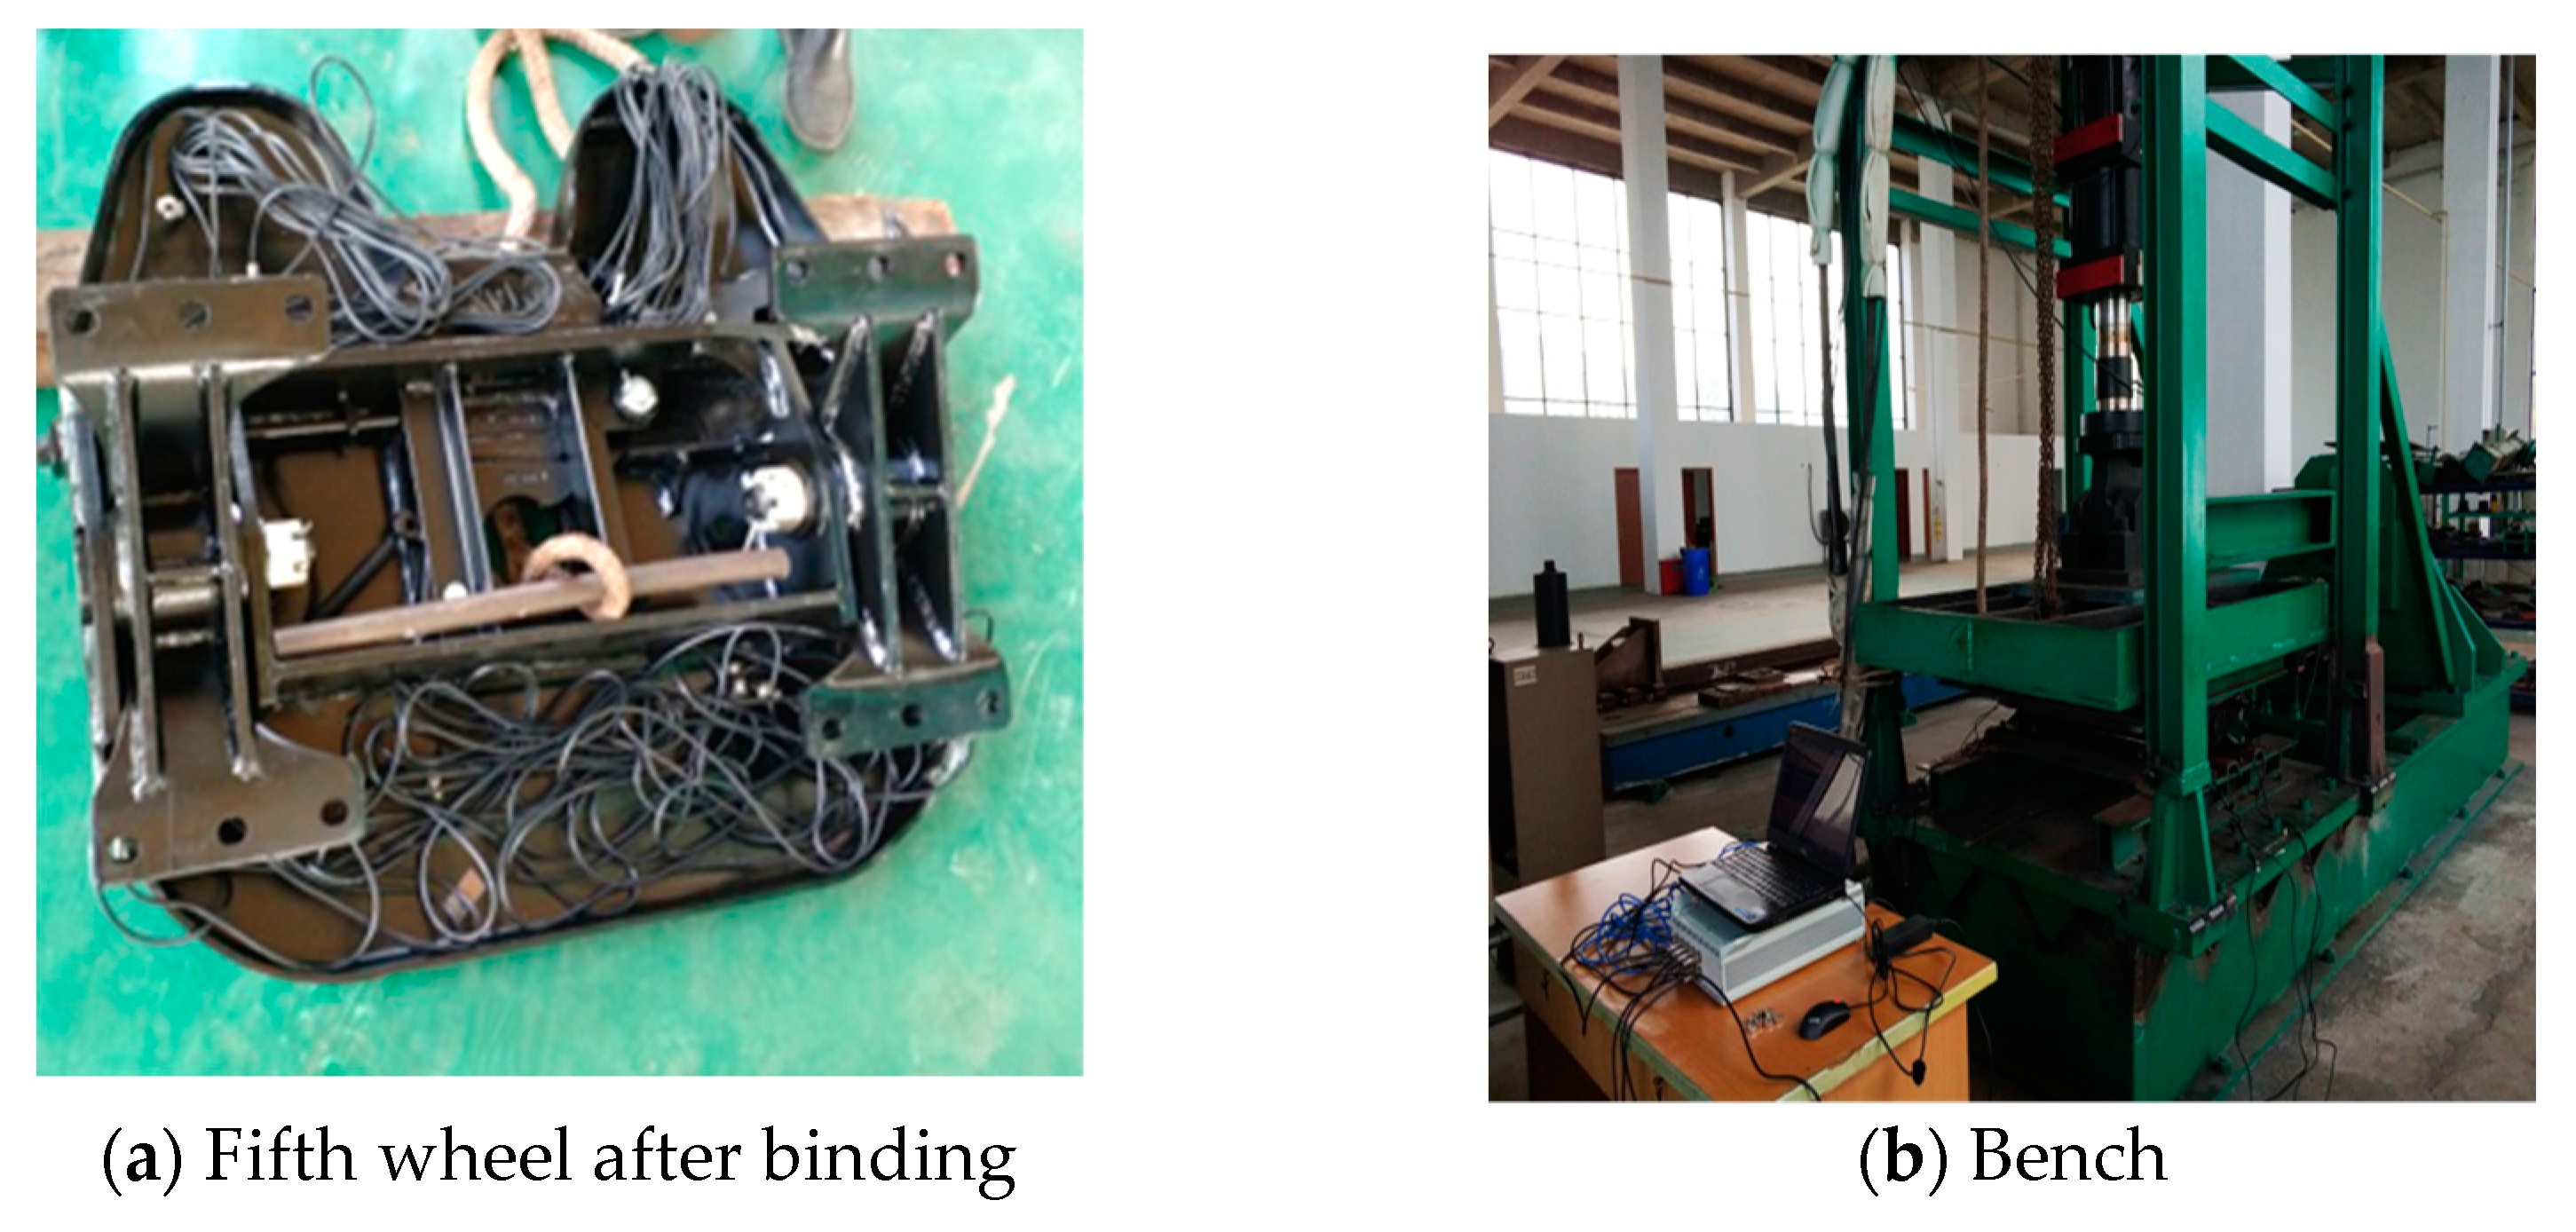
10]. According to the dynamic test methods specified in the relevant standards, a fatigue life simulation test of the fifth wheel was conducted, and the validity of the simulation test results was verified through a bench test to ensure that the fatigue life of the model’s fifth wheel was higher than the standard requirements [
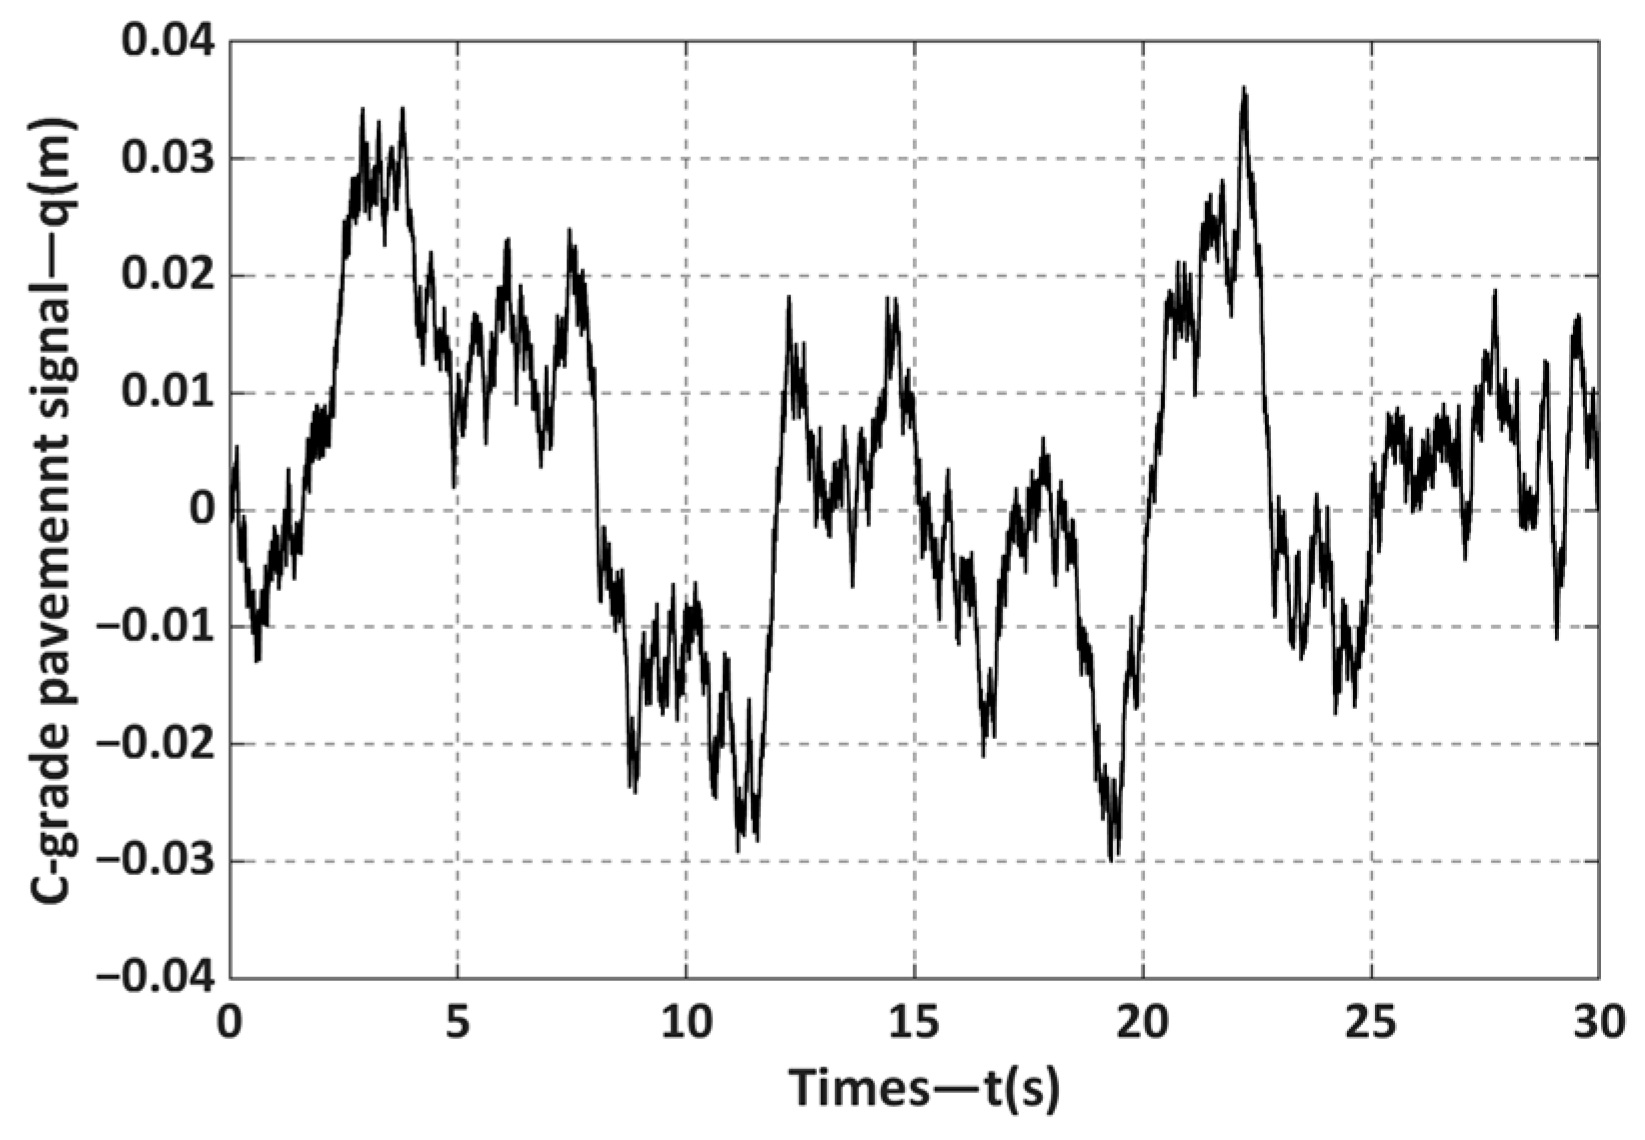
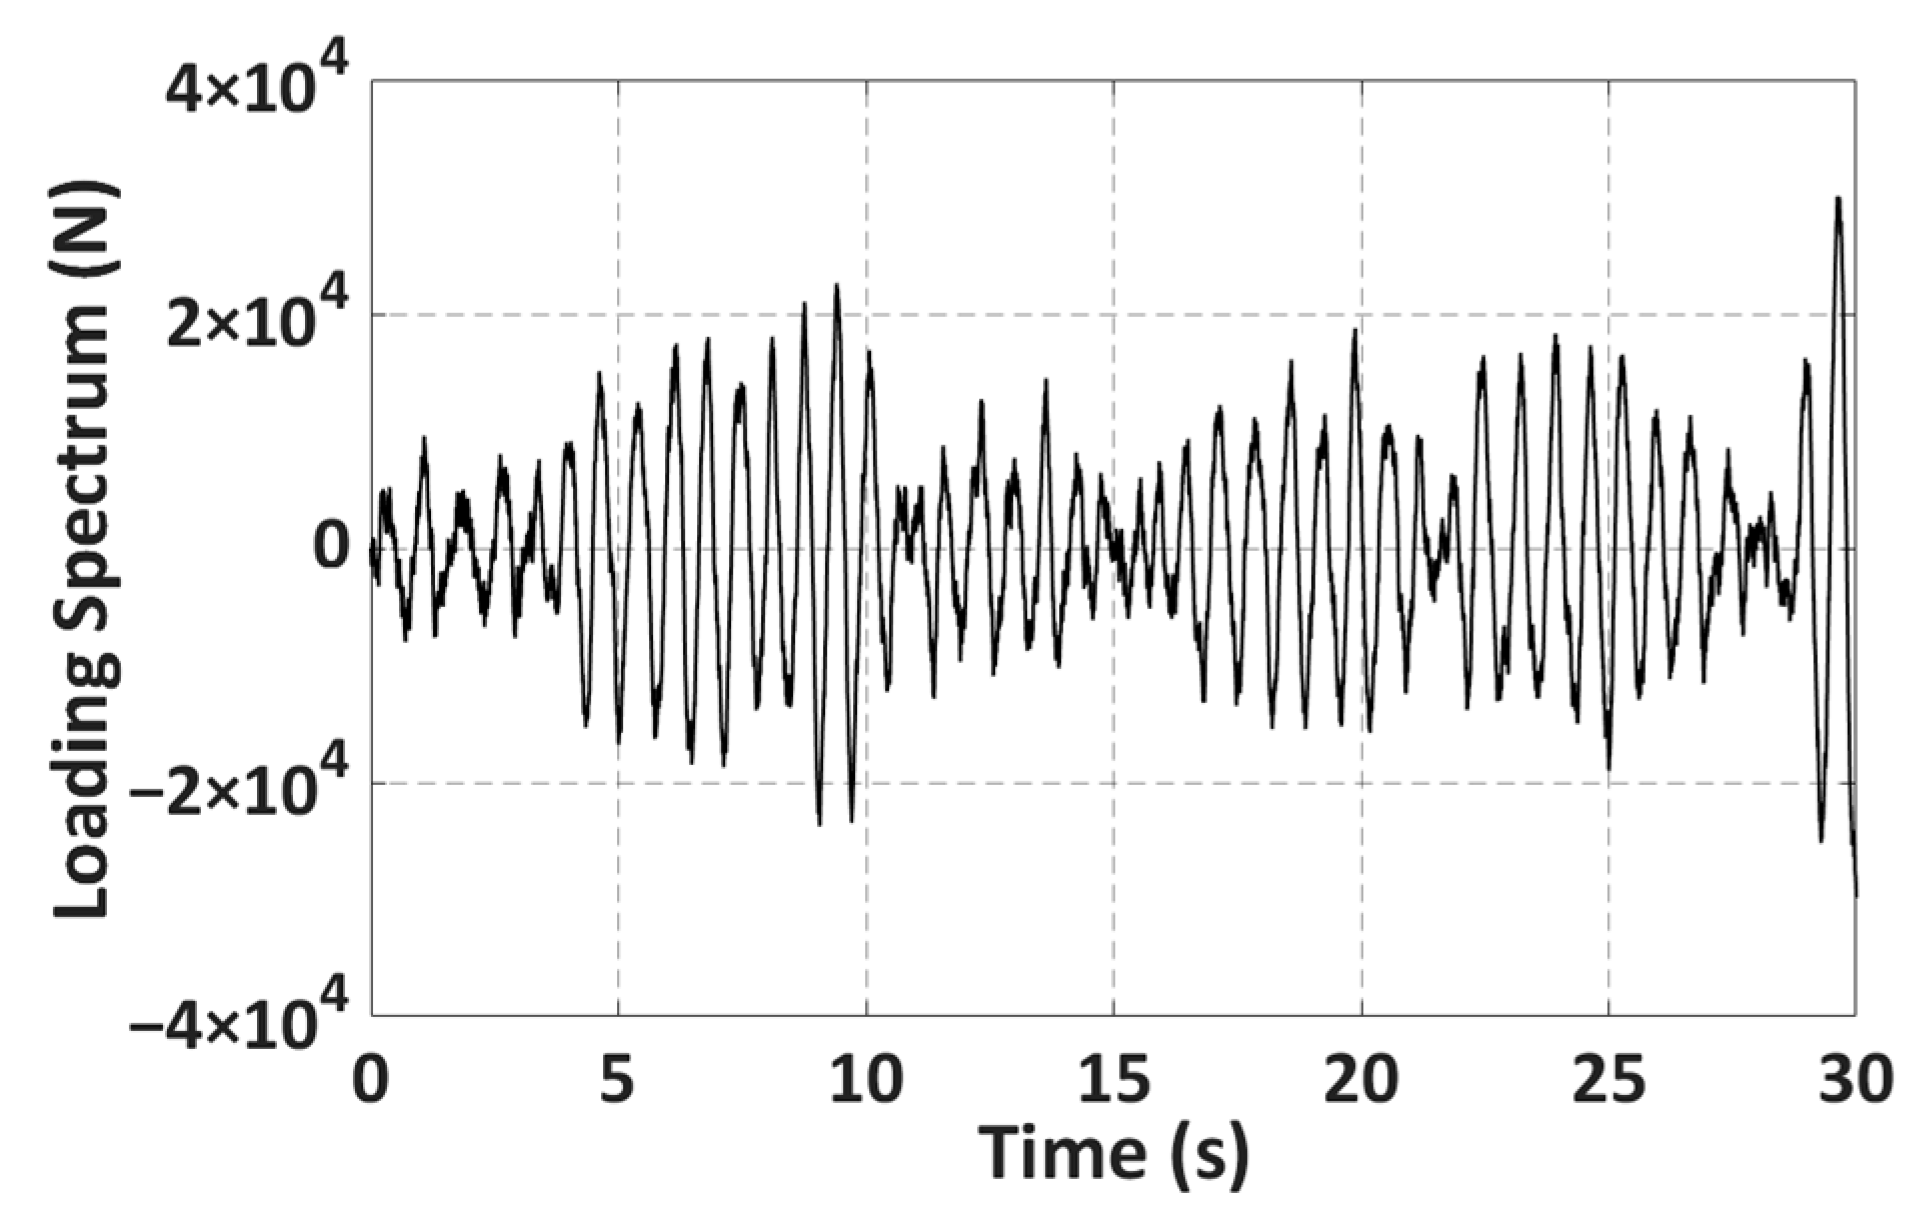
11]. The load spectrum of the upper surface of the fifth wheel was obtained by simulating the time-domain excitation signal of the C-grade road, and the limit fatigue life was estimated with the help of finite element software, according to the load change of the fifth wheel in the actual vehicle transport process, and the fatigue-prone key parts were identified [
12]. For the lightweight design of the fifth wheel, in the optimization with mass as a single objective, a model is established by constraining the first-order modal frequency and equivalent stress of the structure, and the lightweight design of the traction seat is investigated using the optimization method of the dimensional parameters to achieve the effect of lightweight design [
13,
14]. For multi-objective optimization, the mass and first-order intrinsic frequency are usually taken as the objective functions for model building, and the static–dynamic performance and fatigue reliability are verified by the optimal solution to achieve the unity of lightweight and safety [
15].
To achieve better lighting in vehicles, reduce costs, and improve fuel economy at the same time, some scholars have conducted considerable research related to automotive lightweighting. Zhou et al. [
16] proposed a collaborative design method for the key load-bearing parts of automobiles, including the framework of the entire lightweight design process such as structural optimization, material lightweighting, and manufacturing process optimization. The steering knuckle, a load-bearing part of the automobile chassis, was designed and analyzed in detail, and a lightweight target was achieved after the optimized design of the structural topology. Zhang et al. [
17] proposed a structure, design, and optimization method for a magnesium–aluminum alloy combination wheel hub through the establishment of the combination wheel bending and radial fatigue test finite element model, simulation and analysis of the fatigue performance of the combination wheels under the two conditions and their influencing factors, and multi-objective optimization of the assembled wheels, which achieves the purpose of reducing the weight; at the same time, the bending fatigue life and radial fatigue factor of safety are reduced. Li et al. [
18] proposed a comprehensive lightweight design method for automobiles that analyzed the stress, strain, and safety coefficient of automotive components according to their stress, strain, and safety coefficients, determined the applicable location for lightweight design, and reapplied the finite element method to the weight-reduced parts.
Numerous researchers have explored the application of the Multi-Objective Genetic Algorithm (MOGA) to vehicle optimization design. Wang et al. [
19] combined the Non-dominated Sorting Genetic Algorithm (NSGA-II) with an artificial neural network to establish a multi-objective optimization model for self-weight, stiffness, and frequency, which reduces the self-weight of the frame structure and improves the torsional stiffness and torsional frequency of the frame structure by optimizing the CSS of the thin-walled beam. Diba et al. [
20] used a multi-objective genetic algorithm (MOAG) to optimize the driveline components with acceleration time, fuel consumption, and driveline price as the objective function. The overall efficiency of the optimized hybrid driveline was evaluated using a computer model simulation, which improved the overall fuel efficiency of the driveline. Aly et al. [
21] developed a multi-degree-of-freedom automotive model of an improved semi-active suspension system subjected to stochastic road excitations, validated the proposed genetic operator through numerical examples, and investigated automotive suspensions with active damping, and found that the reconciliation behaviors in the objectives or constraints of the suspension problem will lead to disjoint Pareto boundaries.
To verify that the performance of a vehicle under pavement excitation meets the requirements of use, many scholars have studied the strength, stability, energy consumption, and durability of vehicles under pavement excitation. Li et al. [
22] compensated for the shortcomings of the frequency domain method to a certain extent based on spectral decomposition and regularization of the stochastic dynamic load identification time domain method. Zhang et al. [
23] used Gaussian–Legendre integrals to obtain non-smooth stochastic road excitations in the time domain, using applied evolutionary spectrum theory to evaluate the response in the time-frequency domain. They found that non-smooth road excitations have a great role to play in the design and optimization of the ride comfort suspension system. Vaidas et al. [
24] developed a fine dynamic model and suspension for assessing vehicle stability influenced by tire treads, which enables a more accurate assessment of the road’s influence on unevenness with respect to vehicle suspension and body motion on vehicle stability. Jiang et al. [
25] simplified the dynamical model by neglecting the inverse calculation method of monorail road excitation and verified the model by comparing the experimental data with the simulation results. They found that the simulation results of acceleration under the effect of inverse calculation of the road unevenness were consistent with the experimental data, which confirms the validity of the model only at low frequencies. Chin et al. [
26] proposed a more accurate energy characterization method for the energy-based durability prediction of suspension coil springs under random loading conditions and found that the Morrow-based model provided the highest accuracy in fatigue life prediction. Mechanical et al. [
27] developed a time-domain coupled system by modeling a two-degree-of-freedom quarter-vehicle using Galerkin’s method, which was solved using the Newmark-β direct numerical integration method based on the linear mean acceleration method by evaluating the response of the coupled system, effects of the vehicle speed, roughness of the road surface, stiffness of the soil, and effect of parameters such as suspension damping on the response. Guo et al. [
28] established a longitudinal–vertical coupled dynamics model for DCT vehicles considering powertrain mounts and compared the simulation results of the longitudinal–vertical coupled dynamic DCT vehicle model, considering road excitation, with the vehicle test results. They found that the model could accurately reflect the effect of road excitation on the dynamic performance of the DCT vehicle under the conditions of starting and gear shifting.
For the lightweight and multi-objective optimal design of the fifth wheel, most scholars consider the mass, frequency, and material as the optimization objectives. Owing to the existence of a certain link between mass and fatigue performance, the smaller the mass, the lower the fatigue life, and it is not possible to ensure that the fatigue life meets the lightweight requirements simultaneously. In practical applications, the weight of the fifth wheel and its fatigue performance should be taken into account; therefore, this study establishes an optimization model with weight and fatigue life as the objectives so that the two can achieve synergistic optimization and validation.
3. Fatigue Life Prediction Based on a Hybrid Model of Random Forest Algorithm and Improved BP Neural Network
3.1. Multi-Objective Optimization
Lightweight design plays a crucial role in vehicle manufacturing. By reducing the weight of the fifth wheel, the overall vehicle weight can be reduced, fuel efficiency can be improved, and vehicle performance and safety can be enhanced.
The fifth wheel is a key component connecting the tractor and semi-trailer. The semi-trailer operates under intense and complex working conditions, leading to significant fatigue performance challenges. If a lightweight design of the fifth wheel is implemented, the fatigue performance of the fifth wheel can be improved without compromising its weight reduction, and the overall vehicle performance will also be enhanced.
In multi-objective optimization problems, conflicting objective functions must be optimized simultaneously and cannot be simplified into a single objective function. In this study, multi-objective optimization adopted the method of a multi-objective genetic algorithm (Yongmin et al. [
35]) and solved the multi-objective optimization problem through fitness sharing, Pareto frontier sorting, and crowding distance.
The basic idea of MOGA is to search for the optimal solution set of multiple objective functions by simulating the genetic mechanism of nature, obtaining a series of equilibrium solutions that achieve a good balance between multiple objective functions.
Most researchers use constrained fatigue life to minimize mass. For the fifth wheel, both lightweight design and improved fatigue life are important. Therefore, this study aims to achieve lightweight design and improve fatigue life simultaneously, rather than focusing solely on a single maximum value calculation. The multi-objective optimization in this study targets the minimum mass and maximum number of minimum lifetimes of the fifth wheel. The maximum stress under the three conditions was constrained to be less than 600 MPa. The multi-objective optimization mathematical model of the fifth wheel was formulated using Equation (5).
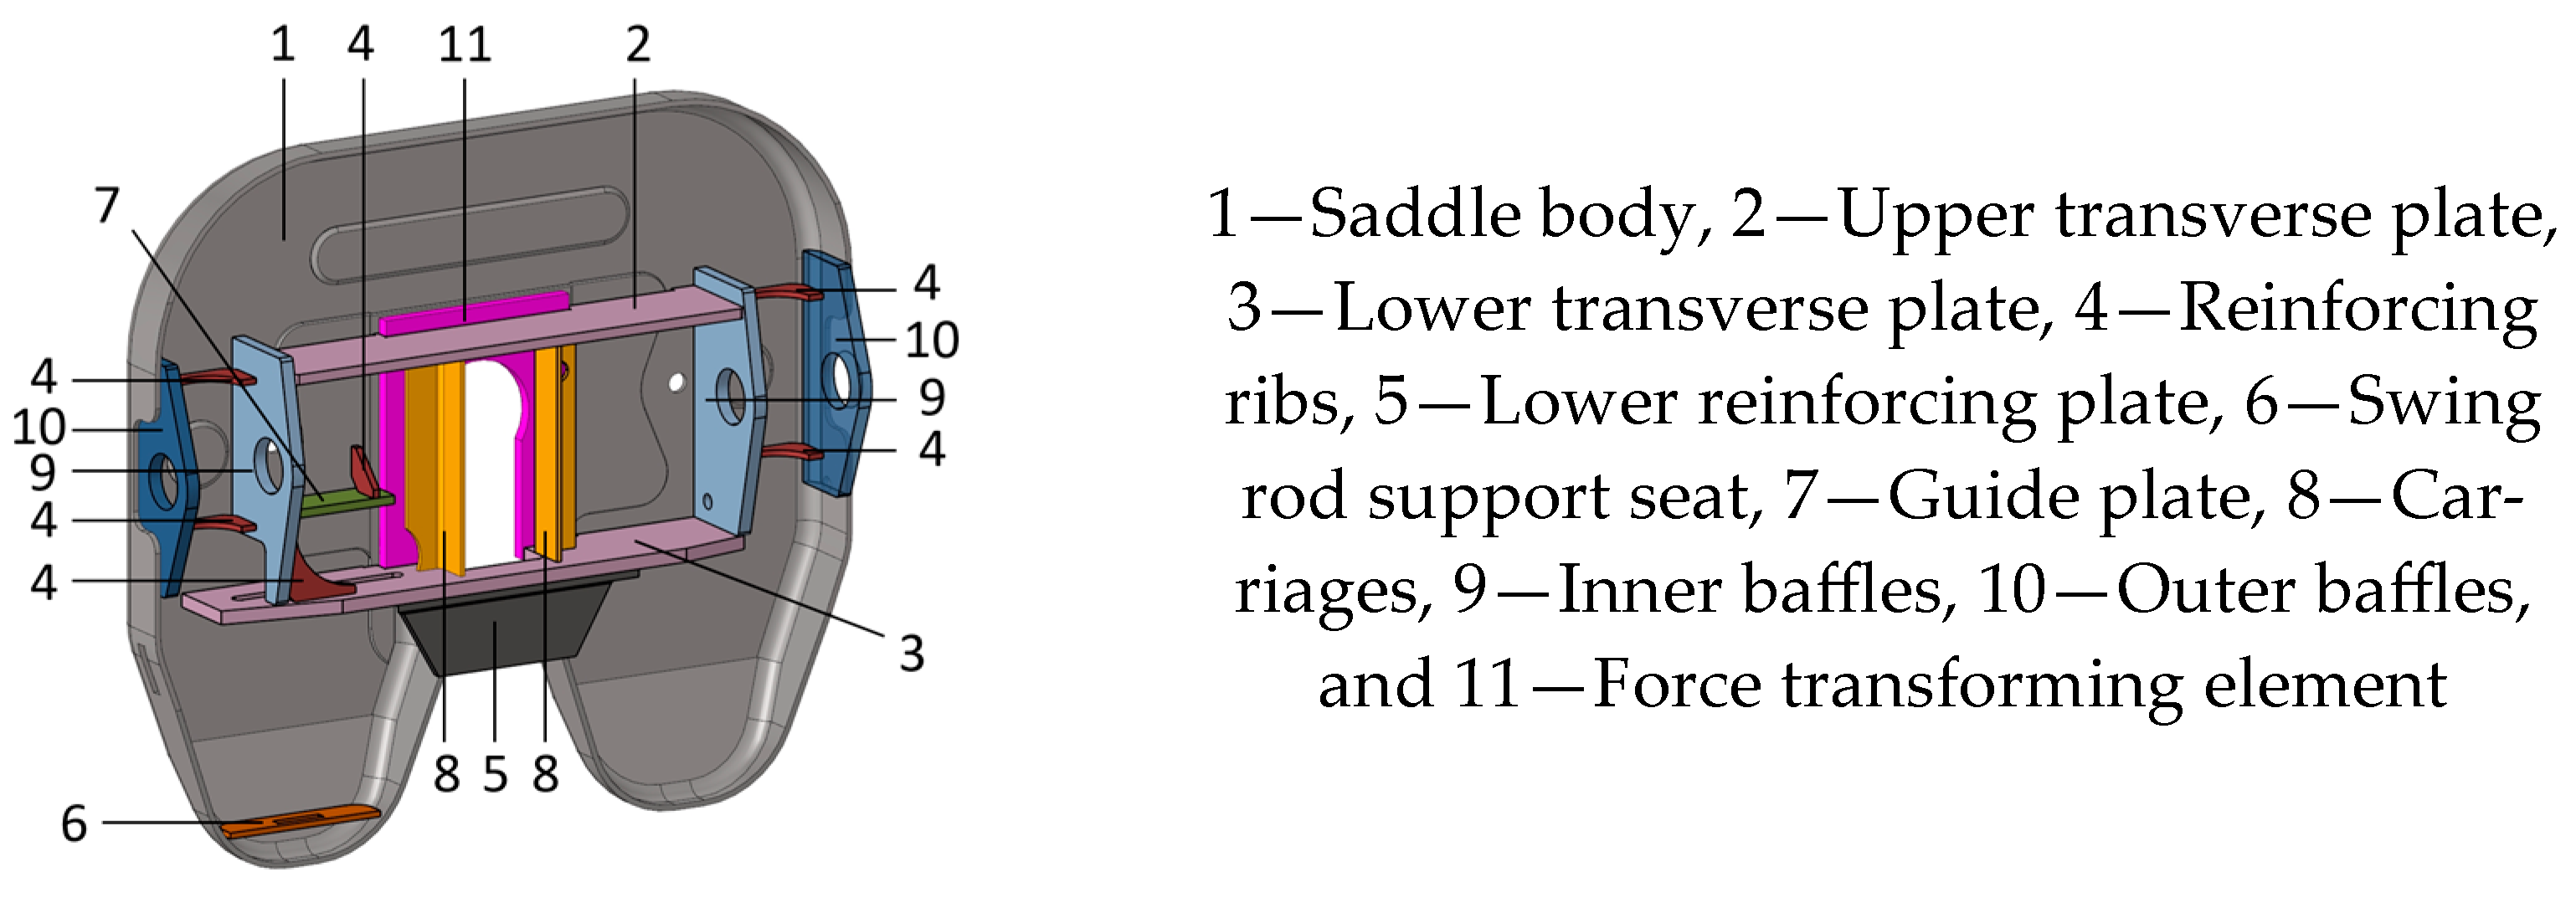
In the shell unit diagram of the fifth wheel, the force-transforming element is located at the center as a solid unit. As shown in
Figure 11a, the thickness of the saddle body is in the range of 6 mm to 7.5 mm. The corresponding function is
in
X. As shown in
Figure 11b–j, the thicknesses of the upper transverse plate, lower transverse plate, reinforcing ribs, lower reinforcing plate, swing rod support seat, guide plate, carriages, inner baffles, and outer baffles, respectively, range from 6 mm to 20 mm. The corresponding function is [
,
,
] in X.
Figure 11k shows the force-transforming element. M(X) represents the total mass of the fifth wheel, corresponding to the thickness of each component. Ni(X) represents the fatigue life of each unit point of the fifth wheel, corresponding to the thickness of each component under the three conditions. Si(X) represents the equivalent stress of the fifth wheel under corresponding conditions. Because the first condition is static, the stress is very small; therefore, it is not constrained. Because the maximum stresses in conditions 2 and 3 are located at the lower transverse plate, the objective function is the minimum mass
f1 and the maximum life
f2 simultaneously. It is only necessary to constrain the maximum stress of conditions 2 and 3 to less than 600 MPa of the yield strength of SD600.
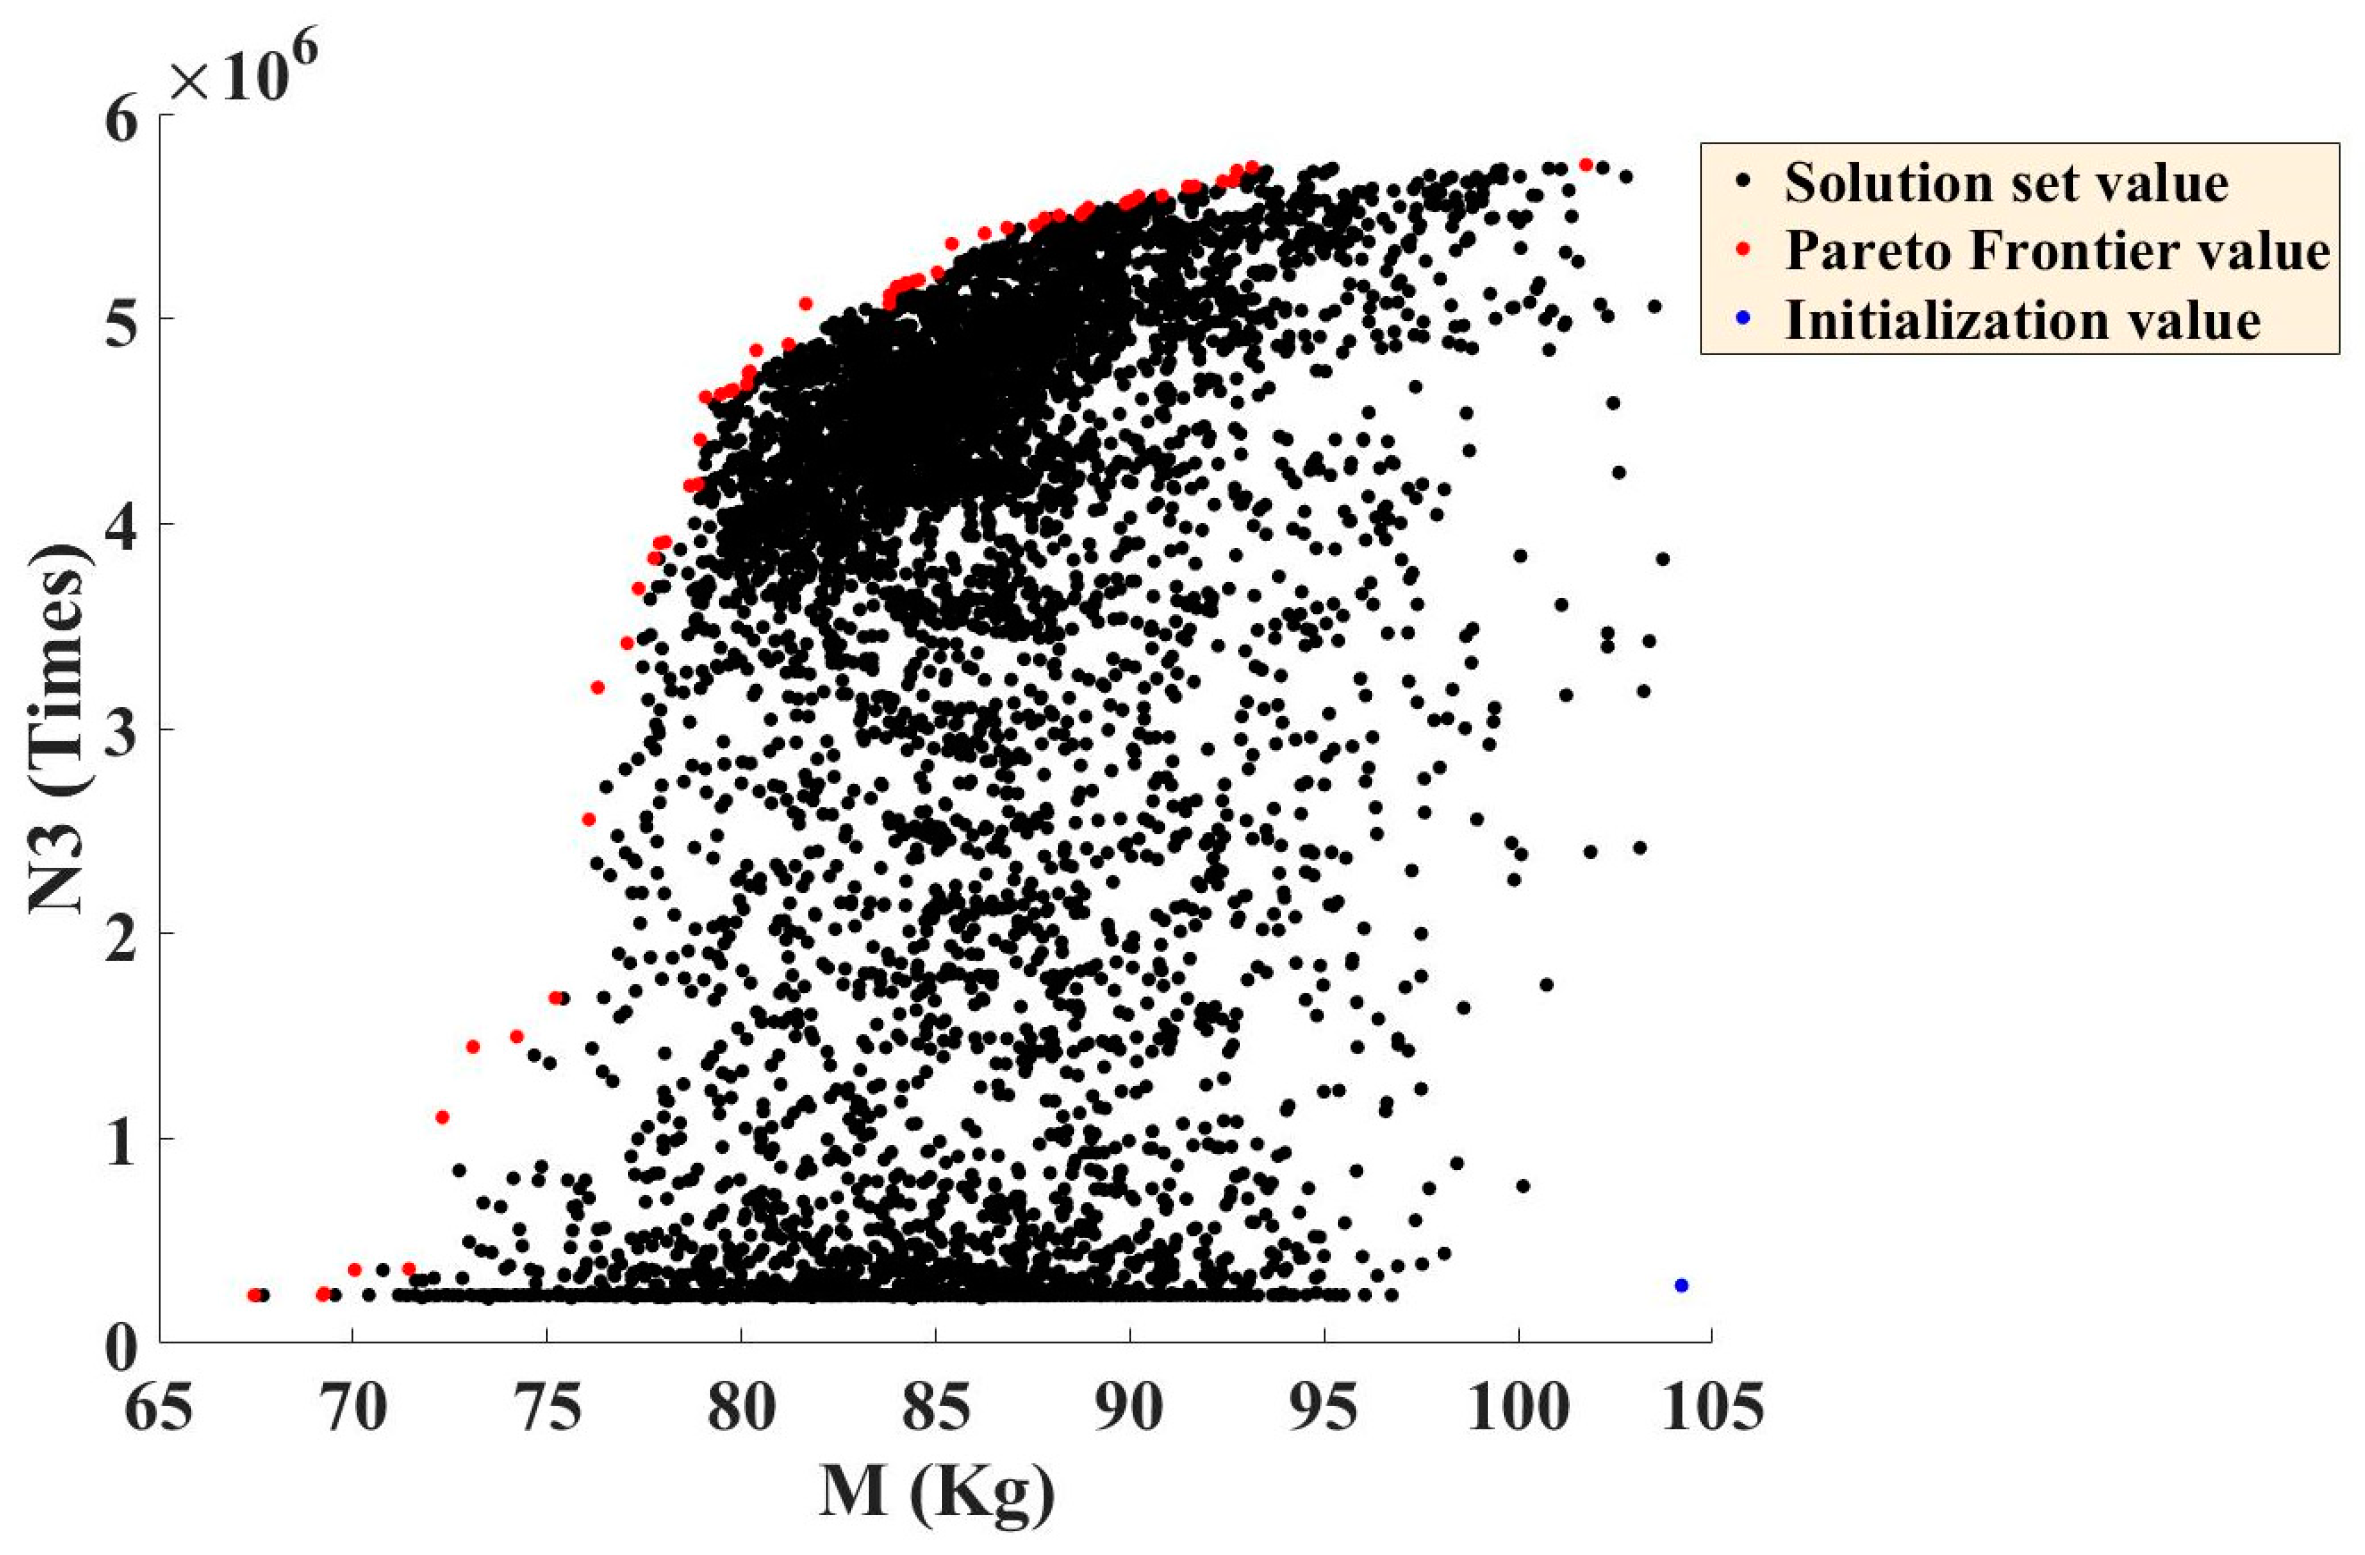
HyperStudy was utilized for multi-objective optimization. In the multi-objective optimization results, the fatigue life under condition 2 mostly exceeds 1.0 × 10
7 cycles. Therefore, only the weight-life optimization results for condition 3 were analyzed. As shown in
Figure 12, the scatter plot illustrates the relationship between weight and minimum fatigue life under condition 3. The black points represent the solution set values, the blue point in the lower right corner indicates the initial value, and the red points denote the Pareto frontier values.
From the trend of the Pareto frontier values in the scatter plot above, it is evident that the trend of the points aligns with the actual situation. Specifically, the greater the mass, the greater the fatigue life.
Next, the multi-objective optimization results were processed. First, outliers were removed. The total mass (M) of the fifth wheel fluctuates within a certain range due to the constrained thickness ranges of its components. The fatigue life data fall within the range of 1.0 × 10⁴ to 1.0 × 10⁷ cycles.
In the calculated life results, the majority of the fatigue life values under condition 2 exceeded 1.0 × 10⁷ cycles, and the fatigue performance under condition 2 was consistently stronger than that under condition 3 across all data groups. Therefore, this study focused on analyzing the fatigue life under condition 3 as the primary indicator. After removing outliers, 6000 data points remained from the optimized dataset.
3.2. Fatigue Life Prediction Based on a Hybrid Model of BP Neural Network and Improved Random Forest Algorithm
To obtain the relationship between each component of the traction seat and the total mass and fatigue life of the traction seat, this study used 6000 sets of data calculated by the multi-objective genetic algorithm for training tests, with the thickness of the ten components as the input and the total mass and fatigue life as the output.
Because there is a linear relationship between the thickness of the ten components and the total mass of the traction seat, the relationship equation between the mass and the thickness of each component was calculated as:
In Equation (6), where M denotes the total mass of the fifth wheel, the [,,,] represent, respectively, the thickness of the saddle body, upper transverse plate, lower transverse plate, reinforcing ribs, lower reinforcing plate, swing rod support seat, guide plate, carriages, inner baffles, and outer baffles.
The dataset generated by multi-objective optimization was imported after singular value processing. It was then divided into training and test sets and normalized for easier analysis. The normalized data were individually trained and predicted using the random forest model. The Mean Absolute Percentage Error (MAPE) of the predictions was calculated by adjusting the parameters of the random forest. The parameter set with the smallest MAPE was selected, and its predictions were fused with the original ten features to create a new dataset. This fused dataset was then used for training and prediction using a BP neural network, and the MAPE of the hybrid model was calculated. The model analysis processing flow is illustrated in
Figure 13.
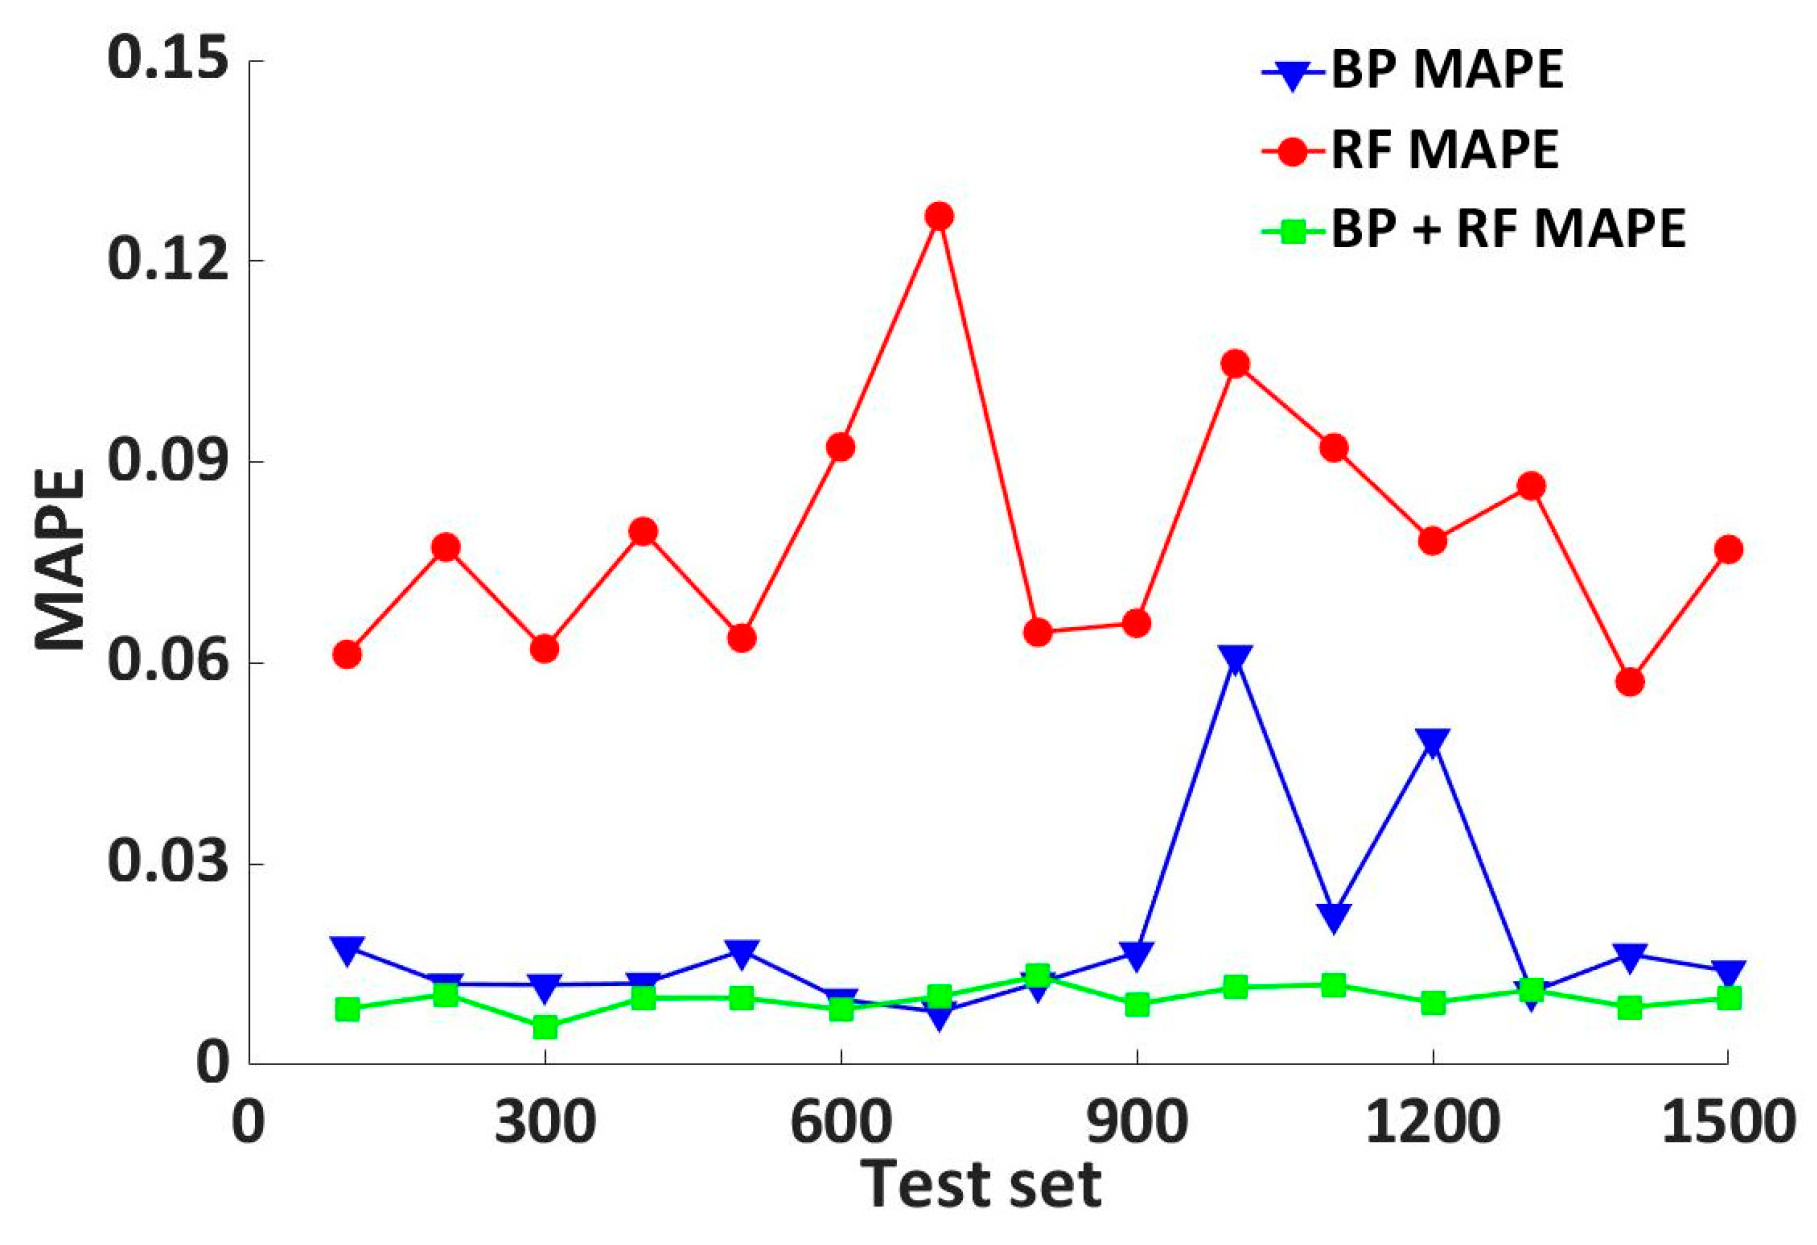
The MAPE for fatigue life prediction by the BP neural network was calculated to be 1.89%, the average absolute percentage error for fatigue life prediction by random forest algorithm was 7.73%, and the MAPE for hybrid model prediction was 0.99%.
Table 9 presents the results.
The MAPE comparison of the three models is shown in
Figure 14, where the blue bar represents the BP neural network prediction model, the red bar represents the random forest algorithm prediction model, and the green bar represents the hybrid model prediction model. It can be observed that the hybrid model has the smallest MAPE among the three models, and its MAPE is significantly smaller than that of the other two models. In this work, which predicts the fatigue life under condition 3 based on the known thicknesses of the ten components of the fifth wheel, the hybrid model’s accuracy is 47.62% higher than that of the BP neural network.
This approach enables more accurate prediction of the fatigue life based on the thickness of individual components, eliminating the need for complex parameter settings and extensive model calculations.
3.3. Secondary Optimization and Inverse Prediction of Part Thickness
In multi-objective optimization, the objectives are to minimize the total mass of the fifth wheel and maximize the minimum fatigue life. There was a positive correlation between the two variables: The smaller the mass, the smaller the corresponding minimum fatigue life. To achieve coordinated optimization between the two, it is necessary to obtain the minimum value of f in Equation (7).
In Equation (7), M is the total mass of the fifth wheel, and N3 is the minimum fatigue life of condition 3 at this mass.
Next, the mass (M) and minimum fatigue life under condition 3 (N3) from the 6000 datasets of the multi-objective optimization results were sorted. The mass (M) was sorted in ascending order. Data points from the 6(i − 1) + 1th to the 6ith positions were assigned a value of i. For example, data points from the 1st to the 6th positions were assigned a value of 1, and so on. Data points from the 6031st to the 6000th positions were assigned a value of 1000. Similarly, the minimum fatigue life under condition 3 (N3) was sorted in descending order, and data points from the 6(j − 1) + 1th to the 6jth positions were assigned a value of j.
In practical applications, the fifth wheel must consider the fatigue performance while pursuing lightweight design. If an increase of 2–3 kg in weight can enhance the fatigue life by hundreds of thousands or even millions of cycles, it is definitely a better option. Therefore, the establishment of the evaluation index in this study is more inclined to the improvement of failure protection performance, with the lightweight being controlled within a 20% reduction. After comprehensive consideration, the evaluation index was set to 0.65i + 0.35j.
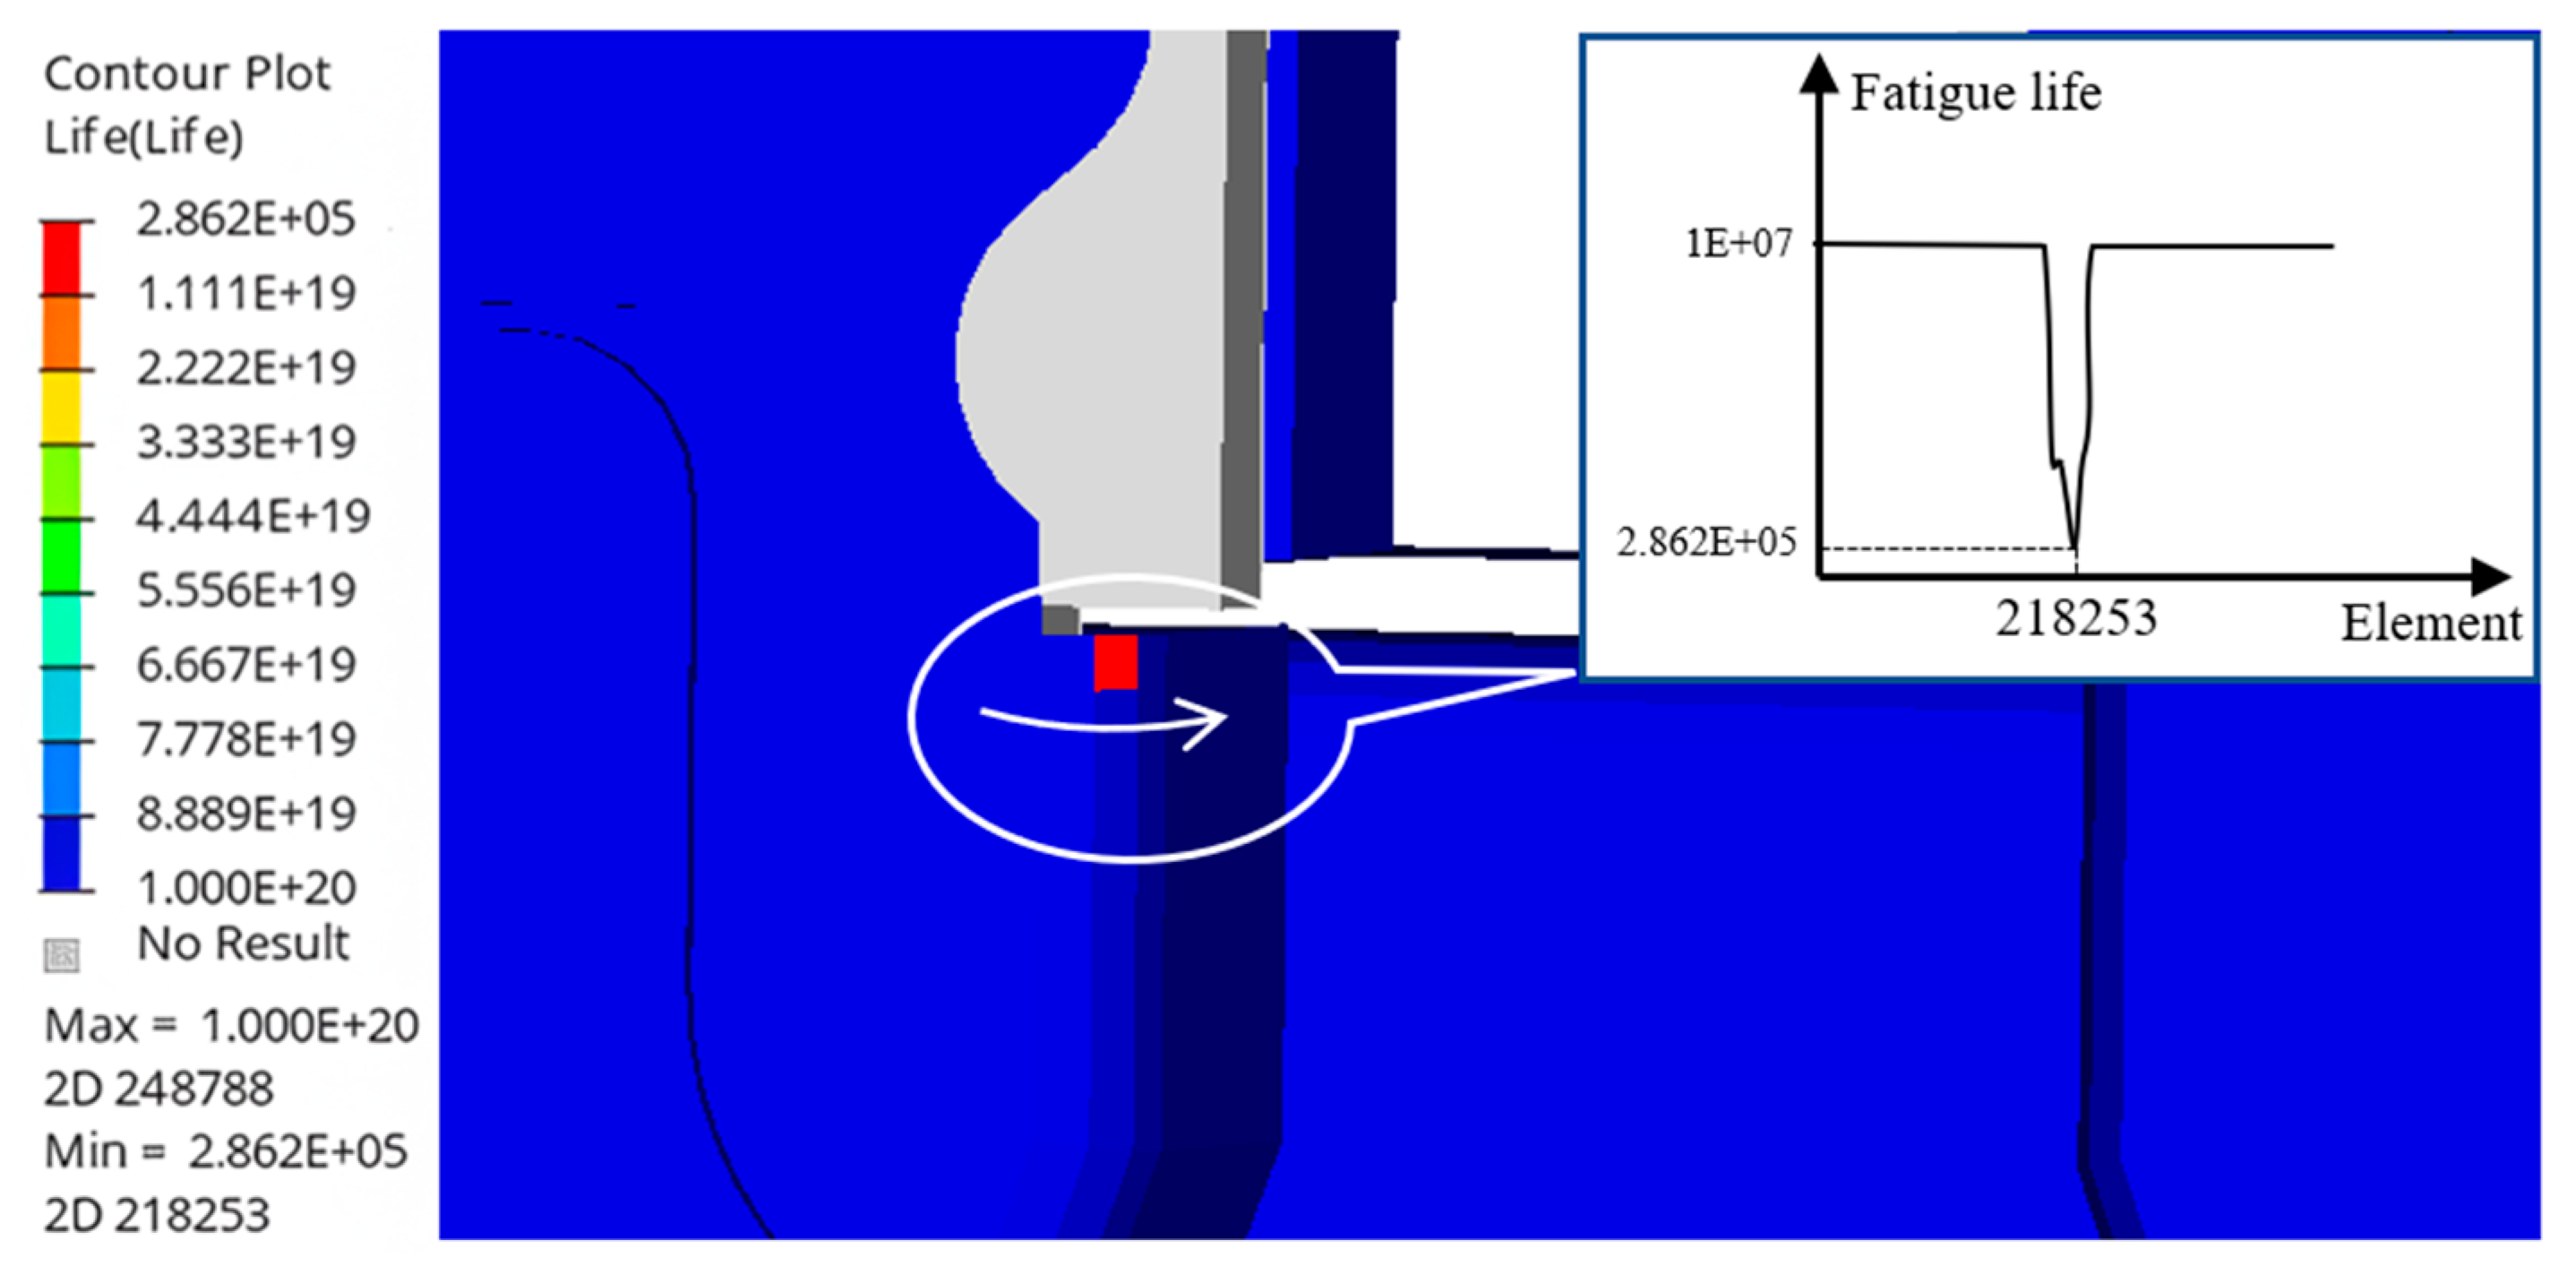
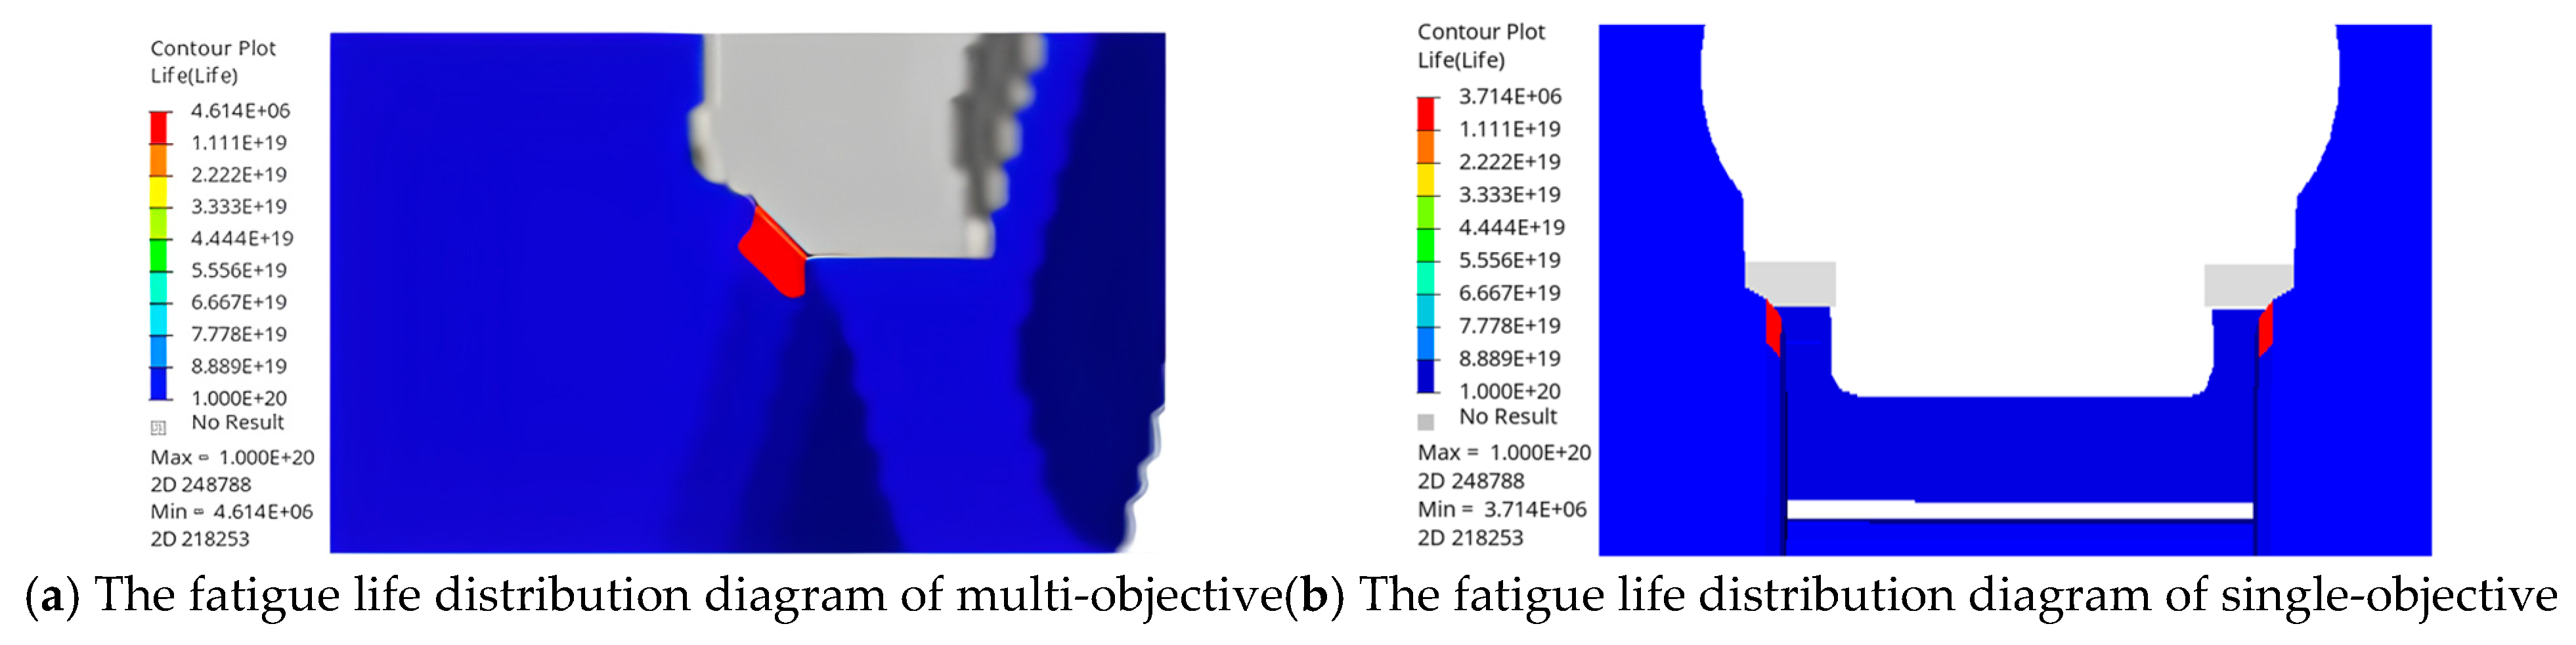
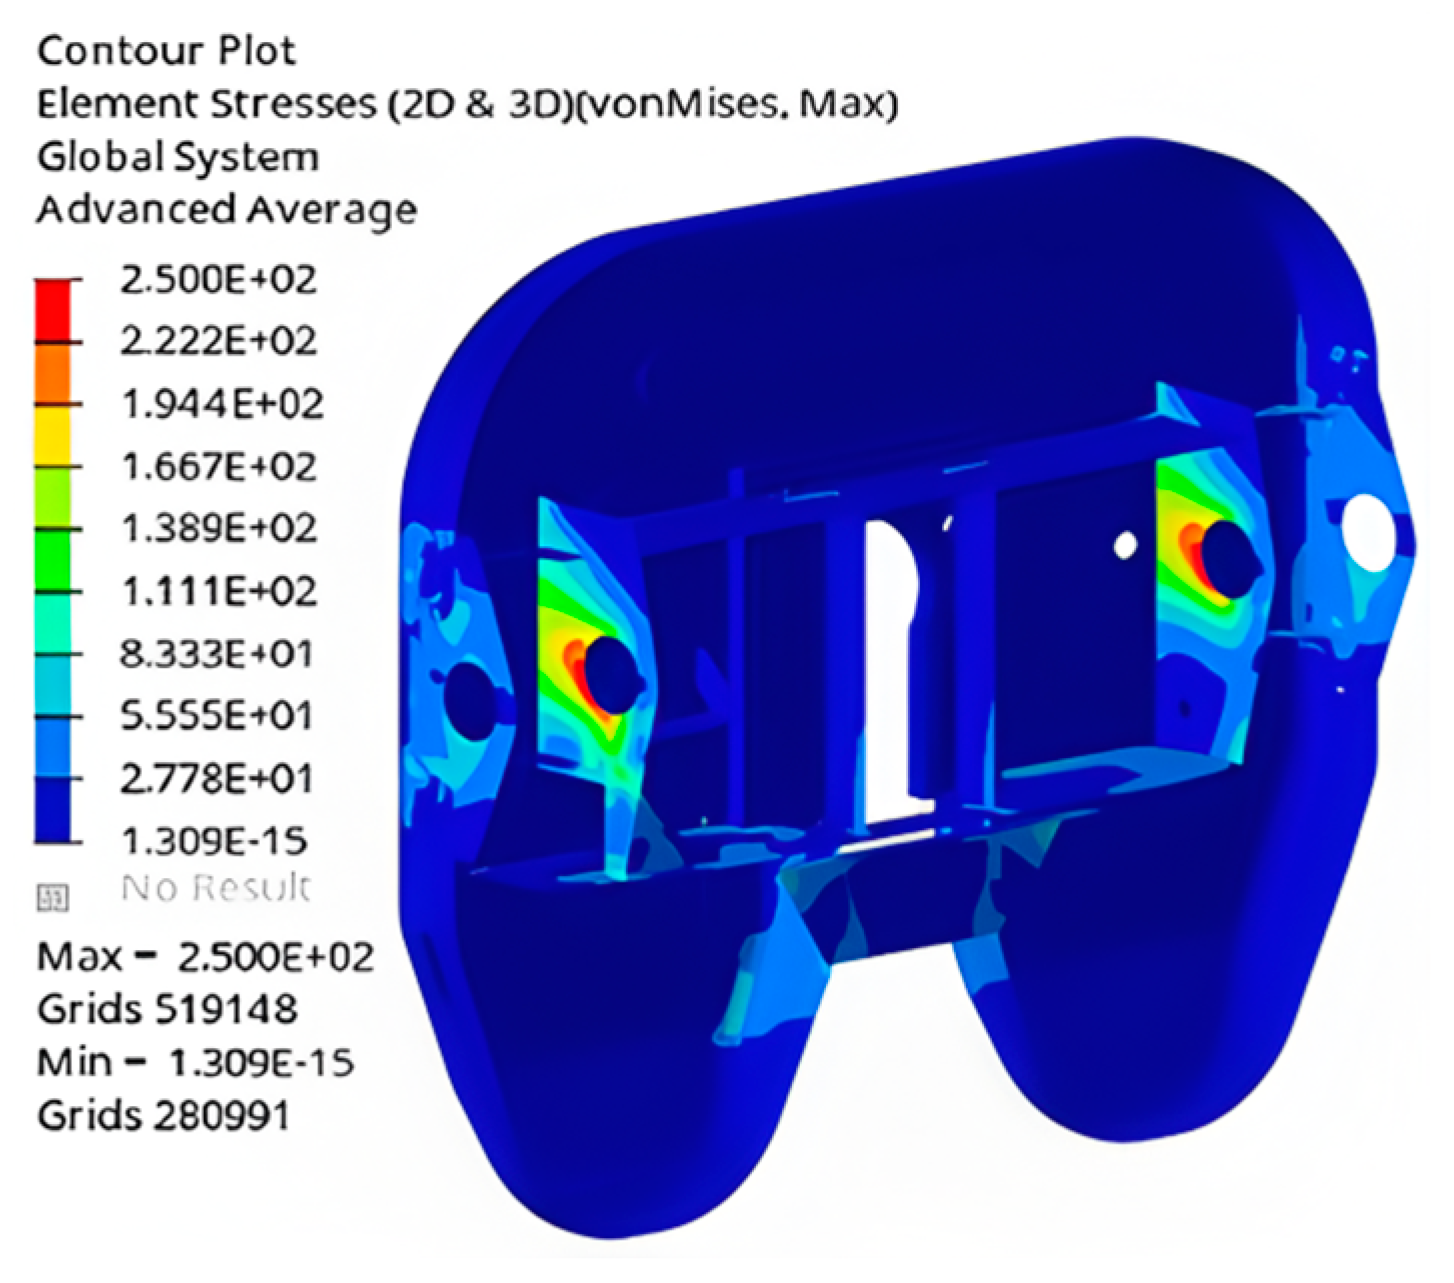
Based on the established multi-objective optimization evaluation index, the minimum value among the 6000 datasets was identified, representing the optimal balance between lightweight design and fatigue performance. This set is the optimal solution. The thickness of each component in the optimal solution is listed in
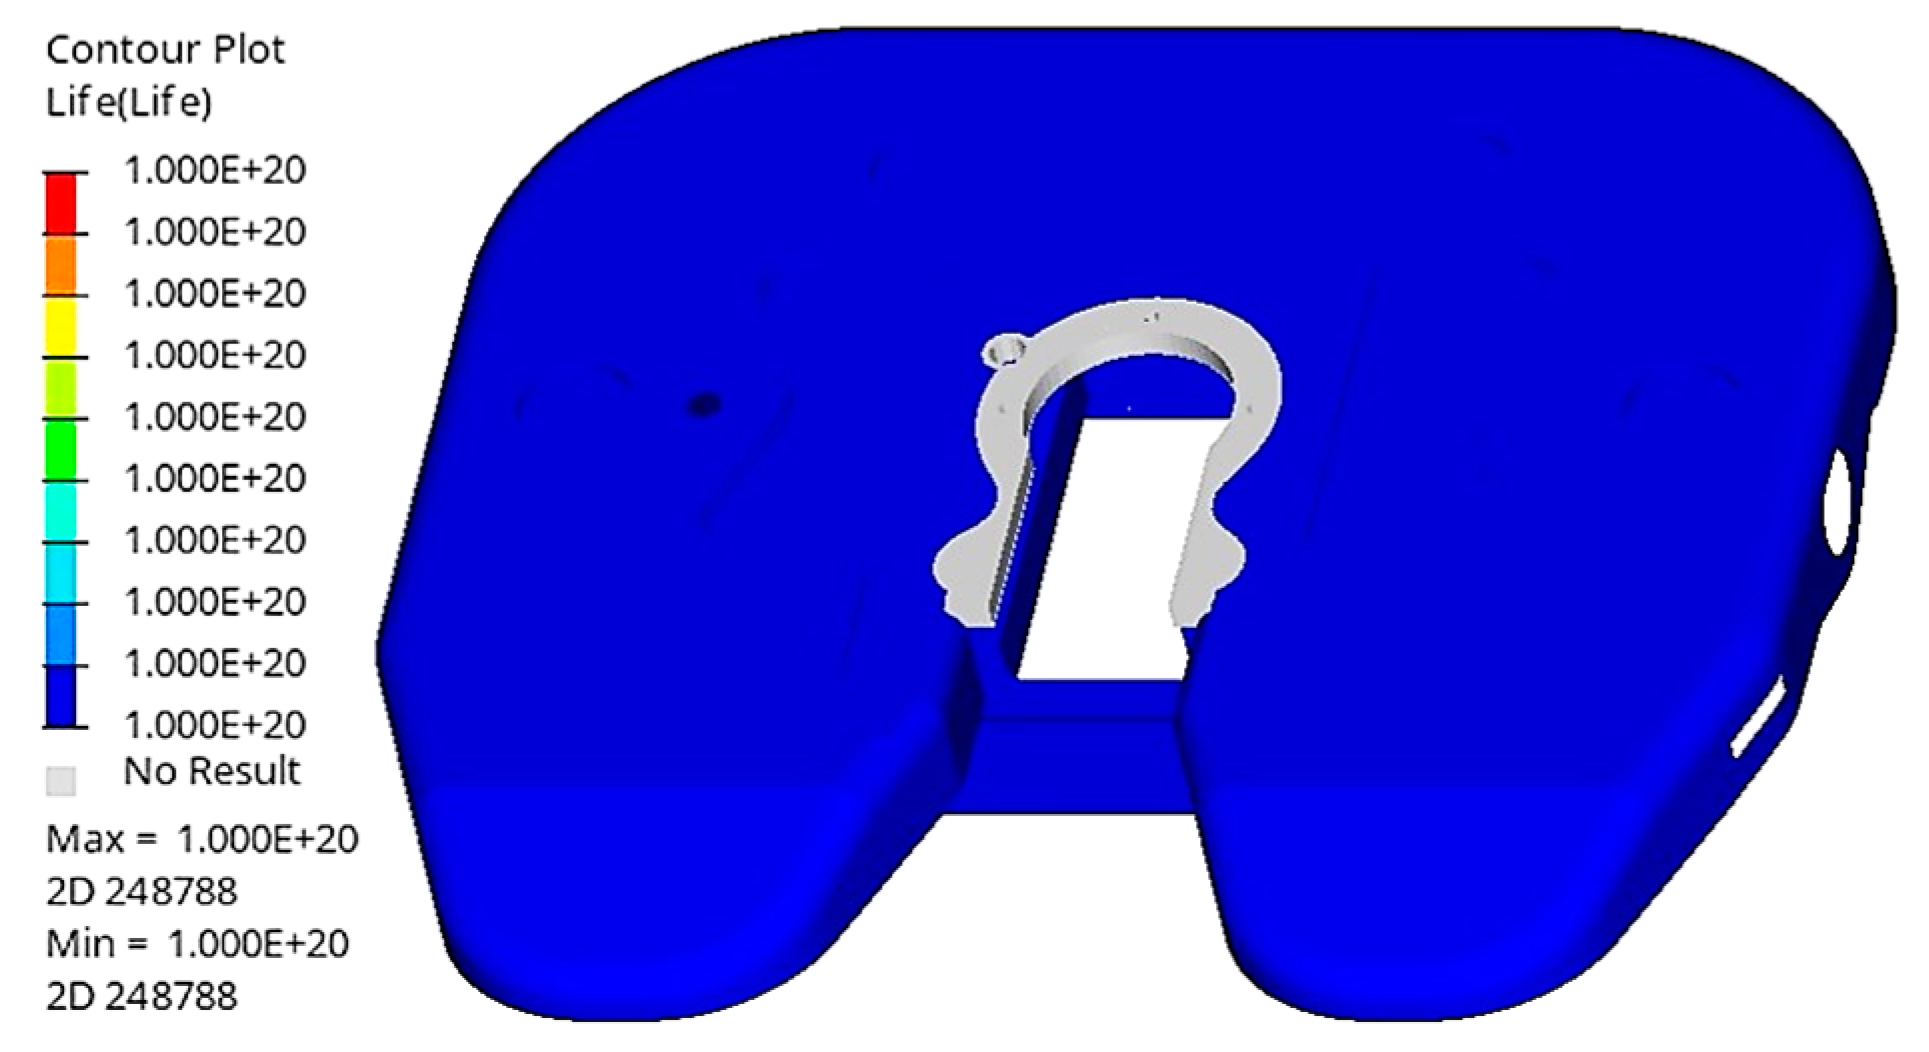
Table 10. The mass of the fifth wheel was 79.07 kg, and the minimum fatigue life reached 4.614 × 10
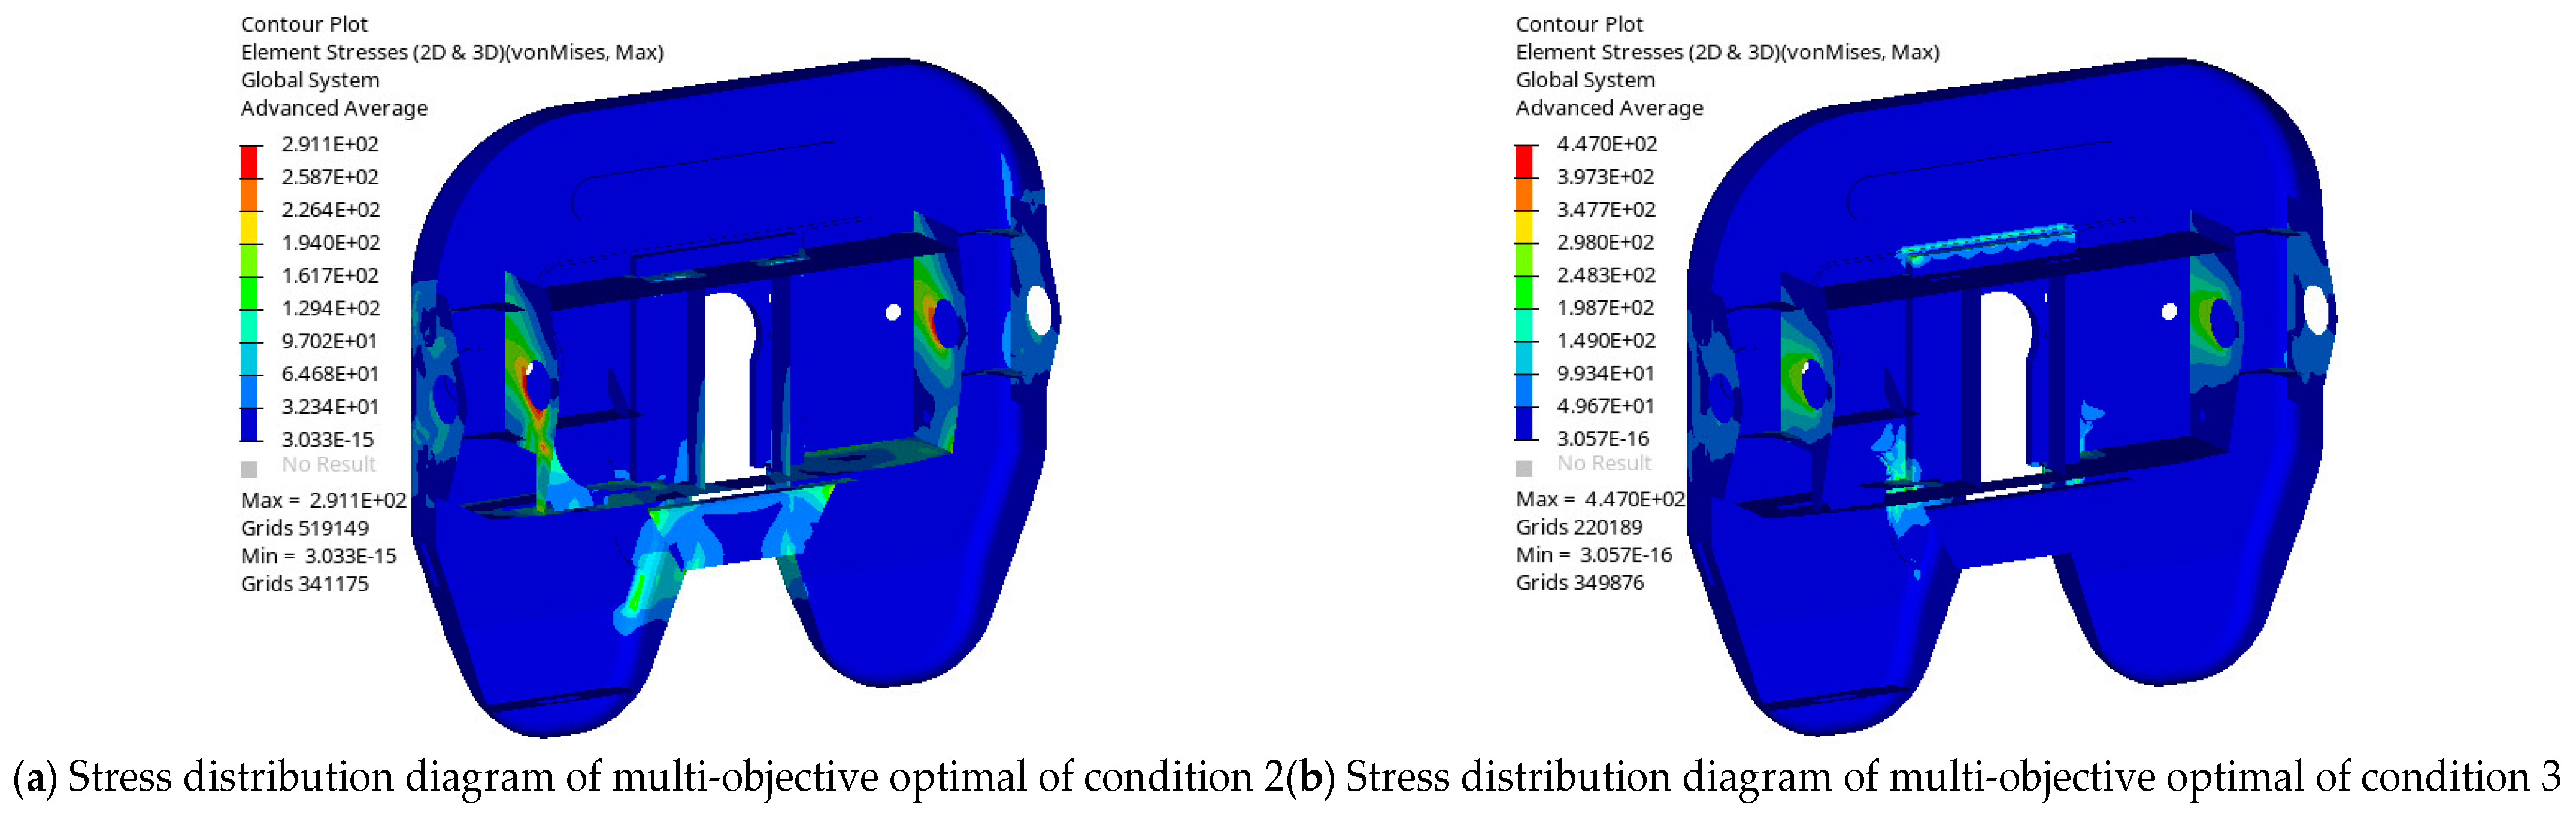
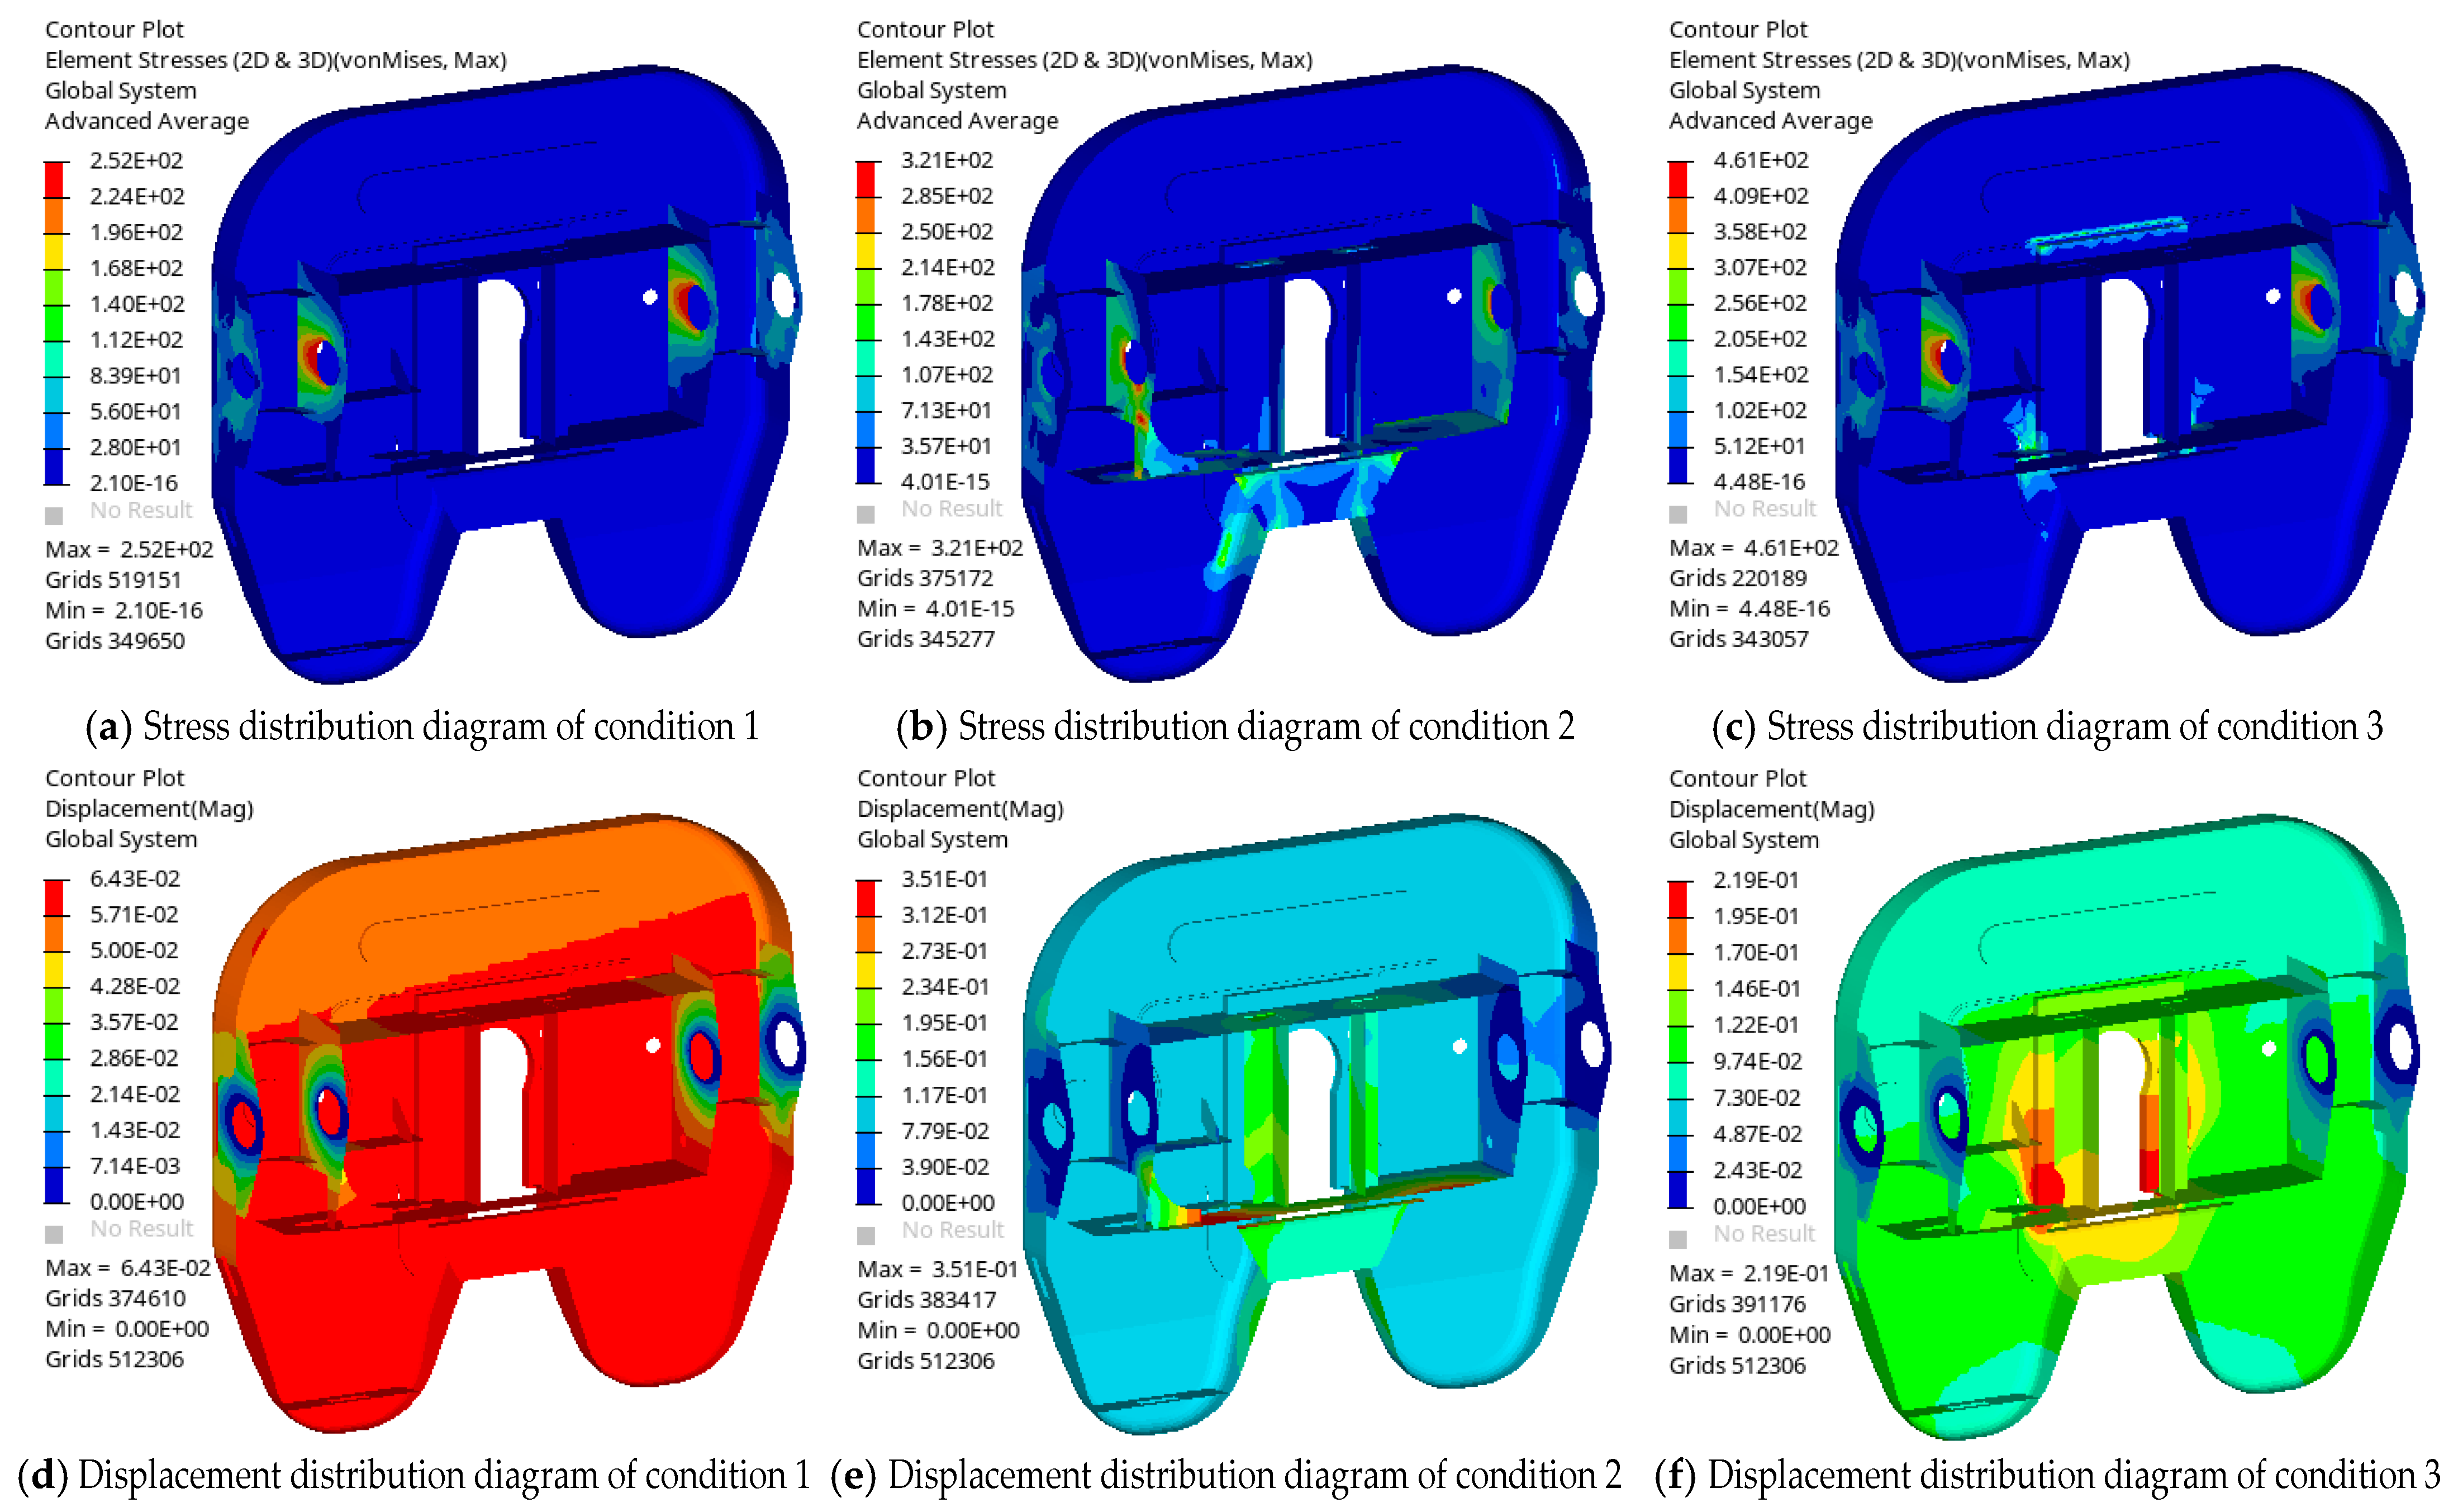
6 cycles. Moreover, the maximum stress was 291.1 MPa under condition 2 and 447.0 MPa under condition 3, which is below the 600 MPa yield strength of SD600, meeting the strength requirements. The fatigue life distribution diagram is shown in
Figure 15a, and the corresponding stress distribution diagrams are shown in
Figure 16a,b.
Single-objective optimization was conducted based on the optimal solution. In accordance with relevant fatigue test standards, N3 was constrained to exceed 2.0 × 10
6 cycles, and the maximum stress under both conditions 2 and 3 was limited to less than 600 MPa. The range of each variable was bounded based on the data in
Table 10, with the saddle body constrained to ±1 mm and the other components constrained to ±4 mm. Optimization was then performed to minimize the mass.
The thickness of each component for the optimal design option from the single-objective optimization results is listed in
Table 11. The mass of this group of results is 72.99 kg, while the fatigue life under condition 3, as shown in
Figure 15b, reaches 3.714 × 10
6 cycles. The position of the minimum life under condition 3 is also the element node-218,253. The maximum stress is 410.1 MPa under condition 2 and 458.9 MPa under condition 3, both of which are below the 600 MPa yield strength of SD600, satisfying the strength requirements. The corresponding stress distributions are shown in
Figure 17a,b.
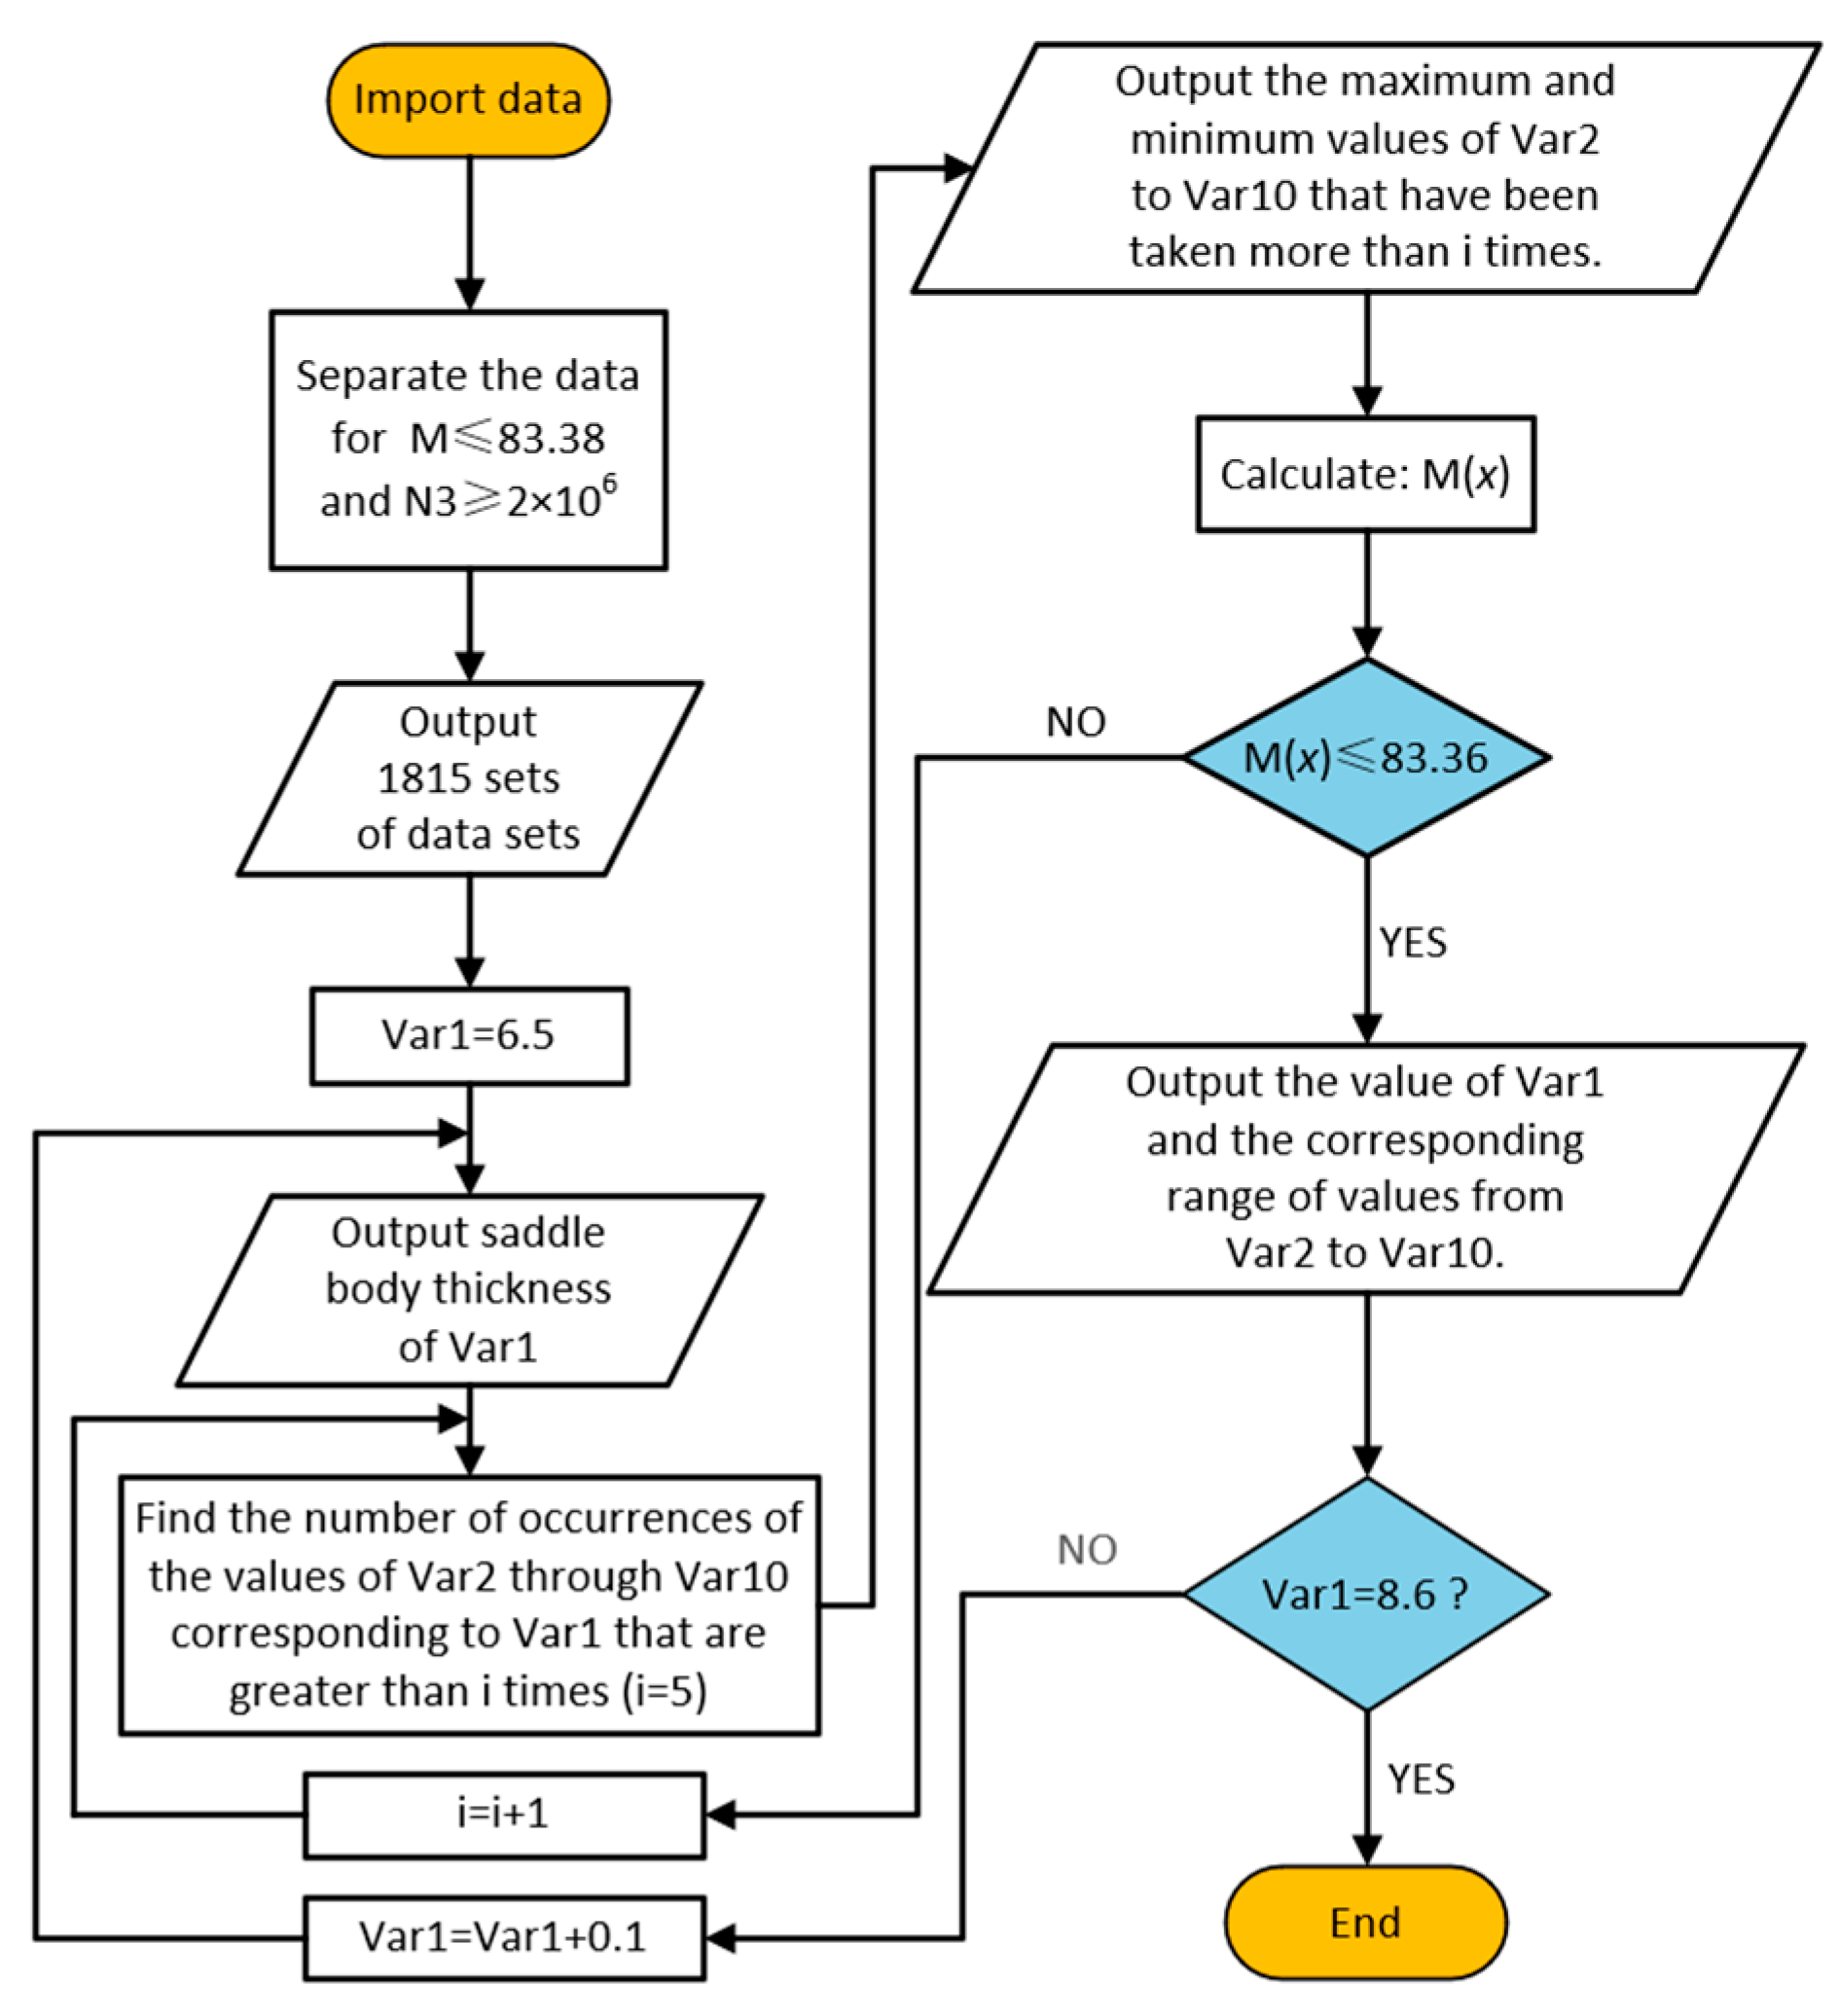
The data obtained from the single-objective optimization calculations were input and solved following the process illustrated in
Figure 18. In this process, M(x) denotes the maximum mass within the range of each independent variable. The calculation method is described in Equation (6), where
is replaced by Var1, and the maximum values within the statistical range of
to
are replaced by Var2 to Var10. The thicknesses of each component and their occurrence frequencies followed a normal distribution trend. Specifically, there is an intermediate value with the highest occurrence frequency, and the frequencies decrease symmetrically on both sides of this value. It was determined that M(x) was less than 83.36 kg, which is 80% of the original mass of the fifth wheel (104.2 kg), indicating a 20% weight reduction. The calculation results are listed in
Table 12. To further evaluate a 25% weight reduction, the value of 83.36 in the flowchart was adjusted to 78.15 kg, and the resulting value ranges are presented in
Table 13. Var1 to Var10 represent the thicknesses of the saddle body, upper transverse plate, lower transverse plate, reinforcing ribs, lower reinforcing plate, swing rod support seat, guide plate, carriages, inner baffles, and outer baffles, respectively.
Consequently, according to the requirements of different degrees of lightweight, the thickness range of the remaining components can be obtained when the saddle body thickness is provided and the fatigue life meets the corresponding standards. Values within the range of components with different wear levels can be modified according to the different application scenarios. Correspondingly, the service life will also be improved to a certain extent by providing the product with optional design requirements.


