Article

A Novel Voltage–Current Characteristic Model for Understanding of Electric Arc Furnace Behavior Using Experimental Data and Grey Wolf Optimization Algorithm

by
Mustafa Şeker
1,*,
Emre Ünsal
2,
Ahmet Aksoz
3 and
Mahir Dursun
4
1
Department of Electrical & Electronics Engineering, Sivas Cumhuriyet University, Sivas 58140, Türkiye
2
Department of Software Engineering, Sivas Cumhuriyet University, Sivas 58140, Türkiye
3
Department of Electrical & Electronics Engineering, Kayseri University, Kayseri 38280, Türkiye
4
Department of Electrical & Electronics Engineering, Gazi University, Ankara 06830, Türkiye
*
Author to whom correspondence should be addressed.
Appl. Sci. 2025, 15(7), 4005; https://doi.org/10.3390/app15074005
Submission received: 21 February 2025 / Revised: 21 March 2025 / Accepted: 1 April 2025 / Published: 5 April 2025

Abstract

:
The control of nonlinear systems cannot be effectively achieved using linear mathematical methods. This paper introduces a novel mathematical model to characterize the voltage–current (V–I) characteristics of the electric arc furnace (EAF) melting process, incorporating experimental field data for validation. The proposed model integrates polynomial curve fitting, the modified Heidler function, and double S-curves, with the grey wolf optimization (GWO) algorithm applied for parameter optimization, enhancing accuracy in predicting arc dynamics. The performance of the model is compared against the exponential, hyperbolic, exponential–hyperbolic, and nonlinear resistance models, as well as real-time measurement data, to assess its effectiveness. The results show that the proposed model significantly reduces voltage and current harmonic distortion compared to existing models. Specifically, the total harmonic distortion (THD) for voltage is reduced to 2.34%, closely matching the real-time measured value of 2.30%. Similarly, in the current spectrum, the proposed model achieves a significant reduction in third harmonic distortion and a THD of 11.40%, compared to 13.76% in real-time measurements. Consequently, a more precise characterization of the EAF behavior enables more effective mitigation of harmonics and vibrations, enhancing the stability and power quality of the electrical networks to which they are connected.

1. Introduction

Electric arc furnaces (EAFs) are one of the most significant nonlinear electrical loads widely used in industry. However, these loads introduce substantial harmonics and vibrations in the electrical networks, leading to power quality problems [1]. In addition, EAFs may contribute to inefficiencies in energy transmission, potentially causing failures or reduced performance in other devices connected to the same power grid. These inefficiencies result in increased fuel consumption to compensate for power losses, indirectly contributing to carbon emissions. Therefore, determining and controlling the properties of electric arc sources will have a significant impact on energy quality, reducing the carbon footprint and reducing the damage to the global energy sector [2].
The iron and steel industry has a significant impact on the global economy. The industry supplies primary materials to numerous sectors, including the automotive, construction, and manufacturing sectors [3]. EAFs and induction furnaces (IFs) are used in steel production facilities to perform the melting process of metals. Technological advances in electricity, metallurgy, and mechanics have led to the rapid development of EAFs over the past fifty years. The melting capacity of EAFs has increased due to several key improvements, including increased furnace transformer power [4], the development of cooling systems [5], refractory design to increase its longevity [6], the use of O2 burners to accelerate melting [4], and the ability to manage all systems with computer assistance [7,8]. In comparison to other metal melting technologies, EAFs have higher melting capabilities and lower operational costs. Currently, EAFs account for approximately 40% of global steel production, and this ratio is projected to reach approximately 50% by 2050 [9,10].
The thermal energy generated by the electric arc formed between the electrodes and the molten metal in EAFs is used to initiate the melting process. By employing this principle of operation, metals are melted, and electrical energy is transformed into thermal energy [11]. The heat generated by the electric arc exceeds 1500 °C when this method is implemented during the melting procedure. The electric arc is distinguished by its high current and low voltage during the melting process. The three primary operating processes are boring, melting, and refining [12].
The melting operation commences with the boring process. The electrodes are charged to initiate the melting process, and they are submerged in the metal reservoir. The electrodes exhibit a short arc length during the charging procedure [13]. The process proceeds to melt once the electrodes have been sufficiently charged. During the melting process, a broad region develops in the center of the molten material. The arc length undergoes a continuous fluctuation due to the dynamic structure of the liquefied metal.
The arc length of the electric arc is nearly constant, and the metal basin contains nearly all the metal in a molten state during the refining process. At this point, the arc reaches a steady structure. The molten metal remains in a liquid state during the transfer to the ladle furnace because of the heat generated by the arc in this procedure [14]. Figure 1 illustrates the apparent power variation derived through experimental methods from a 60 MVA EAF facility, which depicts the operation of the EAF in these three phases.
Despite the substantial benefits of EAFs, such as low production cost and high melting capacity, they also have numerous adverse effects on power systems due to the variation in arc length during the melting process. Rapid arc changes, particularly in the boring and melting processes, induce nonlinear load behavior in EAFs [15,16]. The primary cause of power quality issues, including harmonics, flicker, voltage sag and swell, and voltage imbalances, is this nonlinear behavior in the electrical circuits to which EAFs are connected [17,18,19,20,21,22].
Numerous researchers have explored the power quality issues caused by EAFs. In [23,24], a single-phase equivalent circuit model of the EAF was created, and the operational characteristics of the boring, melting, and refining processes were assessed, alongside an interpretation of their impact on power quality. The power quality issues caused by the EAF were analyzed according to IEC-61400-4-30 standards in [25]. In [26], the effect of harmonic filter groups used in EAFs on power quality was studied. Deaconu et al. examined the power quality of a 100-T EAF using experimental data in their study [27]. Research has also been conducted in [28,29] on the remote monitoring of power quality parameters of EAFs in Turkey and the recording of power quality.
Many researchers have also investigated the nonlinear characteristic behavior of the electric arc, which is responsible for power quality issues in EAFs. The nonlinear V–I characteristics of the EAF have been characterized by time-domain methods, as described by certain researchers [18,19,20,23]. Differential equations have also been proposed as a method for defining the mathematical expression of the electric arc [30,31]. Linearization methods are employed to convey the electric arc’s characteristics [32,33].
Beyond these studies, the literature has presented a variety of modeling techniques for defining the characteristics of EAF loads. These techniques include different time-domain approaches based on the current–voltage characteristic of the electric arc [15,34,35,36], research that examines the EAF’s characteristics stochastically [37,38], time-domain methods based on the Cassie–Mary differential equations [17,39,40,41], and a nonlinear resistance model and frequency domain model [42]. However, the mathematical expression of the relationship between the arc’s current and voltage characteristics in defining the nonlinear behavior is a common thread in all these studies.
The most effective approach to establishing the nonlinear relationship between arc current and voltage is to measure the arc current and voltage directly. A mathematical approach can be devised to define the nonlinear current–voltage characteristic of the arc with an adequate amount of measurement data.
In this study, unlike previous studies, a stochastic mathematical approach is presented to characterize the EAF during the melting process. The proposed model establishes the V–I characteristics of the arc using the modified Heidler function and double S-curves. The arc current and voltage fluctuations that occurred during the melting process of the 60 MVA EAF have been recorded in real time to establish the mathematical model. The V–I characteristic of the EAF’s melting process is formulated using third- and eighth-degree polynomial equations, derived through the curve-fitting method. However, due to the difficulty of solving high-degree polynomial expressions, rapid variations in the arc current and voltage characteristics are not adequately described. Therefore, an approximate mathematical model is necessary to effectively represent these variations.
To refine the proposed model, the equation parameters of the double S-curves and the modified Heidler function have been determined using the polynomial equations obtained through curve fitting as a reference. These parameters were optimized using the grey wolf optimization (GWO) algorithm to achieve the best fit for the polynomial curves.
The structure of this study consists of five sections. The second section presents the electrical circuit of the 60 MVA EAF, along with its single-phase equivalent model and time-domain methods for the V–I characteristics commonly employed in the literature, such as the exponential, hyperbolic, exponential–hyperbolic, and nonlinear resistance models. The third section explains the stochastic mathematical approach of the proposed V–I characteristic model, and the implementation of the GWO algorithm. The fourth section evaluates the static and dynamic properties of various arc models, assessing their harmonic performance and comparing them with real-time measurements. The fifth section summarizes the key findings and emphasizes the practical applications of the proposed methodology.

2. Material and Methods

This section describes the methodology used to develop the electrical circuit configuration of the 60 MVA EAF, along with its single-phase equivalent model and experimental measurement. Additionally, it presents commonly used time-domain methods for defining V–I characteristics.

2.1. Electrical Circuit of Arc Furnaces

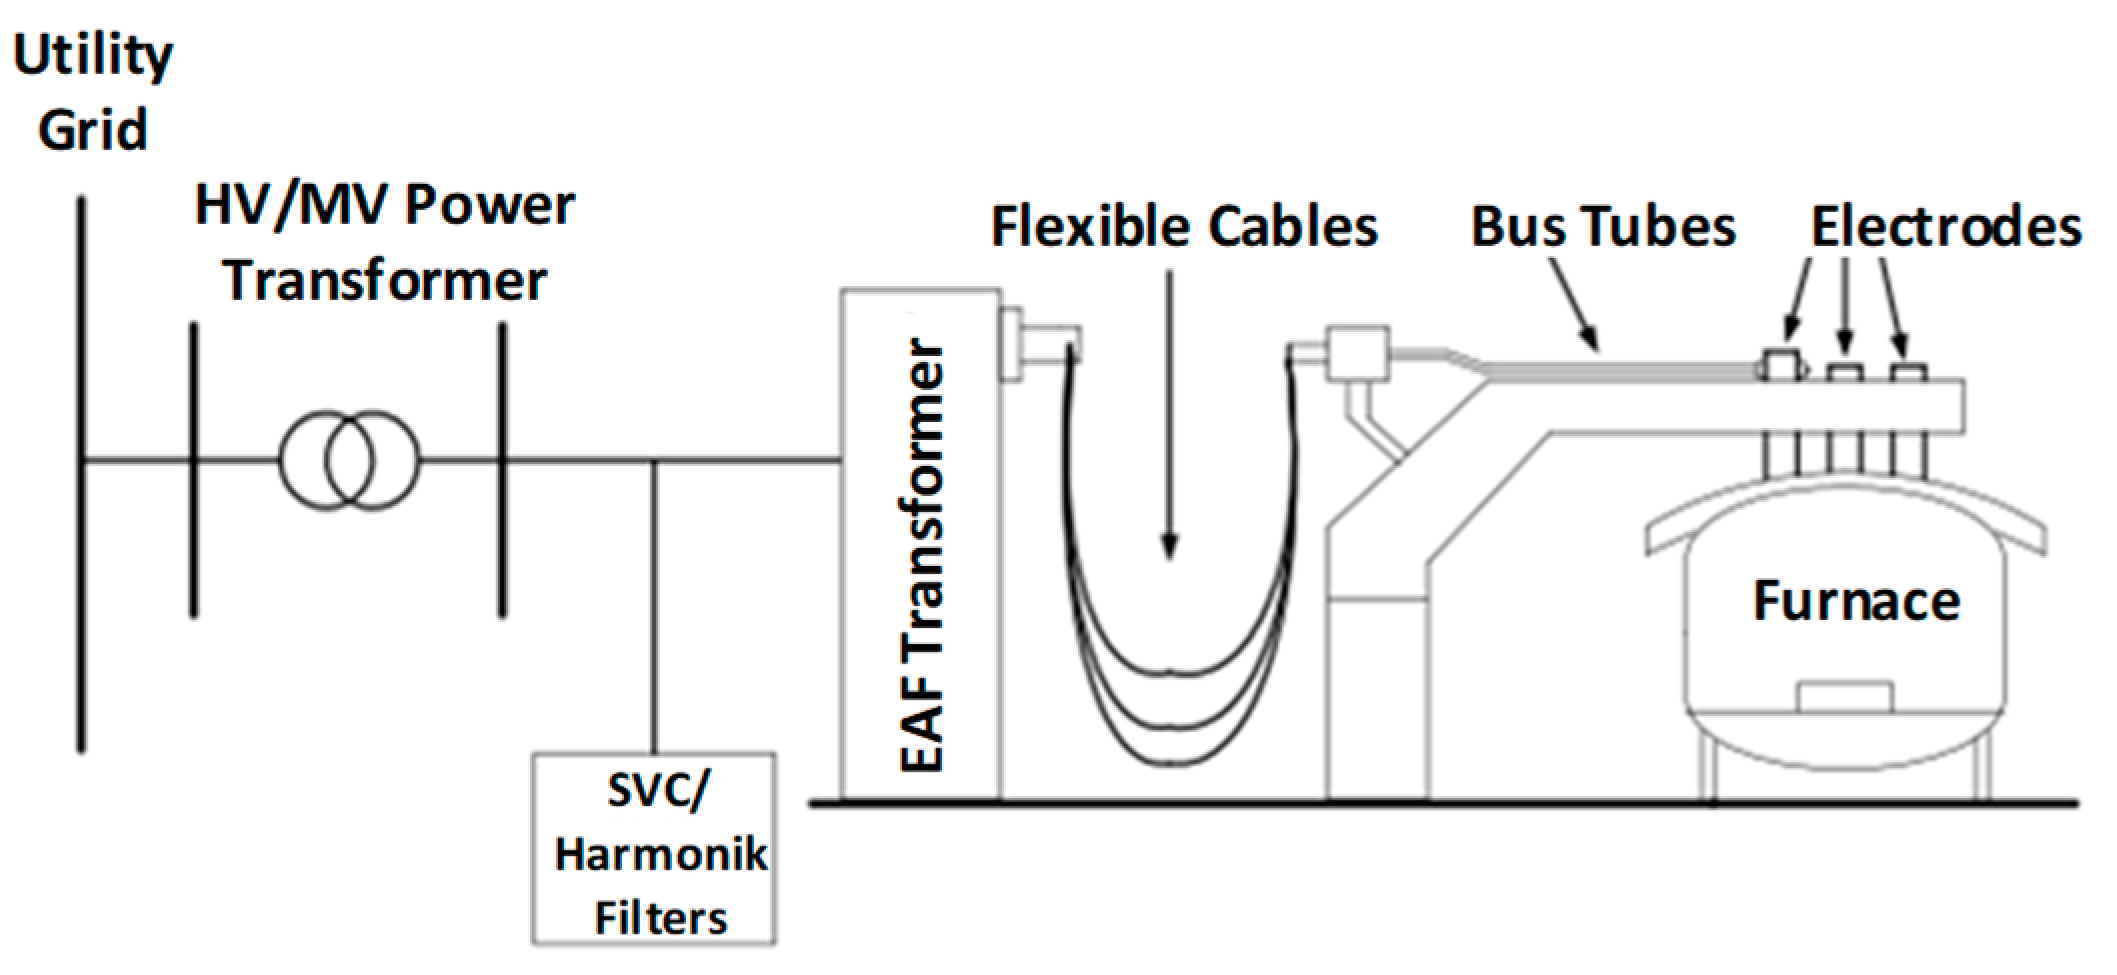
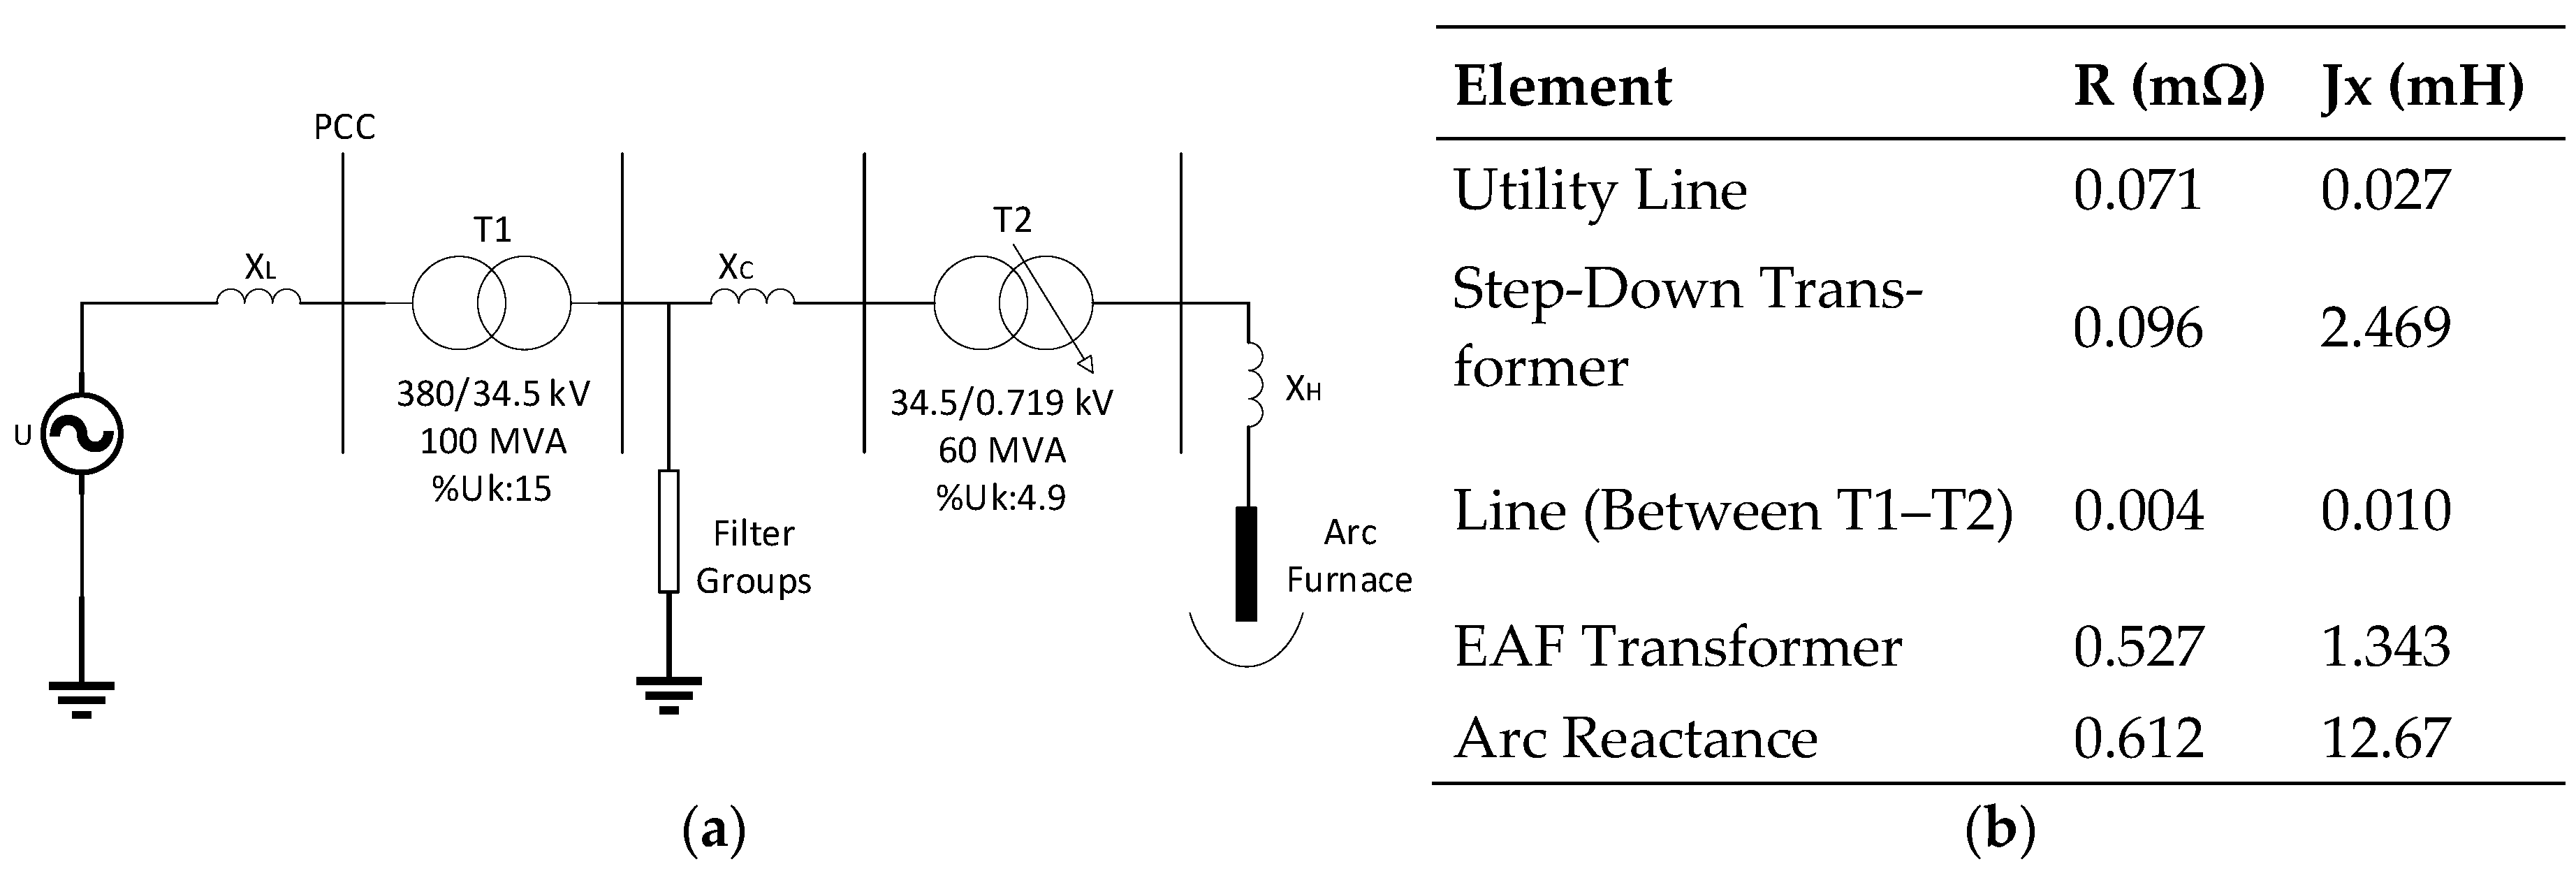
In this study, the electrical circuit components of the system feeding the EAF-60 furnace at the Sivas Iron and Steel facility, where experimental measurements were conducted, are presented in Figure 2. The electrical system includes 100 Hz 15.5 MVar C Type, 150 Hz 10 MVar C Type, and 200 Hz 4.7 MVar single-tuned filter groups [42,43]. A static VAR compensator (SVC) system is used for compensation. The single-phase equivalent model of the system shown in Figure 2 is presented in Figure 3.
Using the calculation methods presented in [44,45,46,47,48], the single-phase equivalent circuit parameters of the system can be calculated. For a reference voltage of 719 V, the calculated equivalent circuit parameters of the electrical system feeding the EAF-60 are specified in Figure 3b.

2.2. Experimental Measurement of Electrical Arc

The arc current and voltage fluctuations during the EAF-60 melting process were documented following the IEC-61000-4-30 standard [49], utilizing a sampling frequency of 1024 Hz [42,44]. Throughout all measurements, the EAF transformer operated at the 12th tap, while the (SVC) compensation and harmonic filter groups remained active in the system.
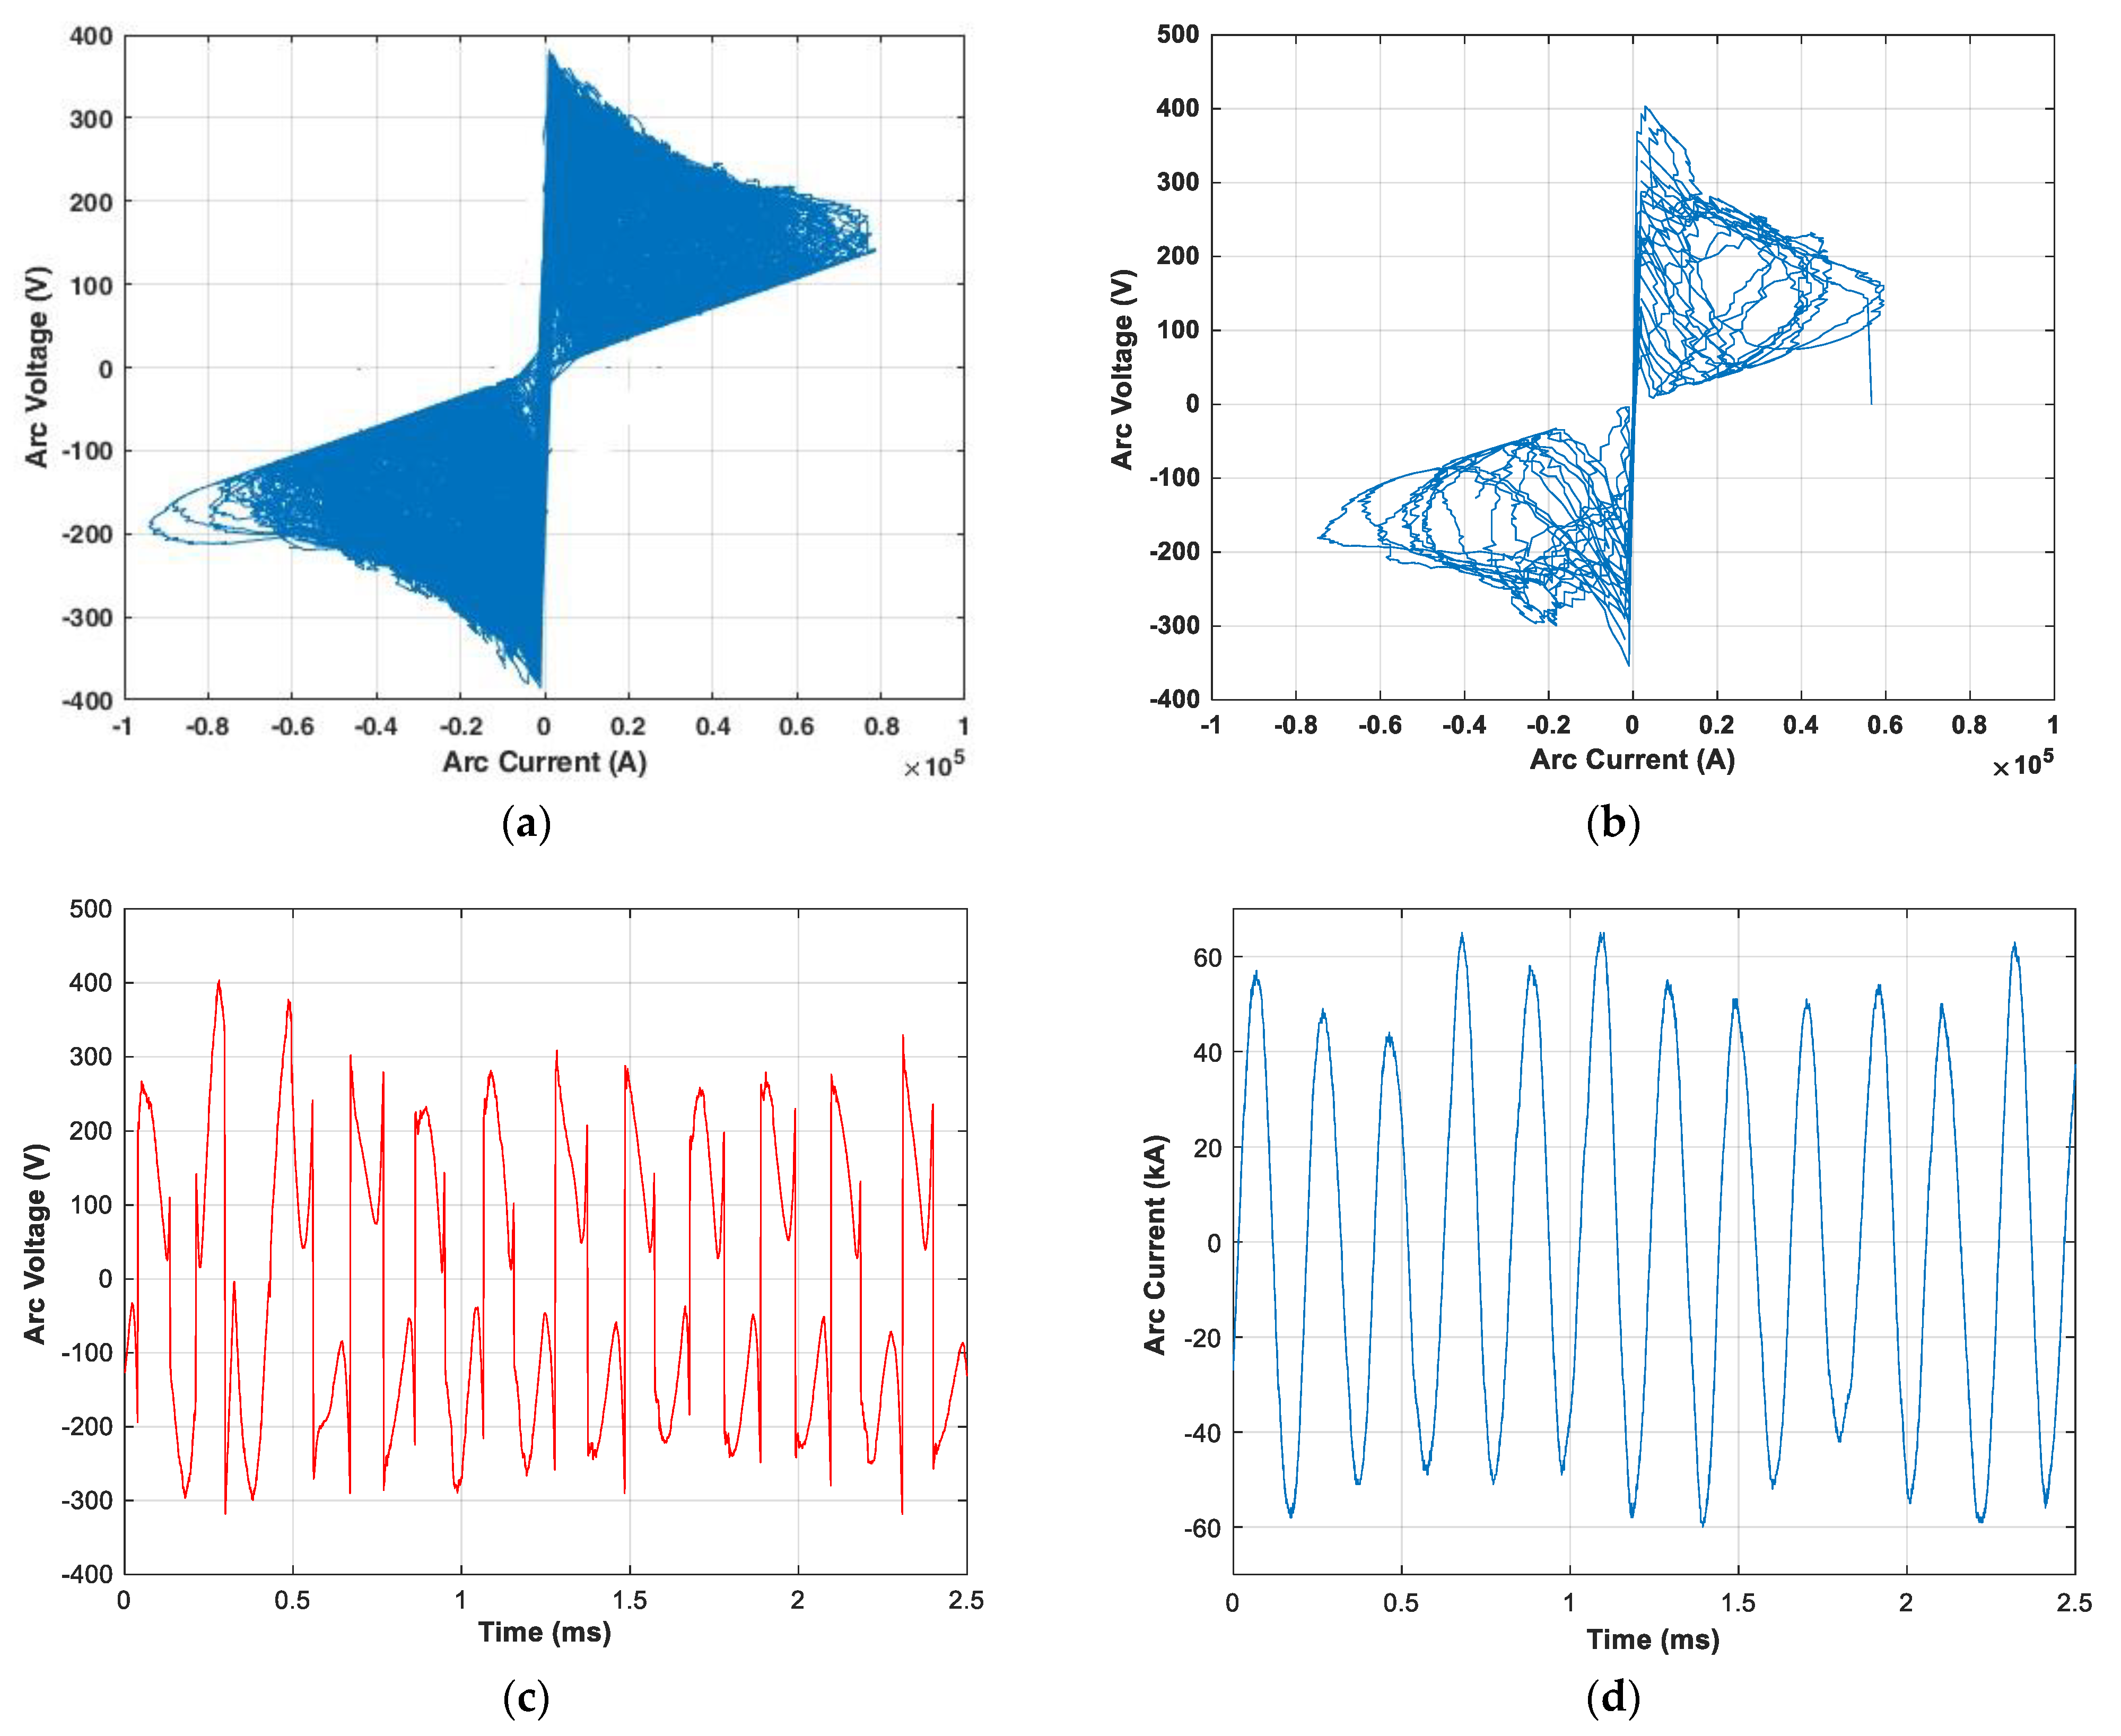
Figure 4a illustrates the variation in the V–I characteristic of the electric arc over 2400 cycles, derived from experimental results. Figure 4b illustrates the V–I characteristic changes over 12 cycles for enhanced visualization of the arc’s V–I behavior. Additionally, the current and voltage waveforms over 12 cycles of the arc are shown in Figure 4c and Figure 4d, respectively.

2.3. Time-Domain Methods for V–I Characteristics of EAF Arcs

Various time-domain models have been developed for EAFs to characterize the nonlinear properties of the electric arc. This study evaluates the performance of the proposed model by defining the V–I characteristic of the electric arc through time-domain methods commonly found in the literature. Specifically, the exponential model, the hyperbolic model, the exponential–hyperbolic model, and the nonlinear resistance model are analyzed to assess their effectiveness in capturing arc behavior.

2.3.1. Exponential Model (Model 1)

The correlation between the current and the voltage of the electric arc is represented as an exponential function in Equation (1) [15]:
V i = V a t · 1 e i i 0 · s i g n ( i )
In Equation (1), V is the arc voltage, V a t is the threshold voltage dependent on the arc length, i is the arc current, and i 0 is a steepness factor that controls the rate of voltage decay. The s i g n ( i ) represents the signum function. This model suggests that, as the arc current increases, the voltage decreases exponentially, meaning the arc resistance diminishes with the rising current.

2.3.2. Hyperbolic Model (Model 2)

In the hyperbolic model, the correlation between the current and voltage of the electrical arc is articulated in Equation (2) [9,15]:
V i = V a t + C i , d D i , d + i · s i g n i
In Equation (2), V is the arc voltage, V a t is the threshold voltage dependent on the arc length, i is the arc current, and C i , d and D i , d are constants that define the shape of the voltage–current curve. In this model, the arc voltage decreases as the current increases, but instead of following an exponential decay, the decline is governed by a hyperbolic function. The denominator ensures that voltage remains finite and does not drop too sharply for small currents.

2.3.3. Exponential–Hyperbolic Model (Model 3)

The exponential–hyperbolic model is characterized by a synthesis of exponential and hyperbolic models. This model represents the V–I characteristic structure of the electric arc as a hyperbolic function during the current increase, and as an exponential function during the current drop. This approach is mathematically expressed by Equation (3) [9,15]:
V i = V a t + C i , d D i , d + i · s i g n i ,       d i d t 0   and   i > 0 V a t . 1 e i i 0 · s i g n i ,   d i d t < 0   and   i < 0
In Equation (3), V is the arc voltage, V a t is the threshold voltage dependent on the arc length, i is the arc current, i 0 is a steepness factor that controls the rate of voltage decay, and C i , d and D i , d are constants that define the shape of the voltage–current curve. The mathematical representation of the Vat, contingent upon the arc length, is delineated by Equation (4) [48]:
V a t = A + B · l
In Equation (4), A is a constant value determined by the anode and cathode voltage dips, approximately 40 V, B is the voltage value contingent upon the arc length, empirically established as B = 10 V for each centimeter of arc length, and l denotes the arc length.

2.3.4. Nonlinear Resistance Model (Model 4)

The V–I characteristic of the electric arc in EAFs can be represented using a nonlinear resistance model [42]. This method articulates the mathematical correlation between the current and the voltage of the electric arc as delineated in Equation (5):
i = i 0 · V V a t α
In Equation (5), V and i represent the arc voltage and arc current, respectively, i 0 represents the reference current utilized to establish the maximum arc voltage, and α is a constant that characterizes the nonlinear behavior of the arc resistance. To obtain the required current level in Equation (5), this function must be utilized alongside the transfer function as 1 0.2 e 2 s + 2 This transfer function has been established for a 60 MVA arc furnace based on experimental results [42]. This function should be empirically redefined for arc furnaces of varying dimensions.

3. Proposed V–I Characteristic Model of Electrical Arc

This section presents a detailed explanation of the novel mathematical approach developed to characterize the electric arc during the melting process in EAFs. The proposed mathematical model is formulated using the modified Heidler function and double S-curves. The V–I characteristic of the electrical arc can be represented through polynomial expressions, obtained by applying the curve-fitting approach to the experimentally measured current and voltage values of the arc. Subsequently, using the polynomial curves as a benchmark, the mathematical parameters of the S-curves and the modified Heidler function have been determined via the grey wolf optimization (GWO) algorithm to achieve the best fit.

3.1. Curve-Fitting Method for Defining Polynomial V–I Characteristics of Electric Arc

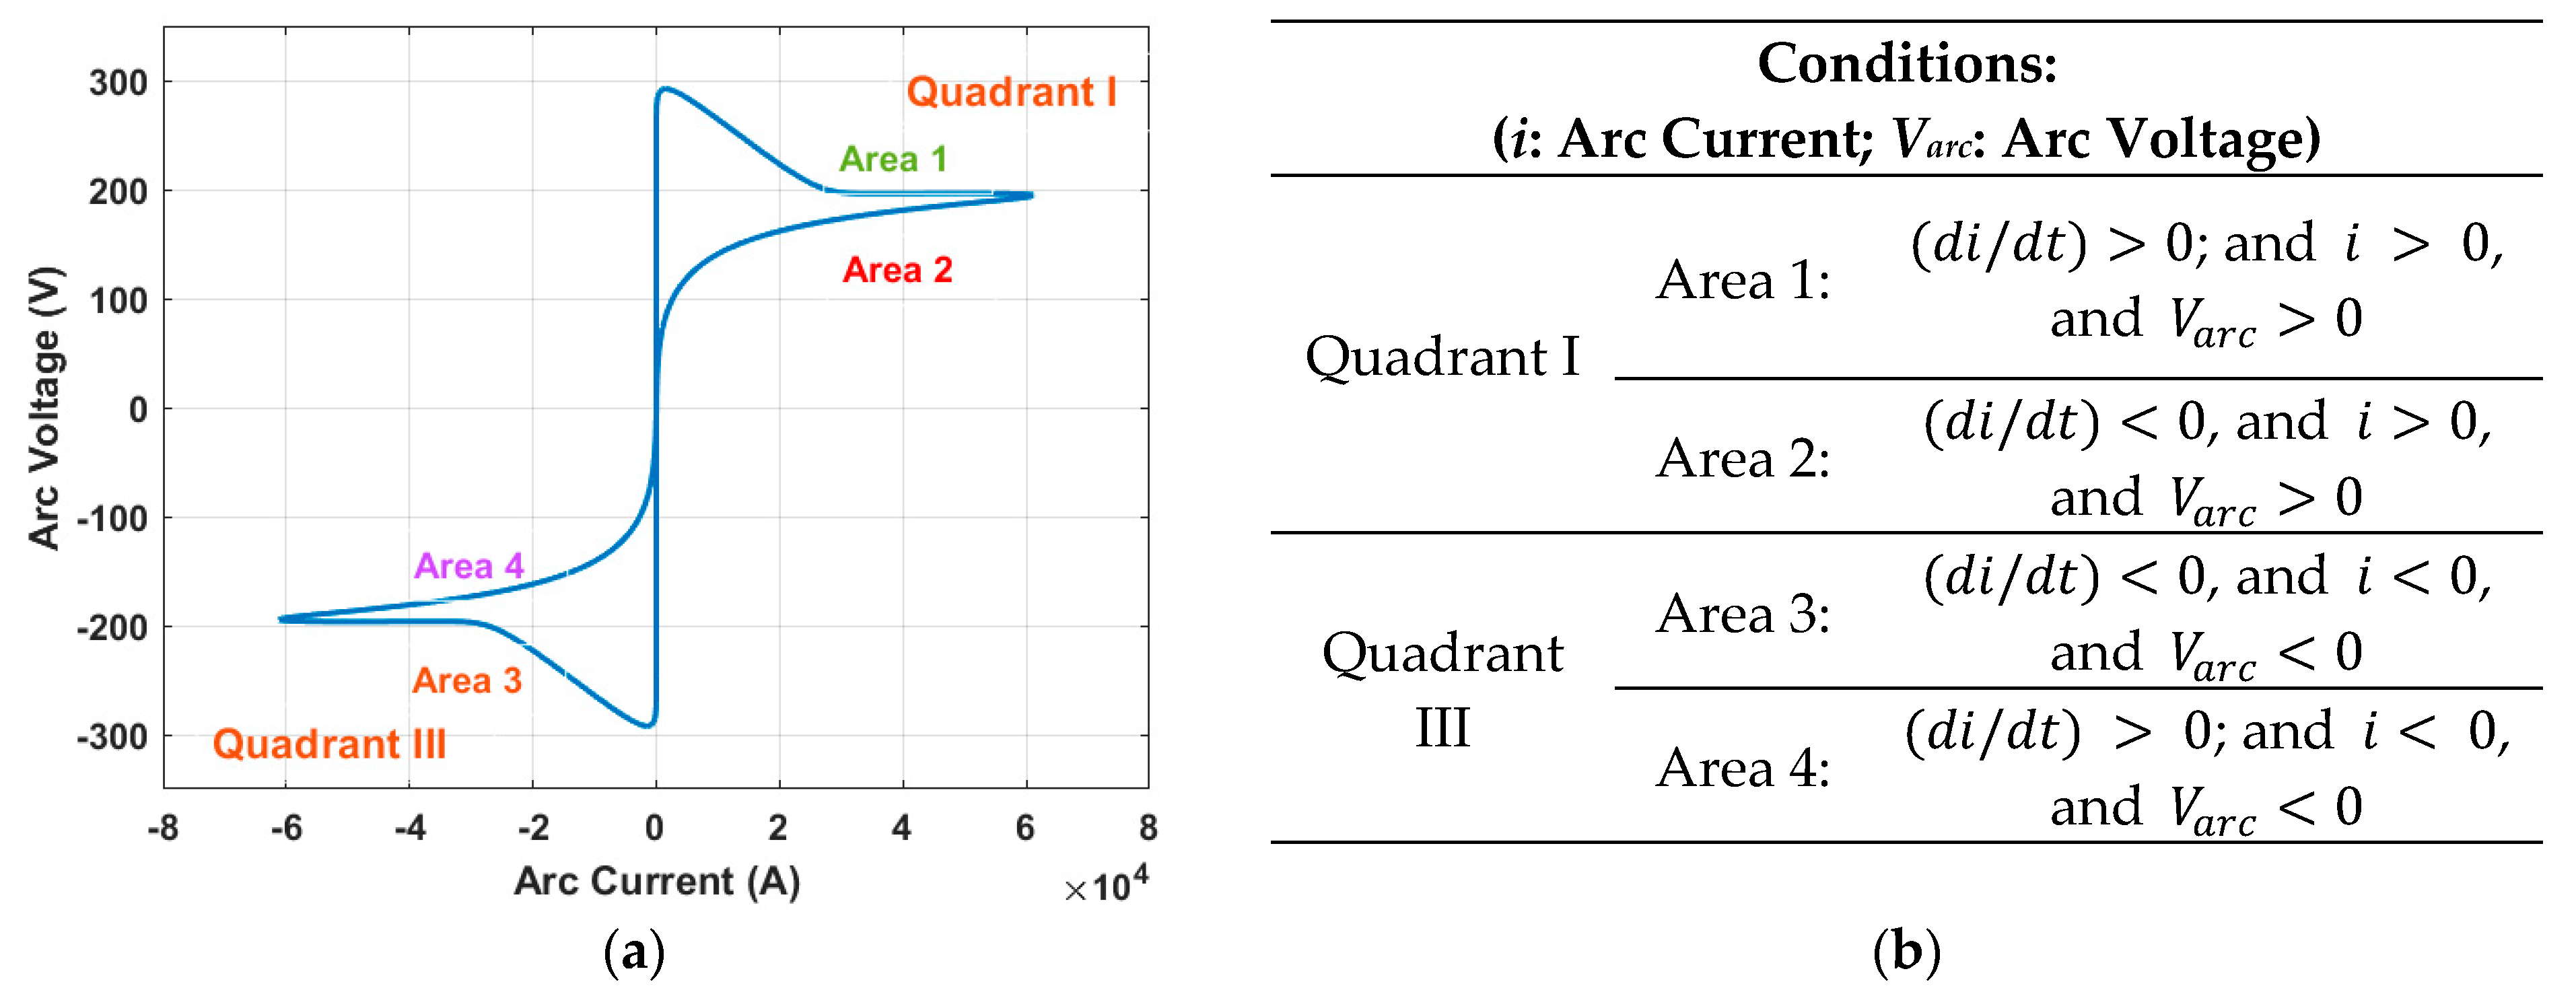
The V–I characteristic of the electric arc in arc furnaces has been empirically categorized into four distinct zones. The constraints used to define these zones are presented in Figure 5a,b.
Considering the positive and negative phases of the arc current, Area 1 and Area 2 exhibit symmetry relative to Area 3 and Area 4. Polynomial expressions are formulated utilizing the curve-fitting method for the positive region of the characteristic, as shown in Figure 5 (for Area 1 and Area 2).
  • For the case where ( d i / d t ) > 0 , i > 0 , and V a > 0 , the V–I characteristic is represented by an eighth-degree polynomial expression, as formulated in Equation (6):
    V ( i ) = p 1 . i 8 + p 2 . i 7 + p 3 . i 6 + p 4 . i 5   + p 5 . i 4 + p 6 . i 3 + p 7 . i 2 + p 8 . i + p 9
  • For the case where ( d i / d t ) < 0 , i > 0 , and V a > 0 , the V–I characteristic is represented by a third-degree expression, as formulated in Equation (7):
    V ( i ) = p 1 . i 3 + p 2 . i 2 + p 3 . i + p 4
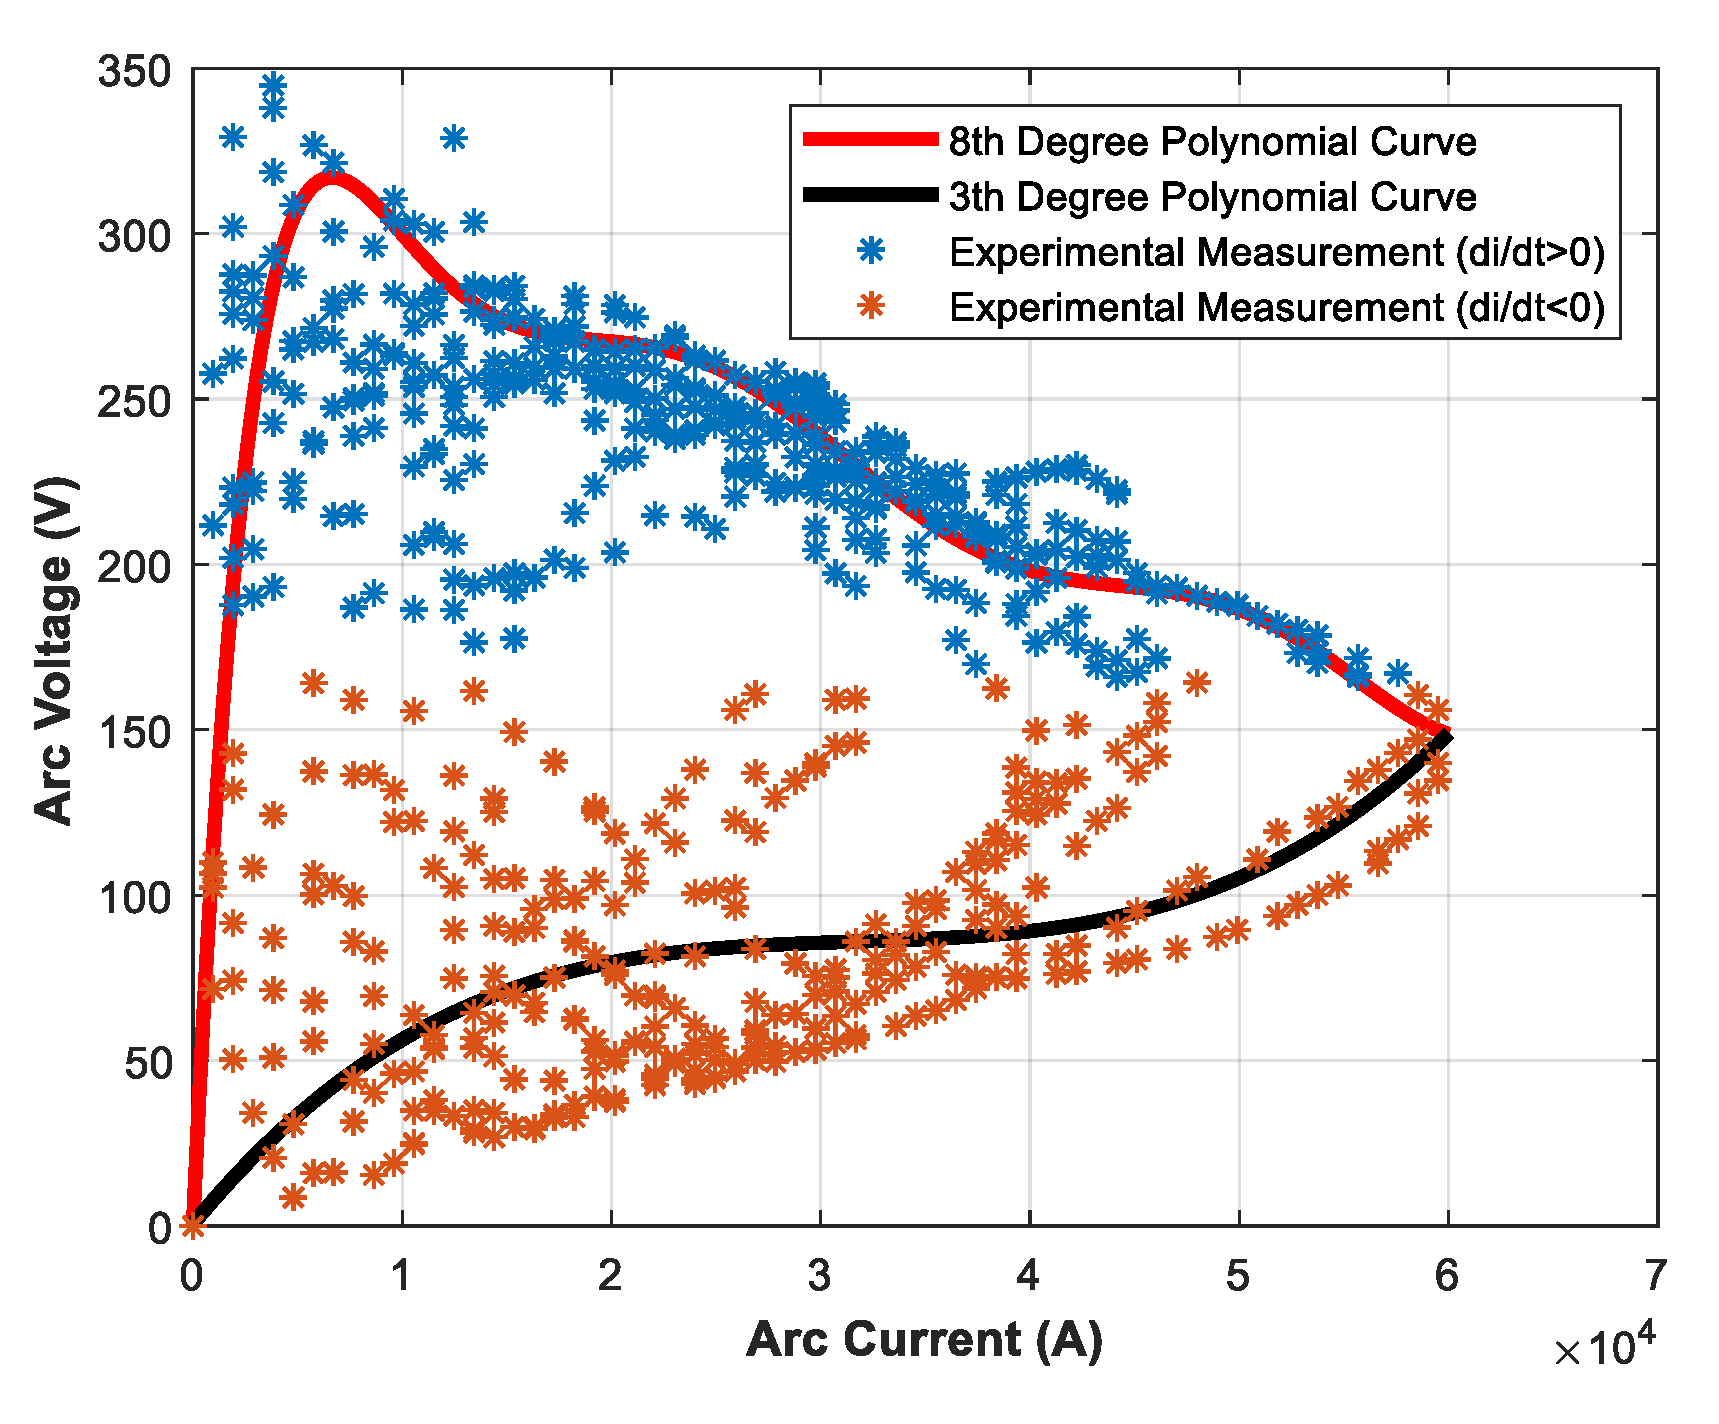
Based on these assumptions, the polynomial V–I characteristic of the arc is illustrated in Figure 6. The calculated polynomial coefficients derived from curve fitting and are presented below:
  • The eighth-degree polynomial expression coefficients (with 95% confidence bounds) are calculated as follows: p 1 = 8.248 · e 34 , p 2 = 2.4973 · e 28 , p 3 = 3.127 · e 23 , p 4 = 2.095 · e 18 , p 5 = 8.1052 · e 14 , p 6 = 1.824 · e 9 , p 7 = 2.285 · e 5 , p 8 = 0.1391 , and p 9 = 1.1695 .
  • third-degree expression coefficients (with 95% confidence bounds) are calculated as follows: p 1 = 2.631 · e 12 , p 2 = 2.3453 · e 7 , p 3 = 0.0081 , and p 4 = 0.5906 .

3.2. Grey Wolf Optimization (GWO) Algorithm

Optimization methods are widely used to estimate the parameters of mathematical functions. In this study, the GWO algorithm makes use of estimating the coefficient parameters of the S-curves and modified Heidler functions used to describe the proposed model. The GWO algorithm requires fewer hyperparameters compared to commonly used population-based algorithms, such as particle swarm optimization (PSO) and the genetic algorithm (GA). In the PSO algorithm, several parameters, such as inertia weight and velocity update coefficients, require careful tuning, while in the GA, crossover and mutation rates must be precisely selected. The GWO algorithm, on the other hand, has fewer parameters, reducing the need for manual adjustments and simplifying the optimization process. This characteristic enhances its ease of implementation, making the GWO algorithm a more practical and stable optimization method. This increases the applicability of the algorithm and reduces the complex adjustments made by the user. In addition, the GWO algorithm provides a more balanced exploration and exploitation mechanism in the optimization process, has a stronger local minimum escaping ability than the PSO and GA algorithms, and provides a faster and more stable convergence.
The grey wolf optimization (GWO) algorithm is an optimization method inspired by the social hierarchy and hunting strategies of grey wolf packs. Grey wolves hunt in packs, exhibiting a well-defined hierarchical structure, as illustrated in Figure 7. In this structure, α is at the top representing the best solution in the mathematical formulation of the GWO algorithm. The β wolves follow α , while δ and ω follow β , maintaining the structured order of the pack [45].
During the hunt, grey wolves primarily surround their prey. The encirclement behavior is mathematically represented depending on the positions of the prey and the wolves, as expressed in Equations (8) and (9) [50,51,52]:
D = C · X p t X t
X t + 1 = X p t A   ·   D
For Equations (8) and (9), t , represents the current iteration value, A   and C represent the coefficient vectors, X p represents the position vector of the prey, and X represents the position vector of the gray wolf. The vectors A and C presented in Equations (8) and (9) are further defined in Equations (10) and (11):
A = 2 a · r 1 a
C = 2 r 2
In Equations (10) and (11), the value of a is defined to decrease linearly from 2 to 0 depending on the number of iterations, while the parameters r 1   a n d   r 2 are random values assigned between 0 and 1.
During the hunting process, α primarily leads the hunt, and sometimes β and δ also join the hunt. In the end, the wolf closest to the hunt, in terms of position, is α , and it provides the best solution. In the absence of α , the best solution would be β or δ . When the hunting process is over, the wolves stop moving and their positions are finalized [51,52]. The position vectors for α , β , or δ are given in Equations (12a)–(12g):
D α = C 1 · X α X
D β = C 2 · X β X
D δ = C 3 . X δ X
X 1 = X α A 1 . D α
X 2 = X β A 2 . D β
X 3 = X δ A 3 . D δ
X ( t + 1 ) = X 1 + X 2 + X 3 3
The pseudo-code of the GWO algorithm is given in Algorithm 1.
Algorithm 1. Pseudo Code of the GWO Algorithm
Initialize grey wolf population:
     Xi = [C1_i, C2_i, I1_i, I2_i, I3_i, I4_i, η_i, n_i] for i = 1 to n
     // C1, C2: Heidler function coefficients
     // I1–I4: current threshold points for Double S-curve
     // η, n: slope and shape parameters
Set control parameters:
     a = 2
     A and C will be computed during updates
For each search agent Xi:
     Compute estimated voltage V_est using:
          - Modified Heidler Function (for rising arc regions)
          - Double S-curves (for falling arc regions)
     Calculate objective functions:
          f1 = RMSE(V_measured, V_test)
          f2 = MAE(V_measured, V_test)
Identify non-dominated solutions and initialize the archive with them // Leader selection
Xα = SelectLeader(archive)
Temporarily remove Xα from the archive
Xβ = SelectLeader(archive)
Temporarily remove Xβ from the archive
Xδ = SelectLeader(archive)
Add Xα and Xβ back to the archive // Optimization Loop
t = 1
while t < MaxIter:
     for each search agent Xi:
          Compute vectors A and C:
               A = 2 * a * rand() – a
               C = 2 * rand()
          Update Xi position using Equations (12a)–(12g)
          Enforce physical bounds on Xi parameters (e.g., C1 > 0, I1 < I2, etc.)
     Update control parameter a:
          a = 2 – (2 * t/MaxIter)
     For each updated Xi:
          Recalculate V_est from new parameters
          Recalculate f1 and f2
     Identify non-dominated solutions
     Update the archive with new non-dominated solutions
     If archive is full:
          Apply grid mechanism to remove one archive member
          Add the new solution to the archive
     If any new solution lies outside current hypercubes:
          Update the grid structure to include the new solution(s) // Update leaders
     Xα = SelectLeader(archive)
     Temporarily remove Xα
     Xβ = SelectLeader(archive)
     Temporarily remove Xβ
     Xδ = SelectLeader(archive)
     Add back Xα and Xβ to the archive
     t = t + 1
// Return result
Return final parameter sets for EAF V–I modeling

3.3. Proposed Model

The proposed model utilizes a mathematical framework to delineate the V–I characteristic of the electric arc, incorporating double S-curves and the modified Heidler function. The polynomial equations established by the curve-fitting procedure, discussed in the previous section, serve as a reference for calculating the mathematical parameters of the model. The characteristic curve, as illustrated in Figure 6 is segmented into three distinct regions to construct the proposed model. The first region, defined by the conditions d i / d t > 0 ,   i > 0 , and V a r c > 0 , is modeled using the modified Heidler function, whereas the reduction in current is represented by double S-curves. The parameters of the equations that yield the optimal fit for the polynomial expressions of the proposed model were identified using the GWO technique.

3.3.1. Region 1 and Region 4: Rising Current Phase ( d i / d t > 0 )

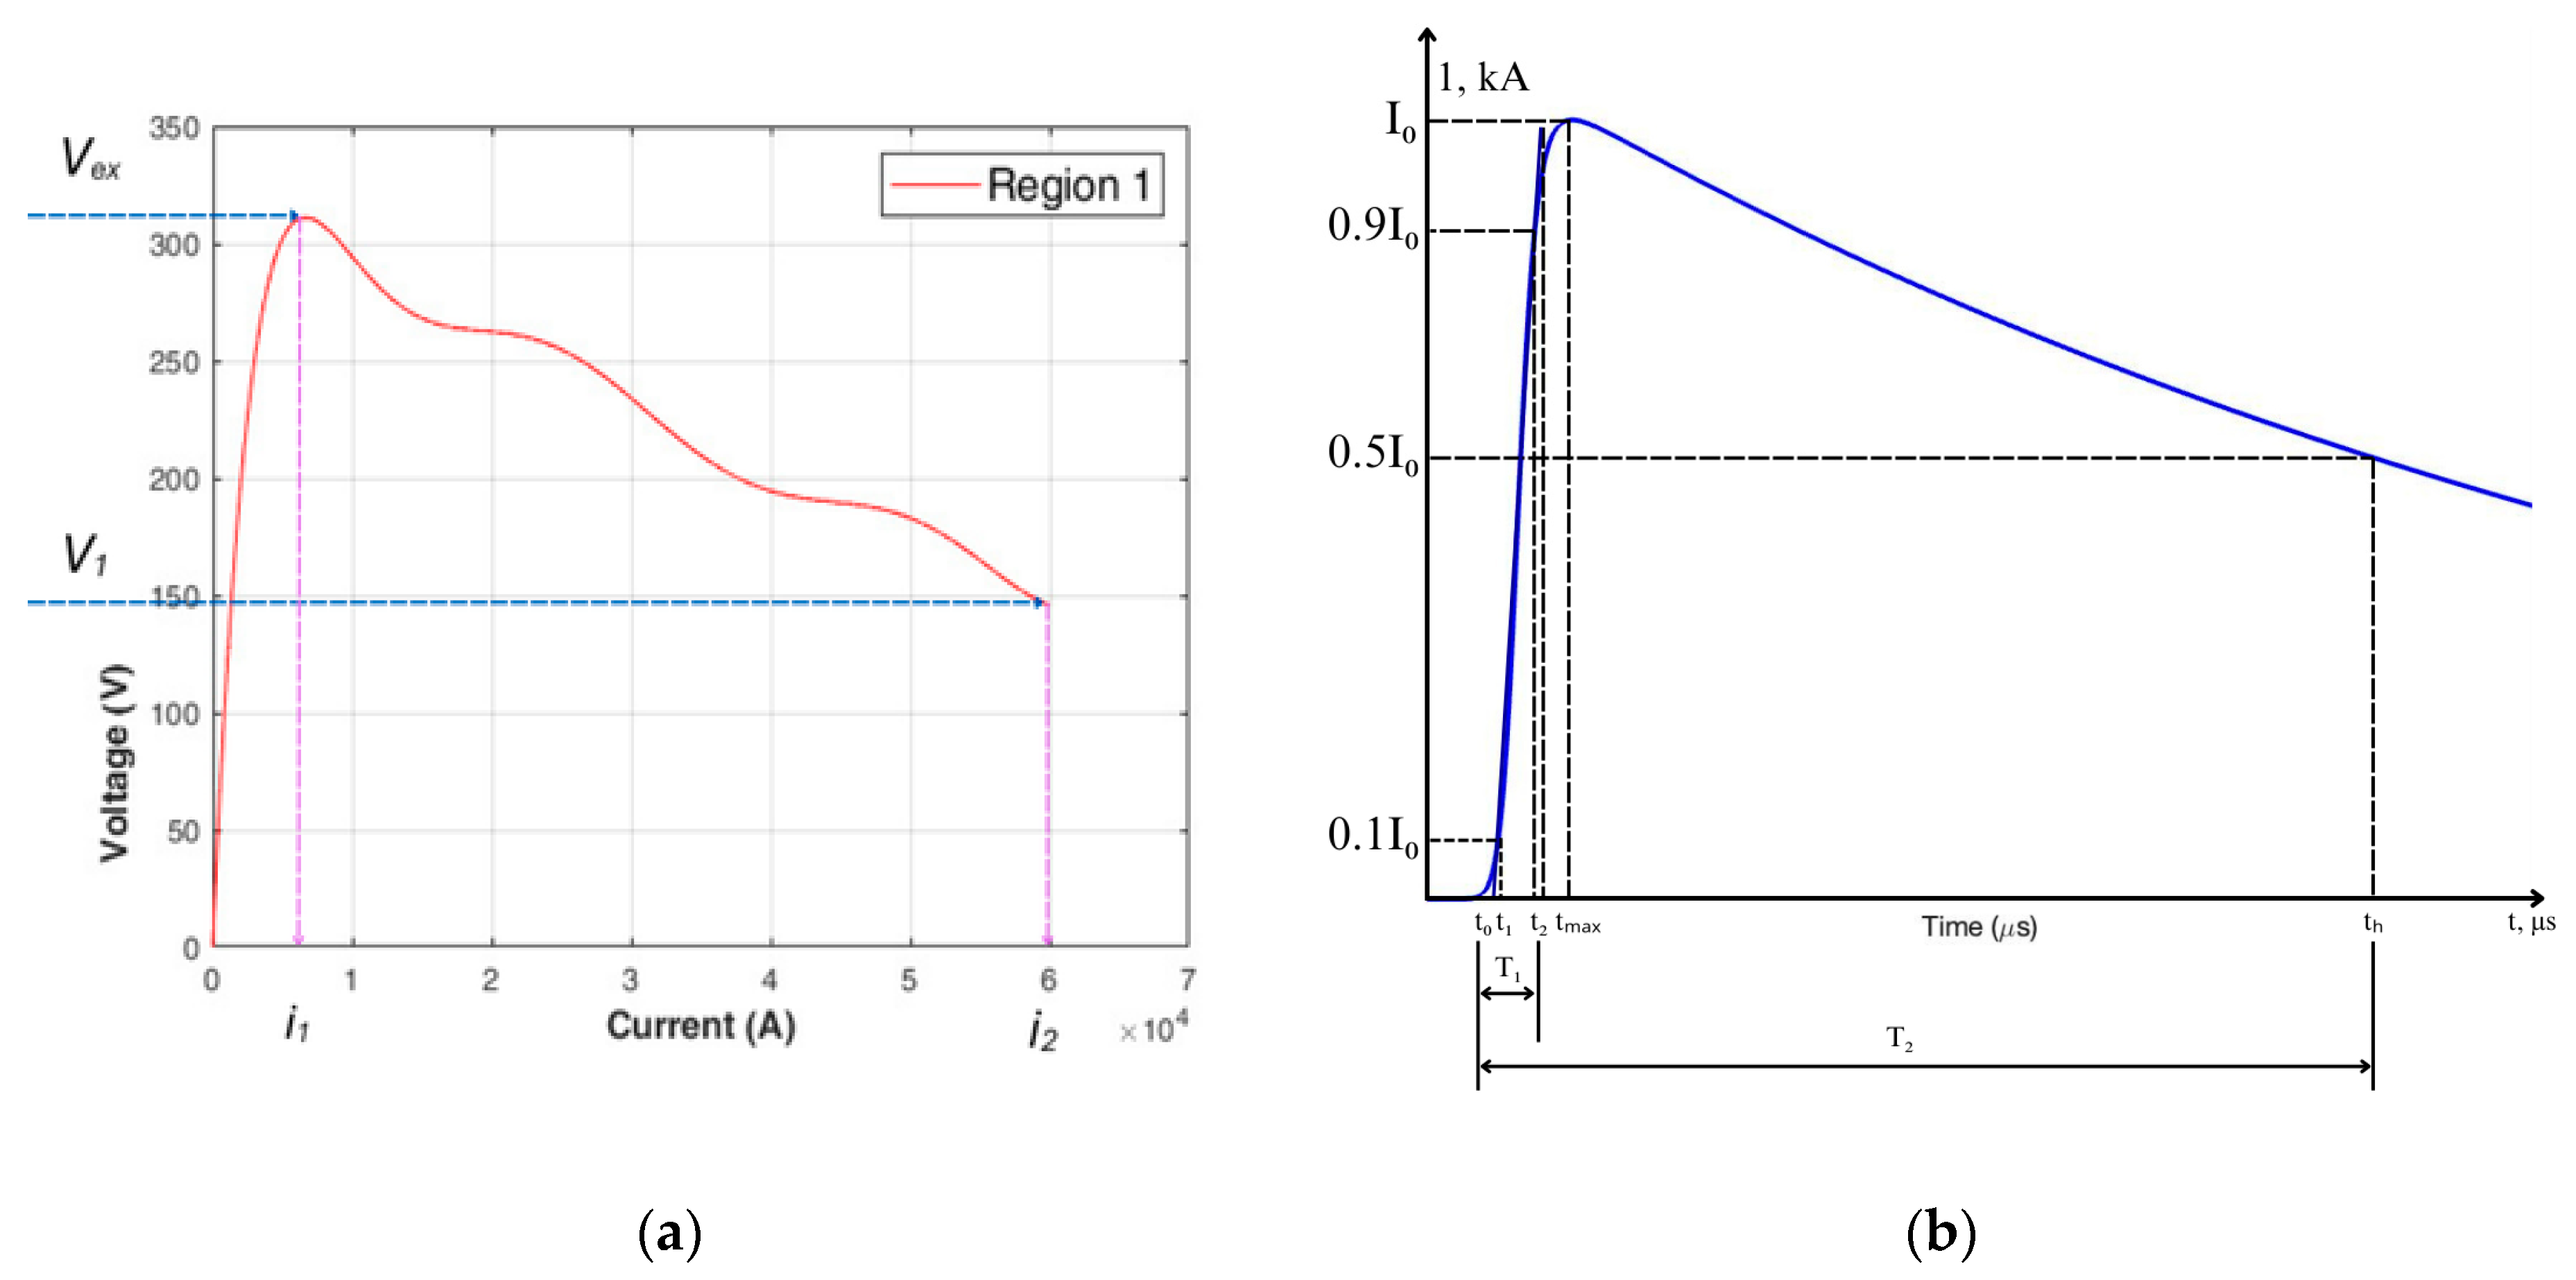
Figure 8a illustrates the eighth-degree polynomial equation derived from the curve-fitting method to represent the V–I characteristic of the electric arc. Figure 8b illustrates the Heidler function employed to model lightning strikes in the investigation of lightning-induced overvoltages. The Heidler function describes the temporal variation of current, making it a suitable approach for modeling arc behavior.
To establish the mathematical relationship between current and voltage in the arc, the polynomial expression in Figure 8a is reformulated by substituting current and voltage parameters in place of time and current in the Heidler function.
The Heidler function is further adjusted, as given in Equation (13), to represent the current as a function of time as follows [53]:
i t = i 0 η . ( t T 1 ) n t T 2 n + 1 . e t T 2
In Equation (14), the parameter η is a scaling factor and is defined as follows:
η = e T 1 T 2 . ( n T 2 / T 1 ) 1 n  
In these equations, i 0 represents the peak current value, T 1 represents the time constant associated with the current’s rise time, and T 2 represents the time constant related to the current’s decay time. The parameter n is the gradient coefficient that determines the steepness of the current variation.
In Equation (13), when the current variable is replaced with voltage and the time variable is designated as current, the arc voltage can be expressed as a current-dependent voltage function, as defined in Equation (15):
V a r c i = α . V e x η . ( i i 1 ) n i 2 i n + 1 . e i i 1 . s i g n ( i )
The negative alternans of arc current and voltage is defined by multiplying Equation (15) by the sign function [52]. In Equation (15), i 0 and i 1 are the current threshold value and the peak value of the current, respectively. The function parameters in Equation (15) can be efficiently determined using the GWO algorithm when the eighth-degree polynomial curve is serving as a reference.
The values derived from experimental measurements were used to apply the constraints defined for the GWO algorithm.
  • 0 < V < V m a x (the min and max values of the arc voltage obtained in the experimental results)
  • 0 < i < 80,000   (the min and max values of the arc current obtained in the experimental results)
In Equation (15), applying the GWO algorithm, as detailed in the pseudo code in Algorithm 1, yields the equation parameters for the optimal polynomial curve solution as follows: V e x = 314 V, α = 1.505, n = 1012, i 1 = 220 kA, and i 2 = 1850 A.
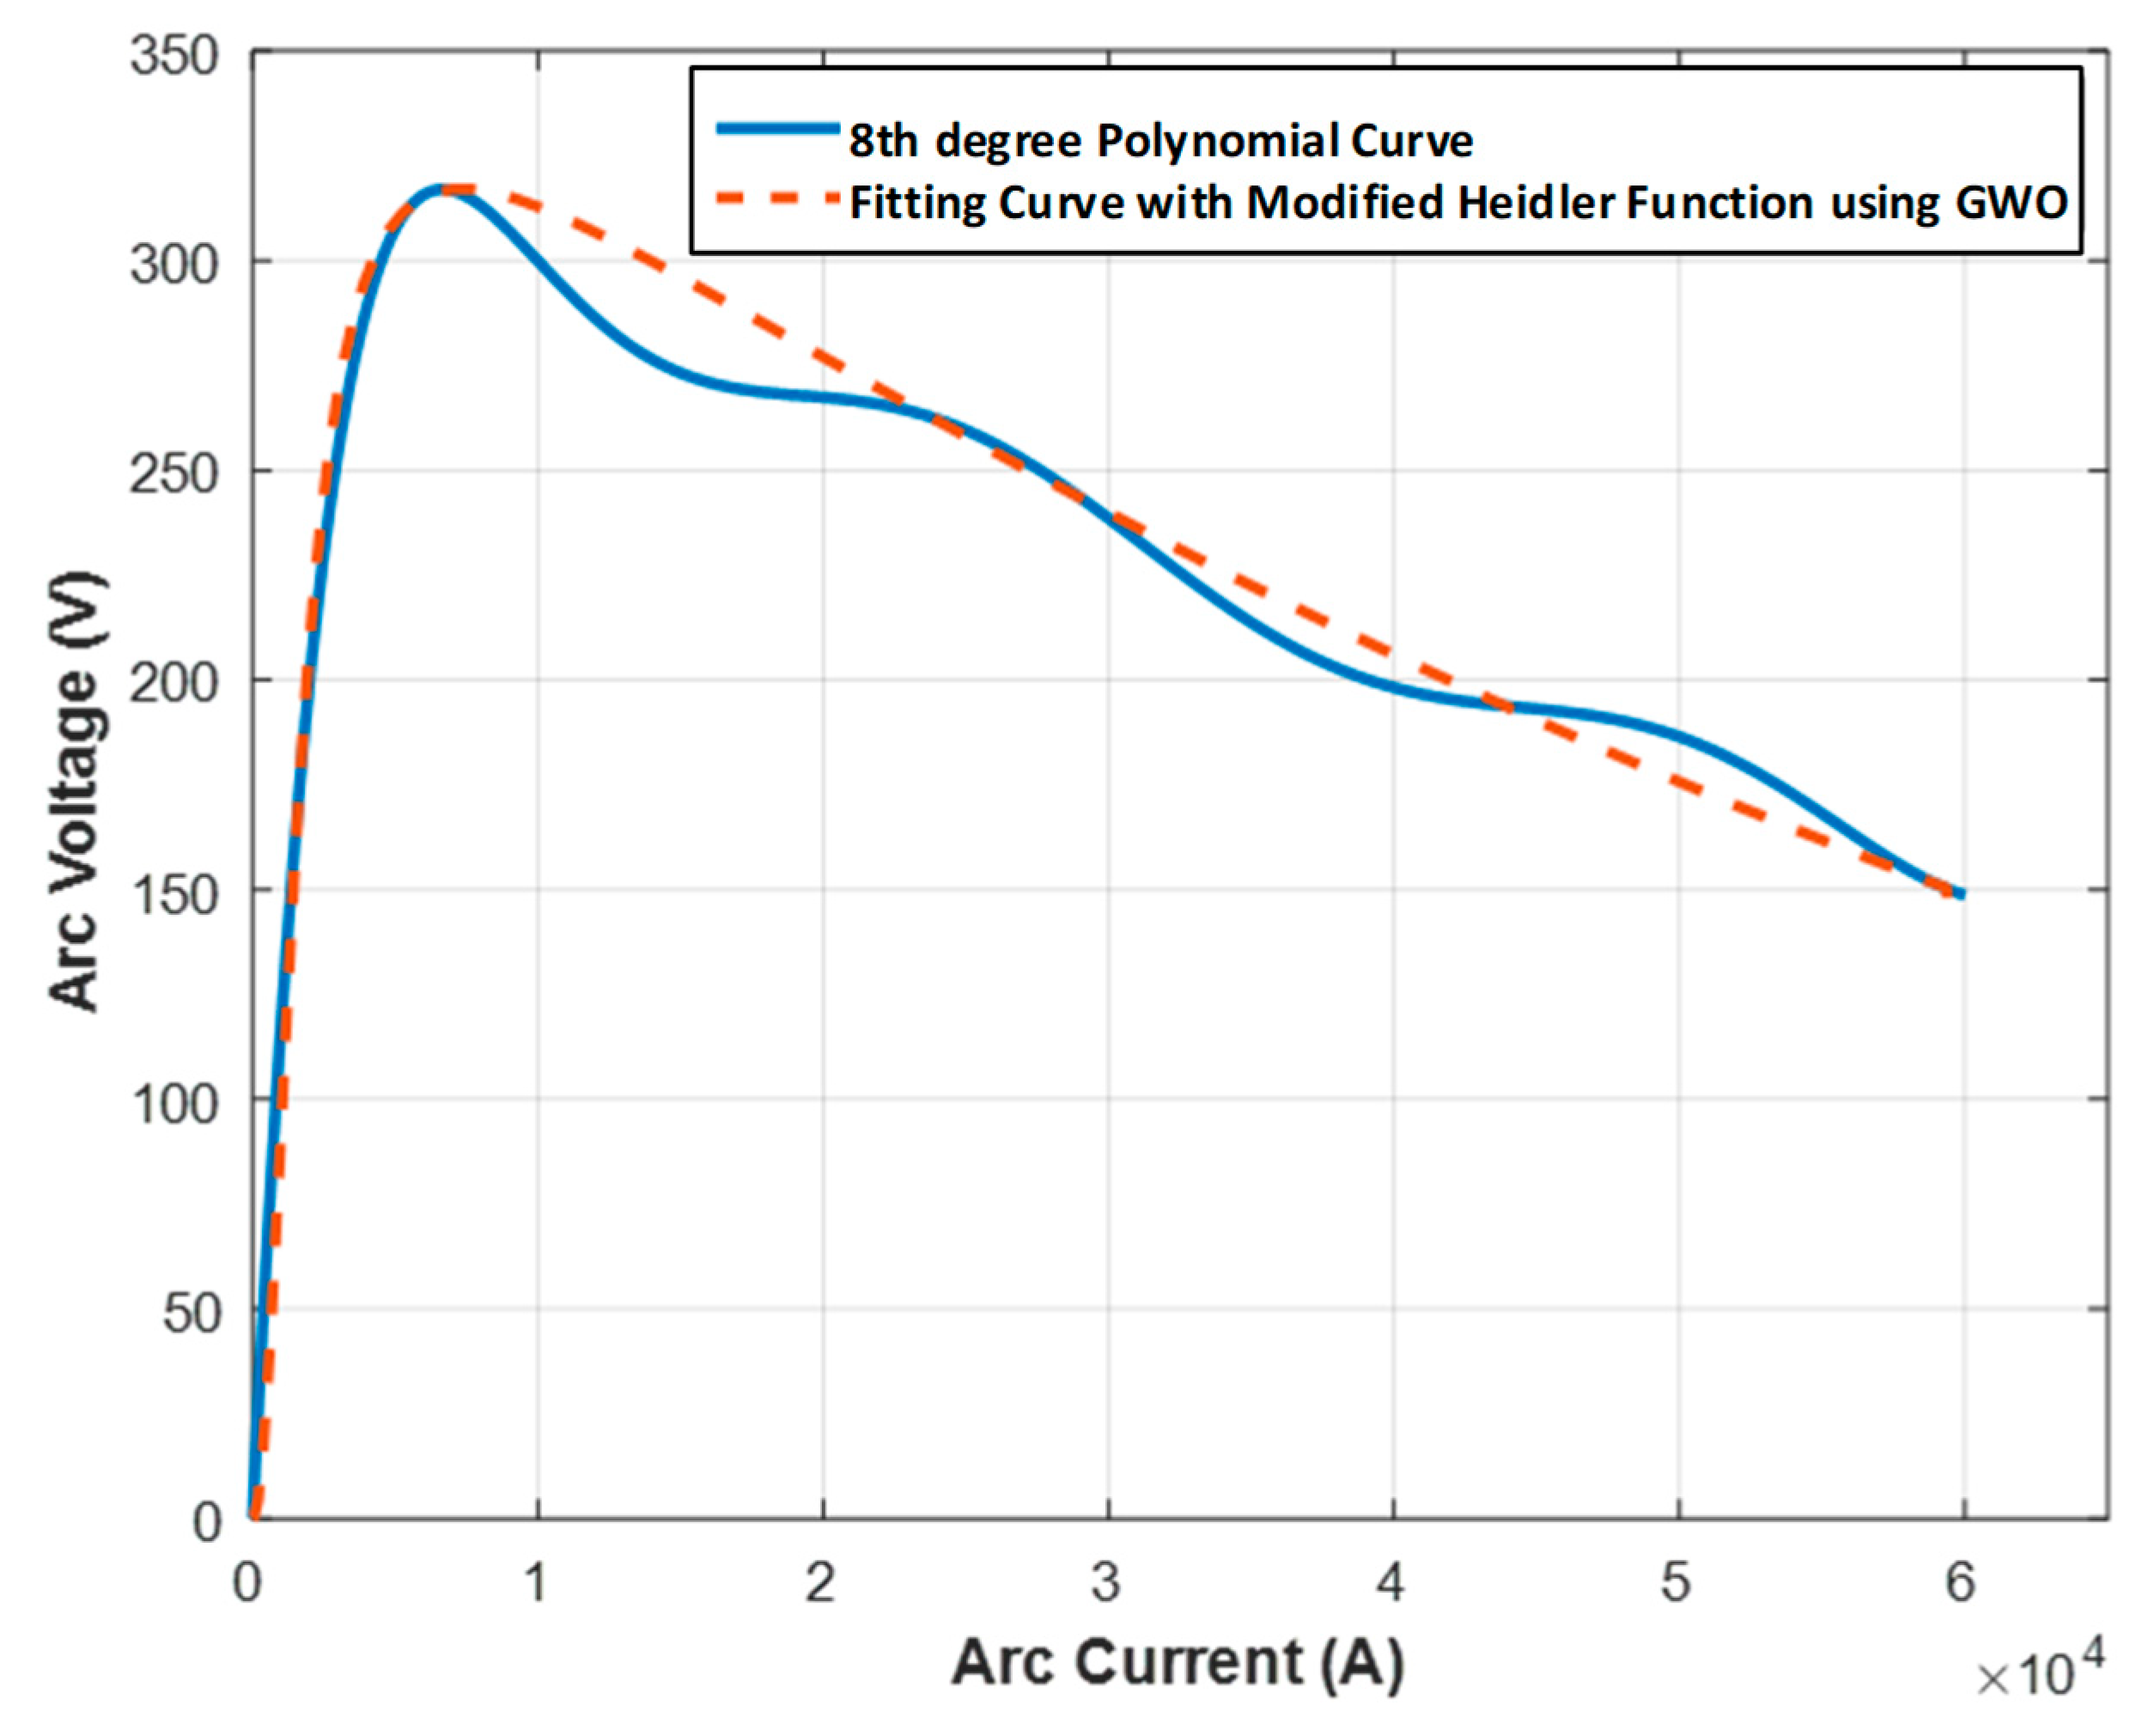
Figure 9 illustrates the V–I characteristic of the arc, represented by an eighth-degree polynomial expression derived through curve fitting and the modified Heidler function, optimized via the GWO algorithm. Additionally, Figure 9 demonstrates that the proposed method effectively characterizes the arc’s V–I behavior during the rising current phase.

3.3.2. Region 2 and Region 3 ( d i / d t < 0 )

The V–I characteristic of the arc can be modeled using a third-degree polynomial equation when the derivative of the current negative is ( d i / d t < 0 ) , indicating a decreasing current phase. This representation is obtained through the curve-fitting method.
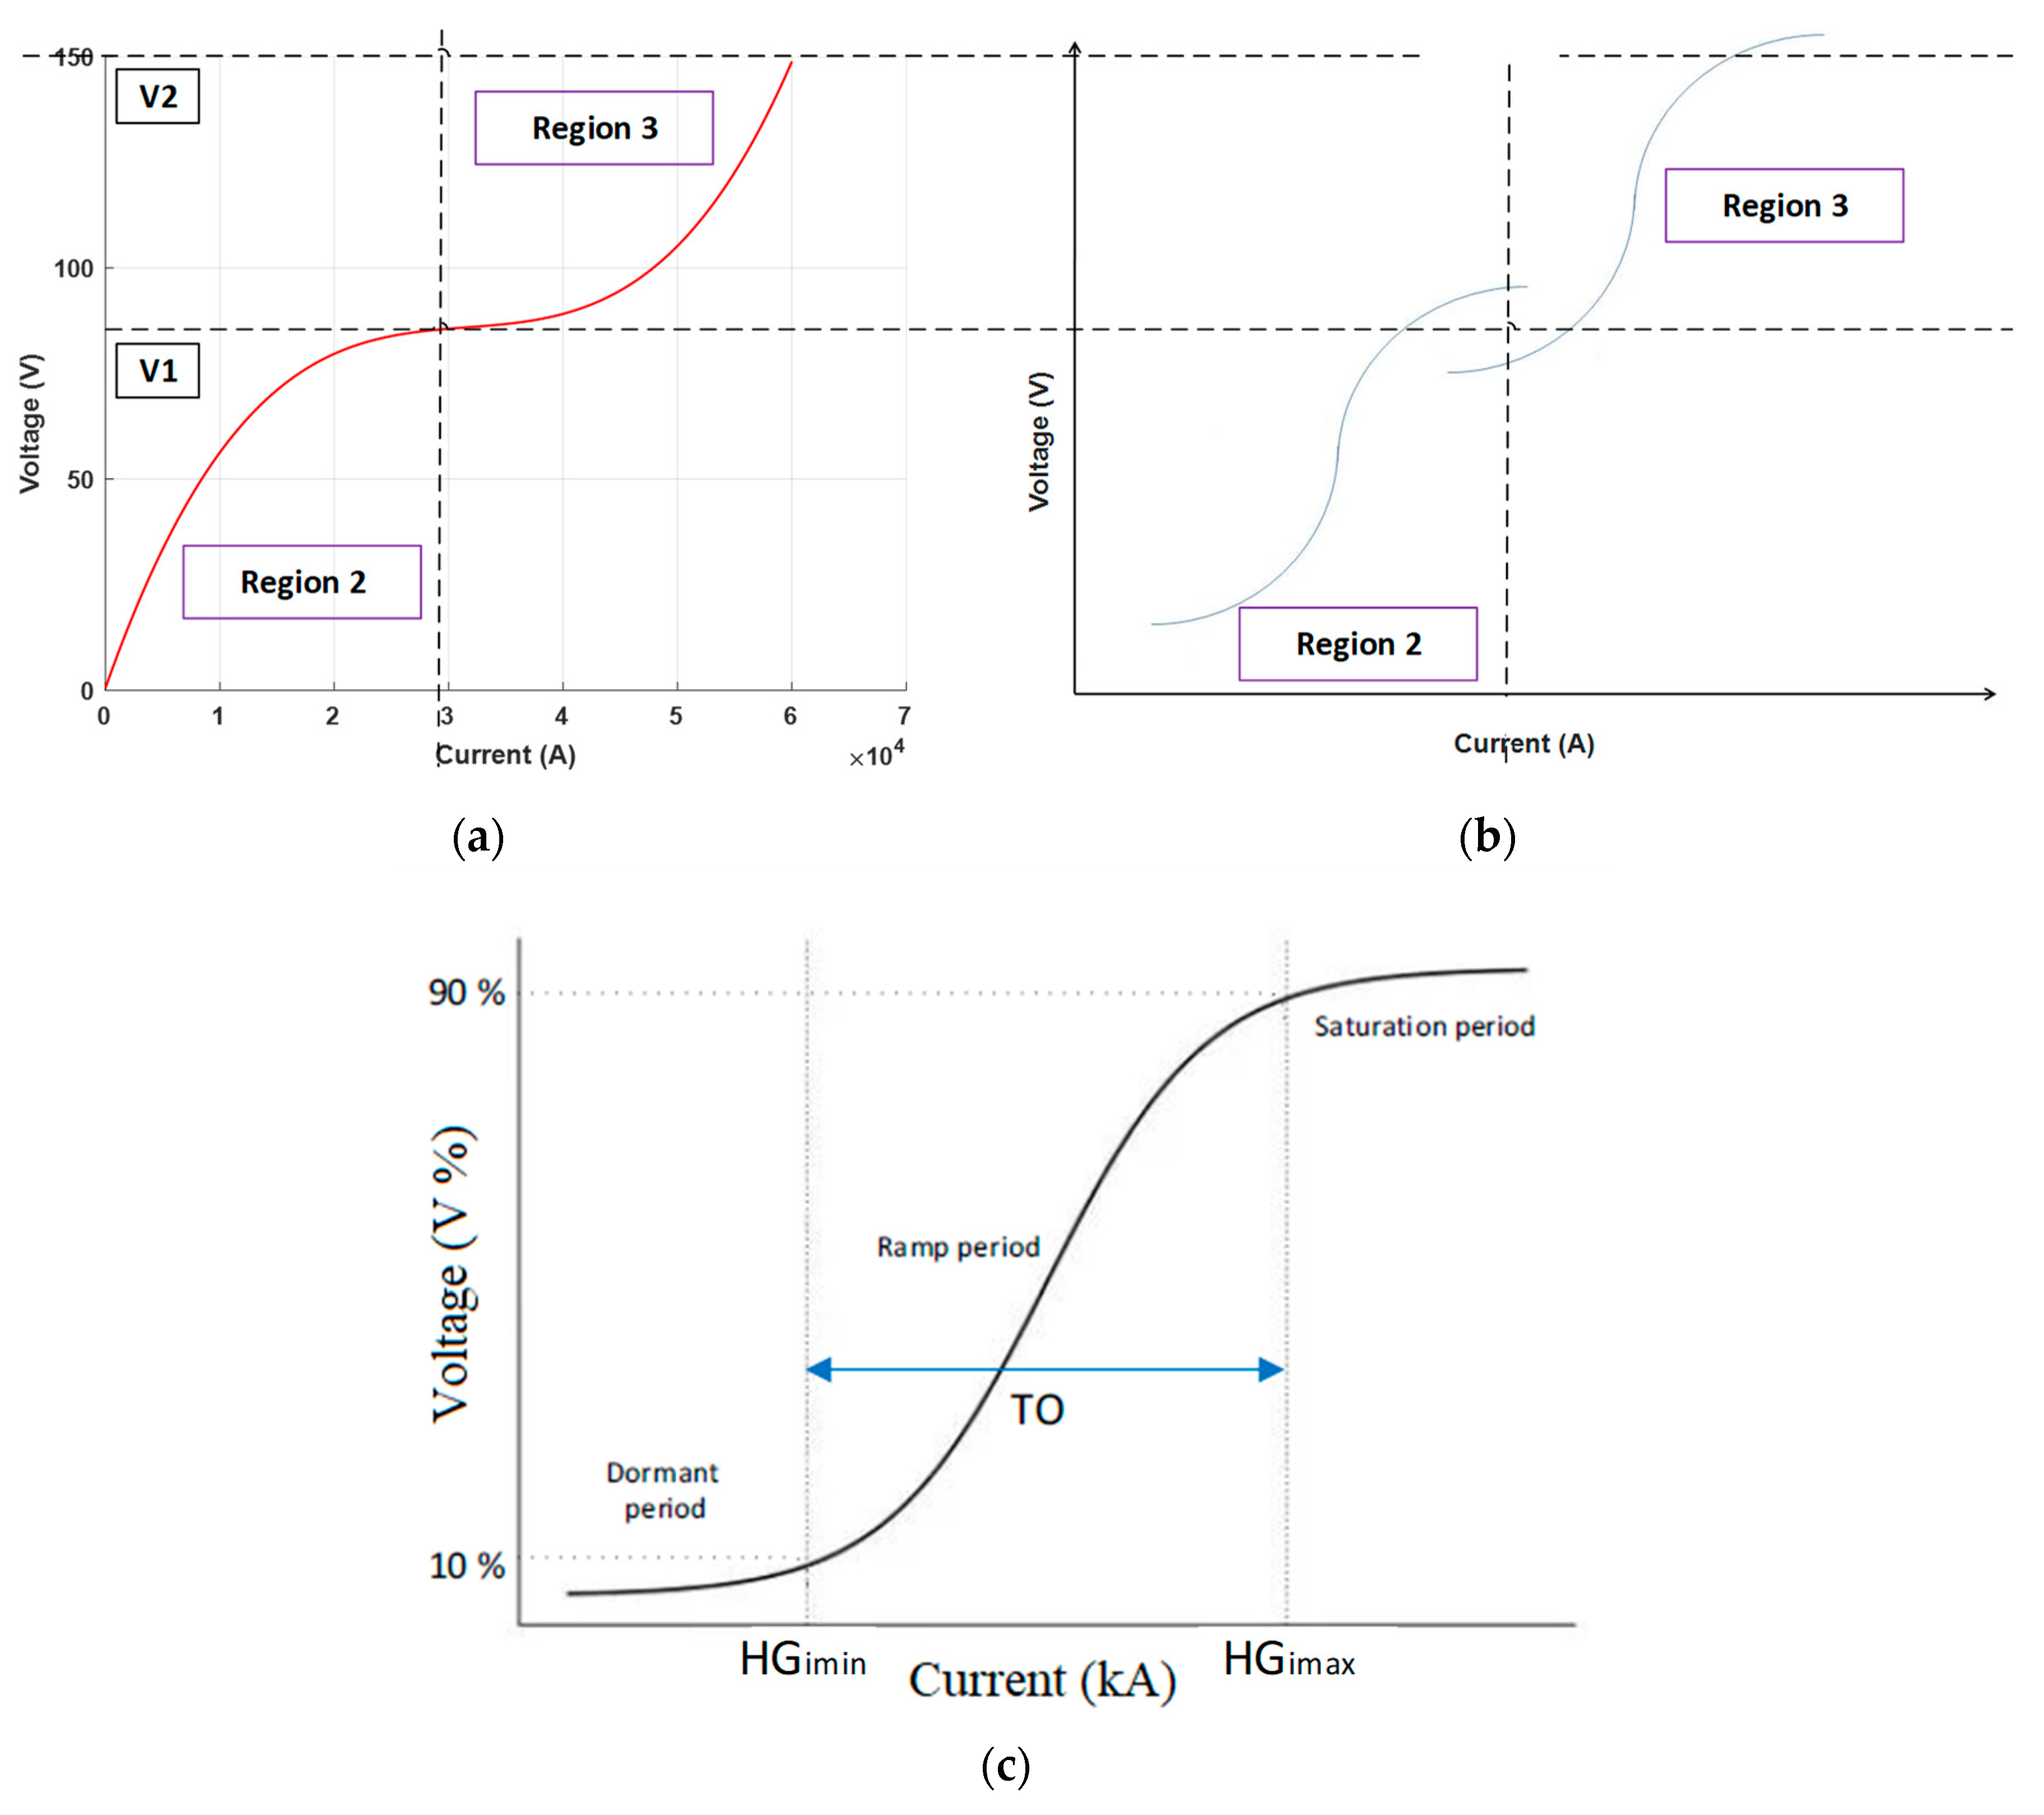
To enhance accuracy, the cubic polynomial expression is divided into two regions, as shown in Figure 10a. In this case, the solution of the polynomial expression can be more accurately modeled using double S-curves, as shown in Figure 10b. The S-curve’s approach is illustrated in Figure 10c [54].
The mathematical representation of the S-curve is calculated by Equation (16) as follows:
V ( i ) = V m 1 + 100 ( H G i m i n + H G i m a x ) 3 i H G i m i n
where:
V m is the maximum saturation voltage on the S-curve.
H G i m i n is the present value in the minimum hyper growth state,
H G i m a x is the present value in the maximum hyper growth state,
i is the arc current.
The experimental data indicate that a minimum threshold voltage of 20 V is required for arc formation [55]. The third-degree polynomial curve exhibits a smooth transition at 30 kA. Consequently, a value of 30 kA has been established as the threshold for differentiating the S-curves.
In Region 2, the peak voltage of the initial S-curve is denoted as V 1 , whereas in Region 3, the peak voltage of the subsequent S-curve is denoted as V 2 . The mathematical representation of the S-curves as a function of the Vex voltage is as follows:
  • In Region 2, where d i / d t < 0 ,     0 < i < 3 0 kA, and V a r c > 0 , the mathematical correlation between arc voltage and arc current is expressed by Equation (17):
    V a r c ( i ) = ( α . V e x β . V 2 . 1 1 + 10 0 i 3 + i 4 3 i / i 3 20 )
  • For Region 3, under the constraints d i / d t < 0 ,   30 < i , and V a r c > 0 , the mathematical relationship between arc voltage and arc current is articulated by Equation (18):
    V a r c ( i ) = α . V e x β . V 2 + ( λ . V 1 . 1 1 + 10 0 i 5 + i 6 3 i / i 5 20 )
In Equations (17) and (18);
V 1 is the maximum voltage value of the S-curve for Region 2.
V 2 is the maximum voltage value of the S-curve for Region 3.
V e x is the maximum value of the polynomial expressions obtained through curve fitting. (corresponding to the maximum value of the eighth-degree polynomial defined in Region 1)
i 3 , i 5 is the arc current value of S-curves in the minimum hyper grow state.
i 4 , i 6 is the arc current values of S-curves at the highest hypergrowth condition.
α ,   β ,   λ is the coefficient values used to define the optimal solution of the polynomial expression.
The GWO approach has been employed to determine the optimal parameters of the S-curves based on the third-degree polynomial equation. In the GWO algorithm, Equations (17) and (18) are defined as the goal function. The optimal solution for S-curves has been obtained by setting upper and lower boundary values, based on the limitations outlined below.
  • 0 < V < V 1 (range of arc voltage values derived from experimental data for Region 2)
  • 0 < i < 30 kA (range of arc current values derived from experimental results for Region 2)
  • V 1 < V < V 2 (range of arc voltage values derived from experimental data for Region 3)
  • 30   k A i (range of arc current values derived from experimental results for Region 3)
According to the characteristic curve obtained using the curve-fitting method, as illustrated in Figure 5, the relationships ( V 1 = 0.255· V e x ), and ( V 2 = 0.477· V e x ) can be expressed. In Equations (17) and (18), the application of the GWO algorithm, while adhering to the defined constraints, resulted in the calculated coefficients α ,   β , and λ as 1.505, 2.533 and 1.50, respectively. The optimization yields for the following values for the hypergrowth parameters are calculated as follows: i 3 = 0 kA, i 4 = 20 kA, i 5 = 27 kA and i 6 = 92 kA.
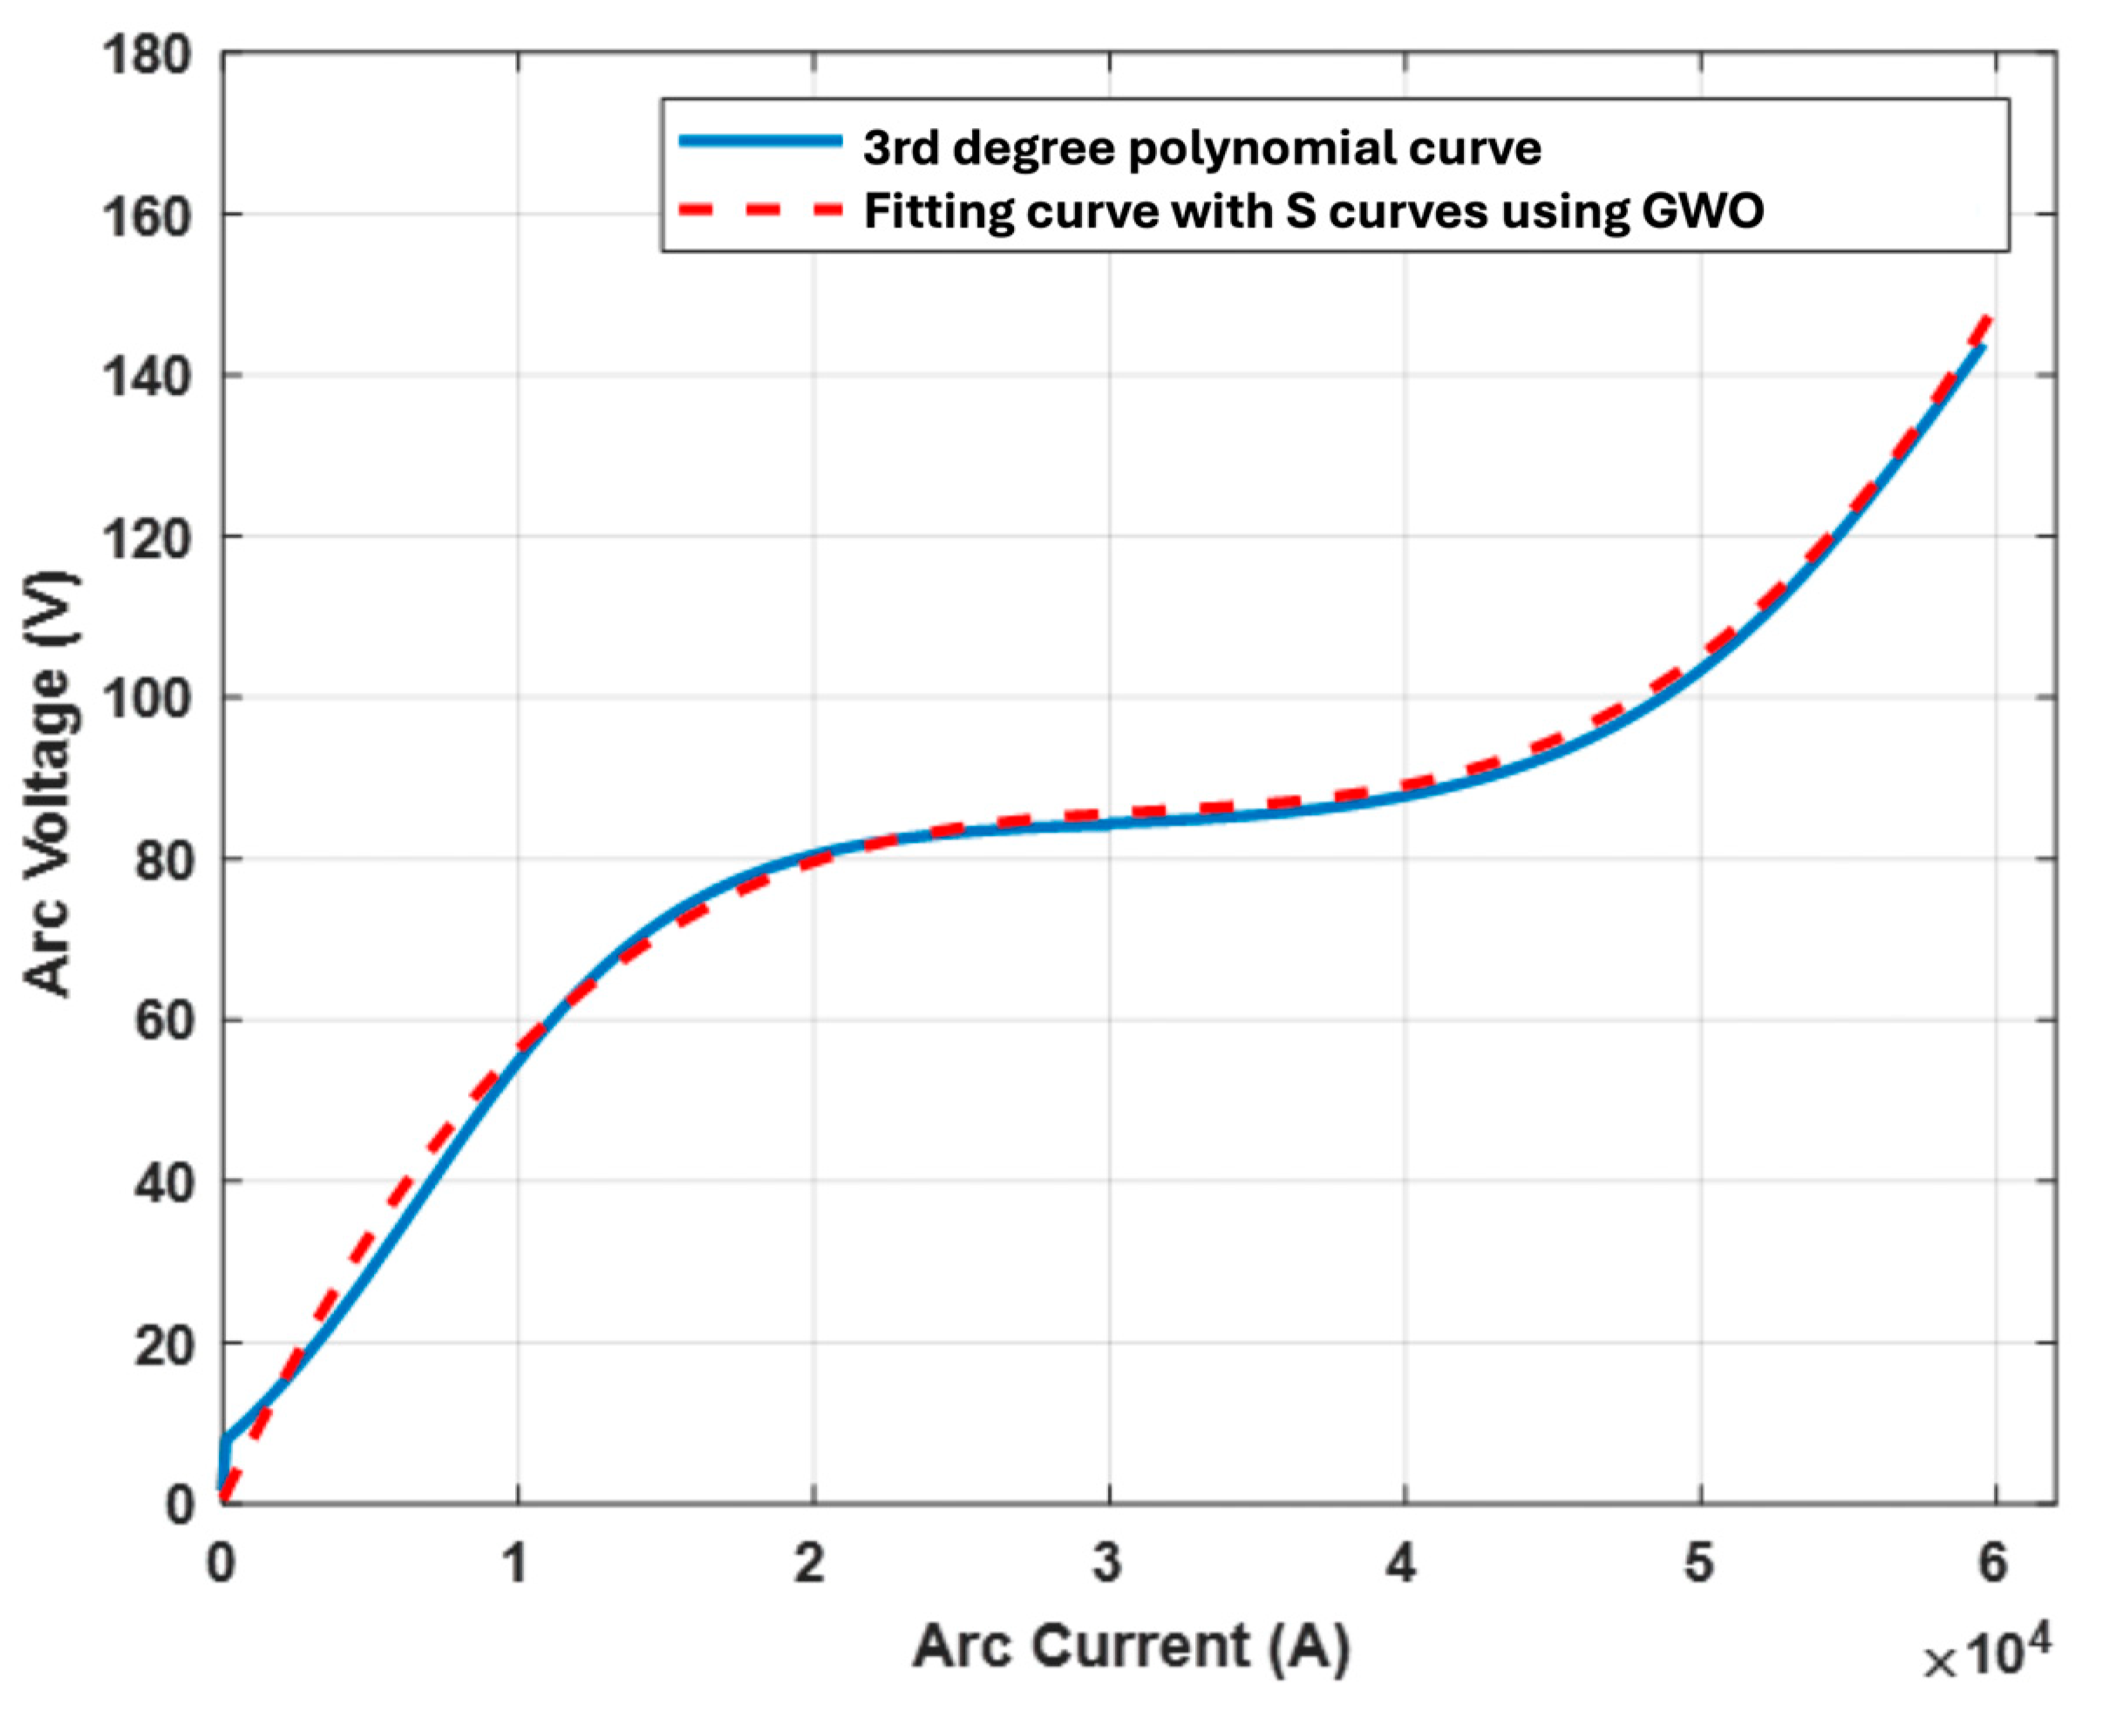
Figure 11 displays the V–I characteristic curves obtained from the third-degree polynomial curve and the GWO technique for utilizing double S-curves.
Considering these assumptions, the solution of the defined polynomial expressions can be expressed using the modified Heidler function and double S-curves. The general mathematical representation of the proposed model is given in Equation (19).
V i = 1.505 · V e x η · ( i i 1 ) n i 2 i n + 1 · e i i 1 · s i g n i   ;                                                                                   i f         d i d t > 0                                                                 0.297 · V e x · 1 1 + 10 0 i 3 + i 4 3 i i 3 20 · s i g n i ;             i f   d i d t < 0   a n d 30   kA < i < 30   kA     V e x · 0.297 + 0.382 · 1 1 + 10 0 i 5 + i 6 3 i i 5 20 · s i g n i ;     i f   d i d t < 0   a n d 30   kA > i ,   i > 30   kA    

4. Results and Discussion

This section analyzes the V–I characteristic structure of the EAF, comparing the characteristic models explained in this study with the proposed model. The simulation results are evaluated by comparing them with actual data. To understand the distinct behavior of the presented models, the current and voltage fluctuations of the arc were initially examined under static arc length. During the melting process, the distance between the molten metal and the arc fluctuates continuously. Therefore, to accurately characterize the dynamic structure of the arc, the flicker effect must be incorporated into the static model.
All the analyses were performed using the MATLAB 2024b software. Table 1 presents the parameters used for the exponential model, the hyperbolic model, the exponential–hyperbolic model, the nonlinear resistance model, and the new proposed model, which describes the arc melting process. During the analysis of the static characteristic, the Vat was recorded at 240 V, estimated based on the arc length defined by the electrode position during the melting process at the measured facility. This value is experimentally recognized as the arc voltage at the average constant arc length. The single-phase equivalent circuit model of the EAF is developed using the model parameters in Table 1.

4.1. Investigation of Static V–I Characteristics of Arc Models

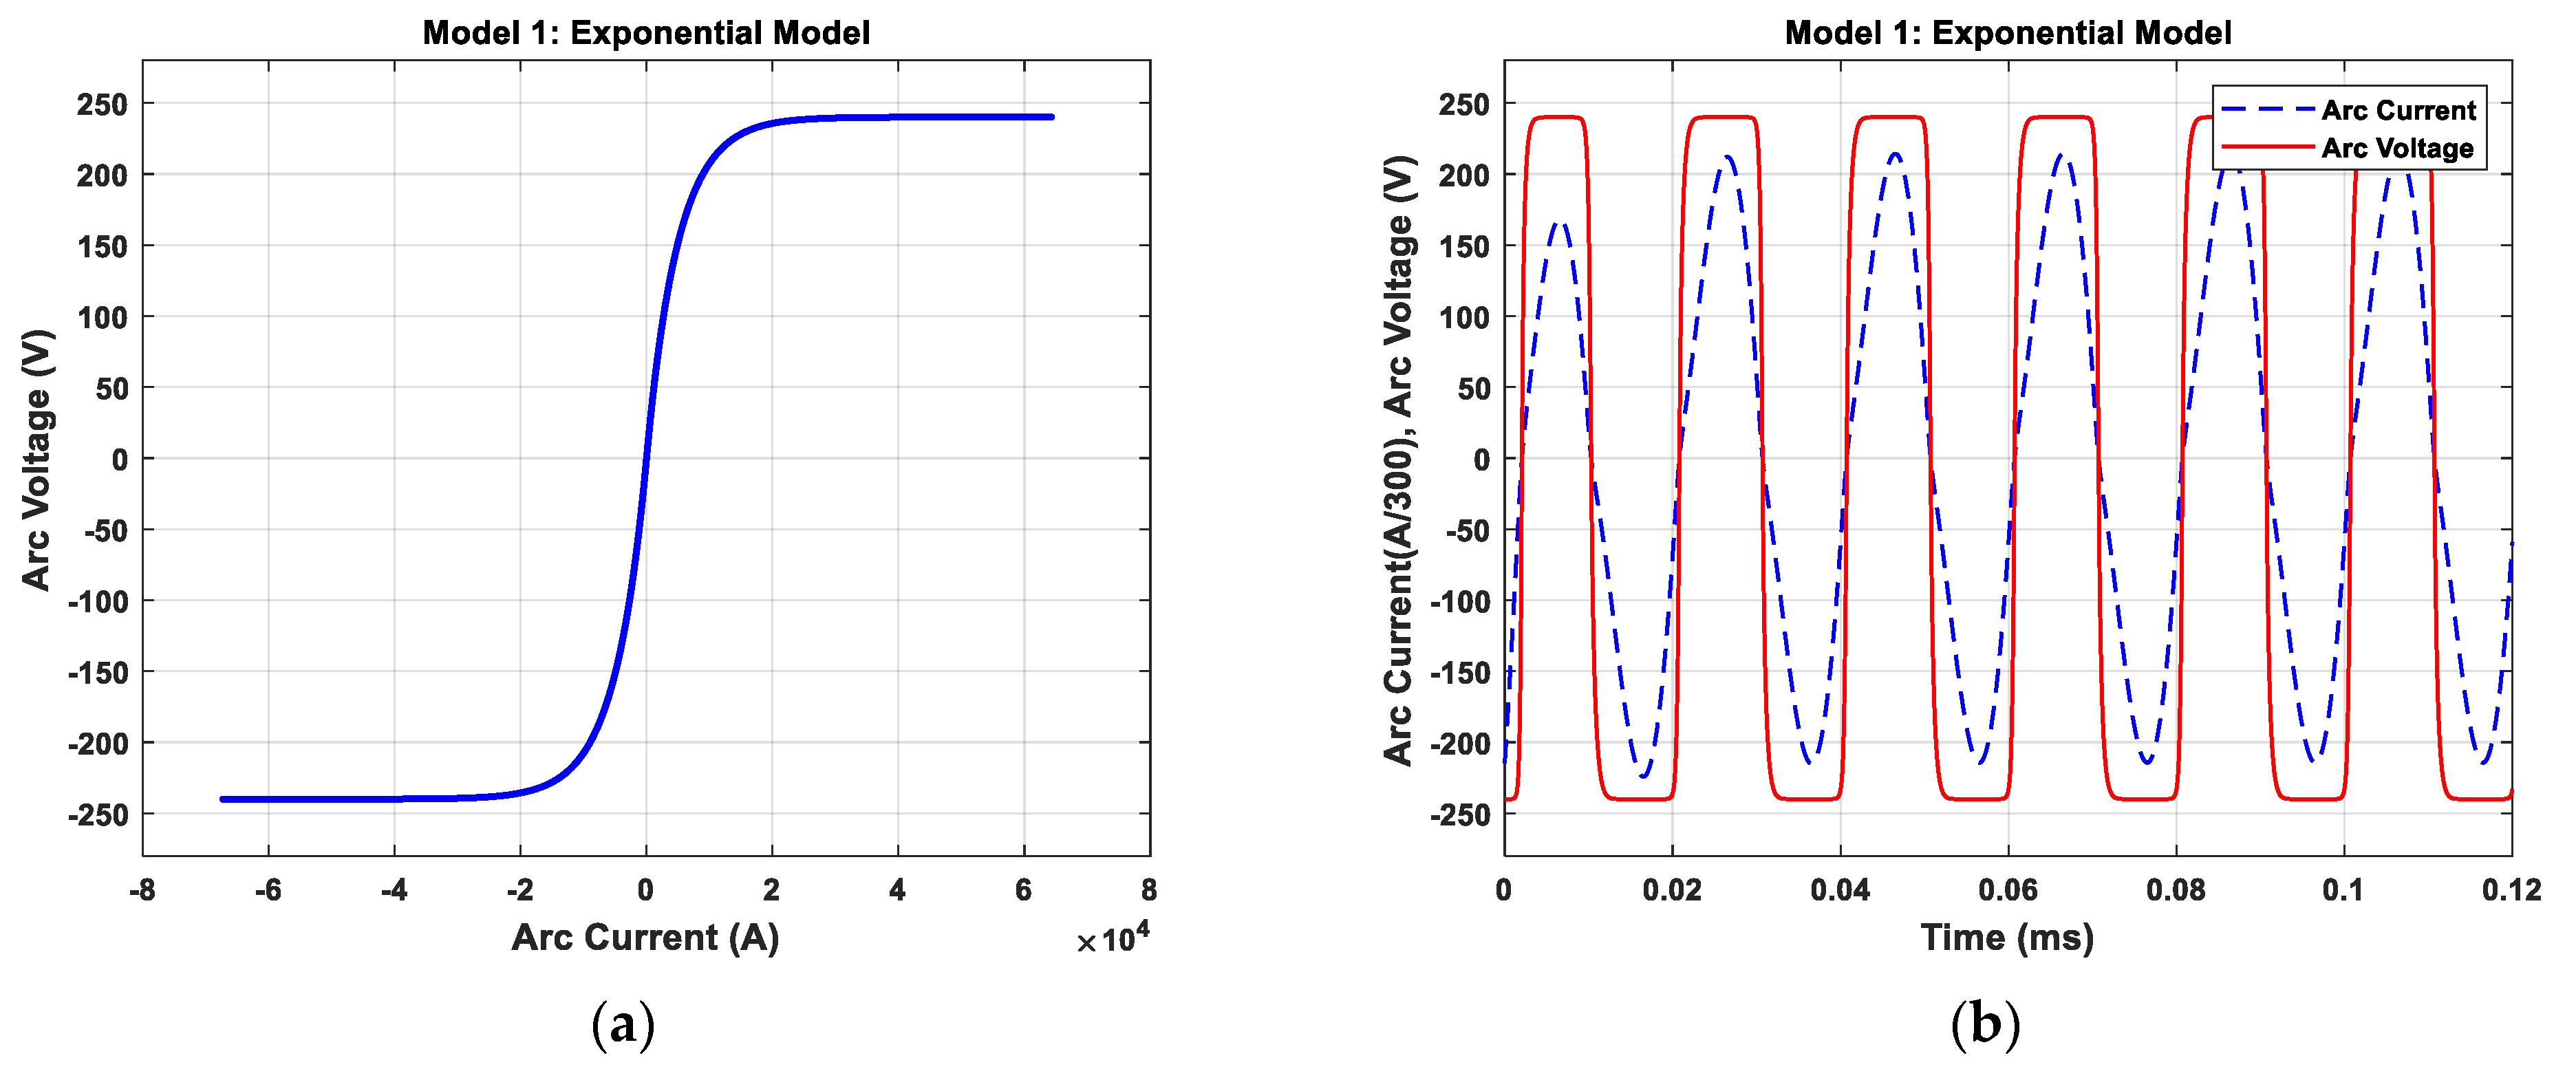
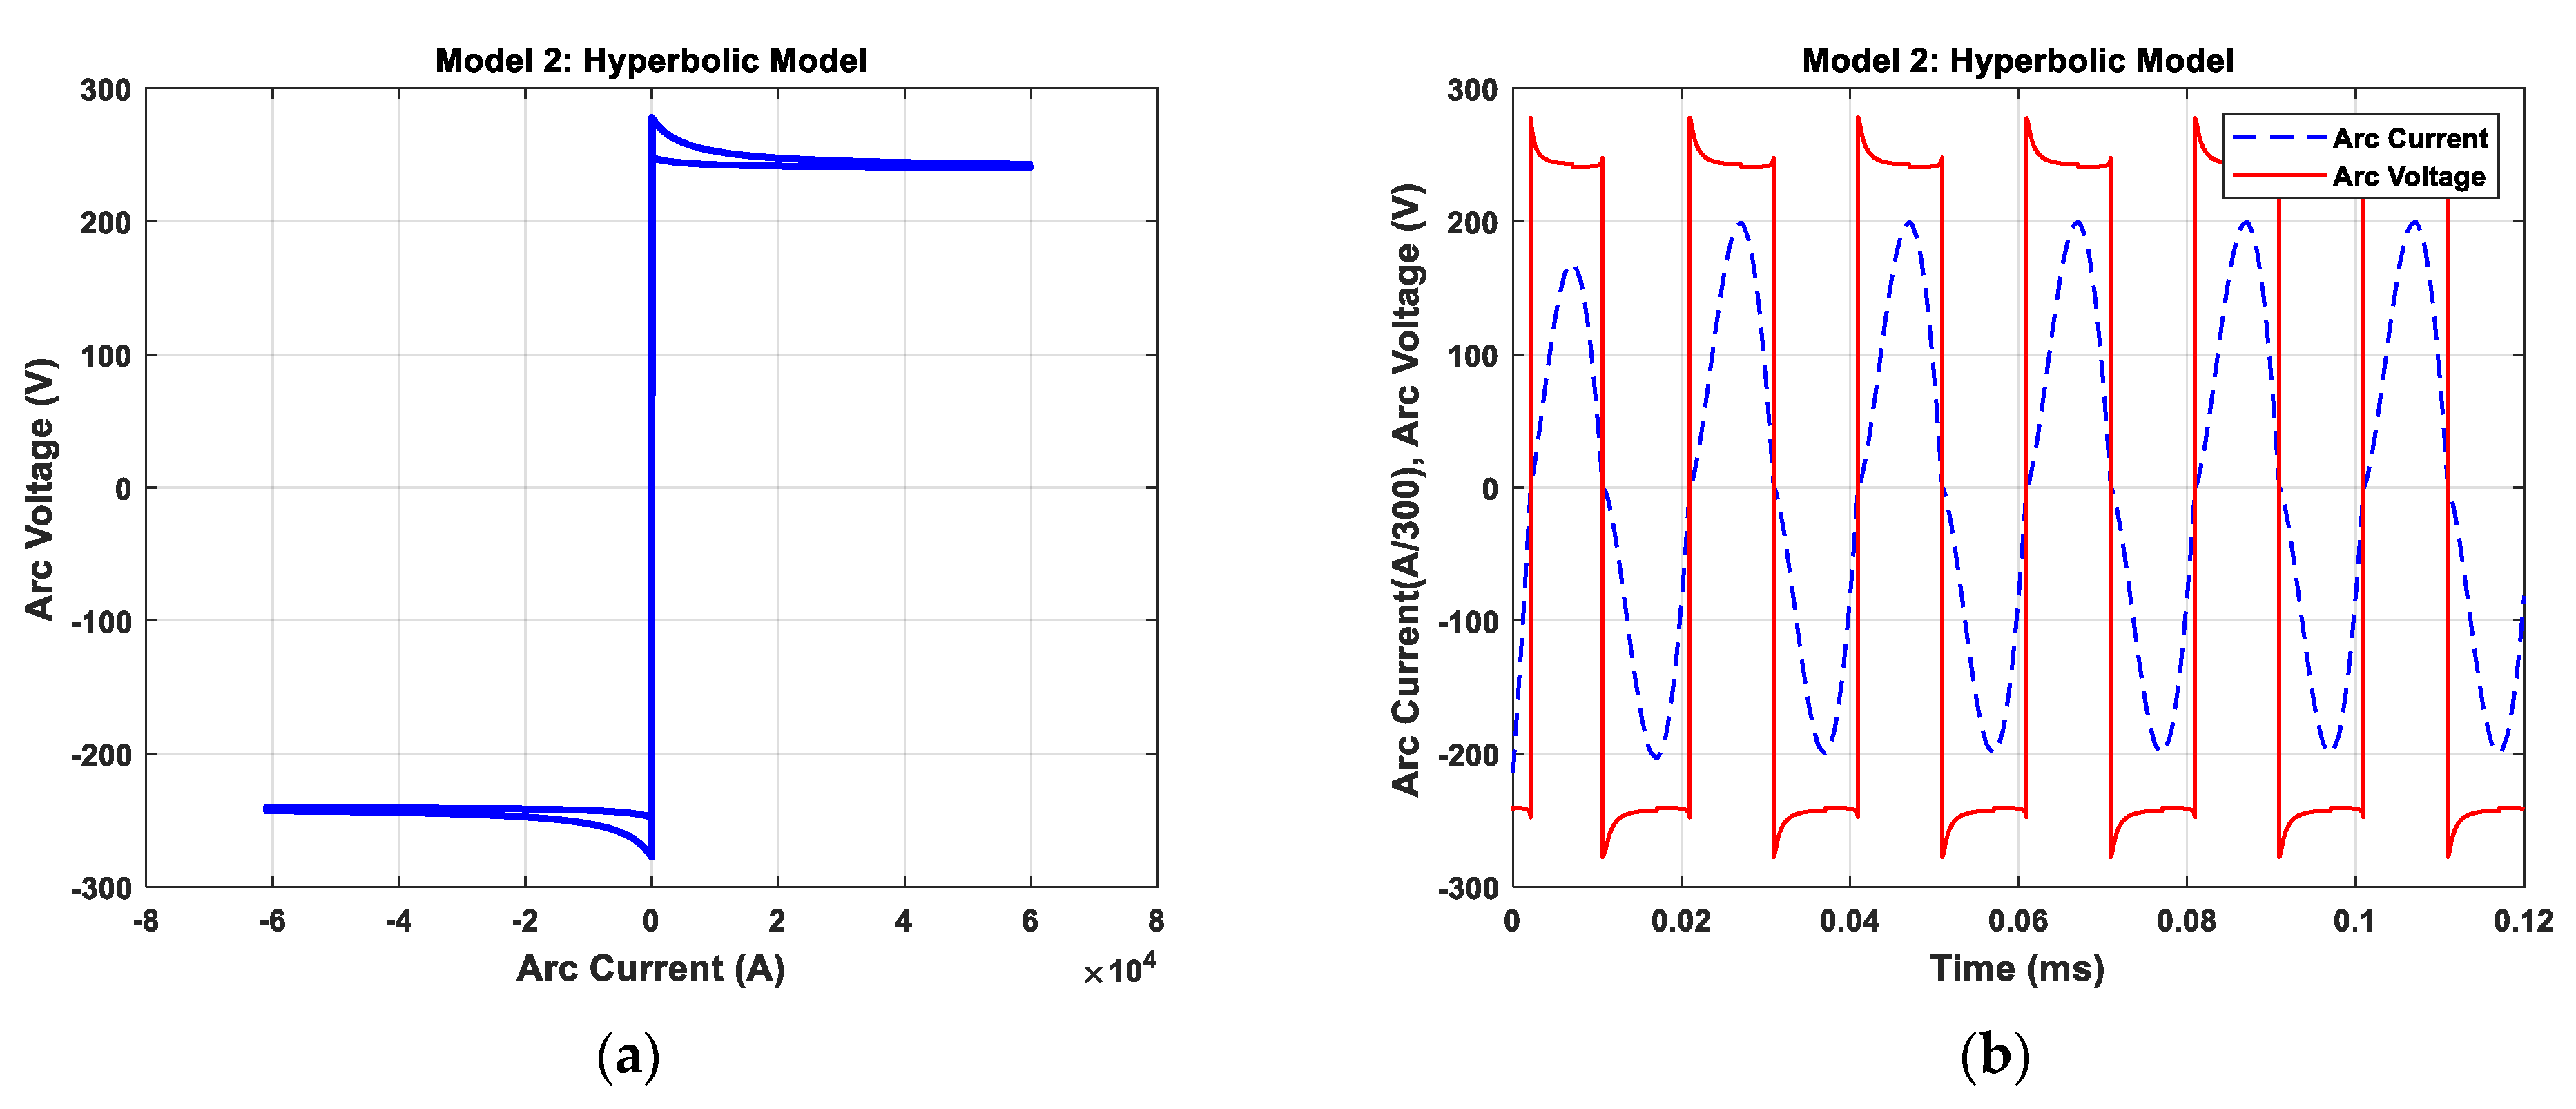
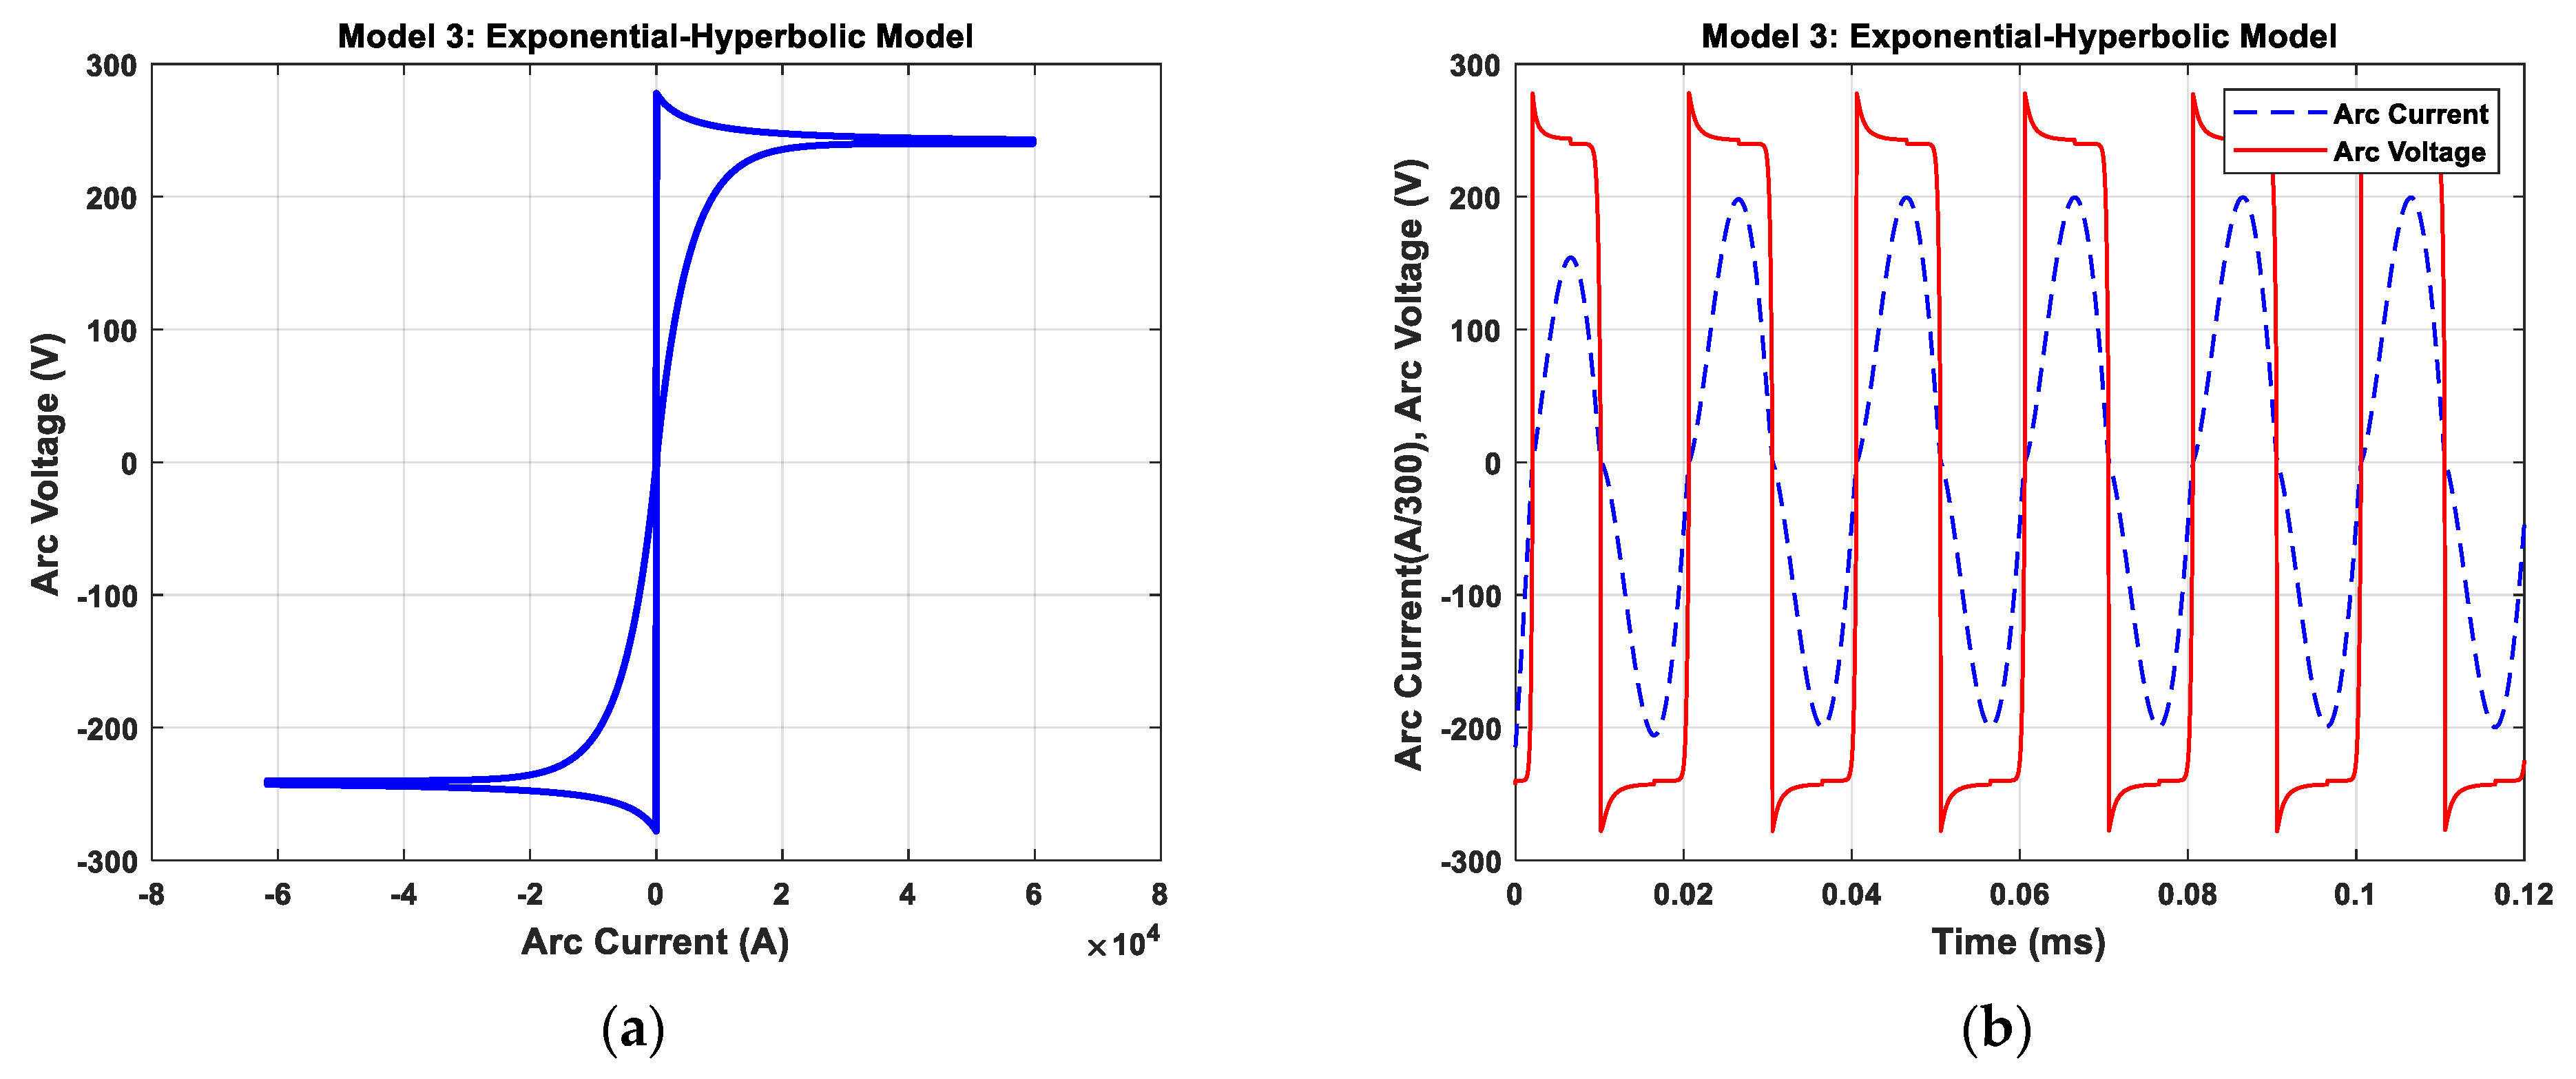
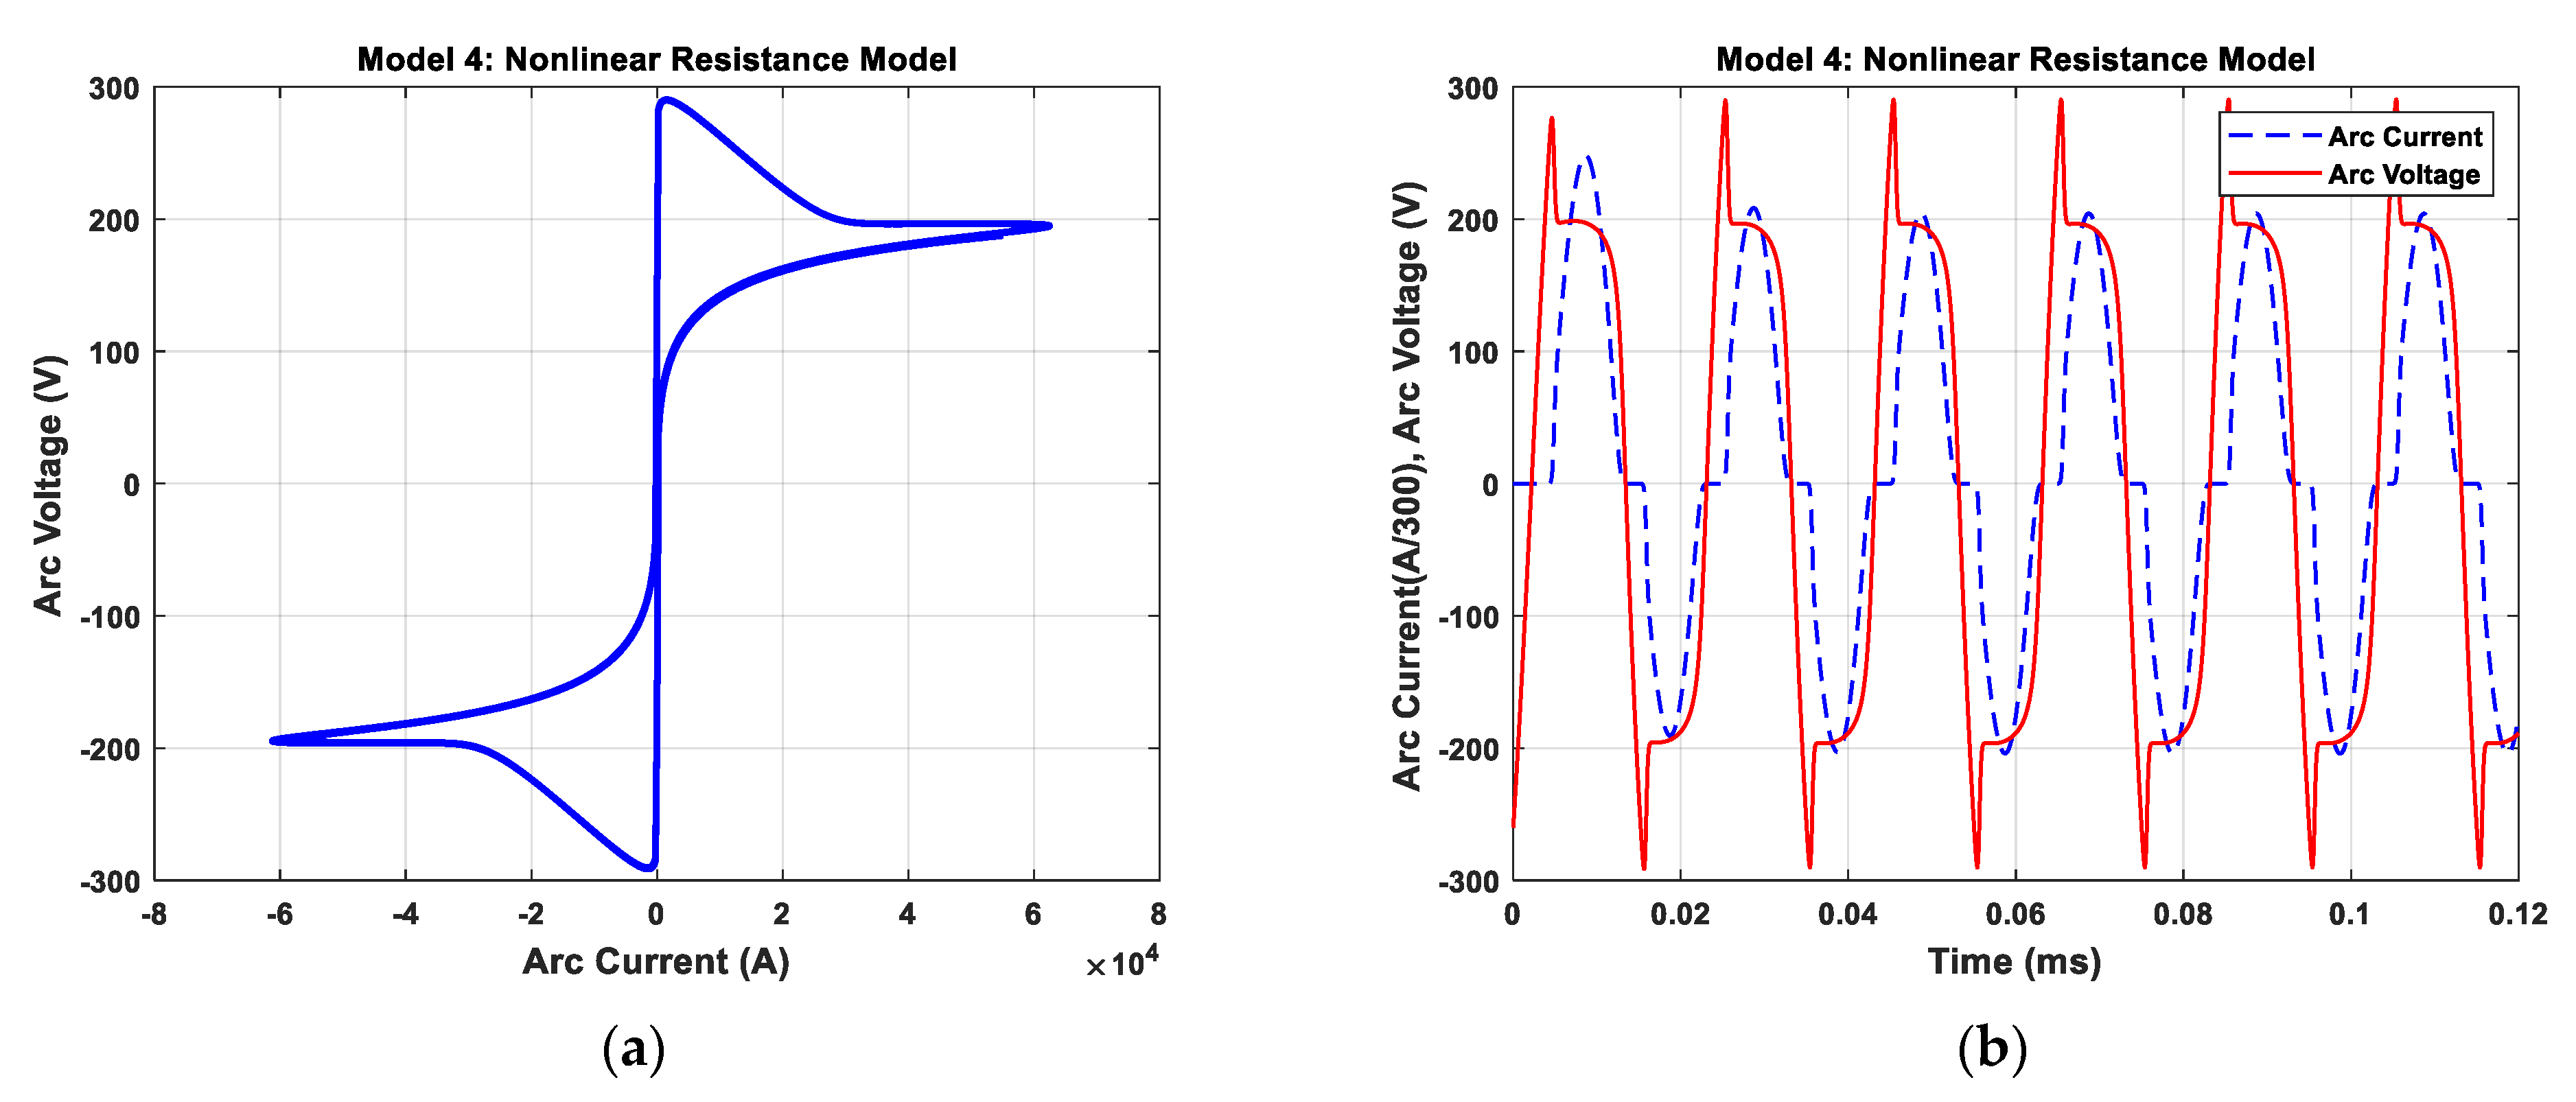
When the arc length between the electrode and the molten material remains constant, flicker effects and power quality issues do not occur at the point of common coupling supplying the EAF. The evaluation of the static characteristic of the EAF, along with the flicker effect, provides the operational state of the EAF during the melting process. Consequently, to comprehend the dynamic characteristics of the electric arc, it is essential to first define its static V–I characteristic. The single-phase equivalent circuit model of the electrical system, as illustrated in Figure 3, alongside the static V–I characteristics and the static current and voltage waveforms of the electric arc for the exponential model (Figure 12), the hyperbolic model (Figure 13), the exponential–hyperbolic model (Figure 14), the nonlinear resistance model (Figure 15), and the proposed model (Figure 16), based on the parameters outlined in Table 1, are presented below.

4.2. Dynamic Characteristic of Electric Arc for Melting Process

During the melting process in the arc furnace, the distance between the electrodes and the molten material continuously fluctuates. The dynamic characteristic of the EAF can be represented by incorporating the flicker effect into the static characteristic model. In this study, the random flicker effect is modeled in Equation (20), which mathematically defines these fluctuations. The frequency of this equation is set at 10 Hz to accurately simulate the flicker behavior observed in real-world EAF operations.
V e x ( t ) = V a t · ( 1 + m · N ( t ) )
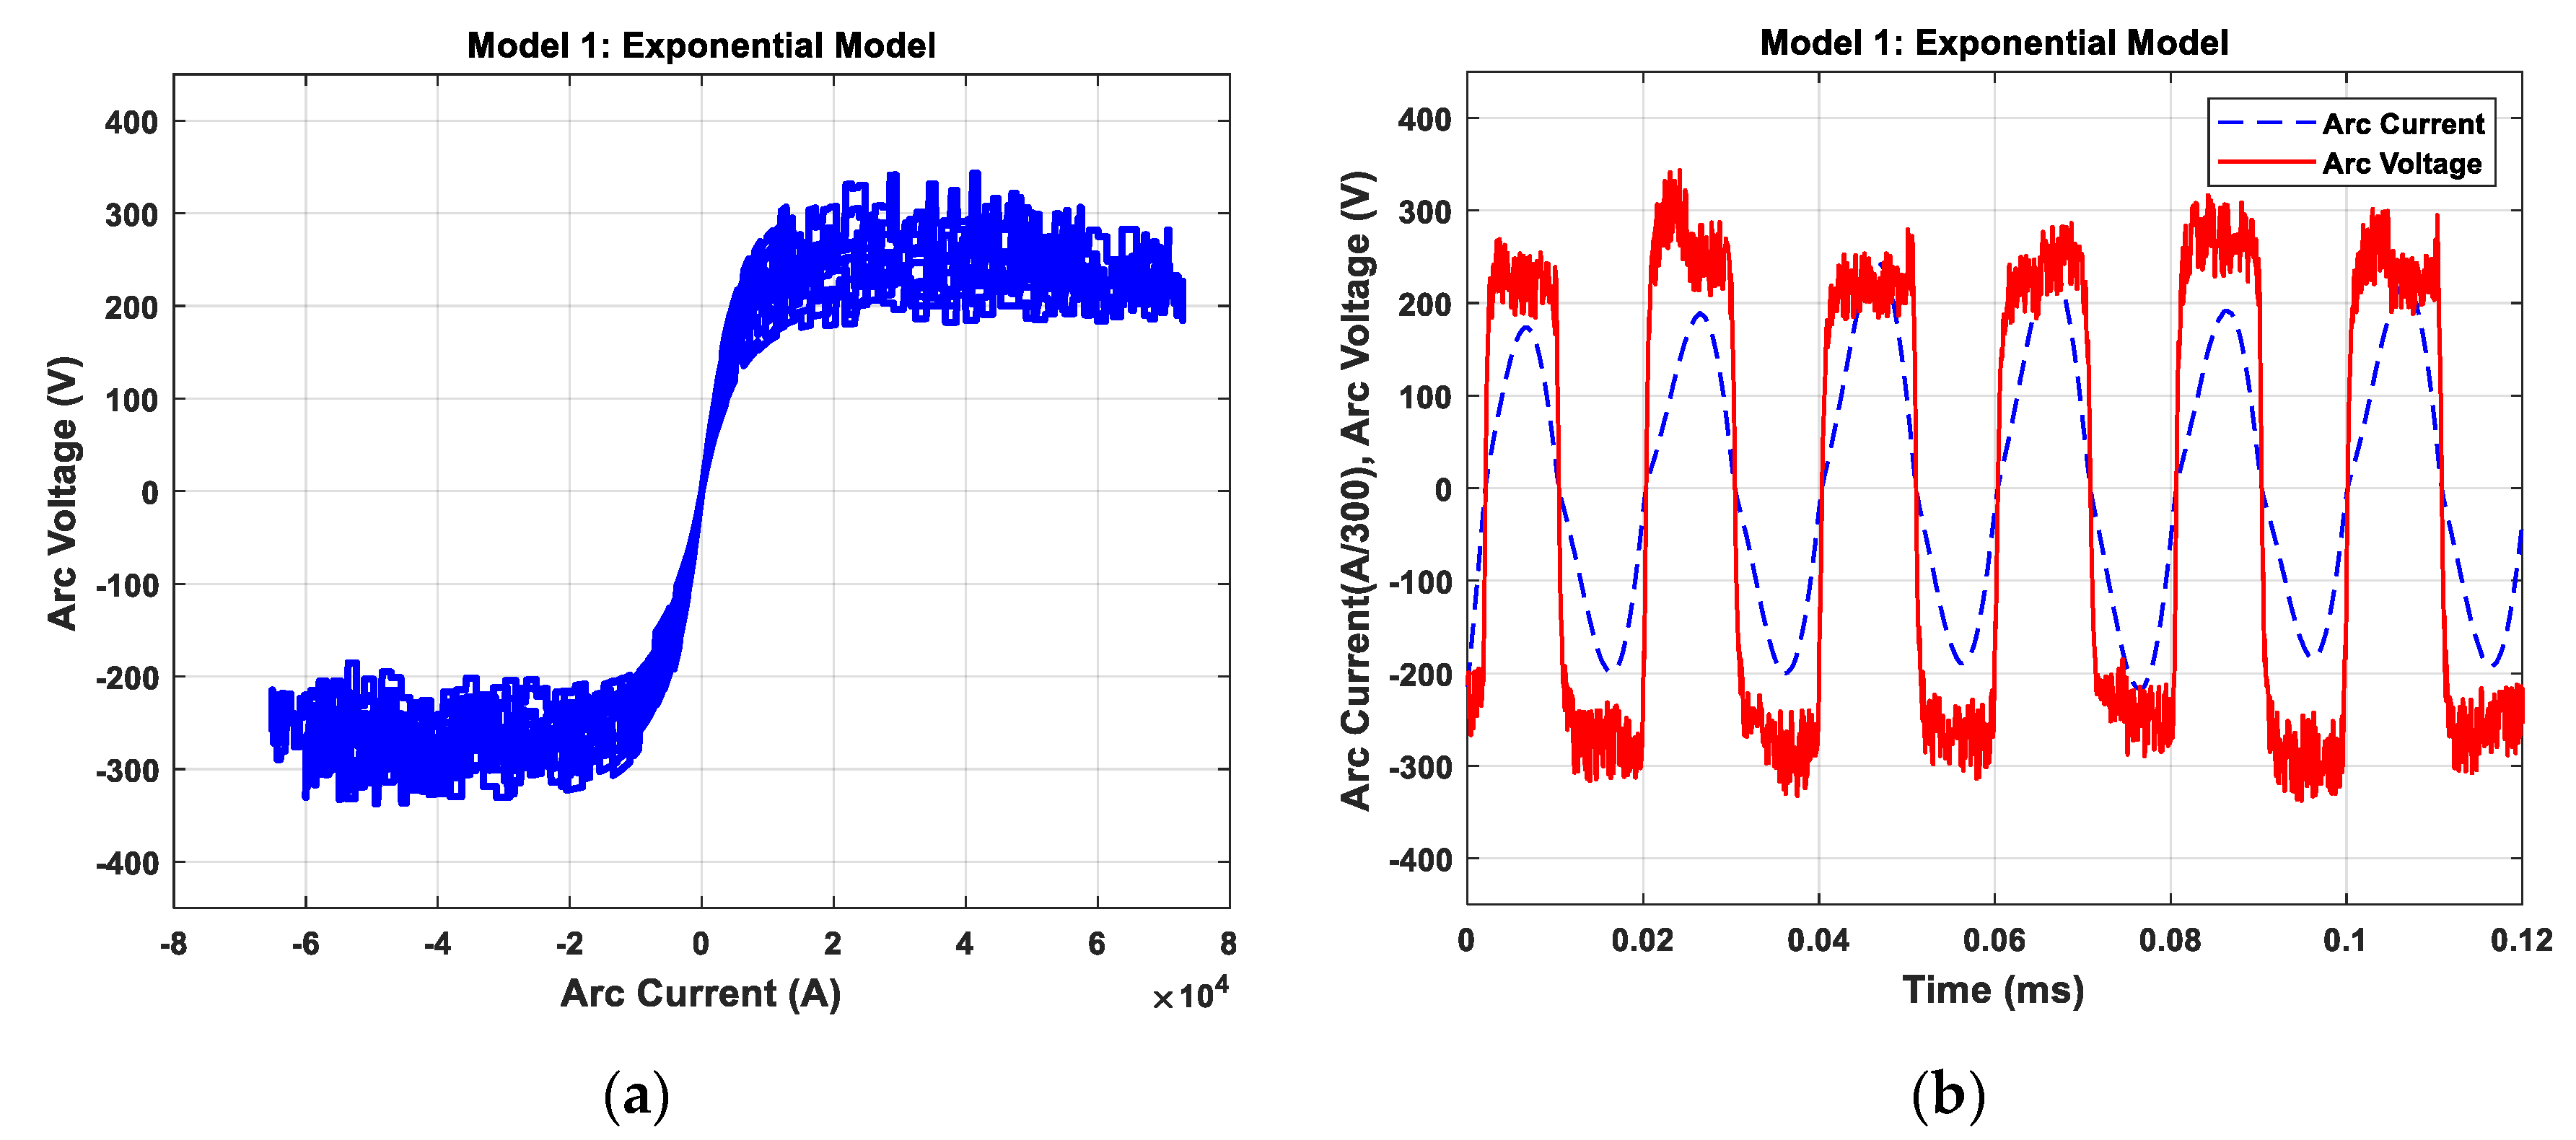
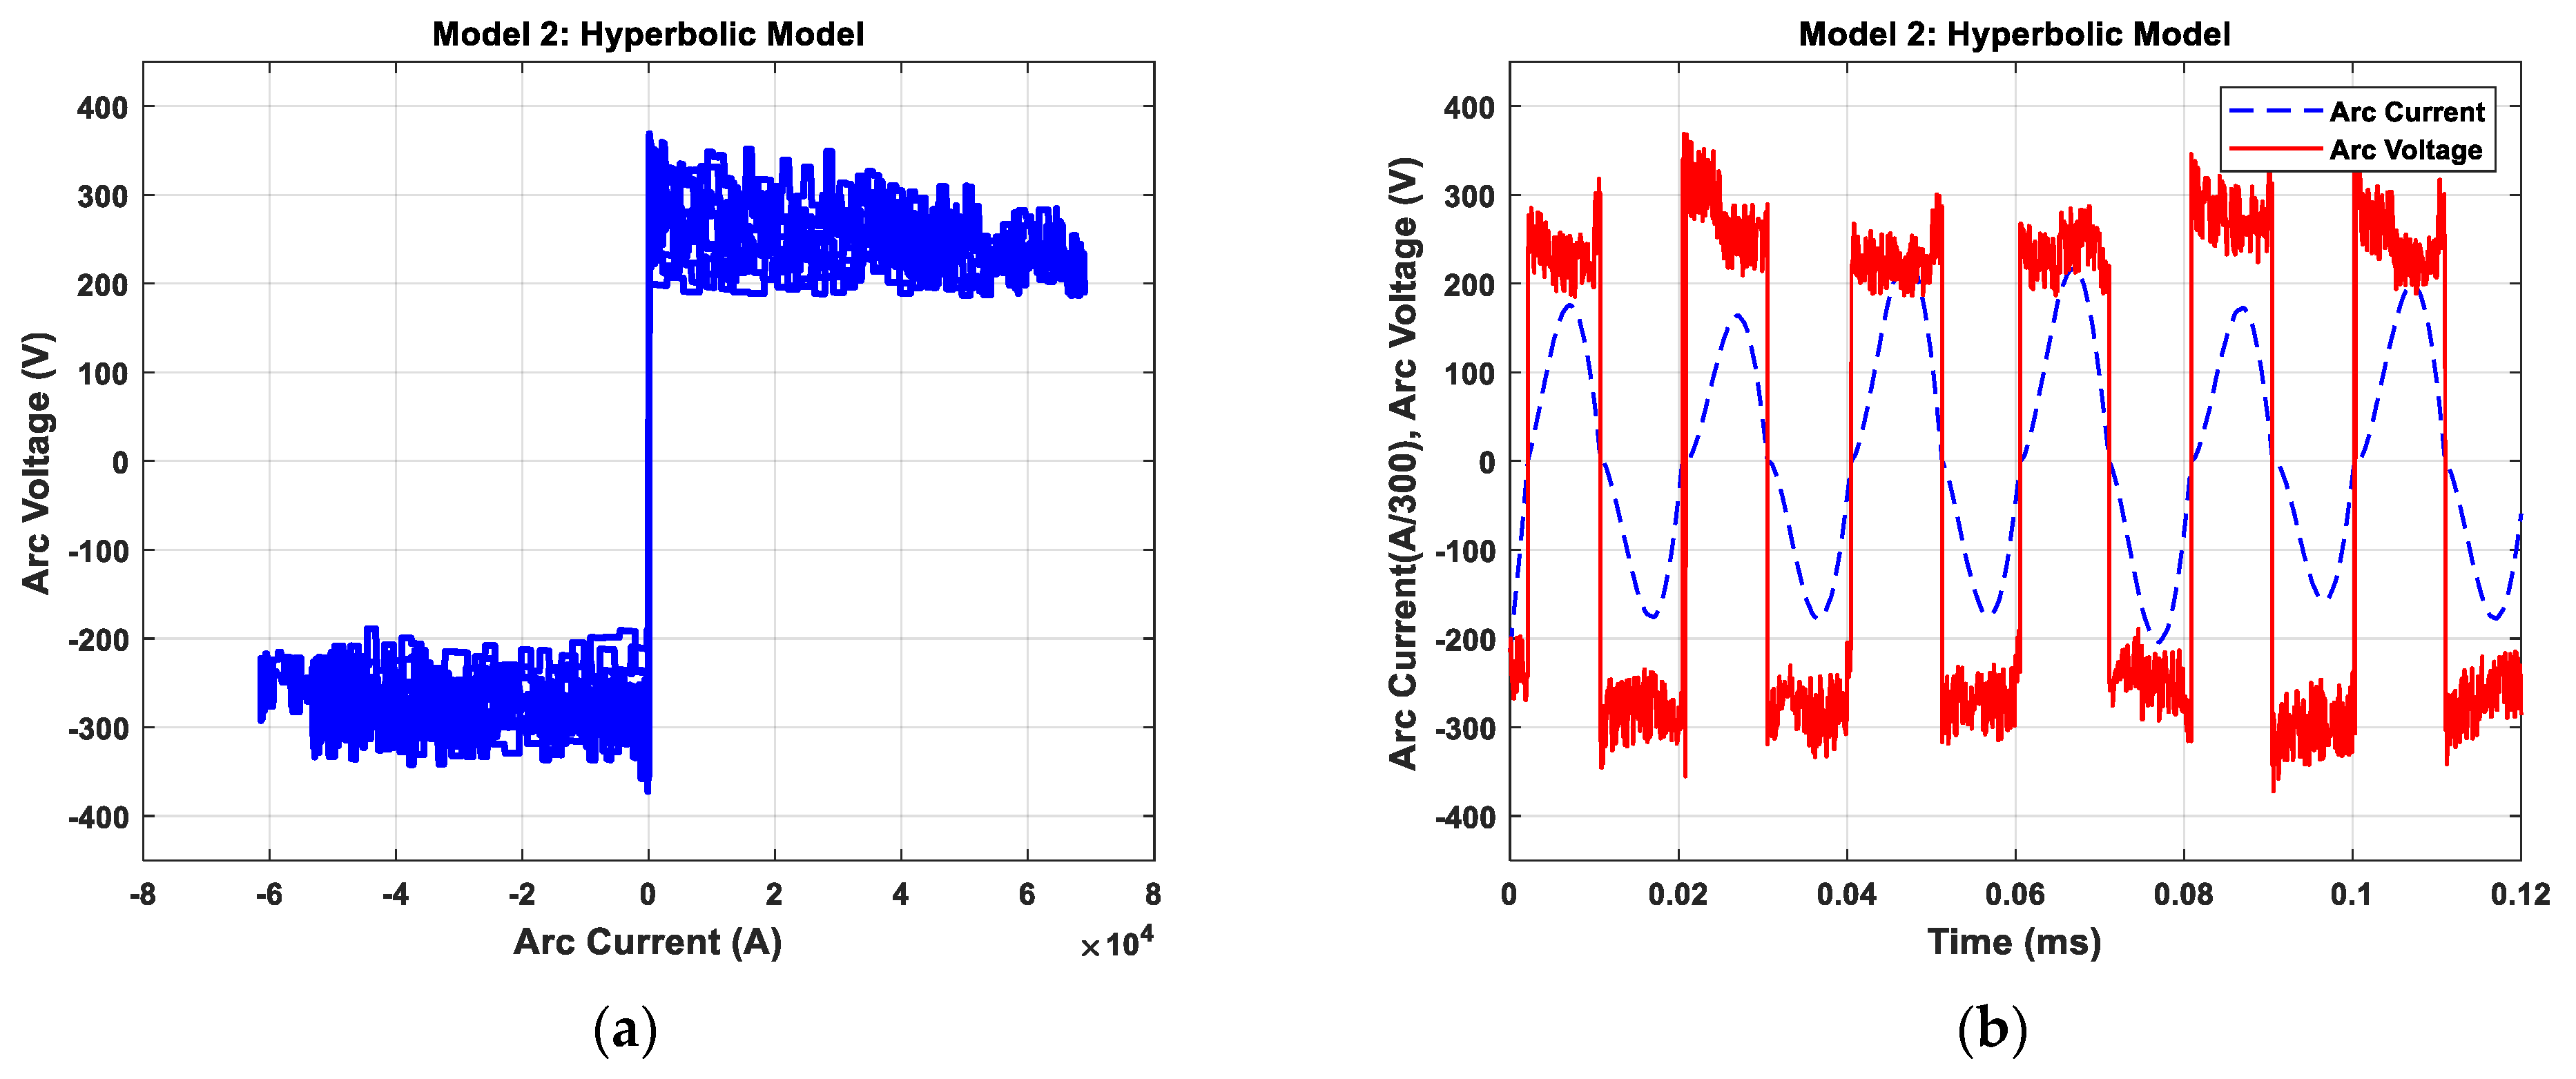
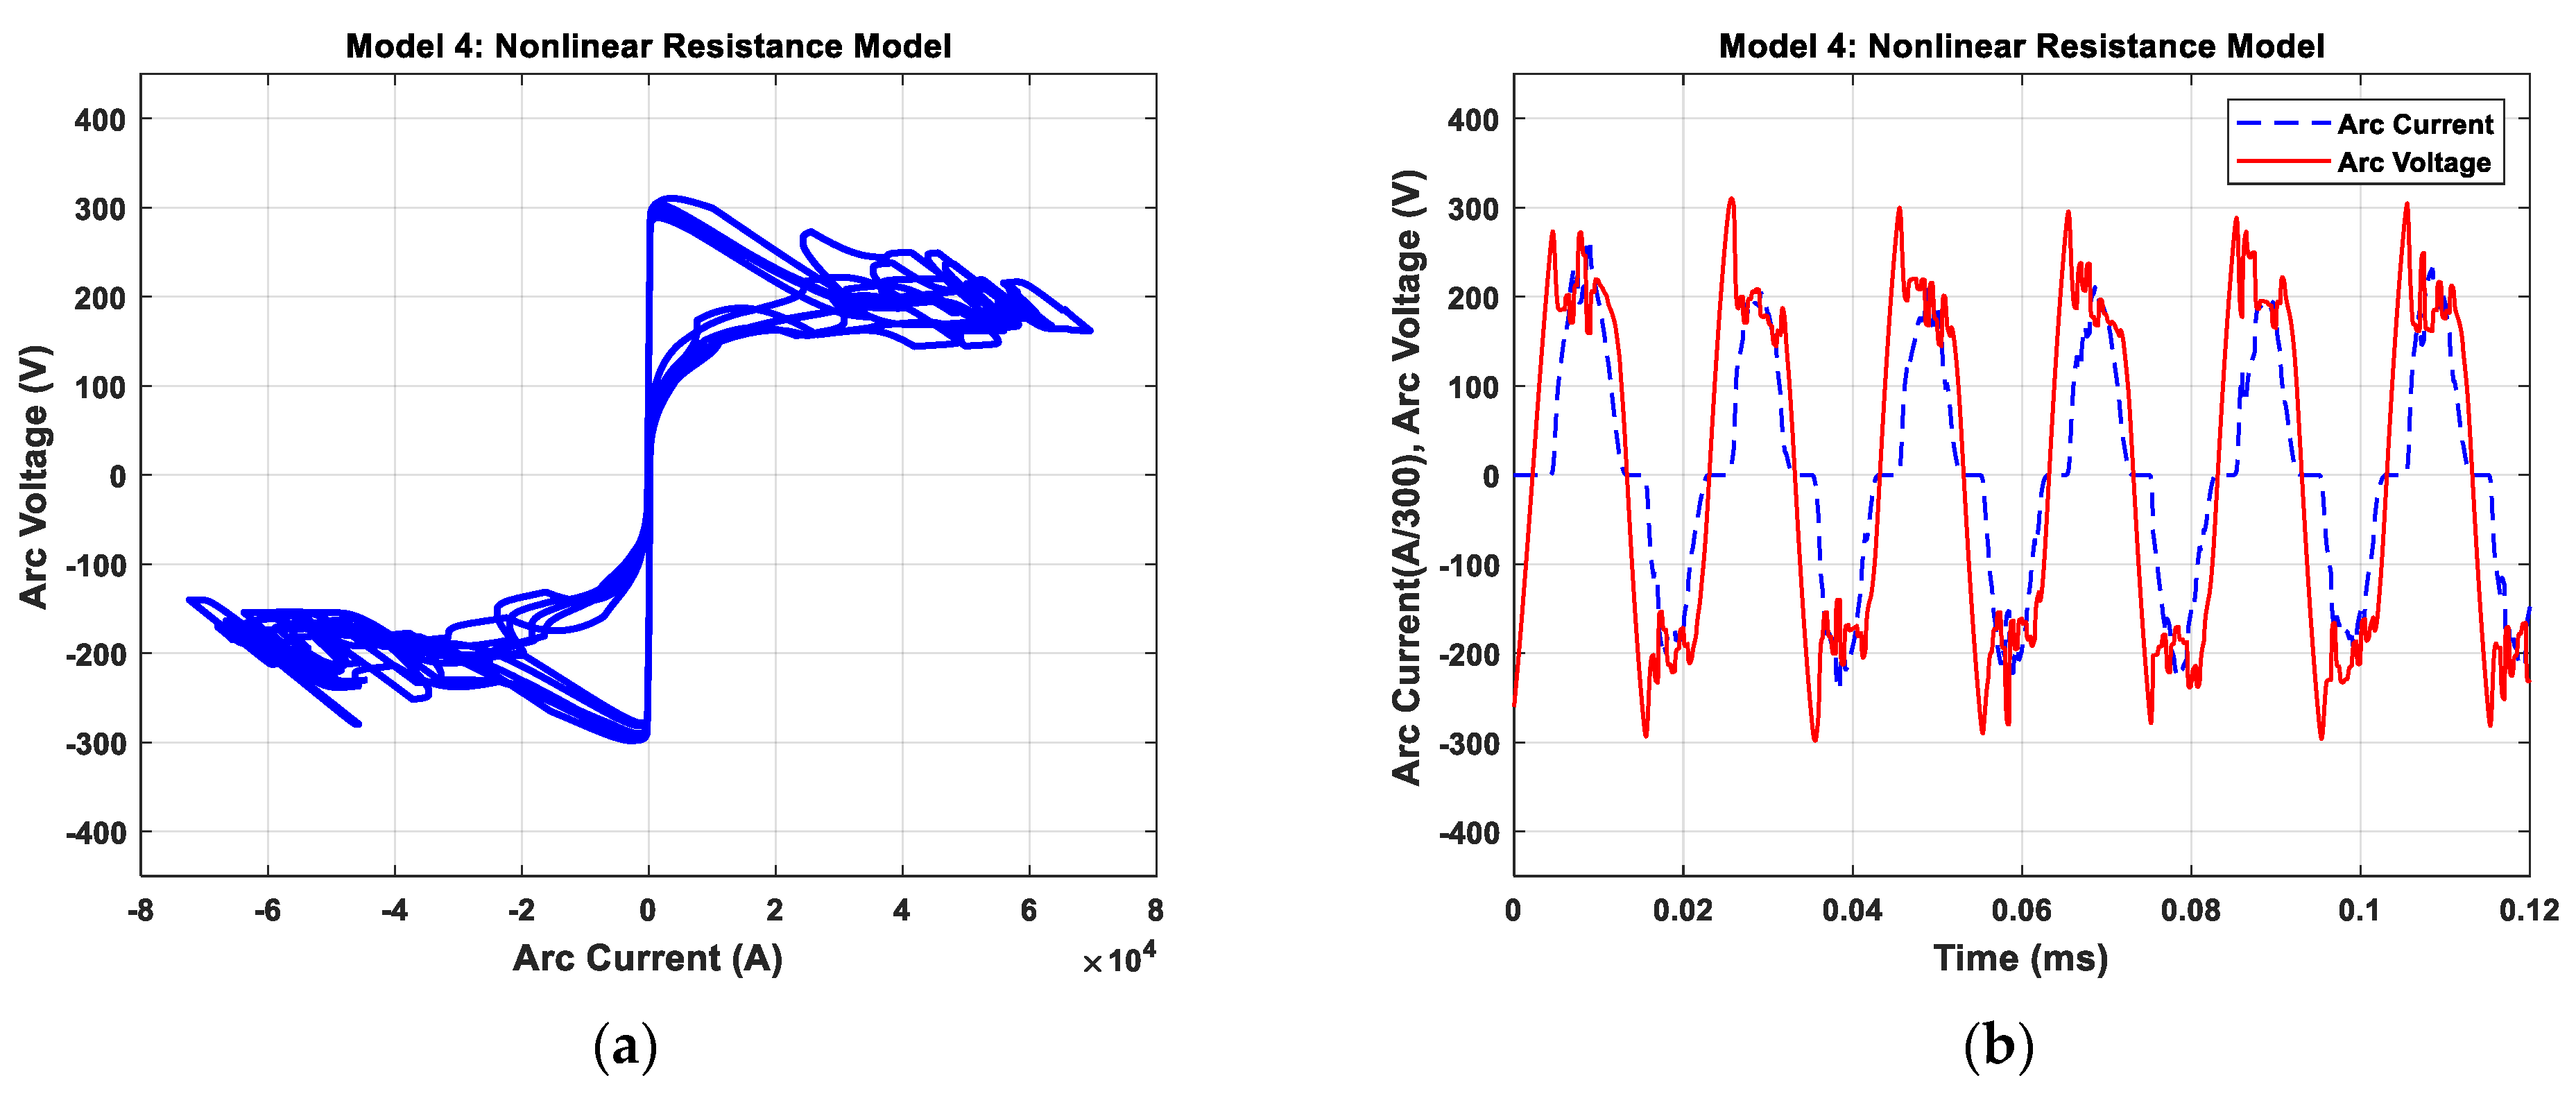
In Equation (20), V a t represents the threshold voltage which depends on the arc length, m denotes the modulation index, and N ( t ) signifies the band-limited white noise signal. The value of V a t at a constant arc length is the threshold voltage determined from the static characteristic curves. Equation (20) is integrated into the V–I static characteristic model that defines the structural characteristics of the arc, hence determining the dynamic characteristic structure of the arc during the melting process. The flicker effect of the arc melting process as modeled for the exponential model (Figure 17), the hyperbolic model (Figure 18), the exponential–hyperbolic model (Figure 19), the nonlinear resistance model (Figure 20), and the proposed model (Figure 21) are presented below.
The exponential model (Figure 17) provides a basic representation but lacks accuracy in capturing rapid arc fluctuations. The hyperbolic model (Figure 18) improves performance at high currents but deviates in low-current conditions. The exponential–hyperbolic model (Figure 19) refines this approach, offering better transient behavior but still has limitations in dynamic conditions. The nonlinear resistance model (Figure 20) accounts for nonlinear effects, improving accuracy across a wider range, yet struggles with high-frequency flicker variations. By contrast, the proposed model (Figure 21), incorporating the modified Heidler function and double S-curves, optimized via the GWO algorithm, demonstrates more accurate performance in replicating experimental results. It effectively adapts to arc length variations and transient behaviors, making it a more reliable model for characterizing dynamic EAF operations.

4.3. Harmonic Contents of Arc Models

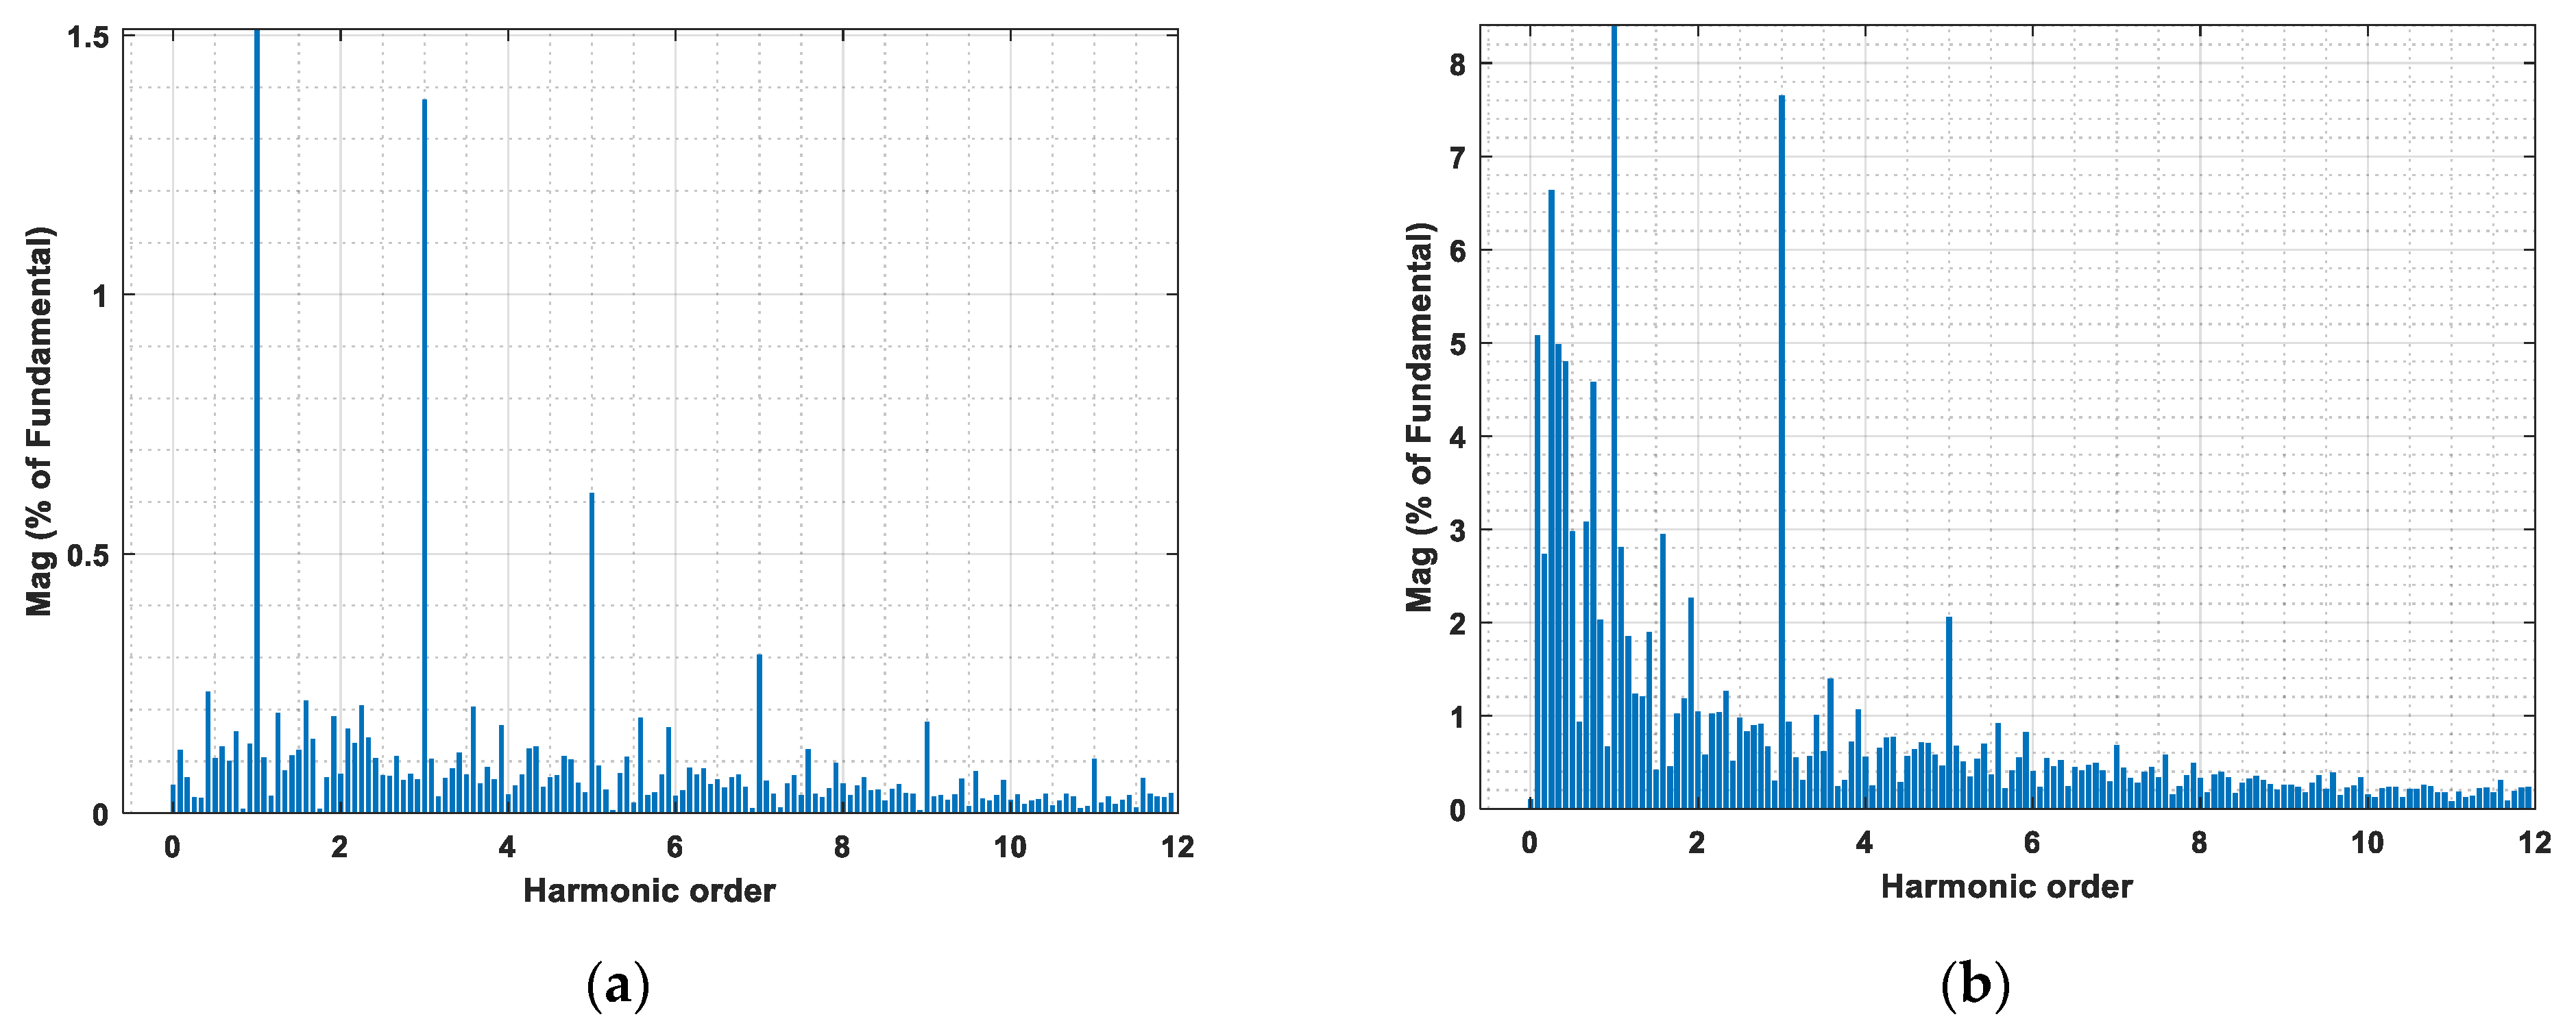
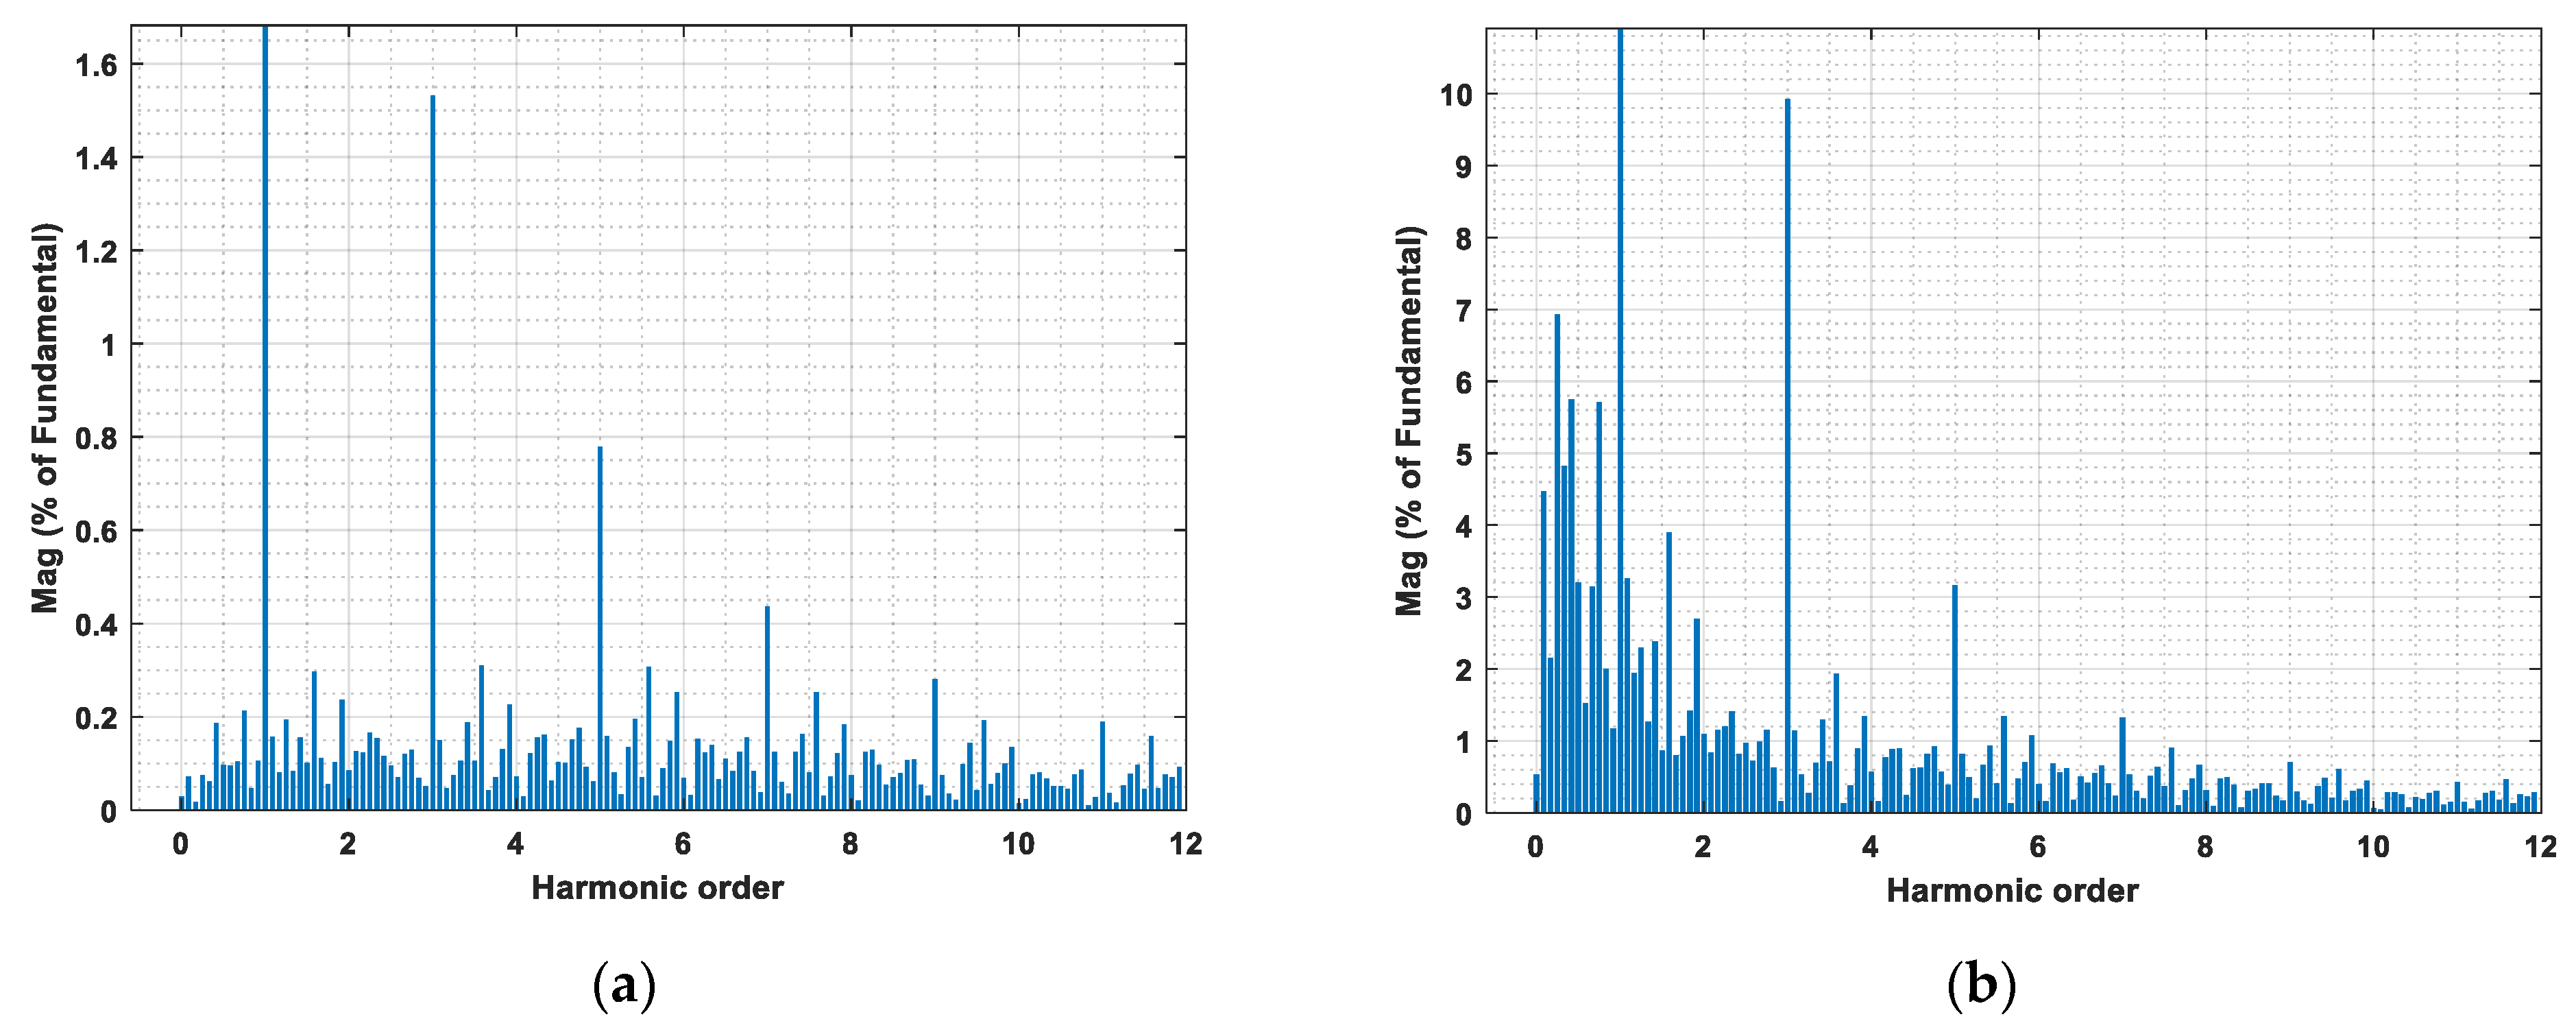
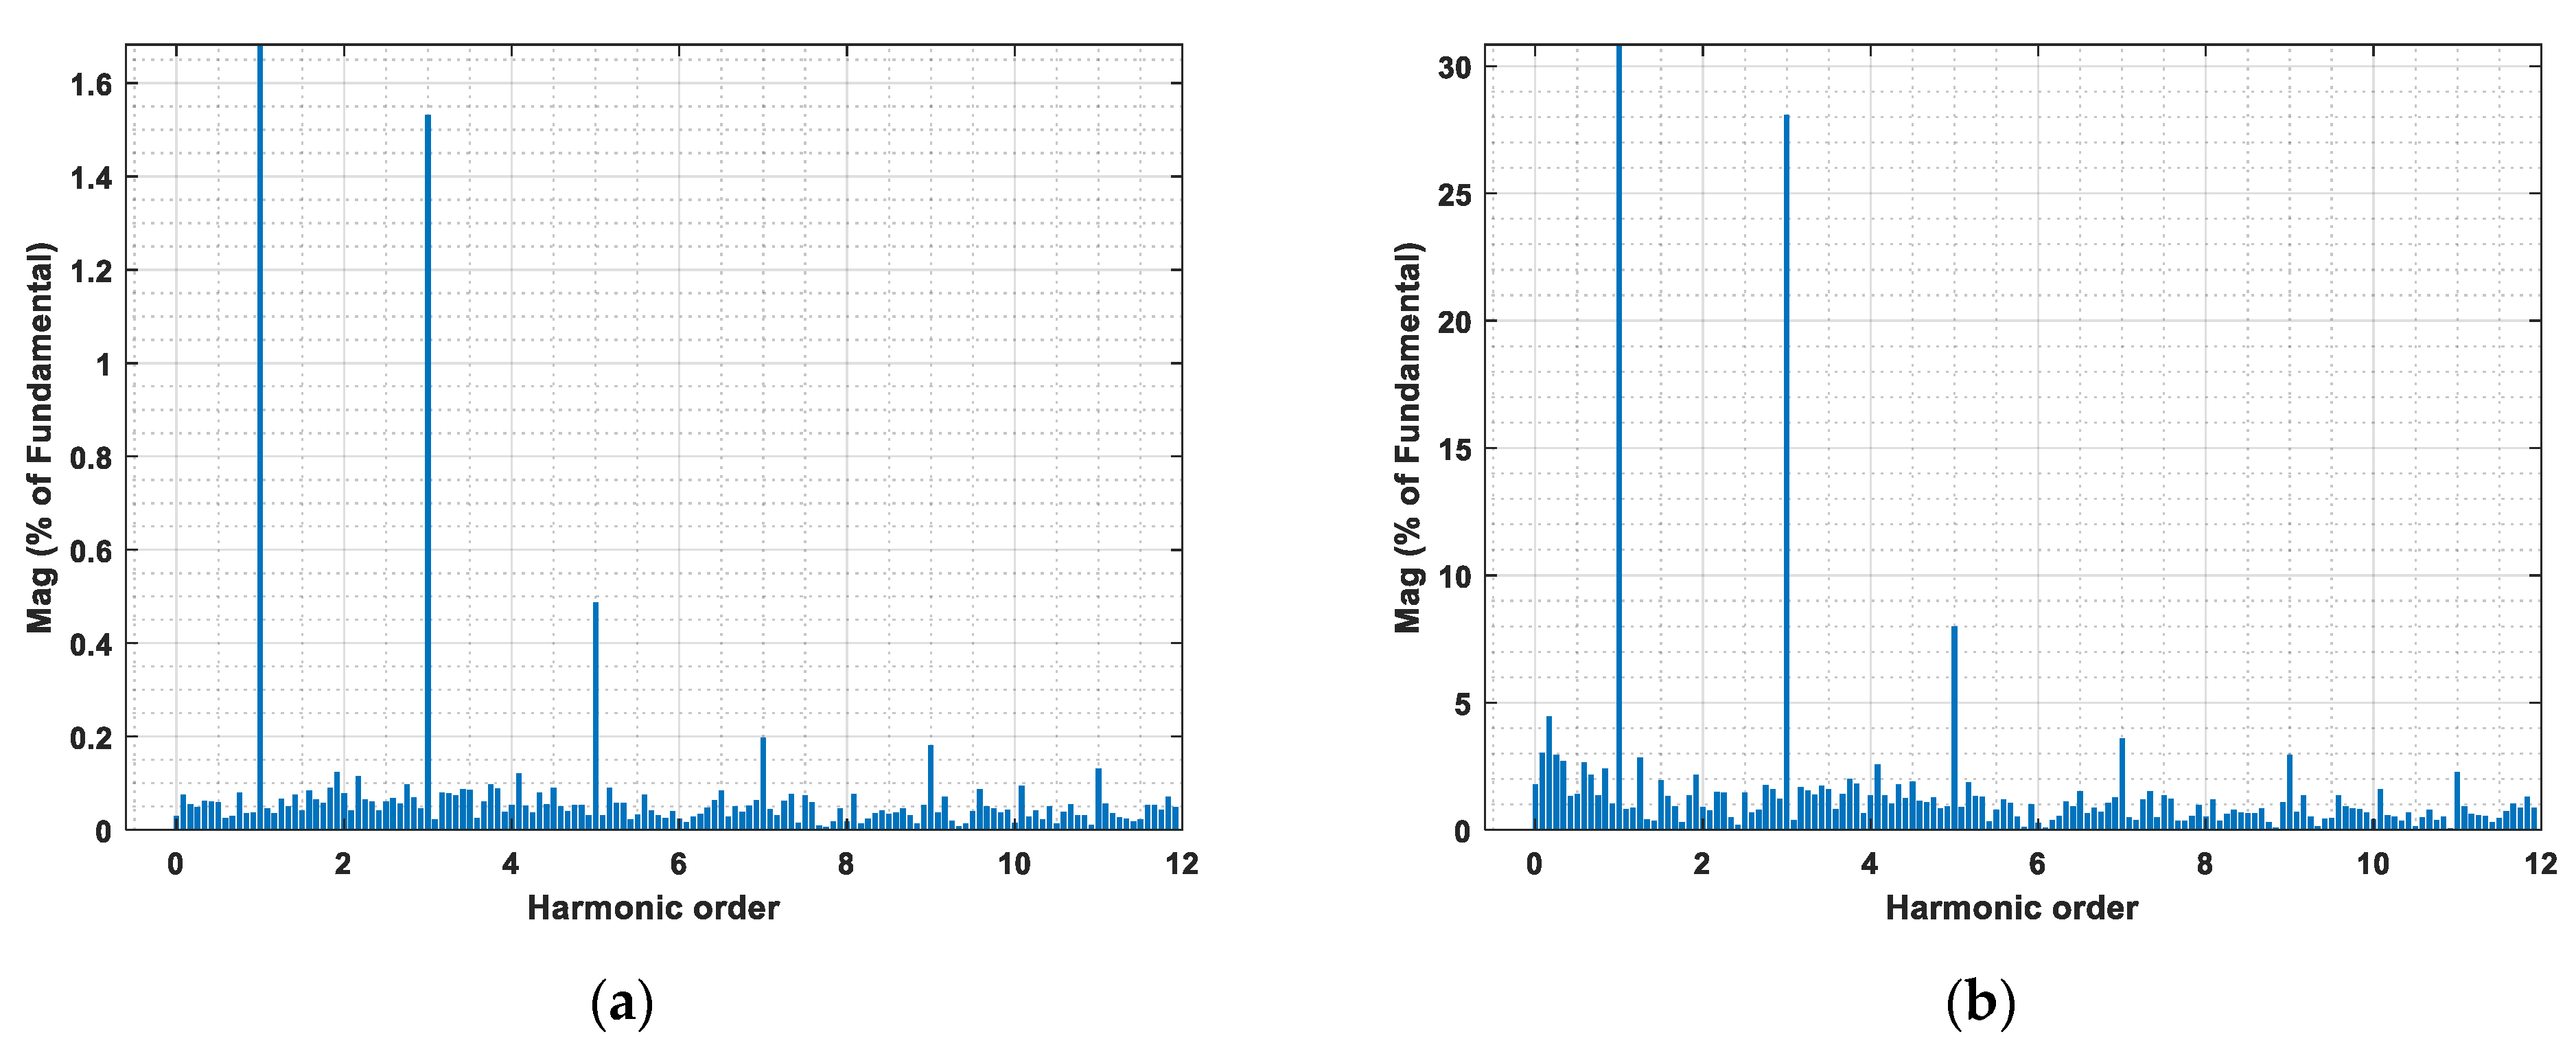
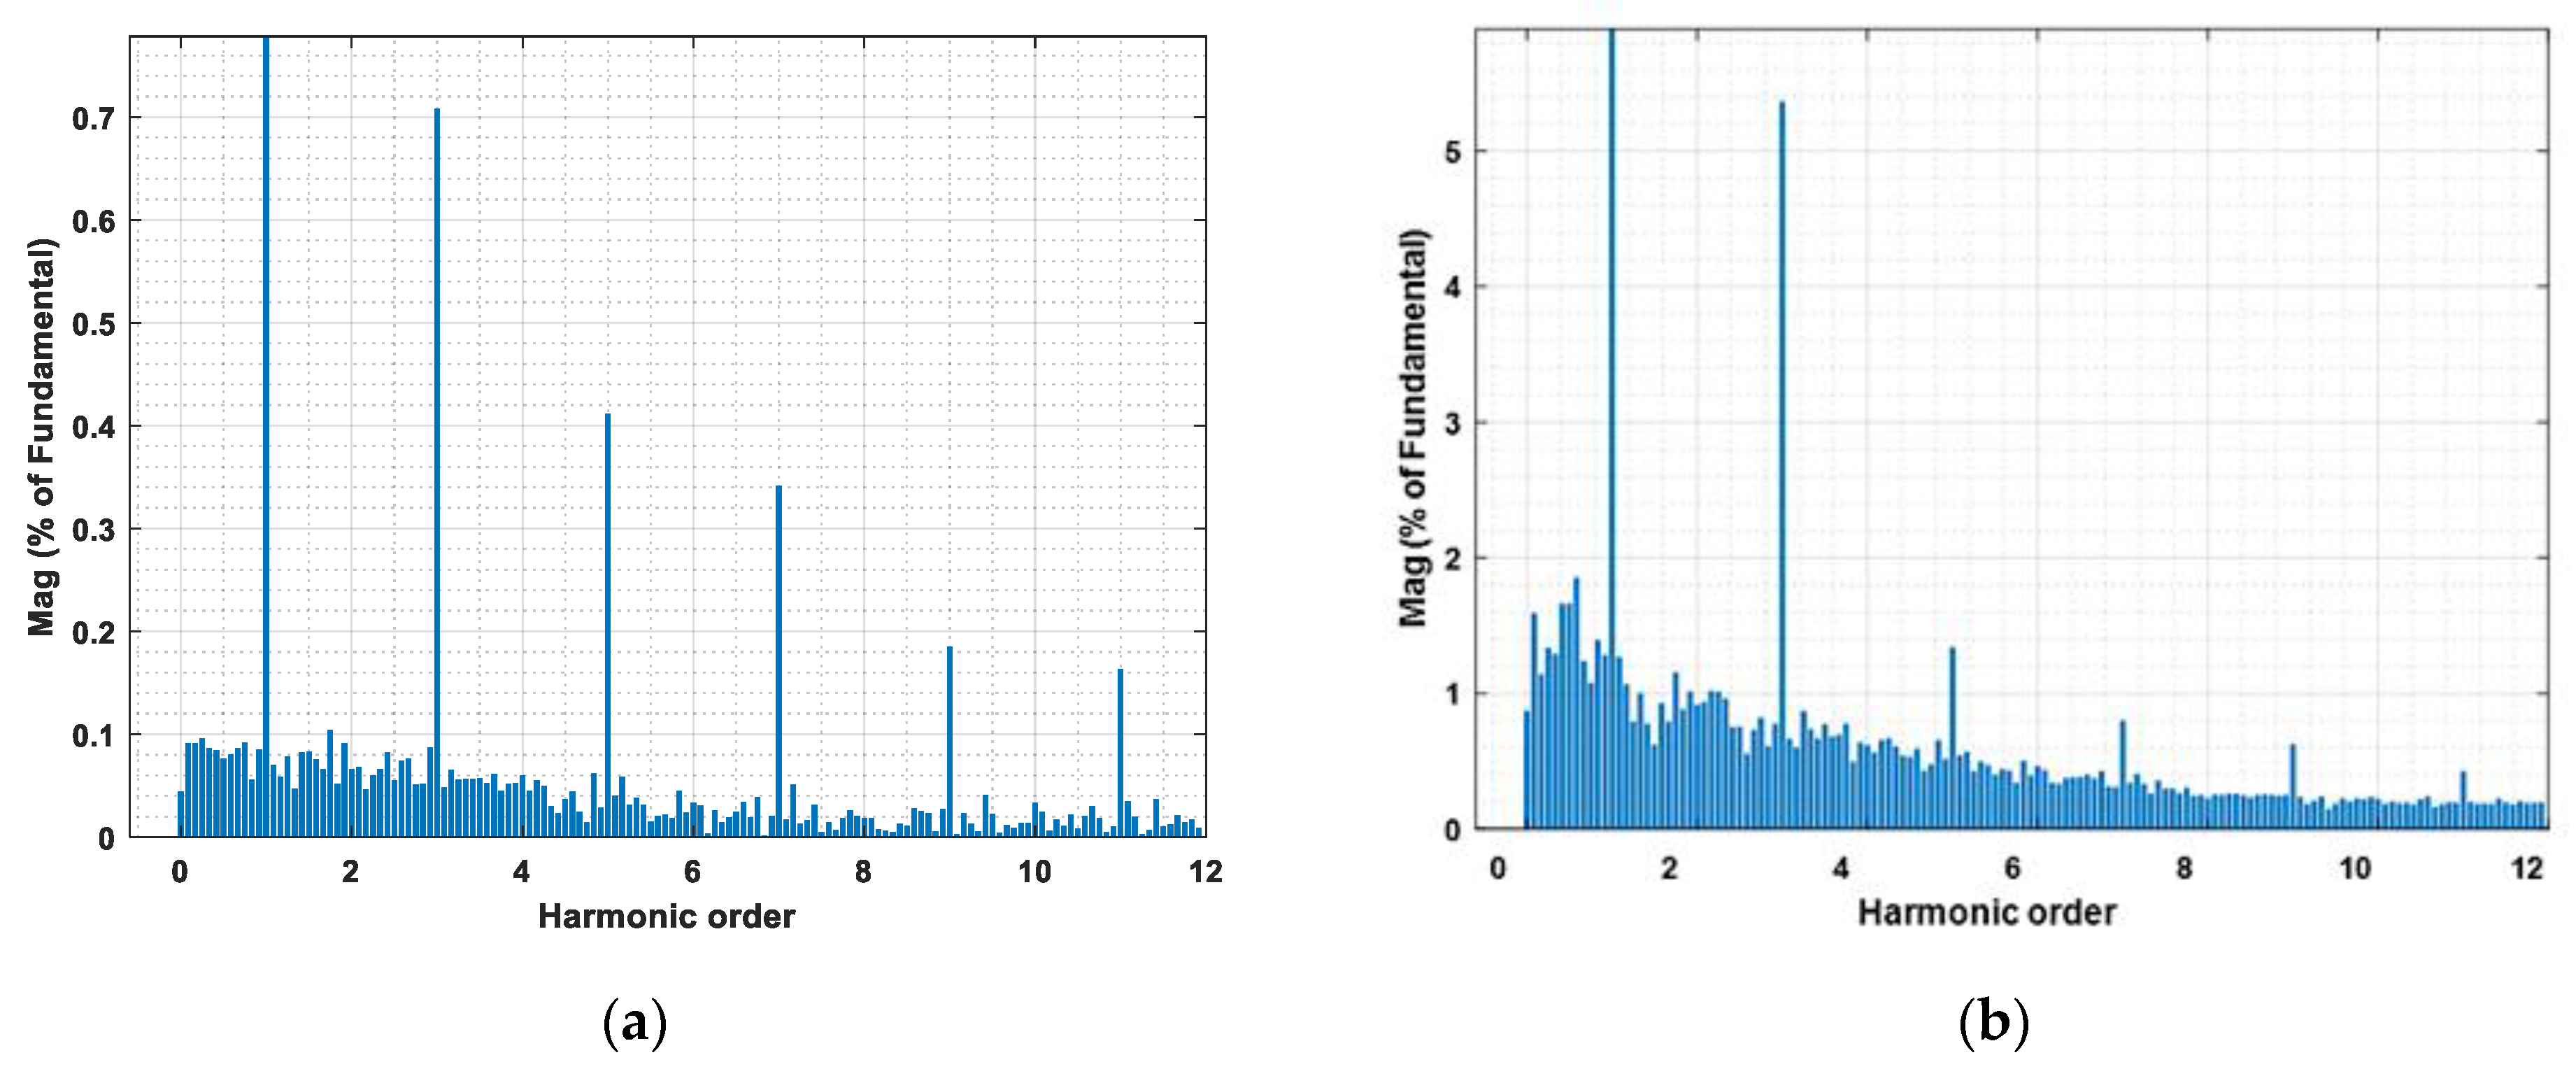
This study analyzes the harmonic content of different arc models, including the exponential model (Figure 22), the hyperbolic model (Figure 23), the exponential–hyperbolic model (Figure 24), the nonlinear resistance model (Figure 25), the proposed model (Figure 26), and real-time measurements (Figure 27). This analysis was conducted at the point of common coupling (PCC) using a fast Fourier transform (FFT) to evaluate current and voltage harmonics.
The FFT spectra for voltage harmonics at the PCC are presented in Figure 22a, Figure 23a, Figure 24a, Figure 25a, Figure 26a and Figure 27a, while the FFT spectra for current harmonics are presented in Figure 22b, Figure 23b, Figure 24b, Figure 25b, Figure 26b and Figure 27b. The harmonic values derived from the FFT spectra are summarized in Table 2 for voltage harmonics and Table 3 for current harmonics.
Upon examining the voltage harmonic results in Table 2, it is evident that the hyperbolic model fails to accurately determine the total voltage harmonic distortion (THD). In all models, excluding the proposed model, the third voltage harmonic significantly exceeds the allowable limit. The proposed model provides a more accurate characterization of voltage harmonics, demonstrating a closer match to real-time measurement data across multiple harmonic orders, including the second, third, fifth, and seventh harmonics, rather than focusing solely on the THD. While Model 3 produces a THD value that is slightly closer to the actual measurement, its harmonic distribution deviates significantly from the real-time data, limiting its practical applicability in a power quality analysis.
Similarly, from an analysis of the current FFT spectrum and the data in Table 3, it is evident that the current harmonics derived from the nonlinear resistance model (Model 4) significantly exceed the actual values. The harmonic components derived from the exponential model (Model 1), the hyperbolic model (Model 2), and the exponential–hyperbolic model (Model 3) yield total THD values that closely approximate the real-time measured THD value. Nonetheless, for basic harmonic components, the values do not yield the resultant harmonic current values.
The proposed model demonstrates better compatibility with the measured data, particularly in representing harmonic components. It achieves improved performance in current harmonics, particularly in the third harmonic content of the current spectrum, which is a critical factor in power system stability. Additionally, it exhibits lower deviation in higher-order harmonics, which is critical for accurately evaluating arc furnace behavior. The THD for the voltage is reduced to 2.34%, closely aligning with the real-time measured value of 2.30%, while the THD for the current is lowered to 11.40%, compared to 13.76% in real-time measurements. However, its total current harmonic distortion deviates from the real value due to the SVC system in real-time applications, which amplifies the intermediate harmonics between the fundamental and second harmonic ranges. Overall, the results indicate that the proposed model for the EAF outperforms existing time-domain methods in accurately analyzing the current and voltage harmonics in arc furnaces, making it a more reliable tool for power quality assessment.
The results show that the proposed model significantly reduces voltage and current harmonic distortion compared to the existing models.
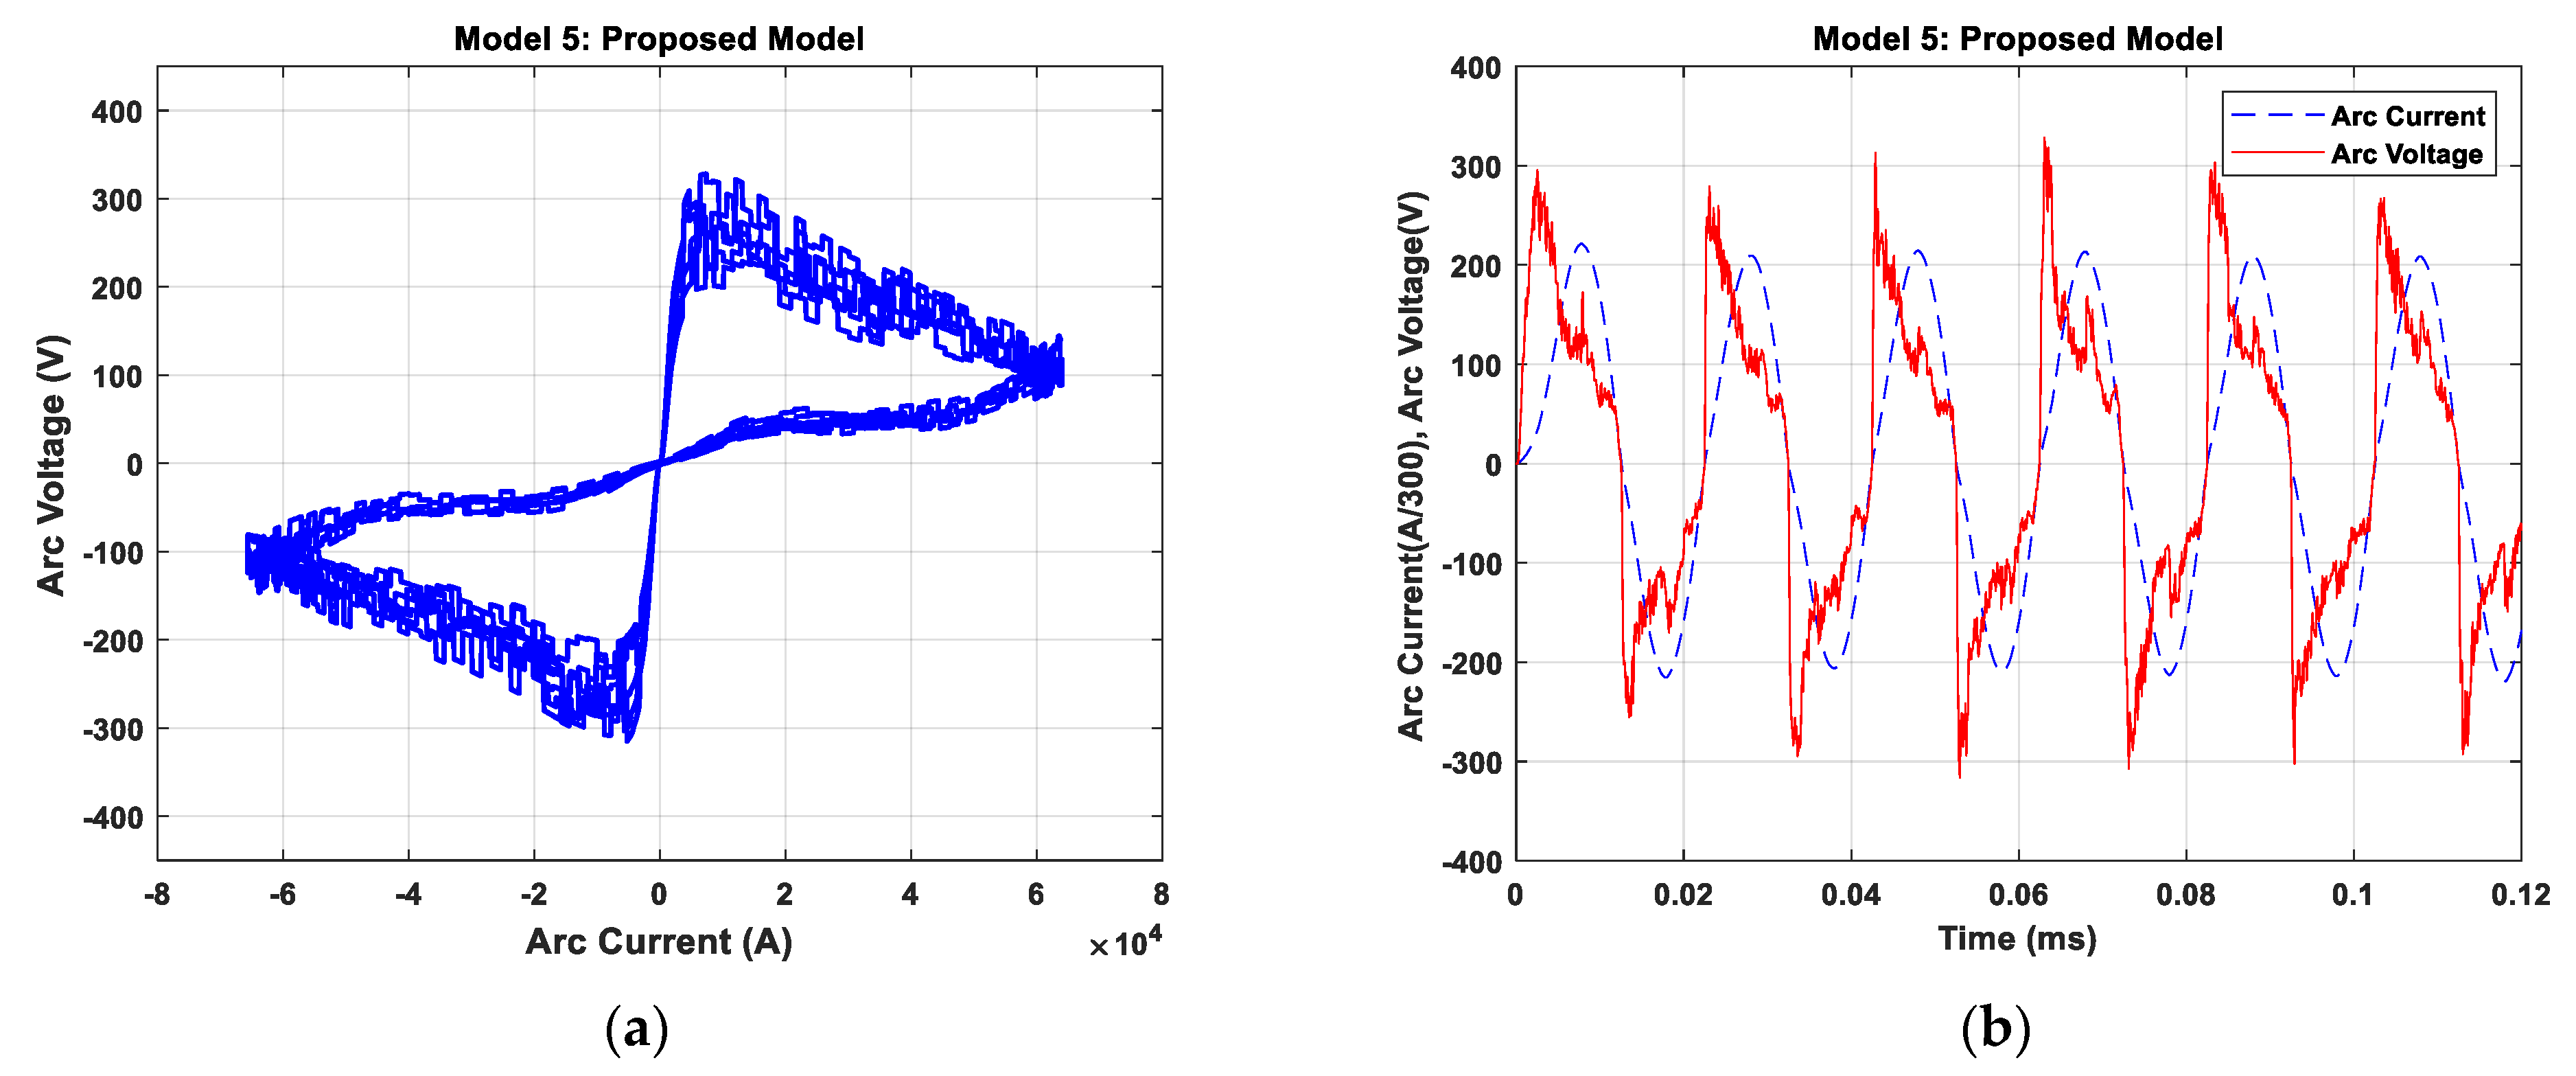
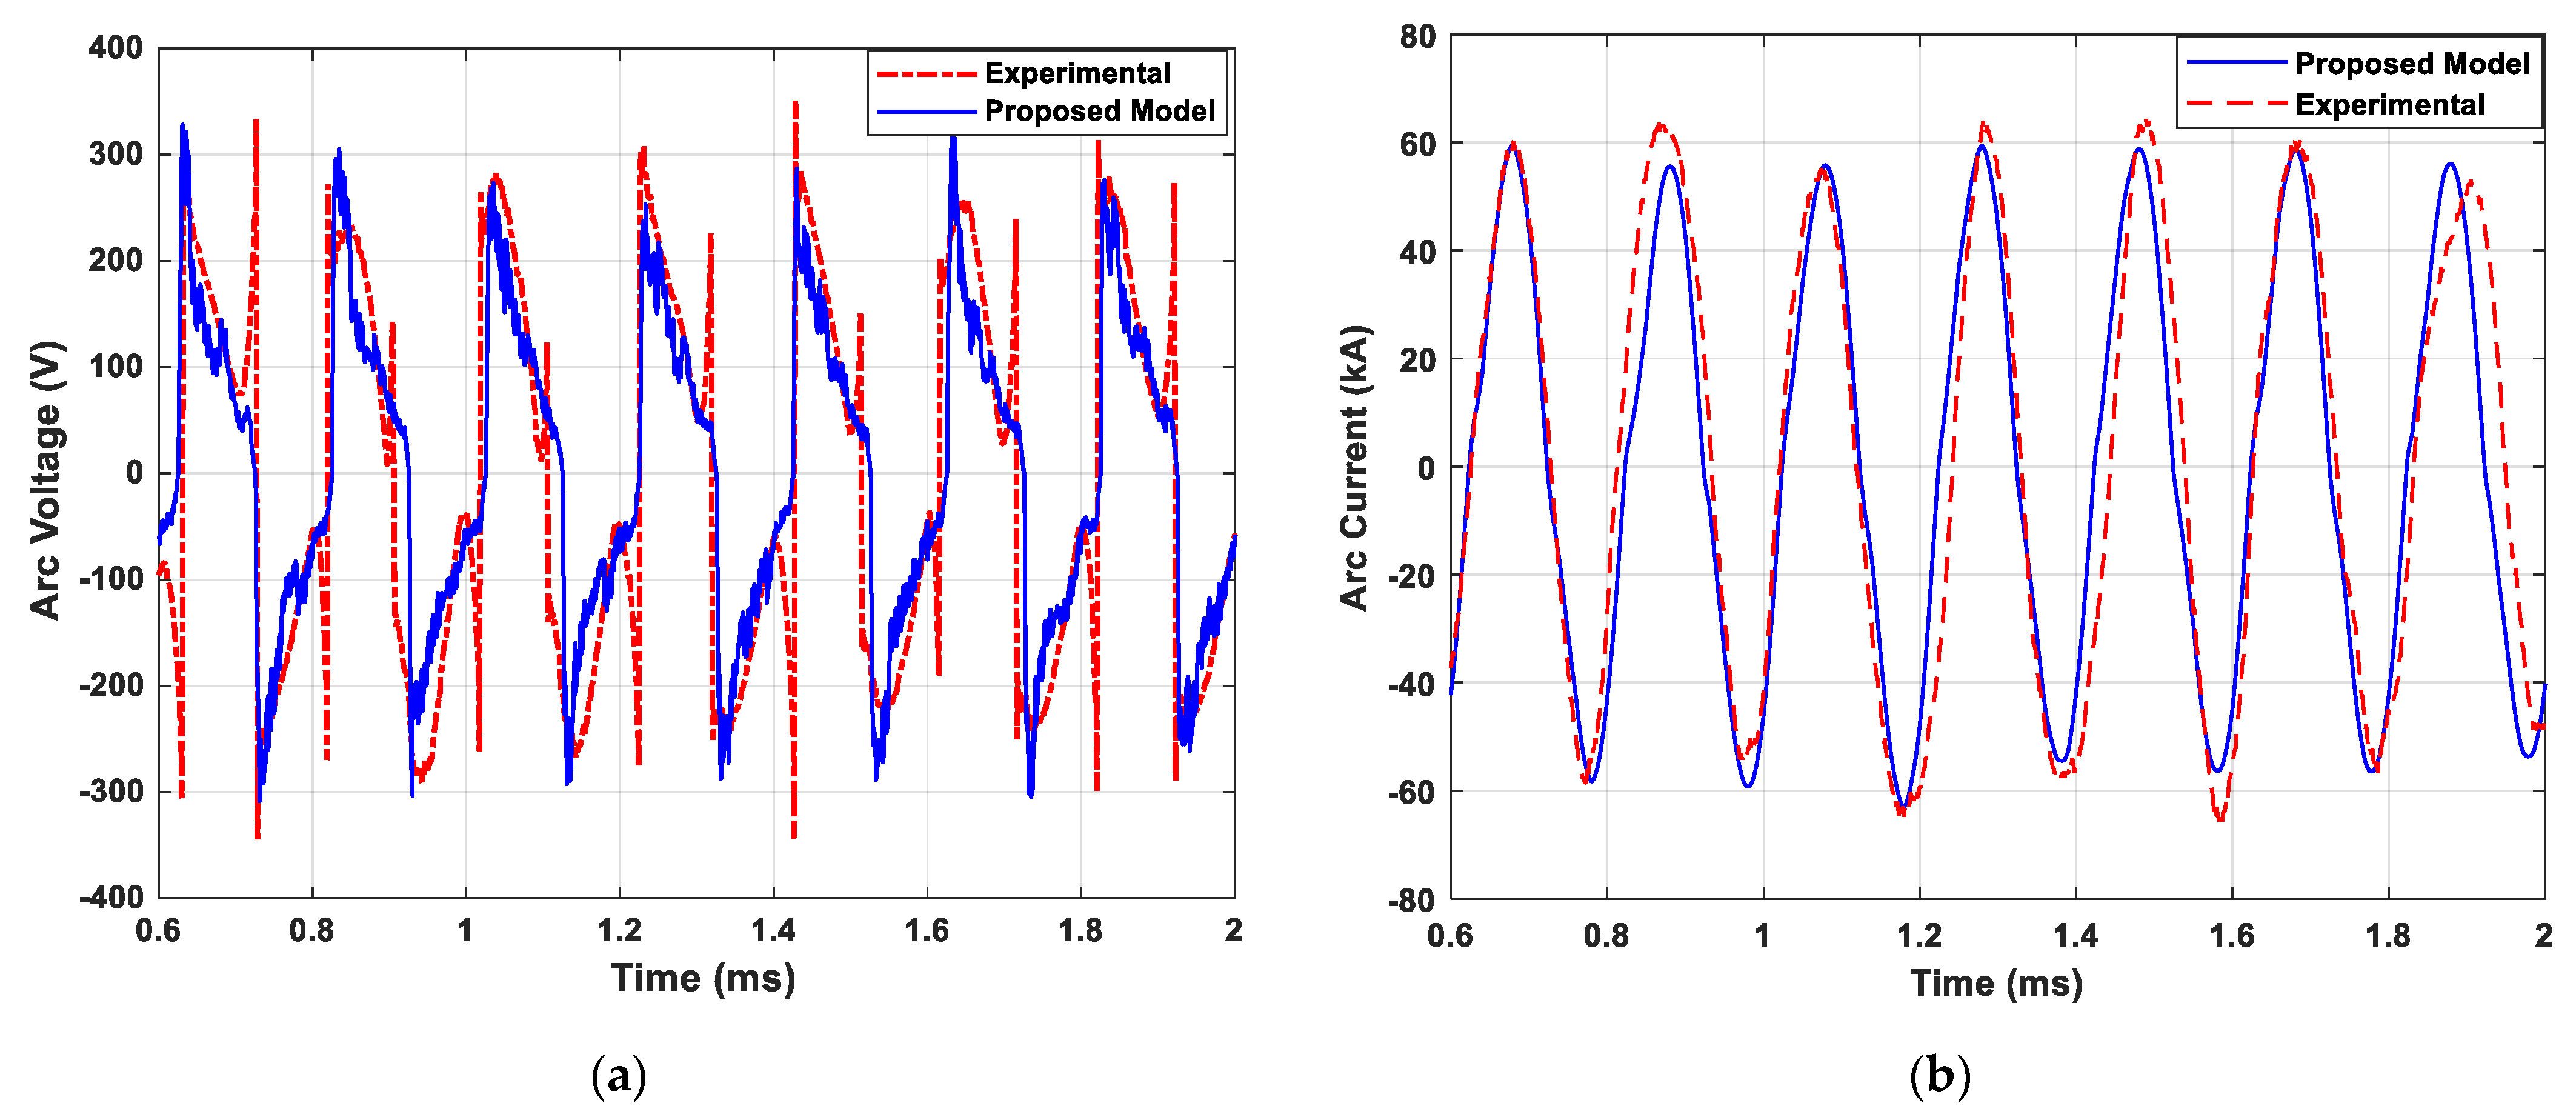
The proposed mathematical model can be effectively applied to an analysis of the harmonic effects induced by EAFs. The objective of visually comparing the arc voltage and current waveforms generated by the model is illustrated in Figure 28a and Figure 28b, respectively.
The model aims to illustrate the alignment between the arc current and voltage variations with the actual measurement data, as depicted in the images. The novel introduced mathematical model can provide a more accurate characterization of the arc current behavior and enables a detailed analysis of the harmonic effects produced by arc furnaces.

5. Conclusions

This study presents a novel mathematical methodology based on field data to characterize the EAF behavior during the melting process. In contrast to existing models, the proposed mathematical model integrates polynomial curve fitting, the modified Heidler function, and double S-curves, optimized using the GWO algorithm, to accurately represent the dynamic V–I characteristics of the arc.
To assess the effectiveness of the model, its results were compared with conventional exponential, hyperbolic, exponential–hyperbolic, and nonlinear resistance models, as well as real-time measurement data. The mathematical formulation of the proposed method was developed by demonstrating that the V–I characteristic of the electric arc melting process can be represented using polynomial equations of the third- and eighth degrees via the curve-fitting method. These polynomial expressions served as a benchmark for determining the appropriate equation parameters of the model. By integrating the GWO algorithm, the model successfully enhanced accuracy in predicting arc voltage and current variations, providing a more realistic representation of the arc melting process.
The main advantage of the proposed model is its ability to more accurately characterize voltage and current fluctuations, improving the understanding of arc dynamics in EAF operations. The model effectively accounts for flicker effects, which are a crucial factor in dynamic arc behavior, making it a valuable tool for power quality analysis. The results indicate that the proposed methodology provides a more precise representation of the arc melting process compared to the exponential, hyperbolic, exponential–hyperbolic, and nonlinear resistance models existing in the literature.
Furthermore, a comparison of the harmonic components derived from the model with real-time FFT spectra demonstrates that the model is compatible with the current and voltage harmonics, highlighting its potential application in harmonic mitigation strategies for EAF systems.
Additionally, the proposed methodology offers a versatile framework for evaluating power system disturbances, as it can be used to analyze harmonic distortion, voltage fluctuations, and arc stability. Although this methodology is specifically designed for the melting phase, it can be adapted to develop a mathematical model for other EAF operational stages using alternative mathematical frameworks.

Author Contributions

Conceptualization, M.Ş.; Methodology, M.Ş.; Software, E.Ü. and A.A.; Formal analysis, A.A.; Resources, A.A.; Data curation, M.Ş.; Writing—original draft, M.Ş. and E.Ü.; Writing—review & editing, M.D.; Supervision, M.D. All authors have read and agreed to the published version of the manuscript.

Funding

This research received no external funding.

Institutional Review Board Statement

Not applicable.

Informed Consent Statement

Not applicable.

Data Availability Statement

The original contributions presented in this study are included in the article. Dataset available on request from the corresponding author.

Acknowledgments

We would like to express our sincere gratitude to SIDEMIR and TEİAŞ for their valuable support during the data collection process.

Conflicts of Interest

The authors declare no conflict of interest.

Abbreviations

The following abbreviations are used in this manuscript:
EAFElectric arc furnace
FFTFast Fourier transform
GWOGrey wolf optimization algorithm
IFInduction furnaces
PPCPoint of common coupling
SVCStatic VAR compensator
THDTotal harmonic distortion

References

  1. Zhao, C.; Jiang, Q.; Liu, D. Flexible Power Supply System of AC Electric Arc Furnace. J. Mod. Power Syst. Clean Energy 2023, 11, 622–633. [Google Scholar] [CrossRef]
  2. Torquato, M.F.; Martinez-Ayuso, G.; Fahmy, A.A.; Sienz, J. Multi-objective optimization of electric arc furnace using the non-dominated sorting genetic algorithm II. IEEE Access 2021, 9, 149715–149731. [Google Scholar] [CrossRef]
  3. Seker, M.; Memmedov, A.; Huseyinov, R.; Kockanat, S. Power Quality Measurementand Analysis in Electric Arc Furnace for Turkish Electricity Transmission System. Elektron. ir Elektrotechnika 2017, 23, 25–33. [Google Scholar] [CrossRef]
  4. Rao, K.R.; Karsiti, M.N. Optimal Design of a Arc Furnace Transformer by Intelligent Evolutionary Methods. Electr. Power Energy Syst. 2012, 43, 1056–1062. [Google Scholar] [CrossRef]
  5. AMakarov, A.N.; Rybakova, V.V.; Galicheva, M.K. Electromagnetism and the Arc Eficiency of Electric Arc Steel Melting Furnace. J. Electromagn. Anal. Appl. 2014, 06, 184–192. [Google Scholar] [CrossRef]
  6. Marulanda-Durango, J.; Zuluaga-Ríos, C. A meta-heuristic optimization-based method for parameter estimation of an electric arc furnace model. Results Eng. 2022, 17, 100850. [Google Scholar]
  7. Klimas, M.; Grabowski, D. Application of the Deterministic Chaos in AC Electric Arc Furnace Modeling. IEEE Trans. Ind. Appl. 2024, 60, 4978–4986. [Google Scholar] [CrossRef]
  8. Klimas, M.; Grabowski, D. Application of long short-term memory neural networks for electric arc furnace modeling. Appl. Soft Comput. 2023, 145, 110574. [Google Scholar]
  9. Seker, M.; Memmedov, A. Investigation of Voltage Quality in Electric Arc Furnace with Matlab/Simulink. International J. Eng. Tech. Res. (IJERT) 2014, 2, 274–284. [Google Scholar]
  10. Babaei, Z.; Samet, H.; Jalil, M. Enhanced models with time-series coefficients used for electric arc furnace. IET Gener. Transm. Distrib. 2023, 17, 2301–2316. [Google Scholar]
  11. Gol, M.; Salor, O.; Alboyaci, B.; Mutluer, B.; Cadirci, I.; Ermis, M. A New Field-Data-Based EAF Model for Power Quality Studies. IEEE Trans. Ind. Appl. 2010, 46, 1230–1242. [Google Scholar] [CrossRef]
  12. Gök, G.; Salor, Ö.; Taplamacıoğlu, M.C. A New Electric Arc Furnace Model Based on Current Waveform Synthesis from Distributions of DFT Amplitudes and Power System Frequency. IEEE Trans. Ind. Appl. 2024, 60, 5872–5881. [Google Scholar] [CrossRef]
  13. Olczykowski, Z. Modeling of voltage fluctuations generated by arc furnaces. Appl. Sci. 2021, 11, 3056. [Google Scholar] [CrossRef]
  14. Seker, M. Experimental Study of Electrical Arc Furnace on Electric Network and Computer Aided Modelling. Ph.D. Thesis, Graduate School of Natural and Applied Science, Department of Electrical and Electronics Engineering, İnönü University, Malatya, Turkey, 2017. [Google Scholar]
  15. Hani, H.; Abdel-Rahman, M.A.; Ezzat, M.; Kamh, M.Z. Novel Time-Domain Modeling Approaches of Electric Arc Furnace Using Enhanced Cassie-Mayr and ARMAX Models. In Proceedings of the 2023 24th International Middle East Power System Conference (MEPCON), Mansoura, Egypt, 19–21 December 2023; IEEE: New York, NY, USA, 2023; pp. 1–6. [Google Scholar] [CrossRef]
  16. Hani, H.; Abdel-Rahman, M.A.; Ezzat, M.; Kamh, M.Z. Estimation and Analysis of the Electric Arc Furnace Model Coefficients. IEEE Trans. Power Deliv. 2022, 37, 4956–4967. [Google Scholar] [CrossRef]
  17. Gomez, A.A.; Durango, J.J.M.; Mejia, A.E. Electric Arc Furnace Modelling for Power Quality Analysis. In Proceedings of the IEEE ANDESCON Conference, Bogota, Colombia, 15–17 September 2010; pp. 1–6. [Google Scholar] [CrossRef]
  18. Babaei, Z.; Samet, H.; Jalil, M. An innovative approach considering active power and harmonics for modeling the electric arc furnace along with analyzing time-varying coefficients based on ARMA models. Int. J. Electr. Power Energy Syst. 2023, 153, 109377. [Google Scholar] [CrossRef]
  19. Chittora, P.; Singh, A.; Singh, M. Modelling and Analysis of Power Quality Problems in Electric Arc Furnace. In Proceedings of the Annual IEEE India Conference (INDICON), New Delphi, India, 17–20 December 2015; pp. 1–6. [Google Scholar] [CrossRef]
  20. Bhonsle, D.C.; Kelkar, R.B. Analyzing Power Quality Issue in Electric Arc Furnace by Modelling. Energy 2016, 115, 830–839. [Google Scholar] [CrossRef]
  21. Balouji, E.; Salor, O.; McKelvey, T. Deep Learning Based Predictive Compensation of Flicker, Voltage Dips, Harmonics and Interharmonics in Electric Arc Furnaces. IEEE Trans. Ind. Appl. 2022, 58, 4214–4224. [Google Scholar] [CrossRef]
  22. Balouji, E.; Bäckström, K.; McKelvey, T.; Salor, Ö. Deep-Learning-Based Harmonics and Interharmonics Predetection Designed for Compensating Significantly Time-Varying EAF Currents. IEEE Trans. Ind. Appl. 2020, 56, 3250–3260. [Google Scholar] [CrossRef]
  23. Golestani, S.; Samet, H. Generalised cassie-mary electric arc furnace models. IET Gener. Transm. Distrib. 2016, 10, 3364–3373. [Google Scholar] [CrossRef]
  24. Choi, S.-W.; Seo, B.-G.; Lee, E.-B. Machine learning-based tap temperature prediction and control for optimized power consumption in stainless electric arc furnaces (EAF) of steel plants. Sustainability 2023, 15, 6393. [Google Scholar] [CrossRef]
  25. Issouribehere, P.E.; Barbero, J.C.; Barbera, G.; Issouribehere, F. Compability Between Disturbance Emission and Argentinian Power Quality Regulations in Iron and Steel Industry. In Proceedings of the IEEE/PES, Transmission, & Disturbution Conference and Exhibition (TDC 2006), Caracas, Venazuela, 15–18 August 2006; pp. 1–6. [Google Scholar] [CrossRef]
  26. Mayordomo, J.; Prieto, E.; Hernandez, A.; Beites, L. Arc Furnace Characterization from an off-line Analysis of Measurement. In Proceedings of the IEEE 9th International Conference Harmonics Quality Power, Orlando, FL, USA, 1–4 October 2000; pp. 1073–1078. [Google Scholar] [CrossRef]
  27. Deaconu, S.I.; Popa, G.N.; Toma, A.I.; Topor, M. Modelling and Experimental Analysis for Modernization of 100-T EAF. IEEE Trans. Ind. Appl. 2010, 46, 2259–2266. [Google Scholar] [CrossRef]
  28. Boulet, B.; Wikston, J.; Kadar, L. The Effect of Measuring System Accuracy on Power Quality Measurements in Electric Arc Furnace. In Proceedings of the IEEE Industry Applications Society Annual Meeting, New Orleans, LA, USA, 5–9 October 1997. [Google Scholar] [CrossRef]
  29. Ozdemirci, E.; Akkaya, Y.; Boyrazoglu, B.; Buhan, S.; Terciyanli, A.; Unsar, O.; Altintas, E.; Haliloglu, B.; Acik, A.; Atalik, T.; et al. Mobile Monitoring System to take PQ Snapshots of Turkish Electricity Transmission System. In Proceedings of the IEEE Instrumentation and Measurement Technology Conference, Warsaw, Poland, 1–3 May 2007; IMTC 20079. pp. 1–6. [Google Scholar] [CrossRef]
  30. Collantes-Bellido, R.; Gomez, T. Identification and Modelling of a Three Phase Arc Furnace for Voltage Disturbance Simulation. IEEE Trans. Power Deliv. 1997, 12, 1812–1817. [Google Scholar] [CrossRef]
  31. Mokhtari, H.; Hejri, M. A New Three Phase Time-Domain Model for Electric Arc Furnace using Matlab. In Proceedings of the IEEE/PES Transmission and Disturbution Conference and Exhibition, Yokohoma, Japan, 6–10 October 2002; pp. 2078–2083. [Google Scholar] [CrossRef]
  32. Alonso, M.; Donsion, M.P. An Improved Time Domain Arc Furnace Model for Harmonic Analysis. IEEE Trans. Power Deliv. 2004, 19, 367–373. [Google Scholar] [CrossRef]
  33. Petersen, H.; Koch, R.; Swart, P.; Van Heerden, R. Modelling Arc Furnace Flicker Investigation Compansation Techniques. In Proceedings of the Thirtieth IAS Annual Meeting International Conference Industrial Application, (IAS, 1995), Orlando, FL, USA, 8–12 October 1995; pp. 1733–1740. [Google Scholar] [CrossRef]
  34. Schau, H.; Stade, D. Mathematical Modelling of Three Phase Arc Furnace. In Proceedings of the IEEE International Conference Harmonics in Power System, Bologna, Italy, 1994; pp. 422–428. [Google Scholar]
  35. Zheng, T.; Makram, E.; Girgis, A. Effect of Different Arc Furnace Model on Voltage Distortion. In Proceedings of the IEEE Conference Harmonics and Power Quality of Power, Athens, Greece, 14–16 October 1998; pp. 1079–1085. [Google Scholar] [CrossRef]
  36. Montanari, G.; Loggini, M.; Cavallini, A.; Pitti, L.; Zaninelli, D. Arc Furnace Model fort he Study of Flicker Compensation in Electric Network. IEEE Trans. Power Deliv. 1994, 9, 2026–2036. [Google Scholar] [CrossRef]
  37. Fenghua, W.; Zhijian, J. Application of Extended Kalman Filter to the Modelling of Electric Arc Furnace for Power Quality Issues. IEEE Trans. Ower Deliv. 2005, 10, 991–996. [Google Scholar]
  38. Pak, L.F.; Dinavachi, V. Real Time Digital Time-Varying Harmonic Modelling and Simulation Techniques. IEEE Trans. Power Deliv. 2007, 22, 1218–1227. [Google Scholar] [CrossRef]
  39. Acha, E.; Semlyen, A.; Rajakovic, N. A Harmonic Domain Computation Package for Nonlinear Problems and Its Application to Electric Arc. IEEE Trans. Power Deliv. 1990, 5, 1390–1397. [Google Scholar] [CrossRef]
  40. Emanuel, A.E.; Orr, J.A. An Improved Method of Simulation of the Arc Voltage-Current Characteristic and Quality of Power. In Proceedings of the Ninth International Conference on Harmonics and Quality of Power. Proceedings (Cat. No.00EX441), Orlando, FL, USA, 1–4 October 2000; pp. 148–150. [Google Scholar]
  41. Cano, P.E.A.; Tacca, H.E. Arc Furnace Modelling in ATP-EMTP. In Proceedings of the International Conference on Power System Transient (IPST’05), Montreal, QC, Canada, 19–23 June 2005. [Google Scholar]
  42. Seker, M.; Memmedov, A. An Experimental Approach for Understanding V–I Characteristic of Electric Arc Furnace Load. Elektron. ir Elektrotechnika 2017, 23, 30–35. [Google Scholar] [CrossRef]
  43. Seker, M.; Memmedov, A.; Huseyinov, R. The Modelling of Three Phases Electric Arc Furnace System using Matlab/SIMULINK and Examining the Harmonic Effects with FFT Analysis. In Proceedings of the International Artificial Intelligence and Data Processing Symposium (IDAP 2016), Malatya, Turkey, 17–18 September 2016. [Google Scholar]
  44. Bello, J.R. Fundamental of the Electric Arc Furnace. In Electrical Furnace Proceedings; AIME: San Ramon, CA, USA, 1971; Volume 29, pp. 219–231. [Google Scholar]
  45. Borrebach, E.J. Maximum Power Operation of Electric Arc Furnace. In Iron and Steel Engineering; AIME: San Ramon, CA, USA, 1969; Volume 46, p. 74. [Google Scholar]
  46. Pelfrey, D.L. Specşfying Arc Furnace Transformer. In Proceedings of the Electric Furnace Conference, Pittsburg, PA, USA, 9 December 1980. [Google Scholar]
  47. Kurecki, M.; Meena, N.; Shyrokykh, T.; Korobeinikov, Y.; Jarnerud Örell, T.; Voss, Z.; Sridhar, S. Recycling Perspectives of Electric Arc Furnace Slag in the United States: A Review. Steel Res. Int. 2024, 2300854. [Google Scholar] [CrossRef]
  48. Abadi, M.M.; Tang, H.; Rashidi, M.M. A Review of Simulation and Numerical Modeling of Electric Arc Furnace (EAF) and its Processes. Heliyon 2024, 10, e32157. [Google Scholar] [CrossRef]
  49. IEC-61000-4-30; Electromagnetic Compatibility (EMC)—Part 4–30: Testing and Measurement Techniques—Power Quality Measurement Methods. IEC: Geneva, Switzerland, 2015.
  50. DiGiovanni, C.; Echterhof, T. Progress Toward Biocarbon Utilization in Electric Arc Furnace Steelmaking: Current Status and Future Prospects. J. Sustain. Metall. 2024, 10, 2047–2067. [Google Scholar]
  51. Mohanty, S.; Subudhi, B.; Kumar Ray, P. A new MPPT Design Using Grey Wolf Optimization Technique for Photovoltaic System Under Partial Shading Conditions. IEEE Trans. Sustain. Energy 2016, 7, 181–188. [Google Scholar]
  52. Mirjalili, S.; Saremia, S.; Mirjalilic, B.S.M.; Coelho, L.D.S. Multi-objective Grey Wolf Optimizer: A Novel Algorithm for Multi-Criterion Optimization. Expert Syst. Appl. 2016, 47, 106–119. [Google Scholar]
  53. Şeker, M.; Çikan, M. Examining the Influence of Tower Grounding Resistance on Lightning Overvoltages for 154 kV Overhead Transmission Line with Fork Pylon Tower using ATP-EMTP. J. Inst. Sci. Technol. Iğdır Univ. 2019, 9, 1989–2001. [Google Scholar] [CrossRef]
  54. Şeker, M. Long term electricity load forecasting based on regional load model using optimization techniques: A case study. Energy Sources, Part A Recover. Util. Environ. Eff. 2021, 44, 21–43. [Google Scholar] [CrossRef]
  55. Niyayesh, M.; Uygun, Y. Predicting endpoint parameters of electric arc furnace—Based steelmaking using artificial neural network. Int. J. Adv. Manuf. Technol. 2024. [Google Scholar] [CrossRef]
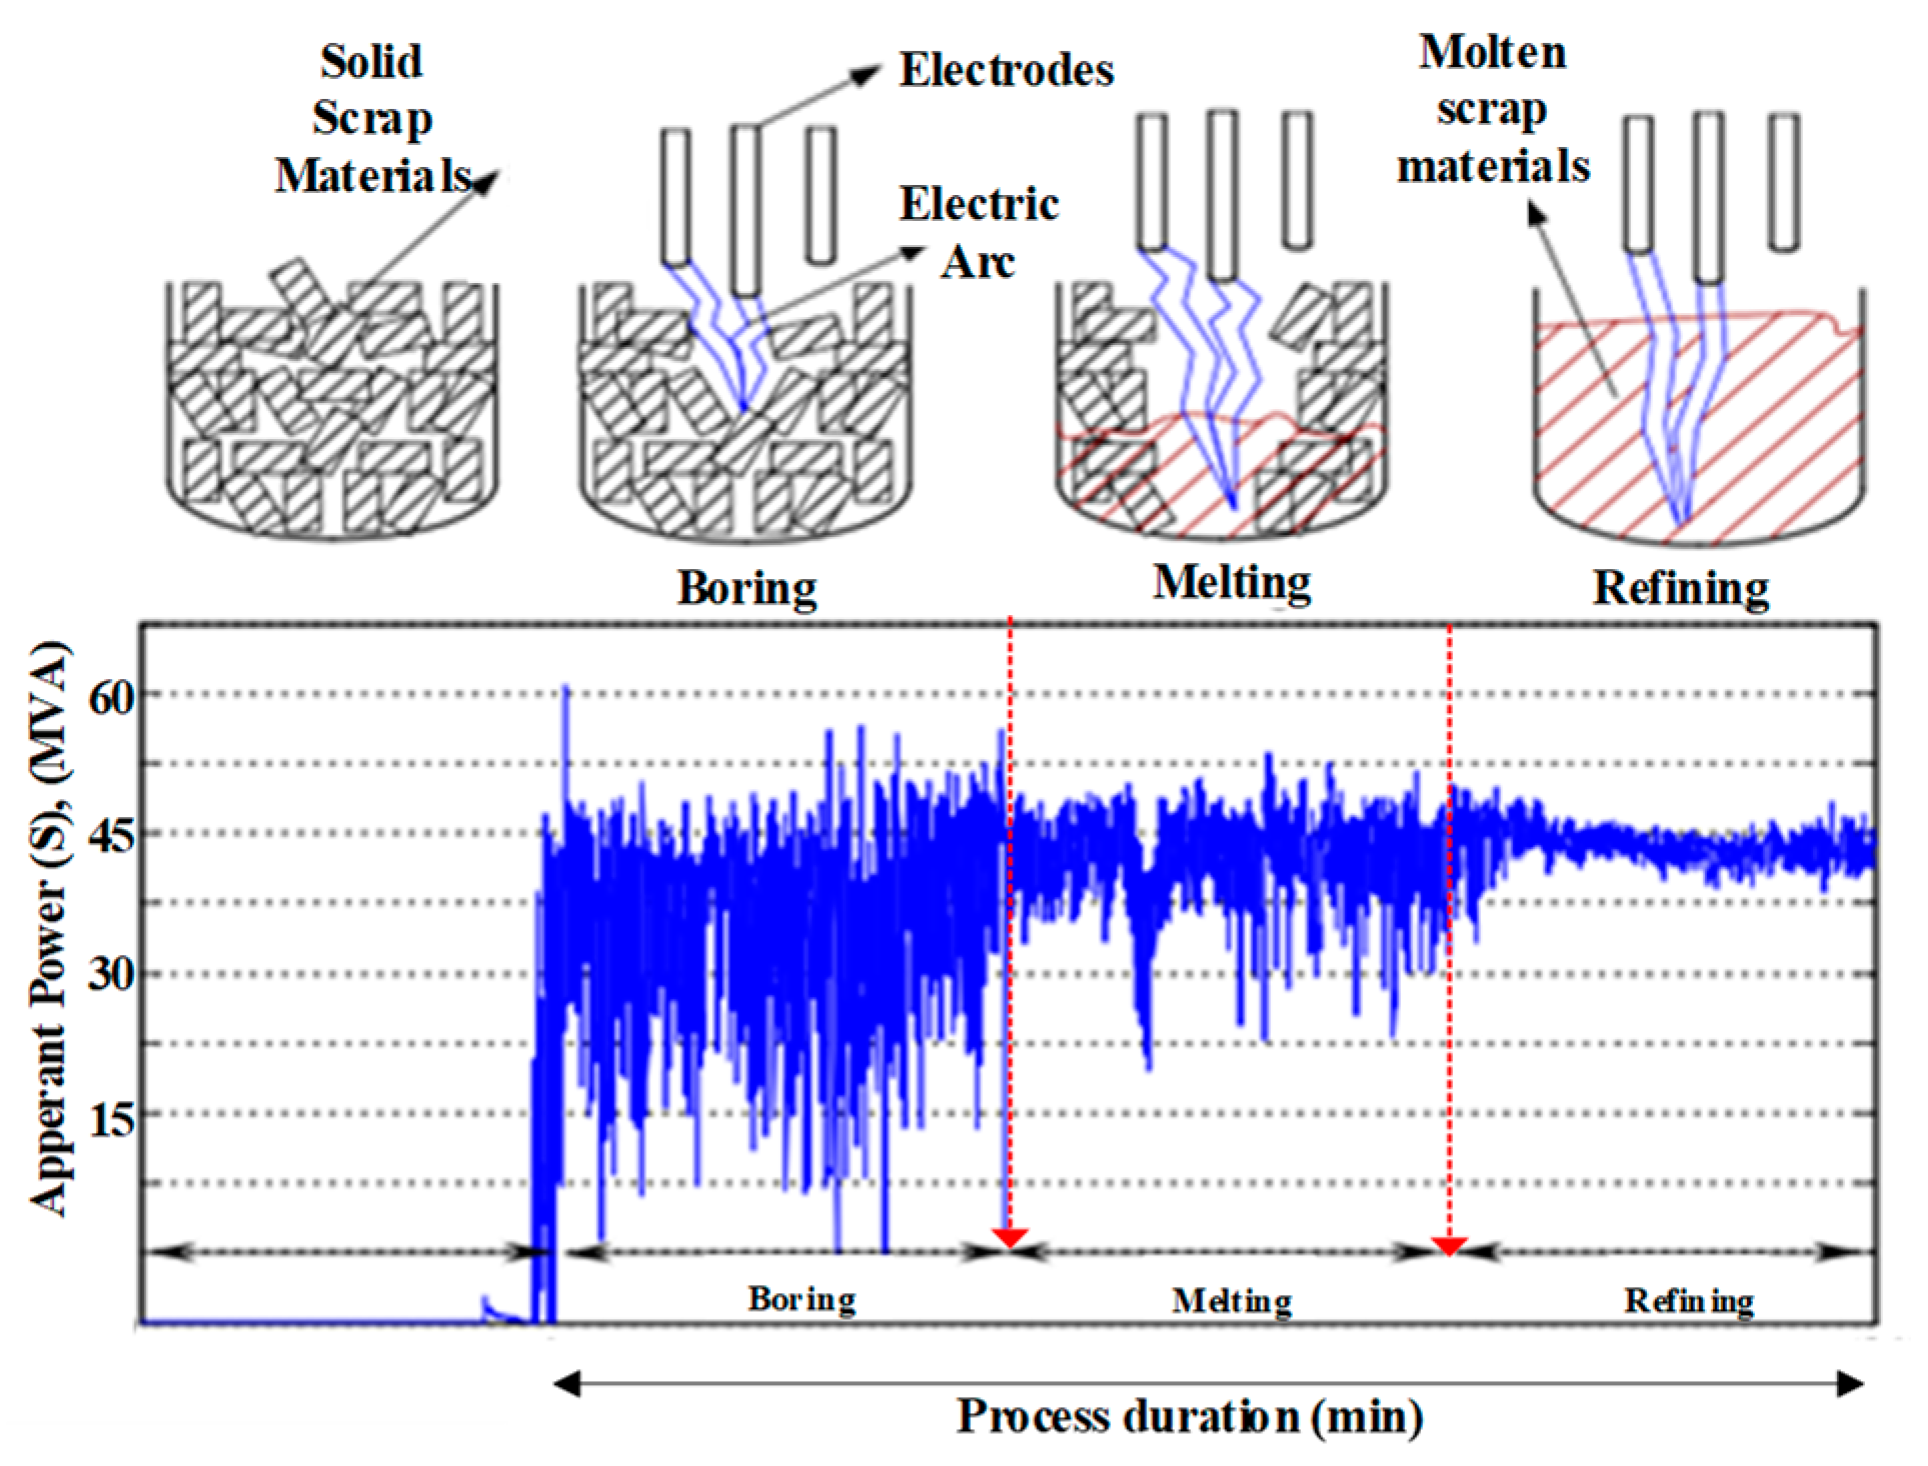
Figure 1. Measured variation of apparent power in boring, melting, and refining processes from the 60 MVA EAF furnace [14].
Applsci 15 04005 g001
Figure 2. Electrical components of the feeding system of the EAF [14].
Applsci 15 04005 g002
Figure 3. General structure of an EAF system: (a) single phase equivalent electrical circuit of the EAF [14]; (b) 719 kV reference values of circuit parameters.
Applsci 15 04005 g003
Figure 4. Actual measurement values of the EAF: (a) actual measured V–I characteristic of the electrical arc for 2400 cycles in the melting process; (b) actual measured V–I characteristic of the electrical arc for 12 cycles in the melting process; (c) actual measured voltage wave for 12 cycles in the arc; (d) actual measured current wave for 12 cycles in the arc.
Applsci 15 04005 g004
Figure 5. The V–I characteristic of the EAF: (a) the four distinct voltage–current characteristic zones; (b) the conditional parameters of the EAF characteristic zones.
Applsci 15 04005 g005
Figure 6. The polynomial V–I characteristic of the electric arc was derived using the curve-fitting method.
Applsci 15 04005 g006
Figure 7. The hierarchical structure of the GWO algorithm (top–down from strong to weak).
Applsci 15 04005 g007
Figure 8. Proposed Model: (a) the eighth-degree polynomial formula derived from the curve-fitting method; (b) the time–current waveform of the Heidler function.
Applsci 15 04005 g008
Figure 9. The eighth-degree polynomial curve from curve fitting for the V–I characteristic and modified Heidler function with the GWO algorithm.
Applsci 15 04005 g009
Figure 10. (a) In d i / d t < 0 case; third-degree polynomial expression. (b) Double S-curve. (c) S-curve approach.
Applsci 15 04005 g010
Figure 11. The S-curve derived using a third-degree polynomial curve and the GWO algorithm for the V–I characteristic during arc current reduction.
Applsci 15 04005 g011
Figure 12. The exponential model with constant arc distance case (Vat = 240 V): (a) static V–I characteristic curve; (b) voltage and current of arc waveform.
Applsci 15 04005 g012
Figure 13. The hyperbolic model with constant arc distance case (Vat = 240 V): (a) static V–I characteristic curve; (b) voltage and current of arc waveform.
Applsci 15 04005 g013
Figure 14. The exponential–hyperbolic model with constant arc distance case (Vat = 240 V): (a) static V–I characteristic curve; (b) voltage and current of arc waveform.
Applsci 15 04005 g014
Figure 15. The nonlinear resistance model with constant arc distance case (Vat = 240 V): (a) static V–I characteristic curve; (b) voltage and current of arc waveform.
Applsci 15 04005 g015
Figure 16. The proposed model with constant arc distance case (Vat = 240 V): (a) static V–I characteristic curve; (b) voltage and current of arc waveform.
Applsci 15 04005 g016
Figure 17. The exponential model during the melting process with flicker effect: (a) dynamic V–I characteristic curve; (b) dynamic voltage and current of arc waveform.
Applsci 15 04005 g017
Figure 18. The hyperbolic model during the melting process with flicker effect: (a) dynamic V–I characteristic curve; (b) dynamic voltage and current of arc waveform.
Applsci 15 04005 g018
Figure 19. The exponential–hyperbolic model during the melting process with flicker effect: (a) dynamic V–I characteristic curve; (b) dynamic voltage and current of arc waveform.
Applsci 15 04005 g019
Figure 20. The nonlinear resistance model during the melting process with flicker effect: (a) dynamic V–I characteristic curve; (b) dynamic voltage and current of arc waveform.
Applsci 15 04005 g020
Figure 21. The proposed model during the melting process with flicker effect: (a) dynamic V–I characteristic curve; (b) dynamic voltage and current of arc waveform.
Applsci 15 04005 g021
Figure 22. FFT in the melting process for the exponential model: (a) harmonic voltage spectrum; (b) harmonic current spectrum.
Applsci 15 04005 g022
Figure 23. FFT in the melting process for the hyperbolic model: (a) harmonic voltage spectrum; (b) harmonic current spectrum.
Applsci 15 04005 g023
Figure 24. FFT in the melting process for the exponential–hyperbolic model: (a) harmonic voltage spectrum; (b) harmonic current spectrum.
Applsci 15 04005 g024
Figure 25. FFT in the melting process for the nonlinear resistance model: (a) harmonic voltage spectrum; (b) harmonic current spectrum.
Applsci 15 04005 g025
Figure 26. FFT in the melting process for the proposed model: (a) harmonic voltage spectrum; (b) harmonic current spectrum.
Applsci 15 04005 g026
Figure 27. FFT in the melting process for the real-time measurement: (a) harmonic voltage spectrum; (b) harmonic current spectrum.
Applsci 15 04005 g027
Figure 28. Comparison of the proposed model with experimental data: (a) EAF arc voltage waveform, (b) EAF arc current waveform.
Applsci 15 04005 g028
Table 1. Model parameters used to describe the V–I characteristics of the arc.
V–I Characteristic ModelModel Parameters
Exponential ModelVat = 240 Volt
I0 = 5 kA
Hyperbolic ModelVat = 240 Vol, Ci = 190 kW, Cd = 39 kW, d = 5 kA
Exponential–Hyperbolic ModelVat = 240 Vol, i0 = 5 kA, Ci = 190 kW, Cd = 39 kW, d = 5 kA
Nonlinear Resistance ModelActive Power = 14 MW, i0 = 50 kA, α = 15, U = 120 V
Proposed ModelVex = Vat = 240 V, i1 = 220 kA, i2 = 1850 A, i3 = 0 kA, i4 = 18 kA
i5 = 27 kA, i6 = 92 kA, η = 12 × 1010, n = 2
Table 2. Real-time measurement variables for arc voltage.
HarmonicsActualModel 1Model 2Model 3Model 4Proposed
Arc
Voltage
2nd0.093%0.07%0.08%0.08%0.08%0.079%
3rd0.801%1.37%1.53%1.51%1.53%0.660%
4th0.056%0.03%0.07%0.04%0.05%0.060%
5th0.531%0.62%0.78%0.78%0.49%0.435%
7th0.332%0.30%0.43%0.45%0.20%0.32%
THD2.300%1.80%4.19%2.13%2.97%2.34%
Table 3. Real-time measurement variables for arc current.
HarmonicsActualModel 1Model 2Model 3Model 4Proposed
Arc
Current
2nd1.20%1.04%1.09%1.16%0.87%0.92%
3rd3.12%7.65%9.91%9.76%28.04%5.36%
4th0.79%0.55%0.56%0.65%1.33%0.62%
5th0.89%2.05%3.16%3.21%7.96%1.34%
7th0.31%0.68%1.31%1.42%3.57%0.81%
THD13.76%11.47%14.55%14.50%32.54%11.40%
Disclaimer/Publisher’s Note: The statements, opinions and data contained in all publications are solely those of the individual author(s) and contributor(s) and not of MDPI and/or the editor(s). MDPI and/or the editor(s) disclaim responsibility for any injury to people or property resulting from any ideas, methods, instructions or products referred to in the content.