Abstract
In response to the issue that post-training quantization leads to performance degradation in mobile deployment, as well as the problem that the balanced consideration of quantization deviation by Clipping optimization techniques limits the improvement of quantization accuracy, this article proposes a novel clipping optimization method named ClipQ, which pays different attention to the parameters, aiming to preferentially reduce the quantization deviation of important parameters. The attention of the weight is positively related to its absolute value. Channel information entropy and principal component analysis are used to characterize the channel attention and spatial attention of activations, respectively. In addition, the particle swarm algorithm is applied in weight clipping to adjust the search step size and direction adaptively. ClipQ achieves high-precision quantization with very few calibration samples (<=50) and low time cost. Meanwhile, it does not bring extra computation, which is friendly to hardware. The experimental evaluation on image classification, semantic segmentation, and object detection shows that ClipQ outperforms other state-of-the-art clipping techniques, such as KL, ACIQ, and MSE. In 8-bit quantization, the average precision loss is 0.31% for image classification and 0.22% for object detection. More notably, it achieves almost lossless accuracy in semantic segmentation tasks.
1. Introduction
In recent years, convolutional neural networks (CNNs) have produced excellent results in computer vision tasks such as image classification [1,2,3,4], object detection [5,6,7,8], and image segmentation [9,10,11,12,13]. However, the large-scale parameters and high-complexity computation of CNNs challenge the storage, power consumption, and computing power of the device. In the deployment of chips for stereo matching networks in deep estimation tasks and the application of mobile devices such as drone driving, CNNs will quickly deplete their storage, memory, batteries, and computing units [14]. Therefore, reducing the scale of the parameter and computational complexity of CNNs is of great importance for the deployment of neural networks in mobile applications [15].
Researchers have proposed a series of CNN compression and acceleration methods, such as lightweight network design, low rank decomposition, pruning, quantization, etc. Quantization is a technique that converts floating-point weights and activations into low-precision fixed-point numbers. Quantization can reduce the data bit width, such as in deep learning scenarios for weather forecasting, which can directly reduce the storage pressure of multi-source data related to lightning and lower hardware power consumption [16]. Segmenting intraoral photography images can improve computational speed and save time for clinical diagnosis [17].
However, since low-bit data cannot fully represent the information of floating-point data, quantization usually hurts network performance. Current quantization methods involve training-based quantization [18,19,20] and post-training quantization [21,22,23,24,25]. Training-based quantization methods improve performance by inserting quantization nodes or low-level computing units and optimizing parameters through backpropagation, but the time cost is enormous.
Quantification after training has been widely applied in mobile model deployment due to its convenience and efficiency. But it will cause a greater loss of network performance, especially for lightweight networks. Crop optimization can effectively improve the performance of quantization after training, such as TensortRt [22], EasyQuant [26], MSE [21], ACIQ [27], etc., which aims to select the optimal clipping thresholds to minimize the quantization deviation. But these methods have two problems. One is the issue of attention balance [28]. For example, if ownership values are treated equally in weight pruning, the quantization accuracy of important weights will decrease, resulting in greater network performance loss. The second issue is the threshold problem, as existing pruning optimization methods find it difficult to find the optimal search step size and search interval.
In this paper, a novel clipping optimization method named ClipQ is proposed to overcome the above problems. More specifically, we obtain weight attention according to the absolute value criterion from the pruning technique and then the particle swarm algorithm instead of a grid search is used to find the best weight clipping thresholds, which adaptively adjusts the search step and direction based on search experience. For activation clipping, ClipQ represents the channel attention of activation based on the channel information entropy and utilizes principal component analysis to characterize the spatial attention of activation [29]. Channel attention and spatial attention will be combined to preferentially reduce the quantization deviation of important activations. The main contributions of this paper are summarized as follows:
1. We design spatial attention, channel attention and weight attention to overcome the attention equalization problem in clipping optimization.
2. The particle swarm algorithm is applied to weight clipping for the first time, which helps to solve the optimal clip threshold more stably, compared to grid search.
3. The excellent performance of ClipQ is demonstrated in image classification, semantic segmentation, and object detection tasks. In addition, practical verification is conducted in FPGA.
The rest of this paper is organized as follows. In Section 2, we briefly review clipping optimization and other technologies in post-training quantization. The details of ClipQ are illustrated in Section 3. In Section 4, the experiments of ClipQ on different vision tasks are carried out, and the results are shown in detail. The last section is the conclusion.
2. Related Work
Large quantization deviation occurs when the maximum and minimum values of floating-point parameters are directly used as clip thresholds, so clipping optimization has been proposed in PTQ. Chung [30] proposes a percentage criterion to exclude the interference of outliers. Nvidia’s TensorRT, a product specifically designed to perform 8-bit integer quantization without retraining, finds the optimal clip thresholds by minimizing the KL distance between the original activation distribution and the quantized distribution, but it causes the accuracy of MobileNetV2 and MnasNetV1 to drop by 3%. DFQ [31] assumes that the feature map processed by the BN layer satisfies the Gaussian distribution and deduces the clipping thresholds according to the mean and variance of the BN layer. ZeroQ [32] synthesizes the input image by regressing the BN parameters and obtains the activation clipping thresholds based on the synthesized image. DFQ and ZeroQ achieve data-free quantization, but their performance depends on the number of BN layers in the network. MSE utilizes L2 distance to characterize the quantization deviation and then minimize it by grid search. OCS [23] compares MSE with other clipping optimization methods and considers it the best. OMSE [24] iteratively quantizes the convolution kernel based on MSE. It means that a convolution operation is decomposed into multiple convolutions. By quantizing the decomposed convolutions, OMSE can achieve better performance under 4-bit, but the amount of calculation and parameters are also multiplied.
In addition to clipping optimization, there are other techniques like weight preprocessing, bias correction, adaptive rounding, etc., which can improve the performance of posttraining quantization. Weight preprocessing, such as DFQ and OCS. AdaRound [25] proposes that nearest neighbor rounding is not the optimal choice for quantization. Based on sufficient calibration data, it uses gradient descent to minimize the output deviation of each layer, thereby determining the clipping thresholds and the best rounding of each parameter. BRECQ [33] disagrees with AdaRound’s assumption that adjacent network layers are independent of each other, and it divides the network into different blocks. When the calibration data are sufficient, adaptive rounding techniques can effectively improve the quantization performance. BFQ [34] reduces activation quantization deviation by fusing the mean of activation quantization deviation into the bias, which is called bias correction.
In post-training quantization, the above methods can be combined according to the actual situation, but it is necessary to set the clipping threshold of weight and activation. Other methods can be regarded as improvement techniques, and they may have additional conditions such as more hardware resources, specific network structures, sufficient calibration data, and so on. ClipQ proposed in this paper improves quantization performance only by clipping optimization. Just a few calibration data are required, and it also does not bring additional computation to hardware.
3. Method
3.1. Linear Quantization
Linear quantization is a linear mapping of FP32 data to lowbit data (as shown in Figure 1), which can be defined as follows:
x is the floating-point data that needs to be quantized. s is called the quantization scale and z is the quantization zero. n represents the bit width of the low-bit data. is a rounding operation, such as rounding up, rounding down and round-to-nearest. and are the minimum and maximum clipping thresholds. Through the truncation operation, the quantized data are limited to . That is, the floating-point data less than will be mapped to , while the floating-point data greater than will be mapped to . The low-bit data q can be mapped back to floating-point data , which is also called fake quantization. Usually, x and are not equal, and the difference between them is called quantization deviation, which can be measured by L1 distance, L2 distance, KL distance, cosine similarity, etc.
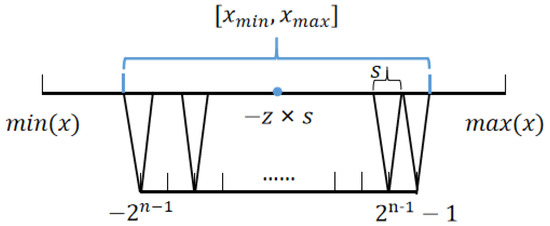
Figure 1.
Linear quantization.
3.2. Weight Clipping Optimization
The BN layer can accelerate the convergence of the network and alleviate overfitting. It has been widely used in convolutional neural networks [35]. The BN layer also contains floating-point parameters, and they will be absorbed into the convolutional layers before quantization. Specifically, the input I goes through the convolutional layer and then the BN layer to obtain the output O.
Among them, ∗ represent the convolution and • represent Hadamard product. W and b are the weights and biases of the convolution layer. The mean of the BN layer is . The BN layer’s variance is . and are the learnable parameters of the BN layer. The new weights and new bias of the merged convolutional layers are as follows:
For the convolutional layer, after merging the BN parameters, we quantize its weights channel by channel. That is, each convolution kernel , where i, , and represent the number of channels, height and width of the convolution kernel, and need a group of clipping thresholds. We can obtain the fake-quantized weight according to (1). Most clipping methods determine the clipping thresholds by optimizing the following objective:
where represents the metric function of quantization deviation. Due to weight decay during network training, the absolute values of weights that have little impact on the loss function will gradually decrease, so the absolute values of weights can be used as a pruning criterion [36,37,38]. Inspired by this, we designed dynamic attention for weight clipping, with the optimization objective of the following:
where c represents the tertile value of . To put it more clearly, for the weights whose absolute value is ranked in the first , ClipQ gives them the least attention. For the others, the attention varies proportionally with their absolute value. The deviation metric function adopts L1 distance or L2 distance according to whether it is depthwise convolution. The reason is that the number of parameters of a single channel of depthwise convolution is very small.
Equation (5) or Equation (4) is a multi-variable optimization problem. We perform 8-bit linear quantization on a convolution kernel in MobileNetV2 to obtain the numerical relationship between the clipping thresholds and the quantization deviation, as shown in Figure 2. It is a non-convex surface with many local optima, and the global minimum of the surface is expected to be found. Gradient-based optimization methods encounter difficulties in obtaining gradients (due to quantization truncation and rounding) and suffer from the problem of numerous local optima in multivariate optimization. Linear search is a solution (shown in Figure 3a), but it is challenging to determine the appropriate search range and step size, which may result in the global optimum not being within the set interval.
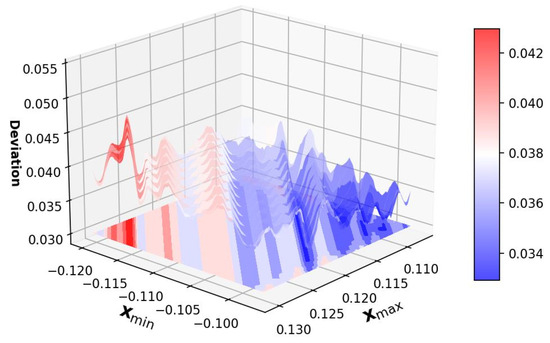
Figure 2.
Numerical relationship between quantization deviation and clipping thresholds.

Figure 3.
Linear Search and Particle Swarm Optimization. (a) Linear search for and . (b) The initial state of particle swarm optimization. (c) The convergence status of particle swarm optimization.
Particle swarm optimization, as a swarm intelligence optimization algorithm, can avoid local optima while avoiding problems caused by truncation and rounding in gradient calculations.
ClipQ obtains the optimal clipping thresholds based on particle swarm optimization. For the target convolution kernel w, we initialize the positions and velocities of several particles (as shown in Figure 3b). The position of the kth particle represents the minimum clipping threshold and maximum clipping threshold. Its movement speed indicates the search direction and step size. The initial position and initial velocity of the particle are defined as (6), where is a parameter that controls the range of the particle’s initial position. We can obtain the quantization deviation of each particle at the current position according to (5). It will function as the fitness function of the particle swarm to guide the particles to converge to the global optimal position.
Specifically, the quantization deviation is calculated at the initial positions of each particle at first. The lowest quantization deviation is recorded, which is defined as the global optimal position . In addition, the optimal position of each particle is also recorded. After that, their speed is adjusted based on and :
Among them, is the inertia factor of the original speed, indicating that the particle will retain the initial motion trend to a certain extent. We define it as
T and t represent the total number of iterations and the current iteration period of the particle swarm, respectively. This means that in the early stage of the particle swarm optimization, a larger makes the movement direction of the particles more dispersed, which improves the global optimization ability of the particle swarm. In the later stage, a smaller allows the particle swarm to conduct a more granular search near the optimal point. and represent the distance from the kth particle to its optimal position and the distance from the kth particle global optimal position, respectively. and are learning factors. The larger is, the more the particle tends to learn the experience of itself, approaching its optimal position. The larger the is, the more the particles tend to learn the experience of the whole particle swarm and move to global optimal position. It reflects the cooperation and knowledge sharing among the particles. and are random numbers, which provide randomness to the movement of particles and help particle swarms avoid getting stuck in local optima.
After the particles move to new positions with the new velocity in line with (9) we recalculate the quantization deviation for each particle to update and . Then, the velocity can be re-determined. In the end, most of the particles will converge to the global optimal position as shown in Figure 3c. The global optimal position of the particle swarm is the optimal weight clipping threshold .
3.3. Activation Clipping Optimization
Unlike weight, activation is not the inherent parameter of the network. We obtain activation by inferring on a few calibration samples. The activation will be quantized layer by layer. There are some features in the activation, such as 0-value activation maps, background features, etc., which have little effect on the output of the network. In activation clipping, we want to pay less attention to them, so activation attention is proposed.
From the channel perspective, we can regard activation as the feature map extracted by c convolution kernels, as shown in Figure 4, where c represents the number of channels of activation, is the height of the activation, and means the activation’s width. Although the input images are different, the feature maps extracted by the same convolution kernel are similar. For example, zero feature maps appear in the same channel. According to Shannon’s theorem, the amount of information contained in data is proportional to its information entropy.
Specifically, as shown in Figure 5, we first compute the distribution histogram of activation for each channel in the same interval . The information entropy of the jth channel is calculated by (10), where represents the frequency of the i-th group data in the distribution histogram.
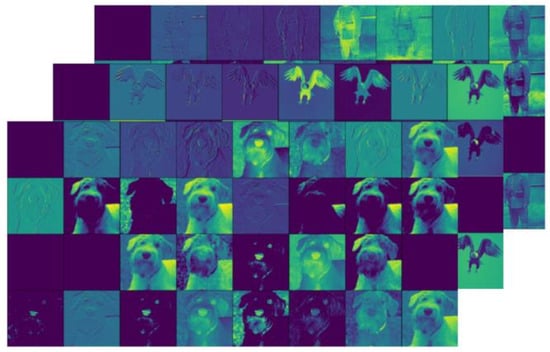
Figure 4.
Channel feature map of the first convolution layer of MobileNetV2.

Figure 5.
The calculation of Channel Importance.
From the spatial perspective, we can regard the activation as a matrix X composed of groups of feature vectors and the vector dimension is c. It means that the convolutional layer encodes the relevant region (receptive field) of the picture into a feature vector. In general, deep convolutional layers have a larger receptive field and more convolution kernels, indicating that a larger region is encoded with longer dimensions.
In visual tasks such as image recognition and object detection, the importance of feature vectors varies among different positions. The internet focuses more on the prospects, so the activation of foreground regions should be given priority consideration. In addition, the input regions are encoded as equal-length feature vectors, so their redundancy is also different.
In order to reflect the coding redundancy and the network’s attention on activation in different regions, ClipQ compresses the original activation based on principal component analysis to remove redundant information and obtain its principal component. In the principal component, different regions of the network input will be encoded as a single numerical value. Its numerical magnitude can be thought of as the network’s attention to activations [39]. We regard it as the spatial attention of activations.
Specifically, feature vectors in X subtract their own mean to obtain the decentralization matrix at first. Then, we perform singular value decomposition of :
is an orthogonal matrix whose column vectors are called left singular vectors. is a diagonal matrix, with n singular values arranged on its diagonal. is also an orthogonal matrix, and its column vector is called the right singular vector. We compress X in the column direction by obtaining the projection of X on the first column vector of V. Finally, ReLu and normalization will act on the projection to obtain the spatial attention of activation .
Figure 6 shows the change in spatial attention from shallow to deep layers in MobileNetV2. In the shallow layers, the attention is concentrated at the boundaries of the image, which indicates that the shallow network layers focus on extracting local details of the input. As the network goes deeper, the receptive field gradually becomes larger, and the spatial attention focuses on core parts of foreground objects.
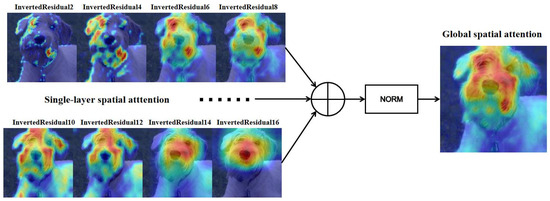
Figure 6.
Spatial attention of shallow activations to deep activations in MobileNetV2.
The activation attention areas of different network layers have their own emphasis. Areas that are not of interest to some network layers may be the concern of other network layers. Since the quantization deviation of the shallow activations will be transmitted to the deep layers, it is necessary to consider the spatial attention of the target layer and other network layers simultaneously in activation quantization. As a result, we sum and normalize the spatial attention of activations at each layer to construct the global spatial attention .
Based on the above single-layer spatial attention, global spatial attention and channel attention, we can obtain the attention of the activation. For example, with the activation data , their attention is defined as (13), where and are balancing factors for single-layer spatial attention and global attention. In summary, the optimization objective of activation clipping is as follows:
where represents the standard deviation of the lth channel. It suppresses the detrimental effect of numerical fluctuations of different channels. In particular, to exclude the interference of outliers, we screened the activation data based on the percentage criterion. In theory, as with weight clipping optimization, we can utilize particle swarm optimization to minimize the objective function. However, since the amount of activations is far more than the weights, the time consumption of executing the particle swarm algorithm is unacceptable. What is more, the activation data are only from a few samples. Even if we obtain the optimal clip threshold that matches these samples, it may not fit the entire test dataset, which can even lead to overfitting problems. Therefore, we employ a grid search to solve the activation clipping thresholds .
4. Experiments
In this section, the performance of ClipQ on convolutional neural networks will be demonstrated, including image classification, object detection, and semantic segmentation applications. At the same time, ClipQ is compared with other quantization methods. Next, the ablation study will be conducted to reflect the role of parameter attention in weight clipping and activation clipping. Finally, we deploy part of the convolutional neural network on the FPGA to reflect the practical application capabilities of ClipQ.
Our code implementation mainly refers to the open-source project ZeroQ. The experimental hardware platforms mainly include TiTan XP GPU and Intel Xeon Silver 4116 CPU. The software environment mainly consists of Python 3.7 and Pytorch1.8. The number of particles and iterations in the particle swarm are both 100. is for 8-bit quantization and for 6 bits. is equal to and is . Fifty random training samples are selected as calibration data for activation quantization in the image classification task. The calibration data in the object detection and semantic segmentation tasks include just ten random training samples. The pretrained model in the image recognition task comes from Torchvision. The pretrained object detection model and semantic segmentation model come from Openmmlab.
ImageNet2012 [40], MS COCO 2017 [41], and Cityscapes [42] are used as experimental datasets for image classification, object detection, and semantic segmentation, respectively. Among them, ImageNet2012 is the most mainstream dataset in image classification, including 1.2 million training images and 50,000 test images, with a total of 1000 object categories. The MS COCO 2017 dataset is a multi-object detection dataset, containing nearly 120,000 training images and 5000 test images, with an average of 3.5 categories and 7.7 detection objects per image. The Cityscapes dataset is frequently used in semantic segmentation research, which contains 34 urban street categories. The performance of the semantic segmentation model is evaluated by 1525 testing data from it.
4.1. Image Classification
Image classification is a fundamental task in computer vision, which can be classified into lightweight and non lightweight networks based on the number of feature extraction network parameters. Lightweight networks commonly use deep convolution with carefully designed hyperparameters and a quantity of about 10 MB, which is very popular in mobile applications. Due to its sensitivity to quantization bias, it can be used to evaluate the performance of quantization methods. Non-lightweight networks have many more parameters than lightweight networks, such as ResNet, VGG, etc. They are more robust to quantization bias and have smaller quantization accuracy loss under the same quantization bit width.
The 8-bit quantization results of MobileNetV2 are shown in Figure 7. After quantizing with ClipQ, the network accuracy just drops by . Compared with Jacob, the quantization accuracy is improved by 1.6%. The popular quantization tool, TensorRT, performs poorly on MobileNetV2, with 3% loss of network accuracy. BFQ uses 1000 calibration samples for bias correction, but ClipQ outperforms it by 0.98%. ACIQ is adopted to quantize the weights channel-by-channel and quantize the activation layer-by-layer, with a drop of accuracy by 0.72%. Nagel and HPTQ simultaneously employ weight preprocessing, clipping optimization, and bias correction techniques. They achieved 71.16% and 71.46% accuracy, respectively, but they still fell behind ClipQ. Furthermore, we utilize the images synthesized by ZeroQ as calibration data to achieve data-free quantization. The result is close to using real data, which is better than ZeroQ and DFQ.
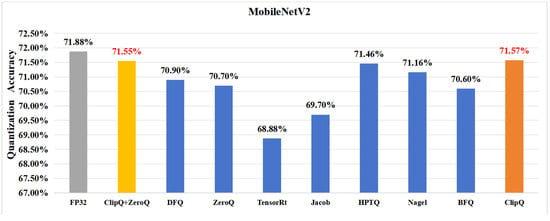
Figure 7.
The 8-bit quantization result of MobileNetV2.
ShuffleNetV1 is a popular lightweight network. As shown in Figure 8. TensorRT and Jacob perform relatively well on ShuffleNet, with network accuracy dropping by 0.37% and 0.47%, respectively, but ClipQ only results in a 0.09% loss of accuracy. ACIQ reduces the network accuracy by 1.27%. The activation of ShuffleNetV1 may be far away from Gaussian or Laplace distribution, which leads to ACIQ being weaker than other methods. ZeroQ also performs poorly, causing an accuracy loss of nearly 1%.

Figure 8.
The 8-bit quantization result of MnasNetV1 and ShuffleNetV1.
MnasNetV1 is a model designed with automatic mobile neural network architecture search technology, and its inference speed on mobile devices is much faster than MobileNetV2 and ShuffleNetV1. ClipQ shows huge advantages over others on this model. In contrast to TensorRT, Jacob, ACIQ, and ZeroQ, its quantization accuracy is improved by 1.8%, 3.1%, 4.2%, and 18.86%, respectively. We observed the standard deviation change in the weights of each channel of the above network in Figure 9. Obviously, the standard deviation of MnasNetV1 is larger than that of MobileNetV2, and the standard deviation of ShuffleNetV1 is the smallest. According to the quantization results, we consider that ClipQ achieves better performance than other methods due to paying more attention to the important weights when the standard deviation of the weights is large.
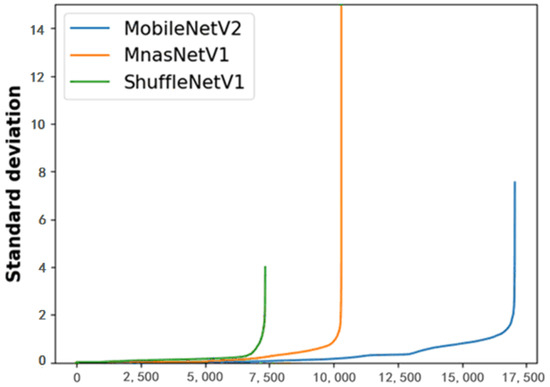
Figure 9.
Weight standard deviation change of MobileNetV2, ShuffleNetV1, and MnasNetV1. They are sorted from smallest to largest.
For non-lightweight networks (ResNet, VGG, and DenseNet), their 8-bit quantization results are shown in Table 1. After ClipQ quantization, the network accuracy loss is within 0.12%. Compared to other quantization strategies, ClipQ has stronger generalization ability and can adapt to different network architectures. In addition, ClipQ improves inference efficiency while ensuring high accuracy by reducing computational complexity and storage requirements. It has the ability to maintain accuracy and a highly robust quantization method, making it suitable for deep learning inference tasks.

Table 1.
The 8-bit quantization result of the nonlightweight networks.
Overall, ClipQ demonstrates superiority in both lightweight and non-lightweight networks, with high accuracy, wide adaptability, and stability, providing strong support for the efficient deployment of deep learning models.
4.2. Object Detection and Semantic Segmentation
The performance of ClipQ on object detection and semantic segmentation tasks is shown in this section. Object detection networks can be divided into one-stage networks and two-stage networks. Compared with the two-stage network, the one-stage network has a faster detection speed, so it is often used in mobile devices. SSD, Yolo, and RetinaNet are classic one-stage networks, and their quantization results are shown in Table 2 and Table 3. Among them, the backbone of RetinaNet is ResNet50, so the model size is larger. The backbone of YoloV3 and SSD are both MobileNetV2. CSPDarknet with the depth factor of 0.33 and the width factor of 0.375 is the backbone of YoloX. As one can see, for 8-bit quantization, the precision (MAP) degradation caused by ClipQ is 0.2.

Table 2.
Quantization Results of Object Detection and Semantic Segmentation Networks (RestinaNet, YoloV3, SSD, YoloX).

Table 3.
Quantization Results of Object Detection and Semantic Segmentation Networks (FCN, PSPNet, DeepLabV3+, PSANet, GCNet).
Further quantizing the model to 6 bits, ClipQ achieves 35.9accuracy on RetinaNet. Compared with Jacob and ACIQ, the accuracy is improved by 0.6%. For YoloV3, YoloX, and SSD, the advantages of ClipQ are more obvious. It results in 2.5%, 1.6%, 1% accuracy degradation, respectively. The performance of Jacob and ACIQ is terrible. Especially for YoloV3, they result in more than a 5% accuracy drop. The nonlinear activation functions LeakReLu and Swish are used in YoloV3 and YoloX. It seems like they are not friendly to quantization, although they improve the performance of the floating-point networks to a certain extent. We intuitively show the quantization results of the object detection network in Figure 10. As will be readily seen, ClipQ is closer to the floating-point model in both category accuracy and target box position compared to ACIQ and Jacob.
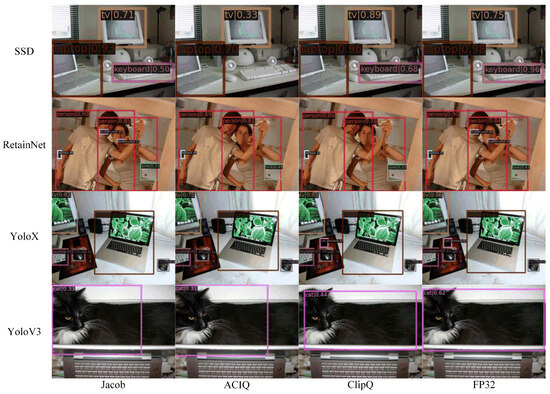
Figure 10.
Visualization of the quantization performance of the object detection network, with the quantization width being 6 bit.
To demonstrate the applicability of our method to semantic segmentation, we apply ClipQ for FCN, PSPNet, DeepLabV3+, PSANet, and GCNet. The results are also listed in Table 2 and Table 3. FCN is a fully convolutional network. After being proposed, it gradually became the basic framework of the semantic segmentation network. PSPNet exploits the capability of global context information by different region-based context aggregation through a pyramid pooling module. DeepLab proposes atrous convolution and atrous spatial convolution pooling pyramid modules, which effectively improve the segmentation ability of the network. Along with the success of the attention mechanism in sequence tasks, it has also been widely used in semantic segmentation networks. For example, PSANet constructs the correlation of different location features through a learnable attention mask. GCNet proposes a lightweight global context module based on the Squeeze-Excitation Network. It can not only effectively model the global context but also be applied to multiple layers in a backbone network to construct a global context network.
ClipQ performs excellently on the 8-bit quantization of the above networks. It achieves almost lossless quantization. The quantization accuracy (MIOU) of PSPNet, DeepLabV3+, and PSANet even outperforms the floating-point model. For FCN and GCNet, ClipQ only leads to 0.01% and 0.14% accuracy degradation. The 6-bit quantization results are also shown in Table 2 and Table 3, and the visualization results are shown in Figure 11. ClipQ achieves better accuracy than Jacob and ACIQ. The quantization accuracy is improved by 5.04% and 2.09% on average, respectively. Especially for PSPNet, ClipQ overbears Jacob, with an advance of accuracy by 10.44%. Meanwhile, it exceeds ACIQ by 7.59%.
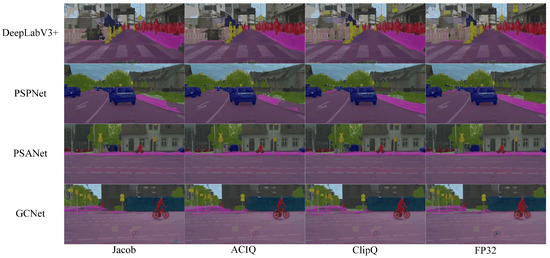
Figure 11.
Visualization of the quantization performance of the semantic segmentation network, with the quantization width being 6 bit.
4.3. Ablation Study
In this section, we show the effect of parameter attention on weight and activation clipping and make a comparison with other clip optimization methods.
Table 4 compares different weight clipping methods. The weight is quantized to 6 bits, while the activation is kept to floating-point precision. Max makes the maximum and minimum weight as the clip threshold. MSE minimizes the L2 distance of weight quantization deviation by linear search. CS is similar to MSE, with cosine similarity evaluating quantization deviation. ClipQ shows the quantization results of ClipQ without considering attention.

Table 4.
Comparison of weight clipping methods.
Overall, Max’s performance is the worst. Due to the small number of weights, the performance of ACIQ based on statistical distribution is unsatisfactory. MSE outperforms the other clip threshold techniques, except for ClipQ in nearly all cases. For SSD and YoloX, the difference between MSE and ClipQ is small. MSE is still inferior to ClipQ from the quantization results of other networks. For PSPNet, ClipQ achieves the precision of the floating-point model, but MSE results in nearly 3% accuracy drop with a final accuracy of 67.2%. ClipQ’s performance on MnasetV1 overshadows other methods, with more than an 8% accuracy improvement.
When ClipQ does not consider parameter attention, its performance is even inferior to MSE and CS, which illustrates the effect of parameter attention on weight clipping. Thanks to the ability of the particle swarm algorithm to automatically adjust the search step size, ClipQ can easily obtain better quantitative results. But for CS and MSE, we try multiple sets of search intervals and search steps to improve their performance.
Next, we quantize the activations to 6 bits and keep the weights in floating-point precision. We evaluate the performance of Max, ACIQ, Percent, KL, and ClipQ in activation clipping, as shown in Table 5. Affected by outliers in the activation, Max causes a large loss to the network performance. Percent only considers the first 99.99% of the activation and uses its maximum and minimum value as clipping thresholds. Compared with Max, the quantization accuracy is significantly improved. ACIQ and Percent are six of one and half a dozen of the other. As the core method of TensorRT, KL is widely used in activation quantization. In our experiments, it outperforms Max, ACIQ, and Percent.

Table 5.
Comparison of activation clipping methods.
As one can see, ClipQ achieves the best quantization results. It achieves 1.02% higher accuracy as compared to KL on average. ClipQ’s quantization accuracy is 1.77% and 1.7% higher than KL for MnasNetV1 and SSD, respectively. If the importance of activation is not considered, the quantization accuracy of ClipQ will be degraded to some extent. In fact, ClipQ is equivalent to using the MSE for activation clipping. Overall, it is slightly better than KL.
In addition, we also added standard deviation to the experimental results to more comprehensively evaluate the stability and performance fluctuations of different quantification methods. Compared with methods such as ACIQ and MSE, the standard deviation of ClipQ is smaller on multiple models. For example, in the MnasNetV1 task, the mean accuracy of ClipQ is 69.82 %, with a standard deviation of only ±0.3 %. In contrast, the standard deviation of the ACIQ method is larger, indicating that its fluctuations are more pronounced under different experimental conditions. In other models and task performances, the ClipQ method maintains a low standard deviation, and the results have high stability and repeatability.
4.4. FPGA Implementation
The ClipQ proposed in this paper has been applied to the CASANN-v2 convolutional neural network 8-bit accelerator. The detailed architecture of the accelerator is described in article [43], and the quantitative inference design borrows from Jacob [18]. We implement the accelerator on the XCUV19PFSVA3824 FPGA, which has 2048 processing units and operates at 100 MHz. Since the hardware accelerator needs to consider quantization in the splicing layer, residual connection, upsampling, and other operators, the results of the accelerator are slightly different from the previous fake-quantization results (as shown in Table 6). However, the accuracy deviations are all within 0.2%, which can reflect the actual application performance of ClipQ.

Table 6.
FPGA Implementation Results.
5. Conclusions
This paper proposes ClipQ, a clipping optimization algorithm for post-training quantization of convolutional neural networks. We introduce how to evaluate spatial attention, channel attention and weight attention. By giving more attention to important parameters, their quantization deviation will be preferentially reduced. The application of the particle swarm optimization algorithm further improves the performance of weight clipping. Under 8-bit, in the more than ten networks quantized in this paper, except for MnasNetV1, ClipQ’s accuracy loss is within 0.5%. For semantic segmentation tasks as well as non-lightweight networks, ClipQ performs very well, with an average accuracy drop of less than 0.1%. In ablation experiments, ClipQ achieves an average improvement of 1.3% (weight clipping) and 0.53%(activation clipping) over the best results of other clipping methods. Further, we have completed the deployment of the quantization network in the FPGA, demonstrating the practical application capabilities of ClipQ.
In the future, we will explore the application of ClipQ in mixed precision quantization methods. By optimizing the bit distribution space of each layer in the network model and assigning different quantization bit widths to each layer, we will further improve the performance of the network model. At the same time, we will combine ClipQ with other post-training quantization techniques, such as weight preprocessing and bias correction to achieve high-precision post-training 4-bit quantization.
Author Contributions
Investigation, Y.C.; Software, Y.C., H.Z. and C.Z.; Data Curation, H.Z.; Validation, H.Z.; Conceptualization, C.Z.; Project administration, C.Z.; Methodology, Y.L.; Formal analysis, Y.L.; Supervision, Y.L.; Writing—review and editing, Y.C.; Writing—original draft, C.Z. All authors have read and agreed to the published version of the manuscript.
Funding
This research was supported by the Startup Foundation for Introducing Talent of NUIST (No. 2023r124) and the Enterprise Cooperation Project (No. 2024h570).
Institutional Review Board Statement
Not applicable.
Informed Consent Statement
Not applicable.
Data Availability Statement
The datasets we used in this study are ImageNet2012, MS COCO 2017, and Cityscapes, and they are openly available at https://image-net.org/challenges/LSVRC/2012/2012-downloads.php/ (accessed on 7 August 2022), https://paperswithcode.com/dataset/coco/ and https://www.cityscapes-dataset.com/ (accessed on 7 August 2022), respectively.
Conflicts of Interest
The authors declare no confficts of interest.
References
- Sandler, M.; Howard, A.; Zhu, M.; Zhmoginov, A.; Chen, L.C. Mobilenetv2: Inverted residuals and linear bottlenecks. In Proceedings of the IEEE Conference on Computer Vision and Pattern Recognition, Salt Lake City, UT, USA, 18–22 June 2018; pp. 4510–4520. [Google Scholar]
- Iandola, F.N.; Han, S.; Moskewicz, M.W.; Ashraf, K.; Dally, W.J.; Keutzer, K. SqueezeNet: AlexNet-level accuracy with 50x fewer parameters and <0.5 MB model size. arXiv 2016, arXiv:1602.07360. [Google Scholar]
- Tan, M.; Chen, B.; Pang, R.; Vasudevan, V.; Sandler, M.; Howard, A.; Le, Q.V. Mnasnet: Platform-aware neural architecture search for mobile. In Proceedings of the IEEE/CVF Conference on Computer Vision and Pattern Recognition, Long Beach, CA, USA, 15–20 June 2019; pp. 2820–2828. [Google Scholar]
- Zhan, Z.; Ren, H.; Xia, M.; Lin, H.; Wang, X.; Li, X. Amfnet: Attention-guided multi-scale fusion network for bi-temporal change detection in remote sensing images. Remote Sens. 2024, 16, 1765. [Google Scholar] [CrossRef]
- Ge, Z.; Liu, S.; Wang, F.; Li, Z.; Sun, J. Yolox: Exceeding yolo series in 2021. arXiv 2021, arXiv:2107.08430. [Google Scholar]
- Lin, T.Y.; Goyal, P.; Girshick, R.; He, K.; Dollár, P. Focal loss for dense object detection. In Proceedings of the IEEE International Conference on Computer Vision, Venice, Italy, 22–29 October 2017; pp. 2980–2988. [Google Scholar]
- Song, L.; Xia, M.; Xu, Y.; Weng, L.; Hu, K.; Lin, H.; Qian, M. Multi-granularity siamese transformer-based change detection in remote sensing imagery. Eng. Appl. Artif. Intell. 2024, 136, 108960. [Google Scholar] [CrossRef]
- Redmon, J.; Farhadi, A. Yolov3: An incremental improvement. arXiv 2018, arXiv:1804.02767. [Google Scholar]
- Noh, H.; Hong, S.; Han, B. Learning deconvolution network for semantic segmentation. In Proceedings of the IEEE International Conference on Computer Vision, Santiago, Chile, 7–13 December 2015; pp. 1520–1528. [Google Scholar]
- Li, H.; Xiong, P.; An, J.; Wang, L. Pyramid attention network for semantic segmentation. arXiv 2018, arXiv:1805.10180. [Google Scholar]
- Chen, L.C.; Papandreou, G.; Schroff, F.; Adam, H. Rethinking atrous convolution for semantic image segmentation. arXiv 2017, arXiv:1706.05587. [Google Scholar]
- Jiang, J.; Liu, J.; Fu, J.; Zhu, X.; Lu, H. Point Set Attention Network For Semantic Segmentation. In Proceedings of the 2020 IEEE International Conference on Image Processing (ICIP), Virtual, 25–28 October 2020; IEEE: Piscataway, NJ, USA, 2020; pp. 2186–2190. [Google Scholar]
- Jiang, S.; Lin, H.; Ren, H.; Hu, Z.; Weng, L.; Xia, M. Mdanet: A high-resolution city change detection network based on difference and attention mechanisms under multi-scale feature fusion. Remote Sens. 2024, 16, 1387. [Google Scholar] [CrossRef]
- Liu, Y.; Wang, W.; Xu, X.; Guo, X.; Gong, G.; Lu, H. Lightweight real-time stereo matching algorithm for AI chips. Comput. Commun. 2023, 199, 210–217. [Google Scholar] [CrossRef]
- Wang, Z.; Gu, G.; Xia, M.; Weng, L.; Hu, K. Bitemporal attention sharing network for remote sensing image change detection. IEEE J. Sel. Top. Appl. Earth Obs. Remote Sens. 2024, 17, 10368–10379. [Google Scholar]
- Liu, Y.; Wang, J.; Song, Y.; Liang, S.; Xia, M.; Zhang, Q. Lightning nowcasting based on high-density area and extrapolation utilizing long-range lightning location data. Atmos. Res. 2025, 321, 108070. [Google Scholar] [CrossRef]
- Liu, Y.; Cheng, Y.; Song, Y.; Cai, D.; Zhang, N. Oral screening of dental calculus, gingivitis and dental caries through segmentation on intraoral photographic images using deep learning. BMC Oral Health 2024, 24, 1287. [Google Scholar]
- Jacob, B.; Kligys, S.; Chen, B.; Zhu, M.; Tang, M.; Howard, A.; Adam, H.; Kalenichenko, D. Quantization and training of neural networks for efficient integer-arithmetic-only inference. In Proceedings of the IEEE Conference on Computer Vision and Pattern Recognition, Salt Lake City, UT, USA, 18–22 June 2018; pp. 2704–2713. [Google Scholar]
- Choi, J.; Wang, Z.; Venkataramani, S.; Chuang, P.I.J.; Srinivasan, V.; Gopalakrishnan, K. Pact: Parameterized clipping activation for quantized neural networks. arXiv 2018, arXiv:1805.06085. [Google Scholar]
- Zhu, S.; Duong, L.H.; Liu, W. XOR-Net: An efficient computation pipeline for binary neural network inference on edge devices. In Proceedings of the 2020 IEEE 26th International Conference on Parallel and Distributed Systems (ICPADS), Hong Kong, China, 2–4 December 2020; IEEE: Piscataway, NJ, USA, 2020; pp. 124–131. [Google Scholar]
- Sung, W.; Shin, S.; Hwang, K. Resiliency of deep neural networks under quantization. arXiv 2015, arXiv:1511.06488. [Google Scholar]
- Migacz, S. 8-bit Inference with TensorRT. NVIDIA. May 2017. Available online: https://www.cse.iitd.ac.in/~rijurekha/course/tensorrt.pdf (accessed on 31 March 2025).
- Zhao, R.; Hu, Y.; Dotzel, J.; De Sa, C.; Zhang, Z. Improving neural network quantization without retraining using outlier channel splitting. In Proceedings of the International Conference on Machine Learning, PMLR, Long Beach, CA, USA, 9–15 June 2019; pp. 7543–7552. [Google Scholar]
- Choukroun, Y.; Kravchik, E.; Yang, F.; Kisilev, P. Low-bit quantization of neural networks for efficient inference. In Proceedings of the 2019 IEEE/CVF International Conference on Computer Vision Workshop (ICCVW), Seoul, Republic of Korea, 27–28 October 2019; IEEE: Piscataway, NJ, USA, 2019; pp. 3009–3018. [Google Scholar]
- Nagel, M.; Amjad, R.A.; Van Baalen, M.; Louizos, C.; Blankevoort, T. Up or down? adaptive rounding for post-training quantization. In Proceedings of the International Conference on Machine Learning, PMLR, Virtual, 13–18 July 2020; pp. 7197–7206. [Google Scholar]
- Wu, D.; Tang, Q.; Zhao, Y.; Zhang, M.; Fu, Y.; Zhang, D. Easyquant: Post-training quantization via scale optimization. arXiv 2020, arXiv:2006.16669. [Google Scholar]
- Banner, R.; Nahshan, Y.; Hoffer, E.; Soudry, D. Aciq: Analytical Clipping for Integer Quantization of Neural Networks. 2018. Available online: https://openreview.net/forum?id=B1x33sC9KQ (accessed on 31 March 2025).
- Ji, H.; Xia, M.; Zhang, D.; Lin, H. Multi-supervised feature fusion attention network for clouds and shadows detection. ISPRS Int. J. Geo-Inf. 2023, 12, 247. [Google Scholar] [CrossRef]
- Zhu, T.; Zhao, Z.; Xia, M.; Huang, J.; Weng, L.; Hu, K.; Lin, H.; Zhao, W. FTA-Net: Frequency-Temporal-Aware Network for Remote Sensing Change Detection. IEEE J. Sel. Top. Appl. Earth Obs. Remote Sens. 2025, 18, 3448–3460. [Google Scholar]
- Fowers, J.; Ovtcharov, K.; Papamichael, M.K.; Massengill, T.; Liu, M.; Lo, D.; Alkalay, S.; Haselman, M.; Adams, L.; Ghandi, M.; et al. Inside Project Brainwave’s Cloud-Scale, Real-Time AI Processor. IEEE Micro 2019, 39, 20–28. [Google Scholar]
- Nagel, M.; Baalen, M.v.; Blankevoort, T.; Welling, M. Data-free quantization through weight equalization and bias correction. In Proceedings of the IEEE/CVF International Conference on Computer Vision, Seoul, Republic of Korea, 27 October–2 November 2019; pp. 1325–1334. [Google Scholar]
- Cai, Y.; Yao, Z.; Dong, Z.; Gholami, A.; Mahoney, M.W.; Keutzer, K. Zeroq: A novel zero shot quantization framework. In Proceedings of the IEEE/CVF Conference on Computer Vision and Pattern Recognition, Seattle, WA, USA, 14–19 June 2020; pp. 13169–13178. [Google Scholar]
- Li, Y.; Gong, R.; Tan, X.; Yang, Y.; Hu, P.; Zhang, Q.; Yu, F.; Wang, W.; Gu, S. Brecq: Pushing the limit of post-training quantization by block reconstruction. arXiv 2021, arXiv:2102.05426. [Google Scholar]
- Finkelstein, A.; Almog, U.; Grobman, M. Fighting quantization bias with bias. arXiv 2019, arXiv:1906.03193. [Google Scholar]
- Ioffe, S.; Szegedy, C. Batch normalization: Accelerating deep network training by reducing internal covariate shift. In Proceedings of the International Conference on Machine Learning, PMLR, Lille, France, 6–11 July 2015; pp. 448–456. [Google Scholar]
- Han, S.; Pool, J.; Tran, J.; Dally, W. Learning both weights and connections for efficient neural network. Adv. Neural Inf. Process. Syst. 2015, 28. [Google Scholar]
- Gale, T.; Elsen, E.; Hooker, S. The state of sparsity in deep neural networks. arXiv 2019, arXiv:1902.09574. [Google Scholar]
- Renda, A.; Frankle, J.; Carbin, M. Comparing rewinding and fine-tuning in neural network pruning. arXiv 2020, arXiv:2003.02389. [Google Scholar]
- Muhammad, M.B.; Yeasin, M. Eigen-cam: Class activation map using principal components. In Proceedings of the 2020 International Joint Conference on Neural Networks (IJCNN), Glasgow, UK, 19–24 July 2020; IEEE: Piscataway, NJ, USA, 2020; pp. 1–7. [Google Scholar]
- He, K.; Zhang, X.; Ren, S.; Sun, J. Delving deep into rectifiers: Surpassing human-level performance on imagenet classification. In Proceedings of the IEEE International Conference on Computer Vision, Santiago, Chile, 7–13 December 2015; pp. 1026–1034. [Google Scholar]
- Faghri, F.; Fleet, D.J.; Kiros, J.R.; Fidler, S. Vse++: Improving visual-semantic embeddings with hard negatives. arXiv 2017, arXiv:1707.05612. [Google Scholar]
- Cordts, M.; Omran, M.; Ramos, S.; Rehfeld, T.; Enzweiler, M.; Benenson, R.; Franke, U.; Roth, S.; Schiele, B. The cityscapes dataset for semantic urban scene understanding. In Proceedings of the IEEE Conference on Computer Vision and Pattern Recognition, Las Vegas, NV, USA, 27–30 June 2016; pp. 3213–3223. [Google Scholar]
- Liu, F.; Qiao, R.; Chen, G.; Gong, G.; Lu, H. CASSANN-v2: A high-performance CNN accelerator architecture with on-chip memory self-adaptive tuning. IEICE Electron. Express 2022, 19, 20220124. [Google Scholar] [CrossRef]
Disclaimer/Publisher’s Note: The statements, opinions and data contained in all publications are solely those of the individual author(s) and contributor(s) and not of MDPI and/or the editor(s). MDPI and/or the editor(s) disclaim responsibility for any injury to people or property resulting from any ideas, methods, instructions or products referred to in the content. |
© 2025 by the authors. Licensee MDPI, Basel, Switzerland. This article is an open access article distributed under the terms and conditions of the Creative Commons Attribution (CC BY) license (https://creativecommons.org/licenses/by/4.0/).