Article

Separation of Body and Surface Wave Background Noise and Passive Seismic Interferometry Based on Synchrosqueezed Continuous Wavelet Transform

State Key Laboratory of Deep Earth Exploration and Imaging, College of GeoExploration Science and Technology, Jilin University, Changchun 130026, China
*
Author to whom correspondence should be addressed.
Appl. Sci. 2025, 15(7), 3917; https://doi.org/10.3390/app15073917
Submission received: 5 March 2025 / Revised: 26 March 2025 / Accepted: 27 March 2025 / Published: 2 April 2025

Abstract

:
Passive seismic interferometry is a technique that reconstructs virtual seismic records using ambient noise, such as random noise or microseisms. The ambient noise in passive seismic data contains rich information, with surface waves being useful for the inversion of shallow subsurface structures, while body waves are employed for deep-layer inversion. However, due to the low signal-to-noise ratio in actual passive seismic data, different types of seismic waves mix together, making them difficult to distinguish. This issue not only affects the dispersion measurements of surface waves but also interferes with the imaging accuracy of reflected waves. Therefore, it is crucial to extract the target waves from passive source data. In practical passive seismic data, body wave noise and surface wave noise often overlap in frequency bands, making it challenging to separate them effectively using conventional methods. The synchrosqueezed continuous wavelet transform, as a high-resolution time–frequency analysis method, can effectively capture the variations in frequency of passive seismic data. This study performs time–frequency analysis of passive seismic data using synchrosqueezed continuous wavelet transform. It combines wavelet thresholding and Gaussian filtering to separate body wave noise from surface wave noise. Furthermore, wavelet cross-correlation is applied to separately obtain high-quality virtual seismic records for both surface waves and body waves.

1. Introduction

In recent decades, with the rapid development of seismic interferometry (SI), passive seismic exploration has garnered increasing attention from researchers due to its advantages such as low acquisition cost, high flexibility in data reconstruction, and rich information content (Shang et al., 2021) [1]. Currently, the data acquisition in passive seismic exploration mainly relies on nodal seismic receivers. Compared with traditional cabled seismic instruments, nodal seismic receivers are not only lightweight but also relatively flexible to deploy. Moreover, they can independently and continuously record data without the need to transmit it back to the main seismic instrument through acquisition cables (Ren et al., 2021) [2]. Wang et al. (2018) [3] used nodal seismic receivers to record ambient noise data and obtained the shallow crustal velocity structure through cross-correlation. Meanwhile, in passive seismic data acquisition, there may be requirements such as placing seismic geophones at specific locations, as well as detecting the hardware status of the instruments and the quality of the data. These functions can also be achieved through intelligent control of nodal seismic receivers. Landar et al. (2024) [4] proposed a method using the Smart 4 Controller to assist operators in effectively evaluating the vibrations and impact loads at the bottom of the drill string during drilling operations in oil and gas development, which helps reduce emergencies such as damage to drill string components.
SI reconstructs Green’s function between two receivers by cross-correlating the seismic records received by different geophones. Claerbout (1968) [5] was the first to propose in his paper that, in an acoustic one-dimensional layered medium, the autocorrelation of seismic records received at a free surface is equivalent to the self-stimulating and self-receiving seismic records. This conclusion can be extended to the non-self-stimulating and non-self-receiving: if cross-correlation is performed between different seismic traces, a new seismic record can be obtained, with one seismic trace acting as a virtual source stimulating the seismic response received by the other seismic trace. Claerbout also suggested that this conclusion applies to 3D anisotropic media. Later, Rickett et al. (1999) [6] extended this method to multi-dimensional models and named it Acoustic Daylight Imaging. Schuster (2008) [7] renamed this method seismic interferometry and elaborated on the basic principles of SI, demonstrating its broad range of applications, including data transformation, interpolation, passive signal extraction, and imaging. Based on the reciprocity theorem of the one-way wave equation and assuming no wavefield scattering, Wapenaar and Fokkema (2006) [8] made rigorous theoretical inferences for noise sources in 3D inhomogeneous media and proved that SI holds under different non-attenuating media and source conditions. Subsequently, passive seismic interferometry has continued to advance. Wapenaar et al. (2008) [9] proposed a passive seismic interferometry method based on multi-dimensional deconvolution, which, compared to conventional cross-correlation methods, can still reconstruct high-quality virtual seismic records in cases of irregular underground source distributions. Nakata et al. (2012) [10] applied cross-correlation methods to reconstruct virtual seismic records from traffic noise, successfully extracting both body waves and surface waves.
However, there are several challenges in using passive seismic data for exploration. Due to the relatively low signal-to-noise ratio of passive seismic data, the seismic records obtained after cross-correlation are difficult to process (Vidal et al., 2014) [11]. This is because body wave noise and surface wave noise in passive data frequently overlap in both spatial locations and frequency bands, making traditional filtering methods less effective (Galiana-Merino et al., 2003) [12]. By identifying and separating body wave-dominated noise and surface wave-dominated noise from the original data prior to cross-correlation and then performing cross-correlation and stacking on each noise type separately, it is possible to obtain high-quality virtual seismic records for both body waves and surface waves. However, the passive seismic data collected in practice are quite complex, with multiple signals overlapping and energy distribution being uneven. This makes it difficult to distinguish surface wave noise and body wave noise in the original passive data (Cheraghi et al., 2015) [13]. Due to the characteristics of surface waves, such as long propagation distances, slow attenuation, and high energy, and because most noise sources in actual data collection originate from the surface, the energy of surface waves is relatively strong in passive seismic data (Ruan et al., 2023) [14]. Therefore, extracting surface waves using SI is relatively straightforward. However, due to the complexity of passive seismic signals, the extraction of surface wave dispersion curves is still prone to interference. As a result, many researchers have conducted studies and practical applications on this topic. Nakamura (1989) [15] proposed a Horizontal-to-Vertical Spectral Ratio (HVSR) method, which inverts passive surface waves using the vertical and horizontal components from a single station. Xia et al. (2017) [16] introduced the Multi-Channel Analysis of Passive Surface Waves (MAPS) method, replacing the active source in Multi-Channel Analysis of Surface Waves (MASW) with passive sources, allowing accurate imaging of surface wave dispersion energy using short-duration passive seismic records. Wang et al. (2019) [17] proposed a frequency–Bessel transform method (F-J), which can clearly image multimodal dispersion curves from ambient seismic noise data recorded by observation arrays. This method was applied to USArray data recorded in the central United States. Chen et al. (2022) [18] used convolutional neural networks (CNNs) to determine the Rayleigh wave phase velocity and validated with real data that the CNN can be used for near-surface subsurface imaging. Mi et al. (2023) [19] successfully extracted surface waves from train vibrations using seismic interferometry, while Wang et al. (2023) [20] applied surface waves measured from ambient noise for 3D tomography.
Body wave signals are relatively weak in passive seismic records and are difficult to extract in practice. However, due to their higher frequency, they can enhance the resolution of subsurface imaging. As a result, considerable research has been conducted on the extraction of body waves. In terms of data acquisition, Bakulin et al. (2018) [21] proposed a novel acquisition scheme using Distributed Fiber Acoustic Sensing (DAS) technology. By adopting buried vertical arrays, the surface wave noise can be significantly reduced. Alternatively, dampers or vibration isolation layers can be used when placing sensors. Velychkovych et al. (2025) [22] proposed a new shell damper and predicted its application in borehole shock absorbers in the oil and geothermal industries. Vidal et al. (2014) [11] used the method of inclined stacking illumination analysis to distinguish low-velocity surface waves and high-velocity body waves along a 2D profile and validated the proposed method using passive data recorded in Annerveen, northern Netherlands. Cheraghi et al. (2017) [23] applied beamforming to analyze real data from a CO2 storage monitoring project, separating body waves and surface waves from the original passive data based on source azimuth and velocity distribution. Fang et al. (2022) [24] extracted body waves by calculating the signal-to-noise ratio of the data before cross-correlation and applied this method to real data from Inner Mongolia, China. Jin et al. (2024) [25] proposed a method using F-k spectral analysis to identify body wave noise and surface wave noise from raw passive noise data. This method was applied to real data from Songke-2, Northeast China, successfully extracting high-quality surface waves and body waves.
Time–frequency analysis, as a widely used signal processing technique in seismic exploration, is highly effective for the processing of non-stationary signals. Traditional frequency-domain or time-domain analysis methods often fail to provide a comprehensive understanding of the signal characteristics. Time–frequency transformation techniques, by simultaneously analyzing the variations in the signal in both time and frequency domains, can effectively reveal the features of different seismic waves, especially demonstrating significant advantages in the processing of non-stationary signals (Han and Baan, 2013; Wang et al., 2017) [26,27]. Among commonly used time–frequency transformations, Fourier transform performs poorly for non-stationary signals. Although the short-time Fourier transform processes non-stationary signals by windowing, the window width is difficult to optimize: if the window is too wide, the time resolution is insufficient; if the window is too narrow, the frequency resolution is inadequate. On the other hand, continuous wavelet transform (CWT) replaces the infinite-length triangular basis function with a finite-length decaying wavelet basis, solving the scaling issue of the window. However, it is highly dependent on the choice of the mother wavelet and suffers from relatively low resolution (Mousavi and Langston, 2017) [28]. Due to the limitations of conventional time–frequency analysis methods in meeting the analytical requirements, the synchrosqueezed continuous wavelet transform (SWT) combines CWT and the reallocation method (Daubechies et al., 2011) [29]. Based on wavelet transform, SWT performs squeezing and reshuffling in the scale direction according to the magnitude of the modulus of the wavelet coefficients in the spectrum. Finally, by mapping, it generates a time–frequency spectrum with more concentrated energy in the time–frequency domain. While Daubechies et al. (2011) [29] initially developed SWT based on the concept of Empirical Mode Decomposition (EMD), SWT offers a more rigorous mathematical derivation and supports inverse transformation, in contrast to EMD. Subsequently, Li and Liang (2012) [30] introduced generalized synchrosqueezed wavelet transform, which addresses the limitation of the original SWT by incorporating additional factors beyond just the scale factor. Thakur et al. (2013) [31] demonstrated that SWT is applicable to both noise and non-uniformly sampled data in engineering and natural environments. Since then, SWT has been widely used in seismic data analysis and processing, as well as in oil and gas exploration and reservoir prediction (Liu et al., 2017 [32]; Zhang et al., 2017 [33]). Mousavi et al. (2016) [34] utilized SWT for denoising microseismic signals and detecting the onset of microseismic events.
In this study, based on the differences in the distribution of passive surface waves and body waves across different frequency bands, we use time–frequency analysis, specifically SWT, to identify body wave noise and surface wave noise in passive seismic data. By combining this with denoising techniques, we aim to minimize the mutual interference between them. Furthermore, high-quality body and surface waves are extracted through cross-correlation in the wavelet domain.

2. Theory

2.1. Cross-Correlation Seismic Interferometry

This section mainly presents the basic formulas of SI derived from the reciprocity theorem by Wapenaar and Fokkema (2006) [8], as shown in Figure 1. To fulfill the assumption of SI that sources enclose the receivers, receivers X A and X B are located within a closed region formed by D 1 and D 2 , with multiple sources S n situated along D 2 (when D 1 represents a free surface, the assumption remains valid even if the receivers are located on D 1 , as long as sources are present along D 2 ).
In this scenario, frequency-domain Green’s functions between the source S and the receivers X A and X B are represented as G ^ X A , S , ω and G ^ X B , S , ω (Figure 1). The reconstruction of Green’s functions between receivers X A and X B can then be expressed as
G ^ X B , X A , ω + G ^ X A , X B , ω = 2 Ɍ G ^ X A , X B , ω = D 2 1 j ω ρ x G ^ S , X A , ω i G ^ S , X B , ω i G ^ S , X A , ω G ^ S , X B , ω n i d 2 x
Equation (1) represents the exact frequency-domain expression for any lossless, heterogeneous acoustic medium. The Green’s function G ^ X A , X B , ω   reconstructed from Equation (1) includes multiple wave components between receivers X A and X B . However, Equation (1) has certain limitations: the integral in Equation (1) contains two cross-correlation terms, which need to be calculated independently; the response generated by monopole and dipole sources at arbitrary positions on D 2 must be received; and the source is required to be a point impulse source. These conditions do not align with practical applications. Therefore, in practice, Equation (1) is often approximated as follows (Wapenaar and Fokkema, 2006) [8]:
  • Approximate the medium outside the D 2 boundary as homogeneous;
  • Apply the far-field approximation, using a monopole to represent the dipole source;
  • The surrounding medium parameters are assumed to undergo a uniform transformation.
The final equation for cross-correlation seismic interferometry is
2 Ɍ G ^ X A , X B , ω D 2 2 j ω ρ x i G ^ X A , S , ω G ^ X B , S , ω n i d 2 x

2.2. Synchrosqueezed Continuous Wavelet Transform

This section presents the theoretical derivation of the forward and inverse transforms of SWT proposed by Daubechies (2011) [29]. First, for a given signal f ( t ) in the time domain, we apply the CWT. Let the mother wavelet function selected be φ; then, the transformation equation for CWT is as follows:
W f a , b = f t a 1 2 φ * t b a d t
In Equation (3), W f a , b denotes the wavelet coefficients, where a is the scale parameter, b is the time parameter, and φ * is the complex conjugate of the mother wavelet function. Commonly used mother wavelets include Haar, Morlet, Symlets, and Meyer wavelets. In this study, the Morlet wavelet is chosen due to its highly localized nature in the frequency domain (Ngui et al., 2013) [35]. According to the Plancherel theorem (Deitmar, 2002) [36], the beam-domain expression of Equation (3) is given by
W f a , b = 1 2 π f ^ ε a 1 2 φ ^ a ε e i b ε d ε
where ε is the angular frequency and f ^ ε and φ ^ are the Fourier transforms of f t and ε t , respectively. Furthermore, f ^ ε can be expressed as
f ^ ε = π A δ ε ω + δ ε + ω
By substituting Equation (5) into Equation (4), we obtain
W f a , b = A 4 π a 1 2 φ ^ a ε e i b ε
where φ ^ ( ε ) tends to zero in the negative frequency domain and is concentrated around ε = ω 0 , and the coefficient W f a , b becomes concentrated at a = ω 0 ω in the time–frequency domain and is distributed along the scale within a certain range. The estimated instantaneous frequency obtained by taking the partial derivative of the wavelet coefficients is given by
ω f a , b = i W f a , b 1 b W f a , b , W f a , b > 0 , W f a , b > 0
Using Equation (7), the wavelet coefficients W f a , b undergo a transformation from the time–scale domain to the time–frequency domain, resulting in W f ω f a , b , b . In this domain, the compressed wavelet coefficient values T f ( ω i , b ) can be derived by compressing the values within the frequency interval ω i 1 2 Δ ω , ω i + 1 2 Δ ω surrounding a given frequency ω i . Consequently, the forward transformation formula for the synchronized wavelet transform is expressed as
T f ω i , b = Δ ω 1 a k : ω k a k , b ω i Δ ω 2 W f a k , b a k 3 2 Δ a k
Similarly, the inverse transformation formula for SWT is given by
f t = R e C φ 1 l T f ω i , b ω
where C φ 1 = 0 φ * ( ε ) d ε ε , R e denotes the real part, and φ * ( ε ) is the Fourier transform of the conjugate of the mother wavelet function. The original signal can be approximately reconstructed from the inverse transform.

3. Method

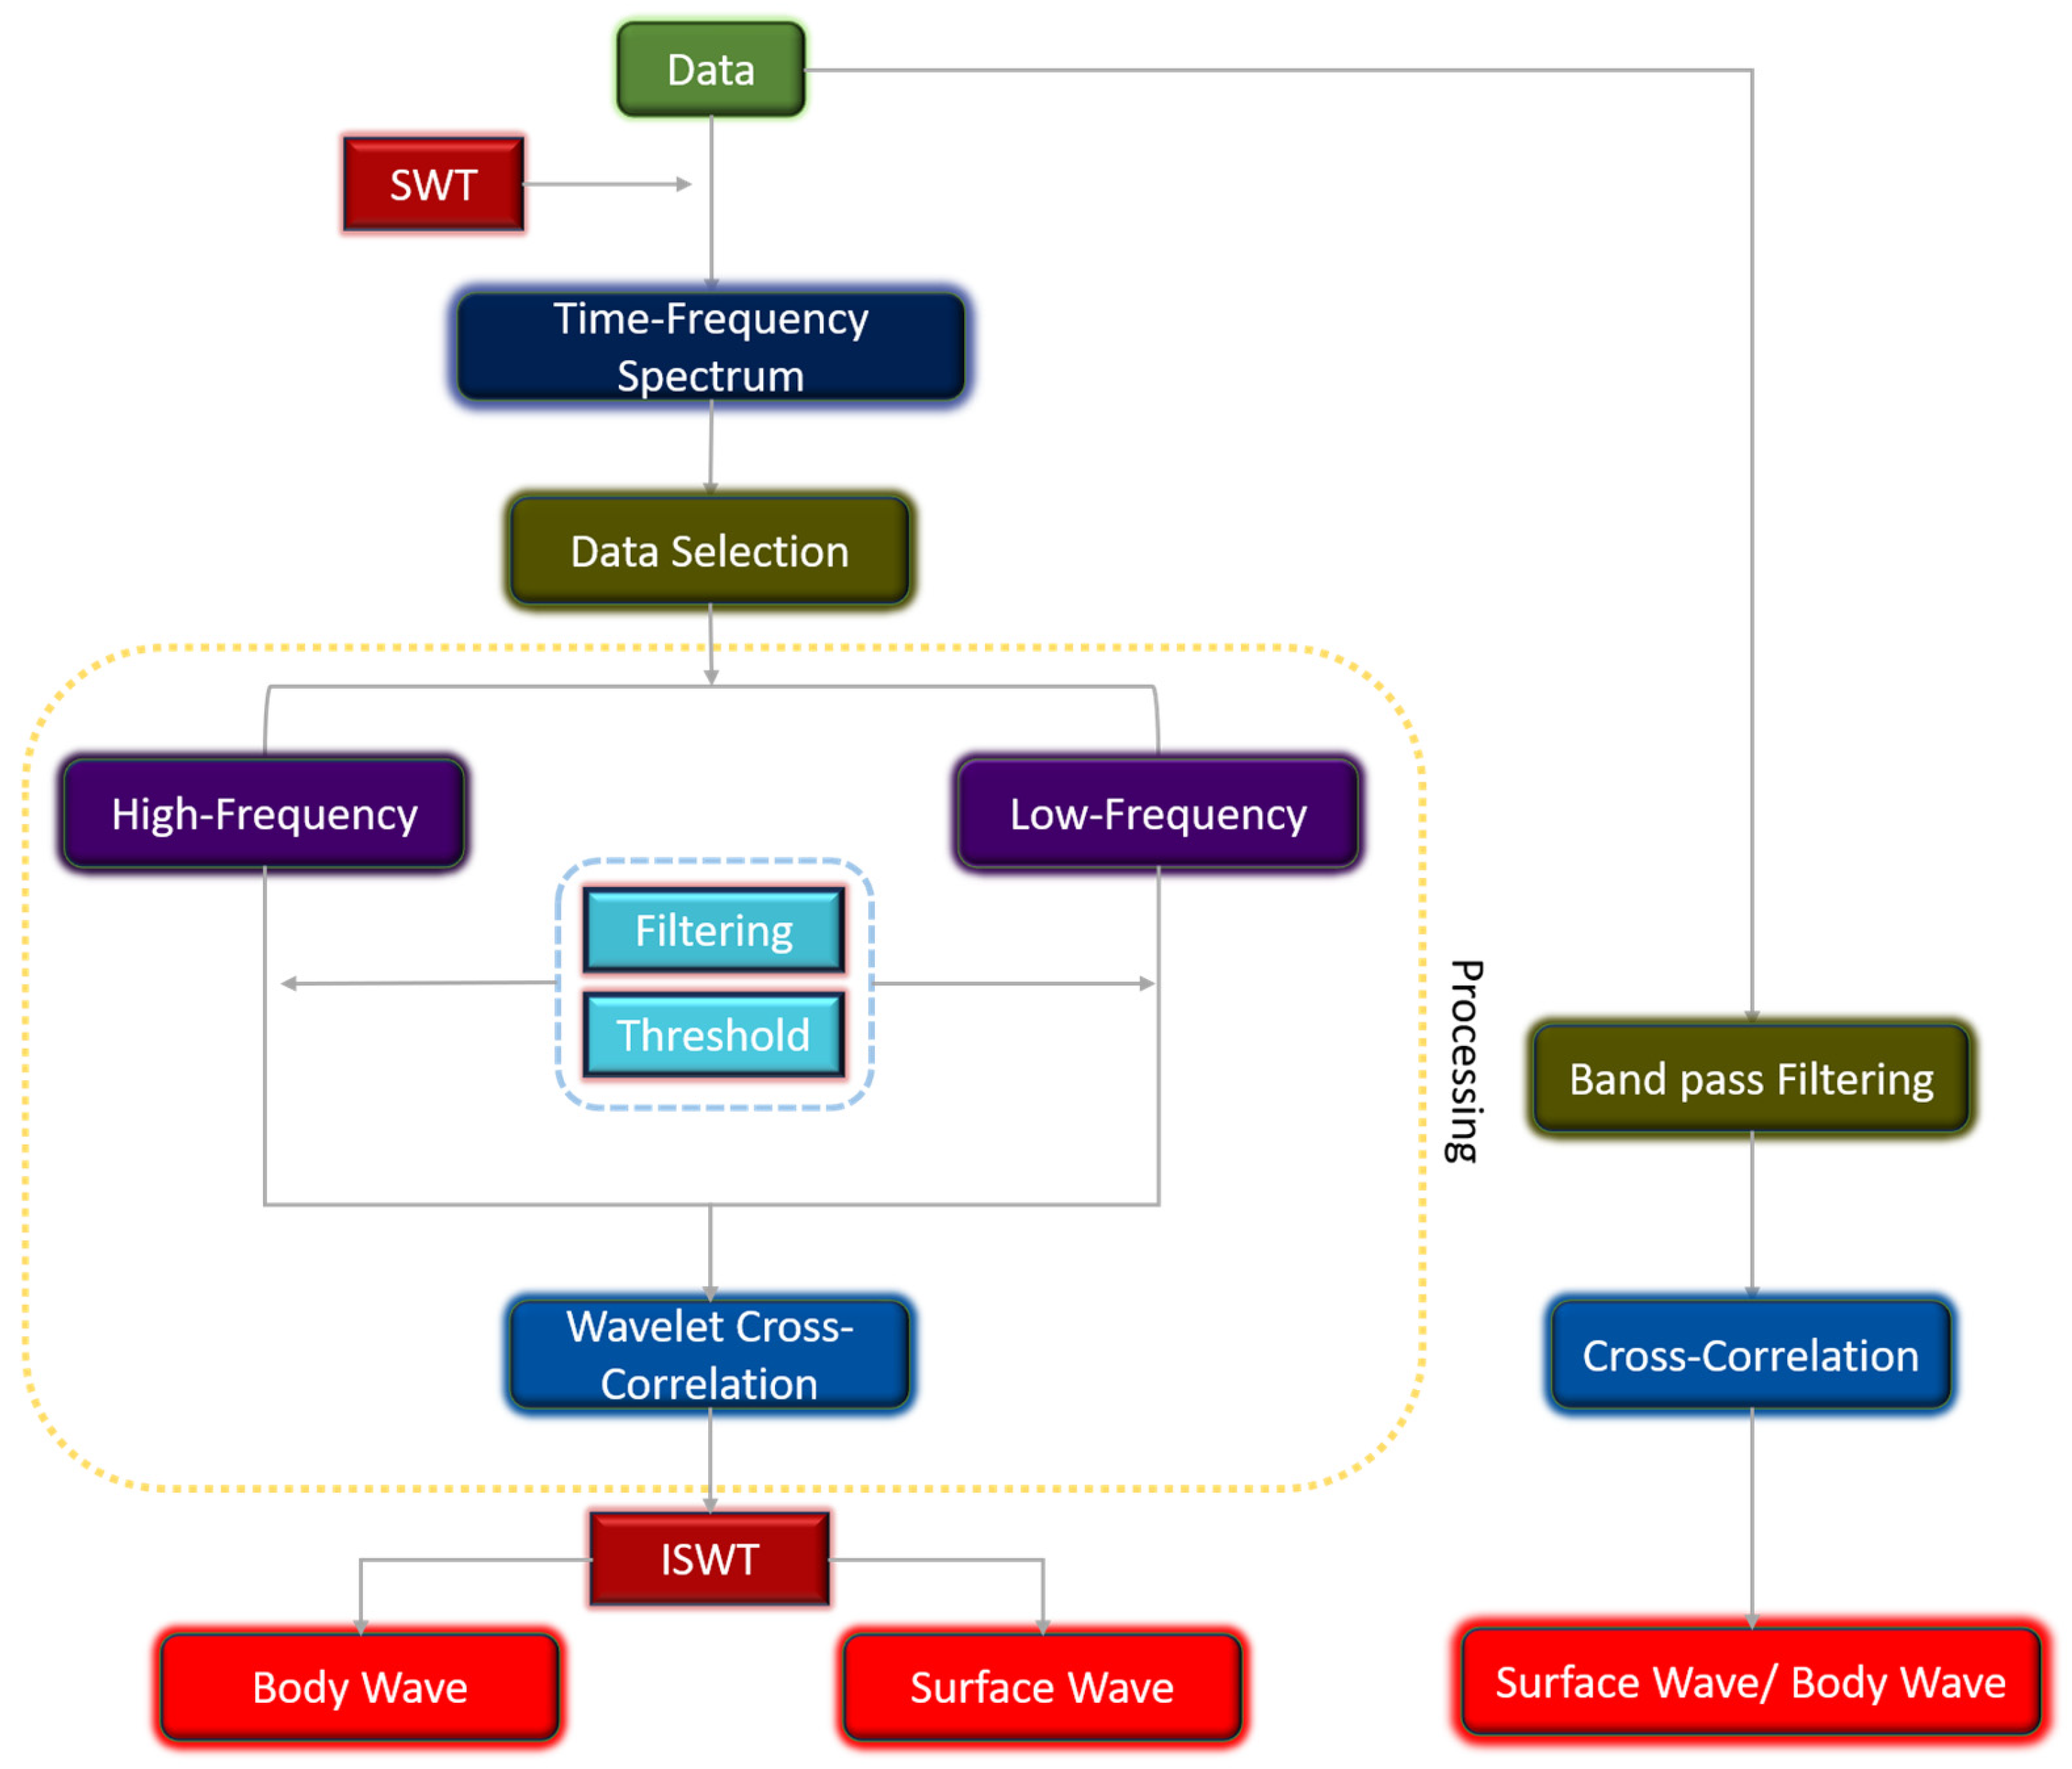
Due to the low signal-to-noise ratio of the actual collected passive seismic data, various seismic signals are mixed together (Averbuch et al., 2018) [37]. Direct cross-correlation without extracting surface wave noise and body wave noise cannot yield high-quality virtual seismic records of surface and body waves. Additionally, surface waves and low-frequency noise in passive seismic data typically have lower frequencies, whereas body waves and high-frequency noise have higher frequencies (Olivier et al., 2015) [38]. Conventional bandpass filtering methods struggle to effectively separate surface wave noise from body wave noise, often damaging one part to preserve the quality of the other, and they are still prone to high-frequency or low-frequency interference. Given the excellent time–frequency characteristics of wavelet transforms, which are commonly used in seismic data processing, we choose wavelet transform for the analysis and processing of passive seismic data in this study. Additionally, the CWT lacks sufficient resolution in the time–frequency domain, resulting in inadequate precision for data processing and analysis (Wang, 2021) [39]. To address this limitation, we utilize SWT, which provides higher resolution in the time–frequency domain, thereby facilitating more effective identification of signals and noise and enhancing the thresholding effect. After successfully separating high signal-to-noise ratio body wave noise and surface wave noise from the raw passive data, wavelet-domain cross-correlation is applied to obtain high-quality virtual seismic records for both surface waves and body waves (Figure 2).
In this study, after transforming the original passive seismic data using SWT, single-trace seismic records are selected for SWT processing. The high-frequency and low-frequency components in the time–frequency spectrum are separated, corresponding to body wave noise and surface wave noise, respectively. The background noise from the high-frequency component is selected, as surface wave energy is weak in the body wave-dominated high-frequency band, and there are also some interference events that contribute minimally to the cross-correlation results. These can be removed using wavelet thresholding, allowing the body wave signal to be preserved with minimal surface wave interference. The same approach is applied to surface wave processing. Common wavelet thresholding functions include hard and soft thresholding functions. The hard thresholding function sets all coefficients below the threshold to zero and retains those above the threshold, which often leads to significant errors. In contrast, the soft thresholding function provides smoother processing, and its formulation is as follows:
η λ s f t W s = W s λ i f   W s λ , 0   i f   | W s | < λ , W s + λ i f   W s λ .
where W f represents the wavelet coefficients and λ is the threshold. The threshold selection is based on the universal threshold proposed by Donoho and Johnston (1994) [40], given by λ = σ 2 l o g e n . At the same time, in order to retain more valid signals, Gaussian filtering is applied to smooth the data before thresholding:
W S 0 ω i , τ = ω i , τ * ω i , τ W S x y ω i , τ
where W S x y ω i , τ represents the wavelet coefficients after SWT transformation and is the 2D convolution operator. W S 0 ω i , τ is the wavelet coefficient after Gaussian filtering. Wavelet thresholding is then applied to the Gaussian-filtered wavelet coefficients to better preserve the effective signals. Through the above operations, we can obtain the processed body wave noise and surface wave noise. By cross-correlating these two components, high-quality body wave and surface wave signals can be obtained. Equation (2) already provides the time-domain expression for reconstructing the Green’s function between two signals through cross-correlation. The wavelet cross-correlation formula was given by Li and Nozaki (1997) [41]:
W C x y α , τ = l i m T 1 T T 2 T 2 W f x b , α ¯ W f y b + τ , α d b
where W f x b , α and W f y b , α represent the wavelet coefficients of the signals f x ( t ) and f y ( t ) after wavelet transform. Equations (3) and (8) above provide the CWT transformation formula for a time-domain signal and its transformation from CWT to SWT. By combining Equations (3) and (8), we can obtain the wavelet cross-correlation formula based on SWT:
W S x y ω i , τ = l i m T 1 T T 2 T 2 T f x ω i , b ¯ T f y ω i , b d b
where T f x ω i , b and T f y ω i , b represent the wavelet coefficients of f x ( t ) and f y ( t ) after SWT, respectively. Through Equation (13), W S x y ω i , τ no longer represents the time delay function of the two time-domain signals, but instead, it represents the time lag between the two seismic traces at a specific instantaneous frequency. By performing an inverse transformation on the cross-correlation result, the reconstructed high signal-to-noise ratio virtual seismic records of surface waves and body waves can be obtained in the time domain.

4. Numerical Experiments

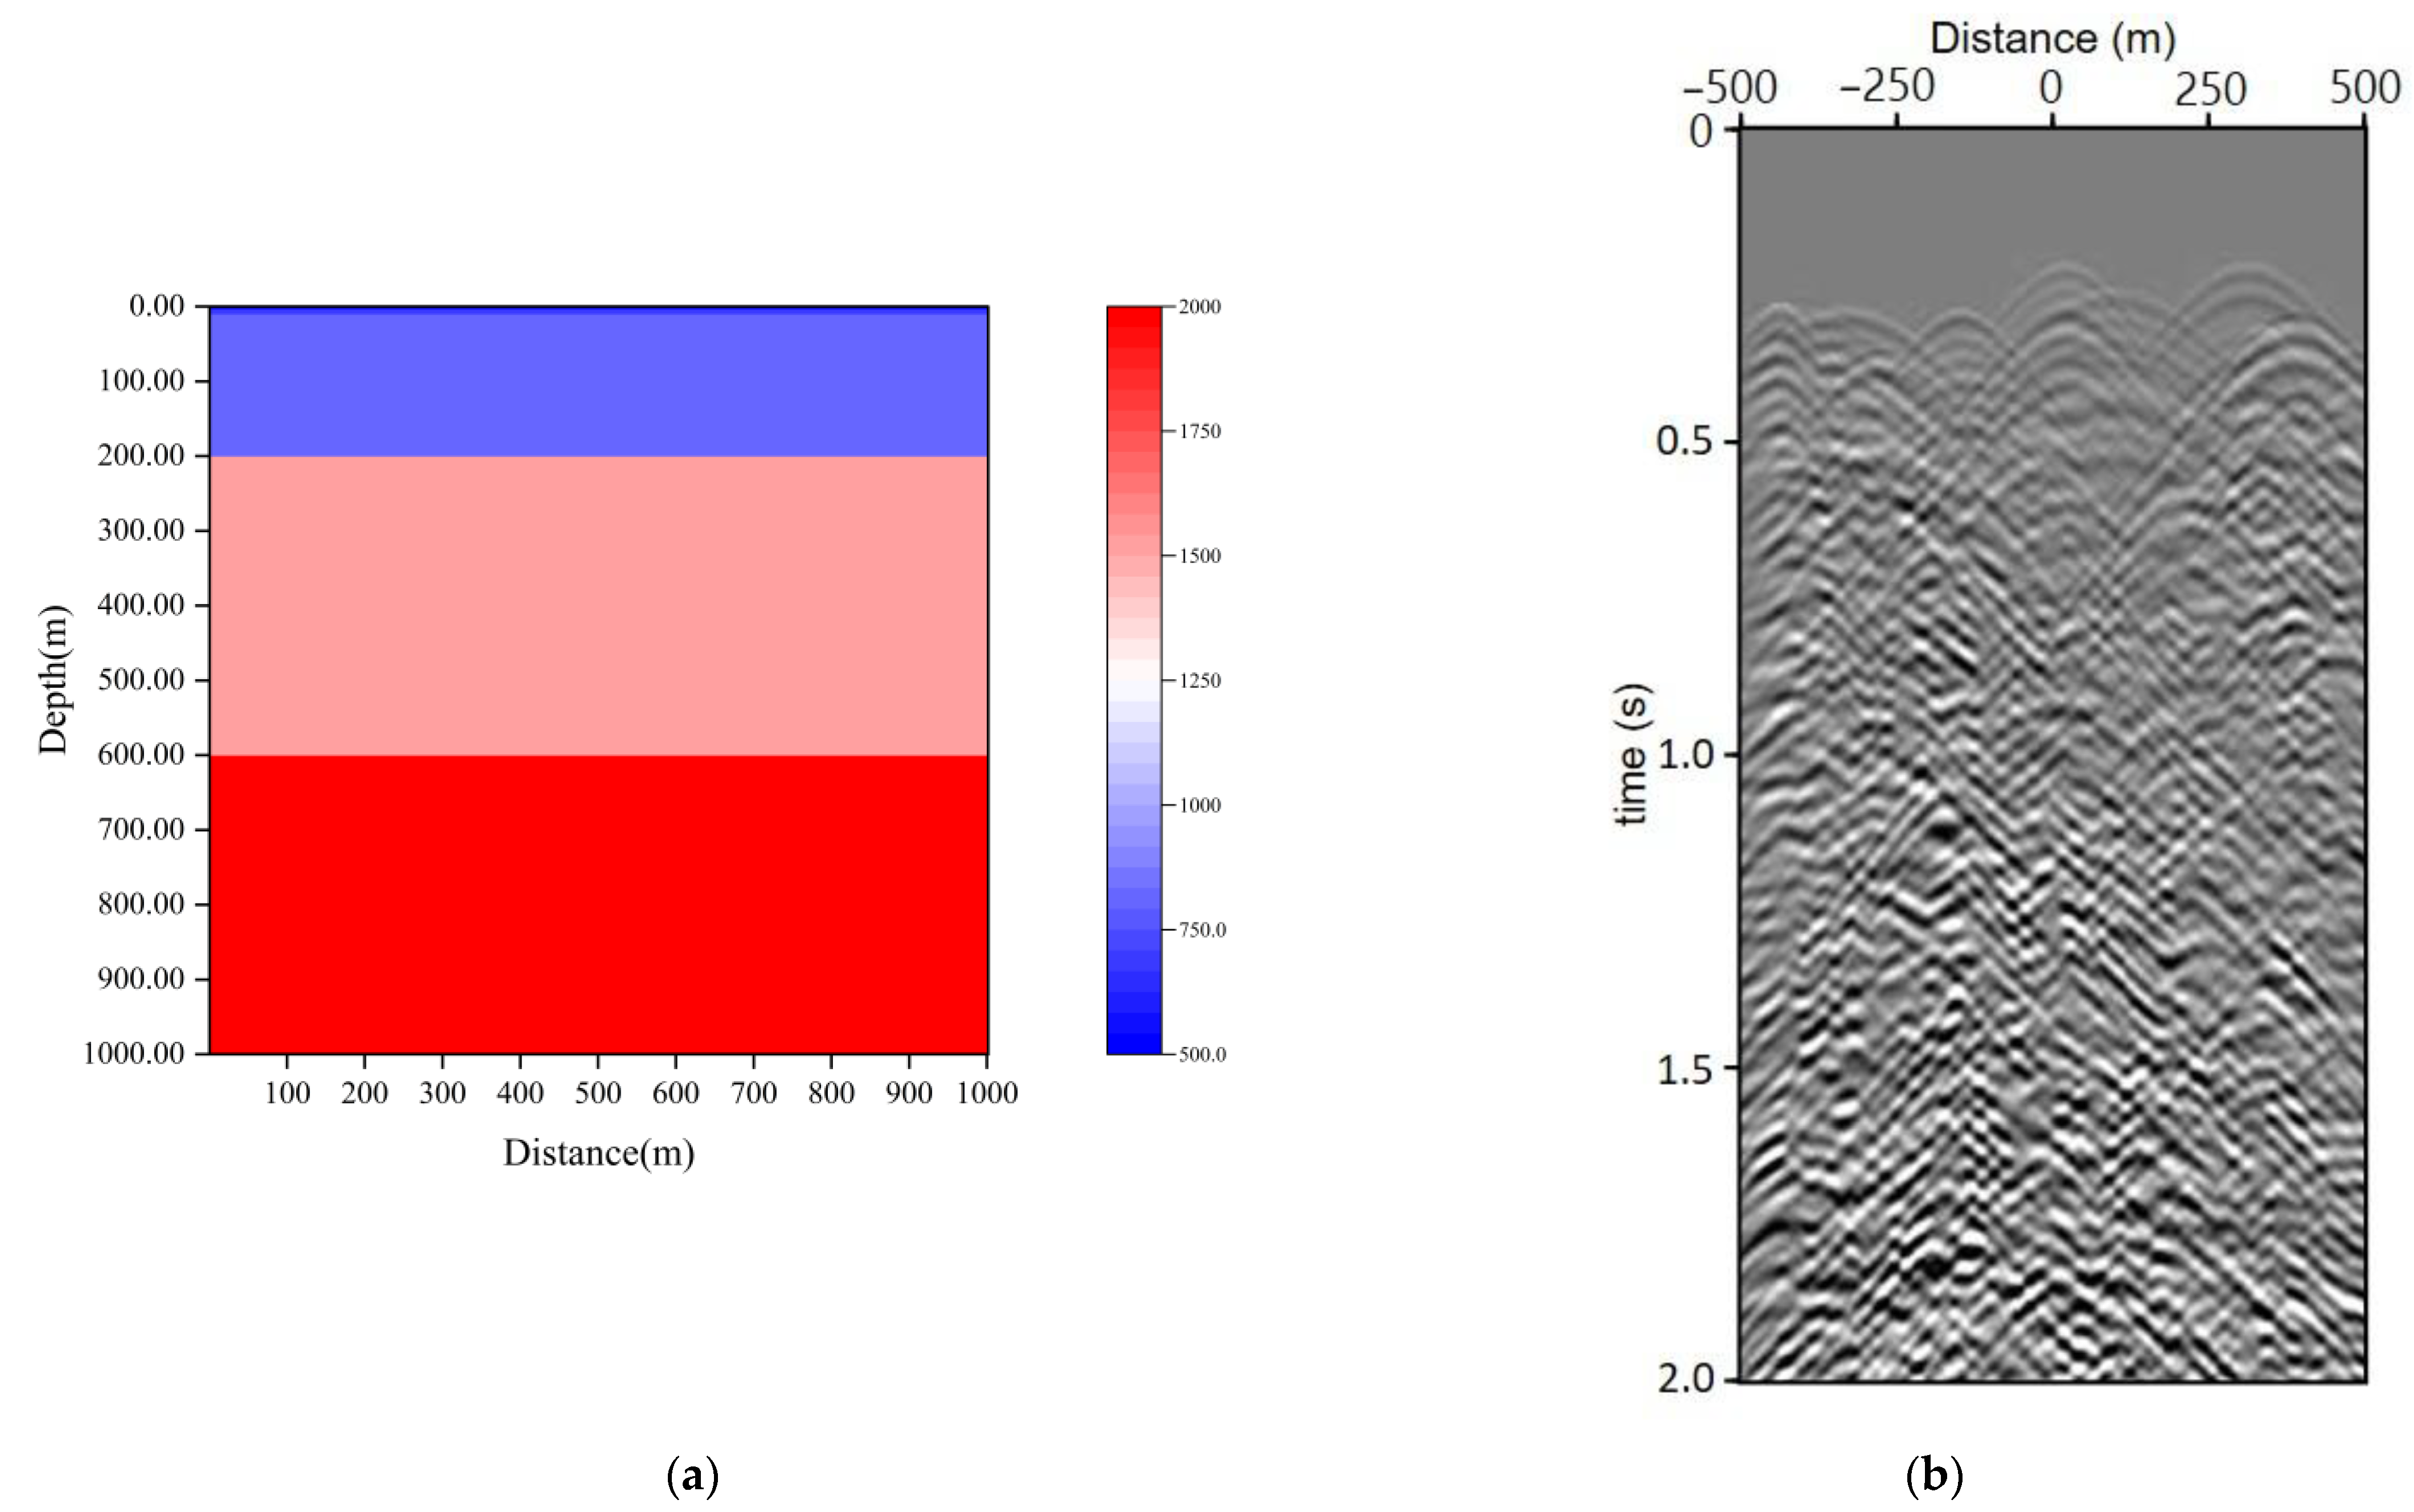
We performed numerical simulations using the finite-difference method (Thorbecke and Draganov, 2011) [42] and utilized the resulting data to assess the effectiveness of the proposed method. Figure 3a shows the P-wave velocity model used in our numerical simulation, with a size of 1000 m by 1000 m (among them, the color scale ranges from blue to red, indicating that the P-wave velocity increases from low to high). The upper boundary of the model is set as a free surface, while the left, right, and bottom boundaries are configured as tapered absorbing boundaries to prevent reflections. Considering that seismic interferometry requires cross-correlation calculations between every two receivers, we opted for a larger receiver spacing to reduce computational load. However, to ensure accurate reconstruction of the surface wave virtual shot gather, the receiver spacing cannot be too large. Therefore, the receivers are uniformly distributed with a 5 m interval along the free surface. To compensate for the short simulation time, which makes it difficult to reconstruct effective signals, we increased the number of noise sources. A total of 8000 noise sources are randomly distributed between depths of 10 m and 190 m, with a maximum frequency of 30 Hz. The amplitude of the sources follows a Gaussian distribution, and the duration of each source is 120 s multiplied by a random percentage. The noise sources are triggered at random times during the 120 s simulation period. For the numerical simulation in the elastic medium, we set the S-wave velocity to 60% of the P-wave velocity.
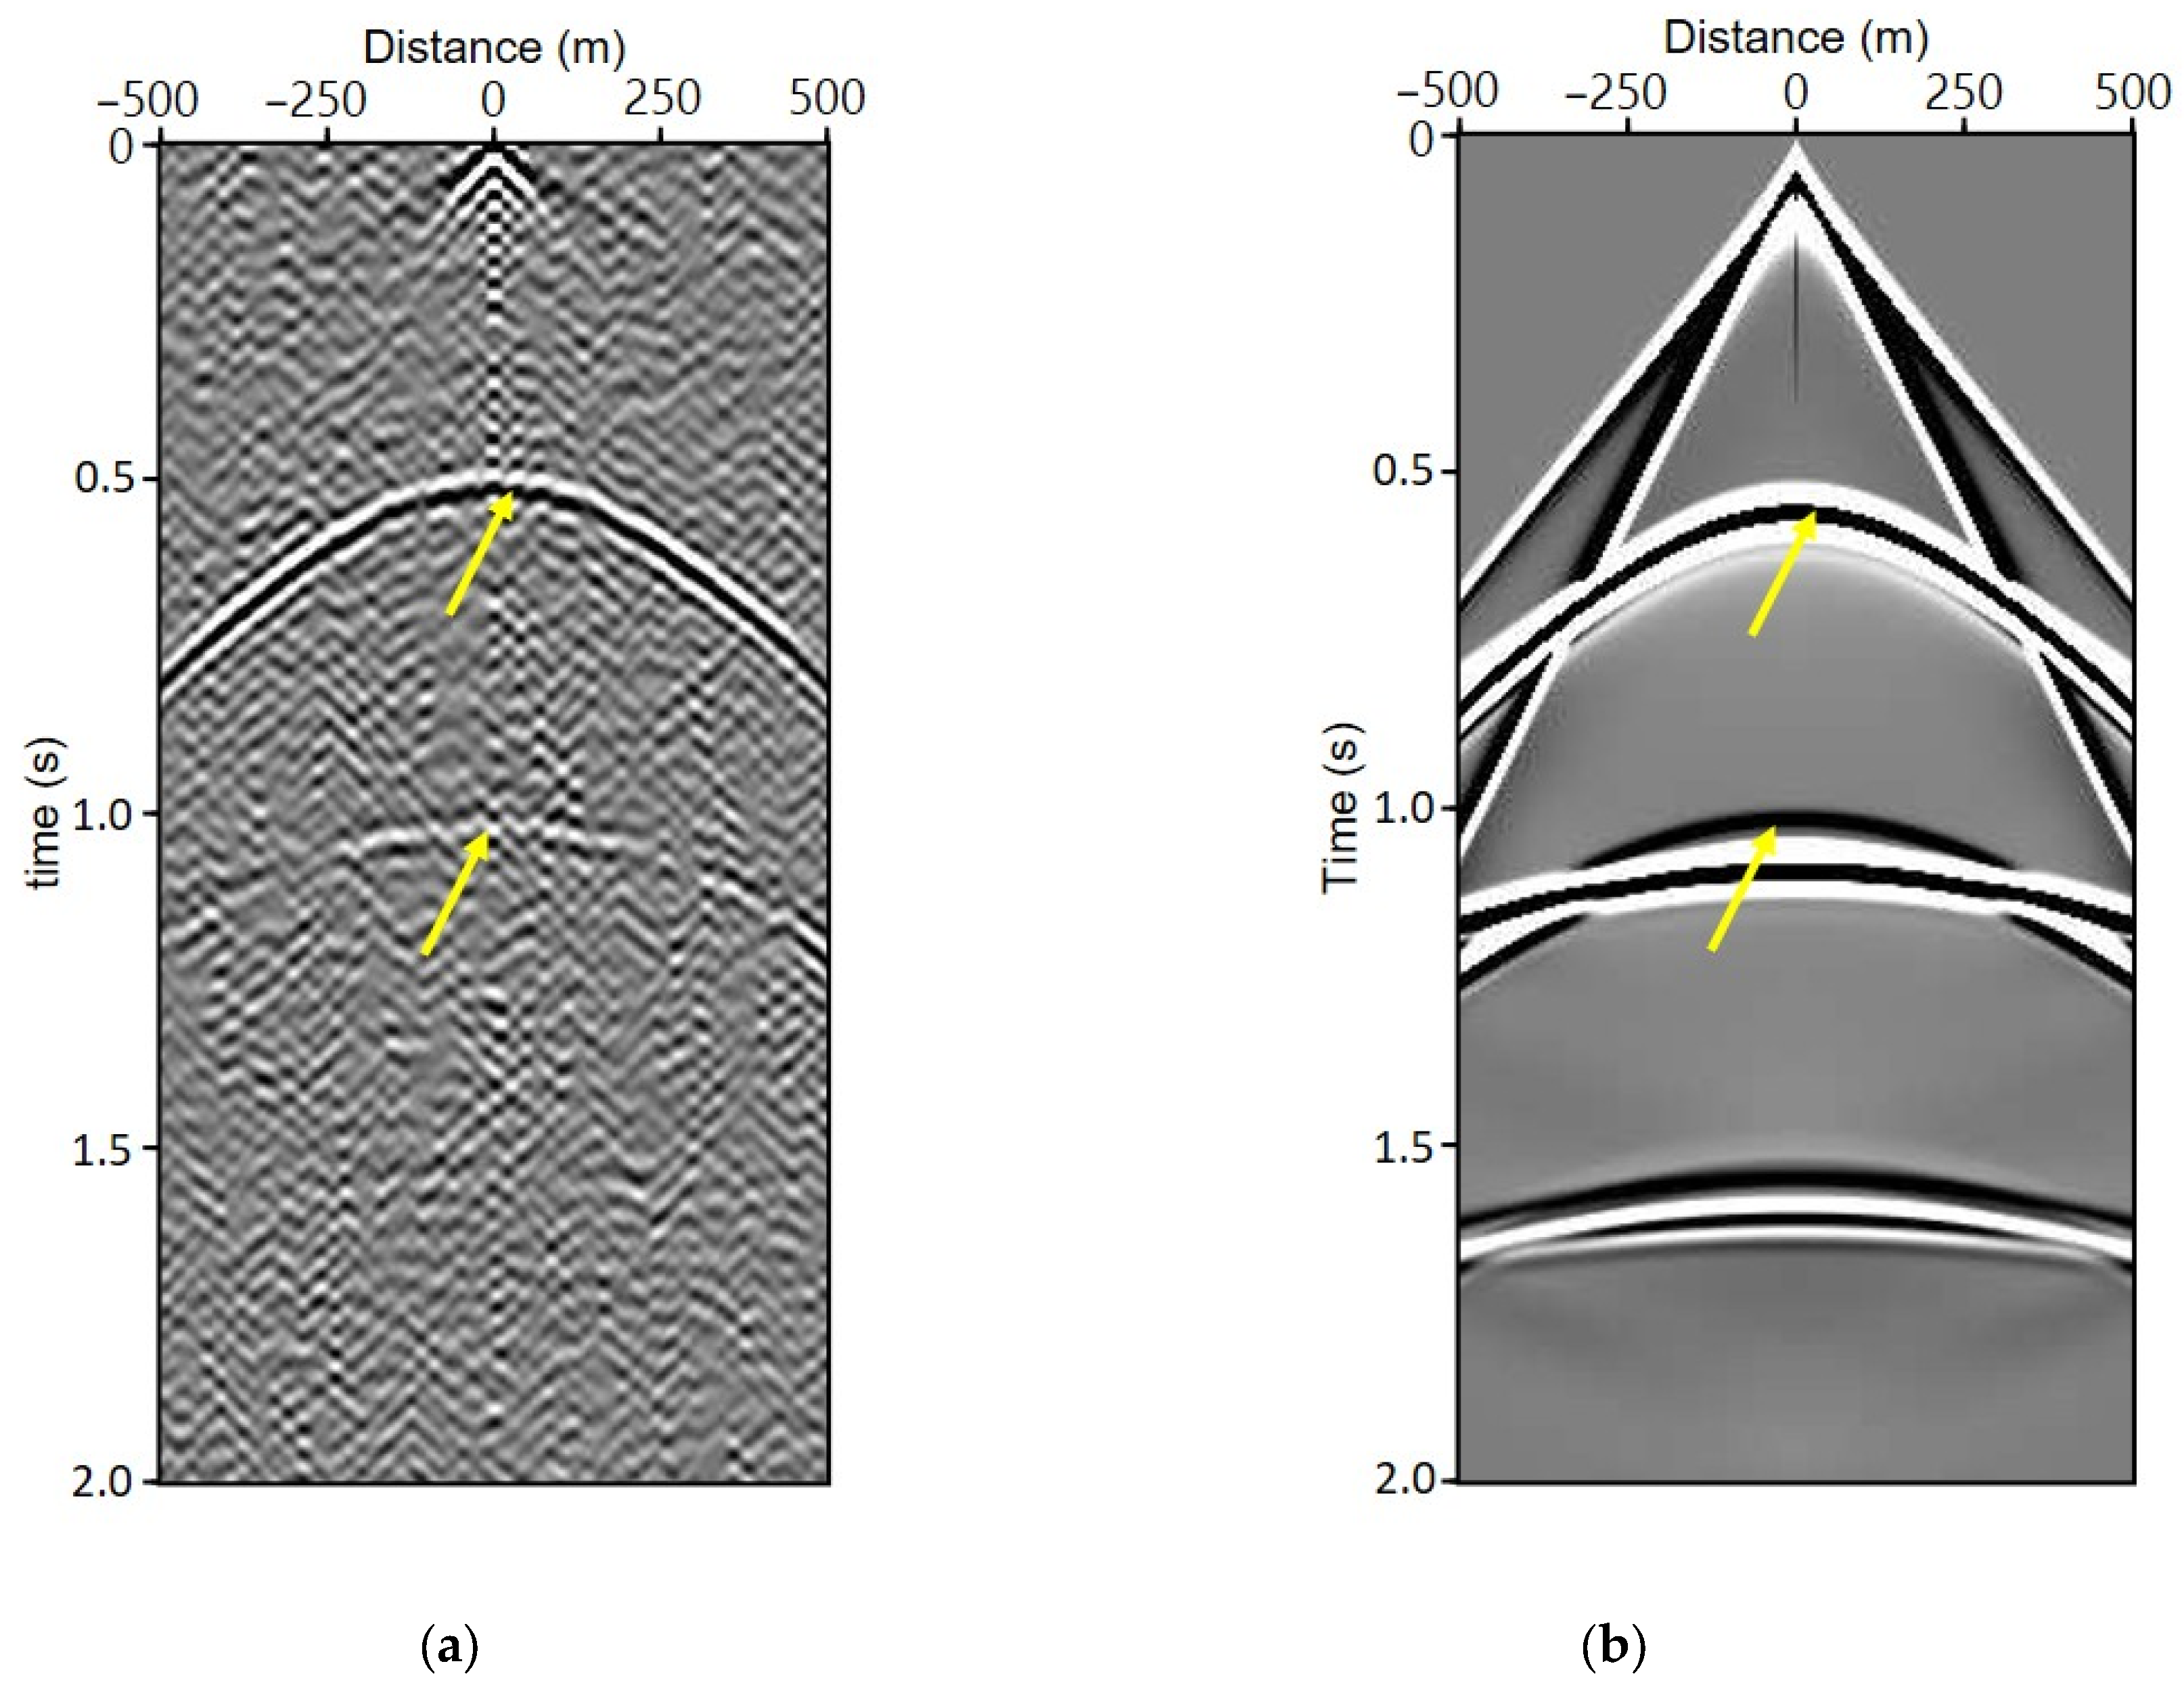
First, we select a geophone located at a horizontal distance of 0 m as the virtual source position. As the data are from numerical simulations, we did not conduct normalization and spectral whitening operations. Instead, we directly performed cross-correlation on the vertical component (Z-component) of the passive seismic data. The results are shown in Figure 4a, where clear surface wave dispersion is observed, along with reflected waves at 0.5 s, 0.7 s, and 1.0 s. To verify the reliability of the cross-correlation results, we conducted a similar active numerical simulation using the same model. The same source position is chosen at a horizontal distance of 0 m, with the geophone arrangement identical to that of the passive source. The difference lies in the selection of the source dominant frequency, which is set to 20 Hz. The vertical component shot gather is shown in Figure 4b. Compared to the virtual shot gather in Figure 4a, consistent surface wave dispersion is observed, along with reflected waves indicated by the arrows.
We performed the same experiment using the above model in an acoustic medium, and the results are shown in Figure 5. Figure 5a shows the virtual shot seismic record, obtained by cross-correlating the passive simulated data in the acoustic medium, while Figure 5b shows the direct seismic shot gather from the active source simulation in the acoustic medium. In both shot gathers, clear reflections from interfaces at 200 m and 600 m are indicated by the yellow arrows, corresponding to those observed in the elastic medium. Furthermore, a comparison of the horizontal component (X-component) seismic records also confirms that the red arrows in the shot gathers of Figure 4a,b represent converted waves.
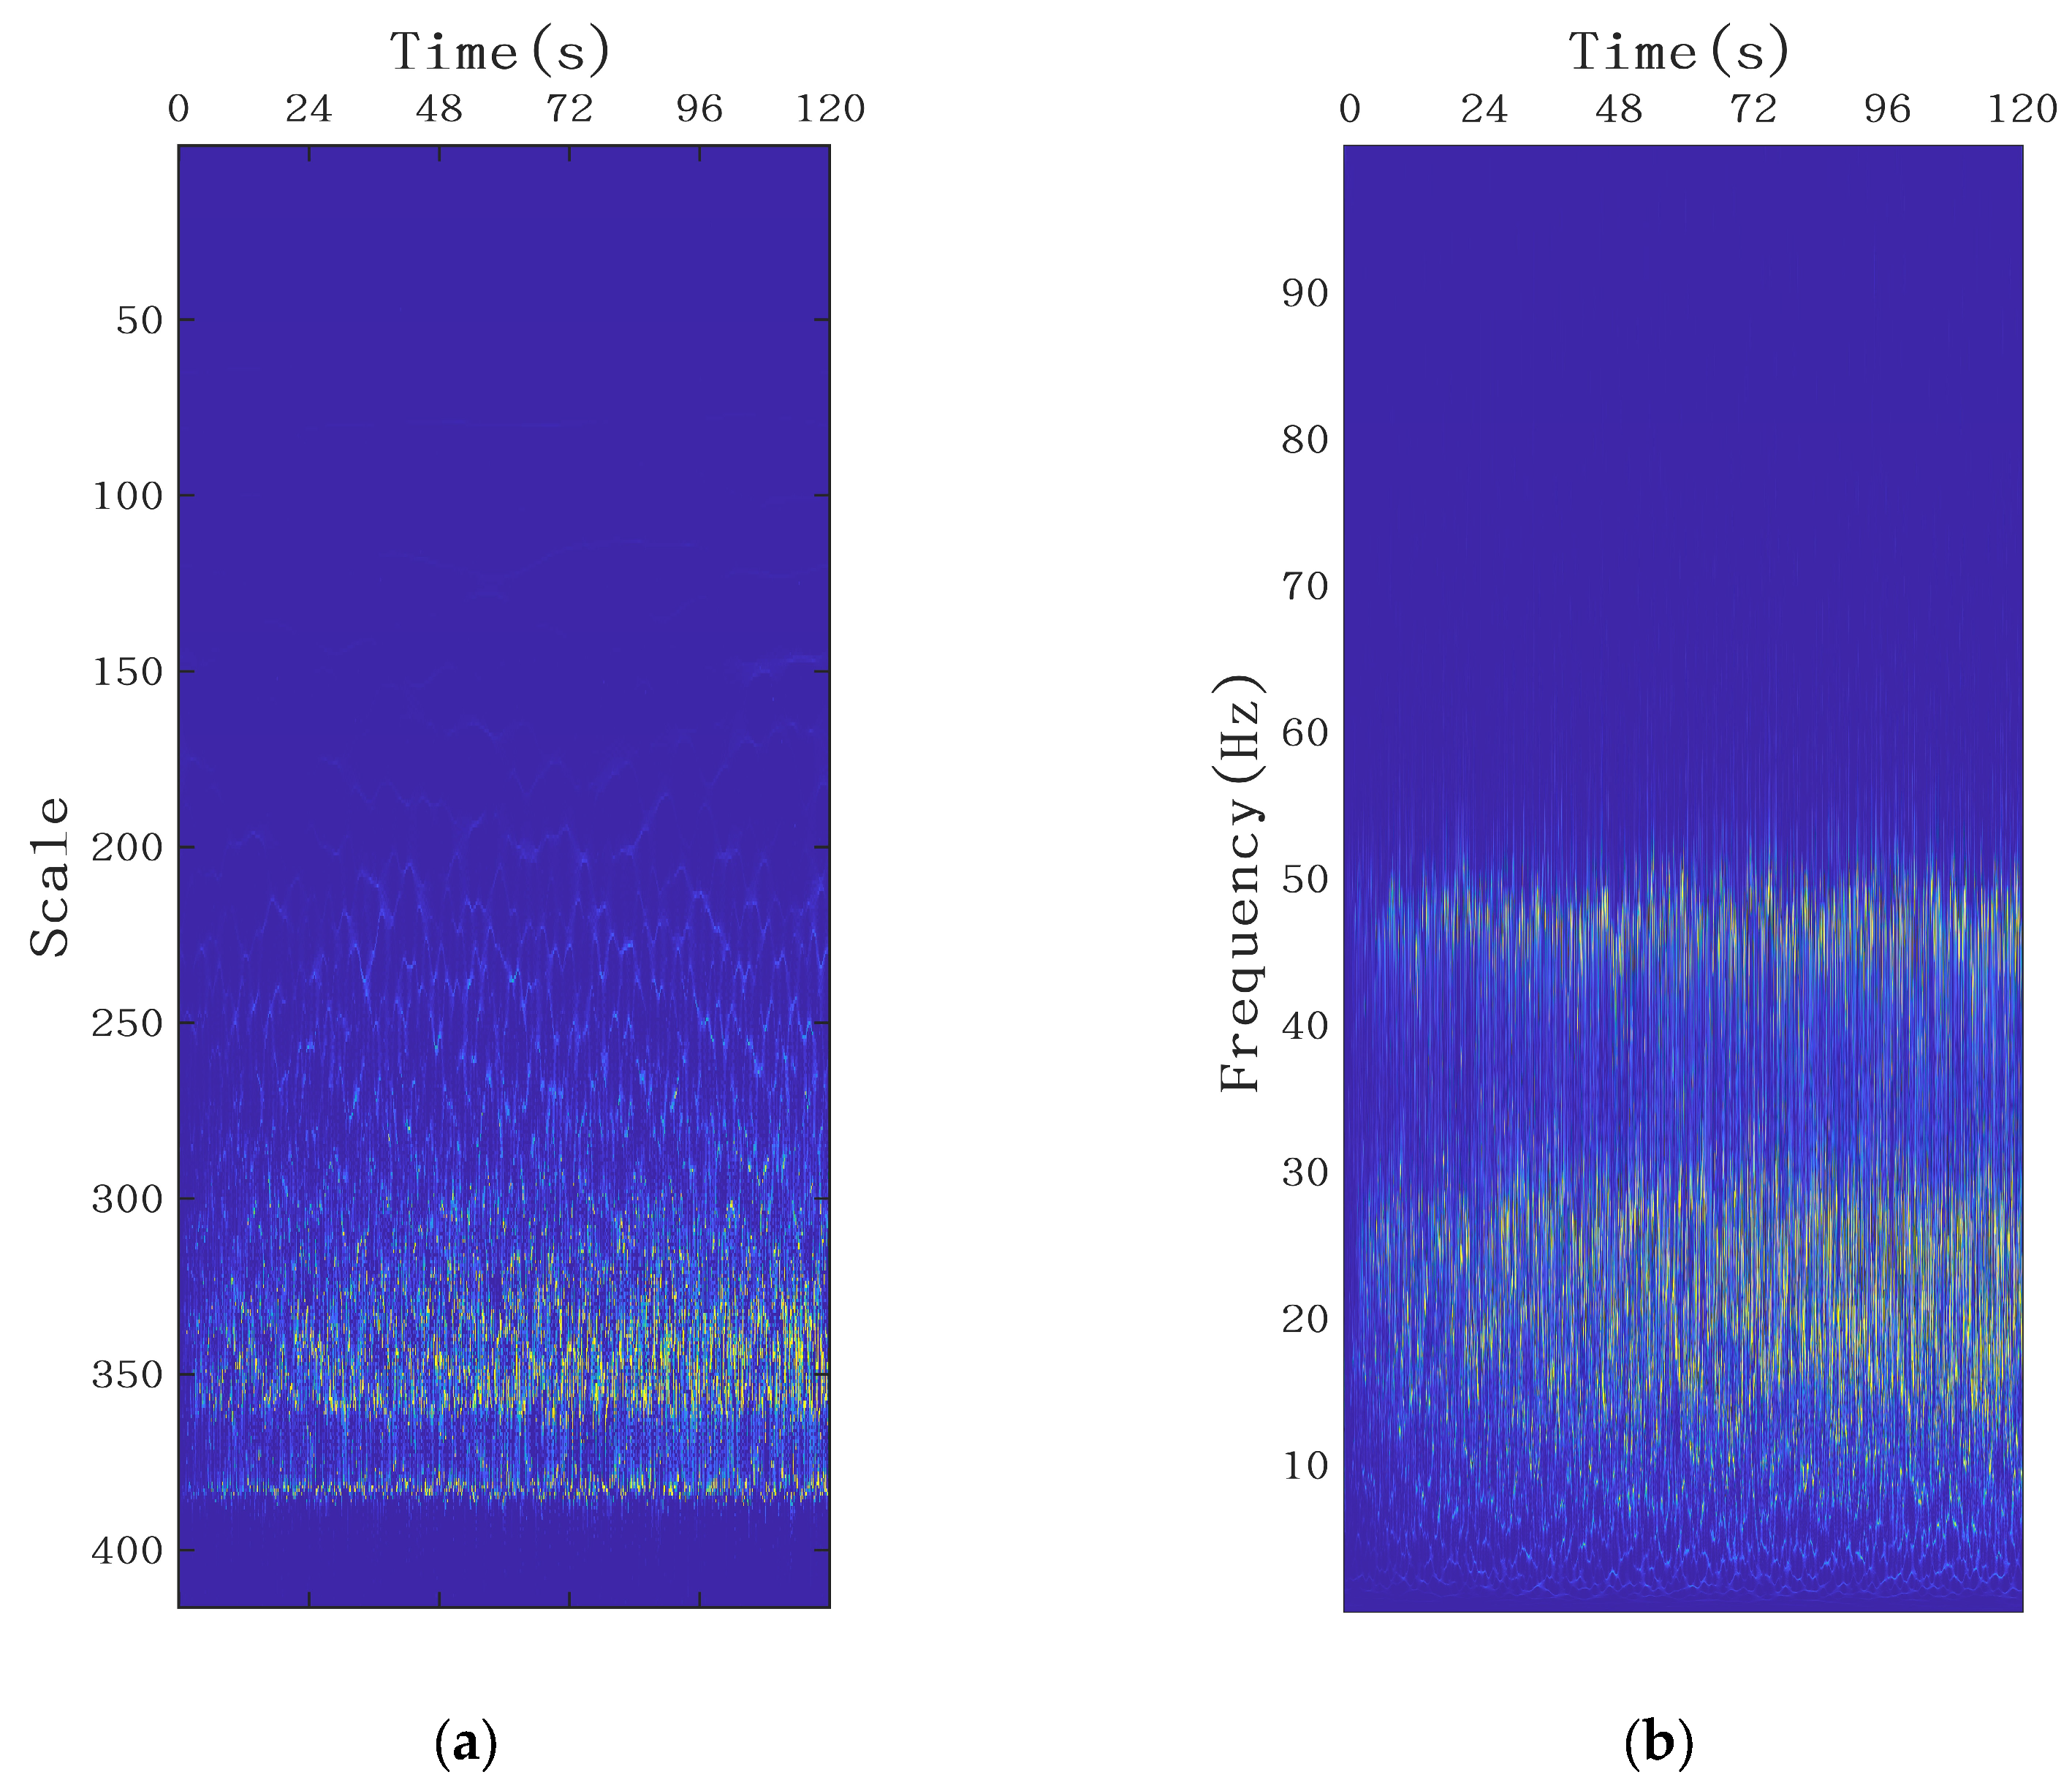
From the results shown in Figure 4a, it can be observed that, in the virtual shot gather directly obtained by cross-correlating the passive seismic data in an elastic medium, surface waves and body waves are mixed together, making it difficult to effectively process surface and body wave data further. Additionally, due to the low signal-to-noise ratio of the original passive data and the difficulty in accurately identifying effective body wave noise and surface wave noise Figure 3b (Panea et al., 2014) [43], purely time-domain or frequency-domain analysis is insufficient for a comprehensive understanding of the effective signals in passive data. Time–frequency-domain analysis methods are more conducive to analyzing passive seismic data. Compared to general time–frequency transforms, SWT provides higher resolution in the time–frequency spectrum. Therefore, we chose SWT to identify surface wave noise and body wave noise in the passive seismic data. The behavior of surface waves and body waves in the time–frequency domain in an ideal case is shown in Figure 6 (the intensity of the energy in the figure represents the strength of the signal). In Figure 6a, the scale parameter is inversely proportional to frequency. Therefore, we can obtain the time–frequency spectrum (Figure 6b). Since surface wave frequencies are relatively low and body wave frequencies are relatively high, we can easily distinguish surface waves and body waves in the time–frequency spectrum. It can be seen that there are obvious energy bands at low frequencies and high frequencies, which are the energies of surface wave noise and body wave noise, respectively. Among them, the relatively weaker energy comes from some signals or noises with smaller contributions. After extracting the wavelet coefficients from the regions corresponding to surface waves and body waves, we can proceed with their respective processing.
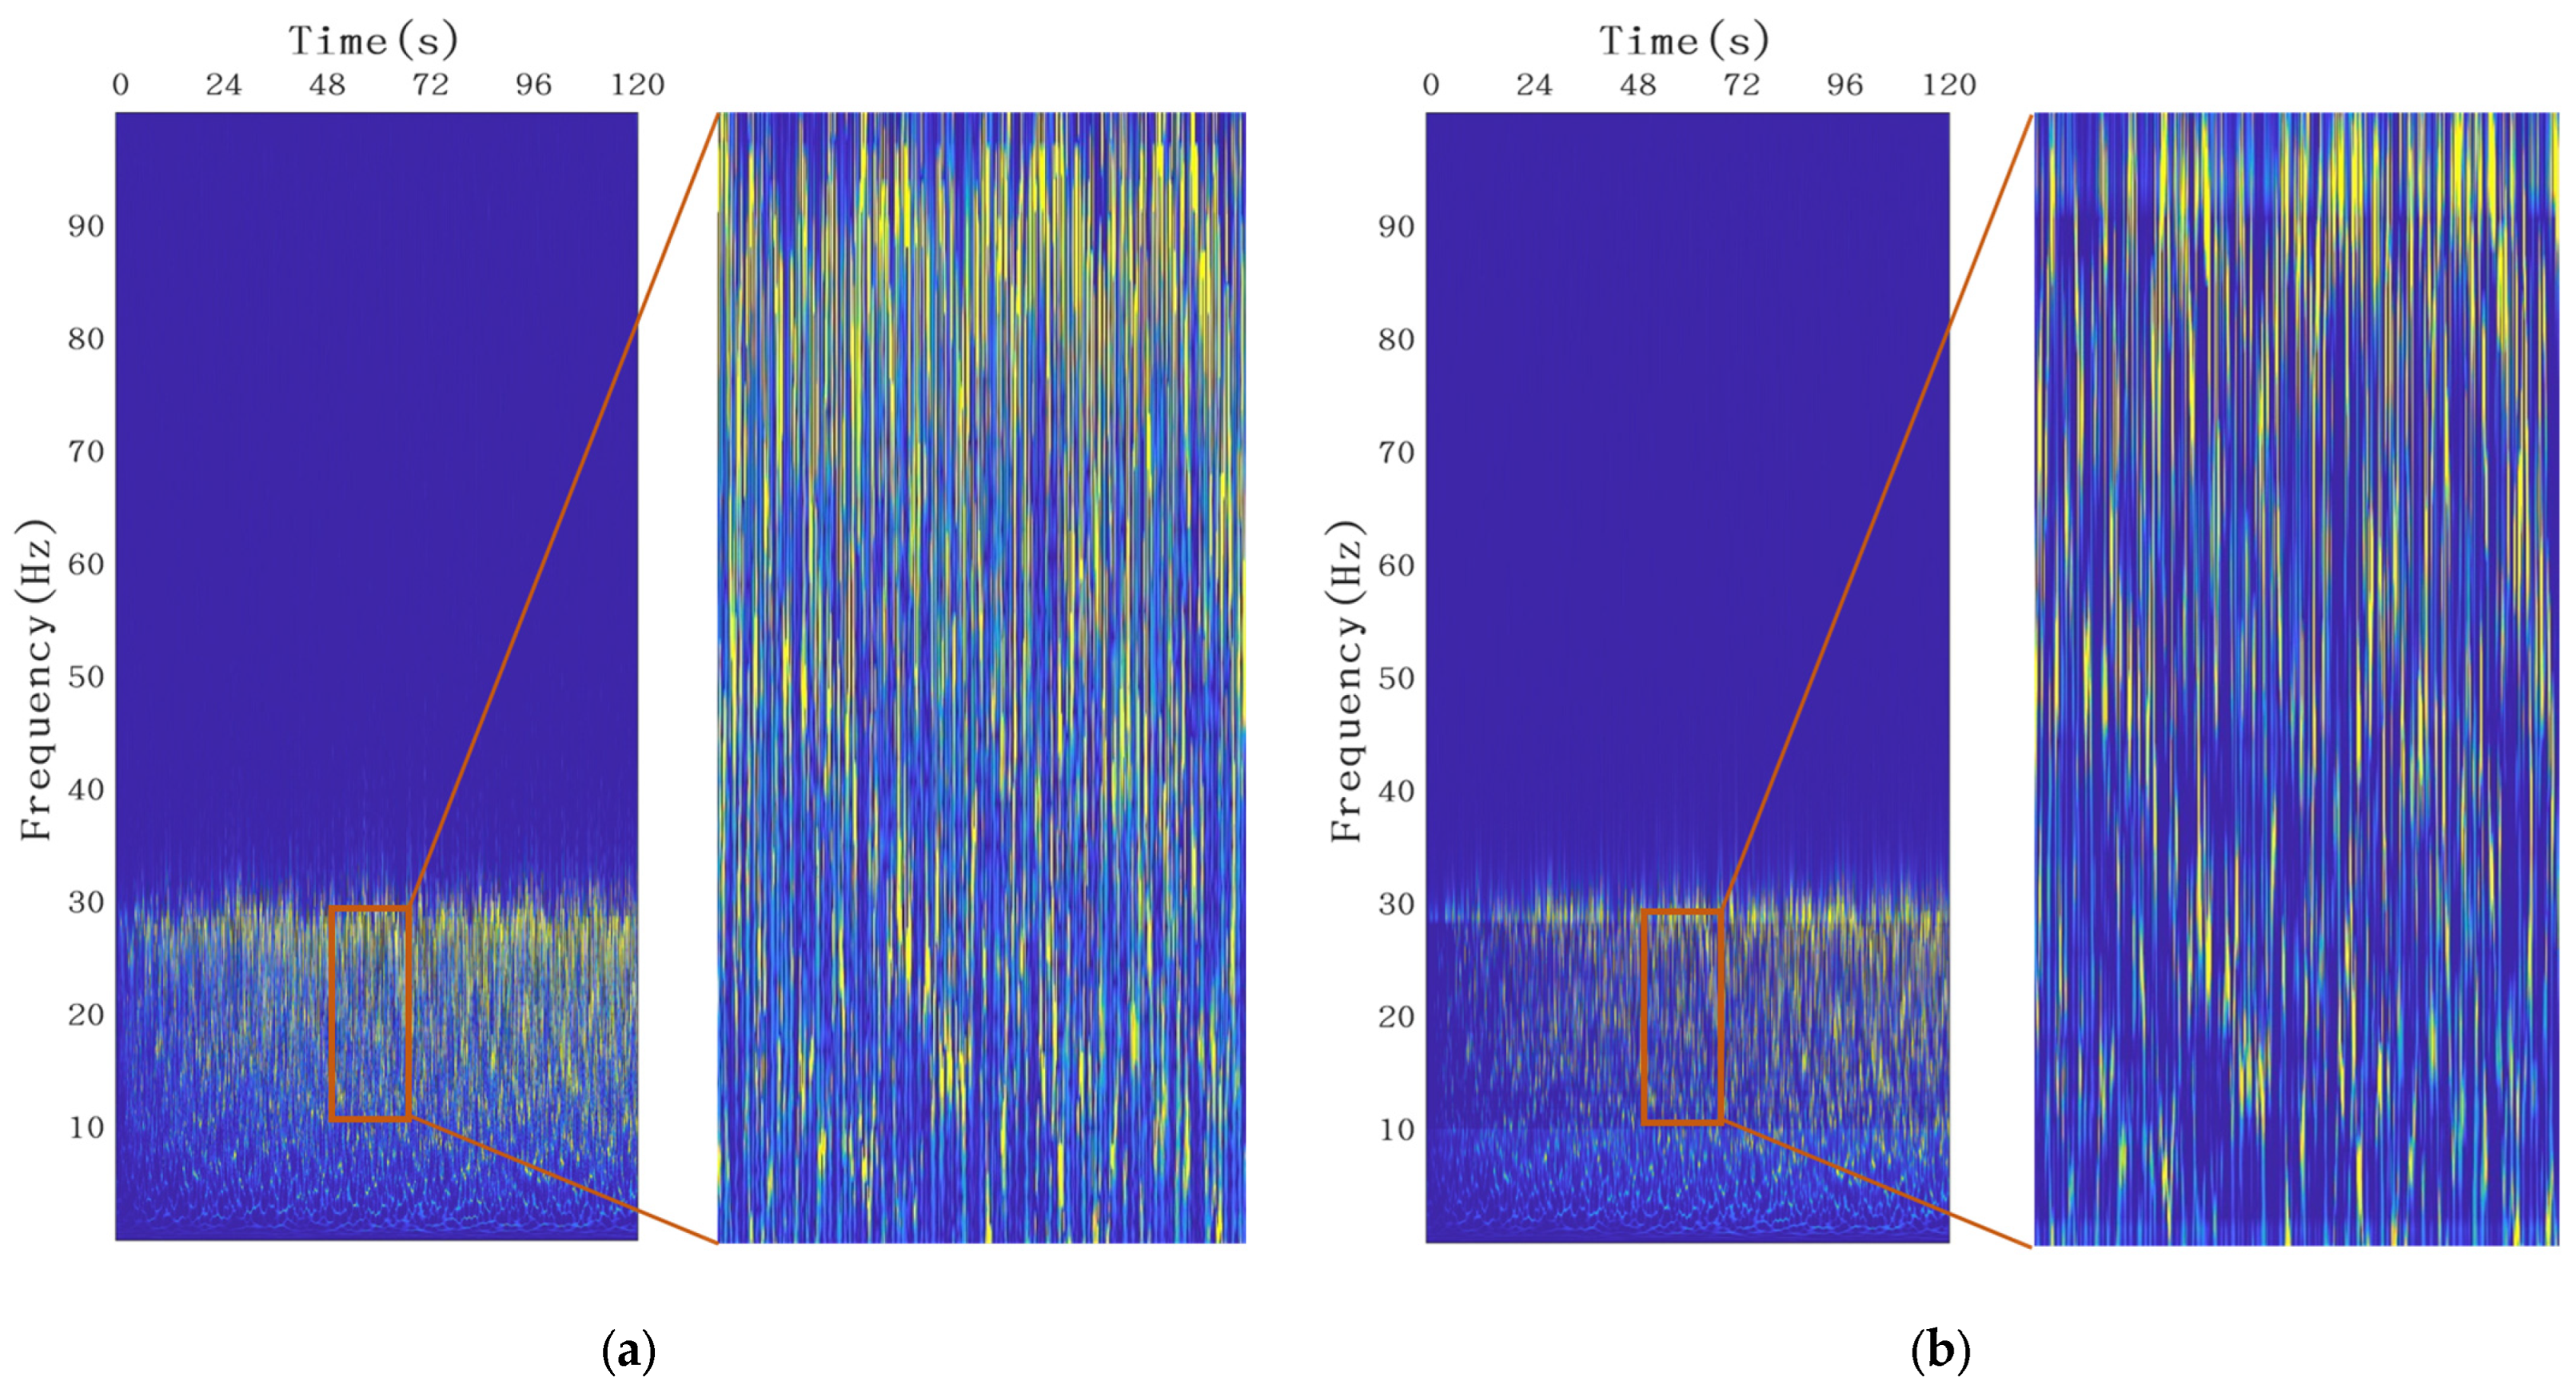
We begin by reconstructing the body wave signal. The passive seismic record simulated in Figure 4a is subjected to SWT, and after identifying the surface wave and body wave components, Gaussian filtering and wavelet thresholding are applied. To effectively reconstruct the reflected waves, the high-frequency band with relatively strong body wave noise is selected (we selected a frequency band range of 10–30 Hz). However, there is an inevitable overlap between the frequency bands of body wave noise and surface wave noise. To further suppress surface wave energy and some signals with weak contributions to the reconstruction of the reflected waves, SWT is used for filtering and thresholding denoising. The results before and after processing are shown in Figure 7. Figure 7a is the time–frequency spectrum of the raw data, while Figure 7b is the processed time–frequency spectrum. It can be observed that, within the frequency band range of 10–30 Hz, the stronger energy, which we consider as body wave noise, is retained, whereas some of the weaker energy, which we identify as surface wave noise, is eliminated. Due to the uniform spatial distribution of the sources, the seismic records received by each geophone exhibit similar time–frequency-domain distributions. Therefore, the same steps are repeated for other geophones until all seismic traces are processed.
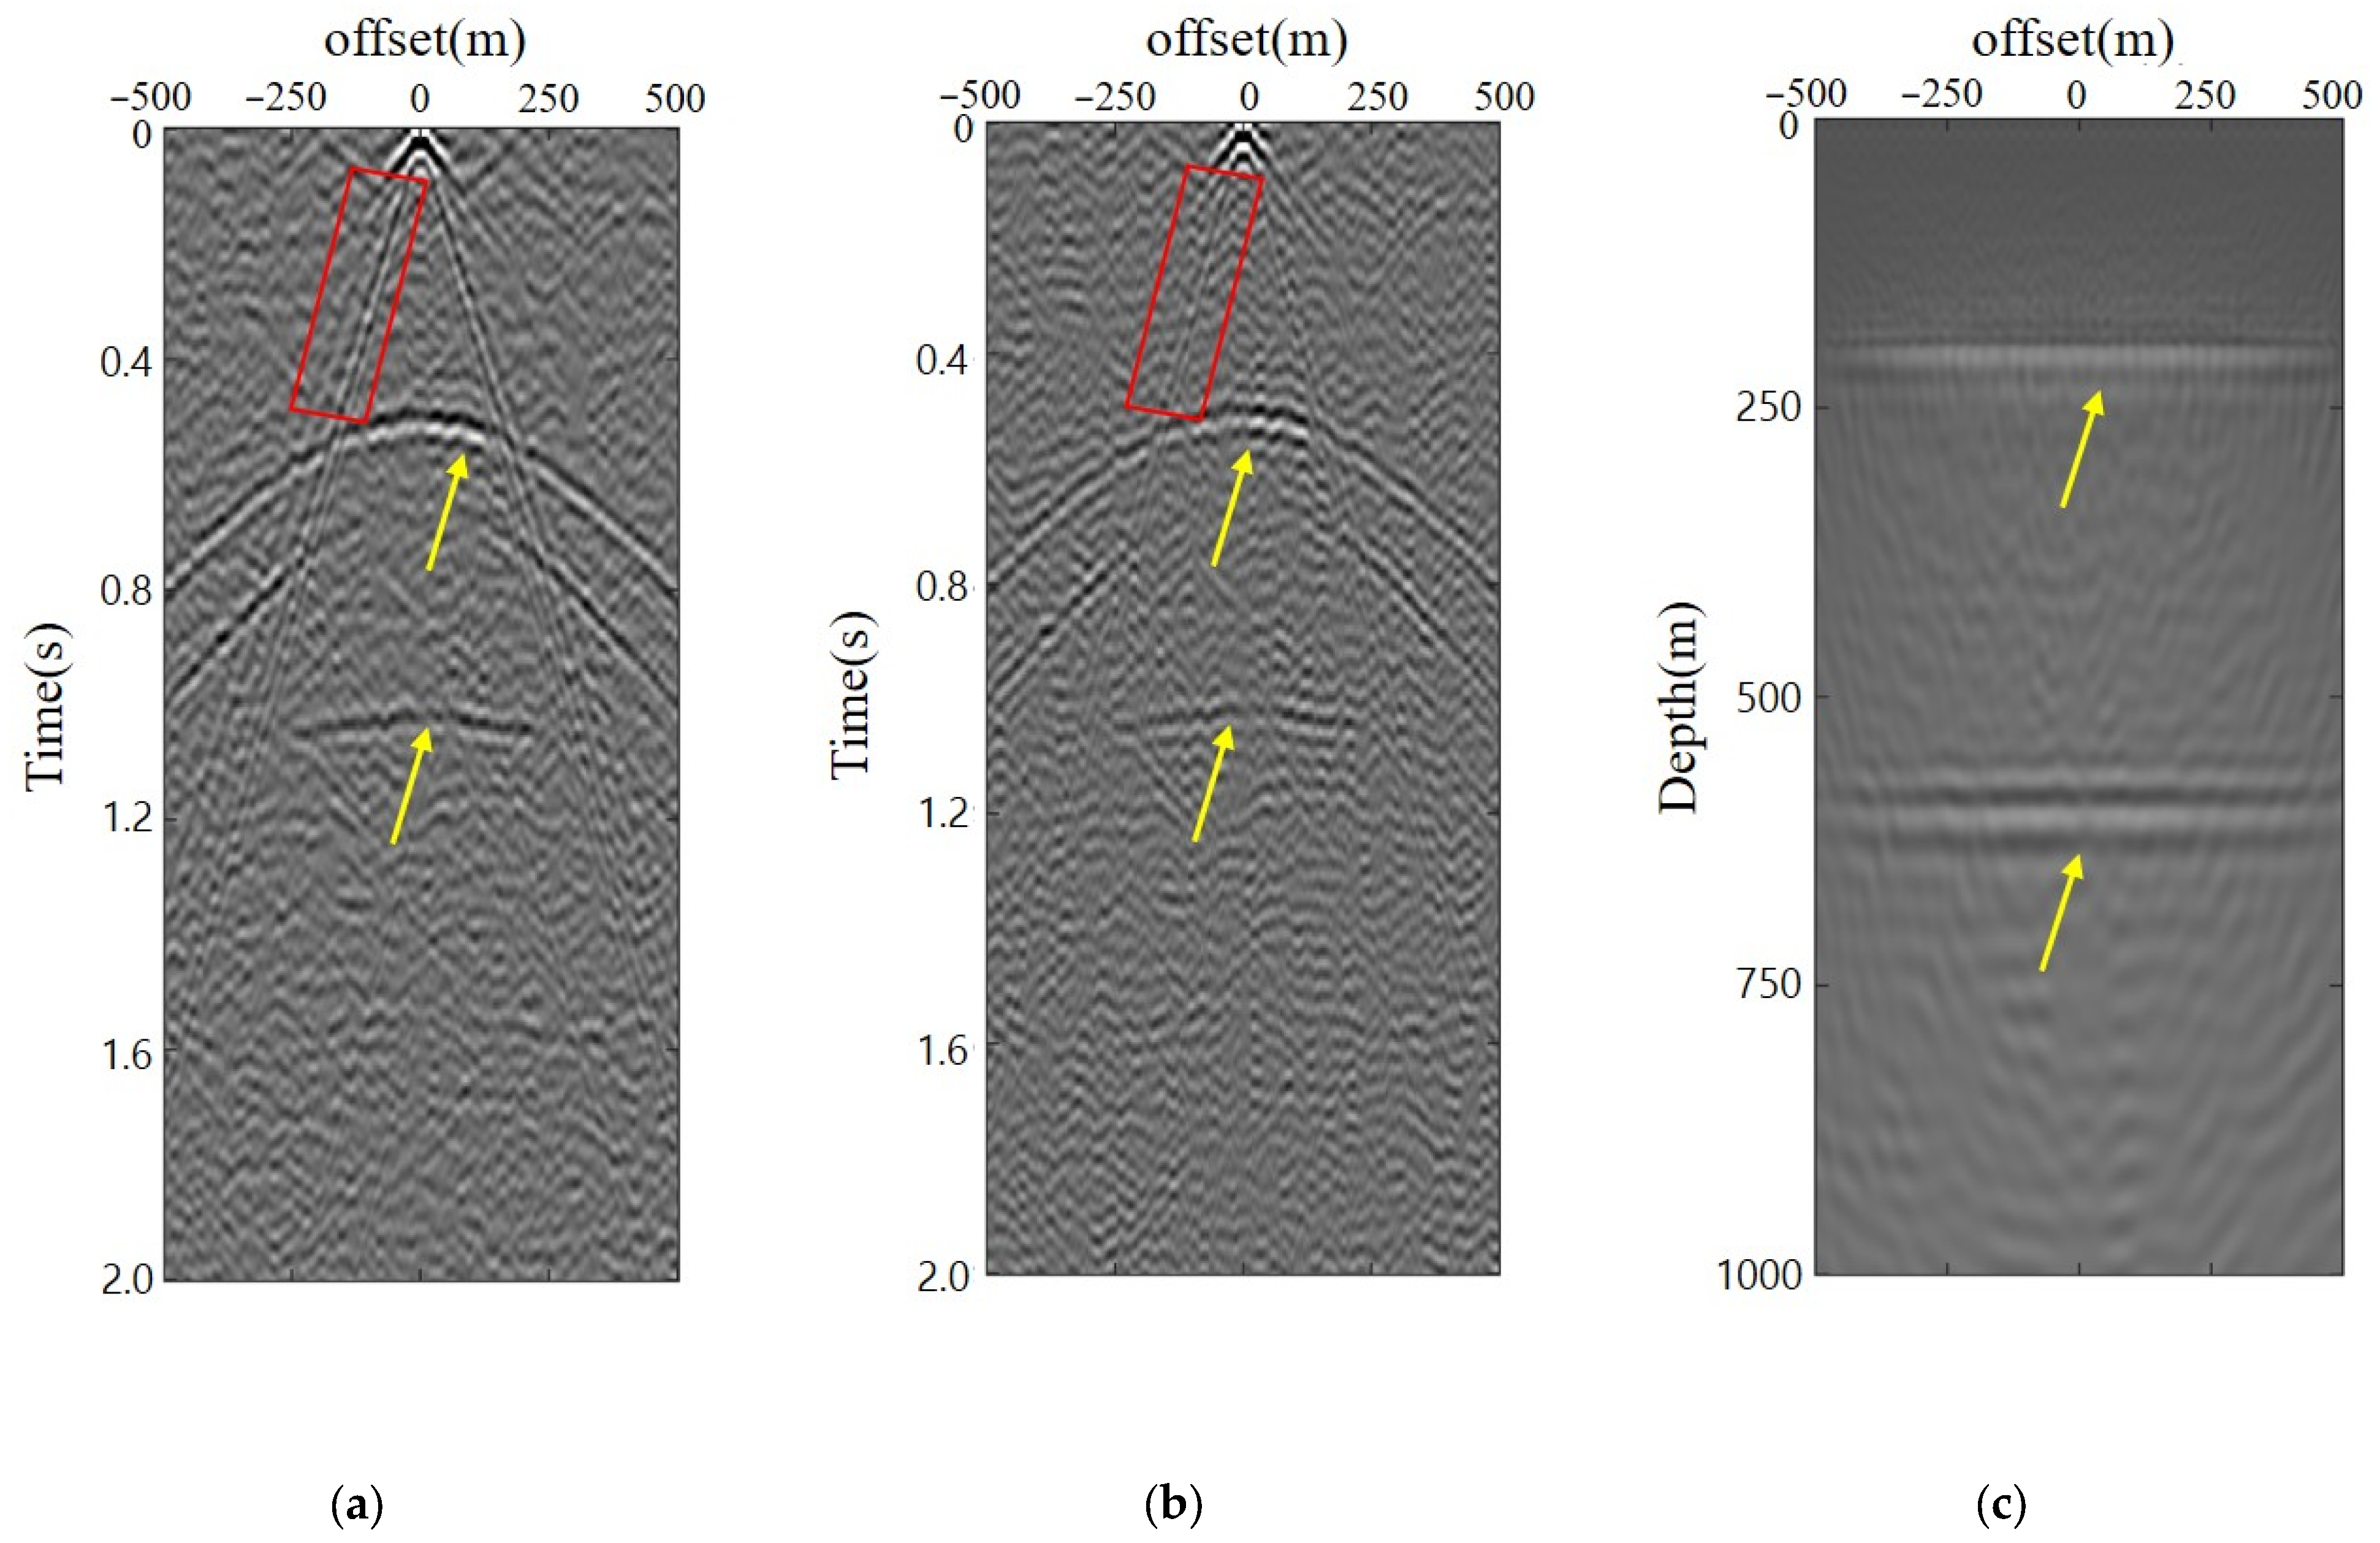
After thresholding the body wave noise, wavelet cross-correlation is applied, followed by inverse transformation to the time domain, yielding the reconstructed virtual body wave seismic record, shown in Figure 8a. We also compare this result with the commonly used bandpass filtering method in passive data processing. Figure 8b shows the virtual shot gather obtained through cross-correlation after bandpass filtering the raw data. The bandpass filter is applied to the same frequency band as selected in SWT. Comparing the two, it can be observed that, relative to Figure 8b, the virtual seismic record processed with the SWT method (Figure 8a) effectively removes surface waves in the red-boxed area, while the reflection section indicated by the yellow arrows is well preserved. We further conducted Kirchhoff pre-stack depth migration imaging on the reconstructed virtual seismic records (modified from the CREWES MATLAB Software Library (CMSL, Version 2122) developed by Margrave) on the reconstructed virtual seismic record, and the resulting imaging profile is shown in Figure 8c, where the reflection layers at 200 m and 600 m (marked by the yellow arrows) are accurately imaged.
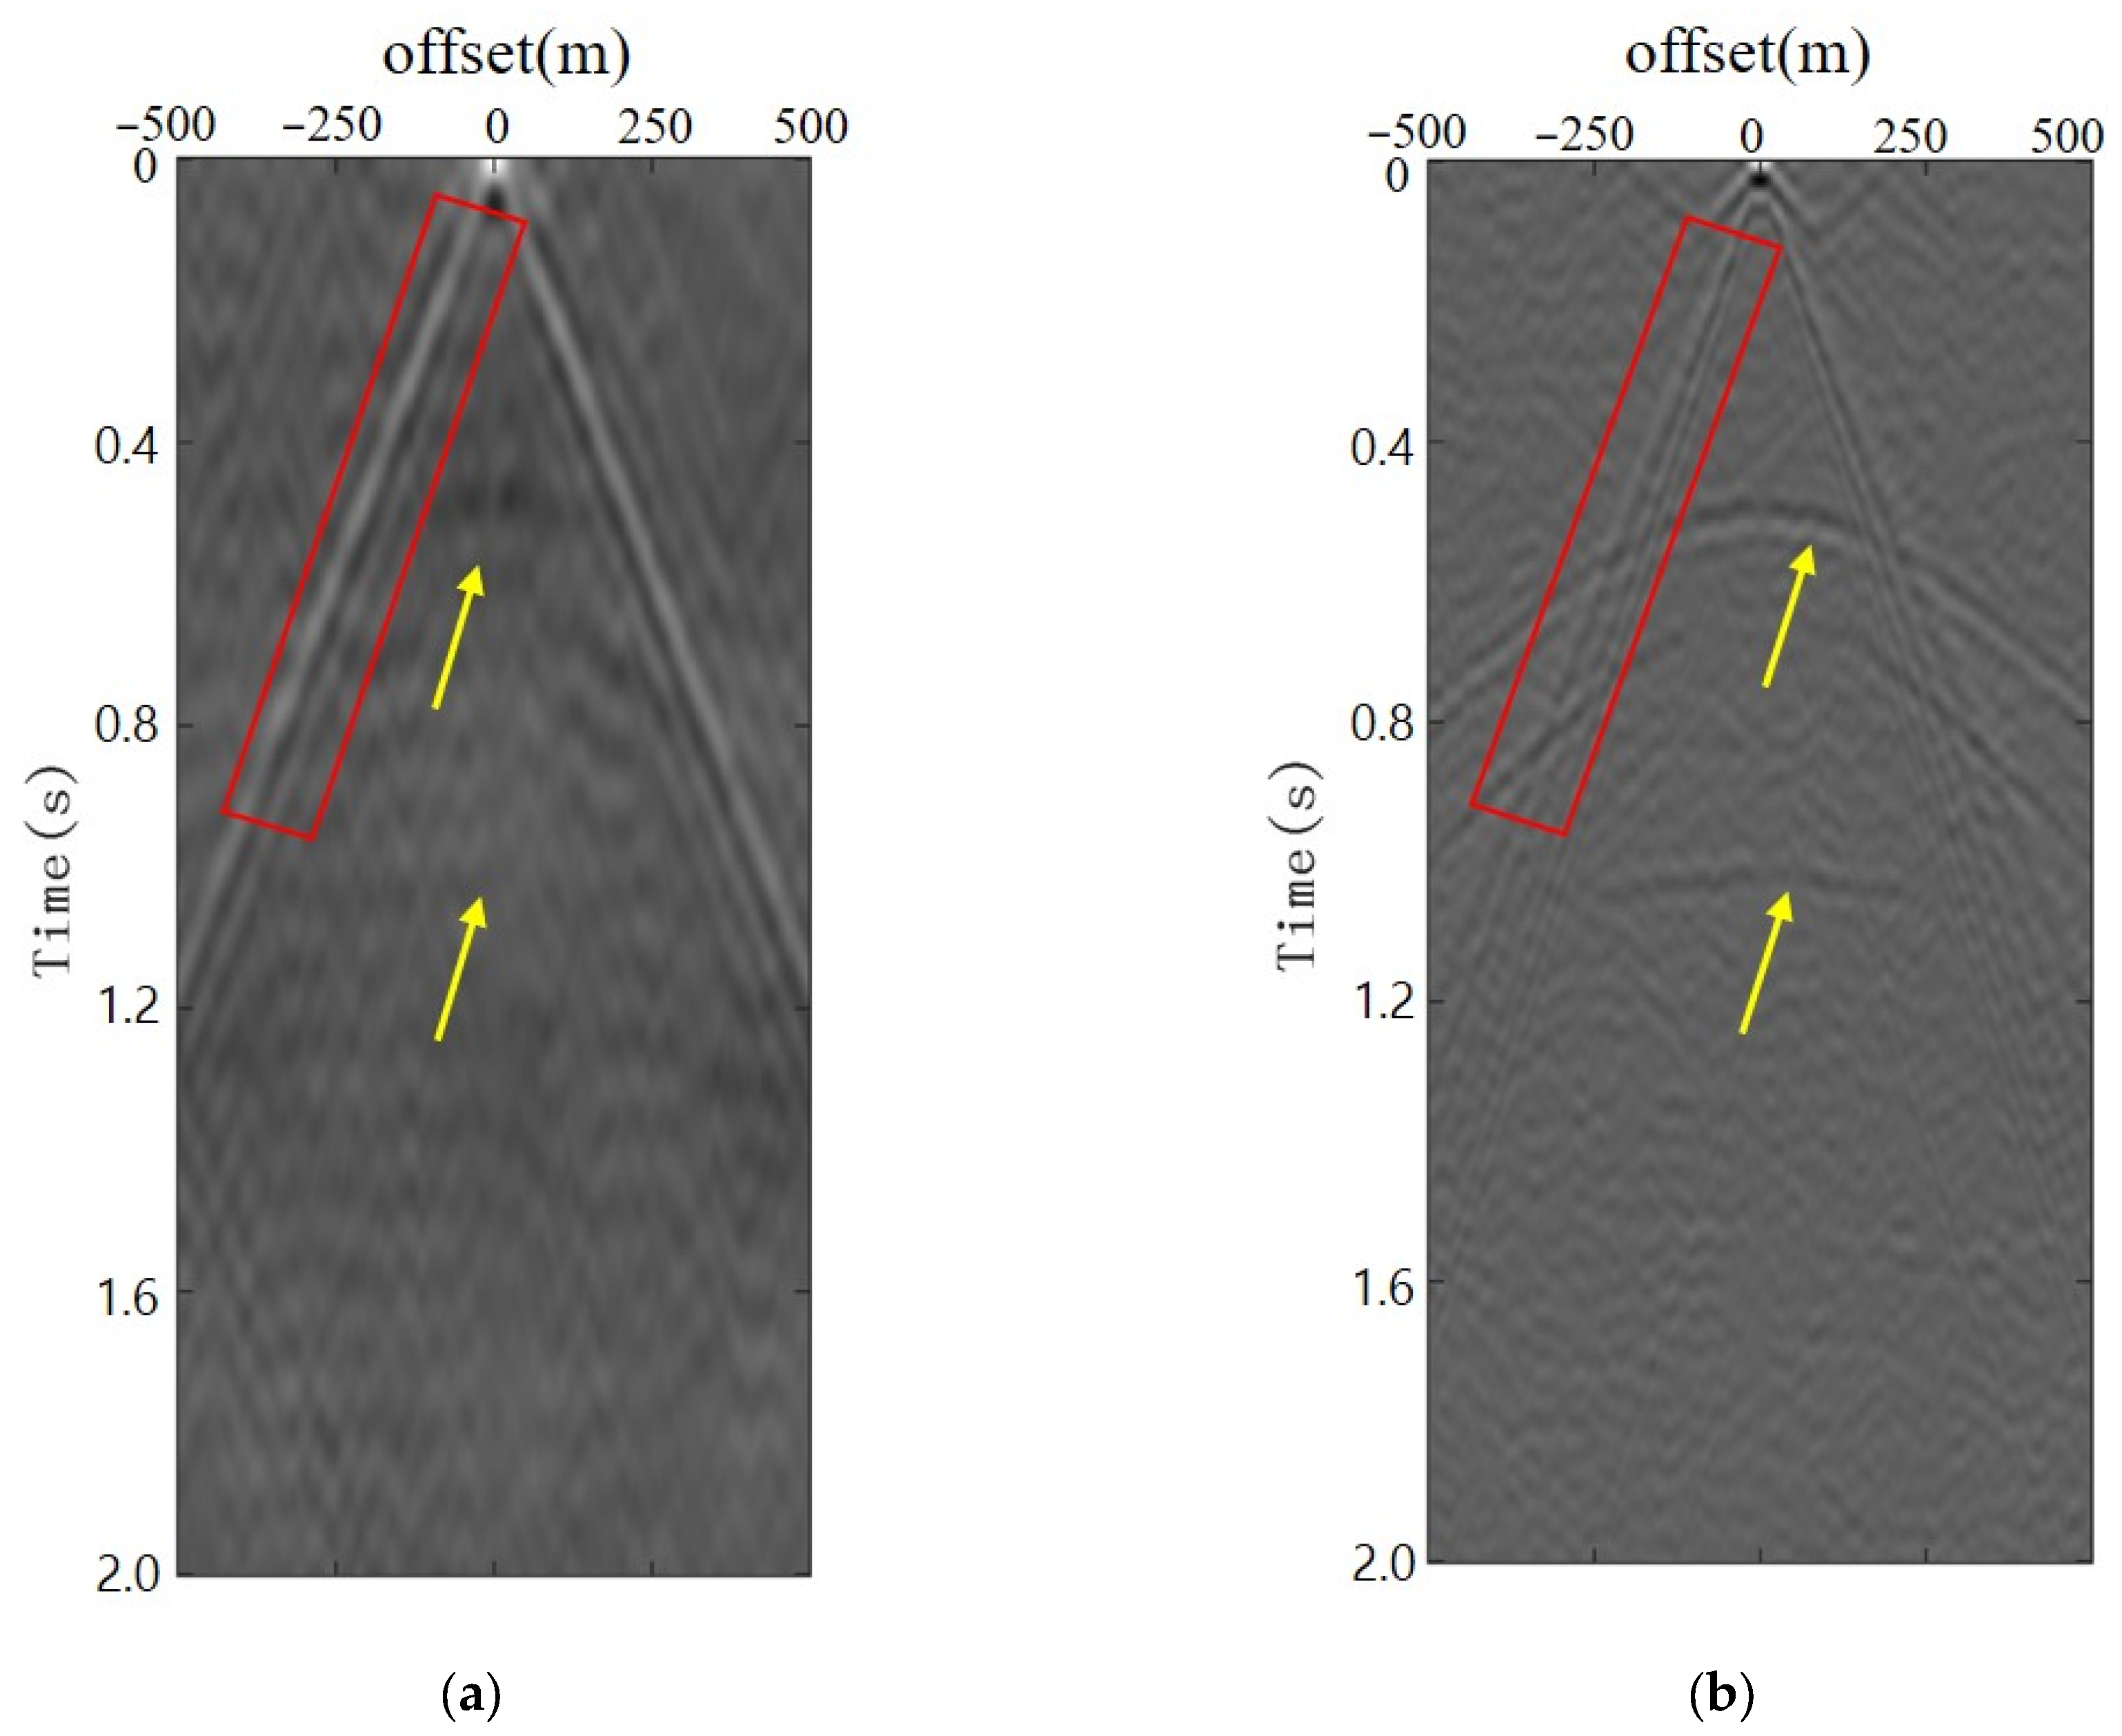
For the extraction of surface wave signals, a similar approach to body wave processing is used. Low-frequency wavelet coefficients are selected for thresholding, and cross-correlation is performed in the wavelet domain before returning to the time domain, resulting in a virtual shot gather predominantly composed of surface waves. Similarly, we compare this with the virtual shot gather processed using conventional bandpass filtering, where the bandpass filter aligns with the frequency band selected by SWT. The results are shown in Figure 9. Figure 9a displays the virtual shot gather obtained after applying low-pass filtering below 10 Hz and cross-correlation, while Figure 9b shows the reconstructed virtual shot gather after SWT processing. It can be observed that, compared to the conventional method, the reflection wave at the yellow arrow is effectively suppressed, and high signal-to-noise ratio surface wave records (within the red box) are obtained.
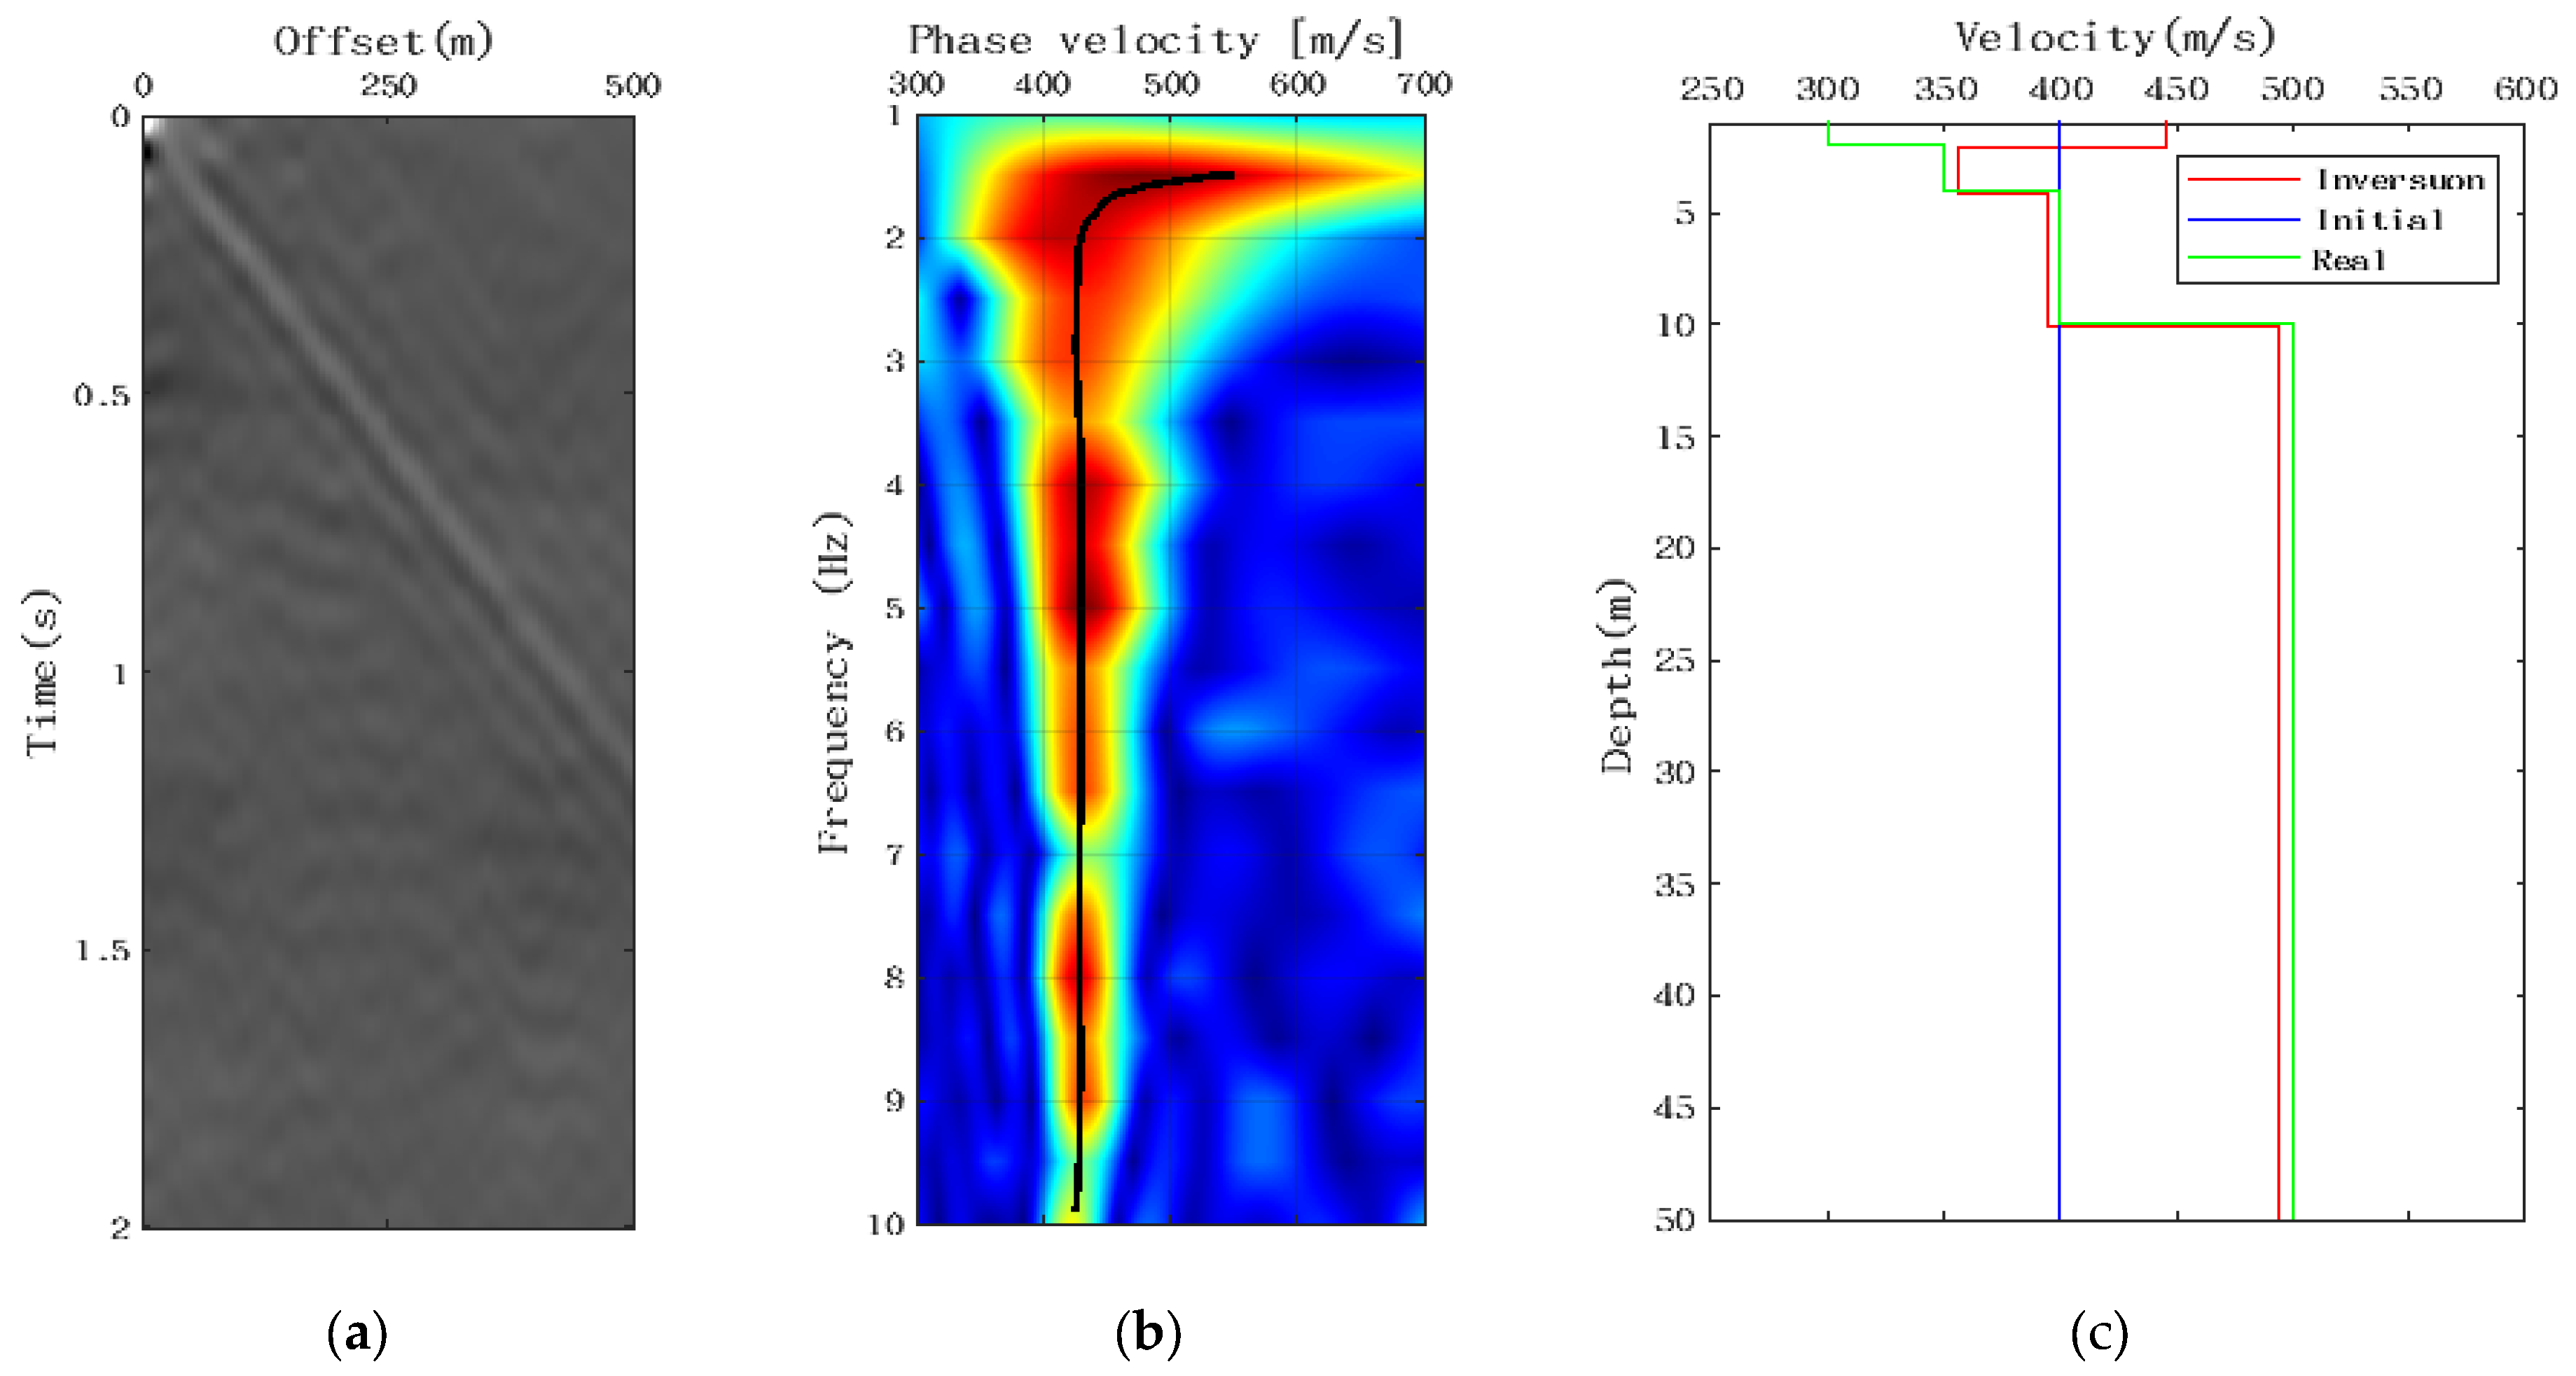
Additionally, we performed surface wave dispersion analysis on the obtained surface wave records and used surface wave inversion to derive the shallow subsurface structure. The MASW method, commonly used in geophysical exploration for analyzing Rayleigh waves, extracts surface wave dispersion curves by transforming the two-dimensional seismic signals from the time–space domain to the frequency–velocity domain. Figure 10 shows the dispersion imaging results obtained using the MASW method from the virtual surface wave seismic record in Figure 9b. Furthermore, using a constant velocity model as the initial velocity model (indicated by the blue solid line), a multi-mode surface wave nonlinear inversion method was applied to obtain the inversion results for the shallow subsurface structure, shown in Figure 10c. The red solid line represents the inversion results, while the green solid line represents the true velocity profile. Here, due to the weak high-frequency signal energy in the passive data, some high-frequency information is missing when extracting the dispersion curve, leading to insensitivity in the inversion of shear wave velocities for the shallow layers above 2 m. However, the inversion results for the subsurface layers below 2 m are well captured.

5. Discussion

Since the widespread application of passive seismic exploration, an increasing number of challenges have emerged. The primary issue is that passive seismic data typically suffer from a low signal-to-noise ratio, with various singles mixed together and difficult to separate. This makes it challenging to obtain high-quality surface wave signals and reflected signals from passive data, which impacts the quality of further processing results for surface waves and reflected waves. Consequently, it often becomes necessary to combine the results from active seismic exploration to infer information about both the shallow and deep subsurface.
Conventional processing methods, such as bandpass filtering, are inadequate for effectively separating surface wave noise and body wave noise. This paper presents a method that combines SWT to identify body wave noise and surface wave noise in the original passive data and effectively reconstructs the body wave and surface wave signals. In this paper, we validate the effectiveness of the proposed method through numerical simulations. Additionally, we compare it with bandpass filtering to demonstrate the advantages of our approach. Additionally, the reconstructed surface waves and body waves are inverted separately, and by combining surface wave inversion for shallow velocity structures and reflection wave imaging for deeper structures, comprehensive subsurface information can be obtained. We compared the obtained subsurface velocity structure with the actual velocity model to verify the accuracy of the method, providing a feasible technical workflow for independent passive seismic exploration. For the processing of real data, the simulated data used in this study have relatively balanced energy, so amplitude balancing was not applied. In contrast, the signals collected by geophones in real data are more complex, and the data volume is significantly larger, and to address issues related to the unevenness of the frequency and amplitude spectra, we propose that the high-resolution characteristics of SWT in the time–frequency domain can be utilized for feature recognition of different wave signals. Energy balancing in the time–frequency domain can also enhance weaker high-frequency energy, making it easier to distinguish between surface wave noise and body wave noise. For the large volume of real passive seismic data and the computational challenges it presents, parallel processing using both CPU and GPU can be employed to accelerate the calculations (Basnet et al., 2022) [44].
Furthermore, regarding the numerical simulation of passive sources, this study currently employs the finite-difference method. However, handling boundary shapes in complex fluid regions is challenging with this approach. Numerical simulation based on lattice element modeling is more suitable for fine-scale structures and complex fluid regions (Nikolic et al., 2016; Rizvi et al., 2020) [45,46,47]. In future work, we will explore the application of lattice element modeling in passive seismic exploration and investigate the impact of fluid effects in fractured rock masses on the wavefield.

Author Contributions

Conceptualization, X.L. and Z.X.; methodology, X.L. and F.Z.; validation, X.L. and X.G.; formal analysis, X.L.; investigation, X.L.; resources, X.G. and Z.X.; data curation, X.L. and F.Z.; writing—original draft preparation, X.L.; writing—review and editing, Z.X. and F.Z.; supervision, F.Z. All authors have read and agreed to the published version of the manuscript.

Funding

This research was funded by the National Natural Science Foundation of China (Grant Nos. 42274164 and 42074151) and the Deep Earth Probe and Mineral Resources Exploration-National Science and Technology Major Project, 2024ZD1004101.

Institutional Review Board Statement

Not applicable.

Informed Consent Statement

Not applicable.

Data Availability Statement

The data presented in this study are available on request from the corresponding author. The data are not publicly available due to the involvement of subsequent research.

Acknowledgments

We would like to thank the researchers who provided theoretical and coding assistance for this study. The URLs of the code used in this article are listed as follows: the finite-difference code is available at https://github.com/JanThorbecke/OpenSource (accessed on 1 October 2023); the Kirchhoff migration imaging code is available at https://www.crewes.org/ResearchLinks/FreeSoftware/index.php (accessed on 25 October 2024); and the multichannel analysis of surface waves (MASW) code is available at https://github.com/nikhil2211/MASW-Matlab-code (accessed on 1 December 2024).

Conflicts of Interest

The authors declare no conflicts of interest.

Nomenclature

The following abbreviations, symbols and units are used in this manuscript:
SISeismic Interferometry
HVSRHorizontal-to-Vertical Spectral Ratio
MAPSMulti-Channel Analysis of Passive Surface Waves
MASWMulti-Channel Analysis of Surface Waves
F-JFrequency–Bessel Transform
CNNConvolutional Neural Network
DASDistributed Fiber Acoustic Sensing
CWTContinuous Wavelet Transform
SWTSynchrosqueezed Continuous Wavelet Transform
EMDEmpirical Mode Decomposition
CMSLCREWES MATLAB Software Library
Boundary
G ^ Green’s Function
ω Angular Frequency
W f a , b Wavelet Coefficients
f t Time-Domain Signal
φ Mother Wavelet
f ^ ε Fourier Transforms of f t
δ Dirac Delta Function
T f ω i , b Synchronized Wavelet Coefficient
ω f a , b Instantaneous Frequency
aScale Parameter
bTranslation Parameter
sSecond
mMeter

References

  1. Shang, X.; Han, L.; Qi, Q.; Li, Y.; Chen, X. Passive seismic full waveform inversion based on random interferometry reconstruction. Prog. Geophys. 2021, 36, 2557–2565. [Google Scholar] [CrossRef]
  2. Ren, Y.; Lu, Z.; Zhang, X.; Xue, S.; Liu, Z.; Cheng, Y.; Cai, Y. Progress in data acquisition and processing technology of portable node seismographs. Prog. Geophys. 2021, 36, 779–791. [Google Scholar] [CrossRef]
  3. Wang, G.; Tian, X.; Guo, L.; Yan, J.; Lyu, Q. High-Resolution Crustal Velocity Imaging Using Ambient Noise Recordings from a High-Density Seismic Array: An Example from the Shangrao Section of the Xinjiang Basin, China. Earthq. Sci. 2018, 31, 242–251. [Google Scholar] [CrossRef]
  4. Landar, S.; Velychkovych, A.; Ropyak, L.; Andrusyak, A. A Method for Applying the Use of a Smart 4 Controller for the Assessment of Drill String Bottom-Part Vibrations and Shock Loads. Vibration 2024, 7, 802–828. [Google Scholar] [CrossRef]
  5. Claerbout, J.F. Synthesis of a Layered Medium from Its Acoustic Transmission Response. Geophysics 1968, 33, 264–269. [Google Scholar] [CrossRef]
  6. Rickett, J.; Claerbout, J. Acoustic Daylight Imaging via Spectral Factorization; Helioseismology and Reservoir Monitoring. Lead. Edge 1999, 18, 957–960. [Google Scholar]
  7. Schuster, G.T. Theory of Daylight/Interferometric Imaging: Tutorial. In Seismic Interferometry: History and Present Status; Wapenaar, K., Draganov, D., Robertsson, J.O.A., Pelissier, M.A., Eds.; Society of Exploration Geophysicists: Houston, TX, USA, 2008; Volume 26, pp. 77–81. ISBN 978-1-56080-150-4. [Google Scholar]
  8. Wapenaar, K.; Fokkema, J. Green’s Function Representations for Seismic Interferometry. Geophysics 2006, 71, SI33–SI46. [Google Scholar] [CrossRef]
  9. Wapenaar, K.; van der Neut, J.; Ruigrok, E. Passive Seismic Interferometry by Multidimensional Deconvolution. Geophysics 2008, 73, A51–A56. [Google Scholar] [CrossRef]
  10. Nakata, N.; Snieder, R.; Tsuji, T.; Larner, K.; Matsuoka, T. Shear Wave Imaging from Traffic Noise Using Seismic Interferometry by Cross-Coherence. Geophysics 2012, 76, SA97–SA106. [Google Scholar] [CrossRef]
  11. Vidal, C.A.; Draganov, D.; van der Neut, J.; Drijkoningen, G.; Wapenaar, K. Retrieval of Reflections from Ambient Noise Using Illumination Diagnosis. Geophys. J. Int. 2014, 198, 1572–1584. [Google Scholar] [CrossRef]
  12. Galiana-Merino, J.J.; Rosa-Herranz, J.; Giner, J.; Molina, S.; Botella, F. De-Noising of Short-Period Seismograms by Wavelet Packet Transform. Bull. Seismol. Soc. Am. 2003, 93, 2554–2562. [Google Scholar] [CrossRef]
  13. Cheraghi, S.; Craven, J.A.; Bellefleur, G. Feasibility of Virtual Source Reflection Seismology Using Interferometry for Mineral Exploration: A Test Study in the Lalor Lake Volcanogenic Massive Sulphide Mining Area, Manitoba, Canada. Geophys. Prospect. 2015, 63, 833–848. [Google Scholar] [CrossRef]
  14. Ruan, X.M.; Chen, M.C.; Liu, Z.D.; Wang, Z.H.; Xu, Z.W.; Chen, M.; Zhang, X.G. Review of progress in passive seismic reflection exploration. Rev. Geophys. Planet. Phys. 2023, 54, 150–173. [Google Scholar] [CrossRef]
  15. Nakamura, Y. A Method for Dynamic Characteristics Estimation of Subsurface Using Microtremor on the Ground Surface. Q. Rep. RTRI 1989, 30, 25–33. [Google Scholar]
  16. Xia, J.; Cheng, F.; Xu, Z.; Shen, C.; Liu, R. Advantages of Multi-Channel Analysis of Passive Surface Waves (MAPS). In Proceedings of the International Conference on Engineering Geophysics, Al Ain, United Arab Emirates, 9–12 October 2017; SEG Global Meeting Abstracts. Society of Exploration Geophysicists: Houston, TX, USA, 2017; pp. 94–97. [Google Scholar]
  17. Wang, J.; Wu, G.; Chen, X. Frequency-Bessel Transform Method for Effective Imaging of Higher-Mode Rayleigh Dispersion Curves From Ambient Seismic Noise Data. J. Geophys. Res. Solid Earth 2019, 124, 3708–3723. [Google Scholar] [CrossRef]
  18. Chen, X.; Xia, J.; Pang, J.; Zhou, C.; Mi, B. Deep Learning Inversion of Rayleigh-Wave Dispersion Curves with Geological Constraints for near-Surface Investigations. Geophys. J. Int. 2022, 231, 1–14. [Google Scholar] [CrossRef]
  19. Mi, B.; Xia, J.; Xu, Y.; You, B.; Chen, Y. Retrieval of Surface Waves from High-Speed-Train-Induced Vibrations Using Seismic Interferometry. Geophysics 2023, 88, KS113–KS126. [Google Scholar] [CrossRef]
  20. Wang, Y.; Tran, K.T.; Cox, B.R.; Vantassel, J.P. Geotechnical Site Characterization with 3D Ambient Noise Tomography. Geophysics 2023, 88, KS101–KS112. [Google Scholar] [CrossRef]
  21. Bakulin, A.; Golikov, P.; Erickson, K.; Silvestrov, I.; Kim, Y.S.; Smith, R.; Al-Ali, M. Seismic Imaging of Vertical Array Data Acquired Using Smart DAS Uphole Acquisition System. In SEG Technical Program Expanded Abstracts 2018; SEG Technical Program Expanded Abstracts; Society of Exploration Geophysicists: Houston, TX, USA, 2018; pp. 4050–4054. [Google Scholar]
  22. Velychkovych, A.; Mykhailiuk, V.; Andrusyak, A. Numerical Model for Studying the Properties of a New Friction Damper Developed Based on the Shell with a Helical Cut. Appl. Mech. 2025, 6, 1. [Google Scholar] [CrossRef]
  23. Cheraghi, S.; White, D.J.; Draganov, D.; Bellefleur, G.; Craven, J.A.; Roberts, B. Passive Seismic Reflection Interferometry: A Case Study from the Aquistore CO2 Storage Site, Saskatchewan, Canada. Geophysics 2017, 82, B79–B93. [Google Scholar] [CrossRef]
  24. Fang, J.; Liu, Y.; Liu, G. Enhancing Body Waves in Passive Seismic Reflection Exploration: A Case Study in Inner Mongolia, China. Interpretation 2022, 10, B13–B24. [Google Scholar] [CrossRef]
  25. Jin, Z.-Y.; Lu, Z.-W.; Fu, W.; Hou, H.-S. A Seismic Ambient Noise Data Classification Method Based on Waveform and Frequency-Wavenumber Analysis: Application to Reliable Geological Interpretation Adjacent to Well Songke-2, Northeast China. Geophysics 2024, 89, Q1–Q12. [Google Scholar] [CrossRef]
  26. Han, J.; van der Baan, M. Empirical Mode Decomposition for Seismic Time-Frequency Analysis. Geophysics 2013, 78, O9–O19. [Google Scholar] [CrossRef]
  27. Wang, Z.; Zhang, B.; Gao, J.; Wang, Q.; Huo Liu, Q. Wavelet Transform with Generalized Beta Wavelets for Seismic Time-Frequency Analysis. Geophysics 2017, 82, O47–O56. [Google Scholar] [CrossRef]
  28. Mousavi, S.M.; Langston, C.A. Automatic Noise-Removal/Signal-Removal Based on General Cross-Validation Thresholding in Synchrosqueezed Domain and Its Application on Earthquake Data. Geophysics 2017, 82, V211–V227. [Google Scholar] [CrossRef]
  29. Daubechies, I.; Lu, J.; Wu, H.-T. Synchrosqueezed Wavelet Transforms: An Empirical Mode Decomposition-like Tool. Appl. Comput. Harmon. Anal. 2011, 30, 243–261. [Google Scholar] [CrossRef]
  30. Li, C.; Liang, M. Time–Frequency Signal Analysis for Gearbox Fault Diagnosis Using a Generalized Synchrosqueezing Transform. Mech. Syst. Signal Process. 2012, 26, 205–217. [Google Scholar] [CrossRef]
  31. Thakur, G.; Brevdo, E.; Fučkar, N.S.; Wu, H.-T. The Synchrosqueezing Algorithm for Time-Varying Spectral Analysis: Robustness Properties and New Paleoclimate Applications. Signal Process. 2013, 93, 1079–1094. [Google Scholar] [CrossRef]
  32. Liu, N.; Gao, J.; Zhang, Z.; Jiang, X.; Lv, Q. High-Resolution Characterization of Geologic Structures Using the Synchrosqueezing Transform. Interpretation 2017, 5, T75–T85. [Google Scholar] [CrossRef]
  33. Zhang, M.; Wang, D.; Zhao, Y.; Man, W. Reservoir Prediction Based on Synchrosqueezed Wavelet Transform. In Proceedings of the International Geophysical Conference, Qingdao, China, 17–20 April 2017; SEG Global Meeting Abstracts. Society of Exploration Geophysicists: Houston, TX, USA; Chinese Petroleum Society: Beijing, China, 2017; pp. 256–259. [Google Scholar]
  34. Mousavi, S.M.; Langston, C.A.; Horton, S.P. Automatic Microseismic Denoising and Onset Detection Using the Synchrosqueezed Continuous Wavelet Transform. Geophysics 2016, 81, V341–V355. [Google Scholar] [CrossRef]
  35. Ngui, W.K.; Leong, M.S.; Hee, L.M.; Abdelrhman, A.M. Wavelet Analysis: Mother Wavelet Selection Methods. Appl. Mech. Mater. 2013, 393, 953–958. [Google Scholar] [CrossRef]
  36. Deitmar, A. Plancherel Theorem. In A First Course in Harmonic Analysis; Deitmar, A., Ed.; Springer: New York, NY, USA, 2002; pp. 89–104. ISBN 978-1-4757-3834-6. [Google Scholar]
  37. Averbuch, G.; Assink, J.D.; Smets, P.S.M.; Evers, L.G. Extracting Low Signal-to-Noise Ratio Events with the Hough Transform from Sparse Array Data. Geophysics 2018, 83, WC43–WC51. [Google Scholar] [CrossRef]
  38. Olivier, G.; Brenguier, F.; Campillo, M.; Lynch, R.; Roux, P. Body-Wave Reconstruction from Ambient Seismic Noise Correlations in an Underground Mine. Geophysics 2015, 80, KS11–KS25. [Google Scholar] [CrossRef]
  39. Wang, Y. The W Transform. Geophysics 2021, 86, V31–V39. [Google Scholar] [CrossRef]
  40. Donoho, D.L.; Johnstone, I.M. Ideal Spatial Adaptation by Wavelet Shrinkage. Biometrika 1994, 81, 425–455. [Google Scholar] [CrossRef]
  41. Li, H.; Nozaki, T. Application of Wavelet Cross-Correlation Analysis to a Plane Turbulent Jet. JSME Int. J. Ser. B 1997, 40, 58–66. [Google Scholar] [CrossRef]
  42. Thorbecke, J.W.; Draganov, D. Finite-Difference Modeling Experiments for Seismic Interferometry. Geophysics 2011, 76, H1–H18. [Google Scholar] [CrossRef]
  43. Panea, I.; Draganov, D.; Almagro Vidal, C.; Mocanu, V. Retrieval of Reflections from Ambient Noise Recorded in the Mizil Area, Romania. Geophysics 2014, 79, Q31–Q42. [Google Scholar] [CrossRef]
  44. Basnet, M.B.; Anas, M.; Rizvi, Z.H.; Ali, A.H.; Zain, M.; Cascante, G.; Wuttke, F. Enhancement of In-Plane Seismic Full Waveform Inversion with CPU and GPU Parallelization. Appl. Sci. 2022, 12, 8844. [Google Scholar] [CrossRef]
  45. Nikolić, M.; Karavelić, E.; Ibrahimbegovic, A.; Miščević, P. Lattice Element Models and Their Peculiarities. Arch. Comput. Methods Eng. 2018, 25, 753–784. [Google Scholar] [CrossRef]
  46. Rizvi, Z.H.; Mustafa, S.H.; Sattari, A.S.; Ahmad, S.; Furtner, P.; Wuttke, F. Dynamic Lattice Element Modelling of Cemented Geomaterials. In Advances in Computer Methods and Geomechanics; Prashant, A., Sachan, A., Desai, C.S., Eds.; Springer: Singapore, 2020; pp. 655–665. [Google Scholar]
  47. Nikolic, M.; Ibrahimbegovic, A.; Miscevic, P. Discrete Element Model for the Analysis of Fluid-Saturated Fractured Poro-Plastic Medium Based on Sharp Crack Representation with Embedded Strong Discontinuities. Comput. Methods Appl. Mech. Eng. 2016, 298, 407–427. [Google Scholar] [CrossRef]
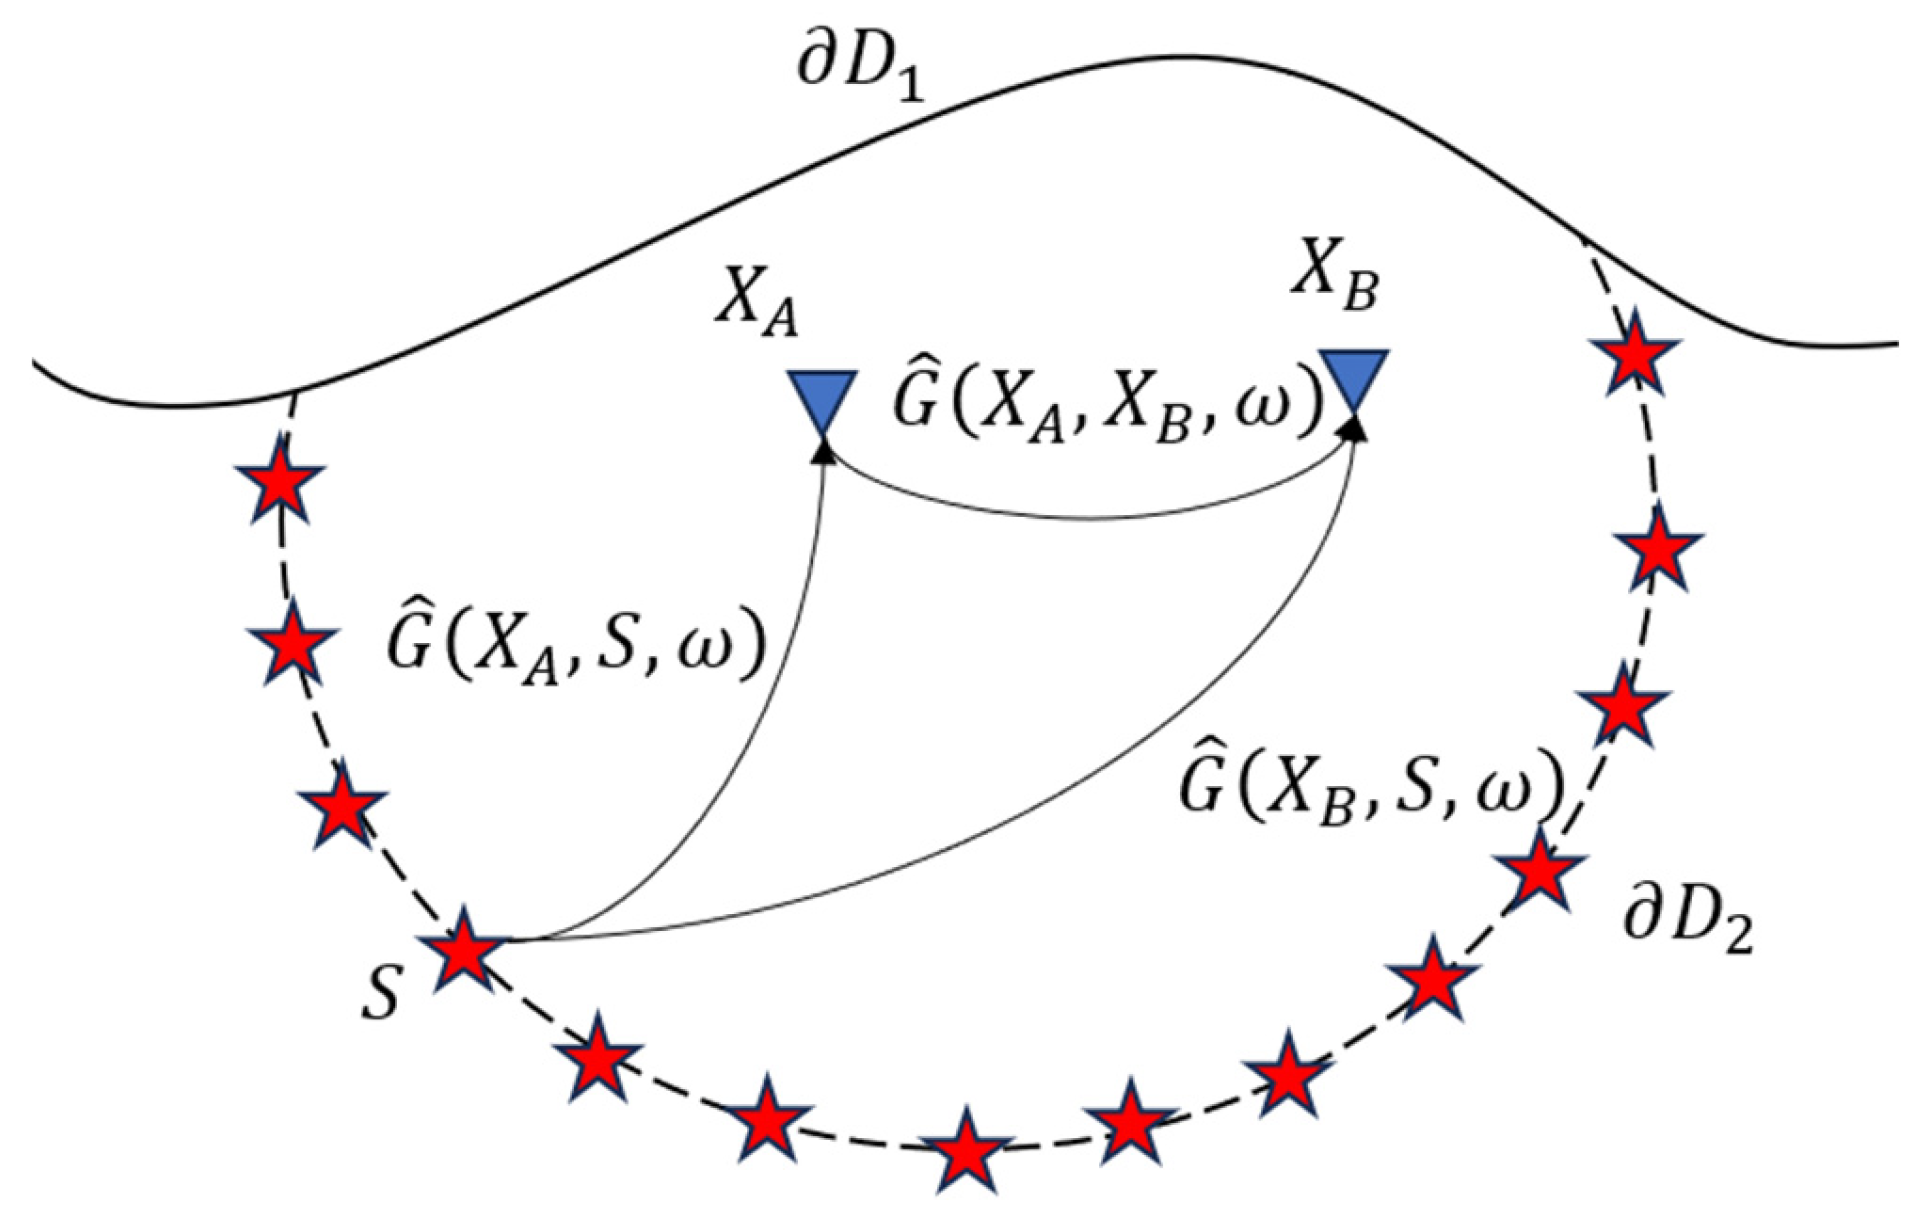
Figure 1. Diagram of the principle of seismic interferometry.
Applsci 15 03917 g001
Figure 2. Technical approach.
Applsci 15 03917 g002
Figure 3. Passive numerical simulation: (a) P-wave velocity model; (b) raw passive data.
Applsci 15 03917 g003
Figure 4. Comparison of passive seismic data cross-correlation results with active source results: (a) virtual shot gather reconstructed from passive seismic data in an elastic medium; (b) shot gather recorded from direct forward modeling of an active source in an elastic medium.
Applsci 15 03917 g004
Figure 5. Comparison of passive seismic data cross-correlation results with active source results: (a) virtual shot gather reconstructed from passive seismic data in an acoustic medium; (b) shot gather recorded from direct forward modeling of a cross-correlation in an acoustic medium.
Applsci 15 03917 g005
Figure 6. The ideal representation of passive source seismic data in the time–frequency domain: (a) time–scale; (b) time–frequency.
Applsci 15 03917 g006
Figure 7. Time–frequency spectrum of the reflected waves before and after thresholding: (a) before thresholding; (b) after thresholding.
Applsci 15 03917 g007
Figure 8. Comparison of cross-correlation results after extracting body wave noise: (a) virtual shot gather reconstructed after bandpass filtering; (b) reconstructed virtual shot gather after SWT thresholding; (c) migration imaging profile.
Applsci 15 03917 g008
Figure 9. Comparison of cross-correlation results after extracting surface wave noise: (a) reconstructed virtual shot gather after SWT thresholding; (b) virtual shot gather reconstructed after bandpass filtering.
Applsci 15 03917 g009
Figure 10. Surface wave inversion results: (a) reconstruction of surface waves after SWT processing; (b) surface wave dispersion imaging; (c) surface wave inversion results, where blue represents the initial model, green represents the true model, and red represents the inversion result.
Applsci 15 03917 g010
Disclaimer/Publisher’s Note: The statements, opinions and data contained in all publications are solely those of the individual author(s) and contributor(s) and not of MDPI and/or the editor(s). MDPI and/or the editor(s) disclaim responsibility for any injury to people or property resulting from any ideas, methods, instructions or products referred to in the content.