1. Introduction
Electricity loss refers to the amount of energy that is dissipated or wasted during the process of generation, transmission, and distribution. This loss is obtained from the difference between the energy generated and the energy billed to the end consumer [
1,
2]. Electricity losses are divided into two groups: technical losses (TLs), or natural losses of the system, and non-technical losses (NTLs) [
3].
TLs are inevitable and are related to the processes of energy transformation and transportation through the electrical system. These can be reduced through technological advancements and proper maintenance of electrical networks [
1,
3]. NTLs occur due to administrative errors that arise in the management of electricity marketing (such as un-billed electricity), the malfunctioning of measuring equipment, and primarily, fraud and electricity theft. These losses are highly prevalent in the distribution stage [
4]. The distribution of non-technical losses (NTLs) can vary depending on the distribution company, region, or country. From the analysis of the inspectors’ comments in the provided data, it was identified that approximately 15% of these losses are due to administrative errors, such as billing failures, measurement errors, omissions in meter readings, and incorrect account records. In contrast, 85% of them are attributed to electricity fraud and theft, including tampering with meters, illegal connections, and deliberate fraud by consumers. In [
2], it is established that losses due to bill collection, overstaffing, and under-pricing can vary between 19% and 70% of the total losses.
Energy fraud occurs through the tampering of electricity meters, which causes measurement errors and consequently changes in energy billing. Energy theft is manifested in clandestine connections and direct connections from the grid, without any billing [
1,
5]. Theft and fraud are serious problems for utility companies in both developing and developed countries, causing significant economic harm to electricity companies [
6,
7].
In Montevideo, the capital city of Uruguay, NTLs account for approximately 13% of the total energy distributed [
8]. In Iran, NTLs caused by electricity theft represent more than 15% of the generation capacity [
9]. P. Glauner et al. indicate that for the United States and the United Kingdom, the financial losses caused by electricity theft range between 1 billion and 6 billion each year [
10]. A. Pazderin et al. established that in the Russian Federation, NTLs, in terms of the volume supplied to the distribution network, vary from 0.06% to over 25%, depending on the region and the organization of the electrical network [
11]. In South Africa, it is estimated that there were irrecoverable losses of ZAR 685 million in 2020 [
12].
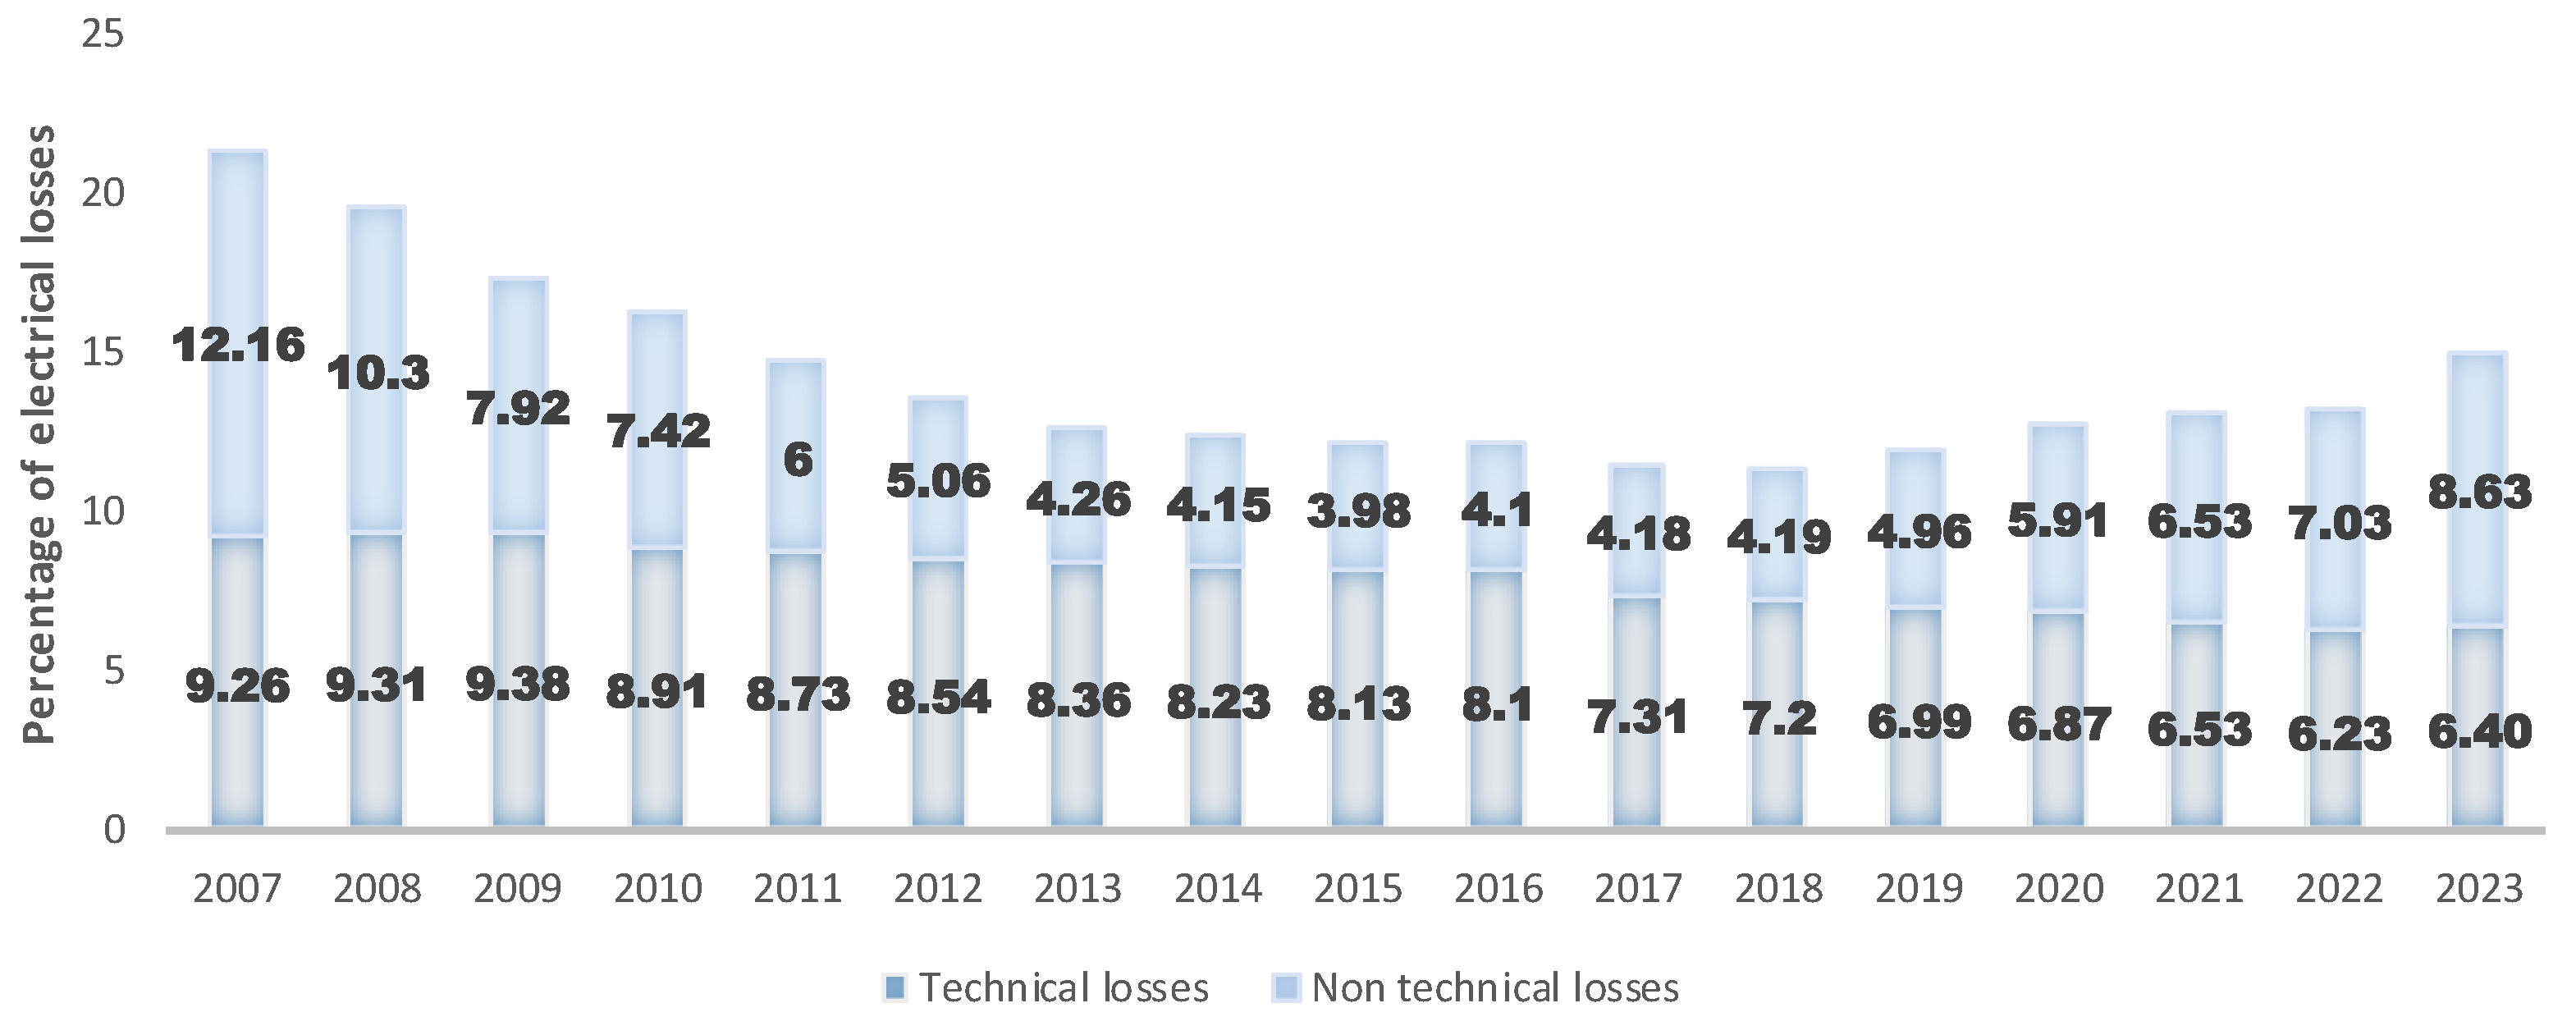
Figure 1 shows the reported percentages of electricity losses in Ecuador (a developing country located in South America) from 2007 to 2023. A decrease in the percentage of losses is observed from 21.42% reported in 2007 to 15.02% in 2023. However, an increase is noted since 2018 with a tendency towards higher levels. As observed, the problem has persisted over time, with a notable increase in NTLs from 3.9% recorded in 2015 to 8.63% in 2023.
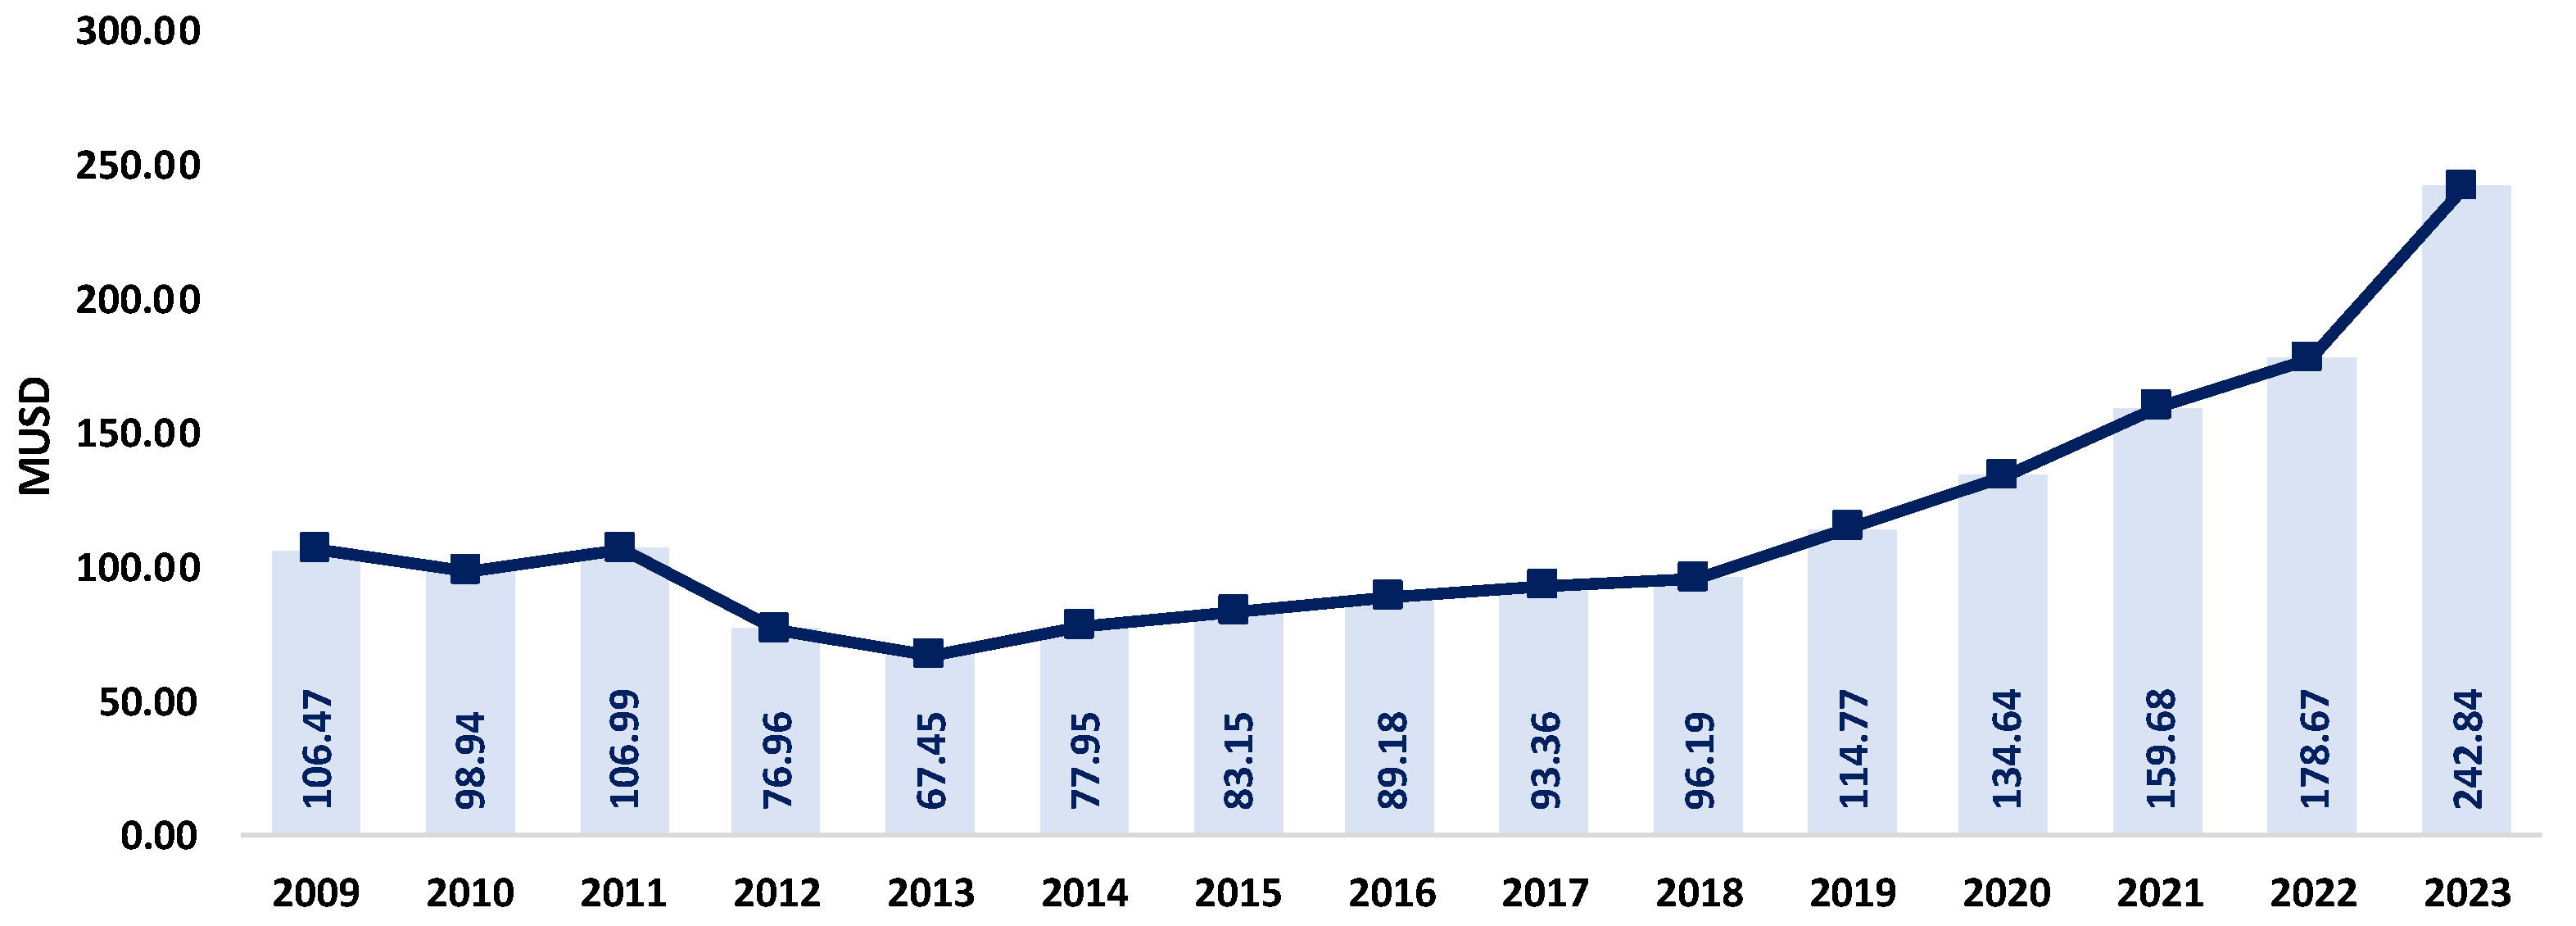
In the Ecuadorian case, it is possible to estimate the economic impact caused by NTLs.
Figure 2 presents the result of this estimation based on the energy billed by electric distribution companies. It indicates that in 2023, NTLs represented USD 242.84 million for the Ecuadorian state, and this value may increase in the future.
Despite significant efforts and substantial investments by the country’s electric utilities, non-technical losses (NTLs) remain a persistent challenge. Addressing this issue requires the implementation of advanced analytical techniques and efficient methodologies to better control and mitigate these losses. This study proposes a data-driven methodology for detecting NTLs in electric distribution systems. Several widely used classification models are trained, with a particular focus on ensemble methods such as Categorical Boosting (CGB), Light Gradient Boosting Machine (LGB), and Extreme Gradient Boosting (XGB). The proposed methodology is applied to an Ecuadorian electricity distribution company, leveraging consumption records to generate targeted lists of users suspected of fraud. Furthermore, the study provides specific recommendations for the practical implementation of this methodology within electric distribution companies. The methodology follows a structured five-step process to identify metering systems with potential NTL issues, enabling companies to take proactive measures for loss mitigation. The key contributions of this work include the following:
The treatment of class imbalances in the data using evaluation metrics is included.
Improvement in model performance by hyperparameter tuning using a grid search approach.
Validation via cross-validation techniques, with a comparative analysis of model performance in terms of accuracy and F1 score.
This article is structured as follows:
Section 2 contains the state of the art, which indicates the advancements in techniques applied to mitigate energy losses.
Section 3 provides a brief classification and description of the main methods for detecting losses and related publications on the topic.
Section 4 describes data analytics, compares different classification methods, and finally presents the proposed methodology for the distribution company.
Section 5 discusses the obtained results. Finally,
Section 6 summarizes the main findings of this research study.
2. Literature Review
NTLs cause serious problems for distribution companies around the world, which is why detecting electricity theft is an essential task for electric companies [
14]. To address the growing problem of electricity fraud, numerous approaches to detecting NTLs have been adopted. NTL detection solutions incorporate contributions from various knowledge domains, such as theoretical studies, hardware-oriented solutions, data-oriented solutions, and a combination of these known as hybrid methods [
3,
11,
15,
16,
17,
18]. In
Table 1, the reviewed methods for this research study are summarized.
The Ecuadorian case is of interest due to the severity of the economic losses, the availability of detailed data, and the need for advanced methods to improve the detection of NTLs in an environment with technological limitations. Additionally, the literature on NTL detection in Ecuador is limited. In [
17], data from a distribution company in the country are analyzed, and unsupervised techniques complemented by neural networks are employed. However, no studies that address this problem with a boosting model-based approach, as used in this study, have been found. The lack of prior research and the sustained increase in these losses reinforce the urgency of developing effective methodologies for their detection and mitigation in Ecuador.
2.1. Theoretical Study
Theoretical studies are methodologies focused on analyzing which socio-economic and demographic factors and variables allow for the identification of NTLs within a limited area or location [
15,
18]. The results of these studies can identify those responsible and point out the causes of the NTL phenomenon, allowing for the adoption of decisions and policies that help to reduce them [
15].
In this regard, T. Winther makes a distinction based on surveys and fieldwork to understand those agents involved in electricity theft in a region of Tanzania and in India [
19]. T. Winther studies the socio-economic variables obtained from illegal electricity consumers to conduct an econometric study. He concludes that education, income, social capital, the rural population rate, the temperature index, and the agricultural production rate are important determinants for characterizing electricity theft. Furthermore, he suggests that special education programs could be designed to focus on preventing electricity theft [
79]. He also recommends the implementation of social tariffs that take into account the purchasing power and levels of social capital of different individuals.
V. Gaur and E. Gupta analyze the socio-economic and governance factors that determine the extent of electricity theft in Indian states. Their results show that electricity theft is related to the degree of corruption, the relationship between state taxes and GDP, the efficiency in collecting electricity bills, poverty, and even literacy levels or income [
20]. They also point out that a better understanding of the key determinants of thefts in electricity distribution is vital for policymakers to design policies. On the other hand, Jamil and Ahmad investigate the relationship between energy theft and corruption, identifying a series of operationally measurable variables, such as the wage rate in electricity utility companies, conviction rate, fines, and civil society participation, which can help reduce electricity theft. Their study indicates that efficient wages, continuous motivation of officials, and active consumer involvement in reporting crimes can help combat corruption and energy fraud [
24].
O. Gbolahan analyzes the effects, consequences, and measures to control electricity theft in Nigeria. He points out that illegal electricity users are divided into two general categories: those who cannot afford it and those who can afford it but choose not to pay. He suggests developing strategies to focus on these different categories, as well as installing advanced energy meters [
21]. O. Yakubu et al. analyze the factors causing NTLs by conducting surveys in Ashanti Region, Ghana. They found that the main causes of electricity theft in this region are high electricity prices, poor quality of power supply, and corruption, among others [
22]. P. Glauner et al. discuss the limitations of current approaches to reducing NTLs and indicate that on-site inspections alone are not sufficient. They suggest other approaches, such as market reforms, increasing the efficiency of the organizational structure of distribution companies, and optimizing communication between utilities and customers [
23].
While these studies can help in decision making and reducing electricity losses, the main disadvantage is that they do not directly target the offenders and are not very effective against the problem [
15].
2.2. Data-Driven Solutions
These are methods that rely on the analysis of data related to electricity users, such as consumption, demands, and type of tariff, among others. With these methods, consumer profiles of electricity are evaluated, and through computer techniques, users with a high probability of committing NTLs are identified [
3,
16,
66]. Most of these studies are aimed at discovering and applying classification techniques, depending on the type of data available to the distribution company [
15]. These techniques are divided into the following.
2.2.1. Supervised Methods
They are called supervised methods because the development of the algorithm requires labeled data [
66]. For the training of the algorithm, the distribution company will need to have labeled data with classes designated as positive—fraud—and negative—no fraud [
3,
16]. The main disadvantage of these supervised methods is the need for labeled data. For this, the distribution company must have information related to fraud in its database [
16].
2.2.2. Unsupervised Methods
These are methods that do not require labeled data for their development [
16]. In this case, the algorithm identifies patterns and aims to gain experience from available data. These techniques are used when the distribution company does not have labeled data or when one of the two classes is much larger than the other [
66].
The need for distribution companies to have labeled data makes supervised methods impractical. Therefore, there are research lines focused on defining techniques that use unsupervised data against NTLs [
61]. Messinis and Hatziargyriou proposed a dynamic model called recursive transform learning for the online unsupervised detection of NTLs. This model has been shown to achieve results that are comparable or even better than supervised methods [
61]. Along the same lines, I. Monedero et al. developed a fraud detection system for the company Endesa in Spain [
41]. The work utilizes data analytics and is based on five different algorithms for the detection of NTLs using the Pearson coefficient, Bayesian networks, and DT. They achieved a success rate of 38% in the inspection of real customers with the help of the presented algorithms.
D. Mashima et al. proposed a model for using data analysis to detect electricity theft and a new metric that leverages the model to evaluate and compare anomaly detection [
80]. To validate the approach, real data from a system with advanced metering infrastructure were used. Honest consumer data were considered, but unfortunately, no metric was defined to evaluate whether the collected data were free from theft. S. Salinas et al. presented three distributed algorithms to solve a system of linear equations for detecting whether a particular consumer is fraudulent or not by determining coefficients of honesty [
81]. Neural networks were applied and achieved effective results, with 75% of true negatives, 95% of true positives, 6.25% of false negatives, and 25% of false positives [
52]. It is even recommended to improve them by using the hyperparameters with which the neural network is trained.
Benford’s analysis was also employed for the initial diagnosis of big data from smart meters, along with a Stackelberg game theory model. The framework was validated by using real electricity usage data from an electric service company in Florida to filter out fraudulent meters within a community. From the results, the probability of detecting energy theft in each smart meter was obtained. However, the false positive rate was quite high compared with existing techniques in the literature [
82]. Bayesian risk structures, RF, Support Vector Machine (SVM), and Artificial Neural Network (ANN) were also applied to recover lost revenue due to NTLs and detect potential irregular consumers based on their consumption profiles [
8].
2.3. Grid-Oriented Methods
Hardware-oriented solutions use devices to monitor the characteristics of the electrical network system, such as power, current, and voltage [
16]. These methods are very efficient when it comes to finding NTLs, but the main disadvantage is that they require additional equipment, making them costly.
Gupta et al. present a technique for detecting energy theft by either manipulating or bypassing the energy meter. This technique requires the injection of high-frequency signals from smart meters, which represents a high cost for the utility company [
83]. Another disadvantage is that energy theft through cyberattacks cannot be prevented. Henriques et al. developed a modified ammeter to facilitate the detection of fraud in low-voltage consumer units. This allows the operator to verify and compare differences between local and remote measurements to establish if there is fraud [
84]. Another example is the development proposed by I. Kazymov et al., who proposed a method based on the suitability of smart meters. This method involves evaluating the voltage drop in a segment. When the calculated voltage drop does not match the actual one, it is determined that there is unregistered consumption in that area, and the location will need to be inspected [
85].
2.4. Hybrid Methods
Hybrid methods are a combination of data-oriented and network-oriented methods with the intention of achieving greater precision in the search for NTLs. In this way, the total energy consumed can be estimated through some equipment installed at a location in the network. After the TLs have been calculated, it is verified whether there are NTLs at that location. If the existence of losses is established, a classification technique (supervised or unsupervised) is applied with the aim of directly targeting the offenders [
3,
16]. The accuracy of these methods increases, but the disadvantages remain the cost and implementation of equipment in the electrical network [
16].
An approach associated with these methods is to detect fraudulent customer transformers based on a static state estimation model, which uses voltage and power measurements from smart meters [
86]. In case of detecting theft, the automatic disconnection of switches in the distribution network is carried out to identify the fraudulent consumer through the analysis of the variation in energy consumption of all consumers. In this model, the use of smart meters is essential to obtaining state variables at the transformer level and then deriving the estimated load curves. The scheme proposed by P. Jokar et al. also involves monitoring at the transformer level in areas with a high probability of energy theft, in order to identify changes in the consumption patterns of suspected customers. Detection is based on analyzing the demand behavior of customers who are suspected of fraudulent consumption [
87].
The SVM classification technique is employed in the proposal by J. Pulz et al. The method involves installing smart meters throughout the electrical network and comparing the energy consumed by users with the energy recorded by the smart meters. If no NTLs are detected, the total consumption of customers plus TLs should match the readings from the smart meters. If there is a discrepancy, the area should be inspected [
36]. The proposal by J. Leite et al. also requires measurement devices on each transformer in a smart grid. Although the use of hardware increases the cost, the results presented yield a high number of false positives, increasing the cost due to the need for field inspections and the use of information technology equipment to assess the veracity of energy theft [
88]. In addition to the required equipment, a strategy was proposed to detect NTLs by using a multivariate control chart that establishes a reliable region for monitoring the measured variance. After the detection of NTLs, a path search procedure based on the A-Star algorithm is capable of locating the consumption point with the NTLs.
3. Data-Driven Solutions Applied for the Detection of NTLs
For these techniques, data related to the electricity consumer is used. As mentioned earlier, these techniques are classified into two types: supervised and unsupervised.
3.1. Supervised Methods
They are methods that require data to be classified as positive—fraud—and negative—non-fraud—for learning. To apply these methods, a database containing customer load profiles with a label or classification is needed [
3,
16,
66]. Among the most common methods are those listed below.
3.1.1. Nearest Neighbors
The K nearest neighbors (K-NN) algorithm allows for the classification of samples based on training data. This technique calculates the distances from the new sample to all the data and selects the K nearest elements. The sample that is most repeated among the K elements will be the classification of the new element. In other words, this algorithm for categorization seeks out examples that are “very similar” to the new sample and classifies them according to this similarity [
27,
28,
30,
89].
It is the simplest and easiest-to-implement supervised algorithm, and it is often used to make comparisons with other algorithms [
16]. While the most commonly used distance function is the Euclidean (Equation (
1)), there are also the Manhattan and cosine distances [
26].
where
d is the distance between two points in a metric space,
are the points whose coordinates are given in an
n-dimensional space, and
are the coordinates of
in dimension
i.
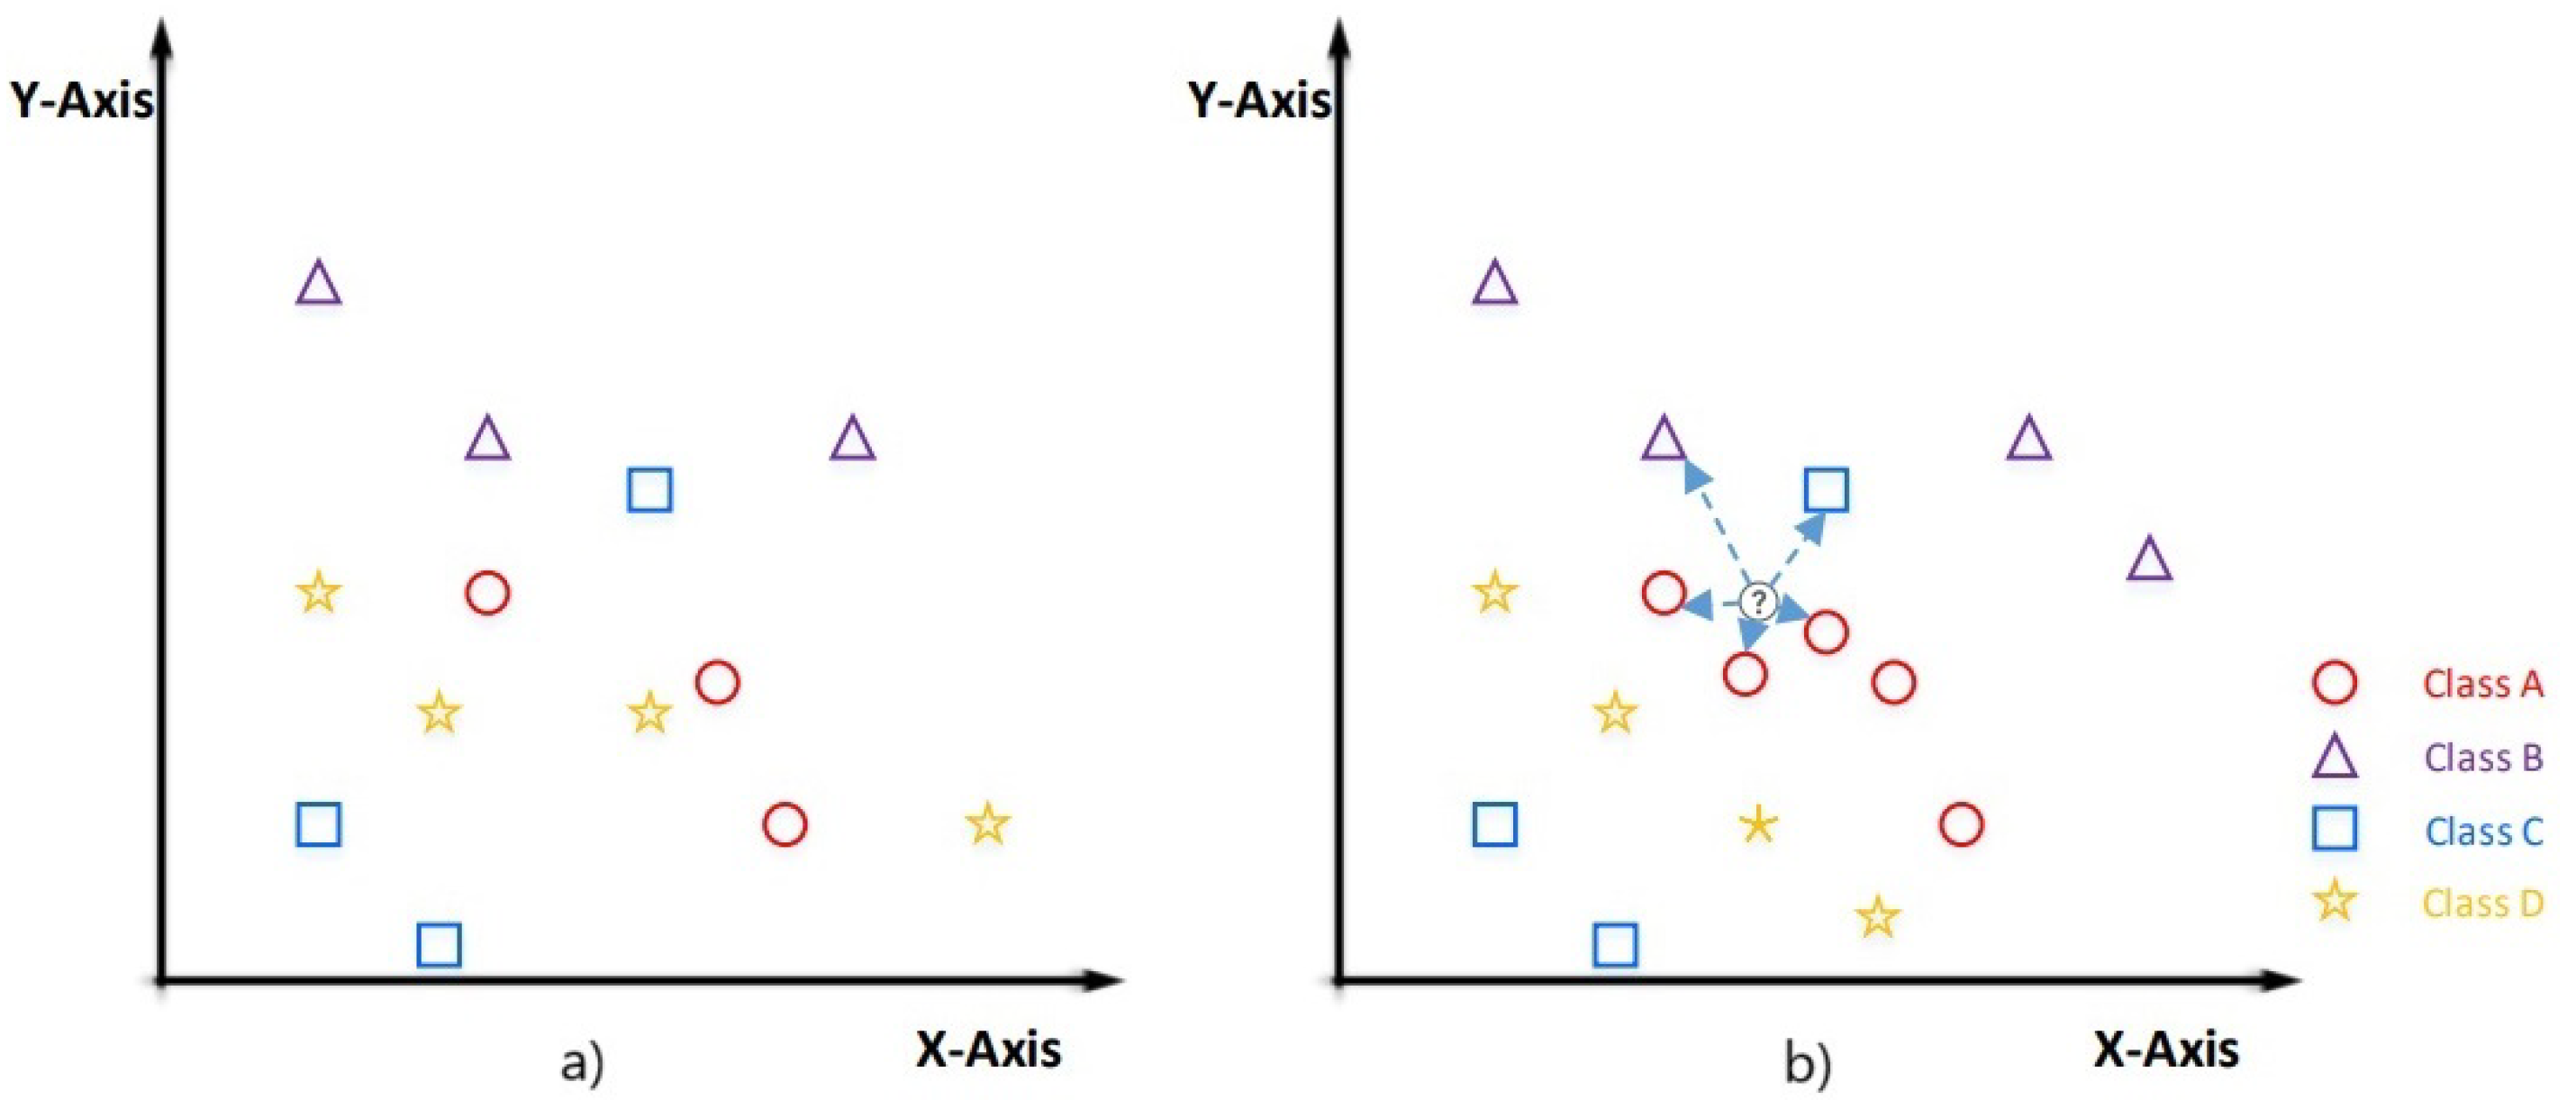
In
Figure 3, an example of how this algorithm works is presented. For the example case, four classes of geometric shapes are shown: Class A = circle (red color), Class B = triangle (purple color), Class C = square (blue color), and Class D = star (yellow color). The value of K = 5. As can be seen, the new sample is classified as a circle because, out of its five nearest neighbors, three are circles, one is a triangle, and one is a square. Therefore, by majority vote, it is classified as a circle.
3.1.2. Support Vector Machine
The SVM method is one of the most widely used techniques for detecting NTLs due to its good performance and adaptability, resilience to class imbalance, ease of use, and tendency to yield results with fewer adjustments [
15,
16,
66].
It is a binary classifier that has gained much popularity in recent years, as it achieves results when the separation boundary between classes is almost linear; otherwise, its classification performance drops sharply [
25,
26,
31,
32,
33,
34,
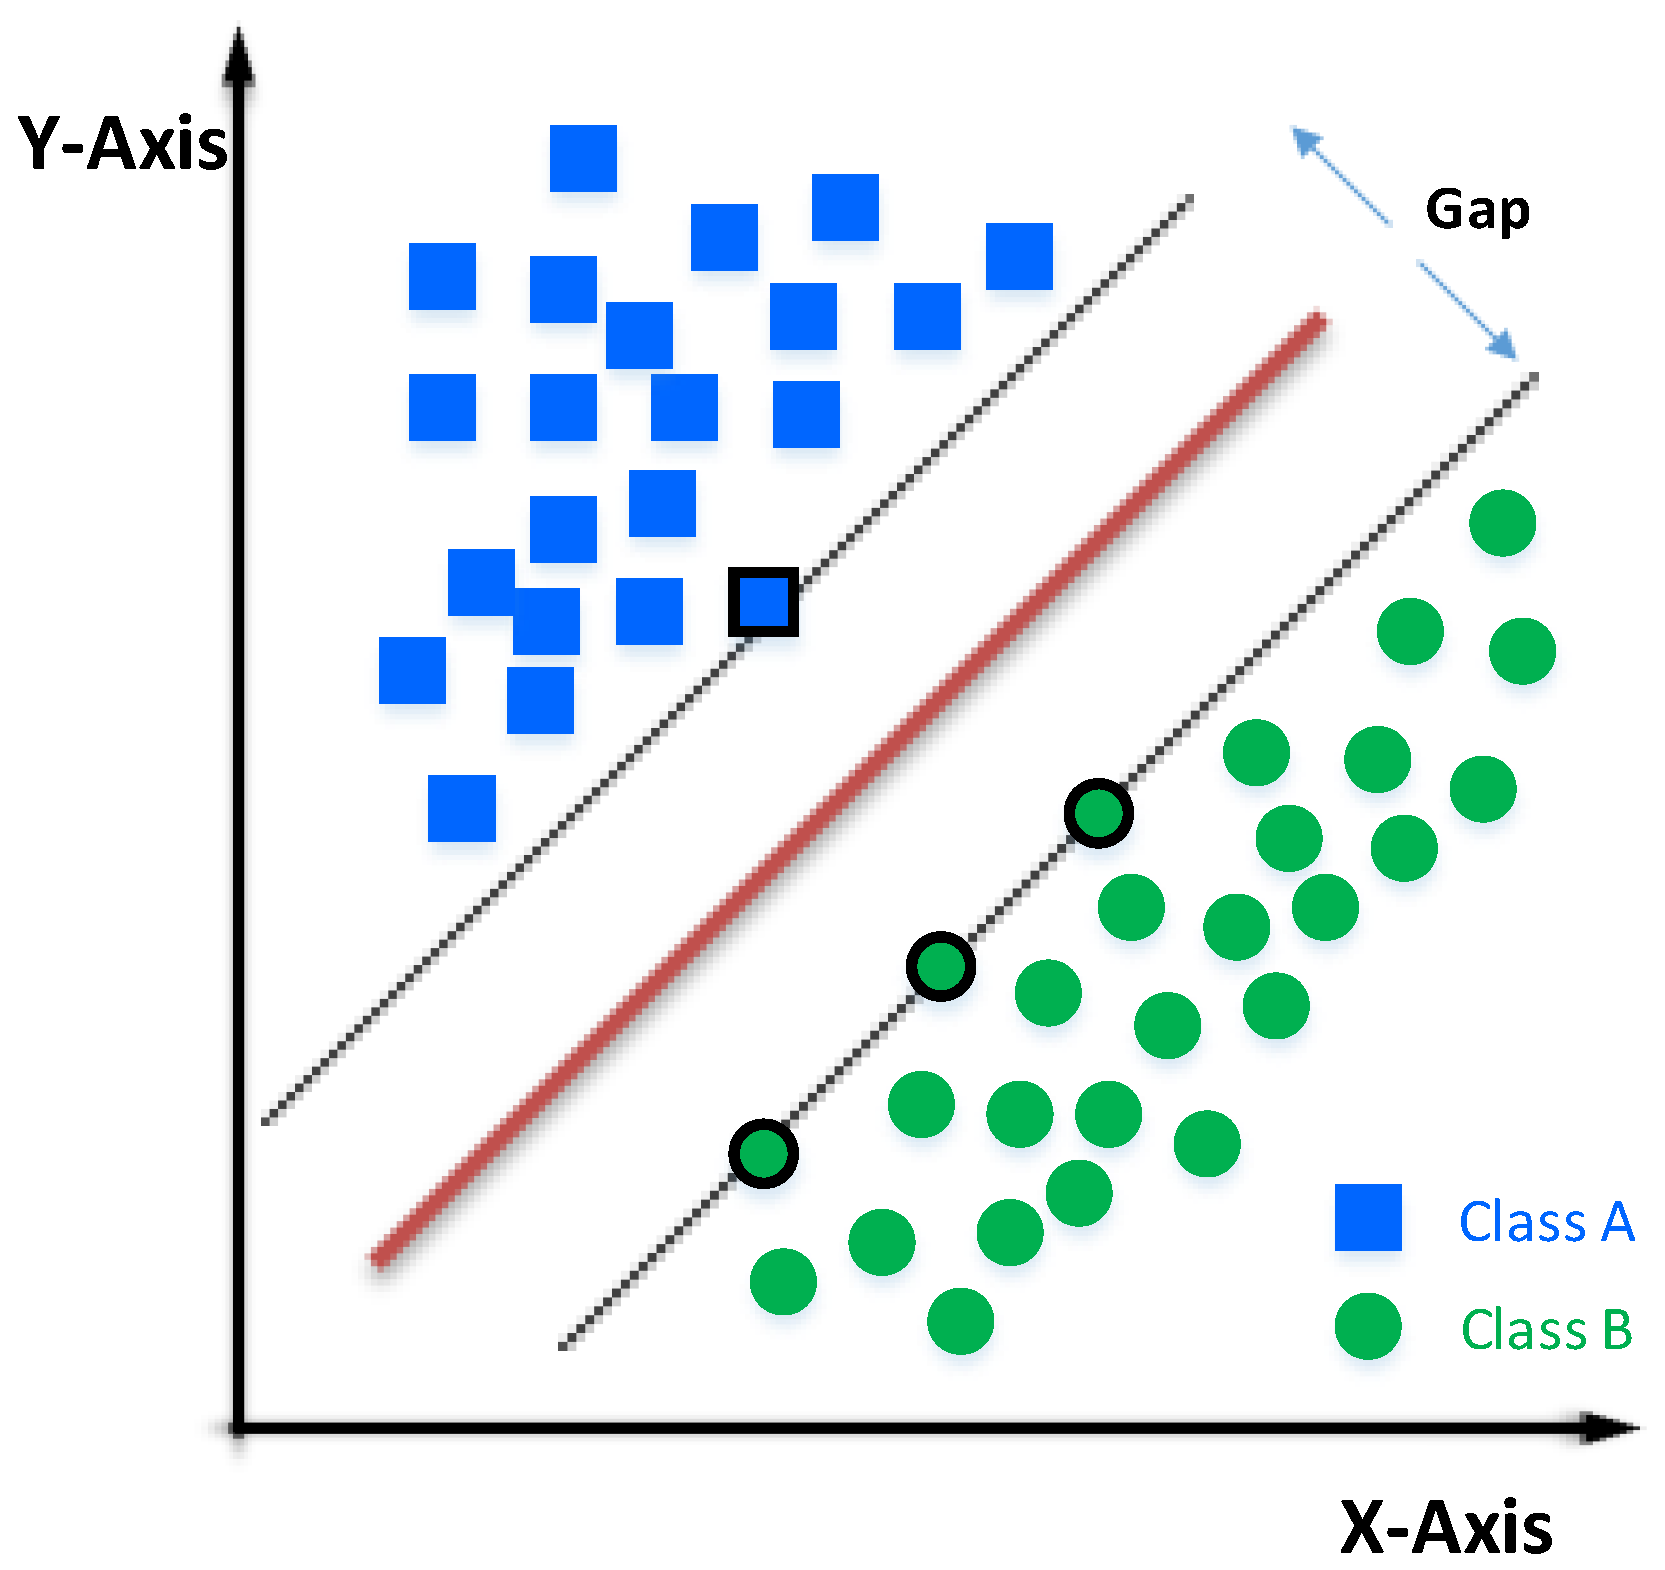
42]. To address this issue, the algorithm uses a dimensionality increase with a Kernel. A Kernel (Linear Kernel, Polynomial Kernel, or Gaussian Kernel) is a function that provides the response of a dot product between two vectors, executed in a recent dimensional space compared with the original space where the vectors are located [
31]. An example can be seen in
Figure 4. Given a set of training samples, we can label the classes and train an SVM model with them, which will serve to predict the class of a new sample.
An SVM represents the points of a sample in space and separates the classes into two spaces as widely as possible through a separation hyperplane defined by the two points of the two closest classes, which are called support vectors. When we use a new sample on this model, we can determine which class it belongs to.
An SVM model using energy data from users in Malaysia achieved detection rates ranging from 3% to 60%. The same authors combined the SVM model with induction rules (IF-THEN) in a subsequent study, achieving detection rates of 72%. In [
36], the authors trained an SVM model by using 20 input attributes, including socio-economic variables and statistical variables related to customer consumption, achieving success rates of 70%. Alongside these models, the use of sensors and meters is an option; however, this increases costs, making it potentially impractical for some distribution companies [
42].
3.1.3. Decision Tree
Decision Tree (DT) is a classifier that uses a flowchart-like graph, starting with an initial node and then “branching out”. New samples are classified based on rules formed during the training of the DT. Essentially, DT is an algorithm that employs IF-ELSE-THEN rules. The main disadvantage of this model is that it can overfit by correctly classifying samples, creating an infinite number of branches [
33,
40,
41,
42]. DT is used for classification and regression models and largely depends on the training dataset. It is also very sensitive to the problem of class imbalance [
4,
16].
CART, combined CART, and RF algorithms for big data analysis have been used for loss detection. It has been found that the CART technique leads to better results (93%), due to the ability to achieve fast classification and computational expansion in parallel [
44]. Other algorithms studied, such as Adaboost and DT C4.5, have achieved performance rates of 88%, 82%, and 73% [
33].
3.1.4. Random Forest
Random Forest (RF) is an ensemble of DTs. Each tree is trained independently with a random number of variables. During the classification phase, each tree performs the classification, and the final classification is determined by the predominant class [
26,
90].
3.1.5. Gradient Boosting
The gradient boosting (GB) method is an ensemble method like RF that uses DTs. [
91]. Unlike RF, which trains multiple trees in parallel, GB trains one tree at a time, where each tree learns from the mistakes of its predecessor, so that the next tree adjusts what the previous one failed to capture [
59,
91,
92]. The main disadvantage of this method is its susceptibility to overfitting, while its main advantage is its robustness against imbalanced data [
91].
3.1.6. Optimal Path Forest
The supervised Optimal Path Forest (OPF) algorithm is a graph-based model used for clustering and classification applications [
15,
16,
66]. Unlike SVM, which is trained to obtain an optimal hyperplane for separating classes, OPF divides the graph into optimal path trees (two or more trees), each representing a class. Each tree is connected to a prototype, and the collection of trees forms the classifier [
4,
16]. This classifier can operate with overlapping classes and has a low training time [
16].
The OPF classifier has been used for the identification of NTLs in databases of industrial and commercial consumers, considering few features extracted from hourly load and demand profiles. The algorithm has shown advantages in consumer classification compared with other supervised classification methods. The limitation in its application is that it requires knowledge of the expected monthly consumption and the use of energy meters that provide hourly consumption [
46]. OPF has been employed to classify customers’ monthly consumption into suspicious and non-suspicious categories. To enhance the performance of the method, the use of a feature extraction algorithm called Discrete Cosine Transform has been included [
47].
3.1.7. Neural Networks
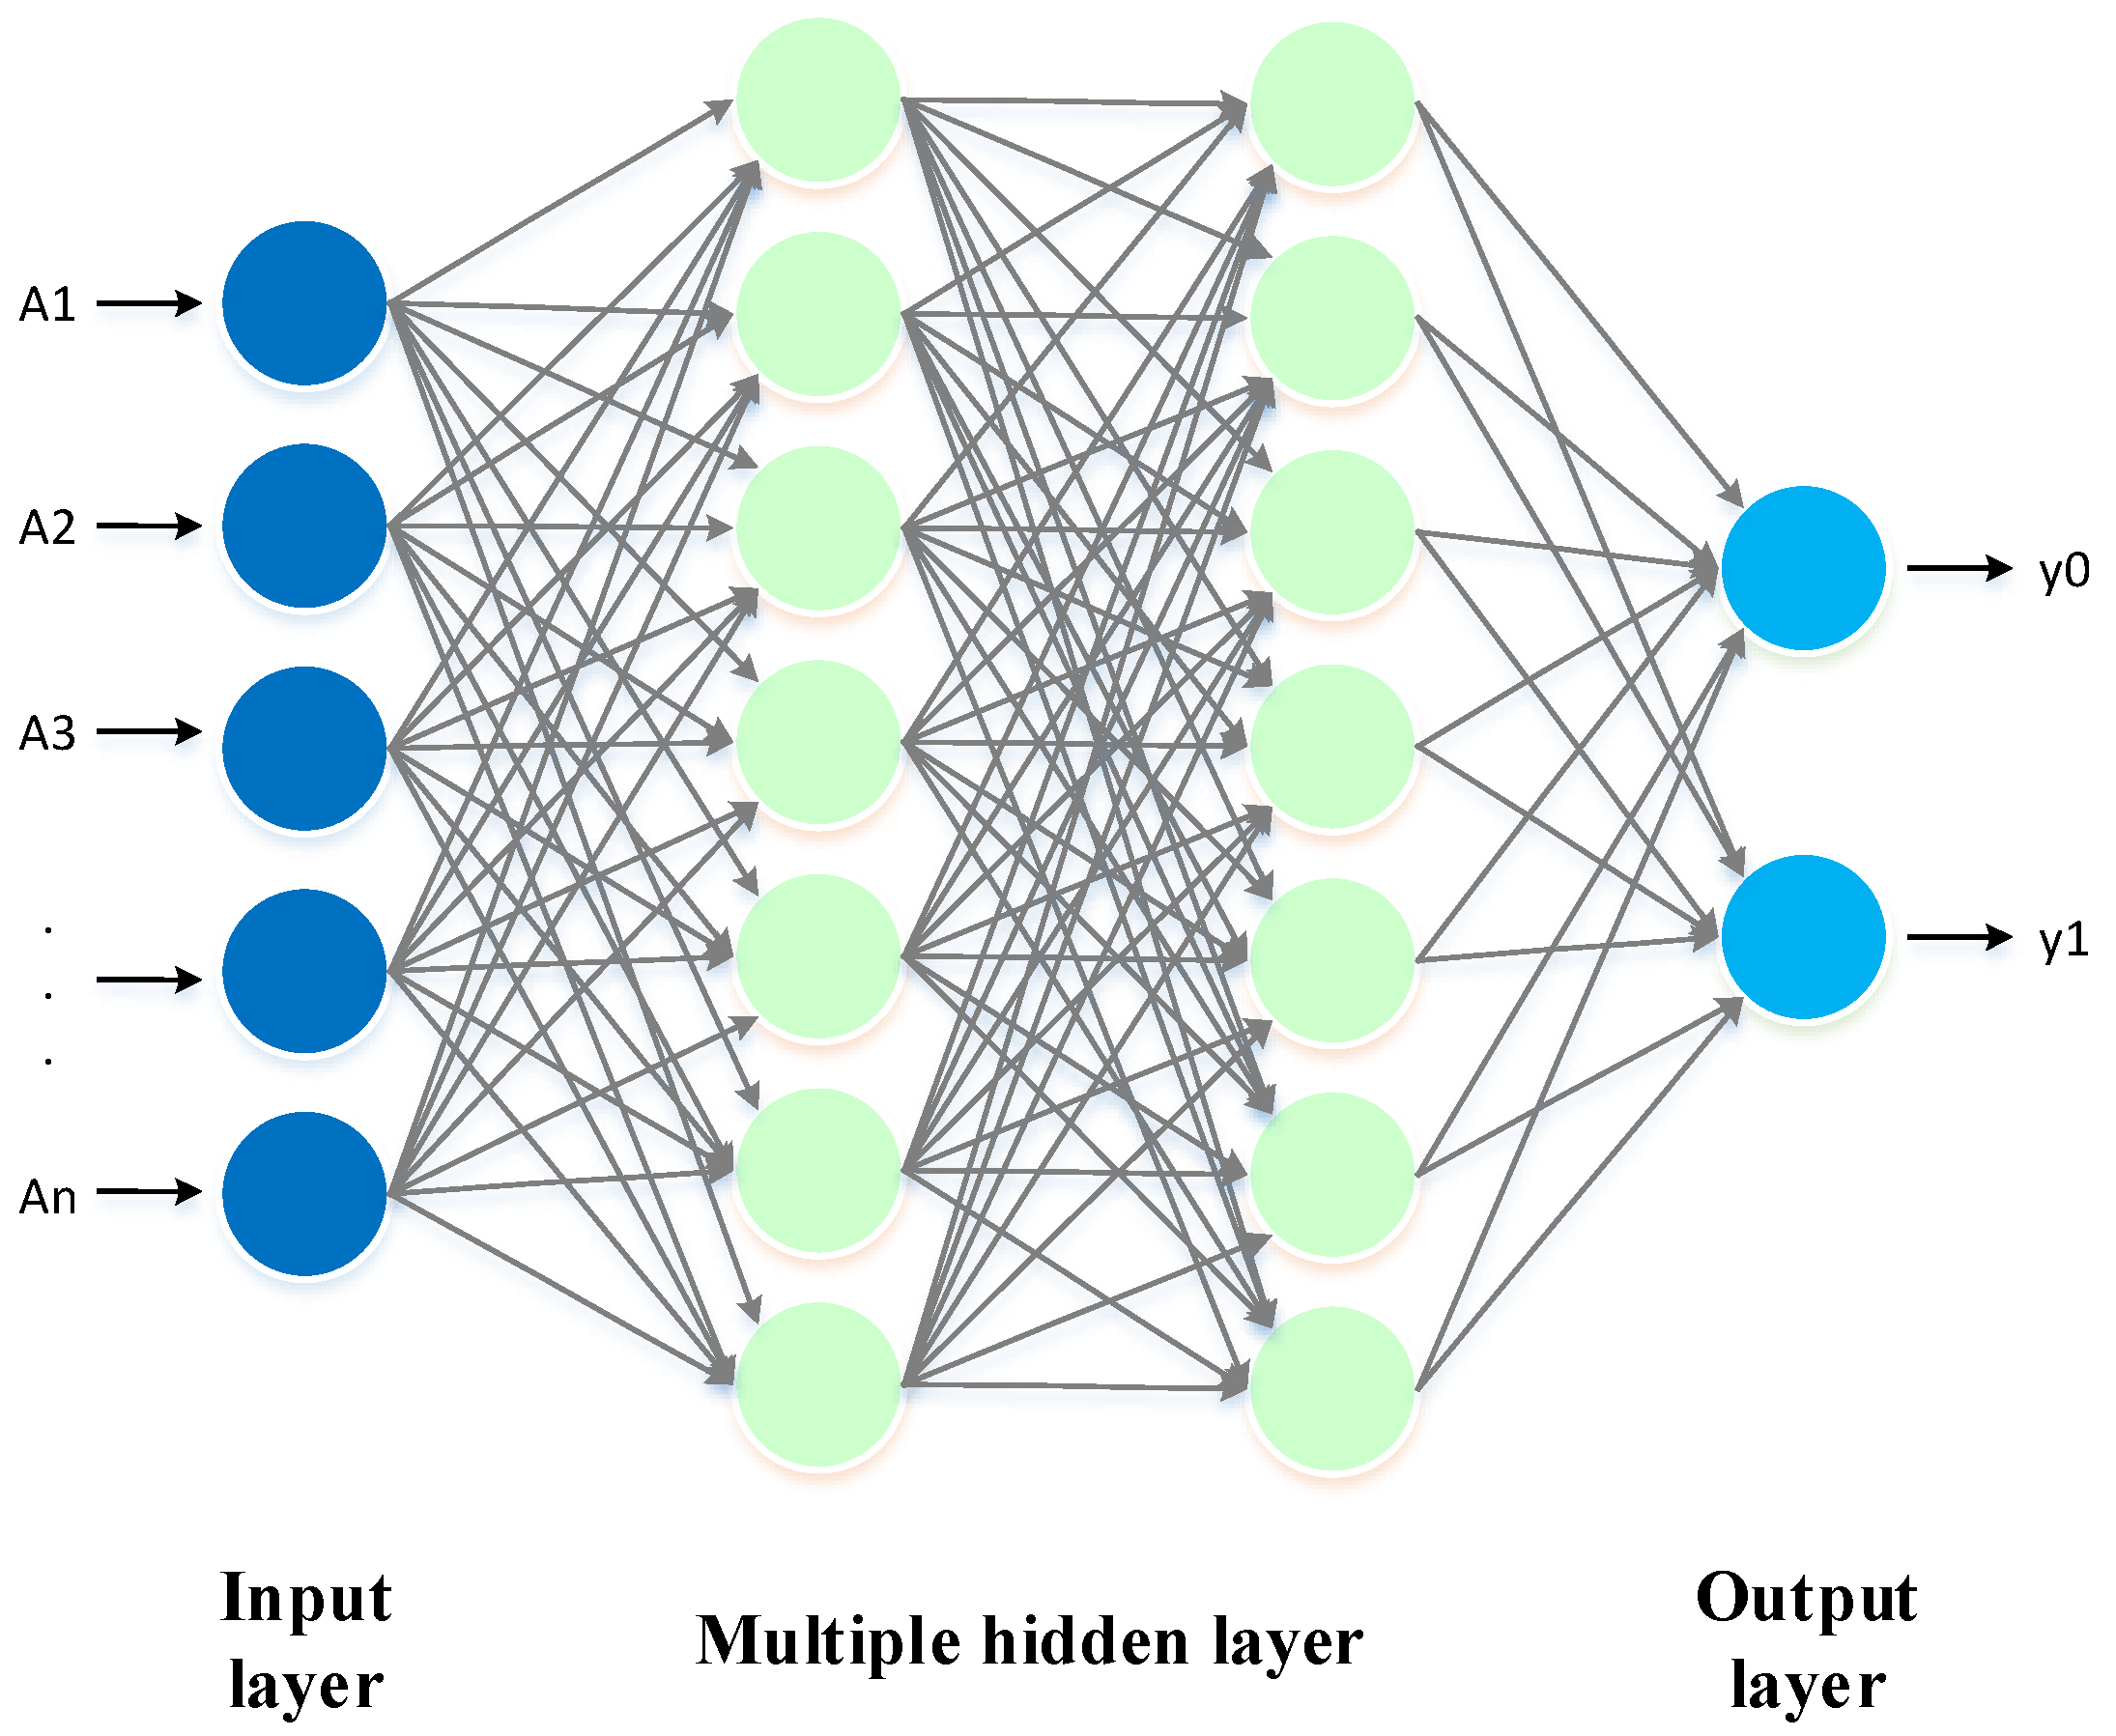
The ANN is based on a human neuron, is formed by layers, and has the ability to solve problems without the need for programming. For example, to perform a simple calculation in traditional programming, one would have to enter data and a formula to solve the calculation. In contrast, the ANN will be able to predict the result of the calculation without the need for programming. To achieve this, the neural network must be trained, evaluated, and validated with examples [
27,
37,
50,
51,
52,
53]. The structure of an ANN can be seen in
Figure 5.
There are many types of ANN architectures, and one of the most common ones for detecting NTLs is the multi-layer perceptron ANN with backpropagation, which is generally used as a binary classifier [
4,
16,
17]. In [
93], a study that employs neural networks for detecting NTLs is presented; the model achieves a success rate of 67.5%. The use of neural networks has allowed the transformation of one-dimensional energy consumption data into a two-dimensional form, which is then used to construct a neural network algorithm. This establishes the behavior of energy consumption, which is utilized for detecting potential cases of fraud [
54].
3.1.8. Bayesian Classifier
This classifier represents the linked probability of a set of attributes graphically, making it easy for the user to interpret. This algorithm learns the conditional probabilities based on the labeled dataset on which it is trained [
41].
Naive Bayes (NB) is another type of Bayesian classifier that is based on probabilities. This classifier requires prior probability information about NTLs obtained from general statistics [
6,
39,
43,
58,
59]. However, in [
59], after evaluating 15 classifiers, it was determined that NB has a success rate below other classifiers such as DT, SVM, or K-NN.
3.1.9. Induction Rules
Induction rules refer to a set of guidelines established by expert personnel (expert knowledge) from distribution companies, which can be described through computer techniques such as IF-THEN-ELSE to distinguish malicious users [
34,
53,
61].
To obtain these rules, expert knowledge (unsupervised method) and statistical analysis are important [
4,
16]. However, expert knowledge and statistical analysis are not sufficient to solve the problem. Therefore, this technique can be used to recognize hidden patterns within the data [
4,
16,
66]. In [
53], this technique is applied, and with the help of inspectors, the success rate is increased. In addition, techniques such as text mining, ANN, and statistical analysis are used, achieving success rates of 33.6%.
3.2. Unsupervised Methods
These methods do not require labeled data for learning but rather gain experience from the available data. This analysis is focused on those distribution companies that do not have a classified database [
3,
16,
66]. Within this classification are the models listed below.
3.2.1. Clustering Algorithms
Clustering techniques are employed either as a classification model or as a method for data preprocessing. They are algorithms used to group samples with similar behaviors [
17,
55,
56,
67,
71]. Applying K-Means and K-medoids, results similar to those obtained with supervised methods are achieved. The disadvantage of these methods is that it is not exactly known how many groups to generate and which group or groups to consider as positive—fraud [
64].
3.2.2. Regression Models
These algorithms are used to forecast time series. Two types of regression are defined: (i) Autoregressive Moving Average (ARMA) and (ii) Integrated Autoregressive Moving Average (ARIMA). These techniques require comparing the energy consumed by users with the predicted energy. The greater the difference, the higher the probability that the customer is committing fraud [
4,
16,
37,
43]. The multiple linear regression model has allowed for the efficient detection of thefts, even in areas with difficult access to energy meters. The disadvantage of this application in some cases is that it requires records from smart meters [
37], which can be limiting for the use of this technique.
3.2.3. Self-Organizing Map
Self-Organizing Map (SOM) is an unsupervised algorithm similar to the ANN used for data classification. It generates a two-dimensional representation of the dataset and, in some cases, is used to reduce the dimensionality of the attributes. Another advantage of SOM is its visual presentation, which is easy for users to understand. The final result of the algorithm is groupings (malicious customers or normal customers), which will need to be evaluated by an expert system [
4,
16,
66].
3.2.4. Outlier Detection
Outlier detection methods involve the analysis of inconsistent and unusual values in a database that typically follows a pattern of behavior [
16,
77].
In [
72], a Gaussian distribution is employed to detect NTLs. This algorithm returns the probabilities of different consumers being fraudulent or not, using variables such as social class stratification, climatic variations, and energy consumption, achieving a success rate of 75%. Moreover, in [
49], a group of samples is modeled as a Gaussian distribution. The probability of belonging to each distribution is calculated. The highest probability is compared with a threshold to decide whether the new sample is an anomaly or not.
3.2.5. Expert System
The expert knowledge system is based on rules determined by personnel responsible for detecting NTLs in the distribution system [
10,
34,
73]. It involves establishing instructions based on experience and data analysis. These instructions can be simple or complex and can achieve high performance. The major disadvantage of this method is that it requires experienced and highly skilled personnel [
4,
16,
66].
3.3. Performance Metrics
Performance metrics are used to evaluate NTL detection algorithms and, in some cases, compare them with each other to determine the best-performing one. Every algorithm outputs a list of customers classified as likely fraud or non-fraud, so the metrics use the following parameters to assess them [
4,
16,
66]:
True positive (TP): when the consumer is correctly classified as fraud [
4,
16,
40,
66];
False positive (FP): when the consumer is incorrectly classified as fraud, that is, they did not commit fraud but are classified as fraud [
4,
16,
40,
66];
True negative (TN): when the consumer is correctly classified as non-fraud [
4,
16,
40,
66];
False negative (FN): when the consumer is incorrectly classified as non-fraud, that is, they committed fraud but are classified as non-fraud [
4,
16,
40,
66].
The results are generally presented in the confusion matrix shown in
Table 2.
The following metrics are calculated from the confusion matrix:
Accuracy: It reveals the accuracy (Acc) of the technique in classifying the samples. However, it is sensitive to imbalanced databases (a greater number of samples of one label than another) [
4,
16].
Detection rate (DR): It indicates the percentage of positive samples correctly classified, that is, it shows the performance of the classifier with respect to the false negatives (FNs) [
4,
16].
Precision: It shows the percentage of performance with respect to the false positives (FPs) [
4,
16].
False-positive rate (FPR): It presents the percentage of samples incorrectly classified as negative out of the total number of true negatives (TNs) [
4,
16].
True-negative rate (TNR): It is the opposite of the DR, so it shows the percentage of samples correctly classified as negatives out of the total number of negatives [
4,
16].
False-negative rate (in English FNR): It shows the percentage of samples incorrectly classified as negative out of the total number of true positives (TPs) [
4,
16].
F1 score: This metric is used to compare various techniques and is a combination of two metrics, the detection rate (DR) and precision [
4,
16].
Other metrics described in the literature are the ROC and the AUC. The ROC is a graph that indicates the performance of a classifier, plotted with two indicators. On the x-axis is the FPR (false-positive rate), and on the y-axis is the DR (detection rate); points can be plotted with different thresholds to evaluate the classification. On the other hand, the AUC is the area under the ROC curve. This metric provides the performance of the classifier across all evaluated thresholds [
4,
16].
4. Data Analysis and Methodology
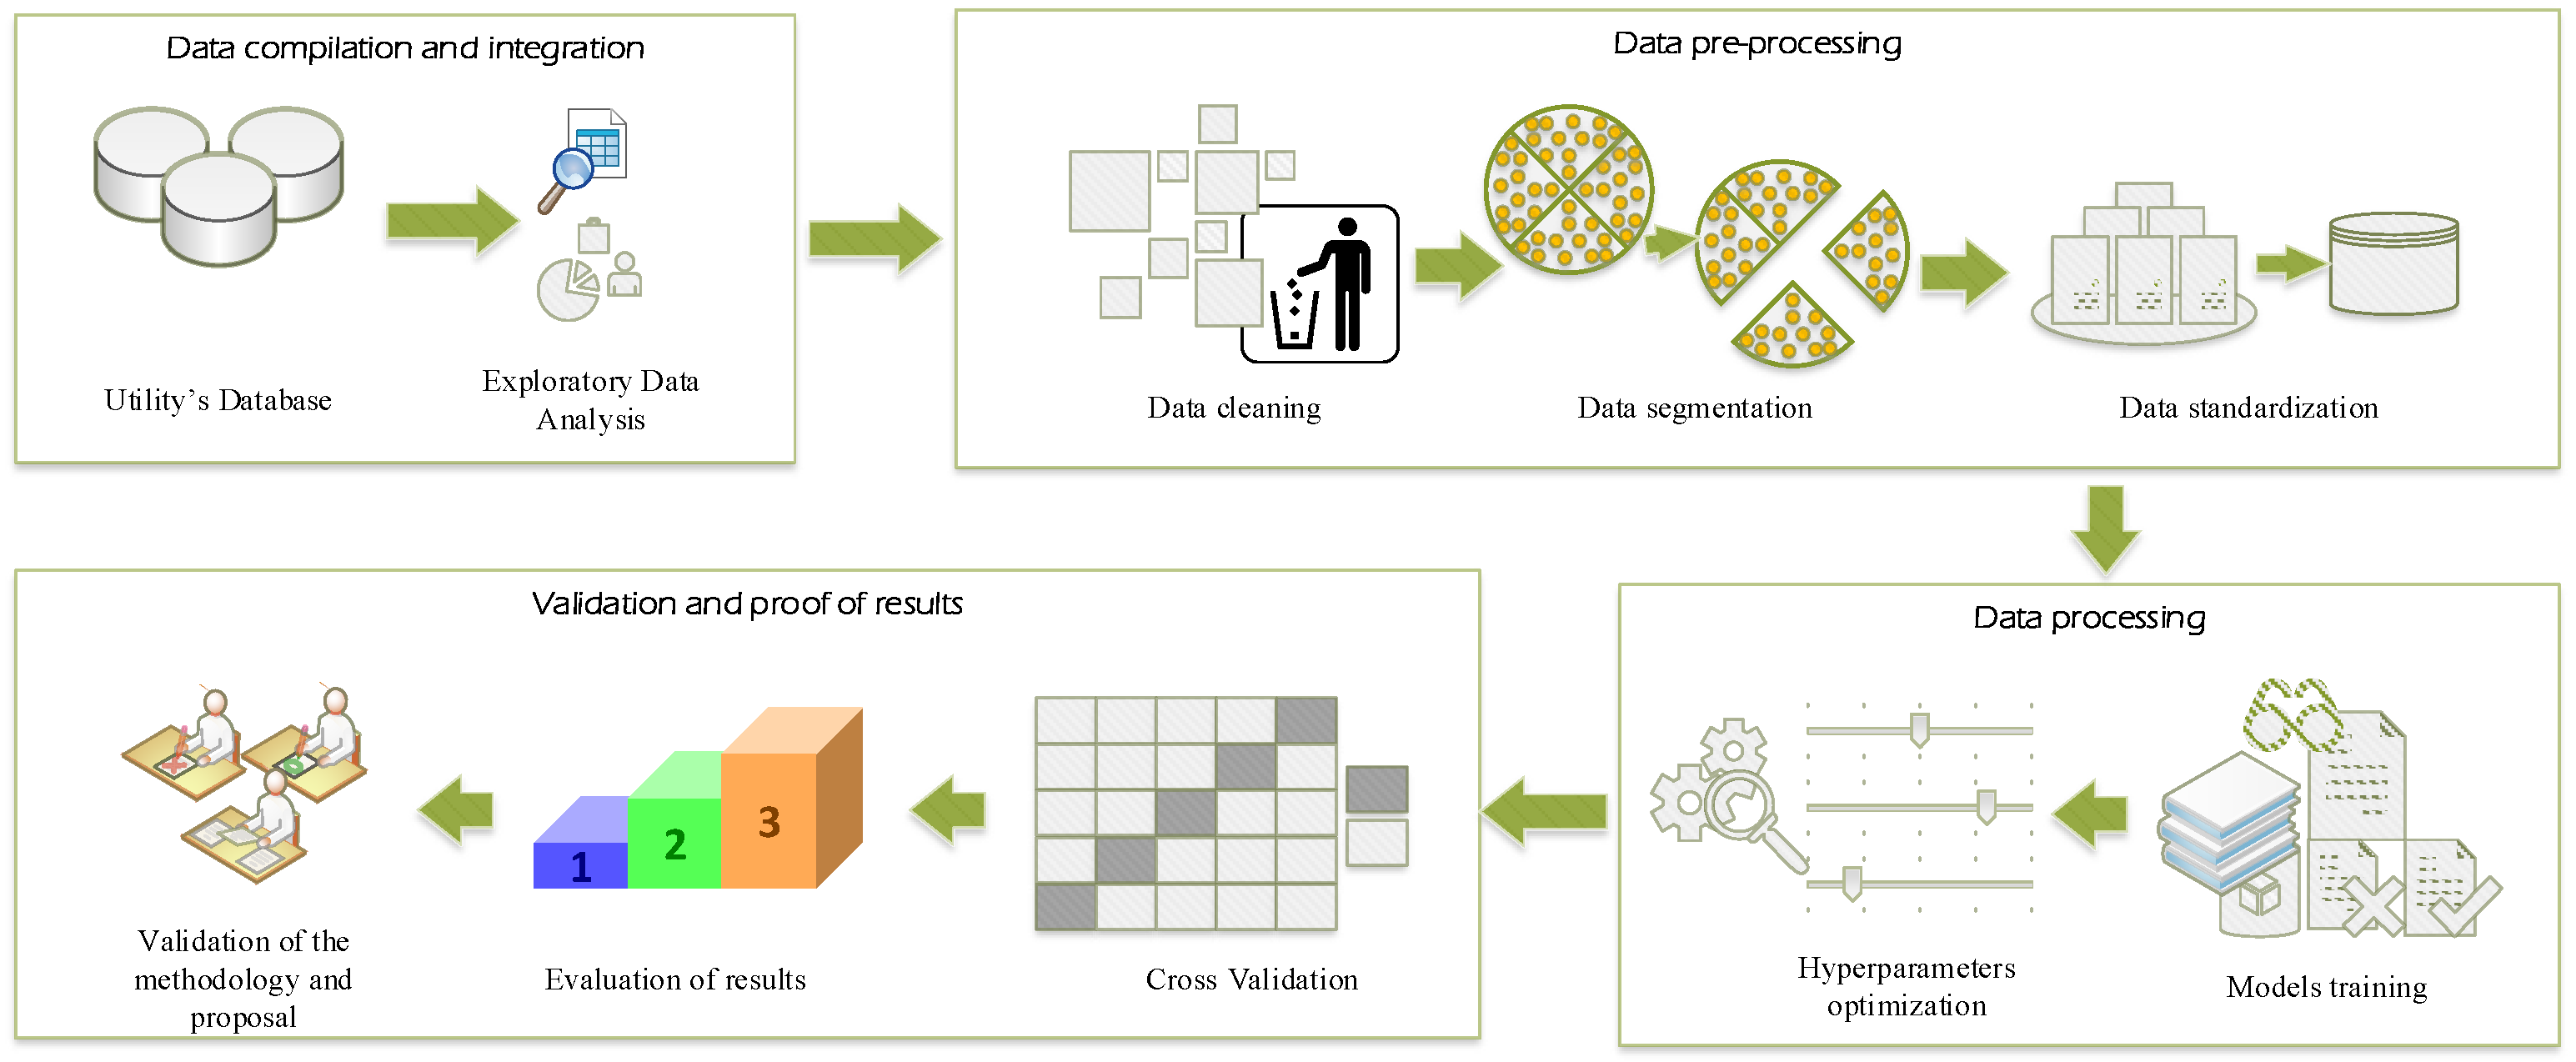
Based on the consumption and customer data provided by a distribution company in Ecuador, data preprocessing was carried out, and several classification techniques were applied in order to identify those users who are committing NTLs. In
Figure 6, an overview of the processes to be carried out is presented, and a detailed description is provided below.
Data Collection and Integration
For this work, a database with 266,298 records, containing technical and economic variables and different tariffs, including residential, commercial, and industrial ones, was used. The data matrix has 80 variables. In order to reduce and optimize the computing processes in subsequent steps, variables that are duplicated and have different names but contain the same information are removed. After this process, the matrix is reduced to 53 variables. In
Table 3, the variables are presented with a brief description of each one.
Among the 53 variables (see
Table 3) is the content of monthly consumption of customers of the distributor, for the period between June 2018 and May 2021. To categorize each consumer, other variables extracted from the consumption curve during the mentioned period are integrated [
17,
30,
64,
94]. The variables that are integrated are shown in
Table 4.
Exploratory Data Analysis
To obtain information about the numerical variables, descriptive statistics are applied. Non-numerical variables are disregarded, as these contribute with location references of the users such as CLINOMABR, PROV, CANTON, and AGENCY, among others. The results obtained can be visualized in
Table 5, in which the following is shown:
count: Number of non-null data in the variable.
mean: Average of the data in the variable.
std: Standard deviation of the variable.
min: Minimum value in the variable.
max: Maximum value in the variable.
Table 5.
Descriptive statistics.
Table 5.
Descriptive statistics.
| Variable | Count | Mean | Std | Min | Max |
|---|
| CLICOD | 30,026 | 3,065,145 | 2,816,055 | 100,103 | 8,997,481 |
| SEQUEN | 30,026 | 277,243.6 | 270,561 | 600 | 8,003,400 |
| YEAR | 29,319 | 2014.1157 | 6.567368 | 1972 | 2021 |
| DATE_INSTALLEDC | 29,235 | 19,395,480 | 3,859,021 | 0 | 20,210,600 |
| AMOUNT / DEBT | 28,620 | 62.021783 | 361.811714 | −0.03 | 37,943.1 |
| MONTHS_DEBT | 29,620 | 1.559558 | 3.904805 | 0 | 61 |
| DATE_RE-INV | 1644 | 20,186,270 | 23,234.05 | 20,100,220 | 20,210,530 |
| P_FACTOR | 30,026 | 0.99977 | 0.009135 | 0.220877 | 1 |
| TJUN_18 | 30,026 | 290.1325 | 7082.58 | 0 | 1,017,104 |
| TJUL_18 | 30,005 | 225.537268 | 2397.2796 | 0 | 290,801 |
| … | … | … | … | … | … |
| REG1_AUM | 30,026 | 13.56 | 11.47 | 0 | 35 |
| REG1_DIS | 30,026 | 14.72 | 12.00 | 0 | 35 |
| REG_AUM_PRO | 30,026 | 15.21 | 5.36 | 0 | 33 |
| REG_DIS_PRO | 30,026 | 17.39 | 6.13 | 0 | 35 |
| REG_AUM_MED | 30,026 | 21.19 | 12.21 | 0 | 36 |
| REG_DIS_MED | 30,026 | 11.69 | 11.34 | 0 | 35 |
An analysis of null values, which are presented in
Table 6, is also carried out.
Based on the results presented in
Table 5 (descriptive statistics) and
Table 6 (existing null values), the following is determined:
Not all variables have complete records, especially in the consumption variables, which should be taken into account when cleaning the data.
There are high values of standard deviation, due to the fact that the database contains profiles of residential, commercial, and industrial customers. Therefore, the variation in consumption is high. This can also be evidenced in the difference between the maximum and minimum values, that is, the range (MAX–MIN) will be large.
In variable A15, there are a large number of null values (blank or empty), so this variable could be removed from the database. In this case, it is decided to keep the variable for information, but it will not be considered for the training of classification techniques.
As observed in
Table 5, there are high values in the standard deviation, due to the existence of customer profiles with different tariffs, which is reflected in a high variation in consumption.
In the analyzed database, five types of tariffs are evident:
Residential: Customers who use electricity for residential purposes. It is the tariff with the most customers.
Commercial: Customers who use electricity for commercial purposes, such as shops and offices.
Industrial: Customers who use electricity to produce products.
Special: Use of electricity in government institutions, hospitals, schools, churches, water boards, agricultural industries, universities, etc.
Others: Users who do not fall into the previously described categories.
In
Figure 7, the number of samples per tariff is observed, showing that the largest number of samples belongs to the RD tariff in the residential category. The tariffs found are encoded. The encoding is in
Table 7.
Figure 8 displays a correlation matrix of the principal variables analyzed in this study. In this matrix, correlation values are represented by a color scale, where lighter shades indicate high positive correlation (close to 1), darker shades represent strong negative correlation (close to −1), and intermediate shades reflect weaker or non-existent relationships (values close to 0). Similarly, the presence of well-defined blocks indicates that some variables may be highly correlated within certain groups, which can have implications for redundancy analysis or model building. A high correlation does not imply causality, but rather a statistical association between variables. Some categorical variables, such as CAT_TARIFF or YEAR, have very low correlations with the numerical variables, indicating that they do not directly influence quantitative trends. Additionally, well-defined blocks are observed in the matrix, indicating that certain variables have a strong relationship with each other. For example, variables corresponding to different months of the same year show high correlation, suggesting a strong temporal or seasonal relationship in the data.
In the database, there are records with observations described by inspectors of the distribution company. The observations found are presented in
Table 8. Out of the total number of records (266,298), 15,013 have some observations and are labeled “FRAUD (1)” for the training, validation, and testing of classification techniques. To avoid problems due to class imbalance (a greater number of records of one class compared with another), 15,013 customer profiles without observations are randomly selected from the database and labeled “NO FRAUD (0)”.
It is verified that there are no profiles with zero records, that is, customers who had consumption zero or average consumption equal to or less than 10 kWh for more than 12 months. These customers are treated differently and will require an inspection; hence, they are excluded from the data for training.
The analysis allows one to obtain the base matrix composed of 68 attributes and 30,026 records. Of these, 15,013 are labeled FRAUD (1), and 15,013 are labeled NO FRAUD (0):
5. Data Preprocessing
To prevent a loss of effectiveness when employing classification techniques, any anomalous records in the data matrix must be eliminated. This procedure is carried out in such a way that the following apply:
After cleaning the base matrix, 27,374 records remain. It is important to ensure that half of these records are labeled 1 (FRAUD) and the other half 0 (NO FRAUD) to prevent issues related to class imbalance. This cleaned dataset is referred to as the Clean Matrix.
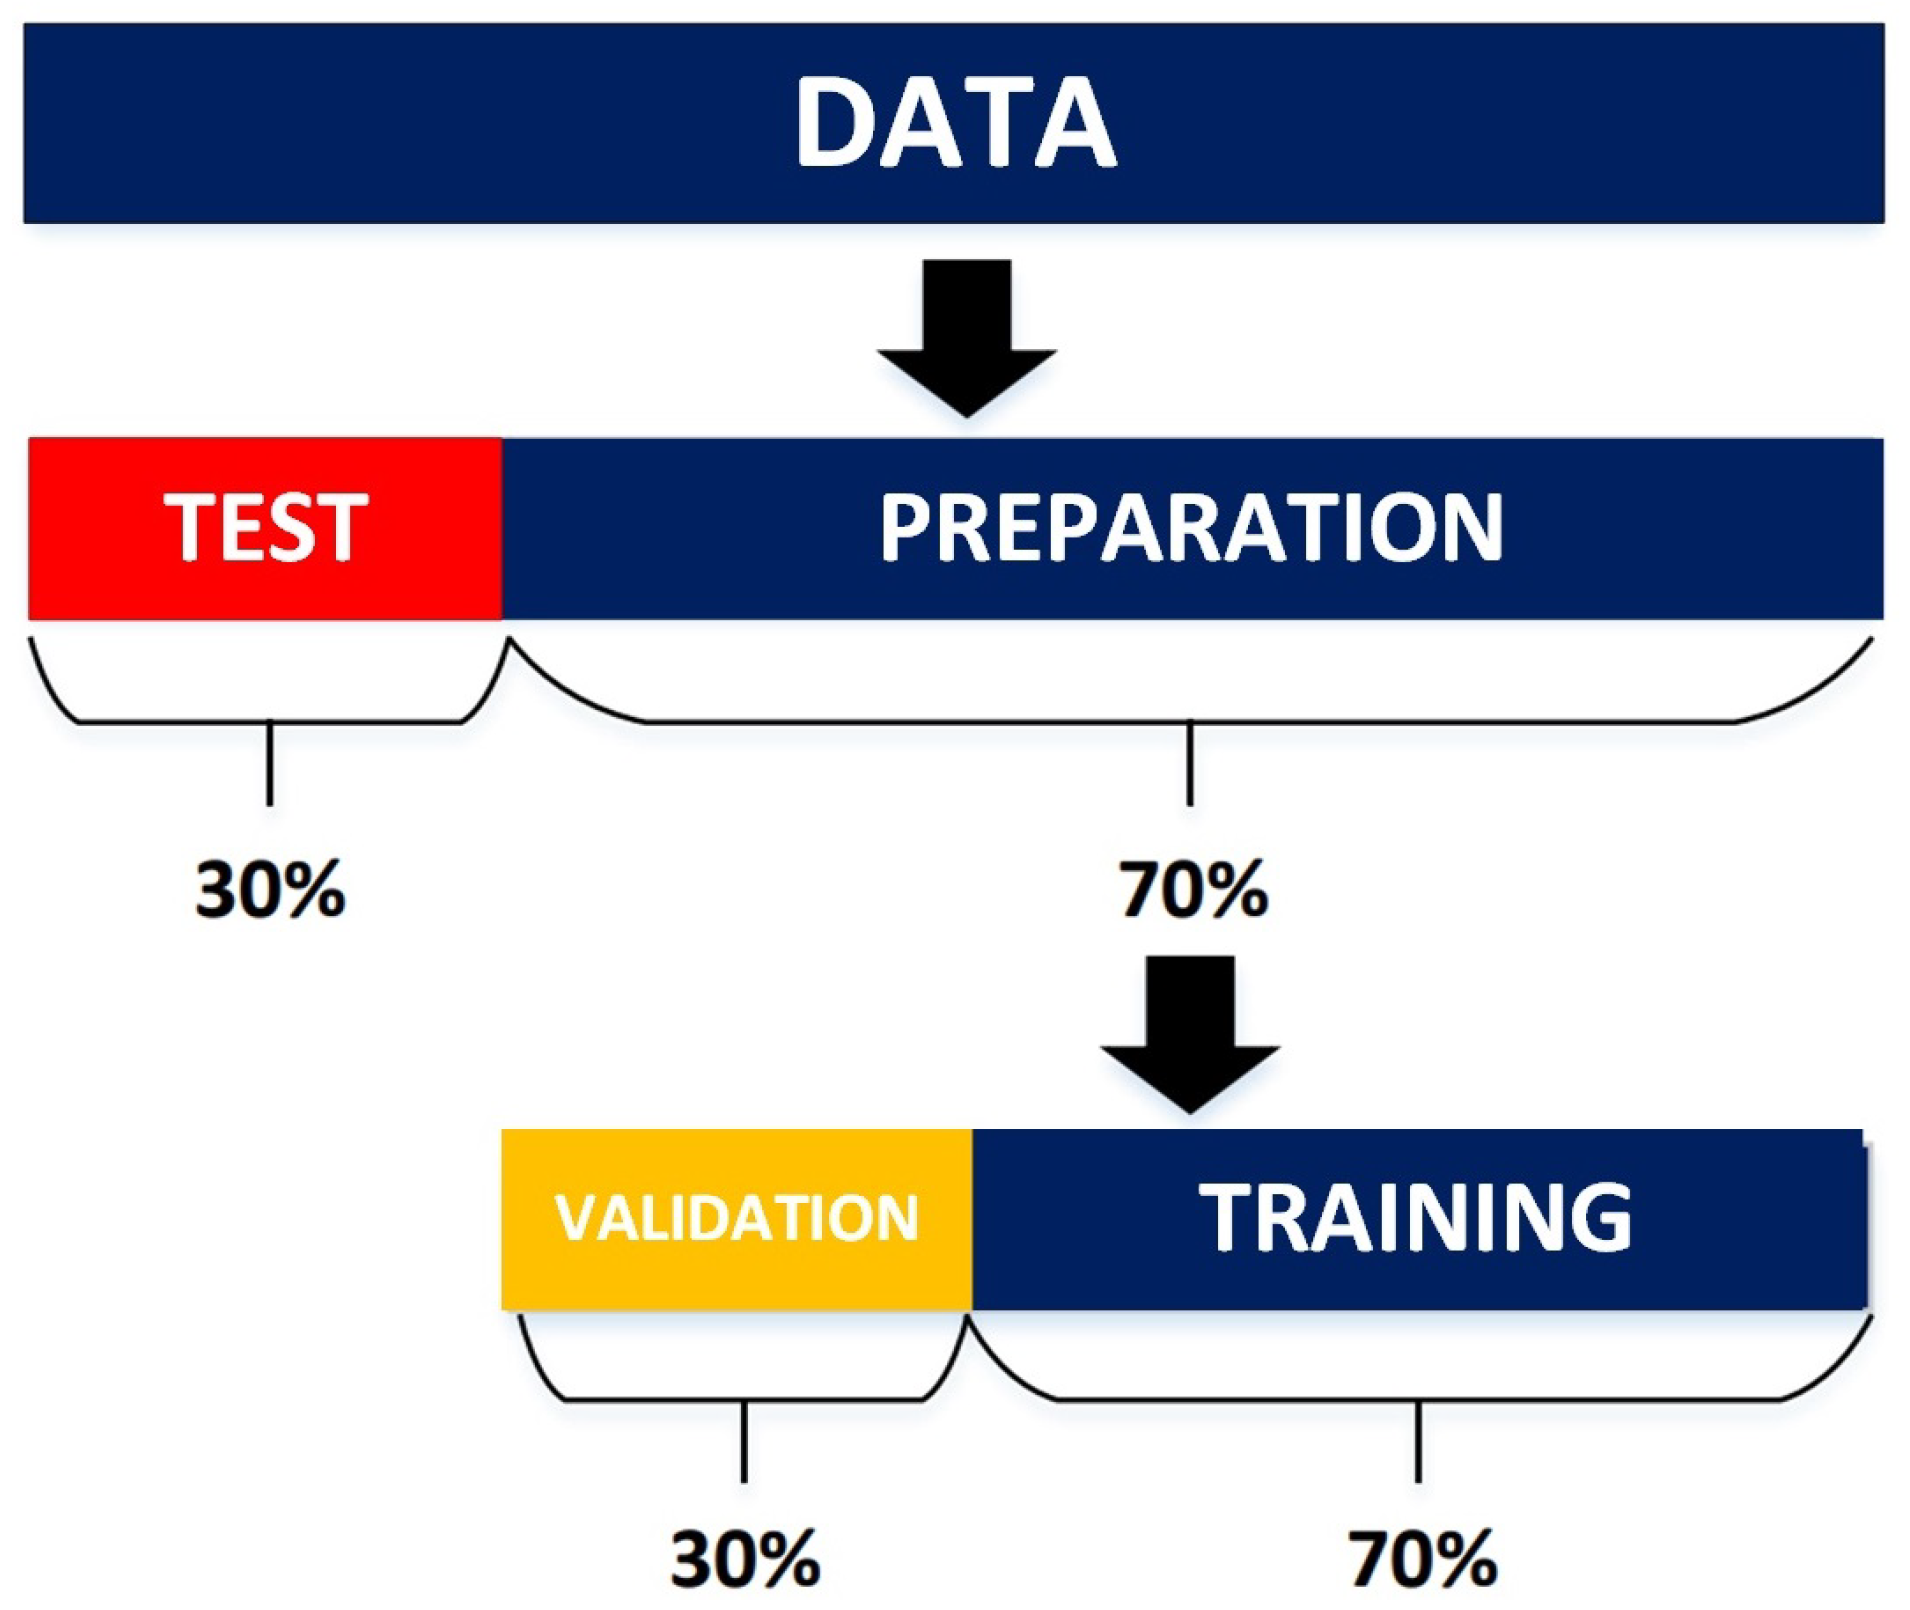
Furthermore, for the subsequent processes (training, validation, and testing), the Clean Matrix is divided as follows: 70% for the preparation of the classifiers and 30% for evaluating them. Additionally, the training matrix is further subdivided into 70 for training and 30% for the validation of the models, as shown in
Figure 9. Only the attributes containing technical data are considered, that is, attributes A8–A9, A12–A15, and A17–A68 (see
Table 3 and
Table 4). The other attributes will be used for information on and the location of the measurement systems to be inspected.
The division of the data is performed as follows:
Lastly, to avoid difficulties with magnitudes and dimensions, the data are normalized by using Equation (
15). This process eliminates the scale differences of the variables [
66,
95]. There are several ways to normalize data, the most common being the following:
Z-Score normalization: It is known for centralizing the data, attenuating large values that are within the database. The equation is as follows [
66]:
where
is the new value, average is the mean of the data, and std.dev is the standard deviation of the data.
Max–Min normalization: It changes the range of values of the data between 0 and 1. The equation is as follows [
66]:
where
is the new value,
is the maximum value of the data, and
is the minimum value of the data.
5.1. Data Processing
In the literature, no specific classification has been identified as the most suitable for identifying NTLs [
16,
59,
90]. For this reason, several supervised classifiers are trained and evaluated to determine which one achieves the best results. The classifier models to be trained and evaluated are the following:
K-nearest neighbor (K-NN);
Support Vector Machine (SVM);
Decision Tree (DT);
Random Forest (RF);
Artificial Neural Network (ANN);
CatBoost (CGB);
LightGBM (LGB);
XGBoost (XGB);
Logistic Regression (LR);
Naive Bayes (NB).
The Preparation Matrix (Equation (
11)) is used to train the classifiers mentioned. Each classifier requires hyperparameters for training. Hyperparameters are elements of the classification models that must be specified prior to training and are used to direct the training process [
96,
97,
98].
To enhance the performance of the classifiers, hyperparameter tuning is conducted. There are several methods for hyperparameter tuning, including (i) grid search; (ii) random search; (iii) derivative-free optimization: Nelder–Mead; and (iv) Bayesian optimization [
96,
97,
99]. In this study, grid search is used for the optimization of the hyperparameters of the different classifiers. Grid search involves an ordered combination of hyperparameters for each classifier and the manual adjustment of each one of them [
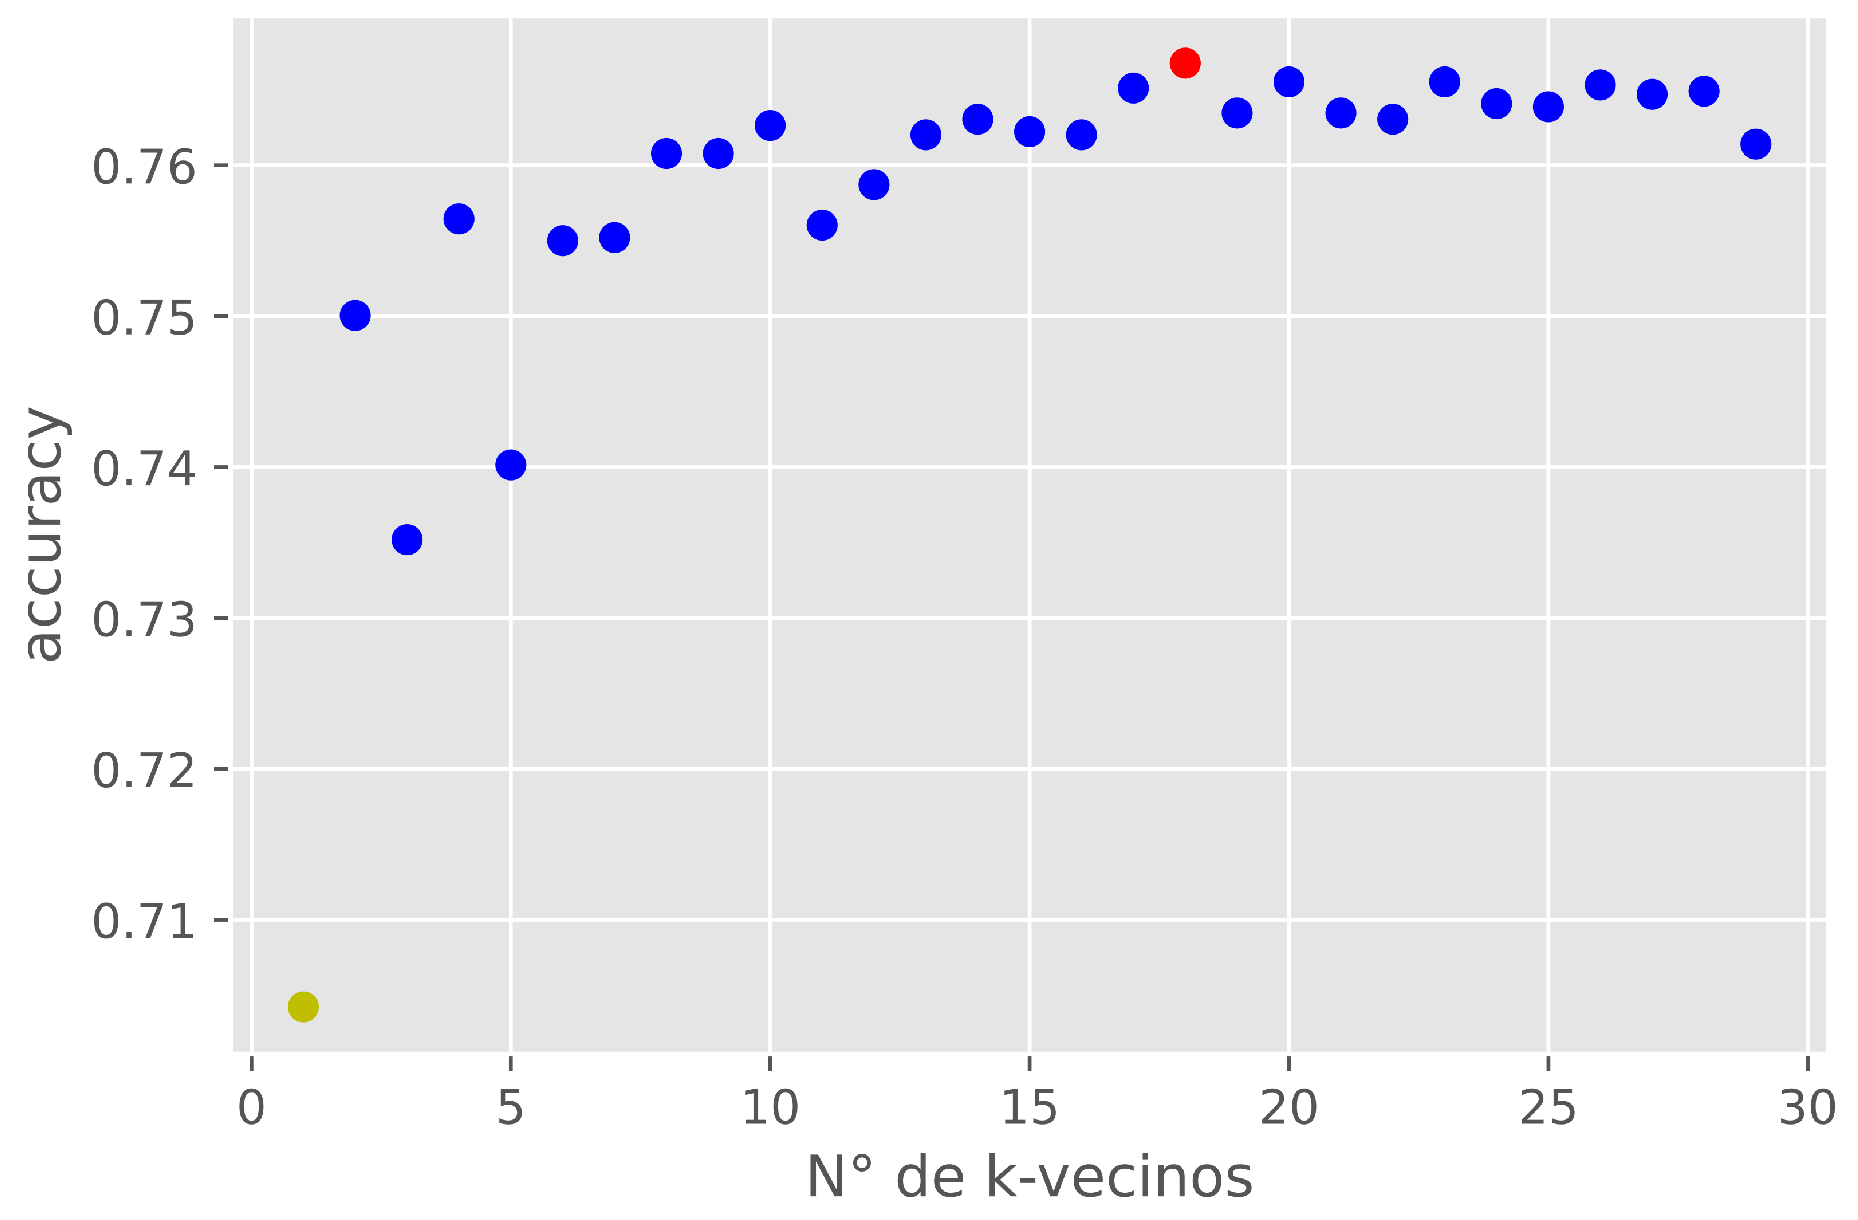
97]. For example, consider a hyperparameter of the K-NN classifier (argument “K”). The model is evaluated with different values of “K” using the accuracy metric (Equation (
2)). In
Figure 10, the results are shown; it can be seen that with K = 18 (red color), the highest effect was achieved with an accuracy of 0.766, and the lowest value was with K = 1 (yellow color) with an accuracy of 0.69.
The main hyperparameters obtained from the grid search optimization of the different classifiers are presented in
Table 9.
5.2. Results
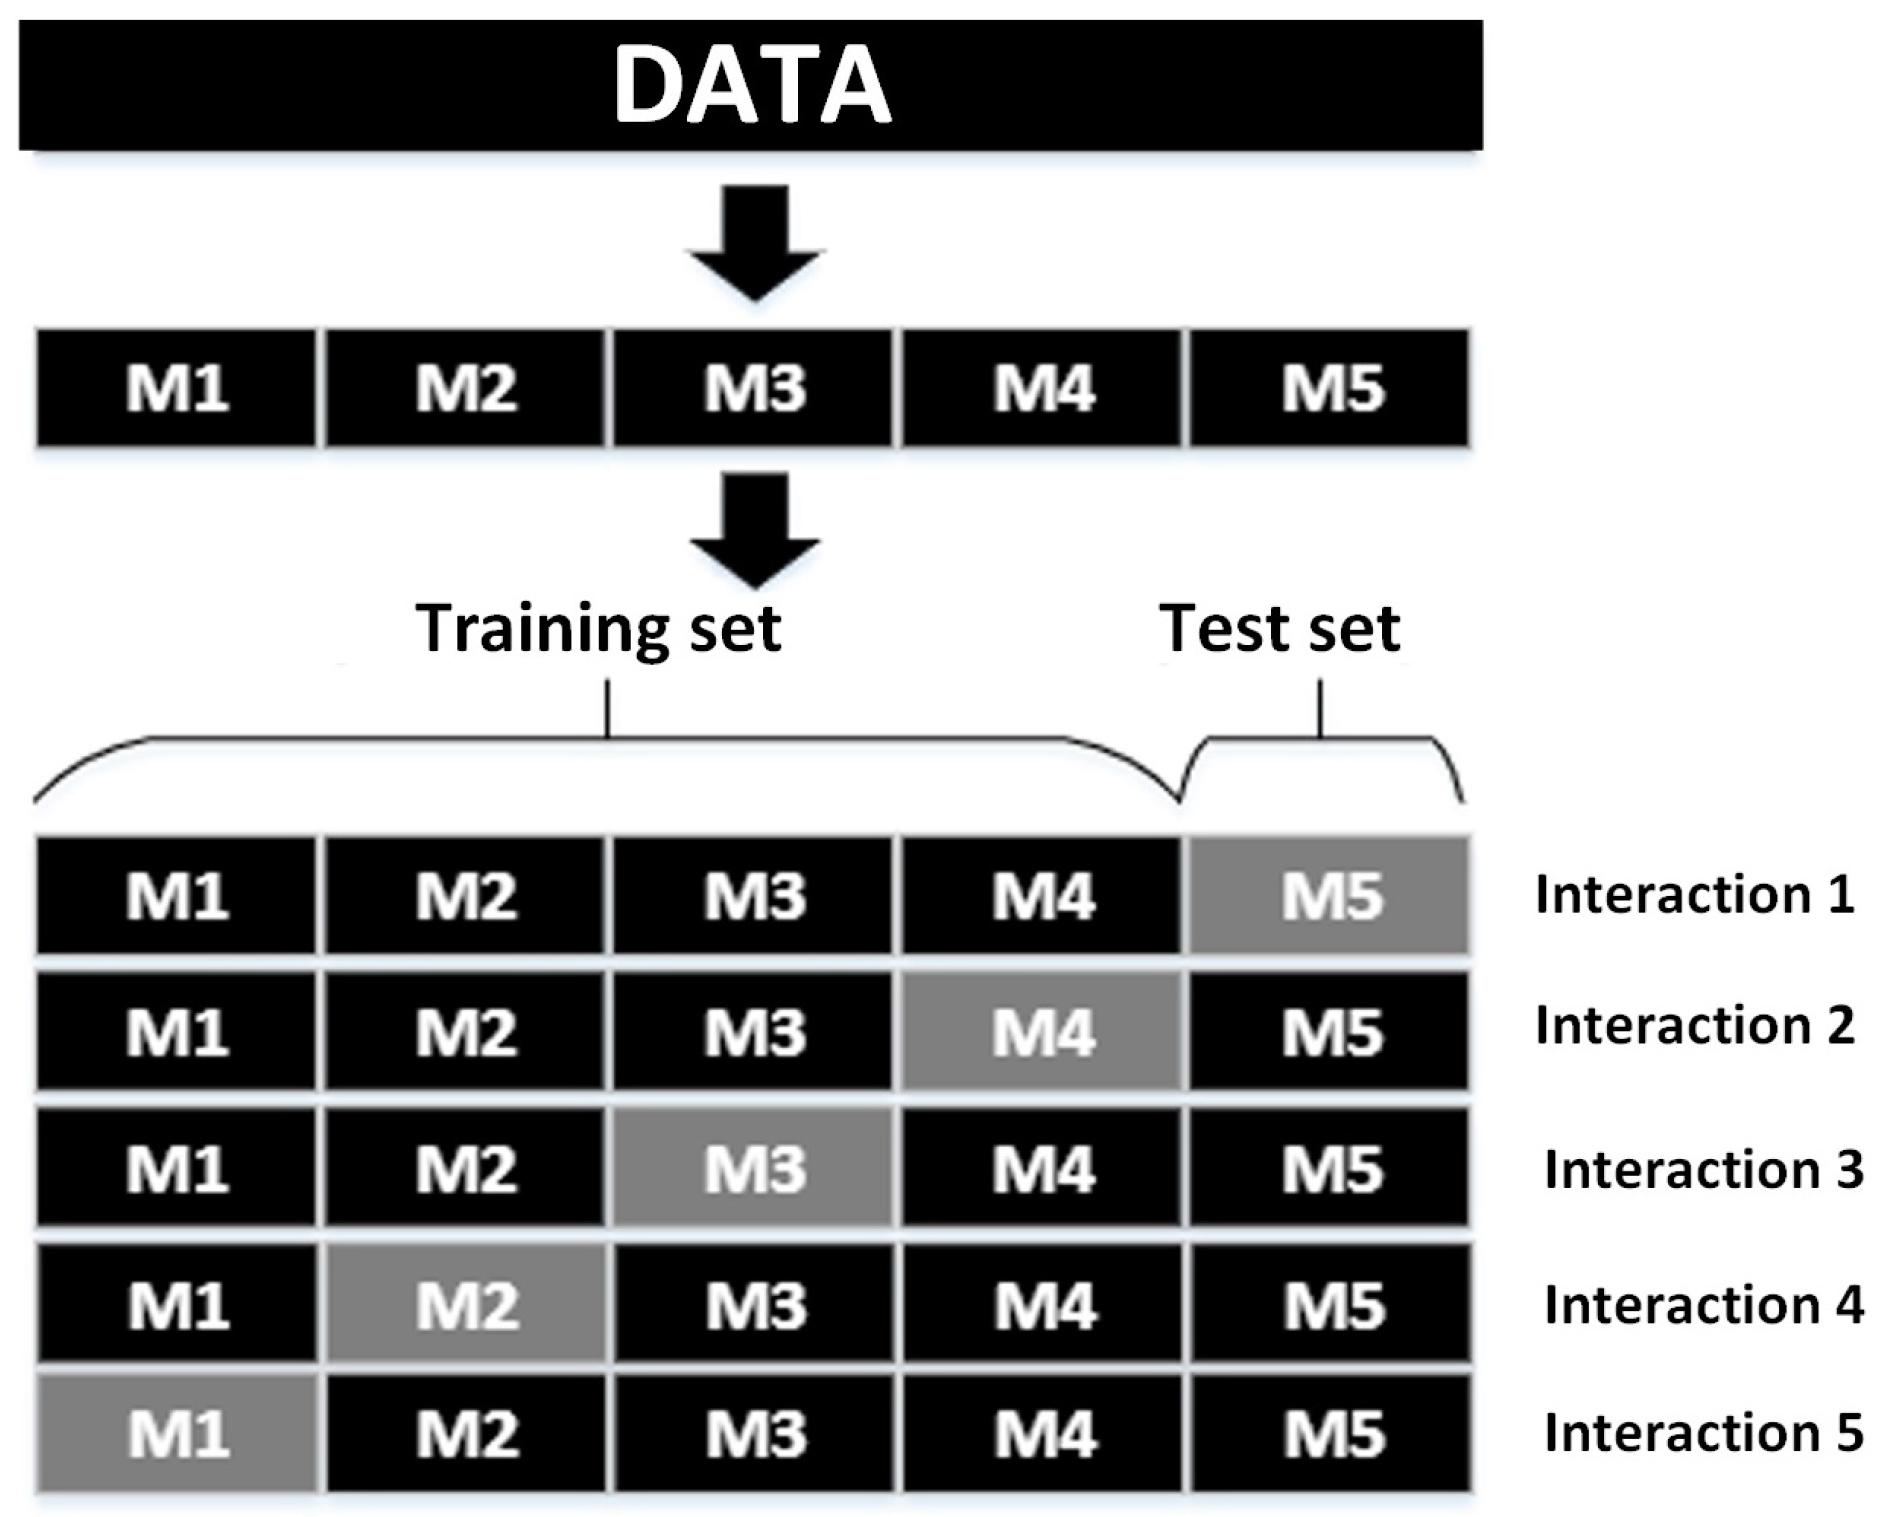
The performance of the classifiers is calculated by using the cross-validation technique, which involves dividing the dataset into i samples. In each iteration, one sample is used as the test set and the remaining samples as the training set. For each iteration, the test set is changed, and this process is repeated until all samples have been a test set (see
Figure 11). This is performed to have a more accurate evaluation of the classifier models so that the performance does not depend on the test set. For this purpose, the Preparation Matrix (Equation (
11)) is divided into five samples (i = 5) for cross-validation, as illustrated in
Figure 11.
The metrics used for cross-validation are accuracy (Equation (
2)) and F1 score (Equation (
8)), which indicate how well the different models classify.
In
Table 10 and
Table 11, the results of the cross-validation are presented. The classifier with the best Acc and F1 results is CGB. However, the algorithms LGB, XGB, DT, RF, and ANN have values close to it, being the best classifiers, demonstrating that these models are suitable for identifying NTLs. SVM had an average performance, while K-NN, RL, and NB obtained low productivity.
Furthermore, in
Table 12, the runtime of the cross-validation process is presented. The fastest classifiers were K-NN and DT, while SVM took approximately 1 h and 24 min. Comparing with its performance (
Table 10 and
Table 11), this model is not suitable for identifying NTLs. The CGB method took around 25 min and 36 s, being the second slowest classifier in the cross-validation process. These results were obtained by using a computer with hardware specifications of an Intel CORE i7 processor with eight cores, 16 GB of RAM, and a 64-bit Windows operating system. However, the results may vary depending on the database analyzed or the hardware characteristics.
5.3. Evaluation of Classifiers
The different models are evaluated, for which a new data matrix called Test Matrix (see Equation (
14)) is classified. This evaluation allows one to verify whether the classification is optimal when using the different models. The Test Matrix contains 7994 records, where 3997 have the label 0 = NO FRAUD and the rest the label 1 = FRAUD. Once the information is validated and anomalies were removed, the data are normalized by using Equation (
15); then, classification is performed by using the trained models.
The results of the classification are represented through the confusion matrix shown in
Table 13. It also displays the evaluation results with Accuracy (Acc) and F1 Score. It is noted that the best classifier is CGB, with similar results for LGB, XGB, ANN, DT, and RF.
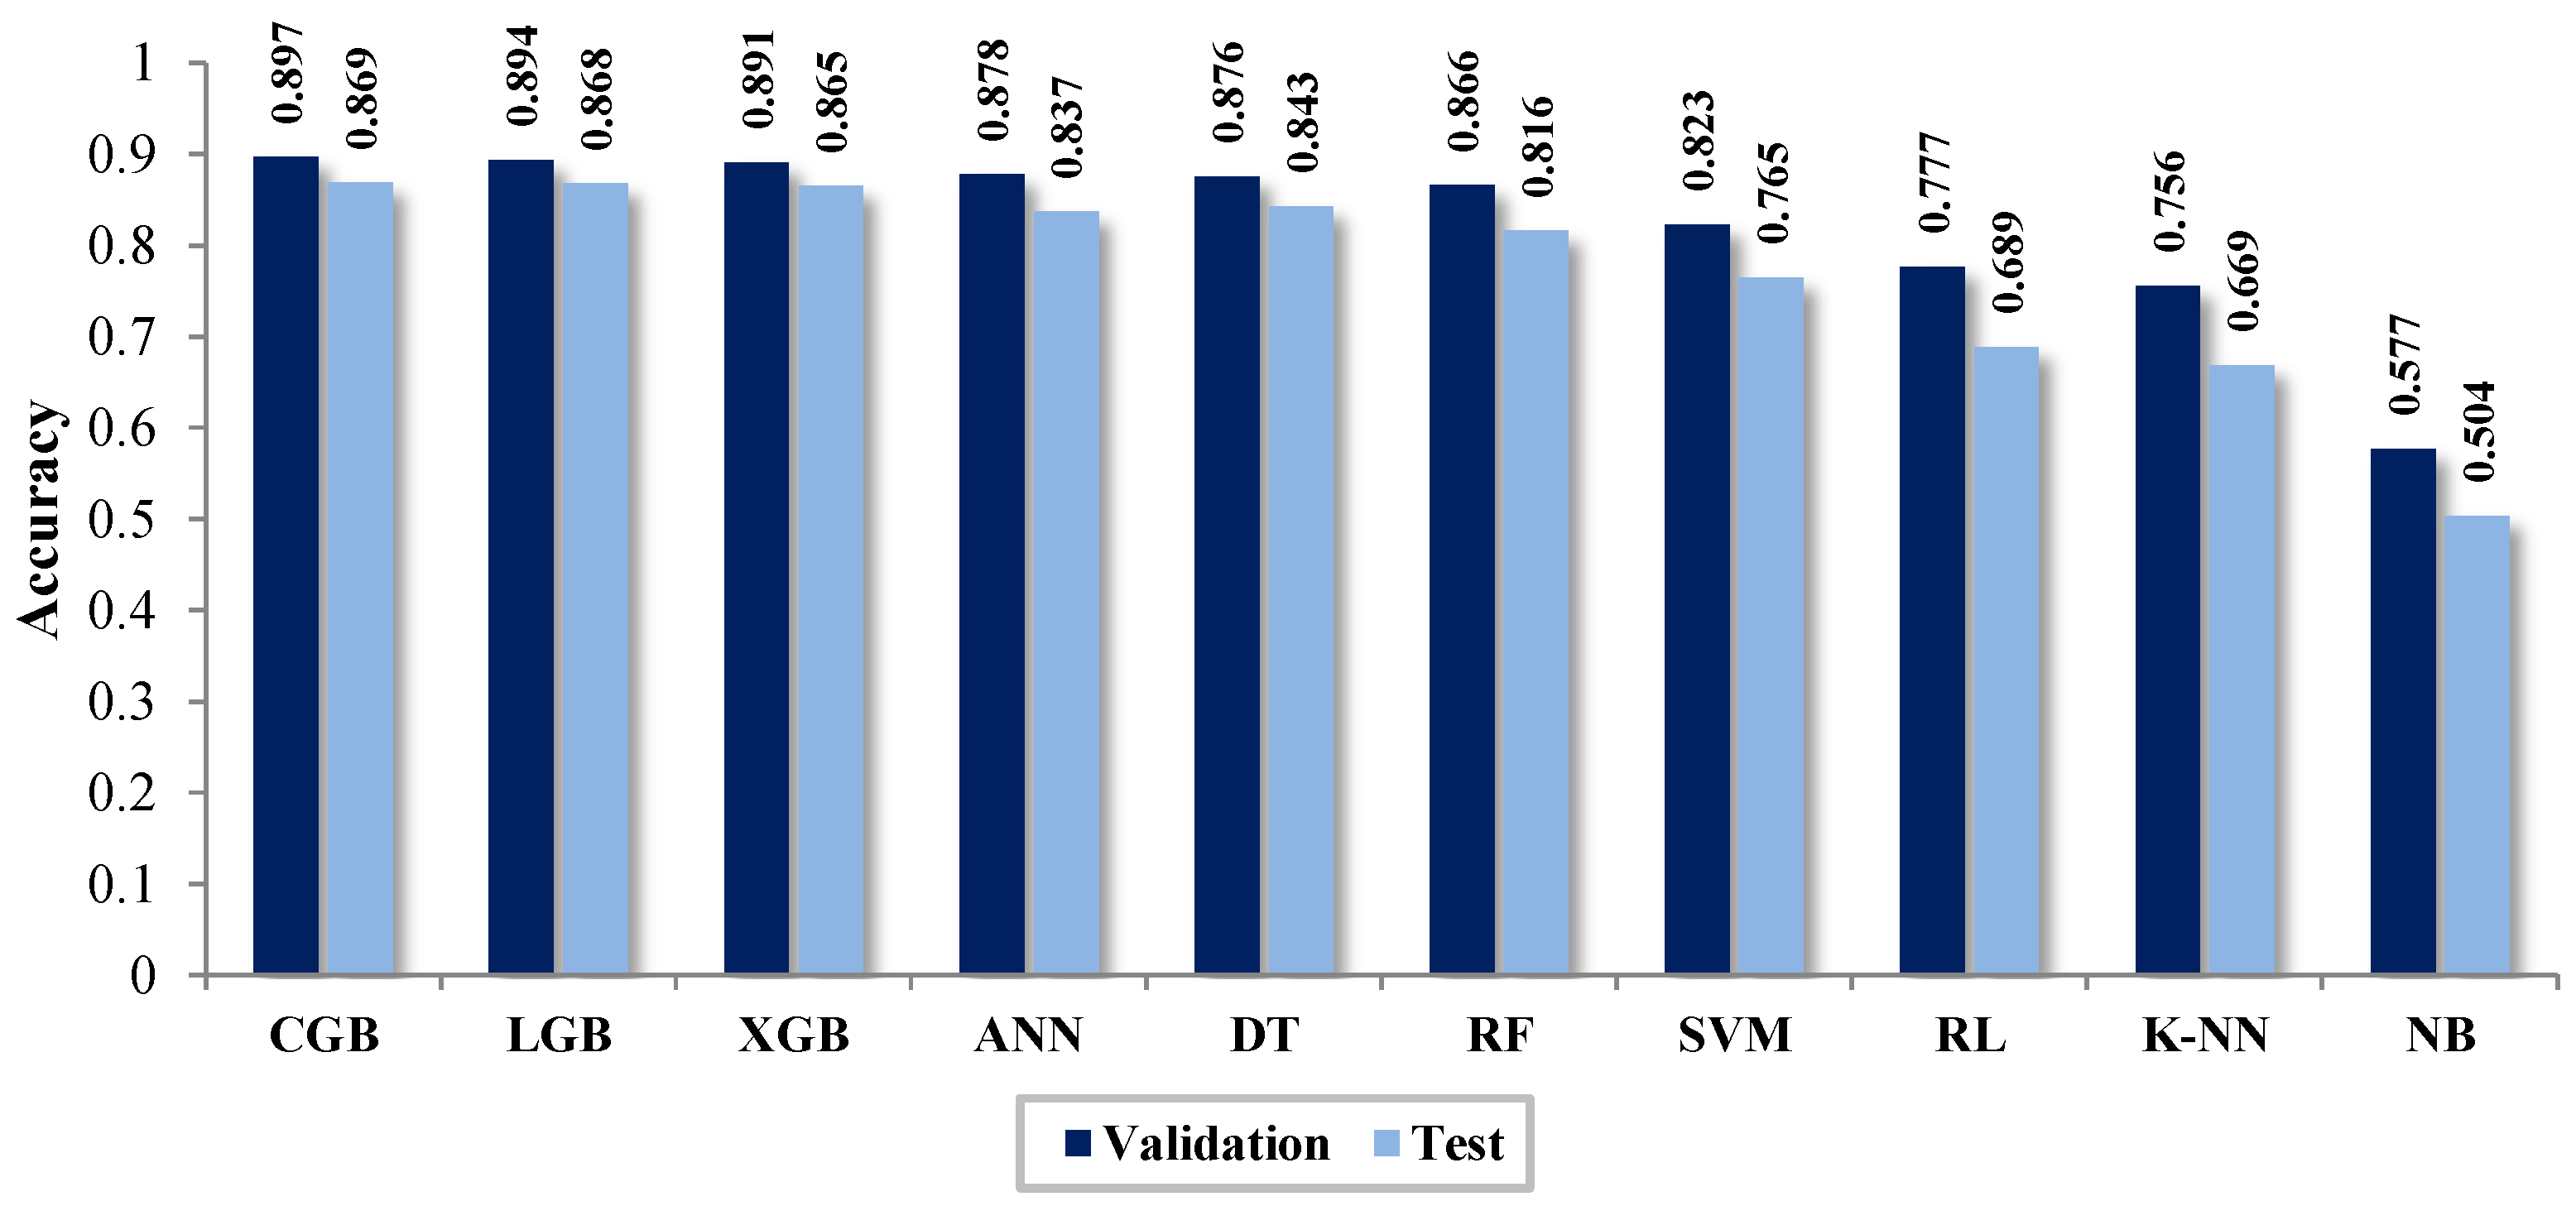
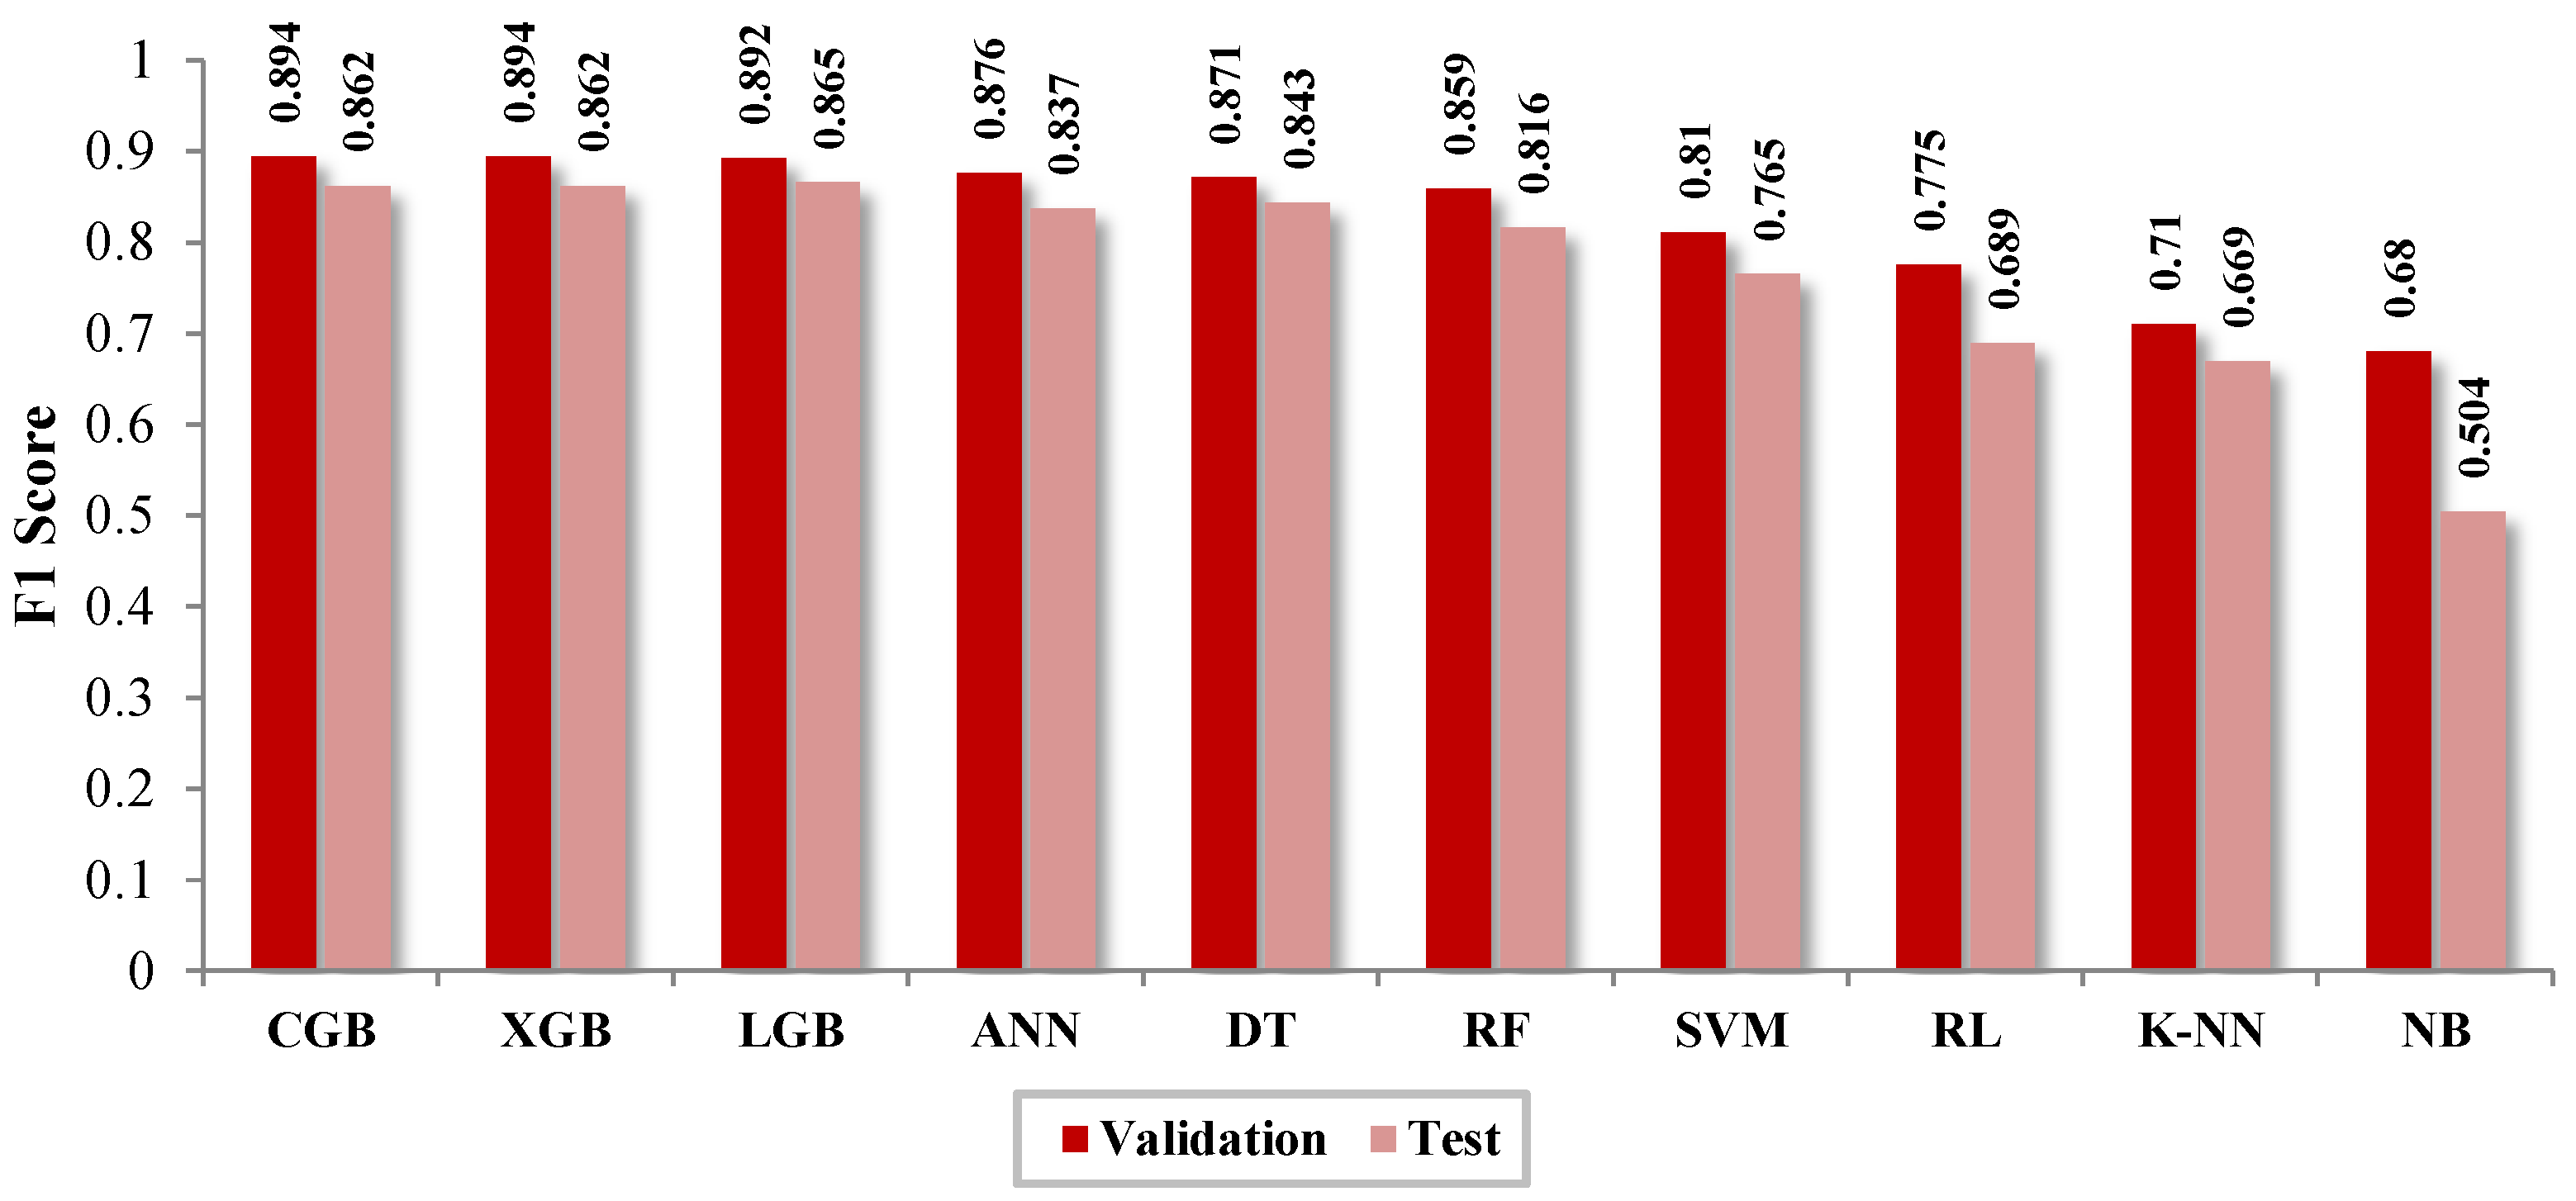
In
Figure 12 and
Figure 13, the results of the evaluation and cross-validation are displayed by using the metrics accuracy (Acc) and F1 score, respectively. It is noted that the classifier with the best performance is CGB, while the classifier with the lowest productivity is NB. Similarly, the table shows that the results obtained in the evaluation are lower than those obtained from the cross-validation.
The Test Matrix, consisting of approximately 7994 samples (30% of the Clean Matrix), is larger than the number of samples developed during the cross-validation stage. This is why lower values are obtained in the calculated metrics. This indicates that the training models classify with results similar to any data matrix.
Proposed Methodology for Distribution System Operator
The proposed methodology for generating lists of measurement systems that determine probable causes of NTLs consists of five stages, which are described below.
Stage 1: Planning: The ODS staff meet to establish review criteria for short-, medium-, and long-term periods:
Short term: Generate review lists where consumption is critical, such as high consumption, because damage to the meter or tampering can cause significant losses for the distribution company.
Medium term: Conduct reviews based on geographical stratification, meaning the lists for inspection should first include those with high consumption, followed by those with lower consumption.
Long term: Review all customers who have had zero kWh/month consumption for more than twelve consecutive months or whose average annual consumption is less than or equal to 15 kWh.
Stage 2: Data preparation: The data are processed for subsequent classification:
Clean erroneous and inconsistent data.
Remove measurement systems that have already been inspected on site within the past 12 months.
Calculate the variables related to consumption as indicated.
Normalize the data by using Equation (
15).
Stage 3: Data classification: Employ classification methods. Based on the evaluations conducted, it is recommended to use the LGB technique, as it provides the best classification in the shortest possible time. In this stage, an initial list of customers who have committed fraud will be obtained.
Stage 4: Review of results: The data classified as probable fraud in the previous stage must be reviewed again by a responsible expert before generating work orders, serving as the final filter before inspections.
Stage 5: Dispatch of work orders: Finally, work orders are generated for those measurement systems classified as probable fraud. These should be inspected on site with the aim of controlling and mitigating NTLs, thereby recovering economic losses for the distribution company.
6. Discussion
The data used were provided by an electricity distribution company in Ecuador; hence, the proposed solution enables the detection of metering systems with a high likelihood of committing fraud. We conducted a data analysis process, during which several classification models were trained and evaluated. In the preliminary analysis, irrelevant variables were removed, validating those associated with the consumption curve.
Once the variables were defined, an exploratory data analysis was conducted by using descriptive statistics and a correlation matrix. In this step, qualitative variables were encoded, and the data were normalized by using the Z-Score technique presented in Equation (
15). The data were preprocessed by removing inconsistent data, forming what is called the Clean Matrix. This matrix was divided into a Test Matrix (30% of the Clean Matrix) and a Preparation Matrix (70%) for the training and validation of classification techniques.
From the literature review, it is concluded that there is no consensus on identifying the most suitable classifier for detecting NTLs. For this reason, in this research study, several supervised learning classifier models were trained to identify which one best fits the provided data. The integrated classification models were (1) K-NN, (2) SVM, (3) RF, (4) ANN, (5) DT, (6) CGB, (7) LGB, (8) XGB, (9) RL, and (10) NB.
To ensure the optimal performance of the classifiers, the technique known as
grid search was applied to find the appropriate hyperparameters for each classifier (Nabil, et al. [
99]). Moreover, for the optimization of the hyperparameters, the random search technique was applied due to its efficiency in time compared with other techniques. The cross-validation technique was employed for validation, as it allows for the assessment of performance by using multiple datasets for training and validation. In this way, the Preparation Matrix was divided into five samples (i = 5), and each classifier was evaluated by using the performance metrics Acc (Equation (
2)) and F1 (Equation (
8)).
The results of the cross-validation indicate that the best classifier is CGB, with Acc = 0.897 and F1 = 0.894. In descending order with close results are XGB (Acc = 0.891, F1 = 0.894), LGB (0.894, 0.892), ANN (0.878, 0.876), DT (0.876, 0.871), and RF (0.866, 0.859). With average scores, there is SVM (0.823, 0.81), and with low performance, there are RL (0.777, 0.775), K-NN (0.756, 0.71), and NB (0.577, 0.68). In the same vein, CGB (1536.2 s), compared with the techniques XGB (405.6 s) and LGB (303.3 s), turned out to be slower. Based on these results, LGB is considered the ideal identifier of NTLs for the data provided by the distribution company.
In this study, the LightGBM (LGB) and XGBoost (XGB) models were the most efficient in detecting non-technical losses (NTLs), with accuracies of 0.869 and 0.865, respectively. Several studies have obtained similar results with comparable methodologies, although there are differences in the variables used and the optimization of the models. This research study establishes that boosting models, particularly LGB and XGB, are the most suitable for detecting NTLs, provided that high-quality data and advanced optimization techniques are used. A comparison of the results between this study and previous studies is presented in
Table 14.
The ensemble methods LGB, CGB, and XGB have demonstrated superior results compared with other traditional methods [
33,
37,
43,
44]. However, the success of the selected method will depend on the available information, including the quantity and type of records, as well as computational capabilities.
7. Conclusions
Detecting fraudulent behaviors in electricity consumption poses a significant challenge for distribution companies due to the complexity of distinguishing between regular and fraudulent consumers. This study proposes an innovative approach to the detection of non-technical losses (NTLs) by using advanced boosting models (LGB, XGB, and CGB), demonstrating superiority in accuracy and computational efficiency compared with traditional models. Hyperparameter optimization through grid search improved the accuracy and stability of the model, advancing the selection and tuning of models for NTLs. Applied in a real-world context in Ecuador with data from an electricity distribution company, this study evaluates the practical applicability of these models. Unlike other works, it relies exclusively on electrical data, avoiding the use of personal information and complying with privacy regulations. Additionally, a replicable methodological framework is proposed, including data collection, cleaning, and normalization; model selection; and validation through cross-validation. This approach could significantly reduce economic losses in Ecuador by improving fraud detection efficiency and optimizing resources for inspections. This work lays the foundation for the future implementation of early and accurate detection of irregularities in electricity consumption.
A dataset comprising 266,298 records, of which 15,013 contained observations made by inspectors, was analyzed. One of the primary challenges in detecting non-technical losses (NTLs) is handling class imbalance in training data and selecting appropriate evaluation metrics. To mitigate this issue, a balanced subset of 27,374 records was created, ensuring an equal distribution of fraud (1) and non-fraud (0) cases, randomly selected from the total dataset.
Feature selection plays a crucial role in identifying NTLs. While alternative techniques could be applied to refine the most relevant features, prior research indicates that using all variables versus only the most relevant ones yields similar classification results, but the latter approach significantly reduces computational costs. Hyperparameter tuning was performed by using the grid search technique, which, although computationally expensive, ensured high classifier performance. Cross-validation was employed for model evaluation, revealing that ensemble methods—CGB, LGB, and XGB—are the most effective for NTLs detection, offering high accuracy, reliability, and reasonable computational costs. The best detection performance was achieved with the CGB model, which obtained an average accuracy (Acc) of 0.897 and an F1 score of 0.894.
Execution time was also monitored during cross-validation. The CGB model required approximately 25 min and 36 s, which, although effective, was significantly longer than LGB, the second-best performer (Acc = 0.894, F1 = 0.892), with an execution time of only 5 min and 3 s. In contrast, the SVM model, while achieving moderate performance (Acc = 0.823, F1 = 0.810), had the longest execution time, taking approximately 1 h and 23 min, making it inefficient compared with faster and more accurate models. The DT model was the fastest, requiring only 14.04 s while maintaining solid performance (Acc = 0.876, F1 = 0.871). Consequently, SVM was deemed unsuitable for NTL detection within the given dataset. Additionally, models such as K-NN, RL, and NB demonstrated low performance and were only included for comparative purposes.
To validate the cross-validation results, a Test Matrix was classified, and performance metrics were computed. The models exhibited only a slight decrease in performance, with CGB maintaining the highest accuracy (Acc = 0.869, F1 = 0.876). However, as previously noted, its computational cost remains higher than LGB (Acc = 0.869, F1 = 0.875), which offers a more efficient alternative.
Although the positive results are notable, this study presents limitations that must be considered. On one hand, the dependence on the quality and availability of data can affect the accuracy and effectiveness of the models. The data used come from a single Ecuadorian distribution company and may have biases or limitations in their representativeness. Including historical information from multiple companies could improve the robustness and generalization capability of the model. On the other hand, the exclusive use of technical data and the absence of socio-economic variables limit the model’s predictive capacity. Combining technical data with socio-economic factors could improve performance and reduce false positives in fraud detection. It is also worth noting that hyperparameter optimization through grid search can be computationally expensive and does not guarantee the best global solution. Alternatives such as Bayesian optimization or random search could be more efficient. Finally, the applicability and scalability of the model in other regions or countries with different consumption patterns and regulations may require adjustments. Replicating the study in other contexts would allow for a better evaluation of the model’s adaptability.
From the methodology, more effective regulations and policies aimed at reducing electricity theft and fraud could be created. High-risk areas and consumers prone to committing offenses could also be identified. In the same vein, resource allocation could be optimized, as inspections and specific interventions could be more efficiently targeted, maximizing the impact of anti-theft measures. However, this or any fraud detection technique should also be accompanied by awareness and education directed at specific demographics and regions, in order to reduce the incidence of theft. This research study promotes the development of regulatory frameworks that encourage the use of advanced detection and data analysis technologies in the electricity sector. Regulators could employ these techniques to effectively monitor compliance with anti-theft regulations and ensure that distribution companies are taking the appropriate measures to reduce NTLs.


 ,
, 

