Article

Optimization of Sensor Targeting Configuration for Intelligent Tire Force Estimation Based on Global Sensitivity Analysis and RBF Neural Networks

School of Automotive and Traffic Engineering, Jiangsu University, Zhenjiang 212013, China
*
Authors to whom correspondence should be addressed.
Appl. Sci. 2025, 15(7), 3913; https://doi.org/10.3390/app15073913
Submission received: 11 December 2024 / Revised: 24 March 2025 / Accepted: 1 April 2025 / Published: 2 April 2025

Abstract

:
Tire force is a critical state parameter for vehicle dynamics control systems during vehicle operation. Compared with tire force estimation methods relying on vehicle dynamics or tire models, intelligent tire technology can provide real-time feedback regarding tire–road interactions to the vehicle control system. To address the demand for accurate tire force prediction in active safety control systems under various operating conditions, this paper proposes an intelligent tire force estimation method, integrating sensor-measured dynamic response parameters and machine learning techniques. A 205/55 R16 radial tire was selected as the research object, and a finite element model was established using the parameterized modeling approach with the ABAQUS finite element simulation software. The validity of the finite element model was verified through indoor static contact and stiffness tests. To investigate the sensitive response areas and variables associated with tire force, the ground deformation area of the inner liner was refined along the transverse and circumferential directions. Variance-based global sensitivity analysis combined with dimensional reduction methods was used to evaluate the sensitivity of acceleration, strain, and displacement responses to variations in longitudinal and lateral forces. Based on the results of the global sensitivity analysis, the influence of longitudinal and lateral forces on sensitive response variables in their respective sensitive response areas was examined, and characteristic values of the corresponding response signal curves were analyzed and extracted. Three intelligent tire force estimation models with different sensor-targeting configurations were established using radial basis function (RBF) neural networks. The mean relative error (MRE) of intelligent tire force estimation for these models remained within 10%, with Model 3 demonstrating an MRE of less than 2% and estimation errors of 1.42% and 1.10% for longitudinal and lateral forces, respectively, indicating strong generalization performance. The results show that tire forces exhibit high sensitivity to acceleration and displacement responses in the crown and sidewall areas, providing methodological guidance for the targeted sensor configuration in intelligent tires. The intelligent tire force estimation method based on the RBF neural network effectively achieves accurate estimation, laying a theoretical foundation for the advancement of vehicle intelligence and technological innovation.

1. Introduction

As the sole component connecting the vehicle to the road, the tire transmits essential forces and moments required for vehicle operation. Tire performance is a critical factor influencing overall vehicle dynamics, safety, and handling stability. The intelligentization of automotive components is fundamental for achieving overall vehicle intelligence. In the current research on automotive intelligent technologies, the tire has traditionally been regarded as a “passive” rubber component, exhibiting significantly lower intelligence levels compared to other vehicle components. The development of intelligent tires facilitates their transition from “passive” rubber components to “active” sensing elements, providing real-time integration and feedback capabilities to vehicle dynamics control systems. To overcome the limitation that traditional “passive” tires cannot directly characterize or obtain the forces and moments they experience, intelligent tire technology installs sensors within the tire structure, enabling the direct monitoring of tire, vehicle, and road information.
In recent years, advances in sensor and electronic technologies have led to the widespread use of various sensors in intelligent tire research, such as optical sensors, PVDF (polyvinylidene fluoride) sensors, strain sensors, and accelerometers [1]. These sensors enable the real-time estimation of tire forces by monitoring dynamic response parameters such as strain, displacement, and acceleration, as well as by analyzing signal characteristics. Tuononen [2] utilized optical sensors to measure the displacement signals at the center of the tire inner liner and estimated the three-dimensional tire forces through linear regression analysis. Matsuzaki et al. [3] employed piezoelectric materials to measure strain signals at the center of the tire inner liner and estimated the vertical tire force by fitting the relationship between strain and the vertical load via linear regression. Cheli et al. [4] analyzed experimental results and identified a significant correlation between the peak distance of vertical acceleration response signals at the center of the tire inner liner and the tire contact patch length, enabling the estimation of vertical and longitudinal forces. Arat et al. [5] determined the tire contact patch length based on the time difference between two peaks of the longitudinal acceleration signal and the tire instantaneous rotational angular velocity and further established the relationship between the vertical force and contact patch length. Garcia-Pozuelo et al. [6] and Bastiaan [7] investigated the effects of tire slip and load on strain characteristics, identifying significant nonlinear relationships between strain signal features and slip angle and enabling the prediction of tire lateral forces. Zhao et al. [8] used circumferential and normal acceleration signal features at the center of the tire inner liner as inputs and estimated the tire’s longitudinal and vertical forces using the BP neural network. Wei et al. [9] utilized radial acceleration response signal features from the center of the tire inner liner to determine the contact patch length of rolling tires and proposed an intelligent tire vertical force estimation method based on an improved semi-empirical tire model. Khaleghian et al. [10] used longitudinal acceleration data to calculate the tire contact patch length and established relationships among vertical force, vehicle speed, tire pressure, and contact patch length based on an artificial neural network. Zhang et al. [11] estimated tire rolling speed and contact patch length based on the Swift tire model and acceleration signal features and subsequently estimated the tire vertical force via polynomial fitting with tire pressure. Zhou et al. [12] proposed estimation methods for tire vertical and longitudinal forces based on the flexible ring tire model, demonstrating the generalization performance of physical model-based approaches in intelligent tire research. Xu et al. [13] analyzed mapping relationships between three-dimensional acceleration information from the tire inner liner and tire forces, achieving high-precision online estimation through combined physical models and machine learning techniques. It can be observed that tire force estimation is based on actual physical quantities measured by sensors, combined with appropriate estimation algorithms. Therefore, the measured physical quantities and their sensitivities to tire forces significantly influence the estimation accuracy of tire forces. In the studies mentioned above, sensors were predominantly installed at the center of the tire inner liner, without sufficient theoretical analysis regarding the optimal sensor type, quantity, and placement locations. Although Miyoshi et al. [14] compared the correlation between strain measurements in specific tire areas and three-dimensional tire forces based on strain sensors, their method assumed a simple linear relationship between strain and tire forces, neglecting the inherent complexity and nonlinearity of actual tire behaviors. Miyoshi [15] performed experimental analysis on the effects of different loads and speeds on tire strain but did not analyze the sensitivity relationship between strain and tire forces. Therefore, to overcome the blindness of the sensor-targeting configuration in intelligent tires, further research is required to identify tire force-sensitive areas and their corresponding sensitive response variables, which is crucial for achieving precise tire force estimation in intelligent tire technologies.
This paper proposes an intelligent tire force estimation method that integrates sensor-measured tire dynamic response parameters with machine learning techniques. A 205/55 R16 radial tire was selected as the research object, and its finite element model was established using the ABAQUS/2020 simulation software with a parametric modeling approach. The validity of the model was verified through indoor static contact and stiffness tests. The variance-based global sensitivity analysis method, along with the multiplication dimensionality reduction-based global sensitivity index solution method and finite element analysis, was used to investigate the sensitivity of acceleration, strain, and displacement responses in the contact deformation area of the tire inner liner to changes in longitudinal and lateral forces. Based on the results of the global sensitivity analysis, the characteristic values from the response signal curves associated with longitudinal and lateral force sensitivity were extracted and used as input variables for the RBF neural network. Three intelligent tire force estimation models, each with different sensor combinations and targeted configurations, were established to determine the optimal sensor configuration for the accurate estimation of the tire’s longitudinal and lateral forces.

2. Global Sensitivity Analysis Method

Global sensitivity analysis, also known as importance measure analysis, quantifies the impact of input uncertainty on output uncertainty from a global perspective. Consequently, it is widely applied in engineering design and reliability assessments [16]. Among these methods, the variance-based global sensitivity analysis method proposed by Sobol [17] is currently the most widely used approach. This method evaluates the influence of input variables on output responses by quantifying their contribution to the variance of the output relative to the total input variance [18].

2.1. Variance-Based Global Sensitivity Index

For a structural system with n-dimensional mutually independent random input variables X = X 1 , X 2 , , X n T , its input–output relationship can be expressed using the system response function Y = g X . Based on the high-dimensional model representation (HDMR) theory [19] and the decomposition concept from the analysis of variance (ANOVA) [20], the system response function can be decomposed into a sum of orthogonal components [21], each with zero expected value, namely
Y = g X = g 0 + i = 1 n g i X i + i < j g i j X i , X j + i < j < k g i j k X i , X j , X k + + g 1 , 2 , , n X
In this equation, each decomposed term has a mean of zero and is mutually orthogonal. g 0 represents the expected value of the output response Y , where g 0 = E Y , g i = E Y X i g 0 , and g i j = E Y X i , X j g i g j g 0 .
Taking the variance on both sides of Equation (1) results in
V Y = i = 1 n V i + i < j V i j + + V 1 , 2 , , n
In this equation, V i = V g i = V E Y X i and V i j = V g i j = V E Y X i , X j V i V j .
The first-order partial variance V i quantifies the independent contribution of input variable X i to the output response variance V Y . The second-order partial variance V i j captures the contribution of the interaction between input variables X i and X j to the output response variance. By normalizing the first-order partial variance V i , the global sensitivity analysis main index S i can be obtained:
S i = V i V Y = V E Y X i V Y ,   0 S i 1

2.2. Efficient Solution Method for Global Sensitivity Indices

A Monte Carlo numerical simulation is the most widely used method for calculating global sensitivity indices; however, it requires significant computational resources, rendering it less practical for engineering applications [22]. Zhang et al. [23] proposed a multiplication-based dimensionality reduction method, which determines specific input variable schemes using Gaussian quadrature rules, constructs an integration grid, and repeatedly utilizes the grid information to calculate higher-order moments at the origin, thereby addressing the high computational cost of traditional methods. This method is adopted in the present study. The surrogate model h X is used to approximate the original system response function, namely
Y h X = h 0 1 n · i = 1 n h x i , c i
where h 0 represents the response value of the system response function when the input variable X = x 1 , x 2 , , x n takes the mean value c = c 1 , c 2 , , c n , namely h 0 = h c 1 , c 2 , , c n , and h x i , c i represents the response value of the structural system response function when all other input variables, except for x i , take their mean values, namely h x i , c i = h c 1 , , c i 1 , x i , c i + 1 , , c n .
Clearly, h x i , c i is a univariate function that depends solely on the input variable x i . The multiplication-based dimensionality reduction method transforms a function model with n random input variables into the product of n univariate functions. To facilitate subsequent calculations and derivations, the expressions for the first-order moment ρ i and second-order moment θ i of the univariate functions are introduced as follows:
ρ i = E h X i = X i h x i , c i f x i d x i θ i = E h X i 2 = X i h x i , c i 2 f x i d x i
The moments of various orders for univariate functions can be calculated using different types of Gaussian quadrature formulas, depending on the distribution type of the structural system input variables. Ultimately, the variance-based global sensitivity main index S i can be expressed as
S i = V i V Y = V E Y X i V Y θ i / ρ i 2 1 k = 1 n θ k / ρ k 2 1 ,   0 S i 1

3. The Finite Element Model of the Tire Established in ABAQUS

3.1. Establishment of the Tire Finite Element Model

To investigate the acceleration, strain, and displacement response characteristics of a rolling tire under different loading conditions, a finite element model of the 205/55 R16 radial tire with a complex tread pattern was developed. The modeling process was divided into two stages: the construction of the tire carcass structure and the tread pattern. In the modeling process, the tire was divided into the tread pattern and the carcass structure (including all components except the tread) [24]. The 2D cross-sectional profile of the tire, created in AUTOCAD, was imported into HYPERMESH for mesh generation, resulting in a 2D finite element mesh model of the tire carcass structure. The rubber–cord structure of the tire was described using the Rebar model, with rubber element types defined as CGAX3H and CGAX4H and the cord element type defined as SFGAX1. After importing the 2D tire carcass mesh model into ABAQUS, the *Revolve command was used to rotate a 3D tire carcass mesh model with a single pitch. To improve the computational accuracy in the contact area, local mesh refinement was applied. The rim and road surface were both defined as analytical rigid bodies, and their interactions with the tire were described using contact constraints with a Coulomb friction model. The rubber material exhibits significant nonlinear mechanical properties, and its mechanical properties vary across different tire components. To accurately describe these properties, our research team conducted uniaxial tensile tests on the tire rubber material, and the experimental data were fitted using ABAQUS. The detailed testing process is provided in reference [25]. Based on the analysis results, the Yeoh model was chosen to describe the mechanical properties of the rubber material, and its strain energy function is defined as follows:
U = C 1 I 1 3 + C 2 I 1 3 2 + C 3 I 1 3 3
In the equation, I 1 = λ 1 2 + λ 2 2 + λ 3 2 , I 1 represents the first invariant of the strain tensor. λ 1 , λ 2 , and λ 3 represent the principal elongation ratios. C 1 , C 2 , and C 3 are the material parameters that characterize the mechanical properties under different strain levels.
During the tread pattern modeling process, a solid 3D tread pattern with a single pitch was first constructed using CATIA and then imported into HYPERMESH for 3D mesh generation. Considering the incompressibility of the rubber material, hybrid elements were chosen as the mesh type. The *Tie command in ABAQUS was subsequently used to bond the 3D tread pattern mesh with the 3D tire carcass mesh, forming a sector-shaped tire model with a single pitch. The *Symmetric model generation command was subsequently applied to rotate and generate the complete tire model. The process of establishing the tire finite element model is shown in Figure 1.

3.2. Validation of the Tire Finite Element Model

To validate the effectiveness of the tire finite element model, several static contact and stiffness tests were conducted on a 205/55 R16 radial tire using the MTM-2 Tire Comprehensive Strength Tester (Tire and Automotive Rubber Products Research Institute, Jiangsu University, Zhenjiang, China). The tests were conducted under a rated load of 4821 N and a rated inflation pressure of 0.24 MPa, in accordance with the GB/T 23663-2009 standard [26]. All tests were performed under consistent conditions, and the average values were used as the final results. The tire contact patch under static loading was obtained using an ink-printing method, and the tire finite element simulation was carried out using ABAQUS. A comparison between the experimental and finite element simulation results of the tire contact patch is shown in Figure 2. The corresponding characteristic parameters are listed in Table 1. The comparison of experimental and simulation results for the tire radial, longitudinal, and lateral stiffness is shown in Table 2.
The analysis of Table 1 and Table 2 shows that the errors between the experimental and simulated results for the tire contact patch and stiffness are less than 2% and 10%, respectively, indicating strong numerical consistency. These results confirm that the tire finite element model established in this study exhibits high accuracy and effectively captures the tire contact mechanical properties.

4. Tire Force-Sensitive Response Areas and Variables

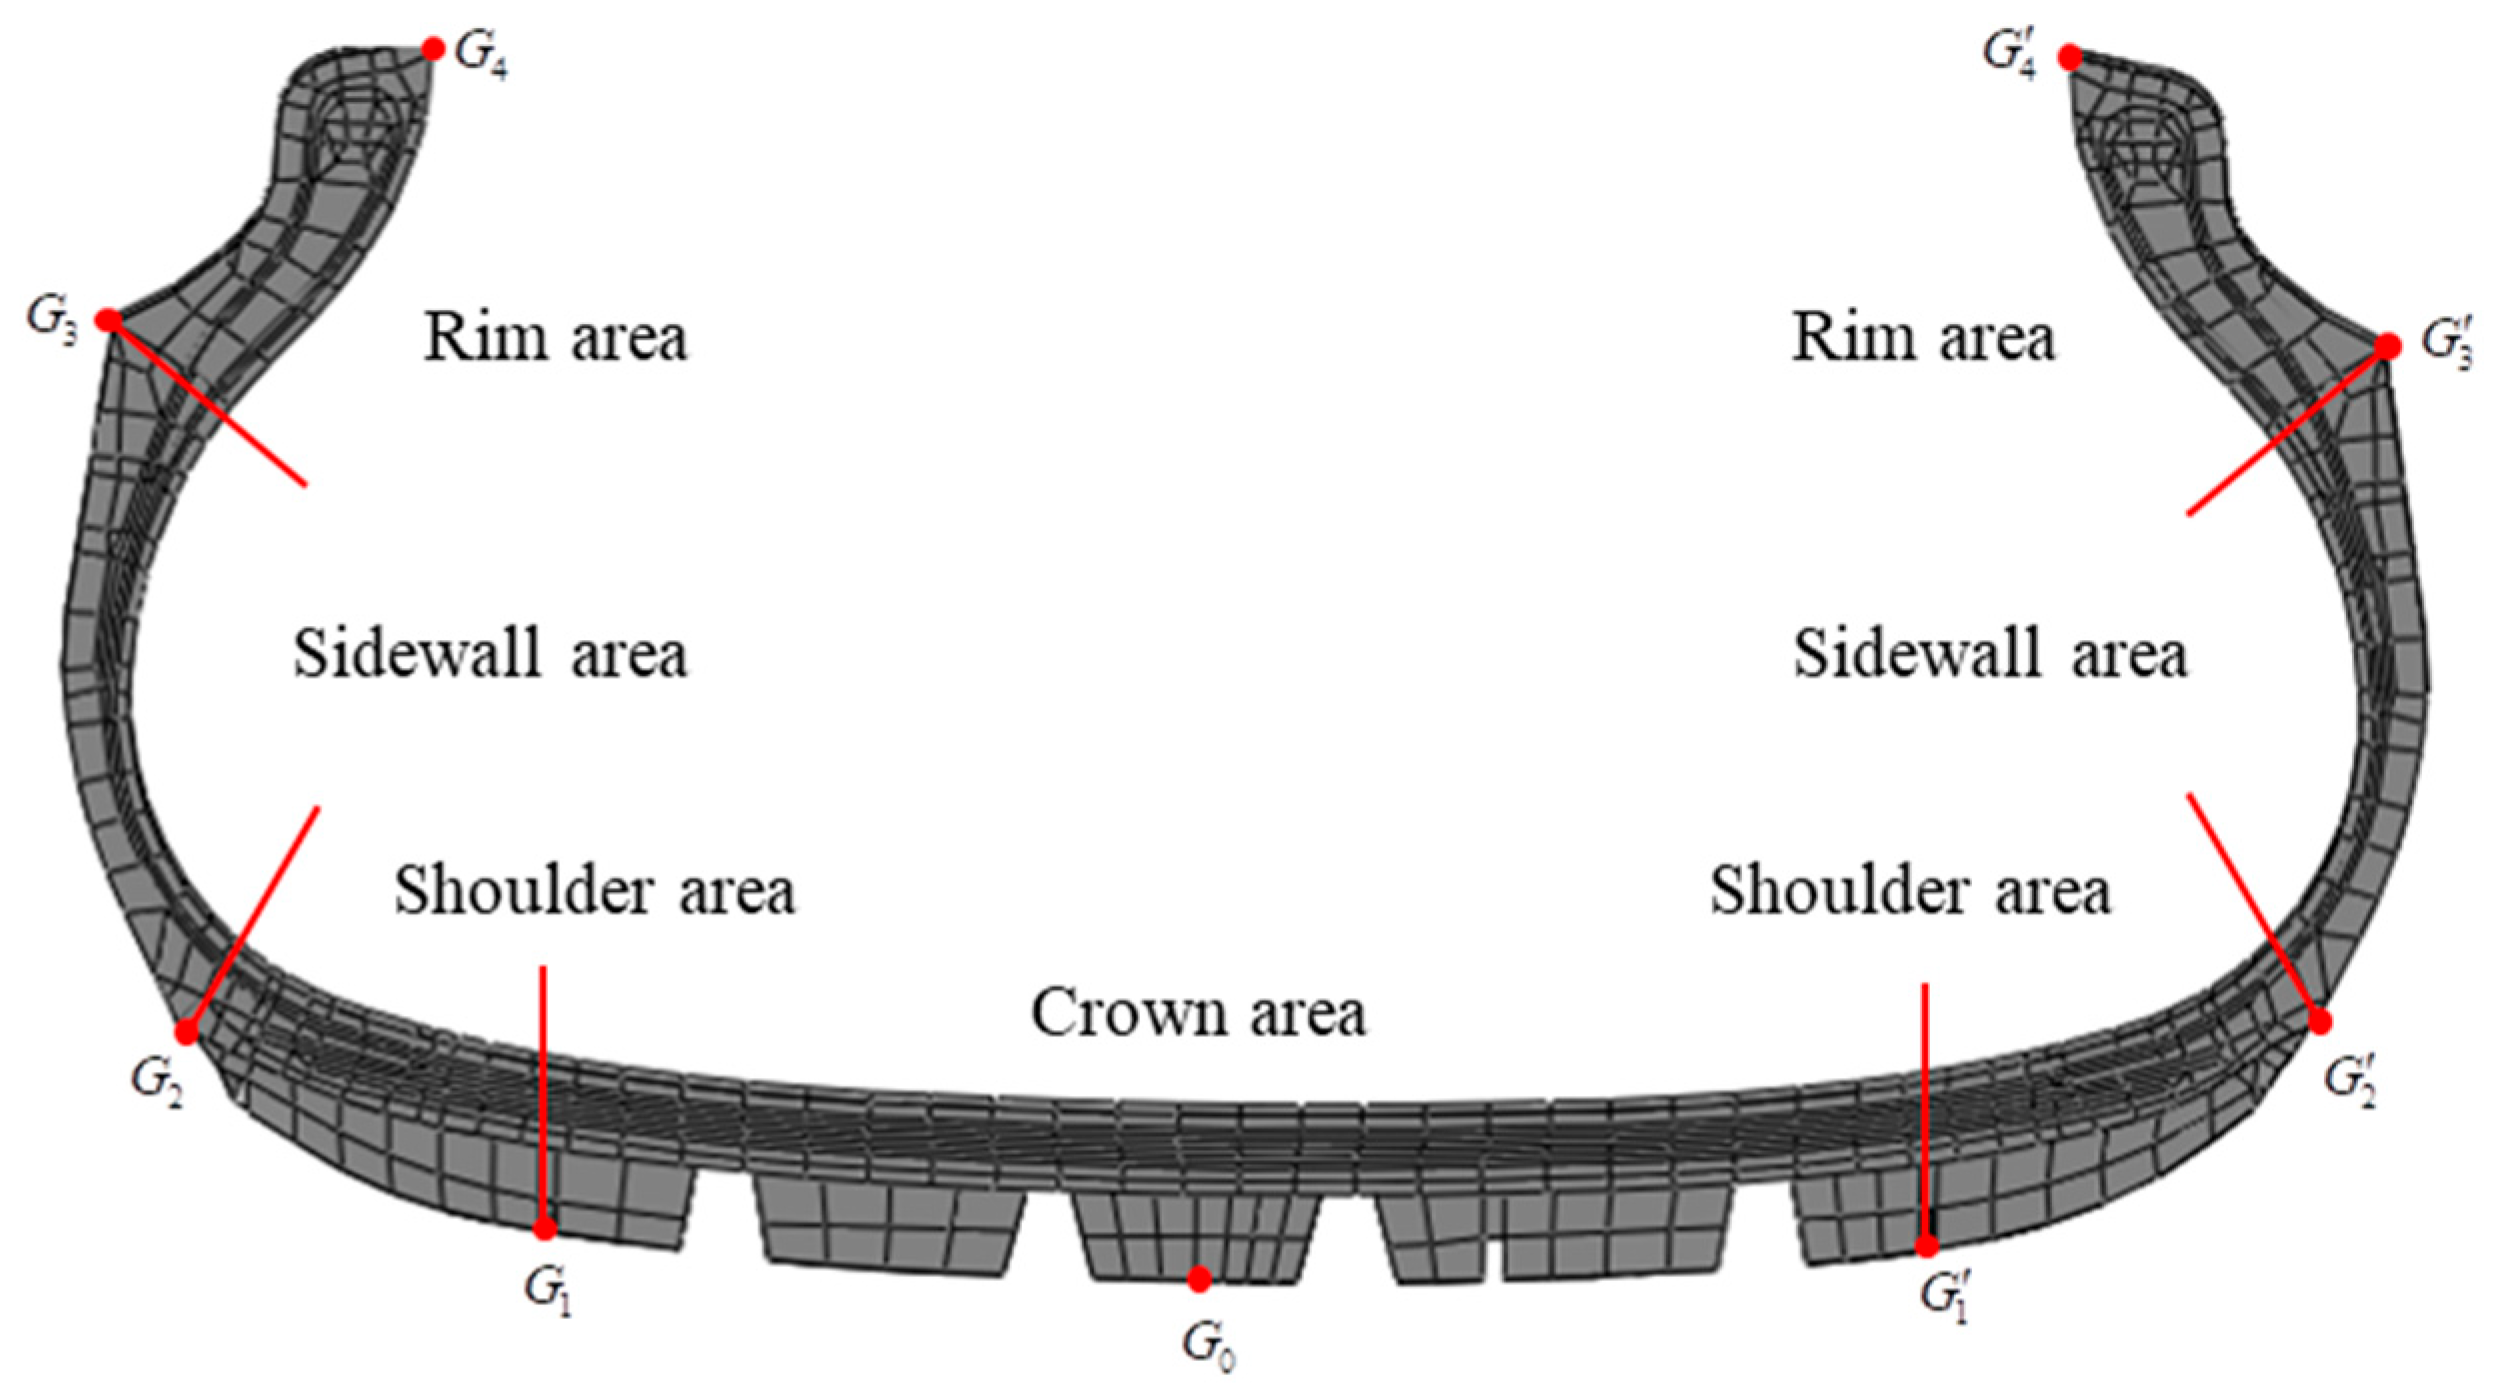
4.1. Division of the Tire Inner Liner Area

To investigate the sensitivity of tire forces at different structural positions of the tire during operation, as well as the corresponding variables, the inner liner of the tire was statically refined along the transverse direction and divided into four distinct areas: the crown area, shoulder area, sidewall area, and rim area, as shown in Figure 3. Using the longitudinal groove G 1 ( G 1 ) of the tire tread as a boundary, the area covered by the tread pattern is divided into the crown area and shoulder area. These two areas are in direct contact with the road surface and provide the required traction or grip for real-time driving, braking, and steering. G 0 represents the center of symmetry for the crown area, and G 2 ( G 2 ) indicates the end point of the tread pattern. The region between G 2 ( G 2 ) and G 3 ( G 3 ) is defined as the sidewall area, which remains out of contact with external components. The region from G 3 (the termination point of the G 3 treadwear rubber outer contour) to G 4 ( G 4 ) at the end of the tire bead is designated as the rim area, which directly interfaces with the rim. As the tire rolls over the road surface, the crown area deforms and leaves a flat footprint, known as the contact patch area. The ground deformation area of the tire is dynamically refined along the circumferential direction and divided into three sub-areas: entry into contact patch area A ( D 1 D 2 ), contact patch area B ( D 2 D 3 ), and exit from contact patch area C ( D 3 D 4 ), as shown in Figure 4. D 1 and D 4 correspond to the maximum response locations, namely acceleration, strain, and displacement, before entering and after exiting the contact patch area, respectively. D 0 , D 2 , and D 3 represent the symmetric center and the front and rear critical boundaries of contact patch area B, respectively. θ d and θ c are defined as the deformation angle and the contact angle of the rolling tire, respectively.
The ground deformation area of the tire inner liner is unfolded into a plane and divided into 21 smaller areas along the transverse and circumferential directions. “L” and “R” represent the left and right sides of the tire, respectively, as shown in Figure 5.

4.2. Global Sensitivity Analysis of Tire Forces

During the rolling of tire, the magnitude of the vertical force can be adjusted by applying a specific vertical load, whereas the longitudinal and lateral forces are difficult to control precisely. The longitudinal and lateral tire forces are significantly related to the slip ratio and slip angle within a certain range. Therefore, varying these parameters can effectively reflect the force conditions experienced by the tire during actual movement [27]. Accordingly, in the global sensitivity analysis of tire forces, the slip ratio and slip angle are used as the actual input variables, while the acceleration, strain, and displacement response variables at each node within the ground deformation area of the rolling tire inner liner are taken as the output variables.
Through finite element simulation analysis, the relationships between the longitudinal force and slip ratio, as well as the lateral force and slip angle, under standard loading conditions during pure longitudinal slip and pure lateral slip scenarios are obtained, as shown in Figure 6a,b. From the figures, it can be observed that under each single scenario, the slip ratio and slip angle vary within ranges of 10% and 8°, respectively. Both variables exhibit a one-to-one correspondence with the longitudinal and lateral forces. The variation trends of the longitudinal and lateral forces are consistent with the predictive force curves from the Pacejka magic formula and the Brush tire model, both of which effectively describe the mechanical characteristics of tires. Therefore, these ranges are adopted as the variation intervals for the input variables slip ratio and slip angle in the global sensitivity analysis of tire forces, with the assumption that these input variables are uniformly distributed.
Based on the five-point Gaussian numerical integration rule [28], the specific values of each input variable are determined, as listed in Table 3, to establish the global sensitivity analysis scheme for tire forces. The Abaqus/Standard solver is used to simulate the rolling process of tire under combined slip angle and longitudinal slip conditions. The tire is configured with a nominal inflation pressure of 0.24 MPa, a vertical load of 4821 N, a road adhesion coefficient of 0.8, and a rolling speed of 70 km/h.
The global sensitivity analysis of tire forces based on the scheme shown in Table 3 is conducted using the finite element method. The acceleration ( A ), strain ( L E ), and displacement ( U ) components in three directions are extracted at each node within the ground deformation area of the rolling tire inner liner, resulting in nine output response variables. ( A 1 , A 2 , and A 3 represent the radial, circumferential, and lateral accelerations, respectively, while other strain and displacement components follow the same directional notation). These response values are calculated for 21 sub-areas, and the moments of various orders are determined to obtain 189 output response variables in different areas under varying input variables, thereby enabling the calculation of the global sensitivity main index S i . When S i 0.8 , the input variable is considered to show high sensitivity to the output response variable; when 0.6 < S i < 0.8 , it indicates moderate sensitivity; and when S i 0.6 , it indicates low sensitivity.
In the global sensitivity analysis of tire forces with the slip ratio (SR) as the input variable, 14 sensitive response variables across different areas exhibit global sensitivity main index values above 0.6, including radial acceleration ( A 1 ) and circumferential displacement ( U 2 ), both of which are associated with longitudinal force-sensitive response variables, as shown in Figure 7. Among these, the radial acceleration ( A 1 ) in the sidewall and rim areas is most significantly affected by the slip ratio, showing high sensitivity. The global sensitivity main index value of the radial acceleration ( A 1 ) in the sidewall area can reach up to 0.9, indicating higher sensitivity compared to that in the rim area. When the tire enters contact patch area A and exits contact patch area C, the circumferential displacement ( U 2 ) in the crown area exhibits high sensitivity, with the sensitivity during entry into contact patch area A being greater than during exit from contact patch area C.
In the global sensitivity analysis of tire forces with the slip angle (SA) as the input variable, the number of sensitive response variables in the areas affected by lateral forces is significantly reduced. Only six sensitive response variables exhibit global sensitivity main index values above 0.6, including lateral acceleration ( A 3 ) and lateral displacement ( U 3 ), as shown in Figure 8. In contact patch area B, the lateral acceleration ( A 3 ) and lateral displacement ( U 3 ) in the sidewall area exhibit high sensitivity. When the tire enters contact patch area A and exits contact patch area C, the lateral acceleration ( A 3 ) and lateral displacement ( U 3 ) in the sidewall area show moderate sensitivity. In addition, the lateral force-sensitive response variables exhibit noticeable asymmetry between the left and right sidewall areas. Specifically, the lateral displacement ( U 3 ) in the left sidewall area shows high sensitivity, while the lateral acceleration ( A 3 ) in the right sidewall area exhibits greater sensitivity. (When the slip angle is positive, the tire experiences a lateral force directed to the left). Therefore, the direction of the lateral force can lead to differences in the contribution levels of acceleration and displacement response variables between the left and right sidewall areas.

5. Intelligent Tire Force Estimation Method

To investigate the influence patterns of longitudinal and lateral tire forces on sensitive response variables in force-sensitive response areas, finite element simulations of pure longitudinal slip and pure slip angle conditions are conducted under different slip ratios (0%, 2.5%, 5.0%, 7.5%, and 10%) and slip angles (0°, 2°, 4°, 6°, and 8°). The signal characteristics of tire force-sensitive responses are analyzed, and the corresponding feature values are extracted. Based on the RBF neural network algorithm, the accurate estimation of longitudinal and lateral forces for intelligent tires is achieved. The rated input parameters used in the finite element simulation are detailed in Section 4.2.

5.1. Analysis of the Characteristics of Longitudinal Force-Sensitive Response Signal Curves

5.1.1. Circumferential Displacement Response Signal in the Crown Area

Figure 9a illustrates the variation in the circumferential displacement response signal in the crown area as a function of longitudinal force. As the rolling tire moves from the highest point toward contact patch area A, the circumferential displacement gradually increases from the initial value h 0 to the positive peak point h 1 . Subsequently, the positive value of circumferential displacement decreases, and after the tire exits contact patch area C, the circumferential displacement reaches the negative peak point h 2 and then gradually returns to the initial value. As the longitudinal force increases, the amplitude of the positive peak point in circumferential displacement also increases, though the rate of increase gradually decreases when the longitudinal force reaches a certain range. Meanwhile, the amplitude of the negative peak of circumferential displacement decreases with the increase in longitudinal force. To accurately characterize the circumferential displacement response signal curve in the crown area, the normal line at the center point of contact patch area B is selected as the reference. The distances from the positive and negative peaks of circumferential displacement to the center of the contact patch are denoted as S 1 and S 2 , respectively, and the distance between the two peaks is denoted as S . In addition, six characteristic values of the circumferential displacement response signal curve in the crown area are extracted, including the initial value h 0 , the positive peak point h 1 , and the negative peak point h 2 , as shown in Figure 9b.

5.1.2. Radial Acceleration Response Signal in the Sidewall Area

Figure 10a illustrates the variation in the radial acceleration response signal in the sidewall area as a function of longitudinal force. Under pure longitudinal slip conditions, the radial acceleration response signal in the sidewall area remains constant at its baseline value when far from the ground deformation area. The signal exhibits local minima when entering contact patch area A and exiting contact patch area C, with the maximum value corresponds to the center of contact patch area B. In the absence of longitudinal force, the amplitude of the local minimum at the entry to contact patch area A is smaller than that at the exit of contact patch area C. As the longitudinal force increases, the maximum value of the radial acceleration response signal gradually decreases. Additionally, the amplitude of the local minimum at the exit of contact patch area C decreases with increasing longitudinal force, while the amplitude at the entry to contact patch area A remains nearly constant. Seven characteristic values are extracted from the radial acceleration response signal curve in the sidewall area, including the baseline value h 0 ; the amplitudes of the extreme points h 1 , h 2 , and h 3 ; as well as the distances between these points S , S 1 , and S 2 , as shown in Figure 10b.

5.2. Analysis of the Characteristics of Lateral Force-Sensitive Response Signal Curves

5.2.1. Lateral Acceleration Response Signal in the Right Sidewall Area

Under pure slip conditions, the direction of the lateral force affects the characteristic variation in the tire force-sensitive response signal curve in the left and right sidewall areas. In this study, the lateral force is directed to the left. Figure 11a illustrates the variation in the lateral acceleration response signal in the right sidewall area with respect to lateral force. When no lateral force is applied, the lateral acceleration response signal in the ground deformation area contains only three extreme points. When the tire is subjected to a leftward lateral force, two additional maxima (the third and fourth) appear in the lateral acceleration response signal, symmetrically positioned on either side of the center of contact patch area B. As the lateral force increases, the amplitudes of the third and fourth maxima progressively increase, while the amplitude of the first maximum at the center of contact patch area B gradually decreases. Nine characteristic values are extracted from the lateral acceleration response signal curve in the right sidewall area, including the baseline value h 0 ; the amplitudes of the extreme points h 1 , h 2 , h 3 , h 4 , and h 5 ; and the distances between these points S , S 1 , and S 2 , as shown in Figure 11b.

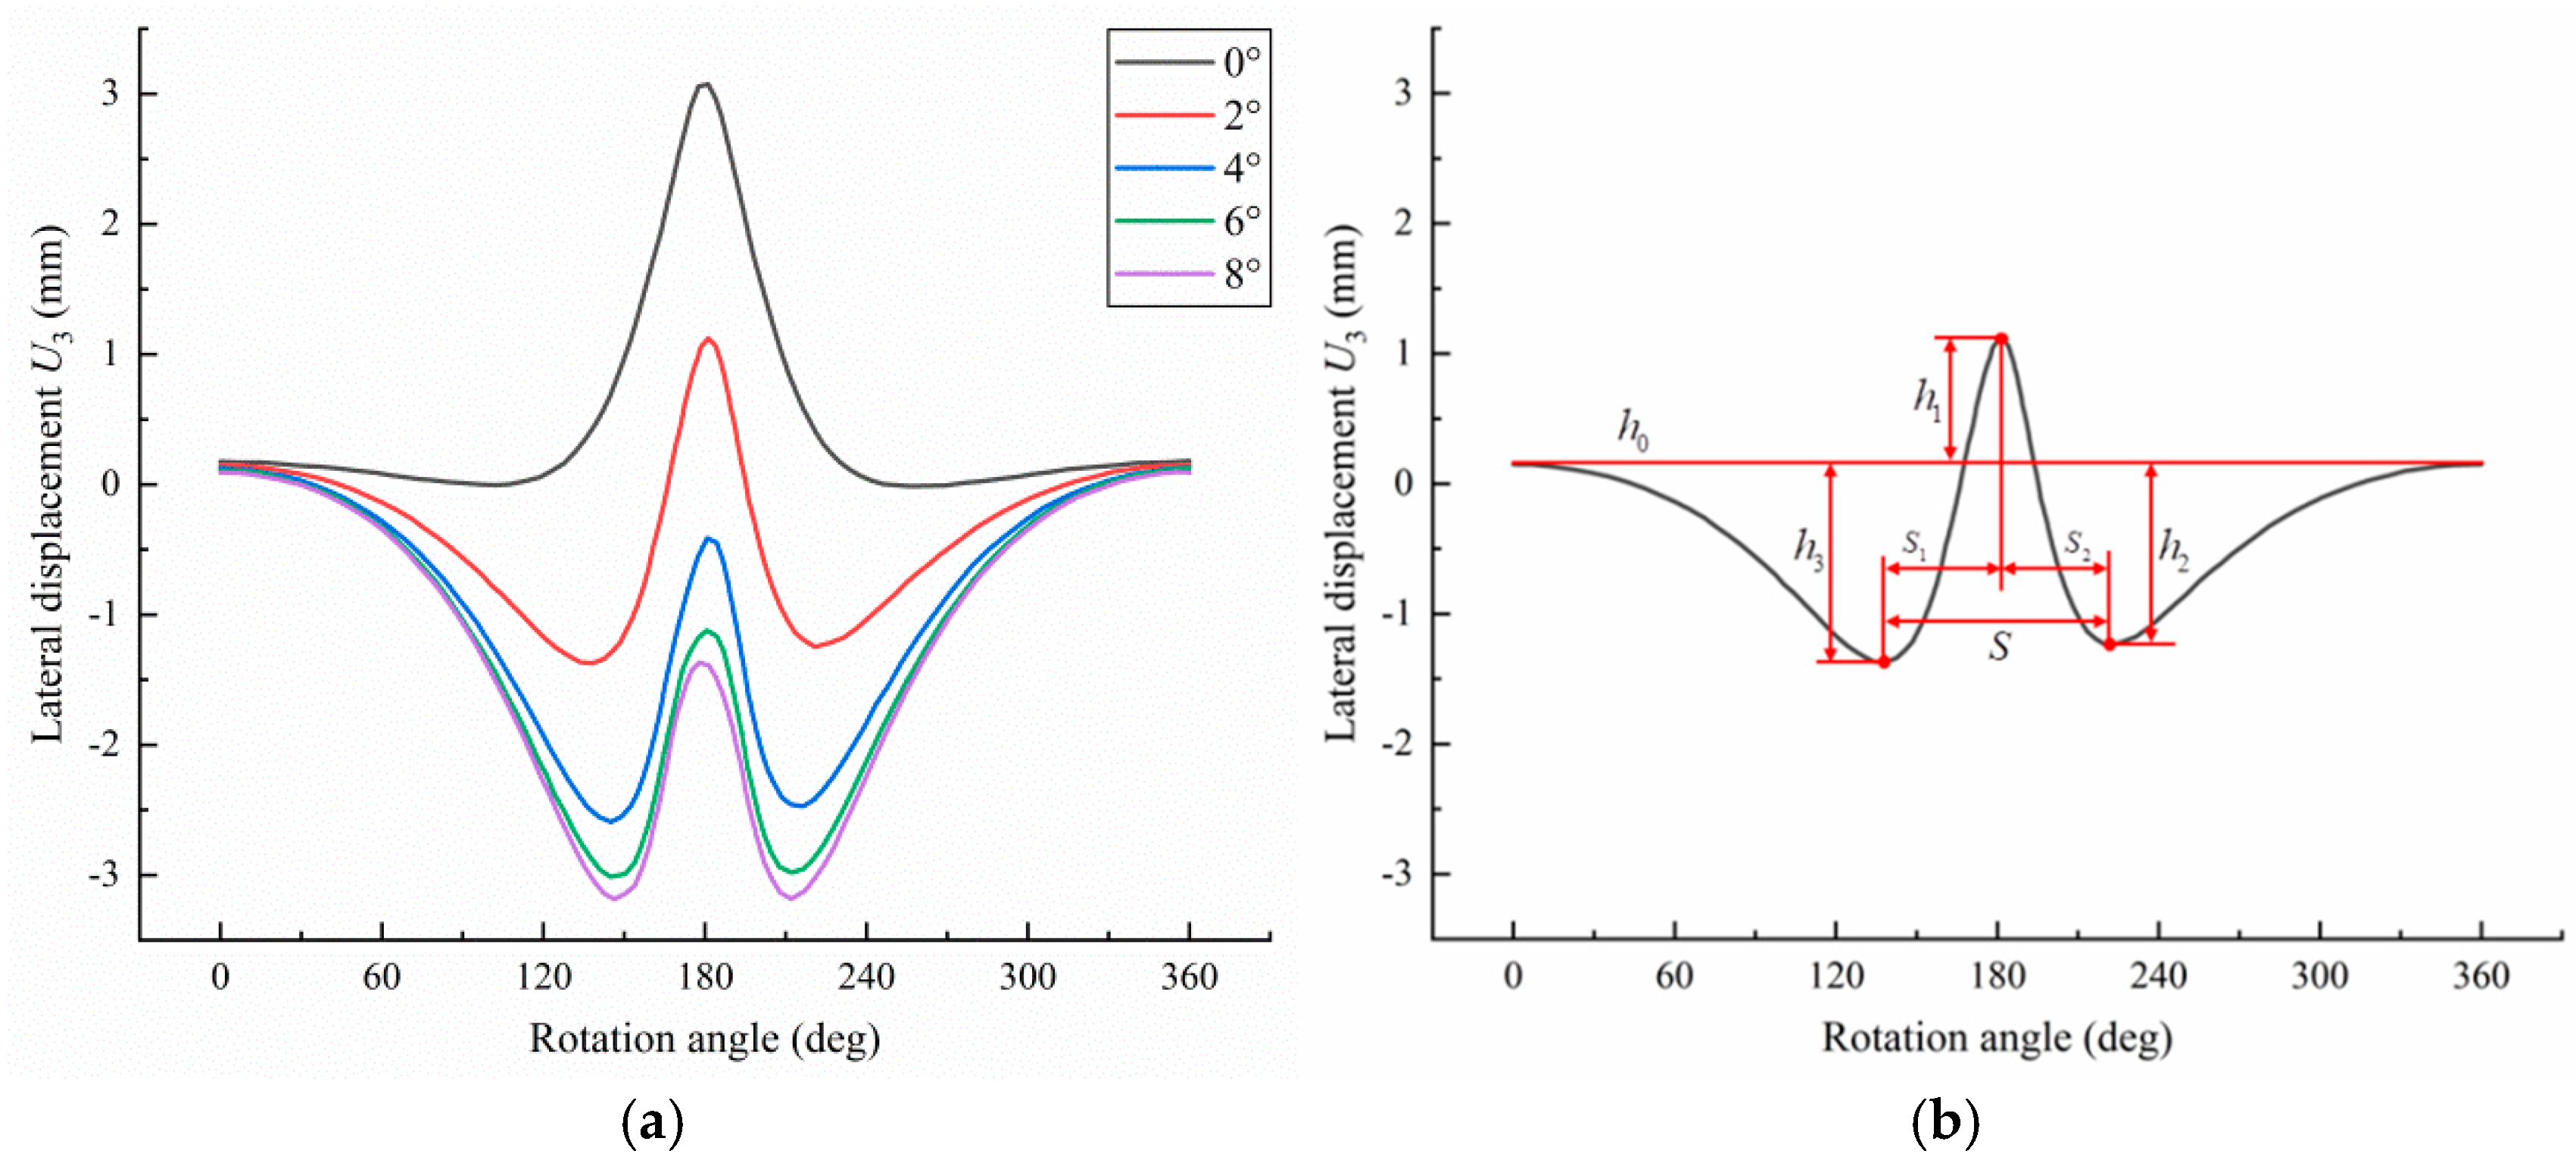
5.2.2. Lateral Displacement Response Signal in the Left Sidewall Area

Figure 12a illustrates the variation in the lateral displacement response signal in the left sidewall area with respect to lateral force. When no lateral force is applied, the lateral displacement response signal only exhibits a single peak at the center of contact patch area B, with negligible displacement observed in the left sidewall area on either side of the ground deformation area. As the lateral force increases, two local minima gradually appear in the lateral displacement response signal as the tire enters contact patch area A and exits contact patch area C. Simultaneously, the original maximum shifts downward, transitioning from a positive to a negative value. It is observed that as the lateral force increases, the amplitude of this shift progressively decreases. Seven characteristic values are extracted from the lateral displacement response signal curve in the left sidewall area, including the baseline value h 0 ; the amplitudes of the extreme points h 1 , h 2 , and h 3 ; as well as the distances between them, namely S , S 1 , and S 2 , as shown in Figure 12b.

5.3. RBF Neural Network

Tires represent complex nonlinear systems, making it challenging to directly establish functional relationships between sensor measurements and tire forces. The RBF neural network is an efficient feedforward architecture that uses radial basis functions as activation functions, featuring a simple structure and fast convergence. It can accurately approximate arbitrary nonlinear functions by transforming input vectors from a low-dimensional, nonlinearly inseparable space into a higher-dimensional, linearly separable space. This enables local nonlinear mappings to be represented as linearly adjustable parameters, effectively overcoming the limitations of traditional tire force estimation methods in terms of nonlinear fitting and tire force decoupling [29]. In this study, the dimensionality of the input features (derived from tire force-sensitive response signal curves) is relatively manageable, and the training dataset is of moderate size. Compared to deep neural networks, the RBF neural network offers notable advantages in terms of parameter tuning, training speed, and computational efficiency, making it more suitable for real-time deployment and validation in vehicle control systems or embedded hardware platforms.
The activation function of the RBF neural network is defined as follows:
g i p = exp p c i 2 2 σ i 2
where p represents the input layer variable, c i represents the center of the hidden layer neuron, and σ i is the spread parameter that controls the radial influence range of the basis function.
The output function of the RBF neural network is defined as follows:
o j p = i = 1 n w i j g i p = i = 1 n w i j exp p c i 2 2 σ i 2 ,   j = 1 , , r
where n represents the number of hidden layer neurons, w i j represents the weight connecting the i-th hidden neuron to the j-th output neuron, and r represents the number of output neurons.
To satisfy the training and testing requirements of the tire force estimation model, the training and testing samples for the RBF neural network are generated from 100 sets of finite element simulation data under pure longitudinal slip and pure slip angle conditions. The tire is set with a rated inflation pressure of 0.24 MPa, a vertical load of 4821 N, a road adhesion coefficient of 0.8, a rolling speed of 70 km/h, a maximum slip ratio of 25%, and a maximum slip angle of 15°. The network used mean squared error (MSE) as the objective function, with a spread parameter of 0.85, an error convergence threshold of 1 × 10⁻⁵, and 1000 training iterations. The dataset is split into training and testing sets in an 8:2 ratio, resulting in 80 training samples and 20 testing samples. The input to the RBF neural network consists of the characteristic values extracted from the response signal curves of sensitive response variables in the tire force-sensitive response areas. For each complete tire rotation, 68 characteristic values are generated for each sensitive response variable. Therefore, the RBF neural network training input forms a 68 × 80 matrix, and the corresponding output is a 1 × 80 matrix. The longitudinal and lateral tire forces are estimated using separate RBF neural networks, as shown in Figure 13. The finite element simulation results are used as reference values for tire forces and are compared against the RBF neural network estimations.
In the crown and the left/right sidewall areas of the tire, the sensitive response signals for longitudinal and lateral forces include distinct acceleration and displacement components. To establish a high-accuracy intelligent tire force estimation model, three RBF neural network models with different input vectors are designed and trained based on various combinations of sensor types, quantities, and targeted configurations, as summarized in Table 4. The sidewall area of the tire serves as a common sensitive response area for both longitudinal and lateral forces. In Model 1, a single acceleration sensor is installed in one sidewall area. Model 2 installs displacement and acceleration sensors in the left and right sidewall areas, respectively. Building upon Model 2, Model 3 adds a displacement sensor in the crown area. The estimated longitudinal and lateral tire forces for Model 3 are shown in Figure 14a and Figure 14b, respectively. The estimation results demonstrate that the RBF neural network, determined through the global sensitivity analysis of tire forces, can effectively and accurately estimate both longitudinal and lateral forces in intelligent tires.
To evaluate the generalization performance of each RBF neural network based on the intelligent tire force estimation model, the mean relative error (MRE) on the test set is used as an approximation of the generalization error. The MRE results for each model are presented in Table 5. Model 3 exhibits the best generalization performance with MREs for longitudinal and lateral forces estimation both within 2%, specifically 1.42% and 1.10%, respectively. Models 1 and 2 show inferior generalization performance compared to Model 3, with MREs for both longitudinal and lateral forces remaining within 10%, still indicating relatively high estimation accuracy. Therefore, it can be concluded that increased diversity in the input vector types of the RBF neural network model leads to improved generalization performance and estimation accuracy.

6. Conclusions

This study systematically investigates the sensitivity of longitudinal and lateral forces to the acceleration, strain, and displacement responses in different areas of the inner liner of a 205/55 R16 radial tire during rolling using the global sensitivity analysis and finite element simulation. The results indicate that, within the ground deformation area, acceleration and displacement responses exhibit higher sensitivity to longitudinal and lateral forces than strain responses. Specifically, when the tire enters and exits the contact patch area, the longitudinal force shows extremely high sensitivity to the radial acceleration ( A 1 ) in the sidewall area and the circumferential displacement ( U 2 ) in the crown area. The effect of lateral force on sensitive response variables is primarily concentrated in the sidewall area, with significant asymmetry between the left and right sidewall areas: the lateral displacement ( U 3 ) in the left sidewall area exhibits high sensitivity, while the lateral acceleration ( A 3 ) in the right sidewall area exhibits similarly high sensitivity. Based on the global sensitivity analysis of tire forces, the characteristic values of sensitive response signal curves for longitudinal and lateral forces are extracted, and three intelligent tire force estimation models are established using the RBF neural network with different sensor-targeting configurations. The estimation results of the three models indicate that the MRE for intelligent tire force estimation remains below 10%. In particular, Model 3 achieves longitudinal and lateral force estimation errors of 1.42% and 1.10%, respectively, with an overall MRE below 2%, effectively verifying the generalization performance of the model.
This study provides a theoretical foundation for the targeted configuration method of intelligent tire sensors and lays the groundwork for future research on accurate estimation methods of intelligent tire state parameters. However, there are some limitations in this study. The neural network based on the intelligent tire force estimation method is only applied under a single operating condition, and different sets of input features are used for force estimation in different directions. The coupling effects among sensitive response signals under complex operating conditions and different road surfaces are not fully considered. Therefore, future work should focus on optimizing the neural network to handle more complex and high-dimensional input features, enabling the simultaneous estimation of vertical, longitudinal, and lateral tire forces. This advancement is expected to further promote the development of vehicle intelligence through innovations in intelligent tire technology.

Author Contributions

Conceptualization, Y.Z. and G.W.; methodology, Y.Z. and G.W.; validation, J.Z., X.L. and X.W.; data curation, Y.Z. and J.Z.; writing—original draft preparation, Y.Z., J.Z., X.L. and X.W.; writing—review and editing, Y.Z., G.W. and H.Z.; supervision, H.Z.; project administration, G.W. All authors have read and agreed to the published version of the manuscript.

Funding

The authors are pleased to acknowledge funding of the National Natural Science Foundation of China (No. 52272366).

Institutional Review Board Statement

Not applicable.

Data Availability Statement

The raw data supporting the conclusions of this article will be made available by the authors upon request.

Acknowledgments

The authors are grateful for the support by the National Natural Science Foundation of China.

Conflicts of Interest

The authors declare that we have no conflicts of interest to report regarding the present study.

References

  1. Lee, H.; Taheri, S. Intelligent tires-A review of tire characterization literature. IEEE Intell. Transp. Syst. Mag. 2017, 9, 114–135. [Google Scholar]
  2. Tuononen, A.J. Optical Position Detection to Measure Tyre Carcass Deflections and Implementation for Vehicle State Estimation. Ph.D. Thesis, Faculty of Engineering and Architecture, Helsinki University of Technology, Espoo, Finland, 2009. [Google Scholar]
  3. Matsuzaki, R.; Hiraoka, N.; Todoroki, A.; Mizutani, Y. Analysis of applied load estimation using strain for intelligent tires. J. Solid Mech. Mater. Eng. 2010, 4, 1496–1510. [Google Scholar]
  4. Cheli, F.; Leo, E.; Melzi, S.; Sabbioni, E. On the impact of smart tyres on existing ABS/EBD control systems. Veh. Syst. Dyn. 2010, 48, 255–270. [Google Scholar]
  5. Arat, M.A.; Singh, K.B.; Taheri, S. An intelligent tyre based adaptive vehicle stability controller. Int. J. Veh. Des. 2014, 65, 118–143. [Google Scholar] [CrossRef]
  6. Garcia-Pozuelo, D.; Olatunbosun, O.; Yunta, J.; Yang, X.; Diaz, V. A novel strain-based method to estimate tire conditions using fuzzy logic for intelligent tires. Sensors 2017, 17, 350. [Google Scholar] [CrossRef] [PubMed]
  7. Bastiaan, J. Estimation of tyre forces using smart tyre sensors and artificial intelligence. Int. J. Veh. Des. 2018, 76, 110–139. [Google Scholar]
  8. Zhao, J.; Lu, Y.H.; Zhu, B.; Liu, S.L. Estimation algorithm for longitudinal and vertical forces of smart tire with accelerometer embedded. Automot. Eng. 2018, 40, 137–142, 183. [Google Scholar]
  9. Wei, Y.T.; Wang, Y.; Lin, B.Q.; Liang, G.Q. Tire vertical force estimation based on smart tire system. Tire Ind. 2019, 39, 117–121. [Google Scholar]
  10. Khaleghian, S.; Ghasemalizadeh, O.; Taheri, S.; Flintsch, G. A combination of intelligent tire and vehicle dynamic based algorithm to estimate the tire-road friction. SAE Int. J. Passeng. Cars Mech. Syst. 2019, 12, 81–98. [Google Scholar]
  11. Zhang, F.; Huang, X.J.; Zhang, S.W.; Wu, Z.Q.; Wei, S.; Wang, F. Vertical load measurement of automotive intelligent tire. Automot. Eng. 2020, 42, 1270–1276, 1283. [Google Scholar]
  12. Zhou, H.; Li, H.; Yang, J.; Chen, Q.; Wang, G.; Han, T.; Ma, T. A strain-based method to estimate longitudinal force for intelligent tires by using a physics-based model. J. Mech. Eng. Stroj. Vestn. 2021, 67, 153–166. [Google Scholar] [CrossRef]
  13. Xu, N.; Askari, H.; Huang, Y.; Zhou, J.; Khajepour, A. Tire force estimation in intelligent tires using machine learning. IEEE Trans. Intell. Transp. Syst. 2022, 23, 3565–3574. [Google Scholar] [CrossRef]
  14. Miyoshi, A.; Tsurita, T.; Kunii, M. System and Method for Determining Tire Force. U.S. Patent 7,249,498, 31 July 2007. [Google Scholar]
  15. Miyoshi, A. Pneumatic Tire with Specifically Arranged Strain Sensors. U.S. Patent 7,513,144, 7 April 2009. [Google Scholar]
  16. Xiao, S.N.; Lv, Z.Z.; Wang, W. A review of global sensitivity analysis for uncertainty structure. Sci. Sin. Phys. Mech. Astron. 2018, 48, 8–25. [Google Scholar]
  17. Sobol, I.M. Global sensitivity indices for nonlinear mathematical models and their Monte Carlo estimates. Math. Comput. Simul. 2001, 55, 221–280. [Google Scholar] [CrossRef]
  18. Liu, F.; Wei, P.; Tang, C.; Wang, P.; Yue, Z. Global sensitivity analysis for multivariate outputs based on multiple response Gaussian process model. Reliab. Eng. Syst. Saf. 2019, 189, 287–298. [Google Scholar]
  19. Li, G.; Rosenthal, C.; Rabitz, H. High dimensional model representations. J. Phys. Chem. A 2001, 105, 7765–7777. [Google Scholar]
  20. Ruan, W.; Lu, Z.; Tian, L. A modified variance-based importance measure and its solution by state dependent parameter. Proc. Inst. Mech. Eng. Part O J. Risk Reliab. 2013, 227, 3–15. [Google Scholar] [CrossRef]
  21. Gamboa, F.; Janon, A.; Klein, T.; Lagnoux, A. Sensitivity indices for multivariate outputs. C. R. Math. 2013, 351, 307–310. [Google Scholar] [CrossRef]
  22. Garcia-Cabrejo, O.; Valocchi, A. Global sensitivity analysis for multivariate output using polynomial chaos expansion. Reliab. Eng. Syst. Saf. 2014, 126, 25–36. [Google Scholar] [CrossRef]
  23. Zhang, X.; Pandey, M.D. Structural reliability analysis based on the concepts of entropy, fractional moment and dimensional reduction method. Struct. Saf. 2013, 43, 28–40. [Google Scholar] [CrossRef]
  24. Wang, G.L.; Shen, F.; Zhou, H.C.; Yang, J. Evaluation of tyre pumping noise and design of low noise structure. J. Jilin Univ. Eng. Technol. Ed. 2017, 47, 1024–1031. [Google Scholar]
  25. Zhou, H.; Wang, G.; Ding, Y.; Yang, J.; Liang, C.; Fu, J. Effect of friction model and tire maneuvering on tire-pavement contact stress. Adv. Mater. Sci. Eng. 2015, 2015, 632–647. [Google Scholar] [CrossRef]
  26. GB/T 23663-2009; Test Method of Automobile Tyre Longitudinal and Lateral Stiffness. China Standards Press: Beijing, China, 2009.
  27. Xu, N.; Huang, Y.; Askari, H.; Tang, Z. Tire slip angle estimation based on the intelligent tire technology. IEEE Trans. Veh. Technol. 2021, 70, 2239–2249. [Google Scholar] [CrossRef]
  28. Zhang, X.; Pandey, M.D. An effective approximation for variance-based global sensitivity analysis. Reliab. Eng. Syst. Saf. 2014, 121, 164–174. [Google Scholar] [CrossRef]
  29. Montazer, G.A.; Giveki, D.; Karami, M.; Rastegar, H. Radial basis function neural networks: A review. Comput. Rev. J. 2018, 1, 52–74. [Google Scholar]
Figure 1. Finite element modeling process of a tire with a complex tread pattern.
Applsci 15 03913 g001
Figure 2. Comparison of the tire contact patch.
Applsci 15 03913 g002
Figure 3. Transverse static partitioning of the tire inner liner for refinement.
Applsci 15 03913 g003
Figure 4. Circumferential dynamic partitioning of the tire ground deformation area for refinement.
Applsci 15 03913 g004
Figure 5. Planar unfolding and detailed partitioning of the ground deformation area of the tire inner liner.
Applsci 15 03913 g005
Figure 6. (a) Tire longitudinal force versus slip ratio. (b) Tire lateral force versus slip angle.
Applsci 15 03913 g006
Figure 7. Global sensitivity main index for longitudinal force ( S i 0.6 ).
Applsci 15 03913 g007
Figure 8. Global sensitivity main index for lateral force ( S i 0.6 ).
Applsci 15 03913 g008
Figure 9. (a) Circumferential displacement response signal in the crown area. (b) Characteristic values of the circumferential displacement response signal in the crown area.
Applsci 15 03913 g009
Figure 10. (a) Radial acceleration response signal in the sidewall area. (b) Characteristic values of the radial acceleration response signal in the sidewall area.
Applsci 15 03913 g010
Figure 11. (a) Lateral acceleration response signal in the right sidewall area. (b) Characteristic values of the lateral acceleration response signal in the right sidewall area.
Applsci 15 03913 g011
Figure 12. (a) Lateral displacement response signal in the left sidewall area. (b) Characteristic values of the lateral displacement response signal in the left sidewall area.
Applsci 15 03913 g012
Figure 13. Intelligent tire force estimation model based on the RBF neural network.
Applsci 15 03913 g013
Figure 14. (a) Longitudinal force estimation of intelligent tires based on the RBF neural network. (b) Lateral force estimation of intelligent tires based on the RBF neural network.
Applsci 15 03913 g014
Table 1. Characteristic parameters of the tire contact patch.
Characteristic ParameterExperimental Value (mm)Simulation Value (mm)Error (%)
Contact patch length1471480.68
Contact patch width161163.81.74
Table 2. Comparison of experimental and simulated tire stiffness values.
Tire StiffnessExperimental Value (N/mm)Simulation Value (N/mm)Error (%)
Radial stiffness198.48191.343.60
Longitudinal stiffness132.99122.228.10
Lateral stiffness86.9278.319.91
Table 3. Global sensitivity analysis scheme for tire forces.
Scheme NumberInput Variables
Slip Ratio (SR)Slip Angle (SA)
10.47%4.0°
22.31%4.0°
35.0%4.0°
47.69%4.0°
59.53%4.0°
65.0%1.8°
75.0%4.0°
85.0%6.2°
95.0%7.6°
Table 4. RBF neural network models with different input vectors.
Model NumberSensorStructure of the RBF Neural Network Model
PositionQuantityType of Input VectorSize of Input Vector
1Right sidewall1 A 1 , A 3 16 × 200
2Left and right sidewalls2 A 1 , A 3 , U 3 23 × 200
3Crown and left/right sidewalls3 A 1 , A 3 , U 2 , U 3 29 × 200
Table 5. Generalization performance of intelligent tire force estimation models.
Model NumberMRE
Longitudinal Force (%)Lateral Force (%)
19.598.73
25.833.69
31.421.10
Disclaimer/Publisher’s Note: The statements, opinions and data contained in all publications are solely those of the individual author(s) and contributor(s) and not of MDPI and/or the editor(s). MDPI and/or the editor(s) disclaim responsibility for any injury to people or property resulting from any ideas, methods, instructions or products referred to in the content.

