Article

Maintenance Method for Rail Corrugation Considering Wheel–Rail Interaction Force

1
Department of Construction Engineering, Dongyang University, No. 145 Dongyangdae-ro, Punggi-eup, Yeongju-si 36040, Republic of Korea
2
Civil Engineering Office, Seoul Metro, No. 5, Hyoreong-ro, Seocho-gu, Seoul 06693, Republic of Korea
3
Department of Architectural Engineering, Gachon University, Seongnam-si 13120, Republic of Korea
*
Author to whom correspondence should be addressed.
Appl. Sci. 2025, 15(7), 3915; https://doi.org/10.3390/app15073915
Submission received: 20 February 2025 / Revised: 28 March 2025 / Accepted: 31 March 2025 / Published: 2 April 2025
(This article belongs to the Special Issue Advances in Railway Infrastructure Engineering)

Abstract

:
Rail corrugation causes various problems such as a decrease in ride comfort due to aggravation of train noise and vibration, and an increase in the amount of track component maintenance due to the amplification of the track impact. Most of the preceding research on rail corrugation has been conducted on the causes and characteristics of rail corrugation, but there are no countermeasures or management plans for existing rail corrugation. In this study, dynamic track response measurement results are analyzed. The dynamic wheel load, rail acceleration, and displacement of the rails and sleepers due to rail grinding were reduced by approximately 48%, 18%, and 12%, respectively. The analysis model was confirmed to be appropriate by comparing the measured and analyzed values of the dynamic wheel load before and after rail grinding in the section where rail corrugation occurred. Additionally, a maintenance method for rail corrugation was proposed considering the wheel–rail interaction force by calculating the appropriate grinding amount (upper and lower limit) for each train speed.

1. Introduction

Recently, various rail surface damages have occurred in urban railways during operation, with an increasing trend in rail corrugation. This issue has caused problems such as reduced riding quality and track impact. Maintenance for rail corrugation has largely relied on visual inspections by inspectors, with qualitative evaluations of the rail’s condition. Consequently, the appropriate extent of rail grinding has not been evaluated, but grinding has instead been performed repeatedly without proper assessment.
In Korea, Kong [1] conducted field measurements on the Seoul Metropolitan subway for research on rail corrugation, analyzing its causes using frequency analysis based on the collected data. Seo [2] studied appropriate rail surface management methods by analyzing wheel–rail interaction and examining the impact of rail grinding on the dynamic track interaction force through field measurements. Park [3] proposed a correlation existing between the rail surface quality index and track dynamic force, considering train load, and suggested a draft for a general railway rail grinding standard.
Yang and Jang used the rail roughness value on a high-speed railway line using a vehicle–track dynamic interaction force analysis program to calculate the track impact level and rail bending stress according to the roughness depth. They proposed a high-speed railway rail surface defect management standard [4].
Chae studied the characteristics of the field measurement data on rail corrugation in the sharp curve section of the Gyeongbu High-Speed Railway and proposed a management measure for these sections [5]. Ha and Kim analyzed the correlation between the automatic operation mode of urban railway electric trains and rail corrugation resulting from traction and braking forces [6]. Hwang evaluated rail polishing effectiveness and performed wheel–rail interaction force analysis based on measured roughness data, predicting actual train passing tonnage [7]. Lee et al. analyzed the types and causes of corrugation occurring on the rail surface. They also analyzed the occurrence status and characteristics of rail corrugation occurring in high-speed railway sections [8].
Ko et al. [9] conducted indoor tests on used and new rails in the Seoul Metro operating section and proposed the optimal amount of grinding and grinding cycle for urban railway rails based on the test results. It was suggested that initial grinding be performed when the thickness is 0.3 mm or more, and maintenance grinding be performed when a rail defect occurs. Park [10] conducted related research to develop a rail corrugation measurement system and analysis software. The analysis was based on the weight, measurement speed, size, resolution, and measurement range of rail corrugation measurement systems used overseas. Seo [11] examined the change in surface roughness through rail grinding in a high-speed railway operation section and analyzed the optimal number of rail grinding cycles by comparing the quality and effect based on the number of grinding cycles with international standards. The effects of roughness on the wheel–rail interaction force were analyzed using a dynamic wheel–rail model. As a result, a rail surface management method that takes into account the characteristics of the operating track can reduce rail surface defects and track damage by reducing dynamic track interaction forces.
Overseas studies on rail corrugations have also been conducted. Grassie analyzed dynamic loads generated by initial roughness, which, in connection with driving, friction elasticity, and creep at the wheel–rail contact point, cause deformation of the initial wavelength. He further noted that the wheel–rail contact direction acts vertically and horizontally, with corrugation progressing due to dynamic loads [12]. Collettea et al. [13] conducted time and frequency studies on rail roughness in a curved ballasted track in the Paris Réseau Express Régional commuter train network. It was found that suppressing both the vertical and lateral sleeper resonances has a positive effect on the mitigation of both types of rail corrugation. Grassie and Meehn et al. [12,14] presented analytical and numerical models to investigate rail corrugations. The comparison of numerical and experimental observations, along with the results related to sleeper spacing, confirmed that a more in-depth analysis of the parameters contributing to growth via vehicle–track vibration dynamics is necessary when complex modal interactions, such as those due to sleeper passage effects, are evident. Wang et al. [15] proposed a non-Hertz dynamic wheel–rail adhesion model for trains passing over wet curved tracks, taking into account wheel–rail surface roughness. Furthermore, numerical analysis showed that the influence of the yaw angle on general contact solutions, such as contact patch shape, size, and stress distribution during rolling contact simulation, was insignificant. Shi et al. [16] designed an optimized rail profile to improve the dynamic performance of subway vehicle–rail systems, considering worn wheel profiles and curved tracks. They confirmed that the use of the optimal profile reduced the rail wear depth on the lower rail of the curved track. Ma et al. [17] numerically analyzed the dynamic resonance and the influence of multiple flexible wheelset–rail interactions on rail corrugation in high-speed railways. As a result, it was confirmed that wheelset flexibility had a limited effect on vertical force resonance.
While much of the prior research on rail corrugation has focused on its causes and characteristics, there has been limited research on the maintenance and management of rail corrugation, particularly in terms of wheel–rail interaction. Therefore, this study examines the current status and management of rail corrugation through field investigations and measurements of rail roughness, dynamic wheel load, acceleration, and displacement before and after rail grinding to analyze the impact of wheel–rail interaction on the track. In addition, based on the analyzed data, the rail grinding priority and a rail corrugation maintenance method are proposed.

2. Materials and Methods
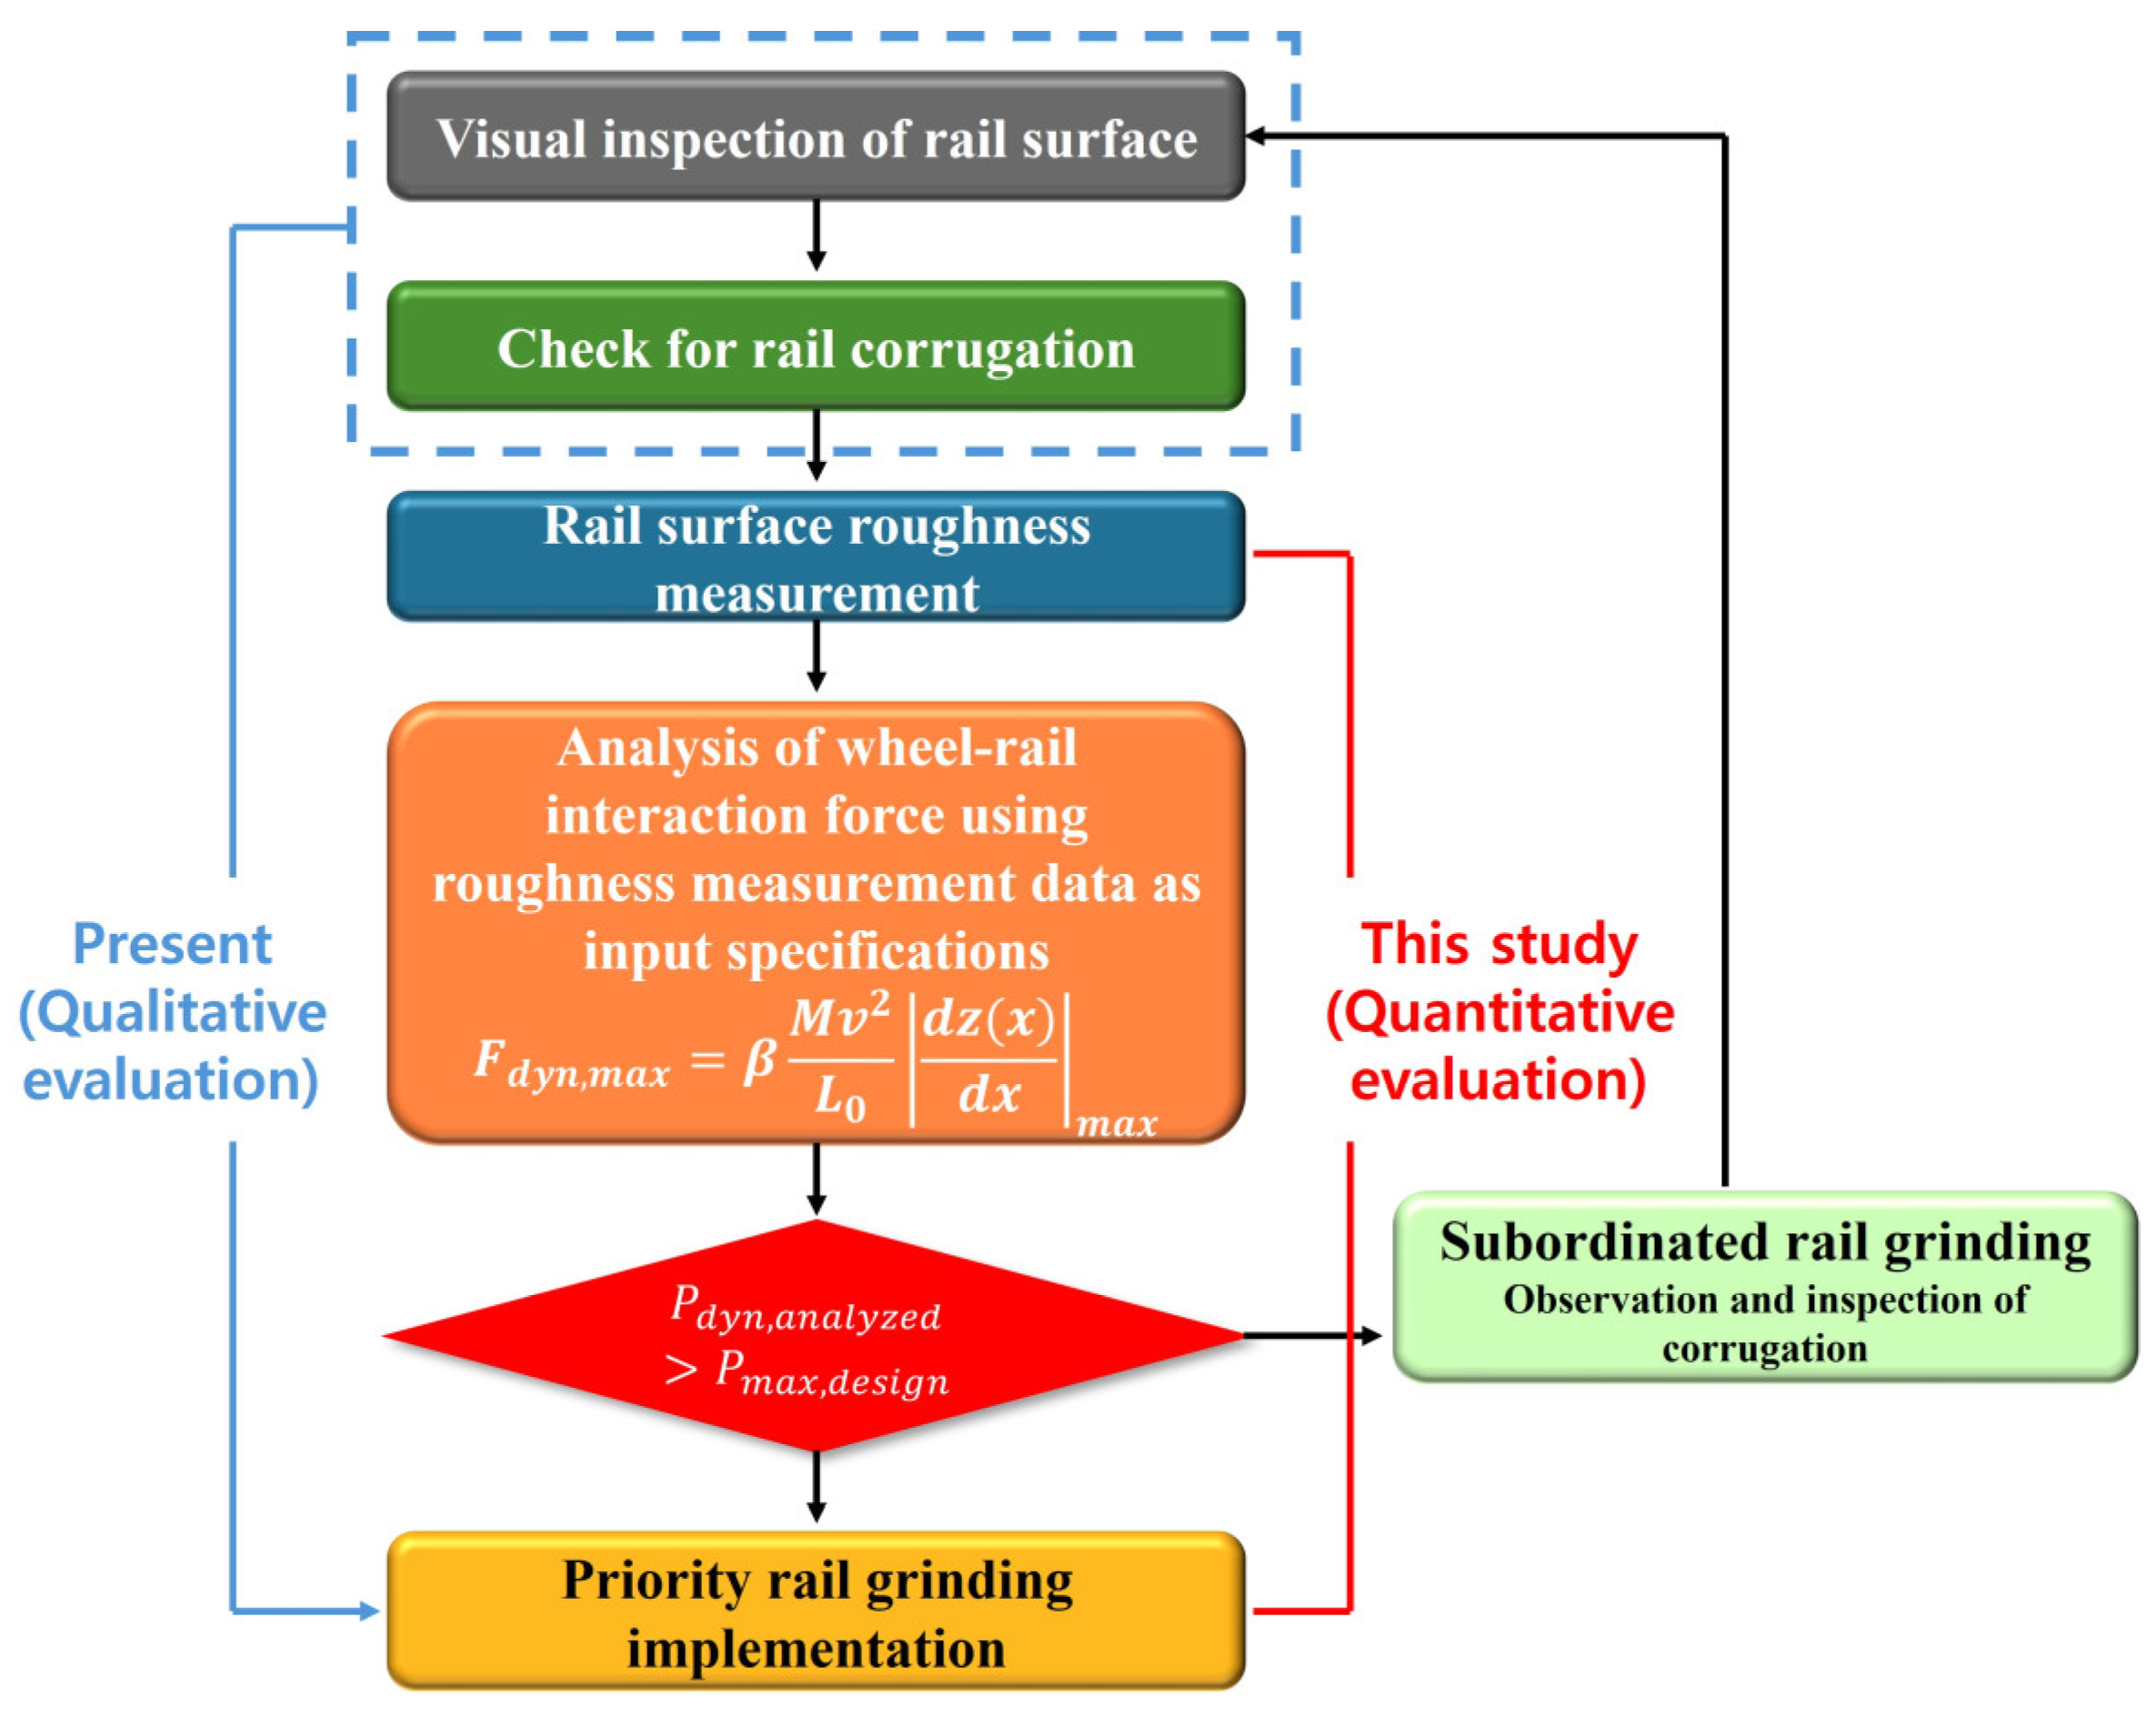
2.1. Overview

This study measured surface roughness of the rail and dynamic response of the track before and after grinding on the intervals of the metropolitan subway track that is under operation in South Korea. The characteristics of the tested track are presented in Table 1. The track was a type of STEDEF (sleeper floating track) within a tunnel and located near the station (which is a deceleration section). The sleeper spacing was 625 mm; operation speed was approximately 68–70 km/h; and annual tonnage was about 18 MGT [18].
Two closely located rail sections with different corrugation levels according to visual inspection were selected, as shown in Figure 1a,b. Section A had a relatively lower corrugation level than Section B. Figure 1c,d show the rail before and after grinding, respectively. Note that the current Korean regulation determines the necessity of rail grinding based on qualitative evaluation from visual inspection.
Photos of the instrument measuring rail surface roughness (RAIL-104 PROF) and the working scene are shown in Figure 2. Rail roughness was measured before and after grinding the rail corrugation section using RAILPROF, as shown in Figure 2b. The length of RAILPROF is 1160 mm and the measurement length is 1000 mm. The measurement interval is 5 mm, and two hundred measurement values can be obtained in one measurement.
The rail corrugation was measured at three locations with intervals of 1.5 m in each section. At every location, the rail corrugation was measured five times. The parameters were applied to Sections A and B as shown in Figure 1a,b.

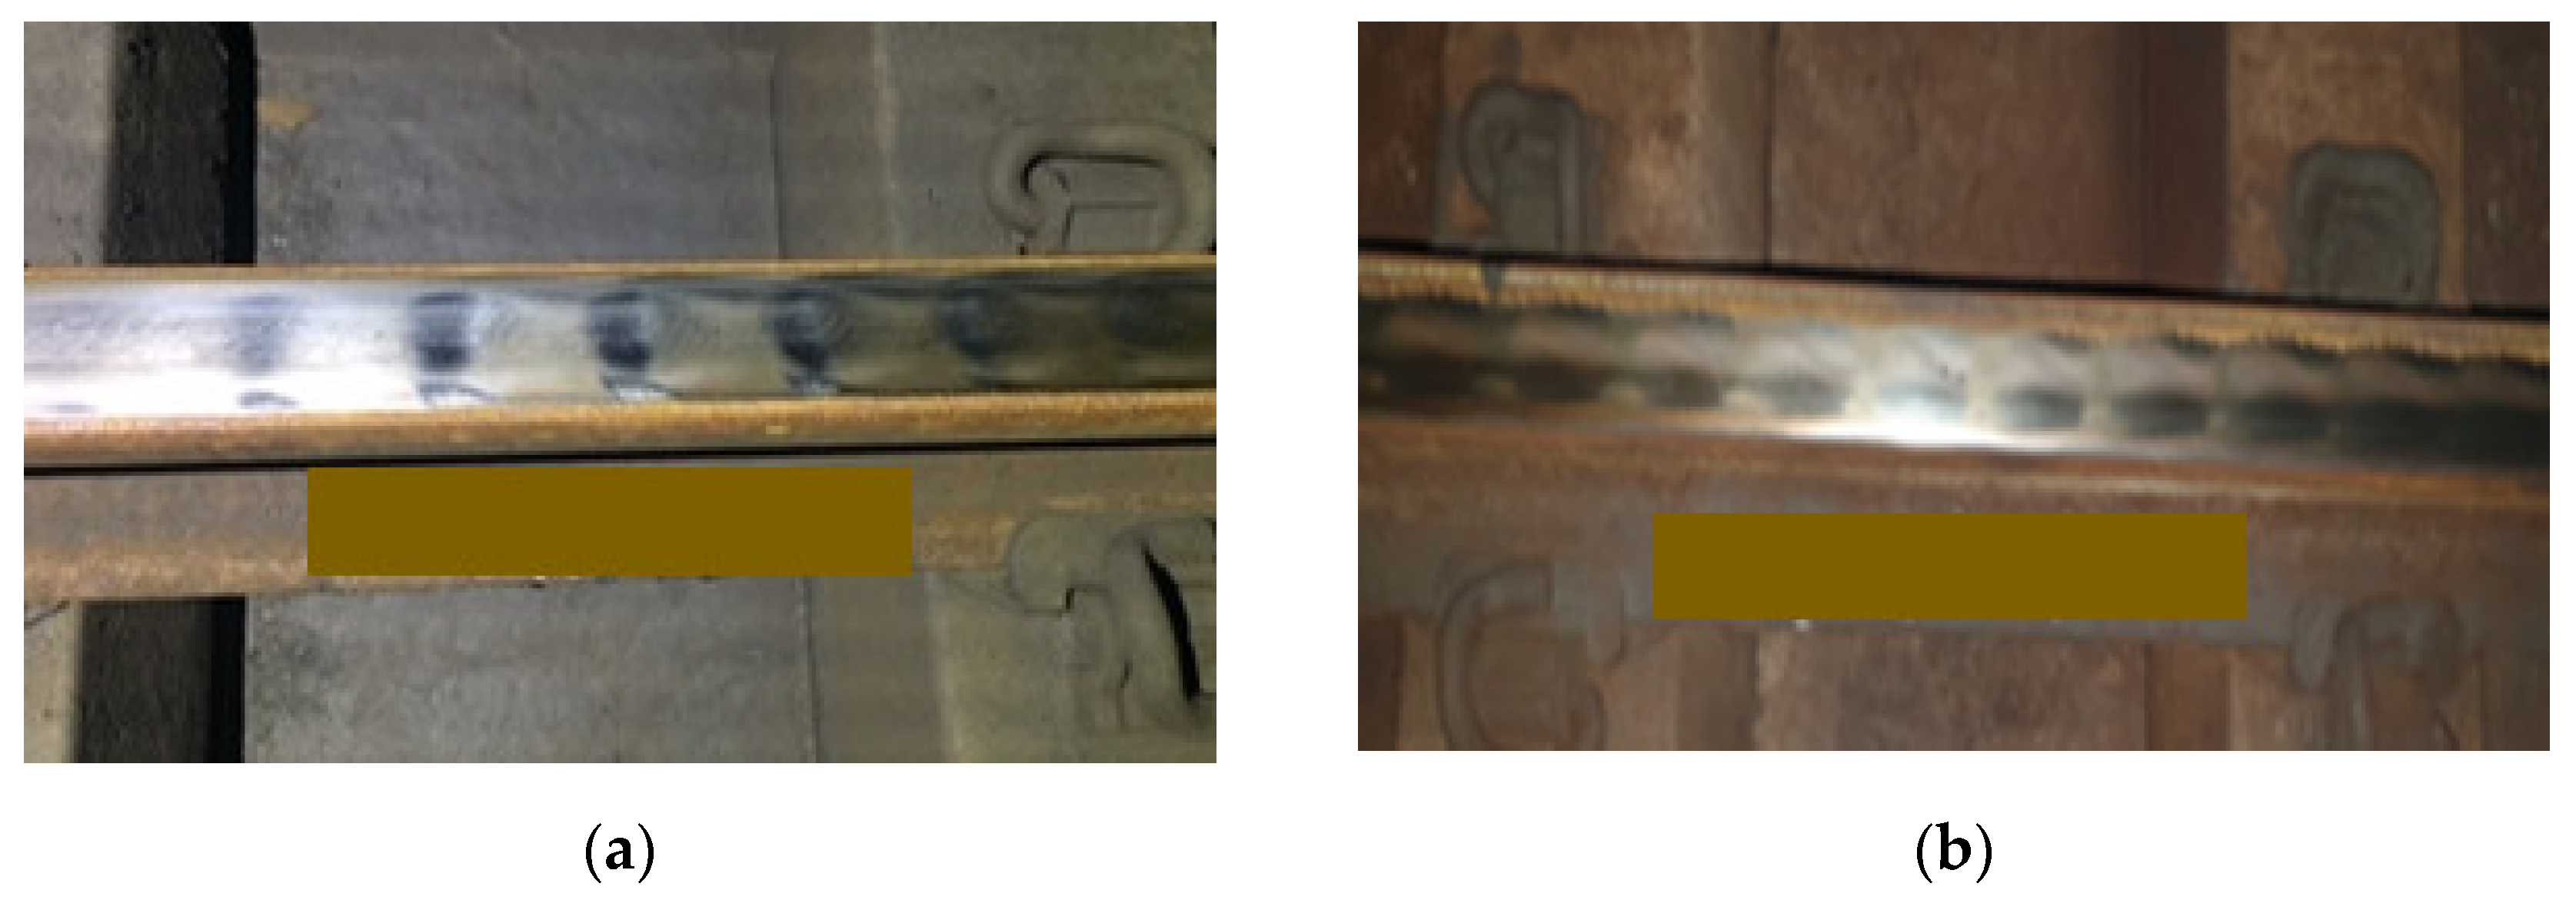
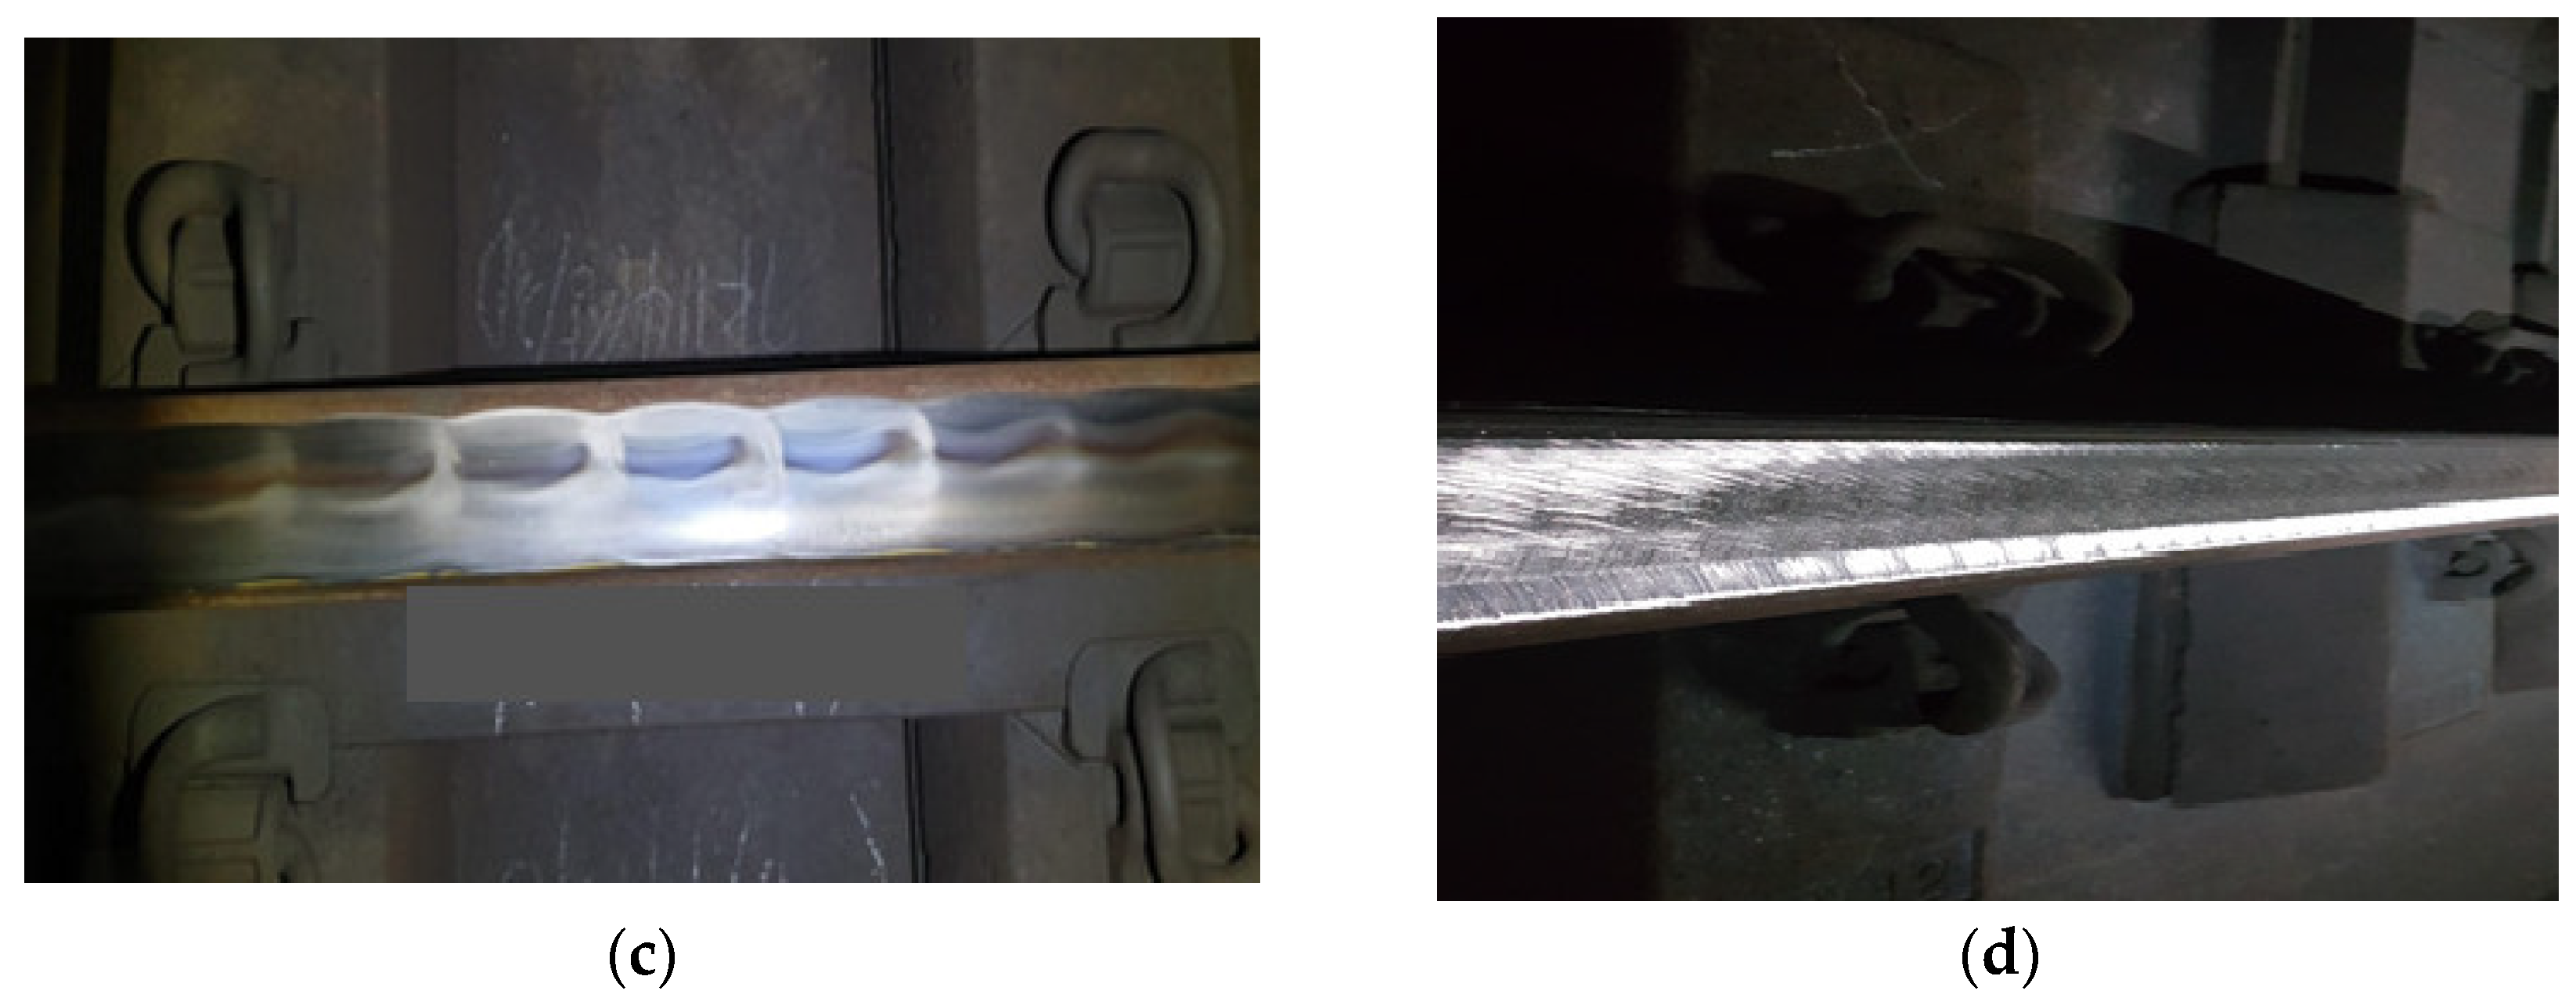
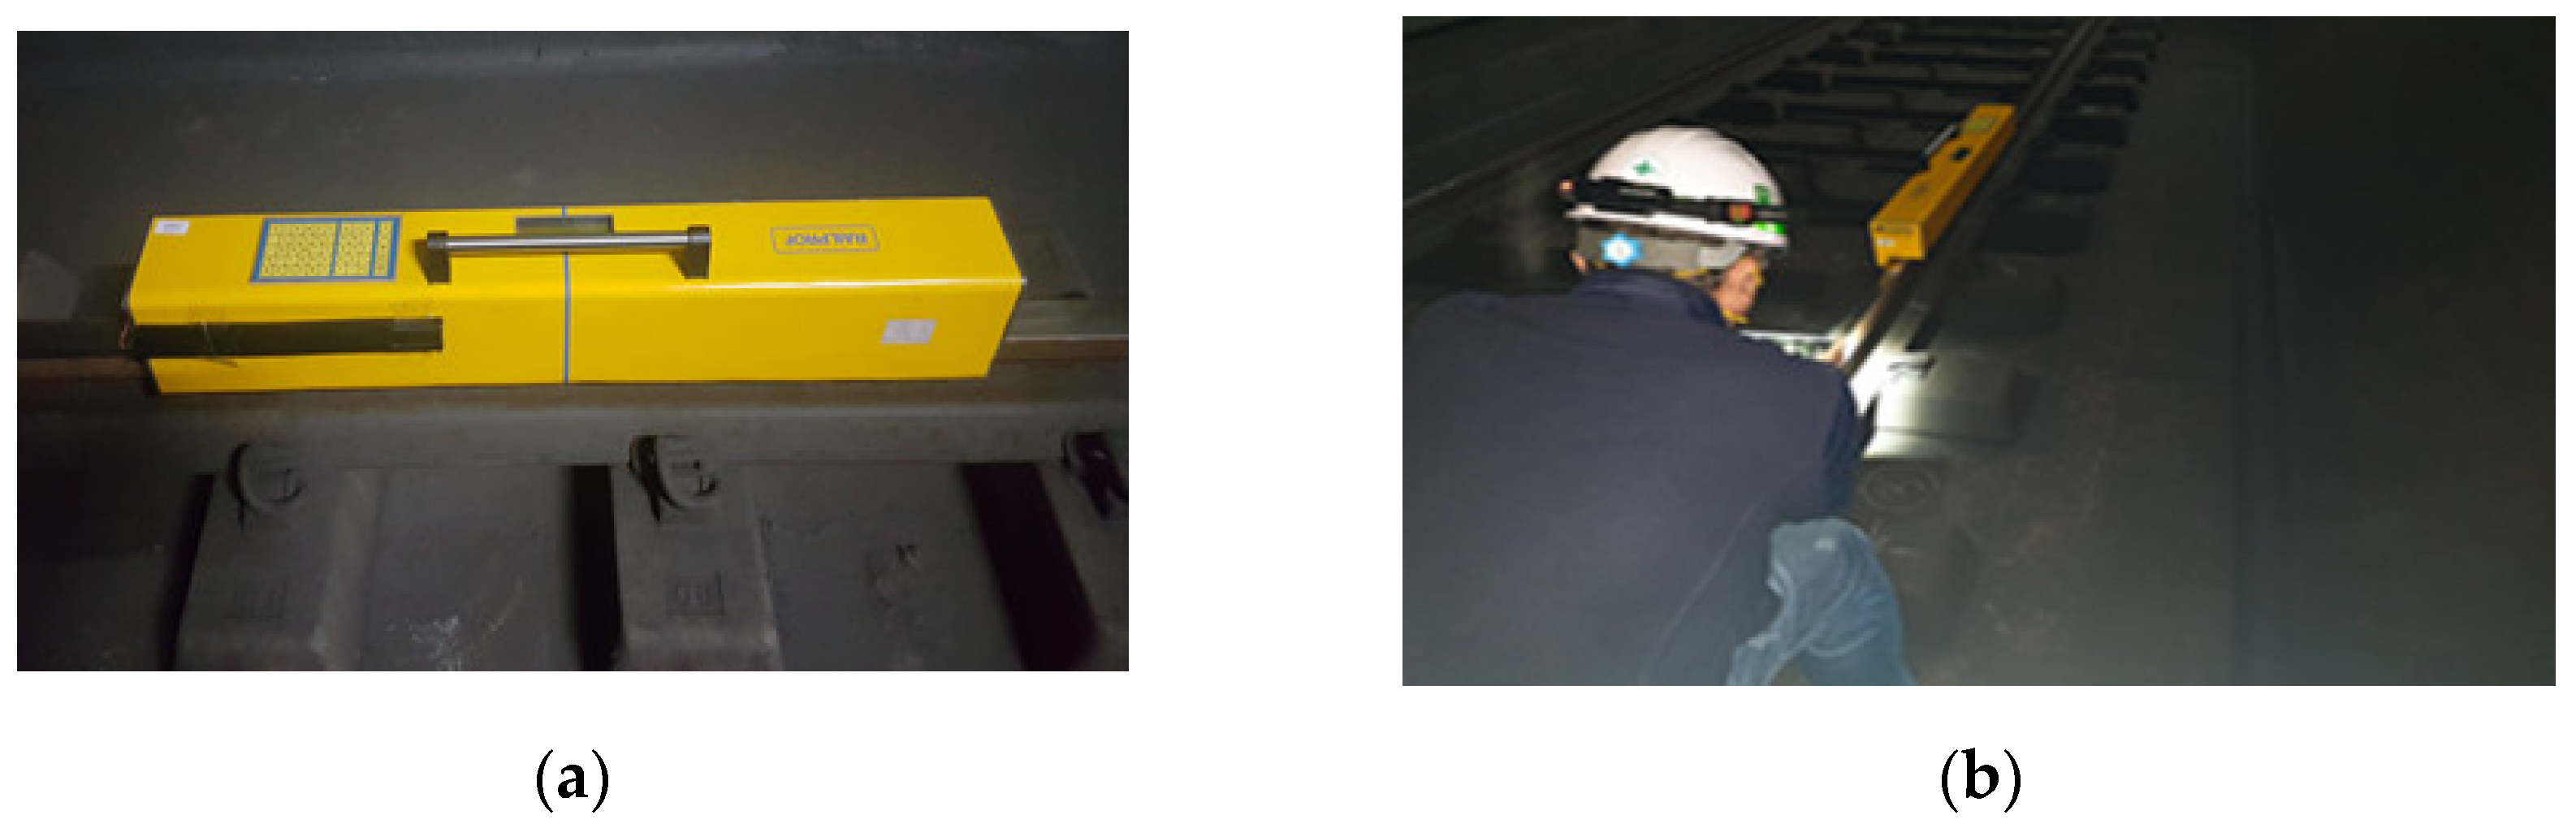
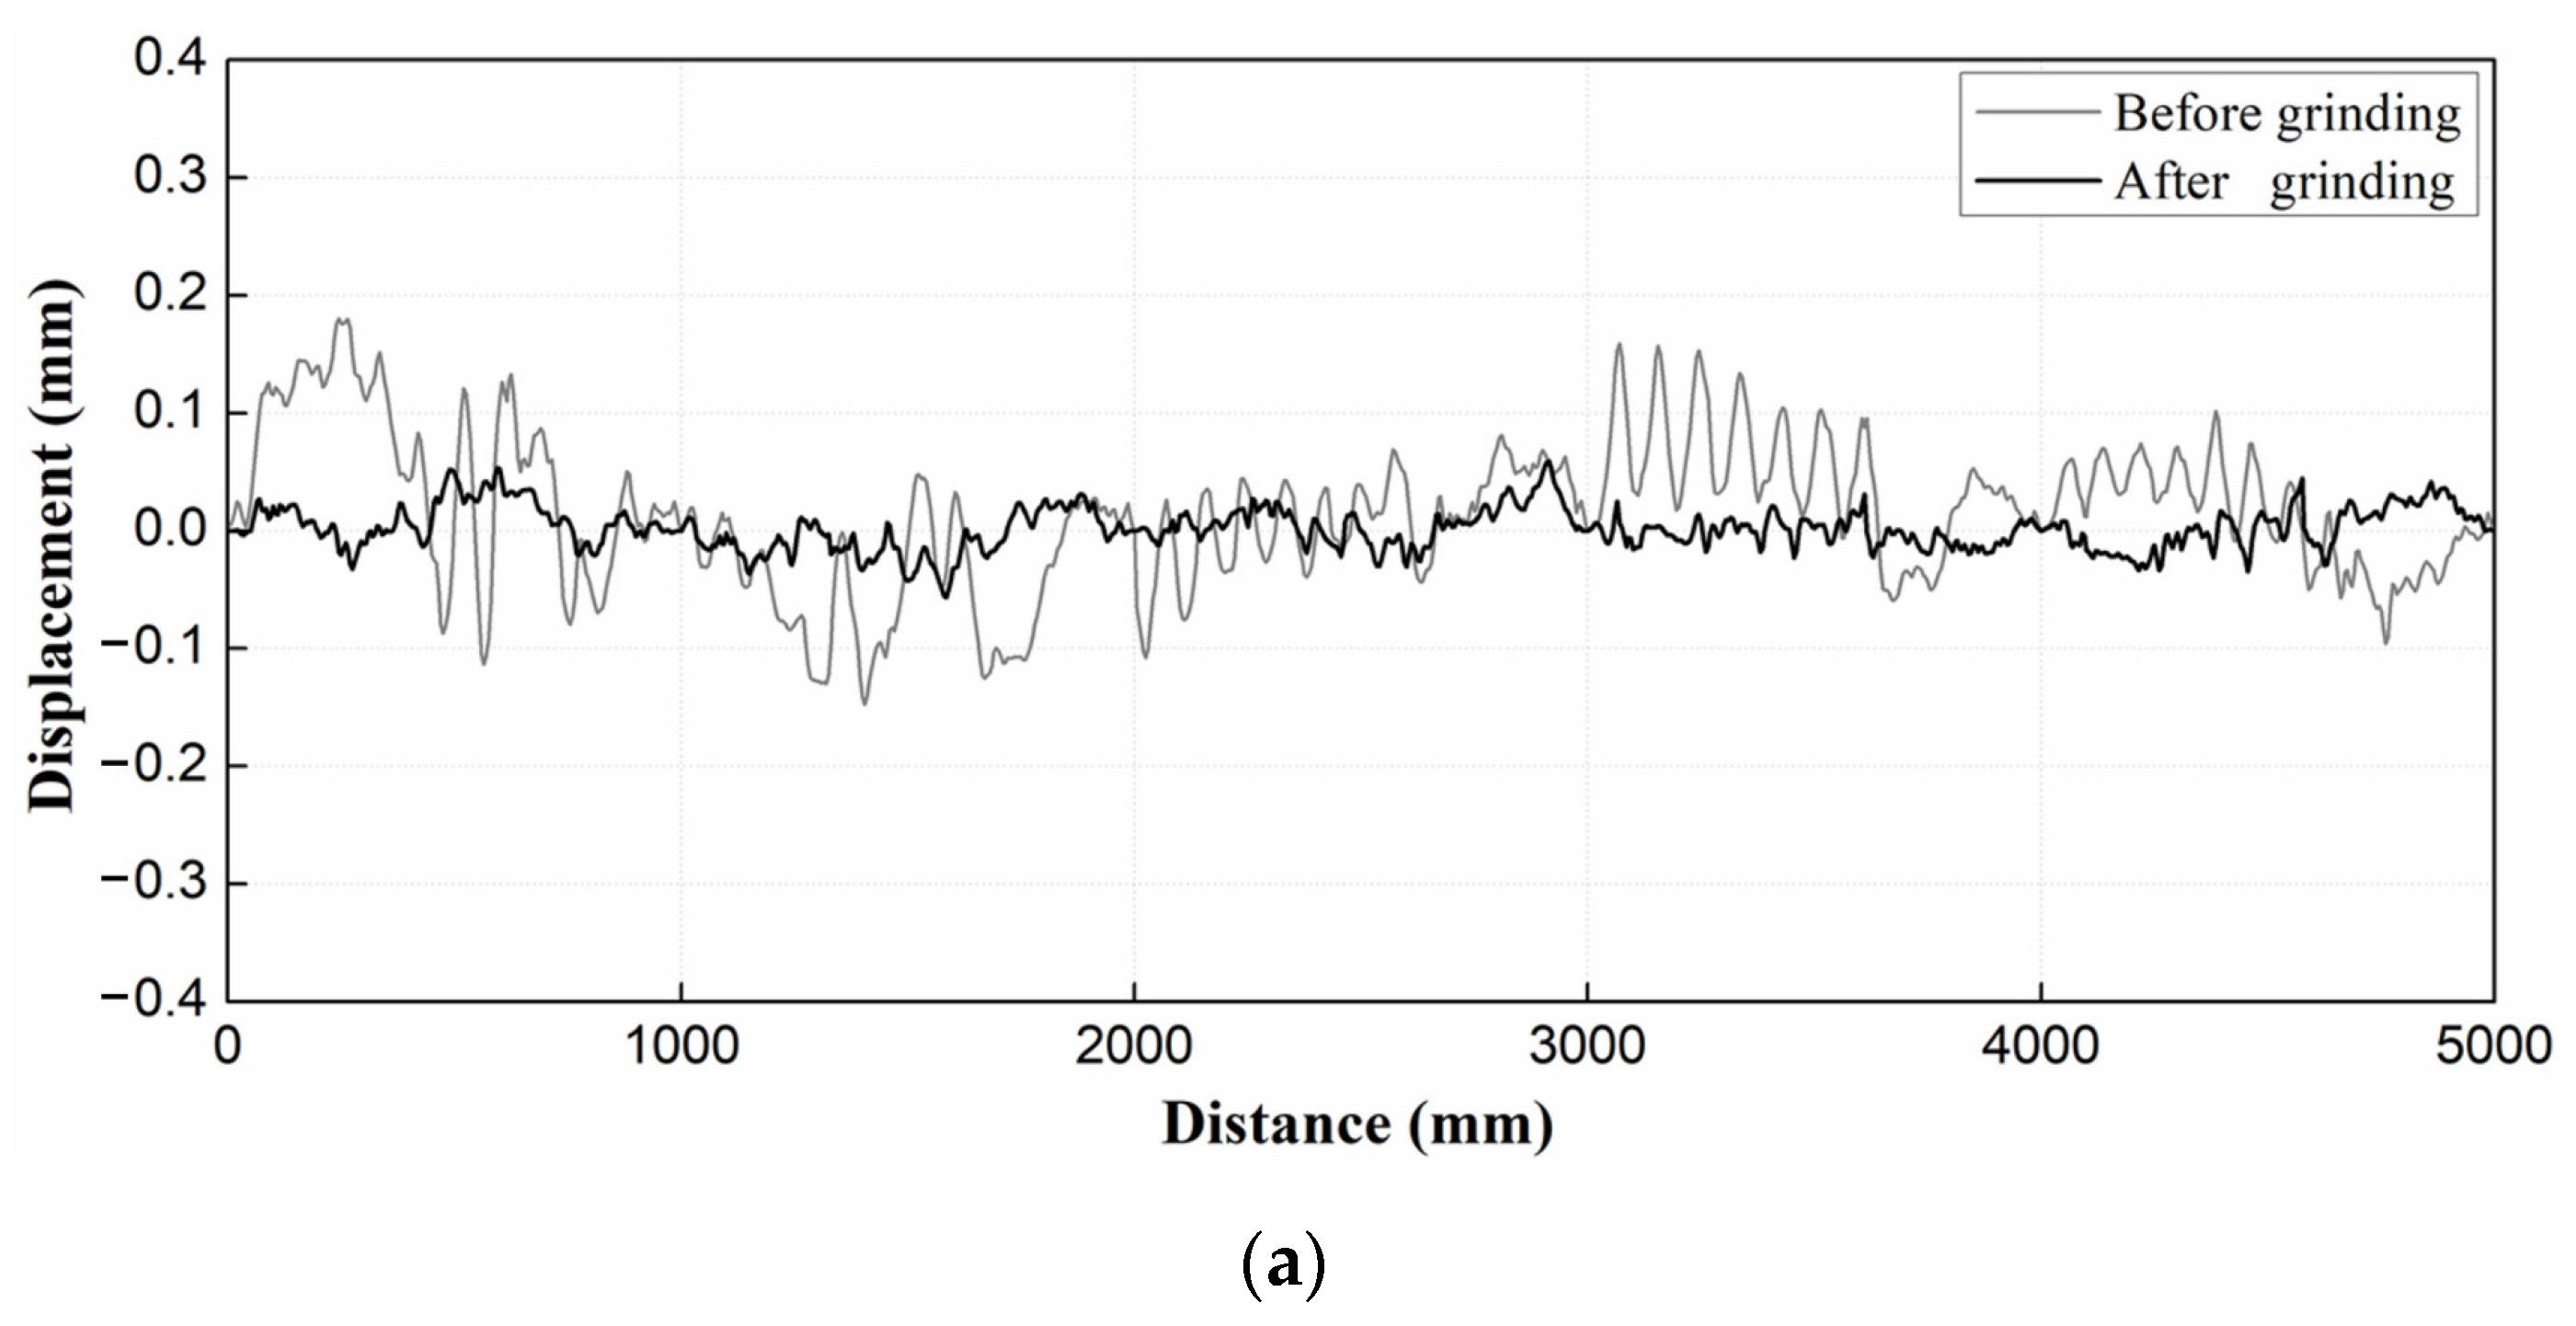
2.2. Rail Surface Roughness

The rail grinding car was composed of two vehicles with two units on each vehicle, as shown in Figure 3. Each unit had four grinding stones. Therefore, a total of 16 stones were used. The grinding car and a rail grinding stone are shown in Figure 3b and 3c, respectively. Details on the grinding car and grinding stones are presented in Table 2. Stones A and B had diameters of 180 and 260 mm, respectively, and were capable of grinding angles of (−)20–(+)15° and (−)70–(−)5°, respectively. The grinding speed was 2–8 km/h, and ordinary speed was approximately 60 km/h.
To examine the impact of rail corrugation on the track, measurements were taken before and after grinding the rail corrugation section. The tests were conducted on an 8-car train. The measurement was performed 10 times consecutively at the same time using the measurement in Figure 4 for an operating train. The measured items were dynamic wheel load, vertical rail acceleration, and vertical displacement of rails and sleepers. Vertical rail displacement and sleeper displacement were measured using displacement transducers such as linear variable differential transformers (LVDTs) mounted on a jig anchored on the side bridge inspection passage without the influence of train load. LVDTs (CDP-10M) have a sensitivity of 500 × 10−6/mm, a rated power of 6.25 mV/V ± 0.3%, and a frequency response of 500 Hz. Displacements are measured and recorded automatically by the computer-controlled data acquisition system [19]. The wheel loads were measured using strain gauges. The vertical rail acceleration has a frequency response range of DC-130 Hz, a natural frequency of 240 Hz, and a gravimeter with an acceleration of 5.1 g.

2.3. Results for Surface Roughness

The surface roughness of the straight sections of the urban railway in use, Sections A and B, was measured before and after rail grinding using Railprof, as shown in Figure 5. It can be easily noticed that the displacements significantly decreased and aligned along the zero line after the grinding. Examples of surface roughness measurements for Sections A and B (before grinding and after grinding) are shown in Figure 5. Note that the visual inspection determined that Section B was rougher than Section A, which is somewhat inconsistent with the measurements. In this example, the maximum displacement of Section B is approximately 0.2 mm, which is slightly larger than that of Section A (0.16 mm). This proves that evaluation of rail surface roughness based on visual inspection may not be appropriate.

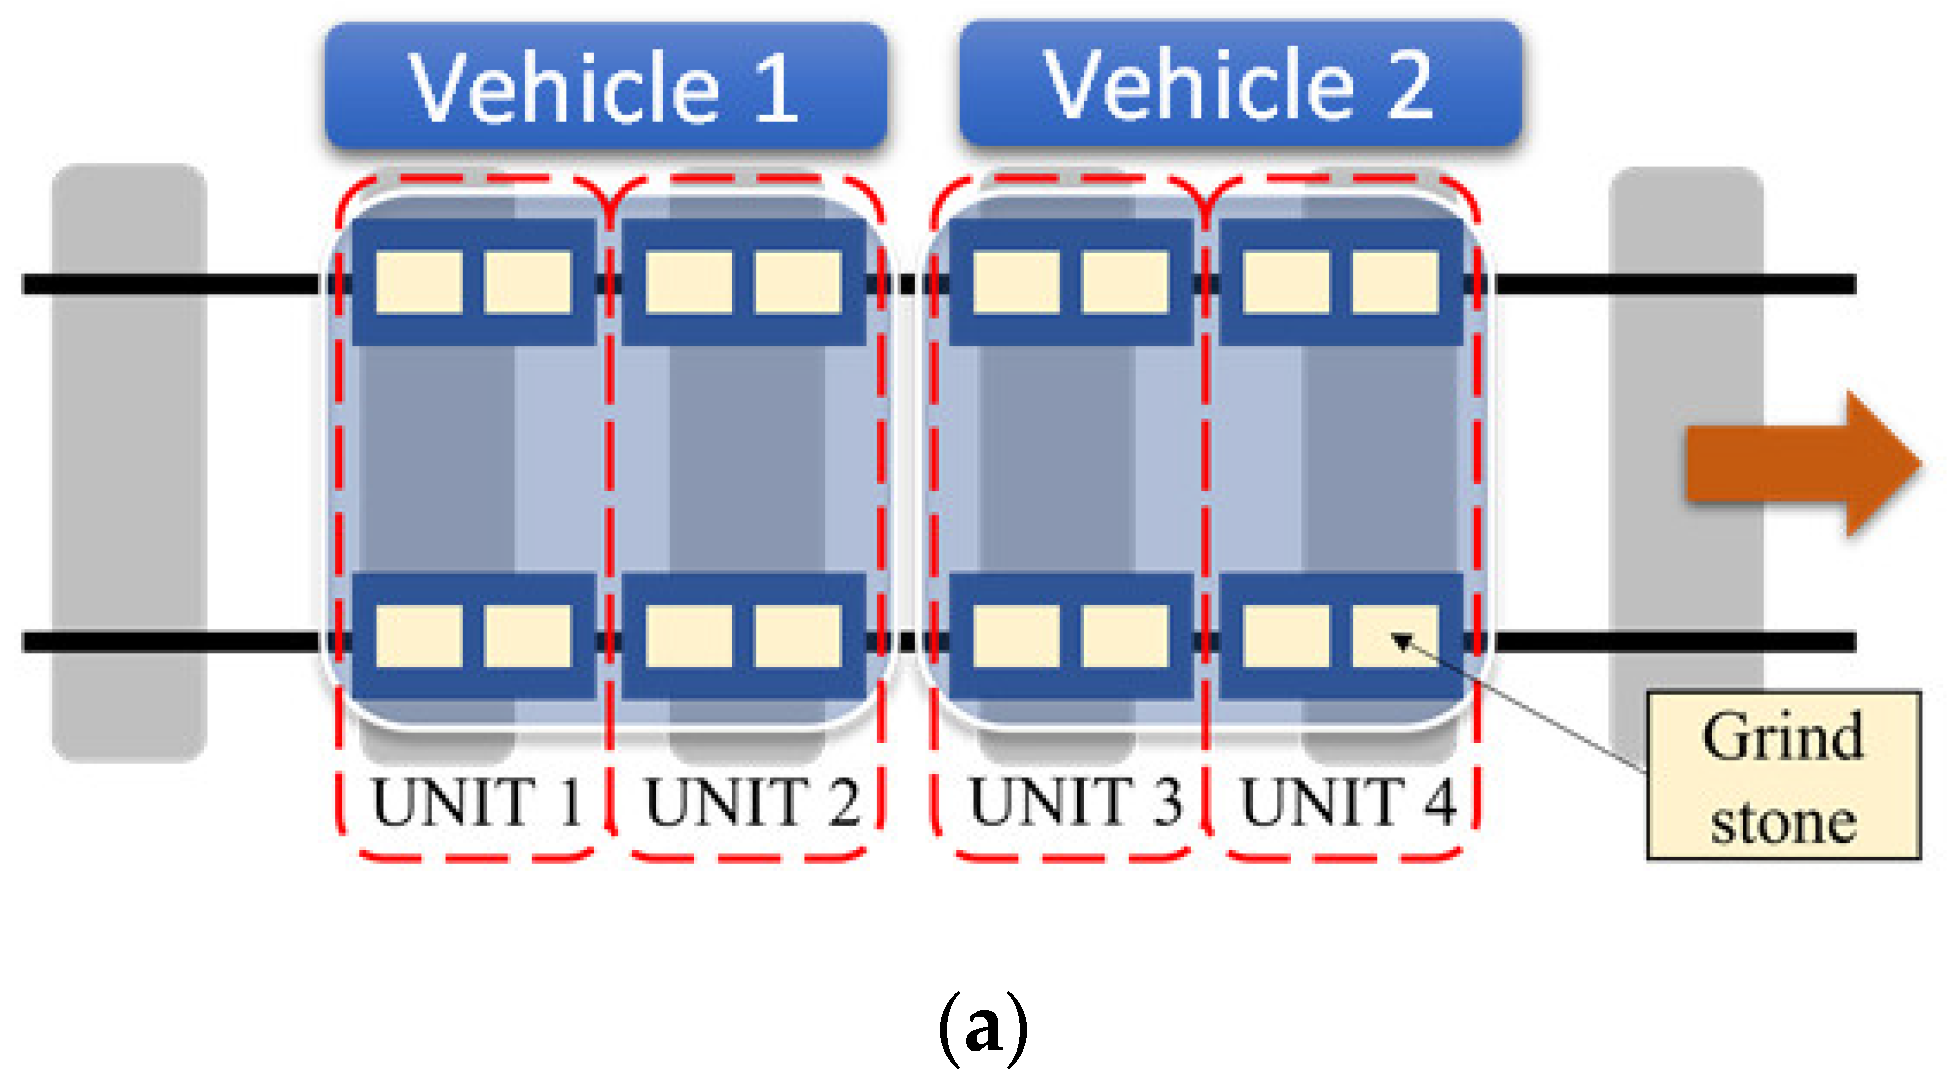
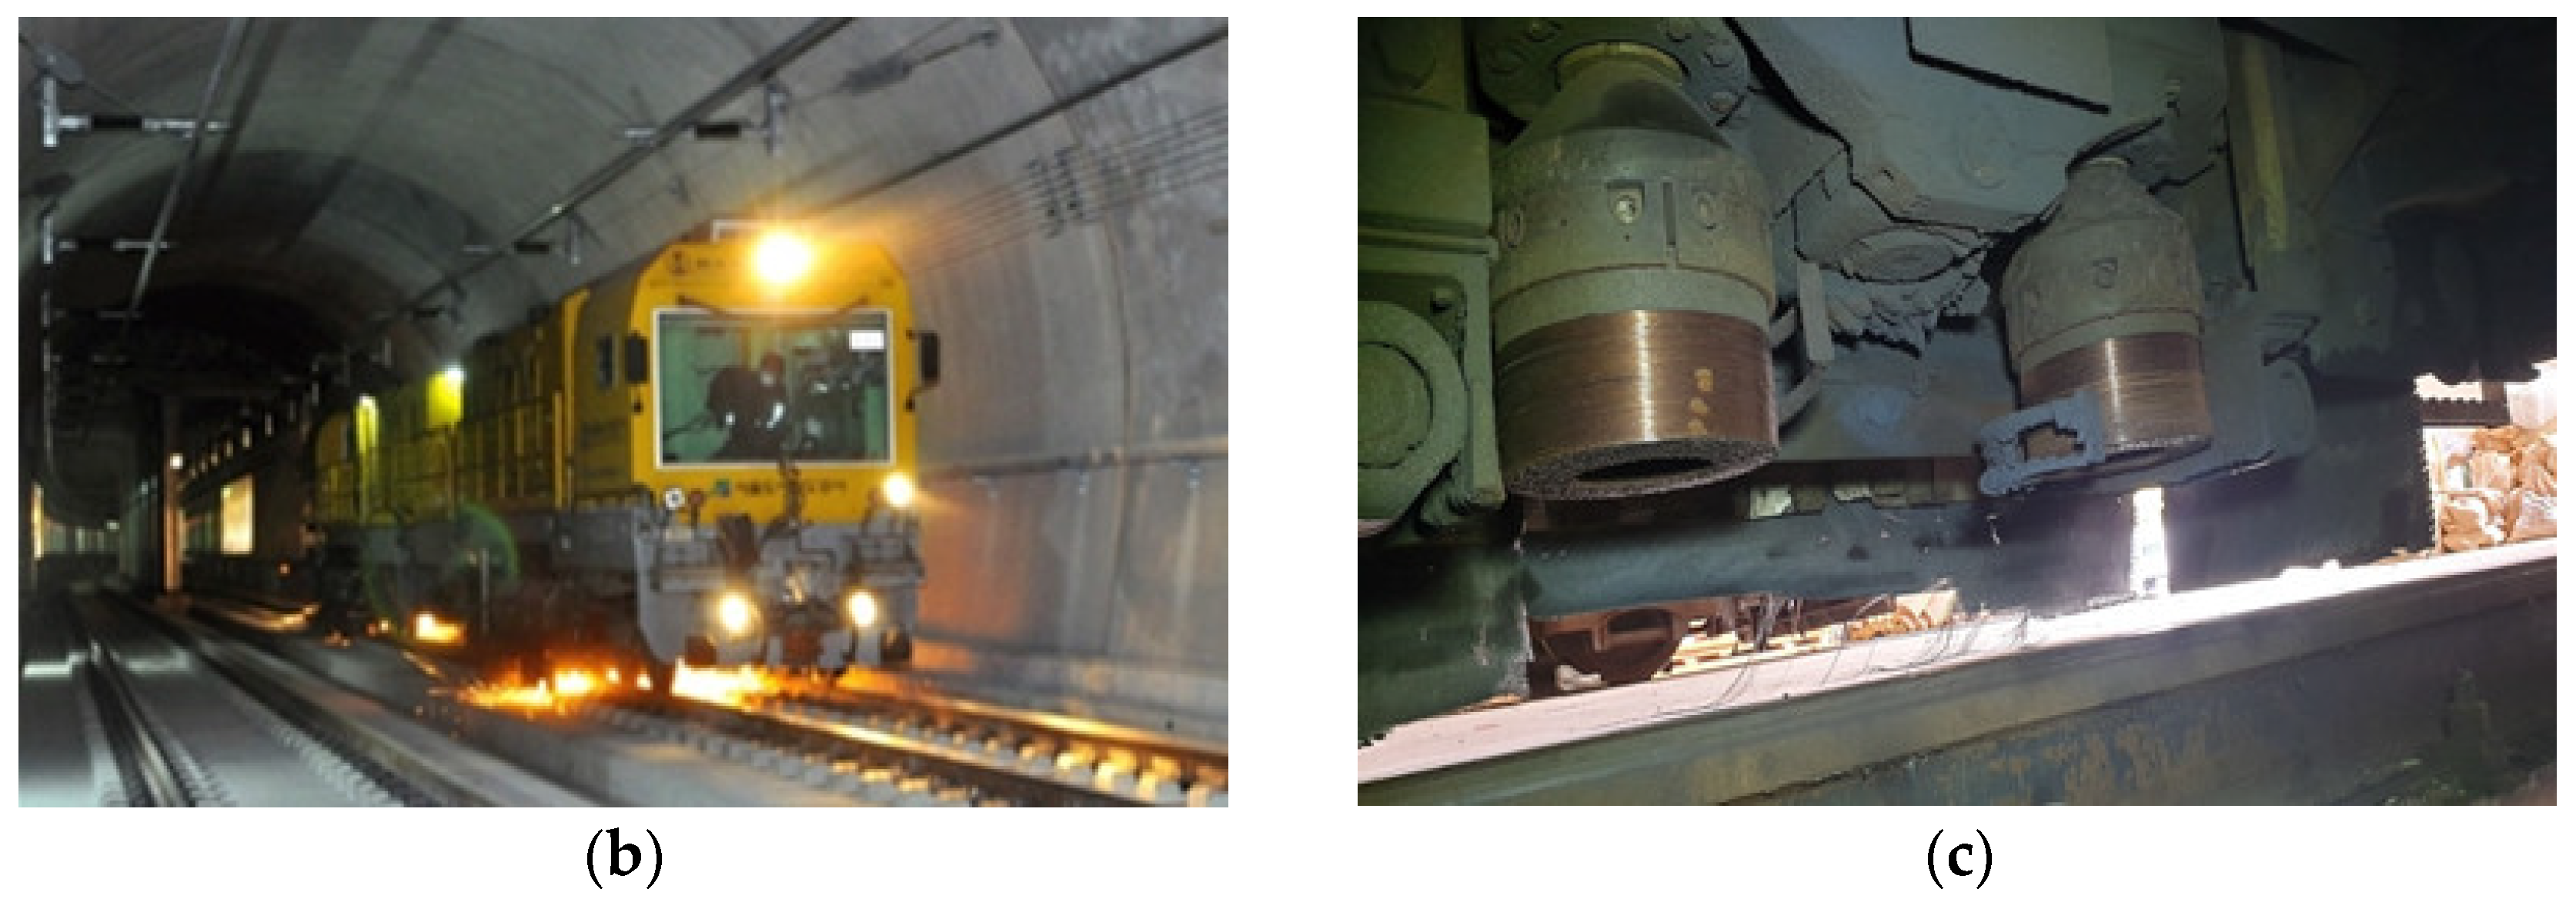
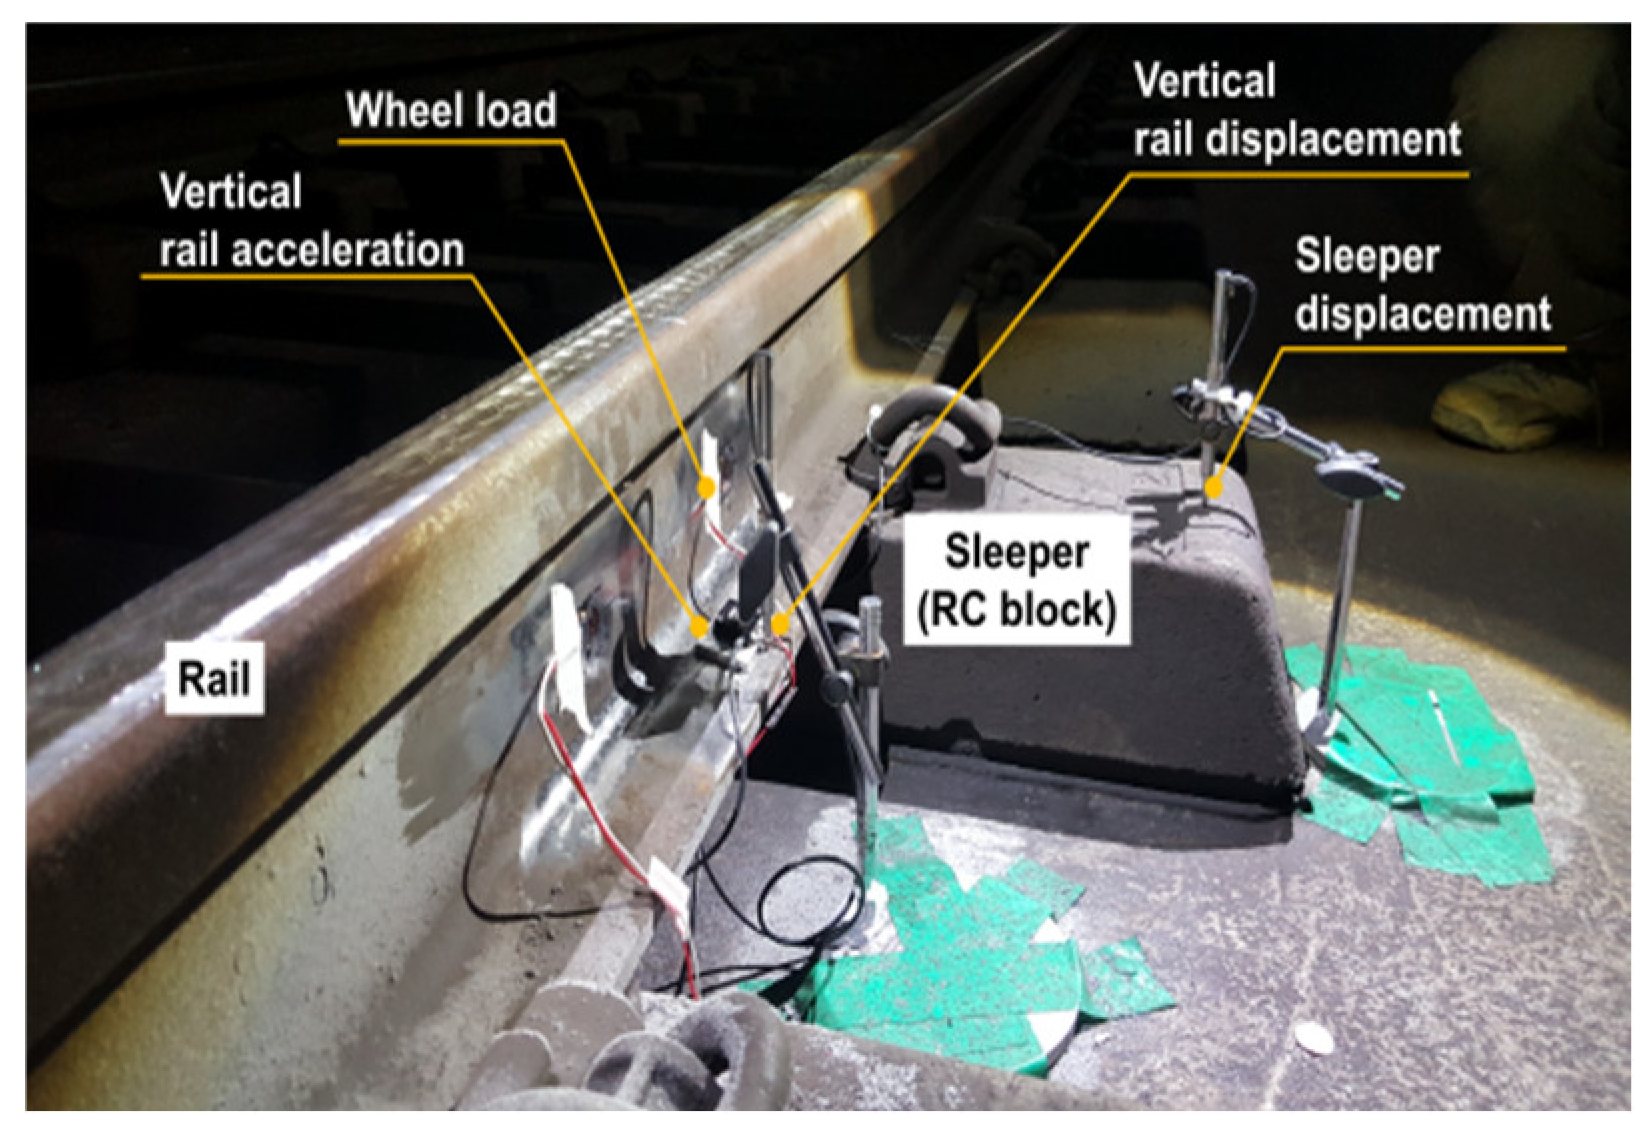
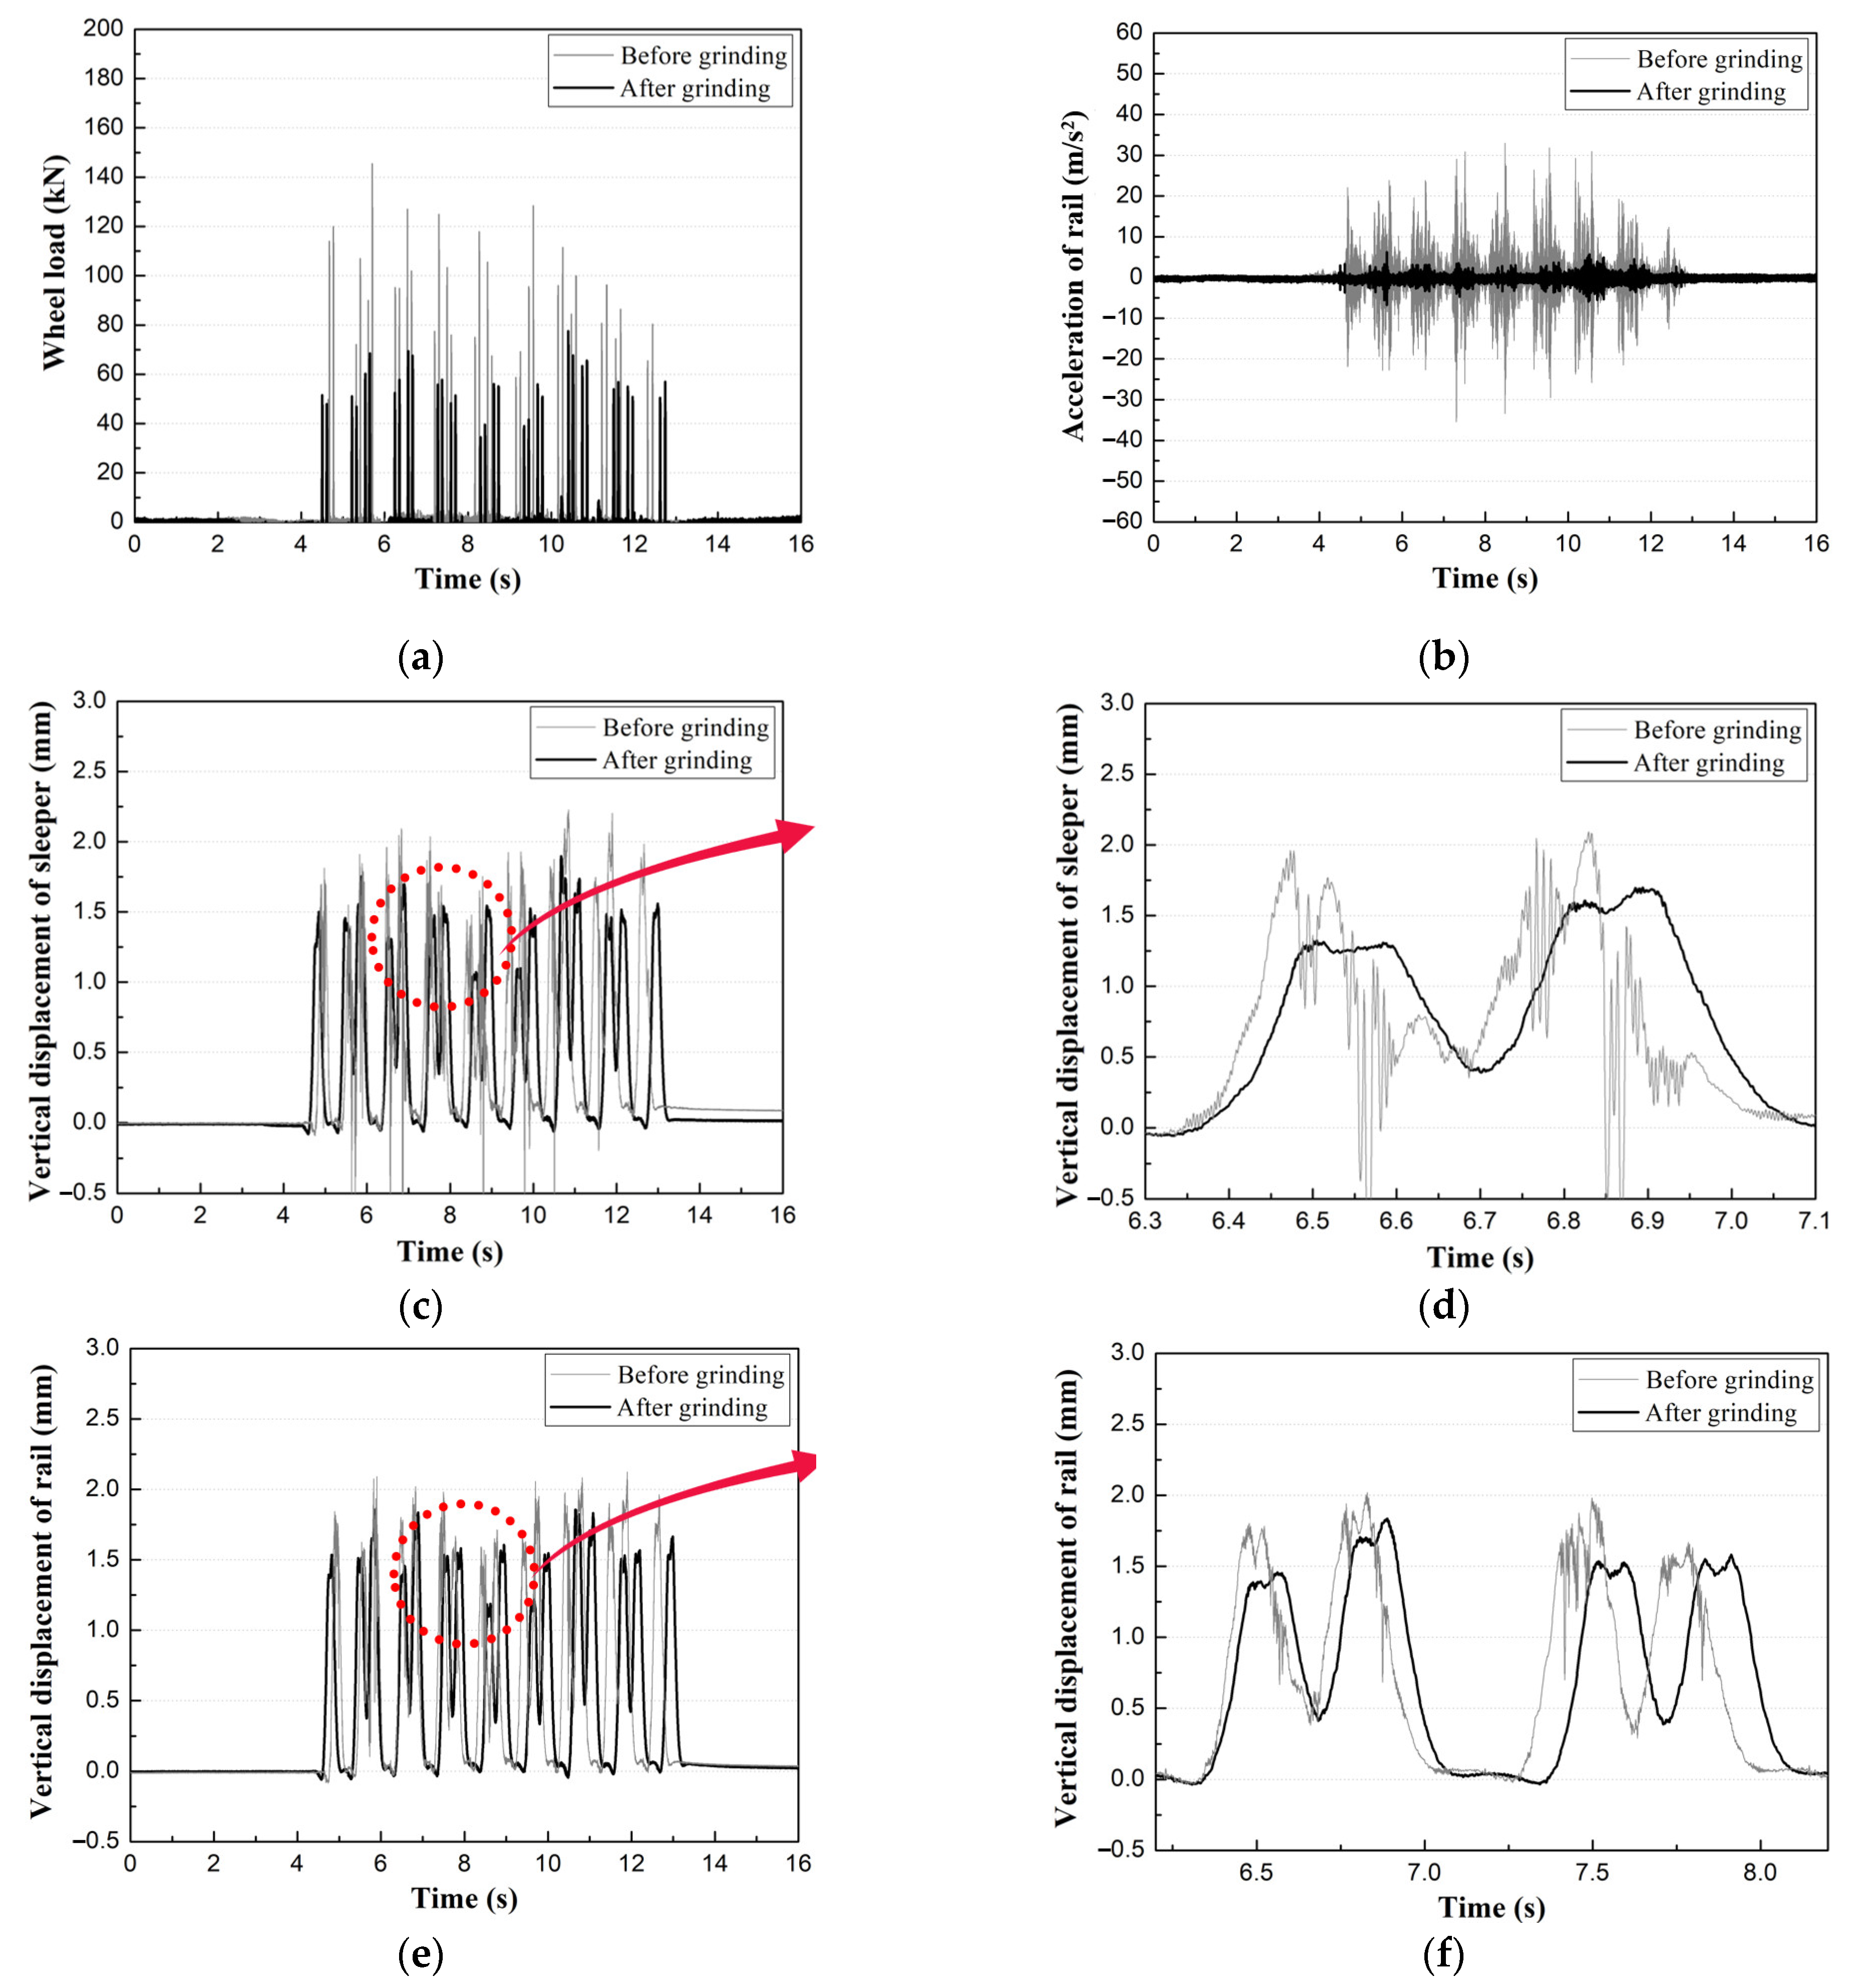
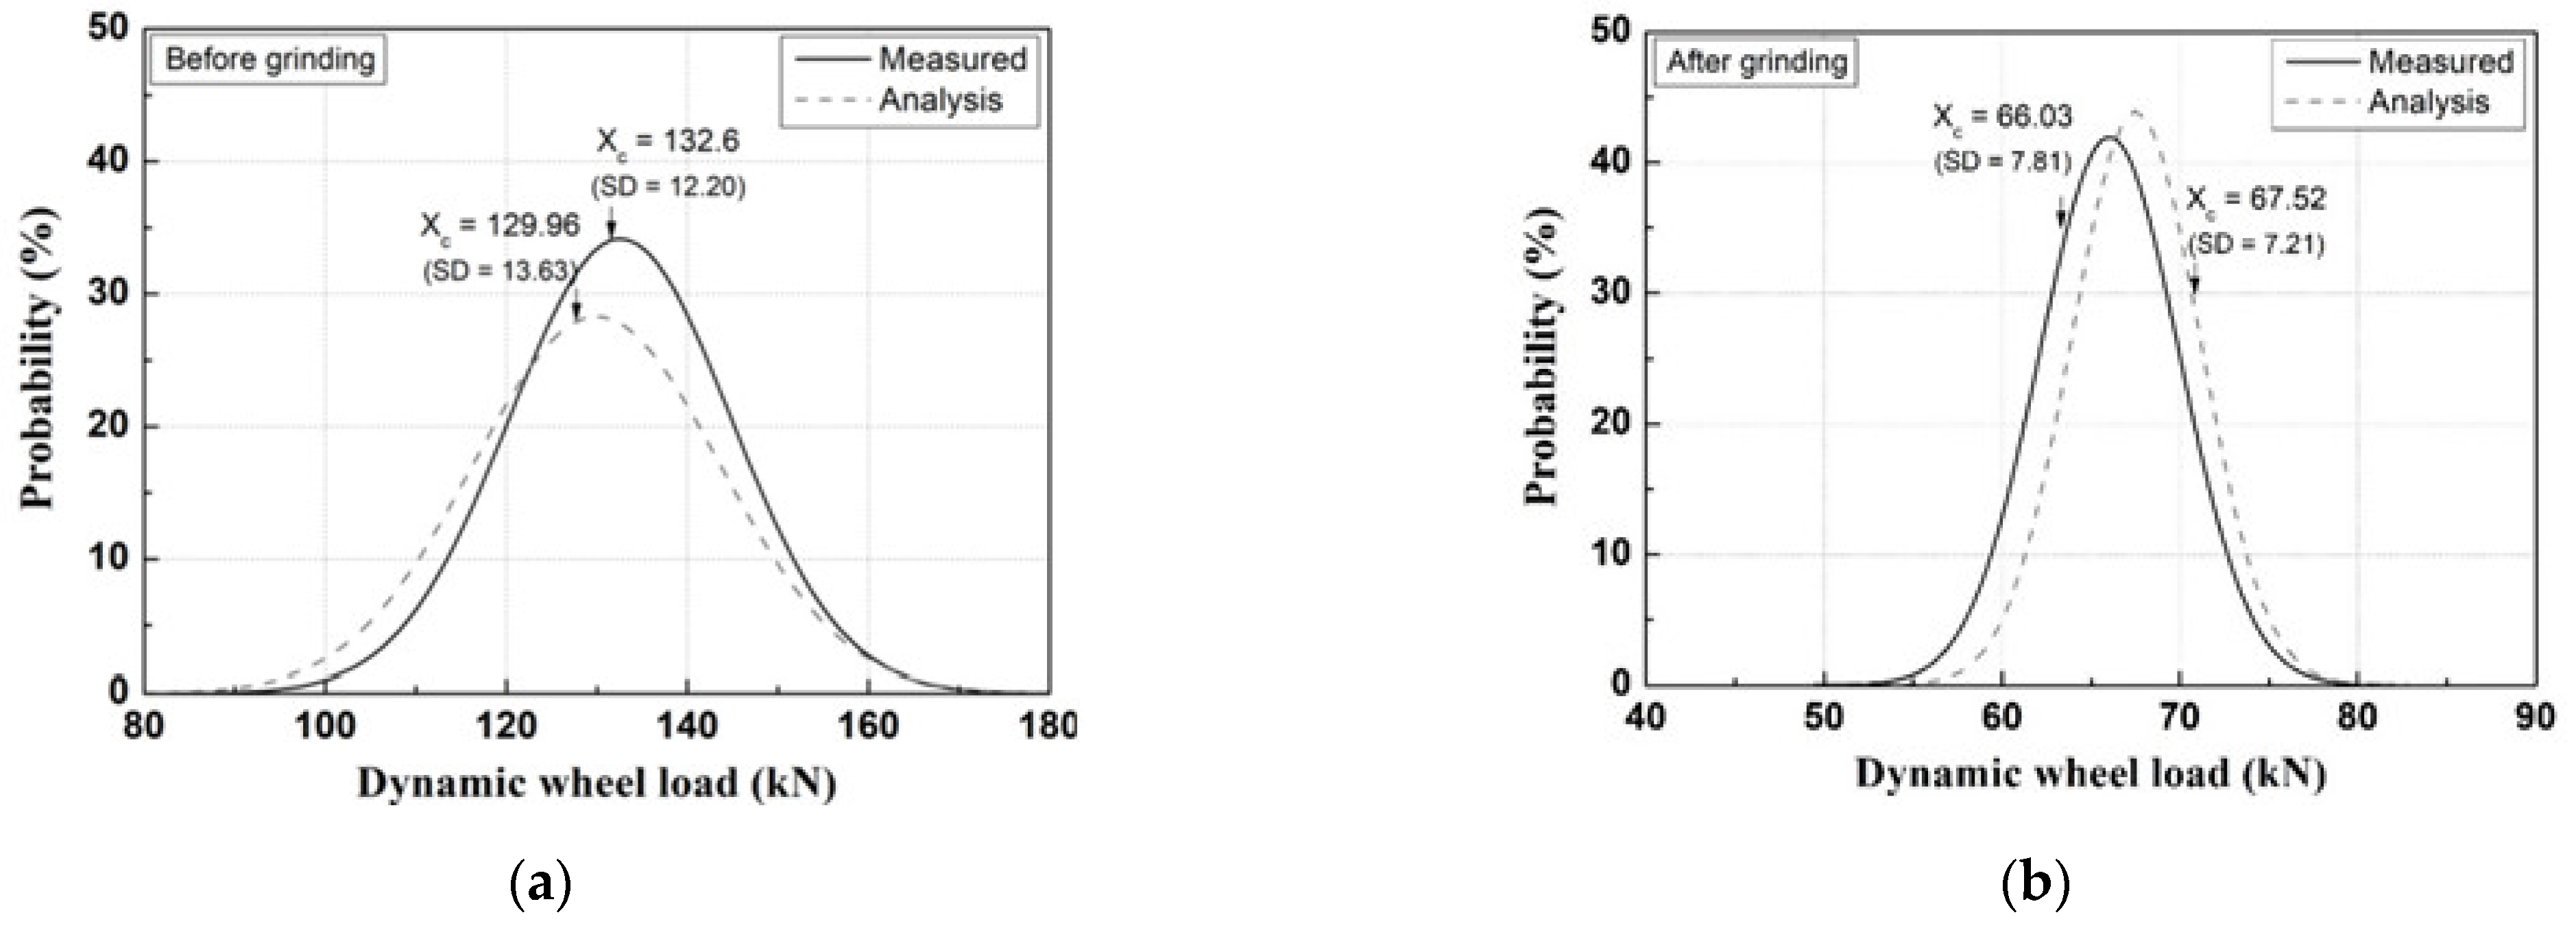
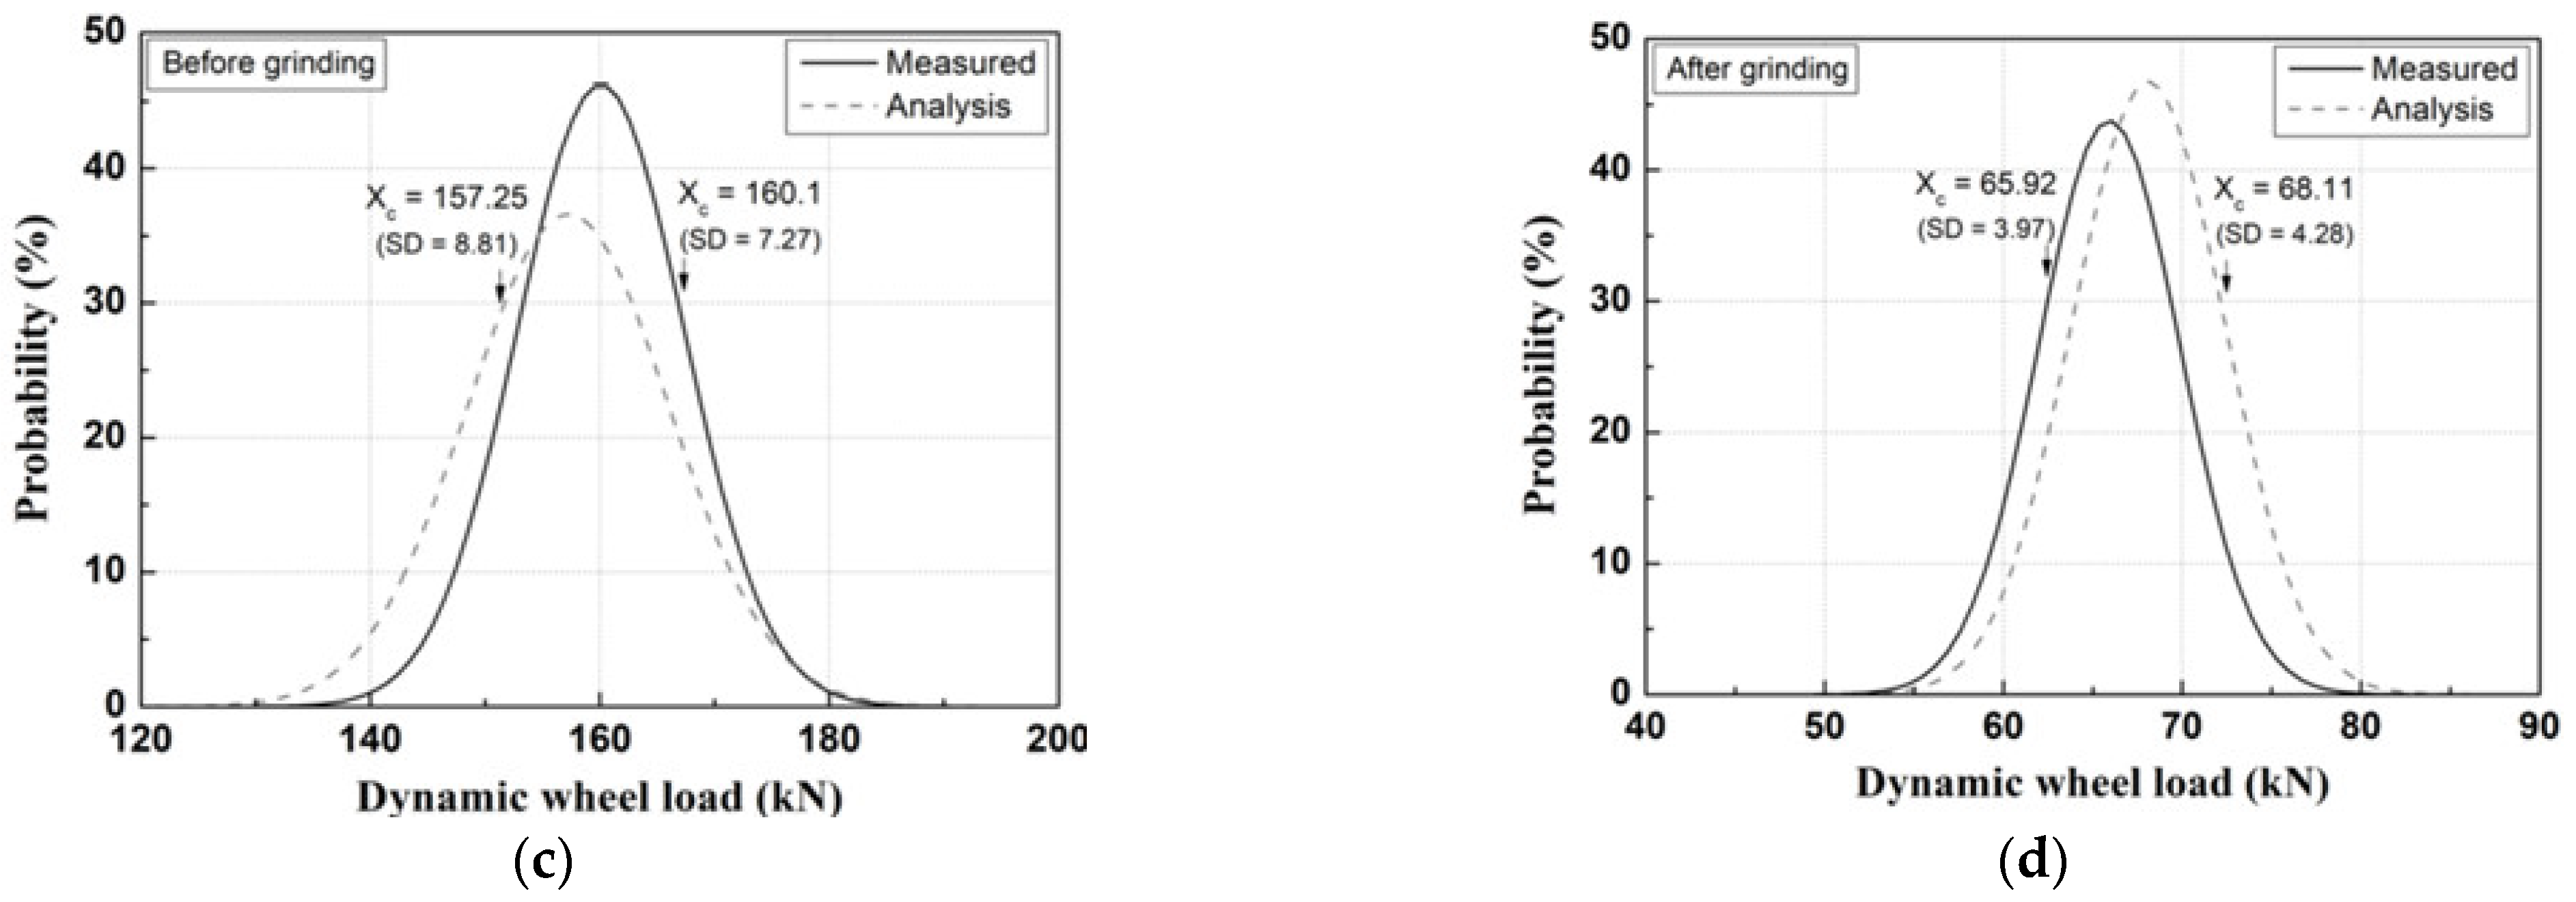
2.4. Effect of Rail Grinding on Dynamic Track Response

The track load (dynamic load, rail acceleration, rail and sleeper displacement) measurement results before and after rail grinding for trains operating in the section where rail corrugation occurred are shown in Figure 6a–f.
As shown in Figure 6a, the results of measuring the track load before and after rail grinding showed that the peak value of the maximum response of the dynamic wheel load before rail grinding increased significantly due to the influence of the unevenness generated on the rail surface.
As shown in Figure 6b, before rail grinding, the peak value of the maximum response of the rail acceleration was significantly increased due to the influence of the unevenness on the rail surface. On the other hand, after rail grinding, the unevenness was reduced, and the peak value of the track response was significantly reduced compared to before rail grinding.
The sleeper displacement and rail displacement are shown in Figure 6c–f, respectively. Before rail grinding, the peak value of the maximum response increased for the sleeper displacement and rail displacement due to the influence of unevenness on the rail surface. After rail grinding, the unevenness decreased, and the peak value of the track response decreased compared to before rail grinding.
The maximum wheel loads and maximum accelerations of the rail measured on Sections A and B during the subway operations are presented in Figure 7. For Section A, the maximum wheel loads ranged from 120 to 154 kN before the grinding and were reduced to 61–80 kN after the grinding, which is approximately a 33–48% reduction, as shown in Figure 7a. The maximum accelerations of the rail also decreased from ±30–40 m/s2 to ±10 m/s2 due to the grinding, as shown in Figure 7b. The maximum wheel loads and the maximum accelerations of the rail on Section B were larger than those on Section A but decreased to similar levels as on Section A after the grinding, as shown in Figure 7c,d.
The maximum vertical displacements of the sleeper and rail on Section A were also reduced by the grinding, as shown in Figure 7e,f. Before the grinding, the maximum vertical displacements of the rail ranged from 2.5 to 2.7 mm, but they decreased to 2.1–2.3 mm after the grinding. The displacement of sleepers and rails due to rail grinding was reduced by approximately 18% and about 12%, respectively.

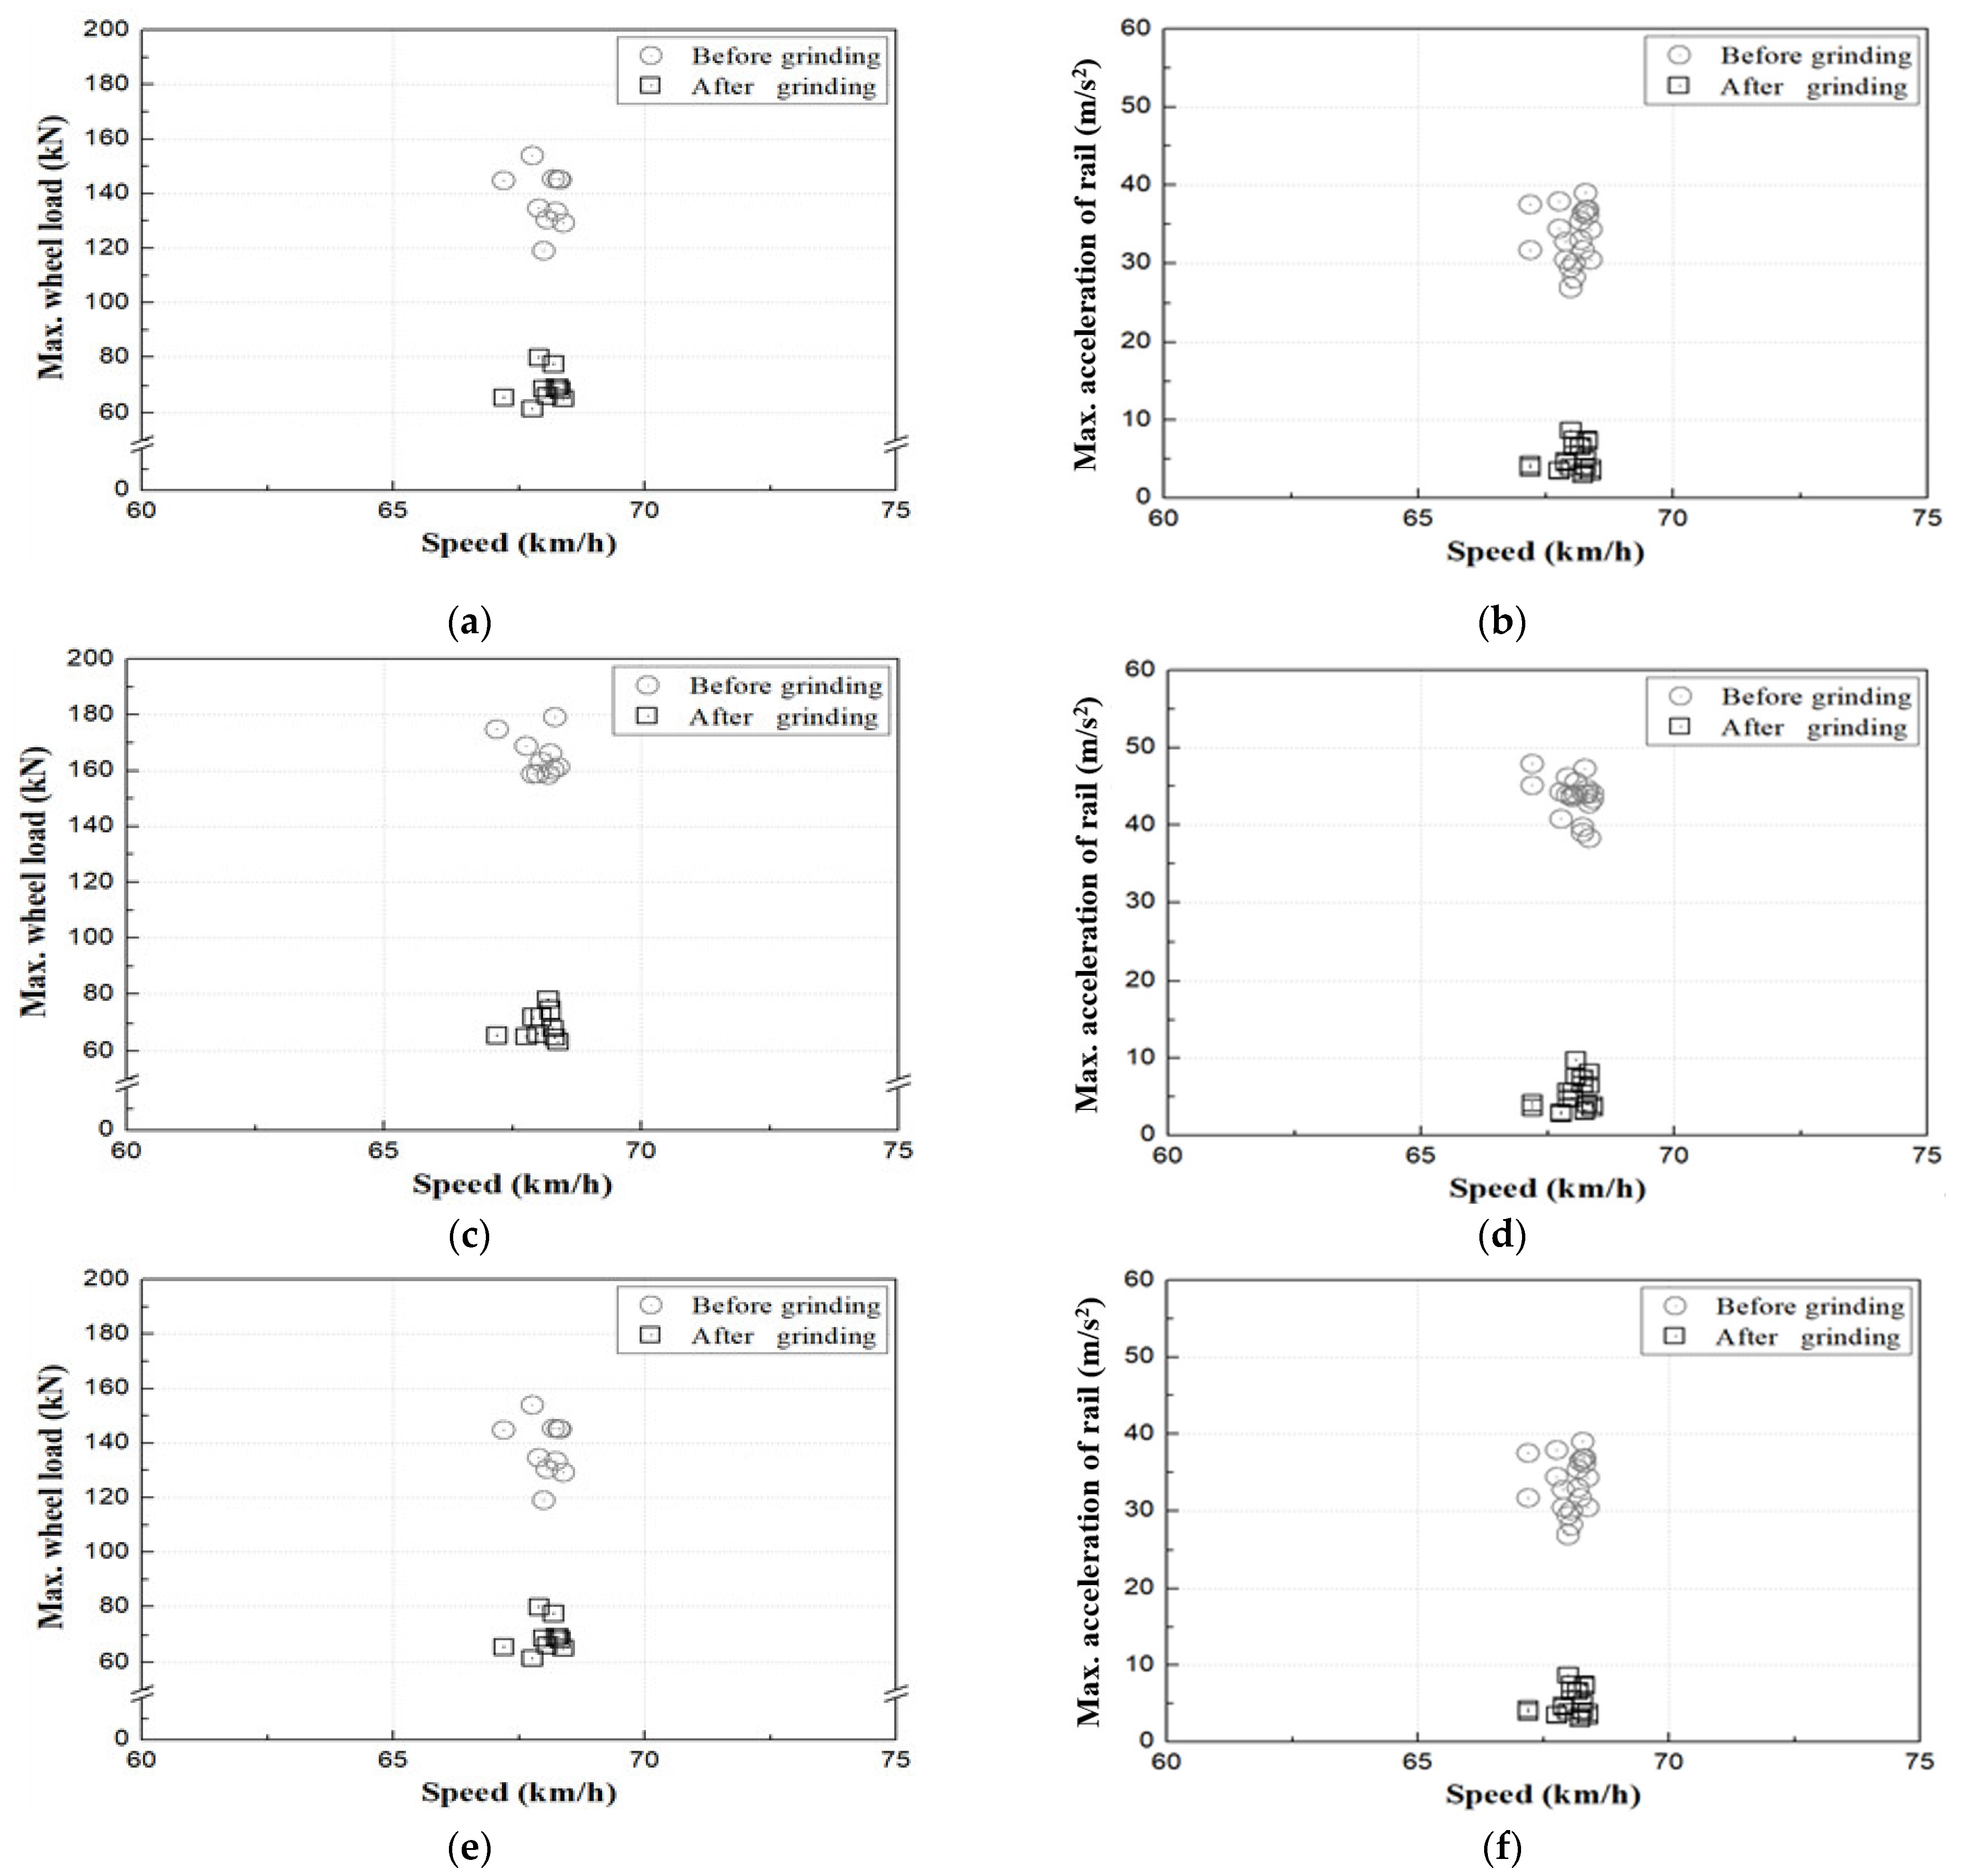
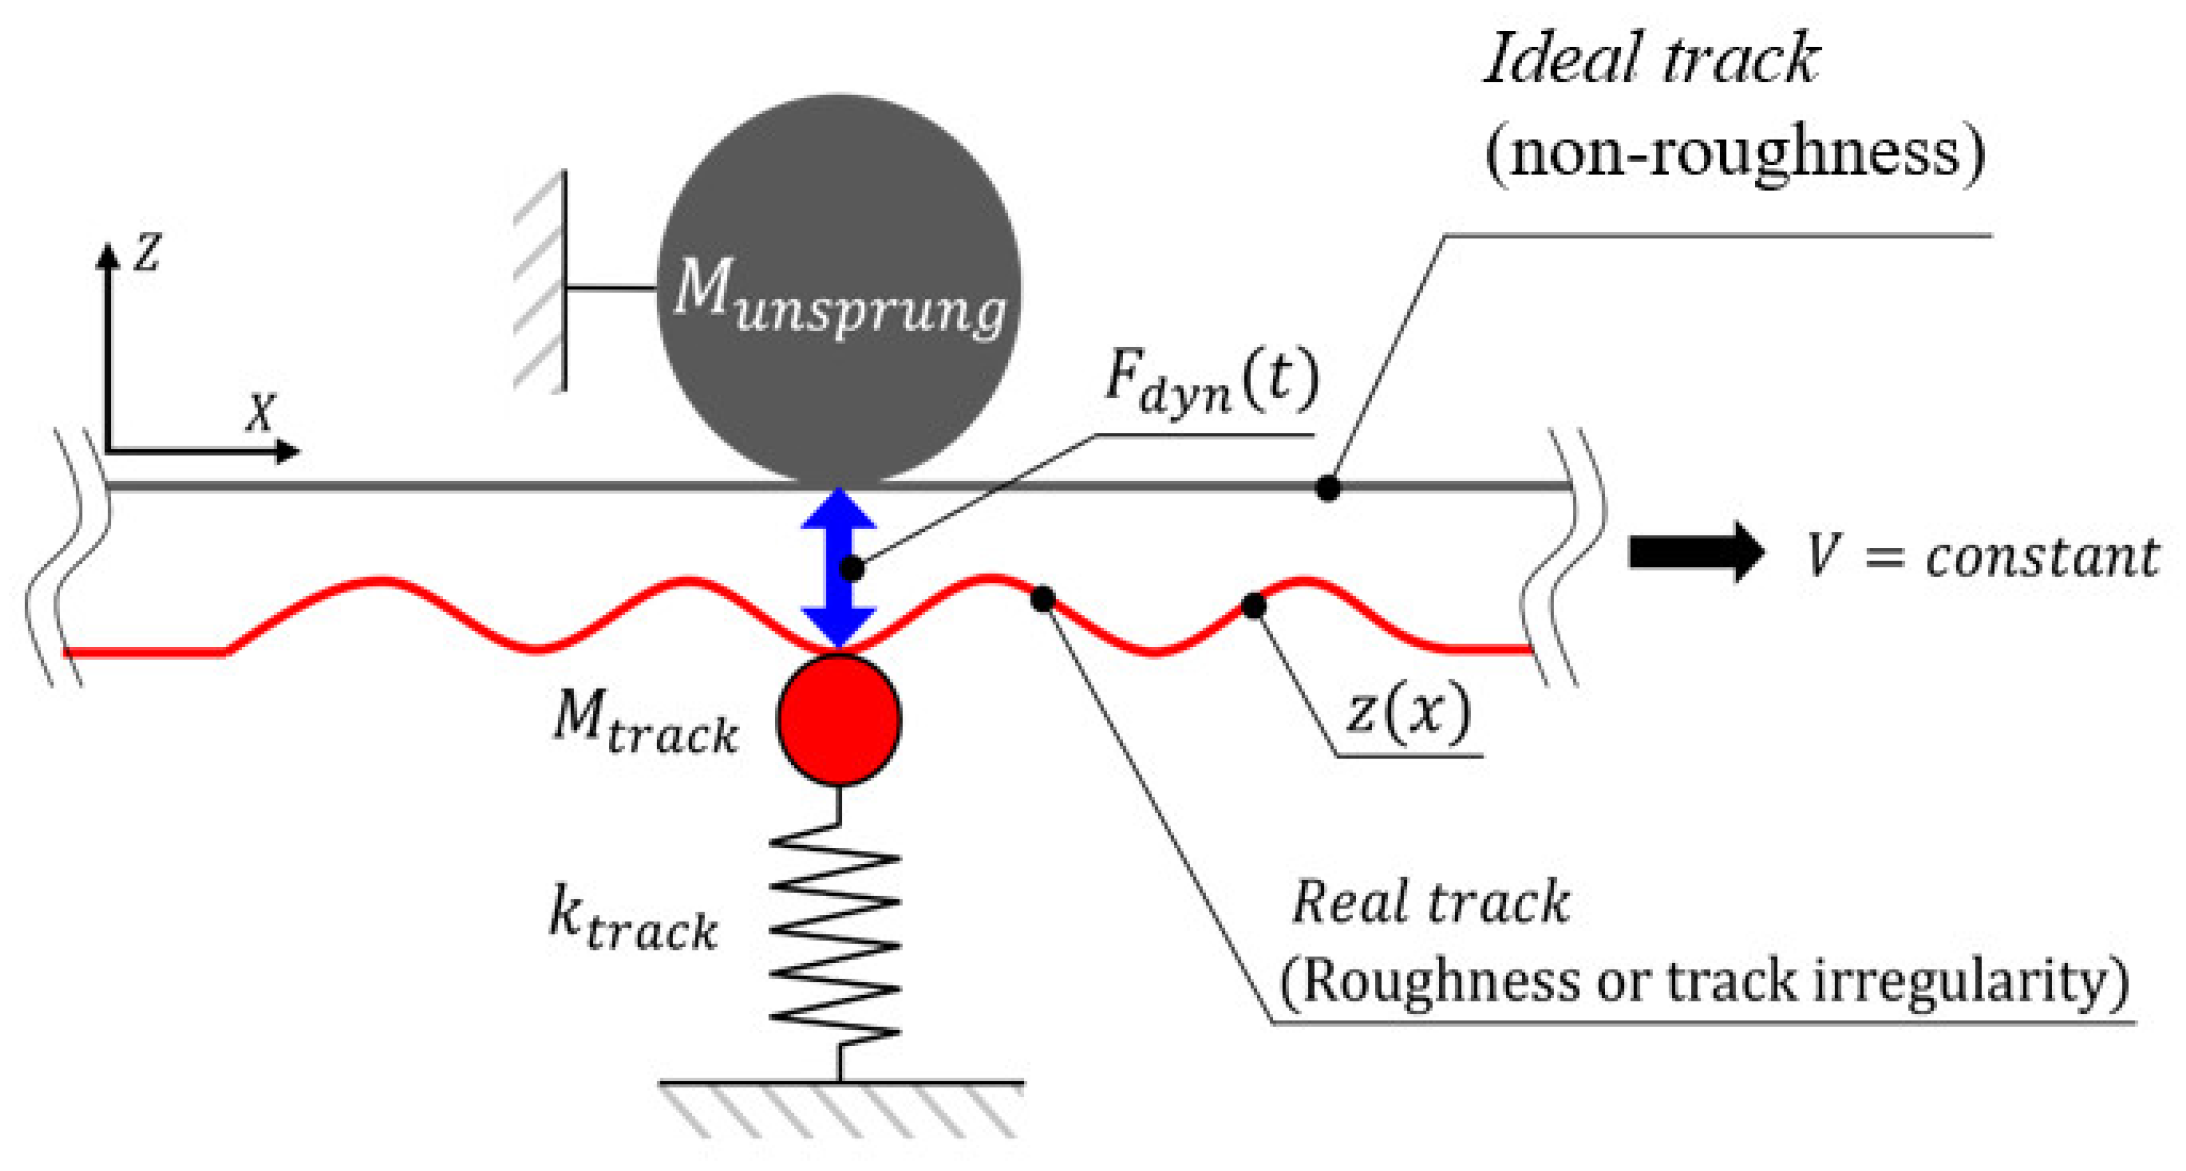
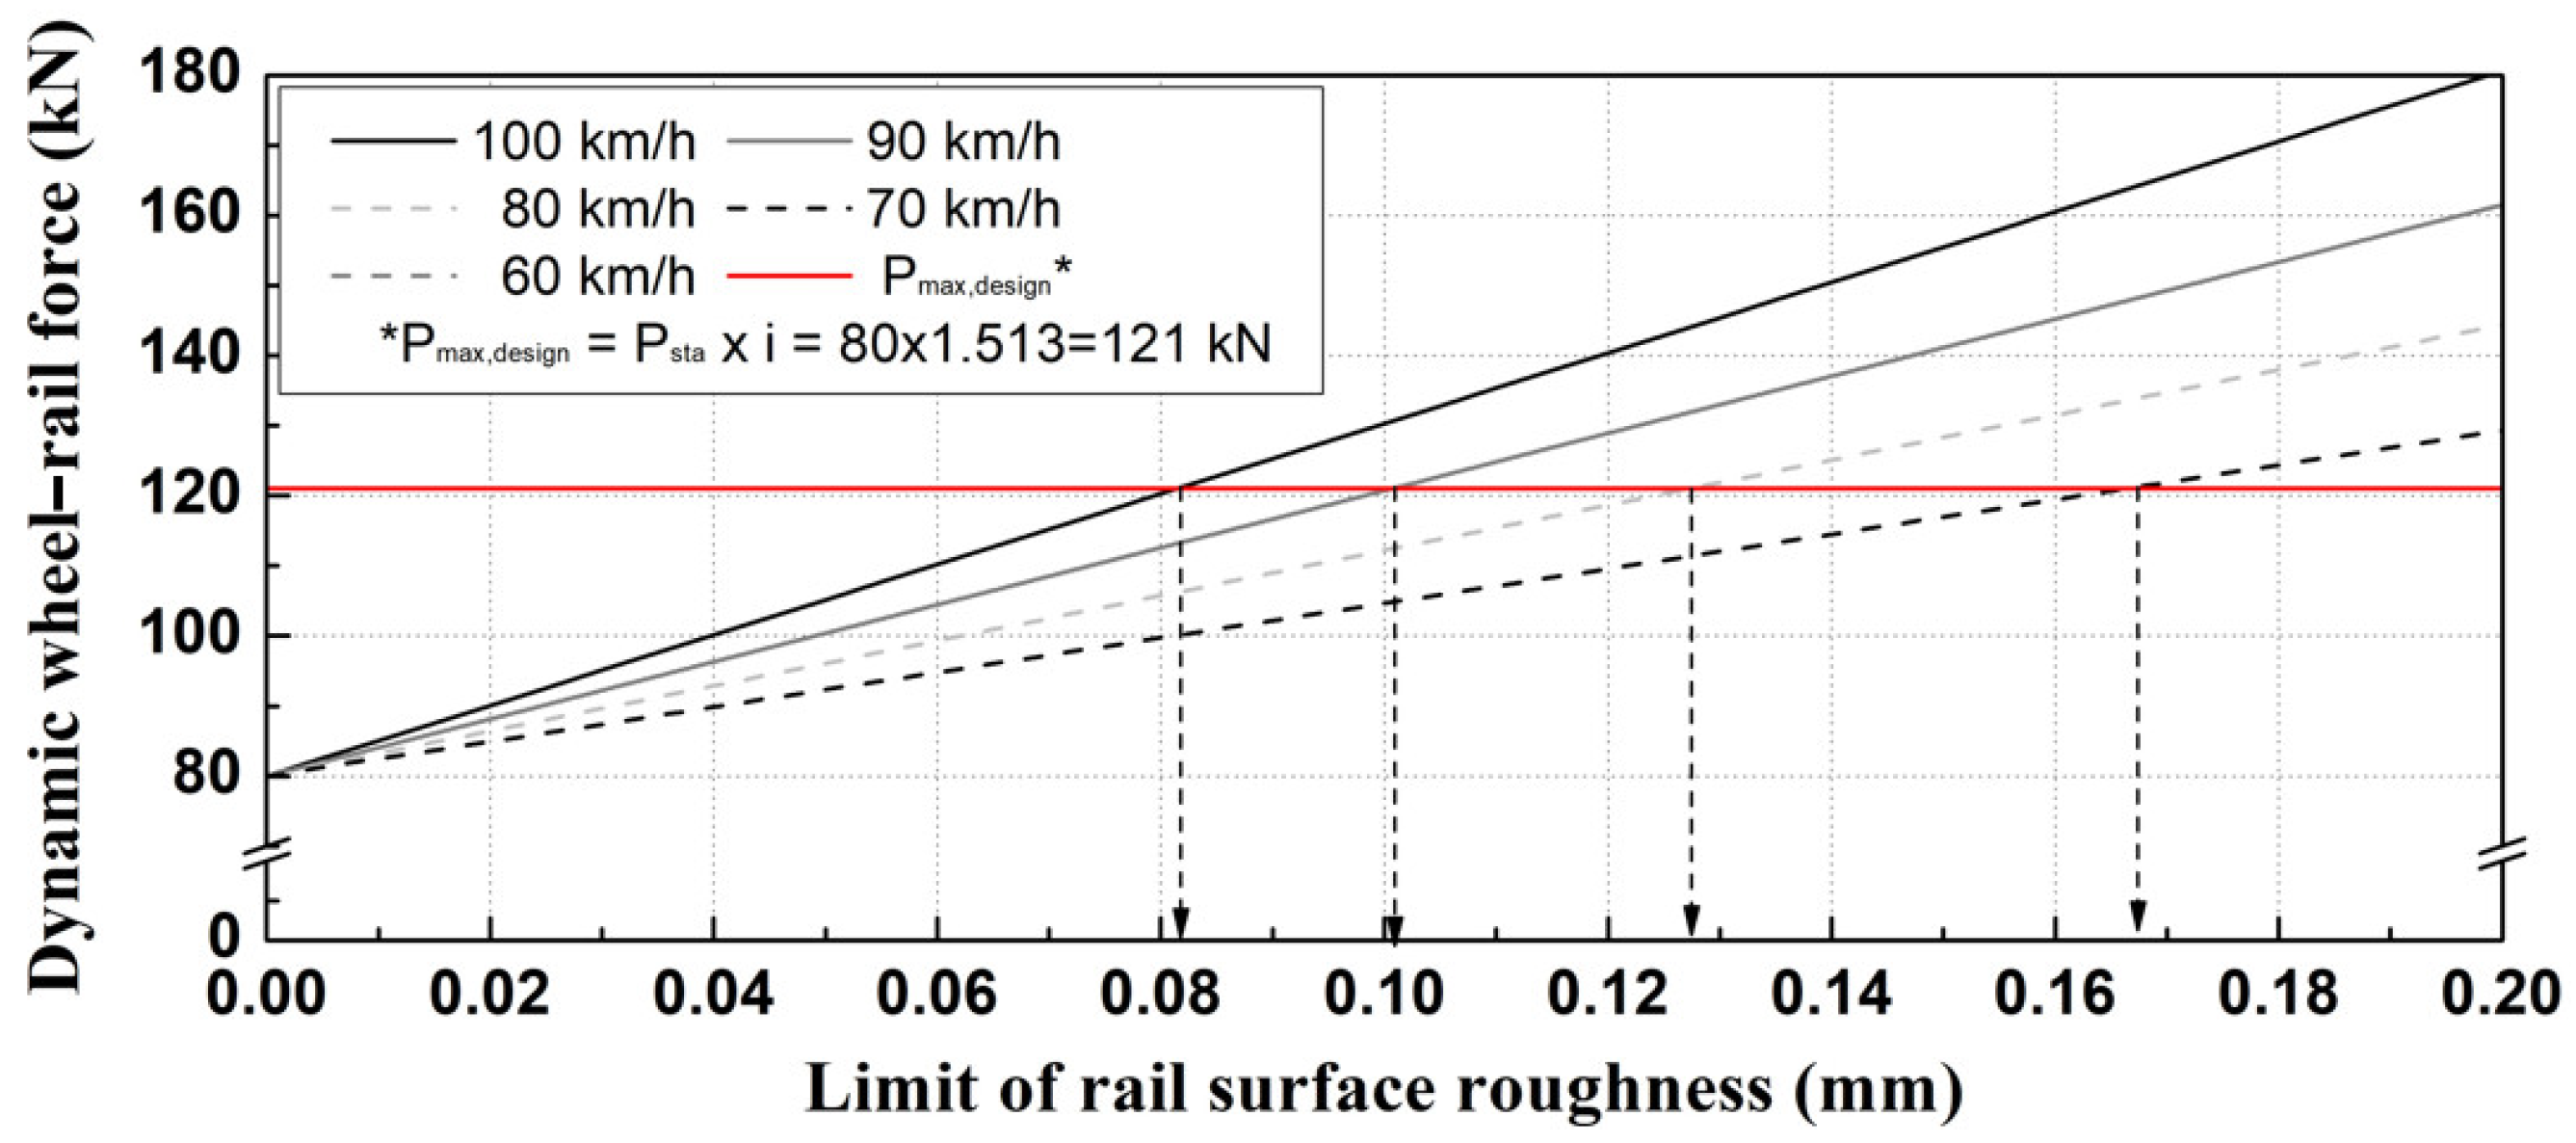
3. Wheel–Rail Interaction Force

To evaluate the effect of rail corrugation on the track, wheel–rail interaction forces were utilized as shown in Figure 8. According to previous studies [20,21,22,23,24,25,26,27,28,29], the rail surface roughness in contact with the wheel increases the wheel–rail interaction force, thus resulting in an increase in the inertia forces such as the dynamic wheel–rail contact force. Steenbergern and Esveld [20] proposed a dynamic model considering the wheel–rail interaction when the train is running at a speed of V, as shown in Figure 8.
Jung [15] proposed that the maximum dynamic wheel–rail interaction force ( F d y n ,   m a x ) is expressed as follows:
F d y n ,     m a x = β M v 2 L 0 d z d x n o r m ·   Q I ,
where β is the dimensionless calibration factor, L 0 is the reference wavelength, m is the equivalence mass (wheel–rail system), and z is z 0 sin(2πvt/L).
The measurements of rail surface roughness on Section A before and after the grinding are shown in Figure 9a. Based on these roughness measurements and Equation (1), F d y n ,   m a x was estimated, as shown in Figure 9b,c. To develop the distribution of the estimated wheel loads, the maximum values of F d y n ,   m a x within every 100 mm interval were selected. Figure 9b shows these values for five intervals of 1000 mm. It is worth noting that the maximum value of F d y n ,   m a x was estimated to be approximately 220 kN, which exceeded the design wheel load of the urban transit system (Seoul Metro subway) (i.e., 80 kN). However, the maximum value of F d y n ,   m a x decreased to approximately 200 kN (approximately 9% reduction) after the grinding, which satisfied the design wheel load.
The distributions of the estimated and measured wheel loads are compared in Figure 10. The Gaussian distributions of the measured wheel loads were constructed based on the data shown in Figure 7. The maximum wheel loads estimated for Section A (Figure 10) were used to develop the Gaussian distributions. Note that the maximum wheel loads for Section B were estimated in the same manner. It turned out that the distributions for the estimated and measured wheel loads for both sections are in good agreement. The mean and standard deviation values for the estimated and measured wheel loads were within 3.2% difference.

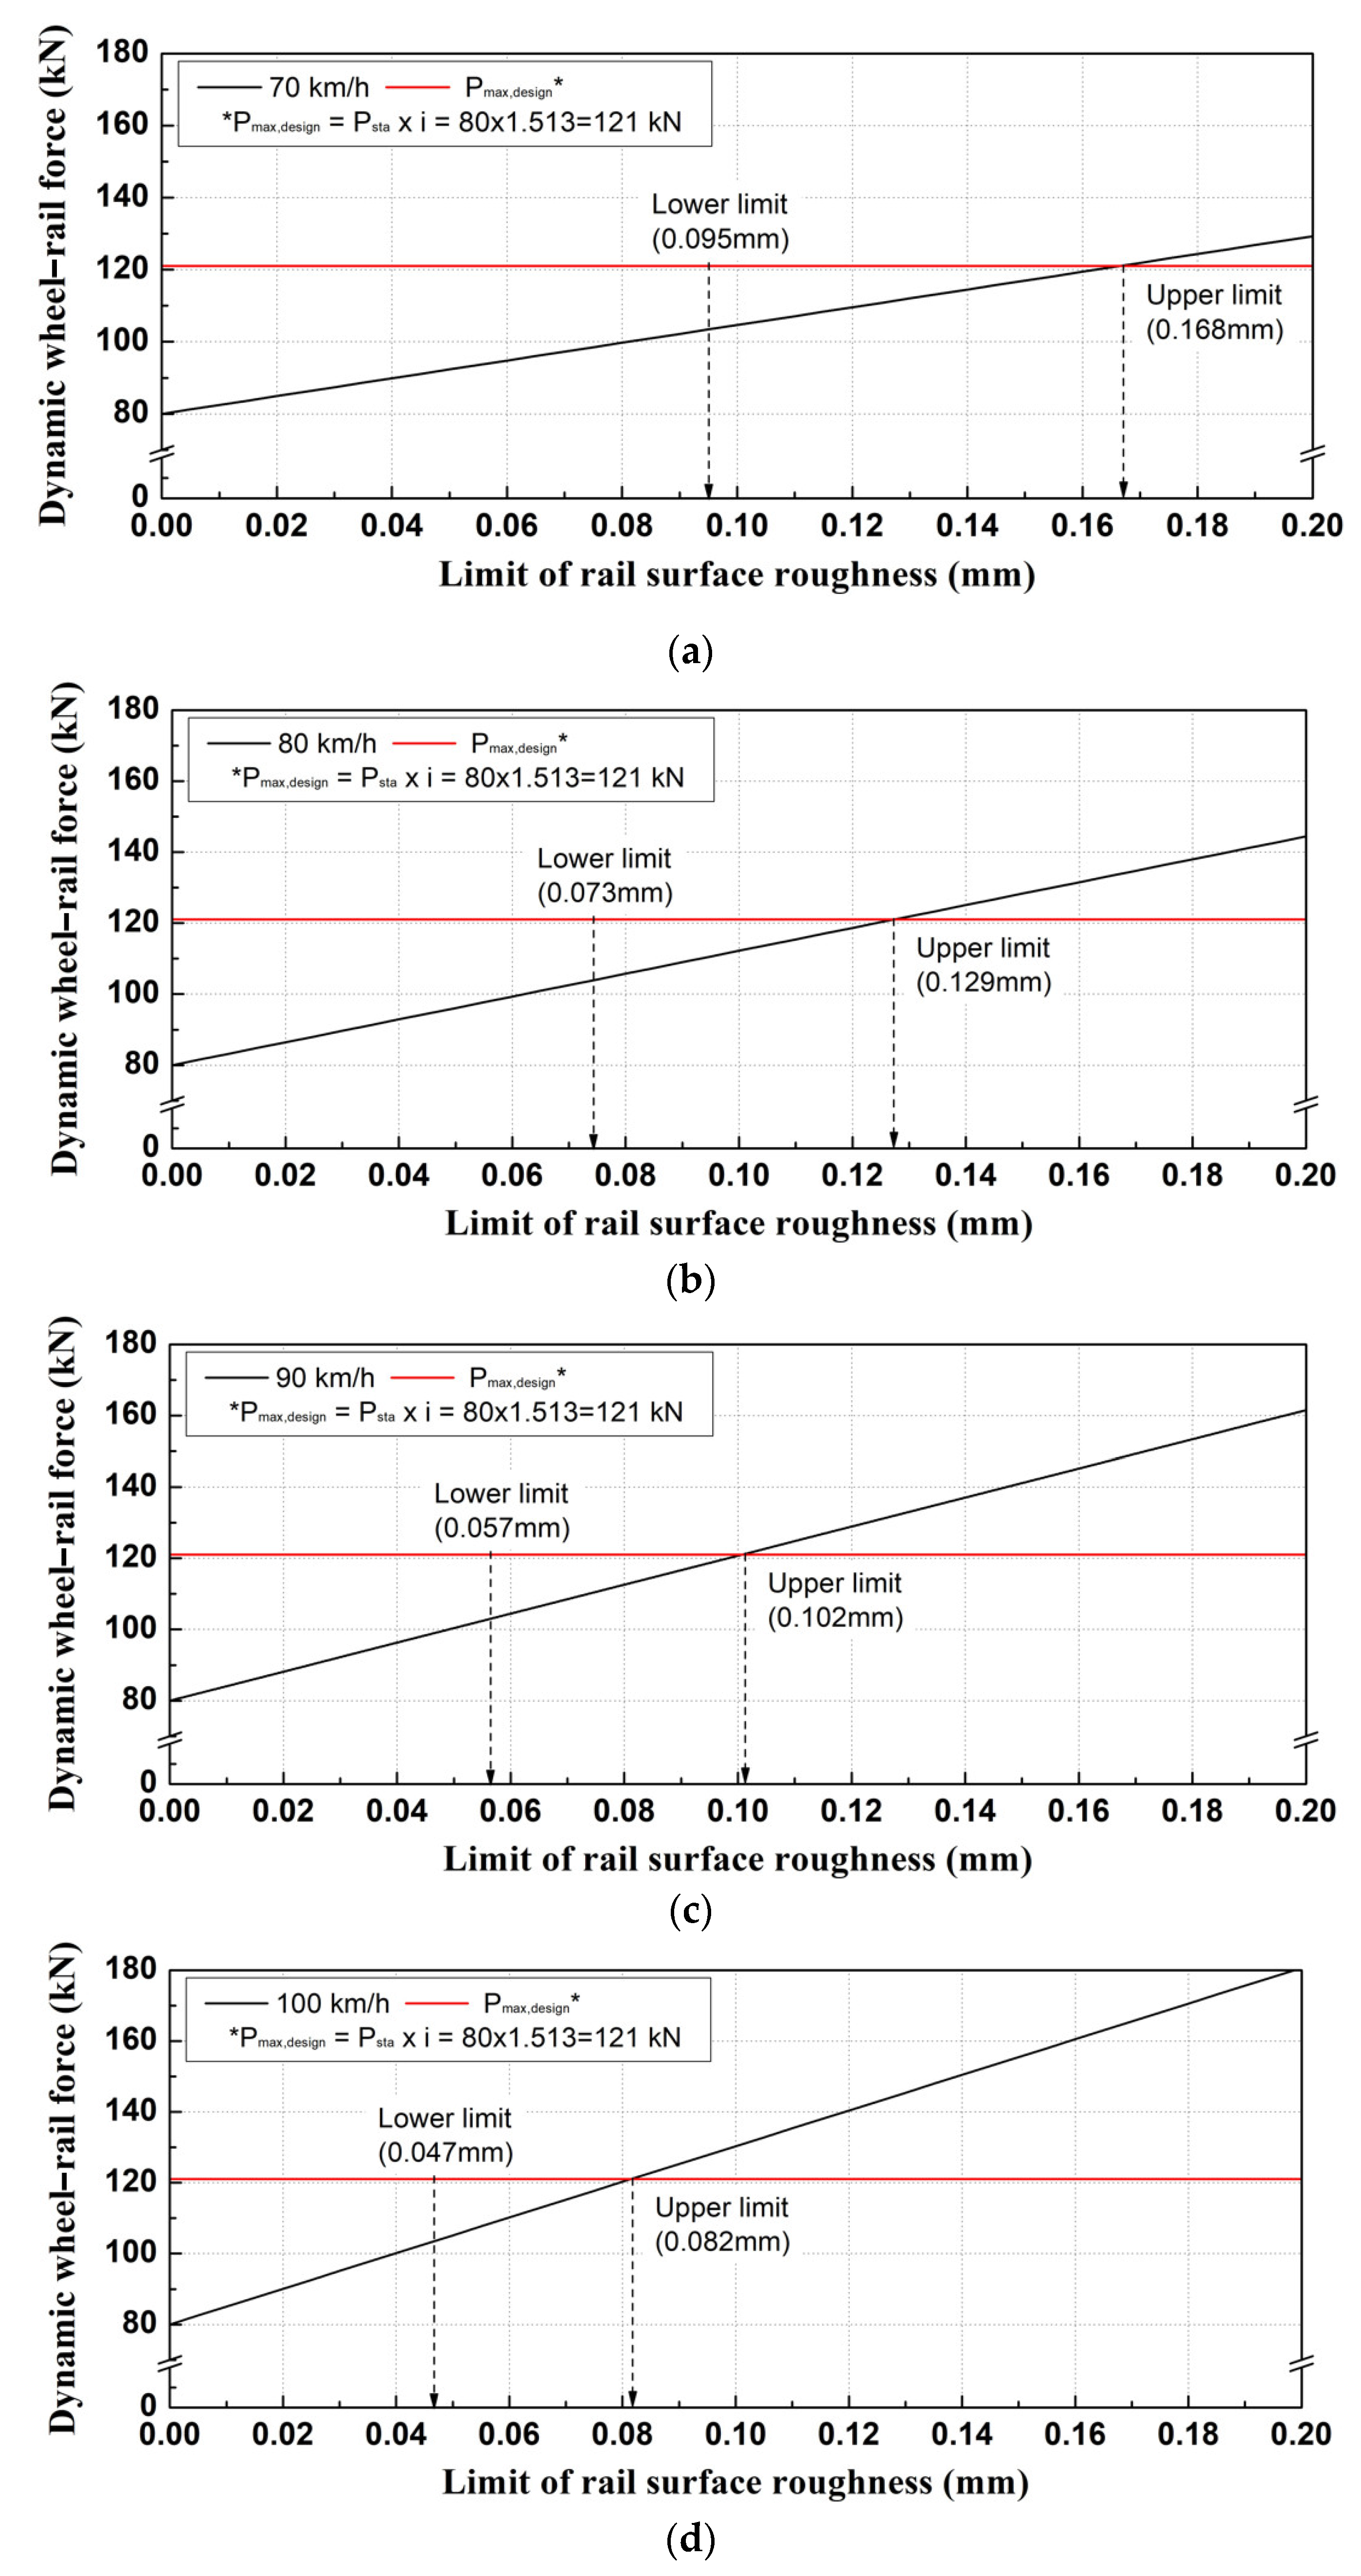
4. Criteria of Rail Surface Roughness

For the wheel–rail interaction force to be managed stably, the analytical dynamic wheel load due to rail corrugation wear should not be greater than the design dynamic wheel load. The rail surface roughness limits for different train speeds are presented in Figure 11. The maximum dynamic wheel load design value (121 kN) was calculated by multiplying the static wheel load of 80 kN by the impact factor of 1.513, and the rail surface roughness limit values were found to be approximately 1.0 and 0.8 mm when the train speed was 90 to 100 km/h. The impact factor was calculated using the formula presented in previous studies [22,30].
As the rail surface roughness increased, the dynamic wheel–rail interaction force was linearly proportional. In addition, the analysis results for the dynamic wheel–rail interaction force considering train speeds of 60 to 100 km/h showed that the slope of the increase in dynamic wheel–rail interaction force increased rapidly as the speed increased. In previous studies, Nielsen [27] suggested that rails should be ground if the average rail roughness level of a track section exceeds the acceptable criterion. Therefore, the faster the train speed, the more conservatively the rail surface roughness must be managed.
Owing to stably managing the wheel–rail interaction force below a certain level, it is desirable to plan and perform rail grinding before rail corrugation wear reaches the rail surface roughness limit. In this study, the upper and lower limits of rail surface roughness according to train speed are presented as results of wheel–rail interaction force analysis in Figure 12.
In actual track management sites, when the upper and lower limits of the rail surface roughness management standards are reached, priority or lower-priority rail grinding must be performed. However, it is realistically difficult to precisely control rail grinding during rail grinding work. In this study, the upper and lower limits of rail surface roughness according to train speed are presented in Figure 12 based on the results of wheel–rail interaction force analysis. The criteria for setting the lower limit of the rail surface roughness were applied to the (±) standard deviation value of the analysis model verified through this study. The (+) standard deviation value was excluded because it exceeded the maximum dynamic wheel load design value, and the (−) standard deviation was applied. The rail surface roughness value was calculated when the (−) standard deviation value was subtracted from the dynamic wheel load upper limit value (121 kN).
As shown in Figure 12a, when the train speed is 70 km/h, the lower limit of the rail surface roughness is 0.095 mm, so the grinding should be performed according to the actual lower limit. However, in the field, if the rail grinding capacity is 0.02 mm per pass, it is desirable to grind five passes to remove 0.1 mm. Figure 12b shows that when the train speed is 80 km/h, four passes should be grinded to remove 0.08 mm. Figure 12c,d show that when the train speed is 90 and 100 km/h, three passes should be grinded to remove 0.06 mm. In addition, to promote the efficiency and convenience of rail grinding, it is also good to calculate the rail grinding pass numbers for the upper and lower limits of rail surface roughness by the train speed of the corresponding line.
Rail wear management has been dependent on visual inspection, and the decision on whether to perform rail grinding has been made through the inspector’s subjective judgment or the qualitative evaluation method. In this study, a method to manage rail corrugation by measuring the rail surface roughness and entering the roughness measurement data when rail corrugation is found is presented in Figure 13.
The diagram presented in Figure 13 provides a quantitative basis for removing rail wear, and it is possible to estimate the appropriate time for rail grinding and plan maintenance.

5. Conclusions

In this study, the effect of rail corrugation on the track was analyzed by measuring rail roughness and track dynamic response (dynamic wheel load, acceleration, and displacement) before and after rail grinding in sections where rail corrugation occurred. It was found that the dynamic wheel load, rail acceleration, and displacements of the rails and sleepers were reduced by approximately 48%, 18%, and 12%, respectively, due to rail grinding. The analysis of wheel–rail interaction, by comparing the measured and analyzed values of the influence of rail corrugation on the track, showed that the analysis model was appropriate, with the difference being less than approximately 3.2%. Based on the verified wheel–rail interaction force analysis model, a management method for rail surface roughness according to train speed was proposed. By using the rail irregularity management check diagram, which considers the wheel–rail interaction force, it is possible to provide a quantitative basis for eliminating rail corrugation and to estimate the appropriate timing for rail grinding and planned maintenance.

Author Contributions

Conceptualization, J.-Y.C.; methodology, C.M.J.; formal analysis, J.-Y.C. and S.-H.K.; investigation, C.M.J.; data curation, C.M.J. and S.-H.K.; writing—original draft preparation, J.-Y.C. and S.-H.K.; writing—review and editing, S.-H.K. All authors have read and agreed to the published version of the manuscript.

Funding

This research received no external funding.

Institutional Review Board Statement

Not applicable.

Informed Consent Statement

Not applicable.

Data Availability Statement

The original contributions presented in this study are included in the article; further inquiries can be directed to the corresponding author.

Conflicts of Interest

Author Cheon Man Jeong was employed by the company Seoul Metro. The remaining authors declare that the research was conducted in the absence of any commercial or financial relationships that could be construed as a potential conflict of interest.

References

  1. Gong, H.S. Cause Analysis and Avoiding Measures of Rail Corrugation for Sleeper Floating Track in Urban Transit. Ph.D. Dissertation, Dongyang University, Yeongju-si, Republic of Korea, 2021. [Google Scholar]
  2. Seo, J.M. An Optimum Maintenance for Rail Surface Considering Dynamic Wheel-Rail Force. Master’s Thesis, Seoul National University of Science and Technology, Seoul, Republic of Korea, 2015. [Google Scholar]
  3. Park, J.W. Optimum Quality Index by Rail Grinding Based on Rail Surface Degradation and Dynamic Wheel-Rail Force. Ph.D. Dissertation, Seoul National University of Science and Technology, Seoul, Republic of Korea, 2017. [Google Scholar]
  4. Yang, S.C.; Jang, S.Y. Investigation of the maintenance criteria for the rail surface defects in high-speed railways. J. Korean Soc. Railw. 2011, 14, 535–544. [Google Scholar]
  5. Chae, K.H. A Study on the Characteristics of Rail Corrugation on the Gyongbu High Speed Railway. Master’s Thesis, Woosong University, Daejeon, Republic of Korea, 2014. [Google Scholar]
  6. Ha, K.Y.; Kim, H. A study of rail wear by change of acceleration and deceleration. J. Korean Soc. Railw. 2007, 10, 607–612. [Google Scholar]
  7. Hwang, Y.T. A Study on Force-Based Rail Surface Quality Maintenance Method. Ph.D. Dissertation, Woosong University, Daejeon, Republic of Korea, 2019. [Google Scholar]
  8. Lee, C.W.; Choi, J.Y.; Kim, J.C. Characterization in high speed rail corrugation. In Proceedings of the Korean Society for Precision Engineering, JeJu, Republic of Korea, 1–3 June 2011. [Google Scholar]
  9. Go, D.C.; Sugn, D.Y.; King, S.Y.; Park, Y.G. The laboratory study for establishing rail grinding period in underground railway. In Proceedings of the Korean Society for Railway, Gyeongju, Republic of Korea, 21–23 May 2009. [Google Scholar]
  10. Park, J.H. Development of Rail Corrugation Measurement System. Master’s Thesis, Chosun University, Gwangju, Republic of Korea, 2016. [Google Scholar]
  11. Seo, J.; Kwon, S.; Park, Y. A study on the effect analysis of rail grinding in highspeed railway considering dynamic wheel-rail force. J. Korean Soc. Railw. 2019, 22, 494–503. [Google Scholar]
  12. Grassie, S.L. Rail corrugation: Characteristics, cause and treatments. Proc. Inst. Mech. Eng. Part F J. Rail Rapid Transit 2009, 223, 581–596. [Google Scholar]
  13. Collettea, C.; Vanhonacker, P.; Bastaits, R.; Levy, D. Comparison between time and frequency studies of a corrugated curve of RER paris network. Eng. Fract. Mech. 2008, 265, 1249–1258. [Google Scholar]
  14. Meehan, P.A.; Daniel, W.J.T.; Campey, T. Prediction of the Growth of Wear-Type Rail Corrugation. Eng. Fract. Mech. 2005, 258, 1001–1013. [Google Scholar] [CrossRef]
  15. Wang, Z.; Wu, B.; Huang, J.; Ji, Y.; Li, D.; Wu, S. Dynamic wheel-rail adhesion characteristics on wet curved tracks considering surface roughness. Phys. Fluids 2025, 37, 022104. [Google Scholar] [CrossRef]
  16. Shi, J.; Gao, Y.; Long, X.; Wang, Y. Optimizing rail profiles to improve metro vehicle-rail dynamic performance considering worn wheel profiles and curved tracks. Struct. Multidiscip. Optim. 2020, 63, 419–438. [Google Scholar]
  17. Ma, C.; Gao, L.; Xin, T.; Cai, X.; Nadakatti, M.M.; Wang, P. The dynamic resonance under multiple flexible wheelset-rail interactions and its influence on rail corrugation for high-speed railway. J. Sound Vib. 2021, 498, 115968. [Google Scholar] [CrossRef]
  18. Jung, C.M. Maintenance Strategy for Rail Corrugation Considering Wheel-Rail Interaction Force. Ph.D. Dissertation, Dongyang University, Yeongju-si, Republic of Korea, 2022. [Google Scholar]
  19. Choi, J.Y.; Yun, S.W.; Chung, J.S.; Kim, S.H. Comparative study of wheel-rail contact impact force for jointed rail and continuous welded rail on light-rail transit. Appl. Sci. 2020, 10, 2299. [Google Scholar] [CrossRef]
  20. Steenbergen, M.J.M.M.; Esveld, C. Rail weld geometry and assessment concepts. Proc. Inst. Mech. Eng. Part F J. Rail Rapid Transit. 2006, 220, 257–271. [Google Scholar]
  21. Hwang, S.K. A Study on Application of Force-Based Track Irregularity Analysis Method. Master’s Thesis, Dongyang University, Yeongju-si, Republic of Korea, 2021. [Google Scholar]
  22. Wang, K.Y.; Liu, P.F.; Zhai, W.M.; Huang, C.; Chen, Z.G.; Gao, J.M. Wheel/rail dynamic interaction due to excitation of rail corrugation in high-speed railway. Sci. China Technol. Sci. 2015, 58, 226–235. [Google Scholar]
  23. Niu, L.; Yang, F.; Deng, X.; Zhang, P.; Jing, G.; Qiang, W.; Guo, Y. An assessment method of rail corrugation based on wheel-rail vertical force and its application for rail grinding. J. Civ. Struct. Health Monit. 2023, 13, 1131–1150. [Google Scholar] [CrossRef]
  24. Du, L.; Liu, W. Study on wheel-rail interaction based on rail roughness. Vibroeng. Procedia 2015, 5, 475–480. [Google Scholar]
  25. Nielsen, J.C.O.; Ekberg, A. Acceptance criterion for rail roughness level spectrum based on assessment of rolling contact fatigue and rolling noise. Wear 2011, 271, 319–327. [Google Scholar]
  26. Keropyan, A.; Gorbatyuk, S. Impact of roughness of interacting surfaces of the wheel-rail pair on the coefficient of friction in their contact area. Procedia Eng. 2016, 150, 406–410. [Google Scholar] [CrossRef]
  27. Nielsen, J.C.O. Rail roughness level assessment based on high-frequency wheel-rail contact force measurements. In Proceedings of the 9th International Workshop on Railway Noise, Munich, Germany, 4–8 September 2007; pp. 355–362. [Google Scholar]
  28. Jaramillo, J.A.A.; Sánchez, J.C.; Santa, J.F.; Palacio, M.E.; Toro, A. Roughness evolution of wheel surface in a simulated wheel-rail contact. Tribol.-Mater. Surf. Interfaces 2022, 16, 188–201. [Google Scholar]
  29. Grassie, S.L.; Saxon, M.J.; Smith, J.D. Measurement of longitudinal rail irregularities and criteria for acceptable grinding. J. Sound Vib. 1999, 227, 949–964. [Google Scholar]
  30. Choi, J.Y.; Park, Y.G.; Lee, S.M. The evaluation of track impact factor on the various track type in urban transit. J. Korean Soc. Railw. 2011, 14, 248–255. [Google Scholar] [CrossRef]
Figure 1. Rail corrugation. (a) Section A; (b) Section B; (c) rail before grinding; (d) rail after grinding.
Applsci 15 03915 g001aApplsci 15 03915 g001b
Figure 2. Measurement: (a) RAILPROF instrument; (b) rail surface roughness measuring work.
Applsci 15 03915 g002
Figure 3. Grinding car. (a) Illustration of the unit module; (b) photo of grinding work; (c) photo of grinding stones.
Applsci 15 03915 g003aApplsci 15 03915 g003b
Figure 4. Measurement sensors.
Applsci 15 03915 g004
Figure 5. Examples of surface roughness measurement before and after grinding; (a) Section A-4; (b) Section B-4.
Applsci 15 03915 g005
Figure 6. Examples of dynamic track response measurements on Section A: (a) wheel load; (b) acceleration of rail; (c) vertical displacement of sleeper; (d) detail of vertical displacement of sleeper; (e) vertical displacement of rail; (f) detail of vertical displacement of rail.
Applsci 15 03915 g006
Figure 7. Dynamic responses of track before and after grinding: (a) maximum wheel load (Section A); (b) maximum acceleration of rail (Section A); (c) vertical displacement of sleeper (Section B); (d) vertical displacement of rail (Section B); (e) maximum vertical displacement of rail on Section A; (f) maximum vertical displacement of sleeper on Section B.
Applsci 15 03915 g007
Figure 8. Mass–stiffness combination in the wheel–rail system considering rail roughness.
Applsci 15 03915 g008
Figure 9. Example of evaluation results of the dynamic wheel–rail interaction force analysis: (a) measurement result for rail surface roughness; (b) analysis result for dynamic wheel–rail interaction force; (c) maximum dynamic wheel–rail interaction force for each section.
Applsci 15 03915 g009aApplsci 15 03915 g009b
Figure 10. Estimated and measured dynamic wheel loads: (a) Section A (before); (b) Section A (after); (c) Section B (before); (d) Section B (after).
Applsci 15 03915 g010aApplsci 15 03915 g010b
Figure 11. Calculation of rail surface roughness management criteria (limit values) considering wheel–rail interaction force.
Applsci 15 03915 g011
Figure 12. Calculation of rail surface roughness management criteria (upper and lower limits) considering wheel–rail interaction force: (a) train speed (V = 70 km/h); (b) train speed (V = 80 km/h); (c) train speed (V = 90 km/h); (d) train speed (V = 100 km/h).
Applsci 15 03915 g012
Figure 13. Rail corrugation maintenance method considering wheel–rail interaction force.
Applsci 15 03915 g013
Table 1. Specifications of the tested track.
ItemsDetails
SubstructureData
AlignmentStraight
Track typeSTEDEF (sleeper floating track)
Sleeper spacing (mm)625
Rail (kg/m)60
LocationNearby station (deceleration section)
Operation speed (km/h)68~70
Annual tonnage (megaton)About 18
Table 2. Specifications of the rail grinding car.
ItemsDetails
Size (length × width × height)27.1 m × 2.4 m × 3.7 m
Weight76 tons
Engine spec.205 kw, 1800 RPM × 2 each
Number of grinding stones16
Diameter of grinding stonesStone A: 180 mm × 12 each
Stone B: 260 mm × 4 each
Grinding motor typeRotary wheel type, electric type
Grinding motor rotation speed3600 RPM
Grinding motor power11 kw × 16 each
Grinding angleStone A: (−)20–(+)15°
Stone B: (−)70–(−)5°
Grinding head control2 stones 1 set, independent control
Normal running speed60 km/h
Grinding speed2–8 km/h
Disclaimer/Publisher’s Note: The statements, opinions and data contained in all publications are solely those of the individual author(s) and contributor(s) and not of MDPI and/or the editor(s). MDPI and/or the editor(s) disclaim responsibility for any injury to people or property resulting from any ideas, methods, instructions or products referred to in the content.

