
Advanced Financial Fraud Malware Detection Method in the Android Environment


Abstract
1. Introduction
- Billing fraud: Malicious apps that exploit payment systems without user consent, often through Android payment methods or unauthorized transactions [16].
- Stalkerware: Software installed on a user device without knowledge, enabling third parties to track location, monitor communication, and access personal data [17].
- Hostile downloaders: Code that does not directly cause harm but downloads other unwanted or malicious software onto the device [18].
- Phishing: These apps disguise themselves as trusted sources, tricking users into submitting personal and billing information, which is then sent to malicious third parties [19].
- Spyware: Malicious software that monitors the online activity of a user and collects sensitive information, such as login credentials, banking details, and private data without the consent of the user [20].
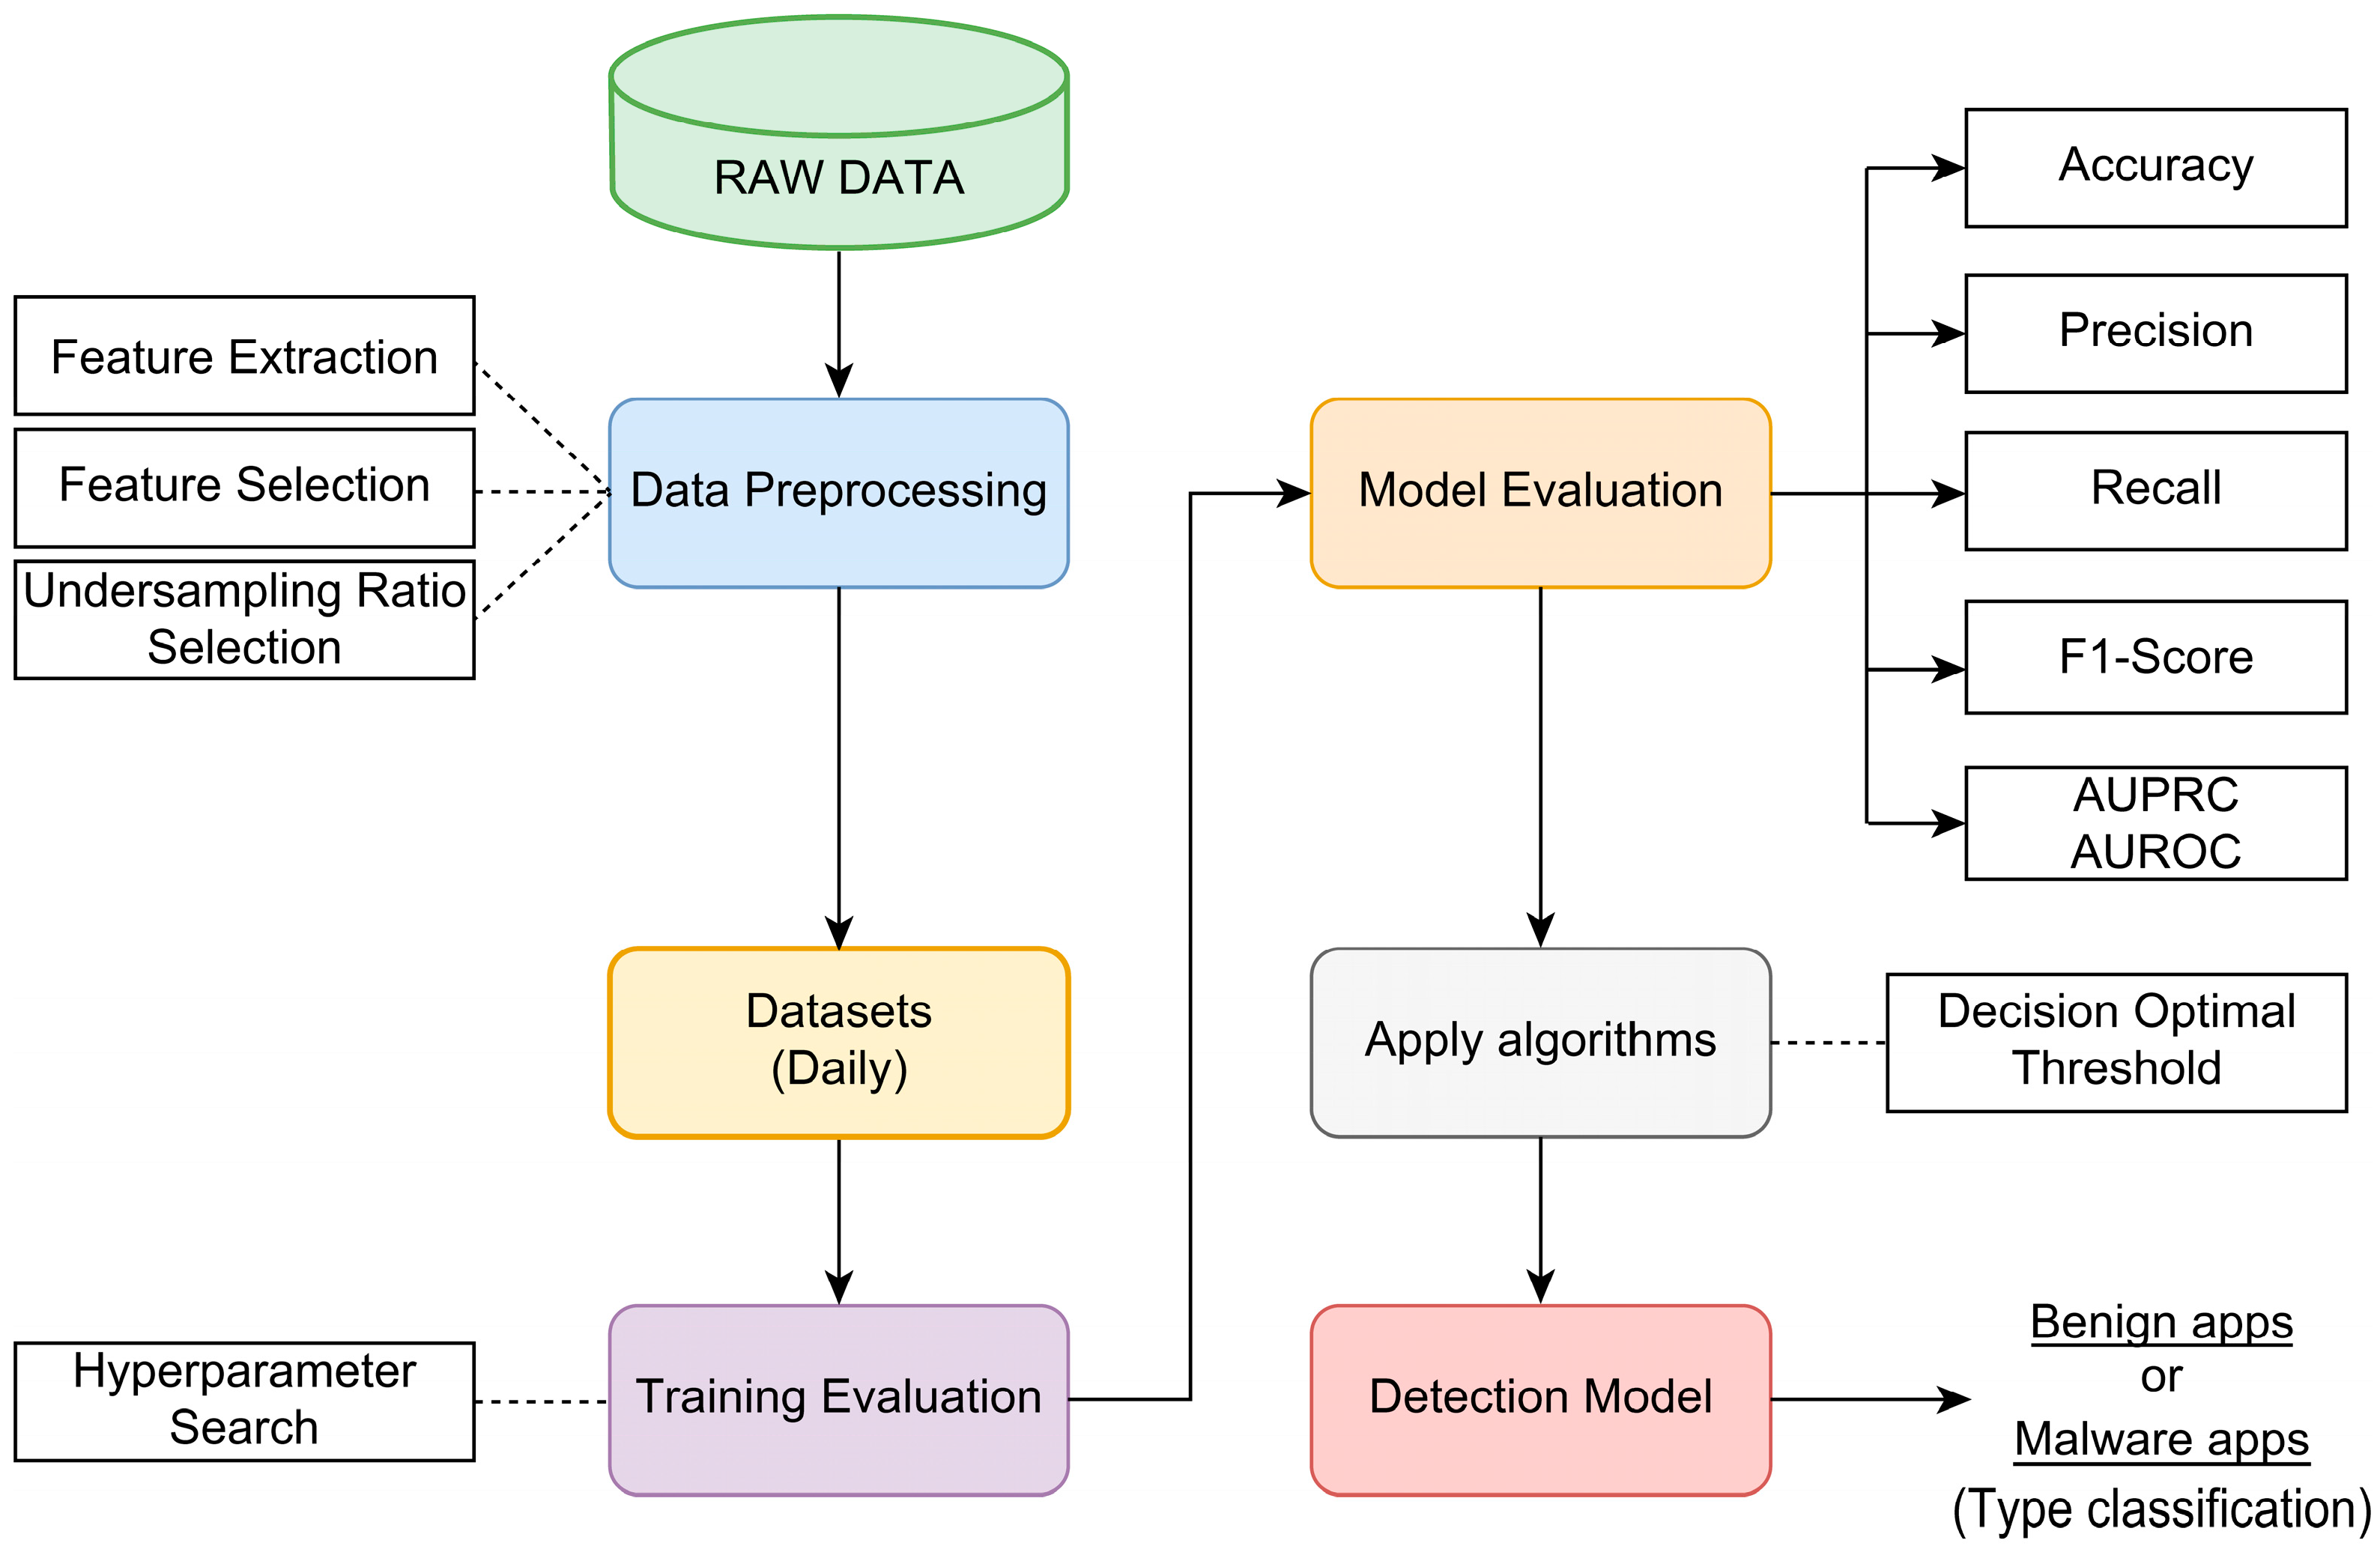
- Static Analysis for Financial Fraud Malware Detection: This study proposes a novel approach utilizing static analysis for detecting financial fraud malware. Compared to dynamic analysis, static analysis is more efficient for real-time detection in operational environments.
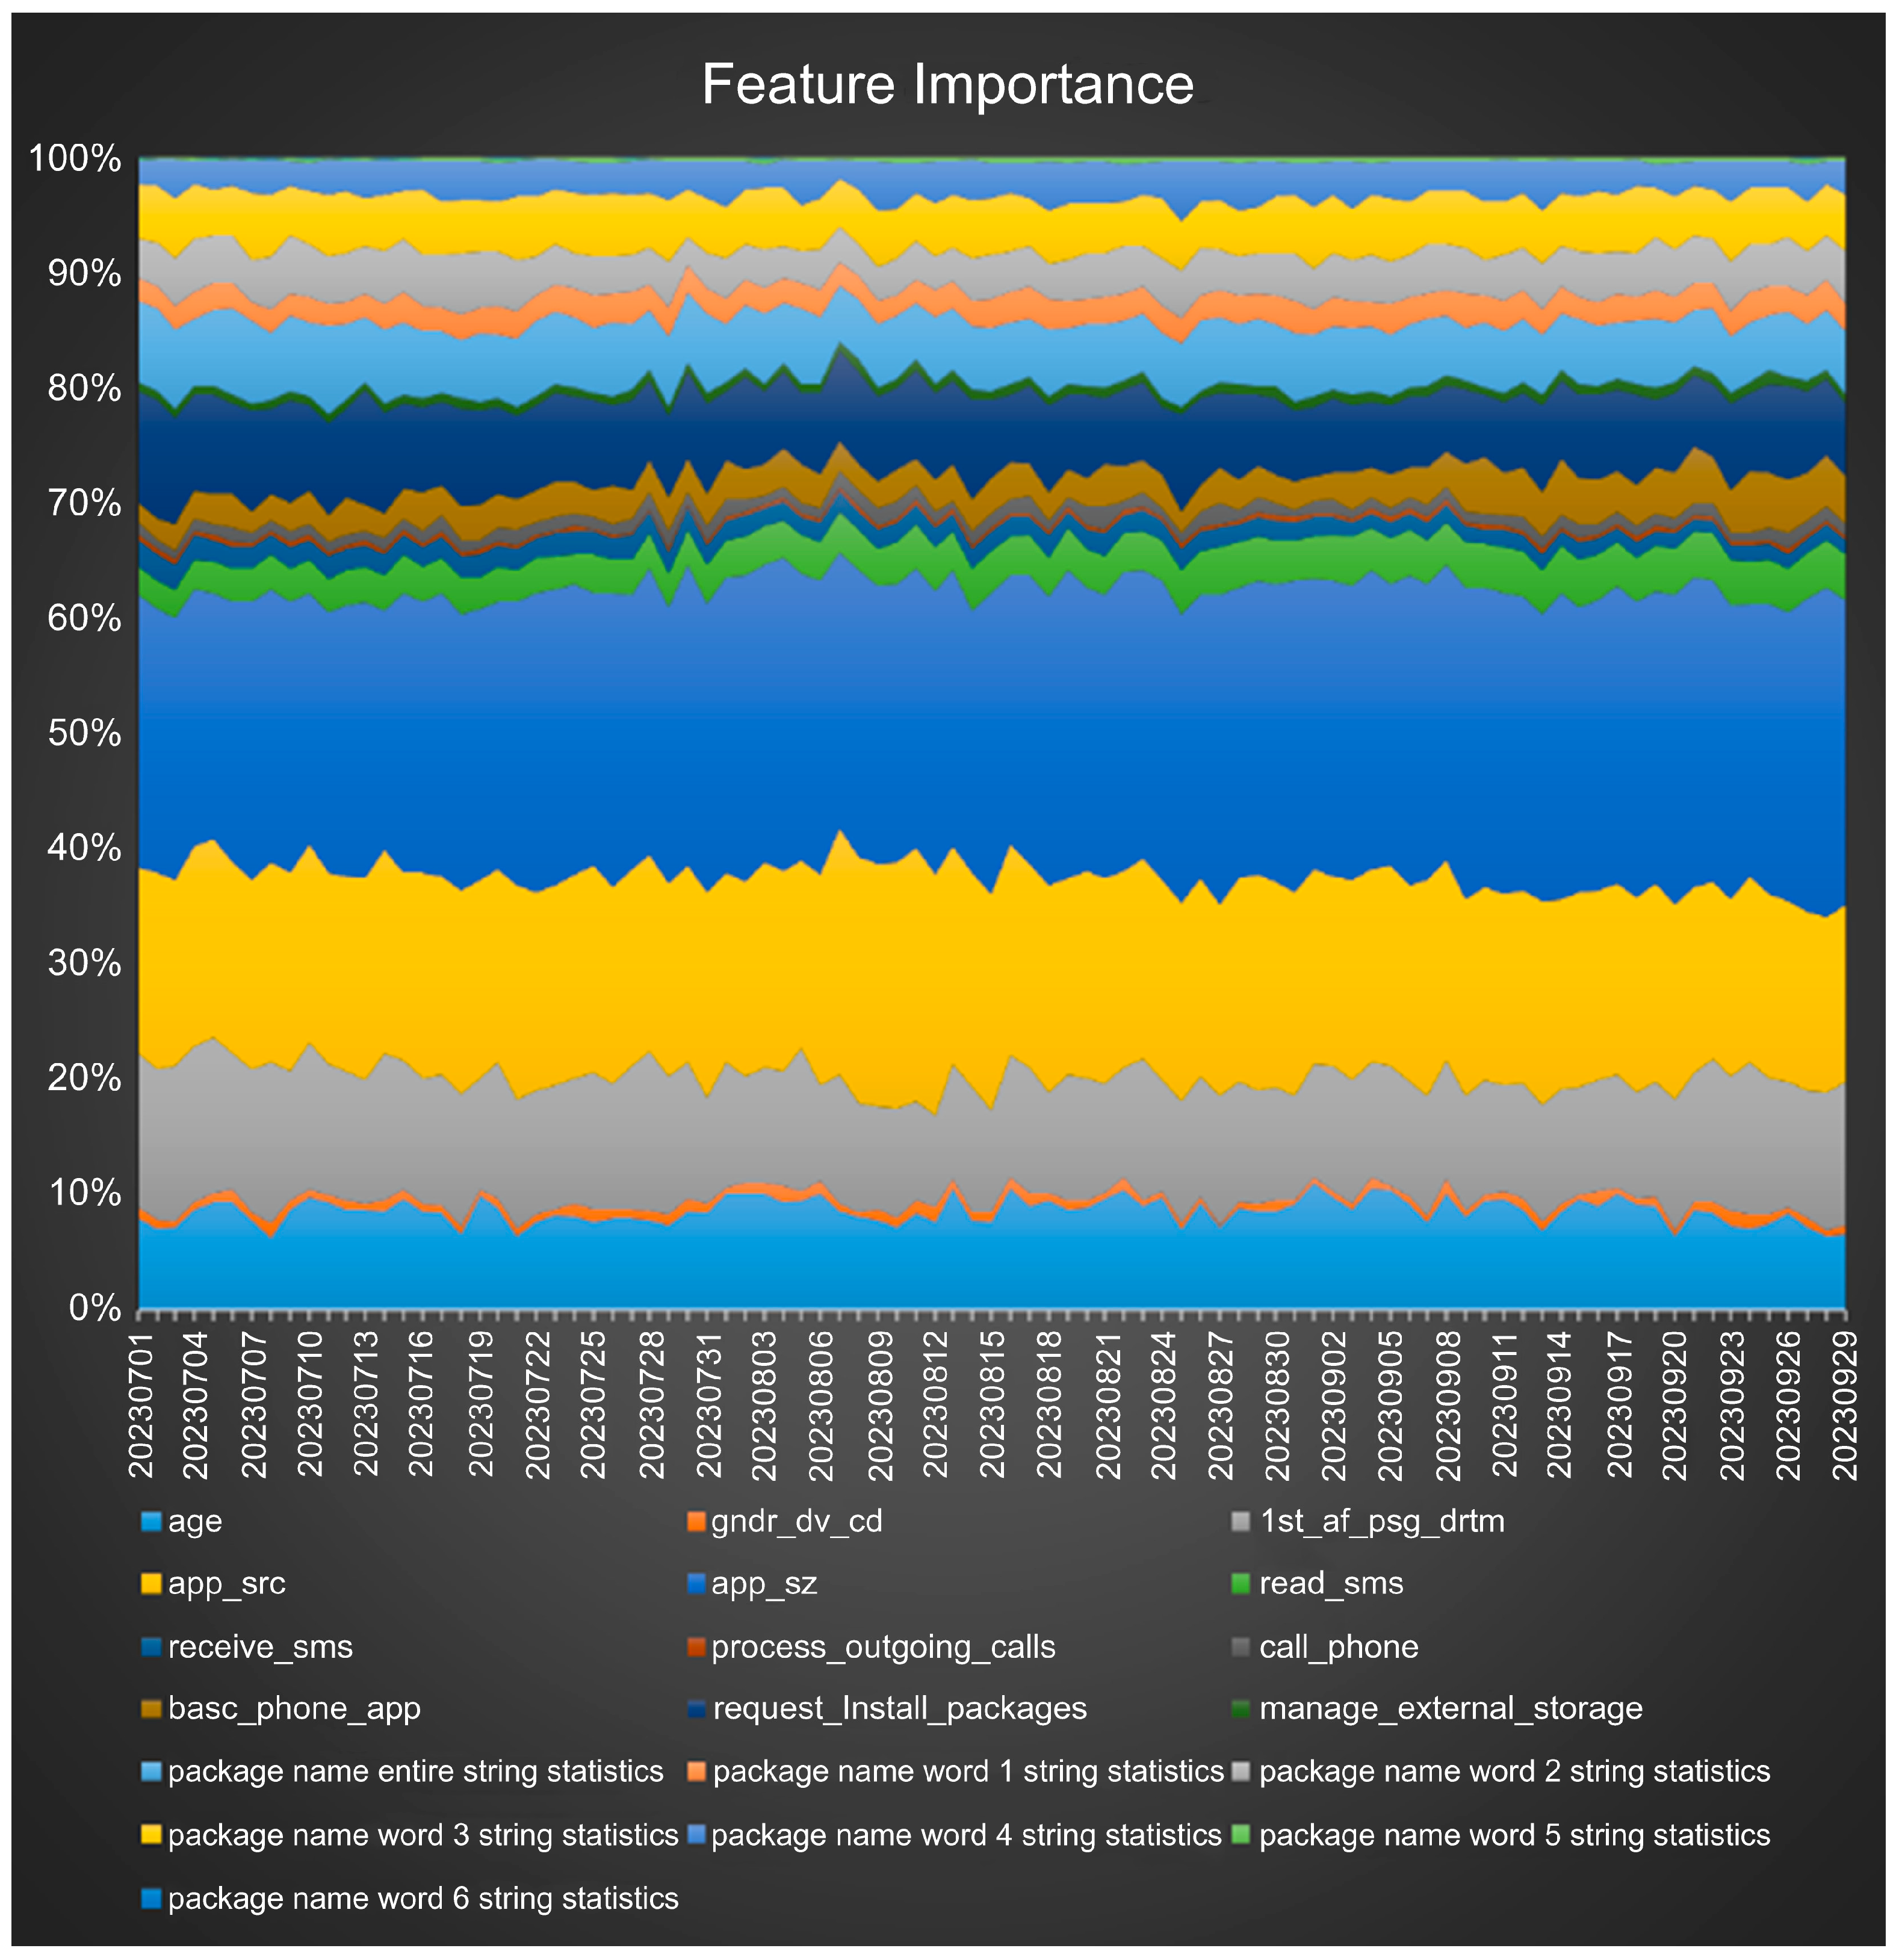
- Real-World Financial Data Utilization and Feature Engineering: The research leverages real-world financial fraud malware data from Bank A in South Korea. Seventy-one features were extracted from eight feature sets, and the accuracy of distinguishing between benign and malicious apps was enhanced by incorporating unique features such as “User activity”, “User information”, and “App package name statistics”, which differentiate this study from previous research.
- Extensive ML Model Comparison and Optimization: Multiple machine learning models, including logistic regression, random forest, LightGBM, XGBoost, and CatBoost, were evaluated. Optimized hyperparameters were determined using a grid search to enhance model performance.
- Scalable and High-Performance Malware Detection for Financial Institutions: The LightGBM model achieved an accuracy of 99.99% and an F1-score of 97.04%, demonstrating its effectiveness as a scalable, real-time cybersecurity solution for financial institutions.
2. Related Work
2.1. Static Analysis-Based Malware Detection
2.2. Dynamic Analysis-Based Malware Detection
2.3. Hybrid Analysis-Based Malware Detection
3. Proposed Malware Detection Approach
3.1. Data Collection
3.2. Feature Extraction
- Target: The “label” in the raw data to determine if an app is malicious. This was used as the dependent variable to train the model.
- App information: “App package name” and “app size” were selected from the raw data. Some information in “app size” was missing; therefore, a derived variable called “app size Null indicator” was added. “App name” was excluded from this study because it requires further research on natural language processing as it contains data in various languages, including English, Korean, Chinese, and Japanese.
- App permissions: These were extracted from the manifest.xml file. Permission information is a key element in determining whether an app is malicious, as evidenced by several related studies on static analysis of malware apps [10,25,27,29,33,35,37]. From the information on numerous permissions, this study utilized that on “read SMS permission”, “write SMS permission”, “process outgoing calls permission”, “call phone permission”, “request install packages permission”, and “manage external storage permission?”.
- App service: A service is a background component that runs independently of the user interface [62]. The services were also extracted from the manifest.xml file. In this study, only services that could determine the default phone app indicators were used.
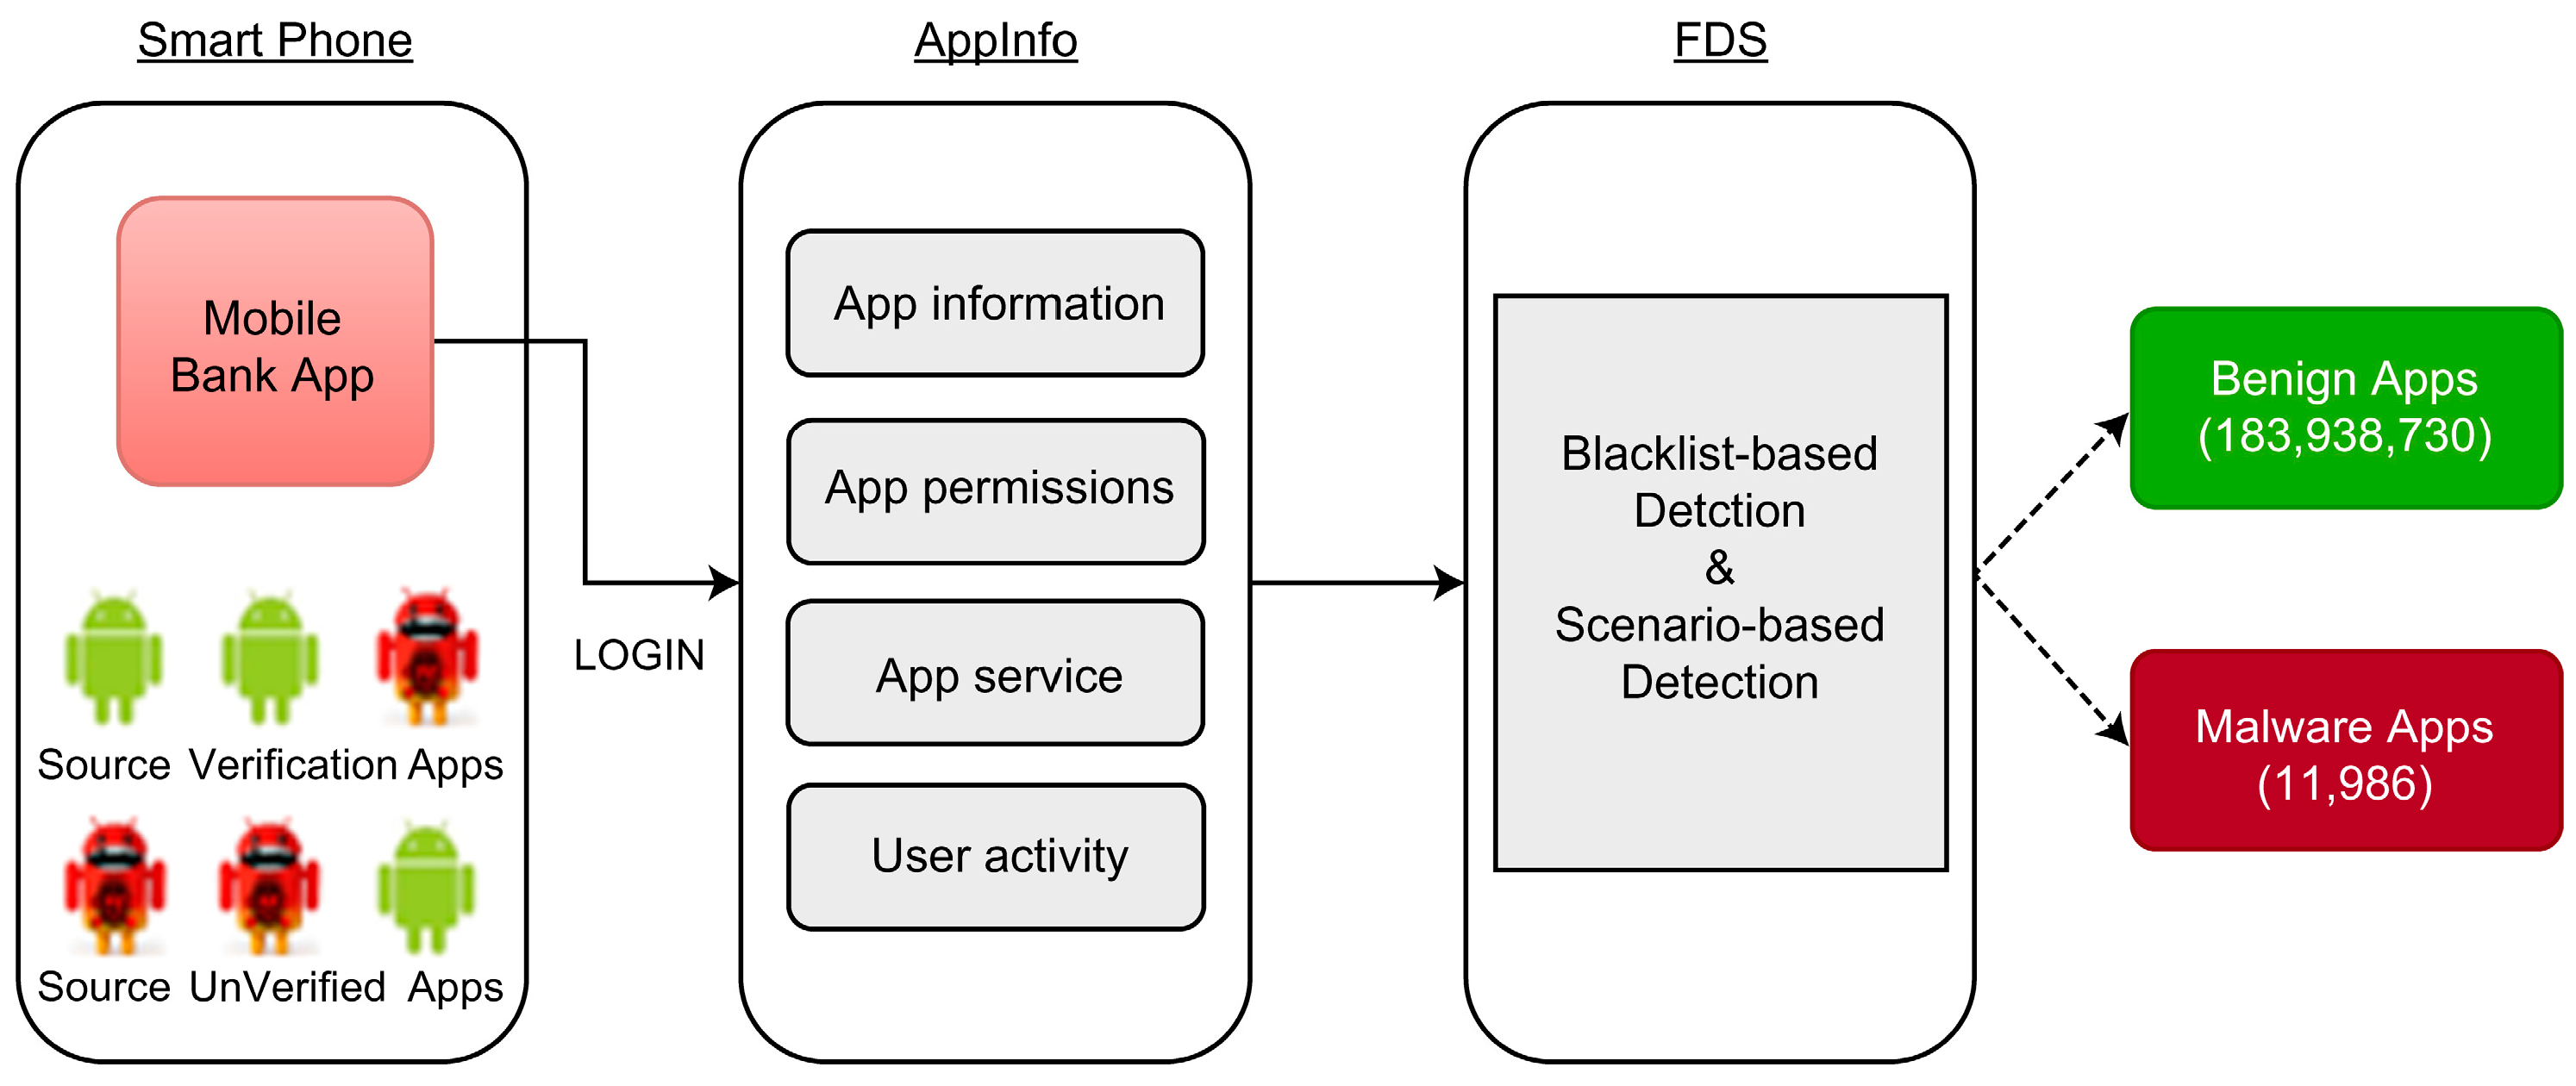
- User activity: Classification of elements changed by user activity. We utilized the “App source” and added “app source verification indicator”, “elapsed time after installation”, and “elapsed time after installation Null indicator” as derived variables. Most malicious applications that steal personal information are installed through illegal URLs rather than through publicly available app stores. Hence, “app source” information is crucial in determining whether an app is malicious.
- User information: The age range and sex of users who install malicious applications are considered important factors. Hence, customer information from Bank A was combined with the raw data to add “age”, “age Null indicator”, and “sex” as additional variables.
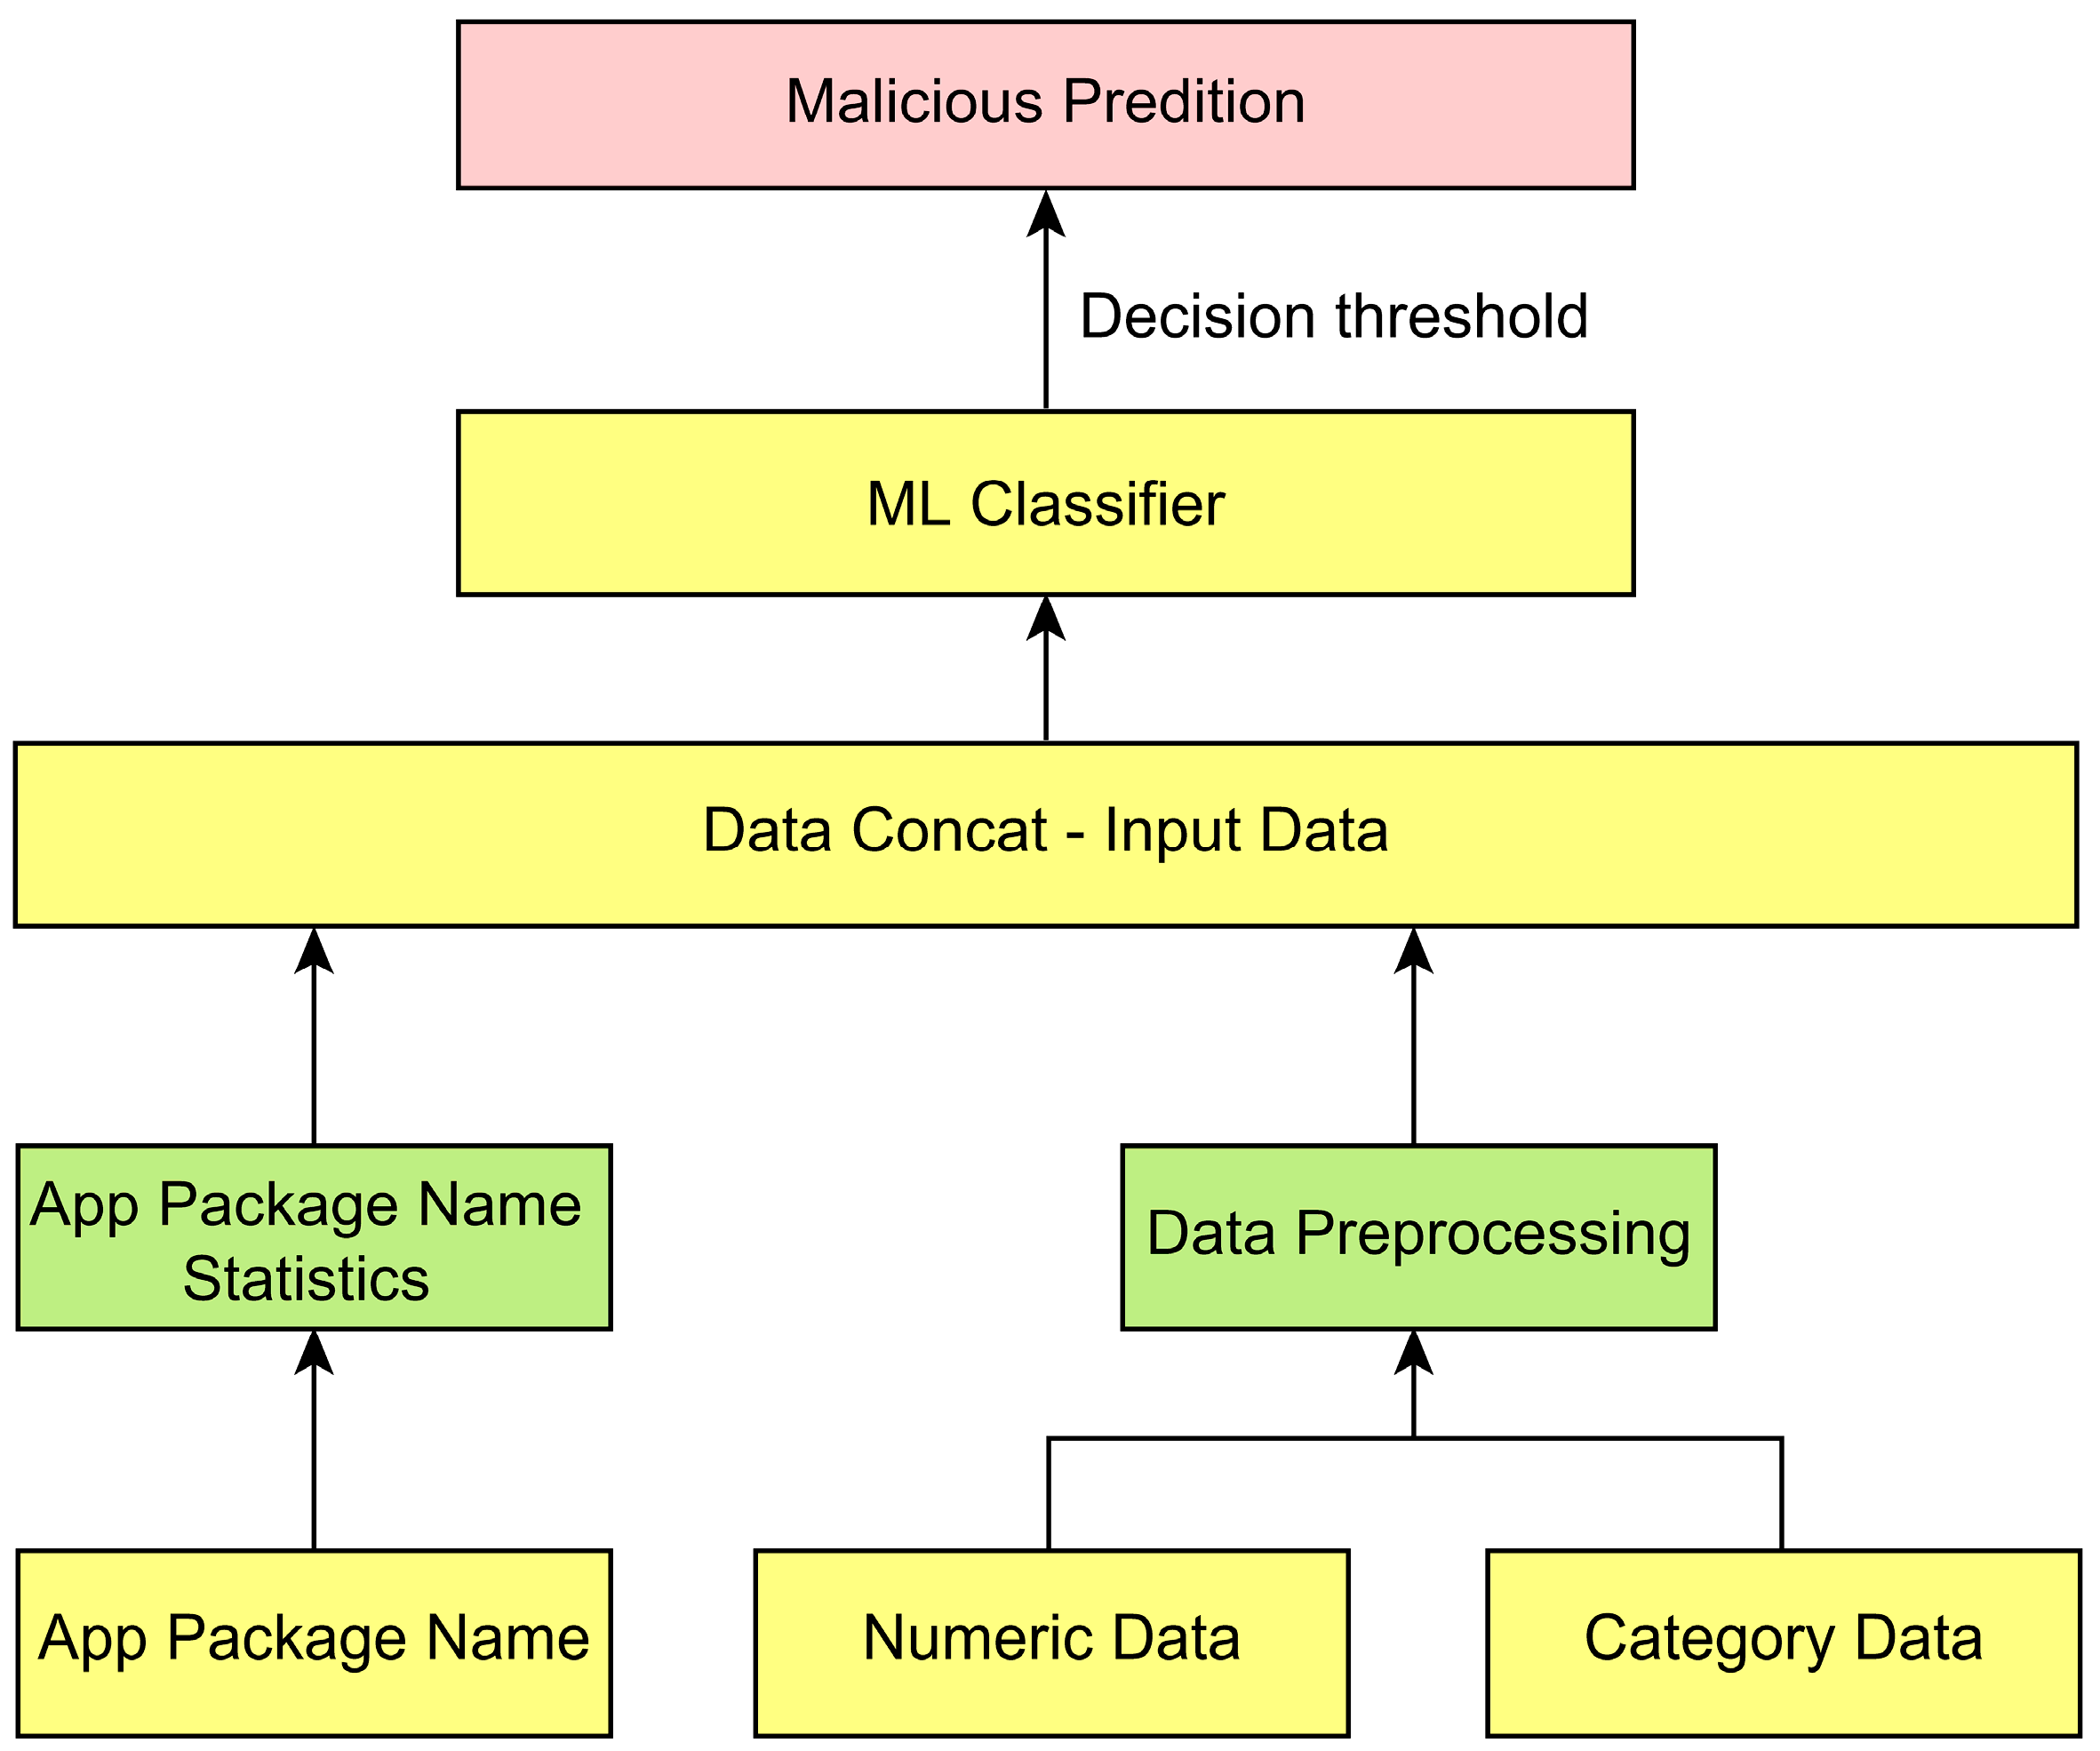
- App package name statistics: According to the analysis results of the app package names in the raw data, 99% of the app package names contained six or fewer words. The following derived variables were created and added to learn the package name patterns: the length of each word up to the sixth word separated by “?”. for the entire package name string, the number of words, the standard deviation of word length, the ratio of numbers, the ratio of vowels, the ratio of consonants, the ratio of maximum consecutive numbers, the ratio of maximum consecutive vowels, and the ratio of maximum consecutive consonants, respectively.
3.3. Data Preprocessing
- App size (app_sz): If a value is missing, it is replaced with 0, and the derived variable “app size Null indicator (app_sz_yn)” is created. If “app_sz” is missing, “app_sz_yn” is set to 1, and if not, it is set to 0.
- Elapsed time after installation (ist_af_psg_drtm): If a value is negative or missing, it is replaced with 0, and the derived variable “elapsed time after installation (ist_af_psg_drtm_yn)” is created. If “ist_af_psg_drtm” is missing, “ist_af_psg_drtm_yn” is set to 1, and if not, it is set to 0.
- Age (age): If a value is negative or missing, it is replaced with −1, and the “age Null indicator (age_yn)” is created as an additional variable. If “age” is missing, “age_yn” is set to 1, and if not, it is set to 0.
- App permissions: If the app permissions (read_sms to manage_external_storage) have missing values, they are replaced with “?”. For each permission value, set it to 1 if it is “Y”, 0 if it is “N”, and 1 if it is “?”.
- App service: If the app service (basc_phone_app) is missing a value, it is replaced with “?”. If the permission value is “Y” or “?”. The value was set to 1; if the permission value was “N”, it was set to 0.
3.4. Dataset
3.5. Algorithms
3.5.1. Logistic Regression
3.5.2. Random Forest
3.5.3. LightGBM
3.5.4. XGBoost
3.5.5. CatBoost
3.6. Construction of the Proposed Model
3.7. Evaluation Metrics
4. Experimental Results and Discussion
4.1. Model Evaluation
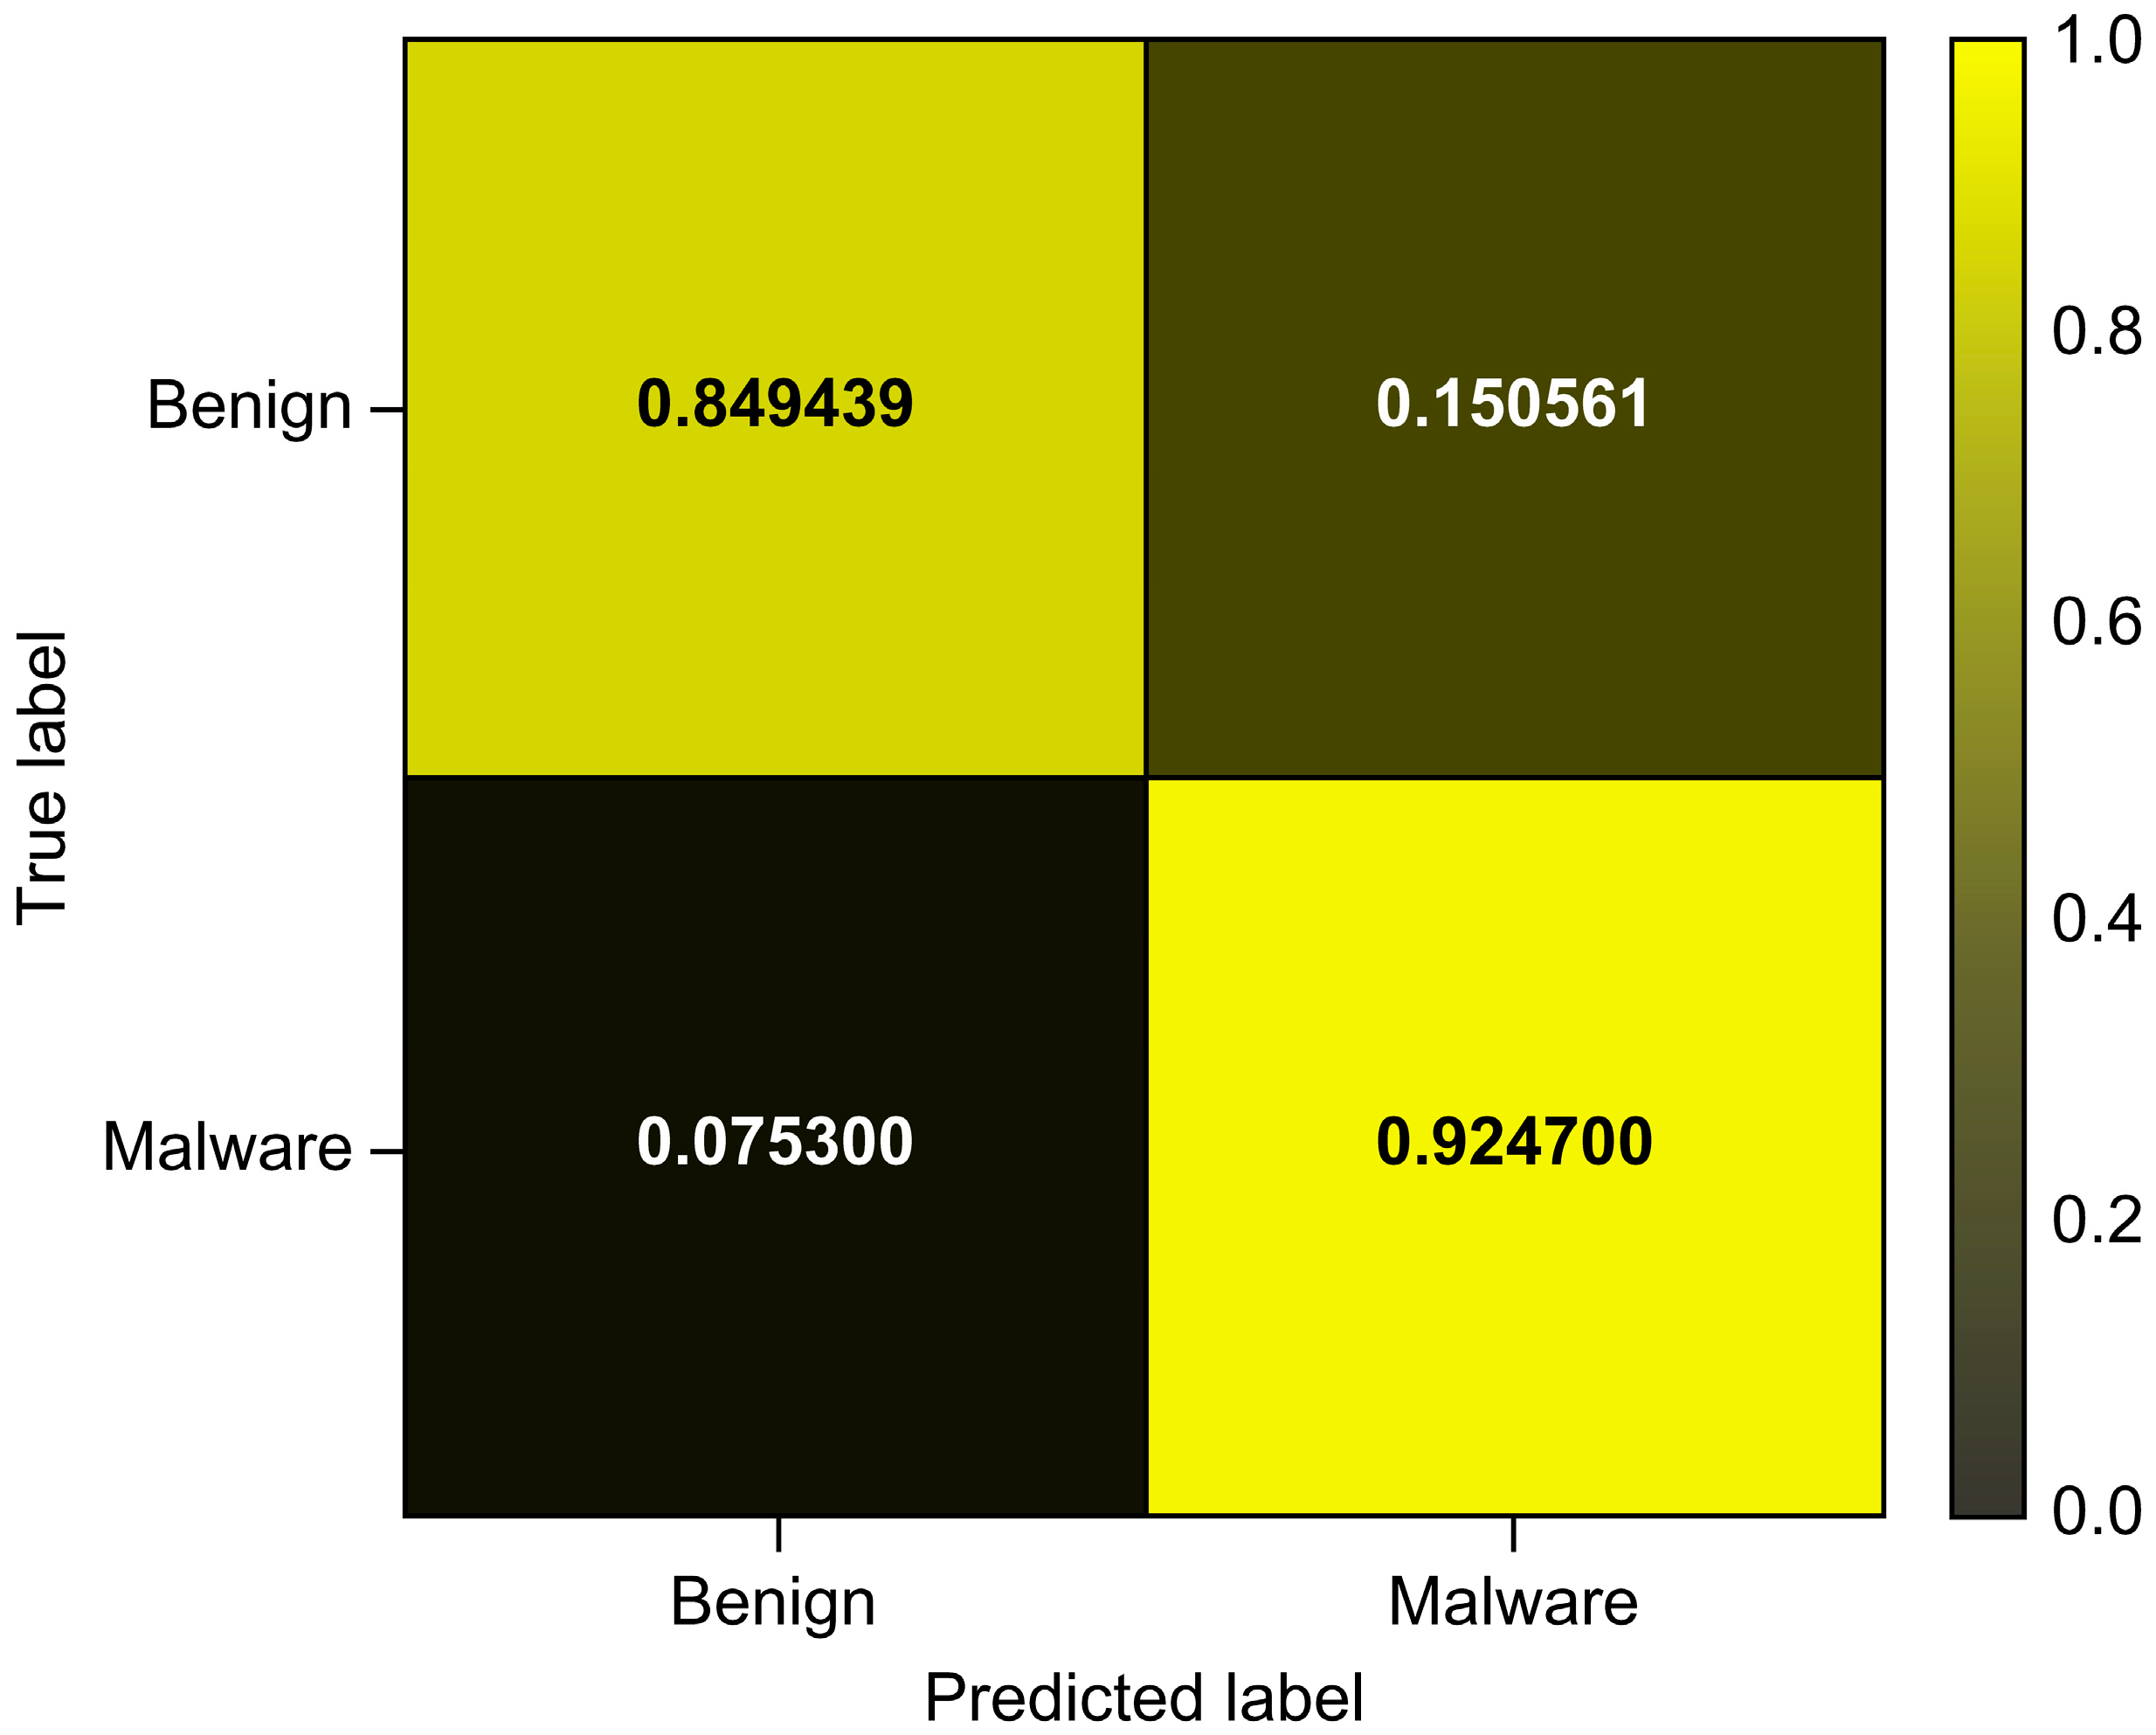
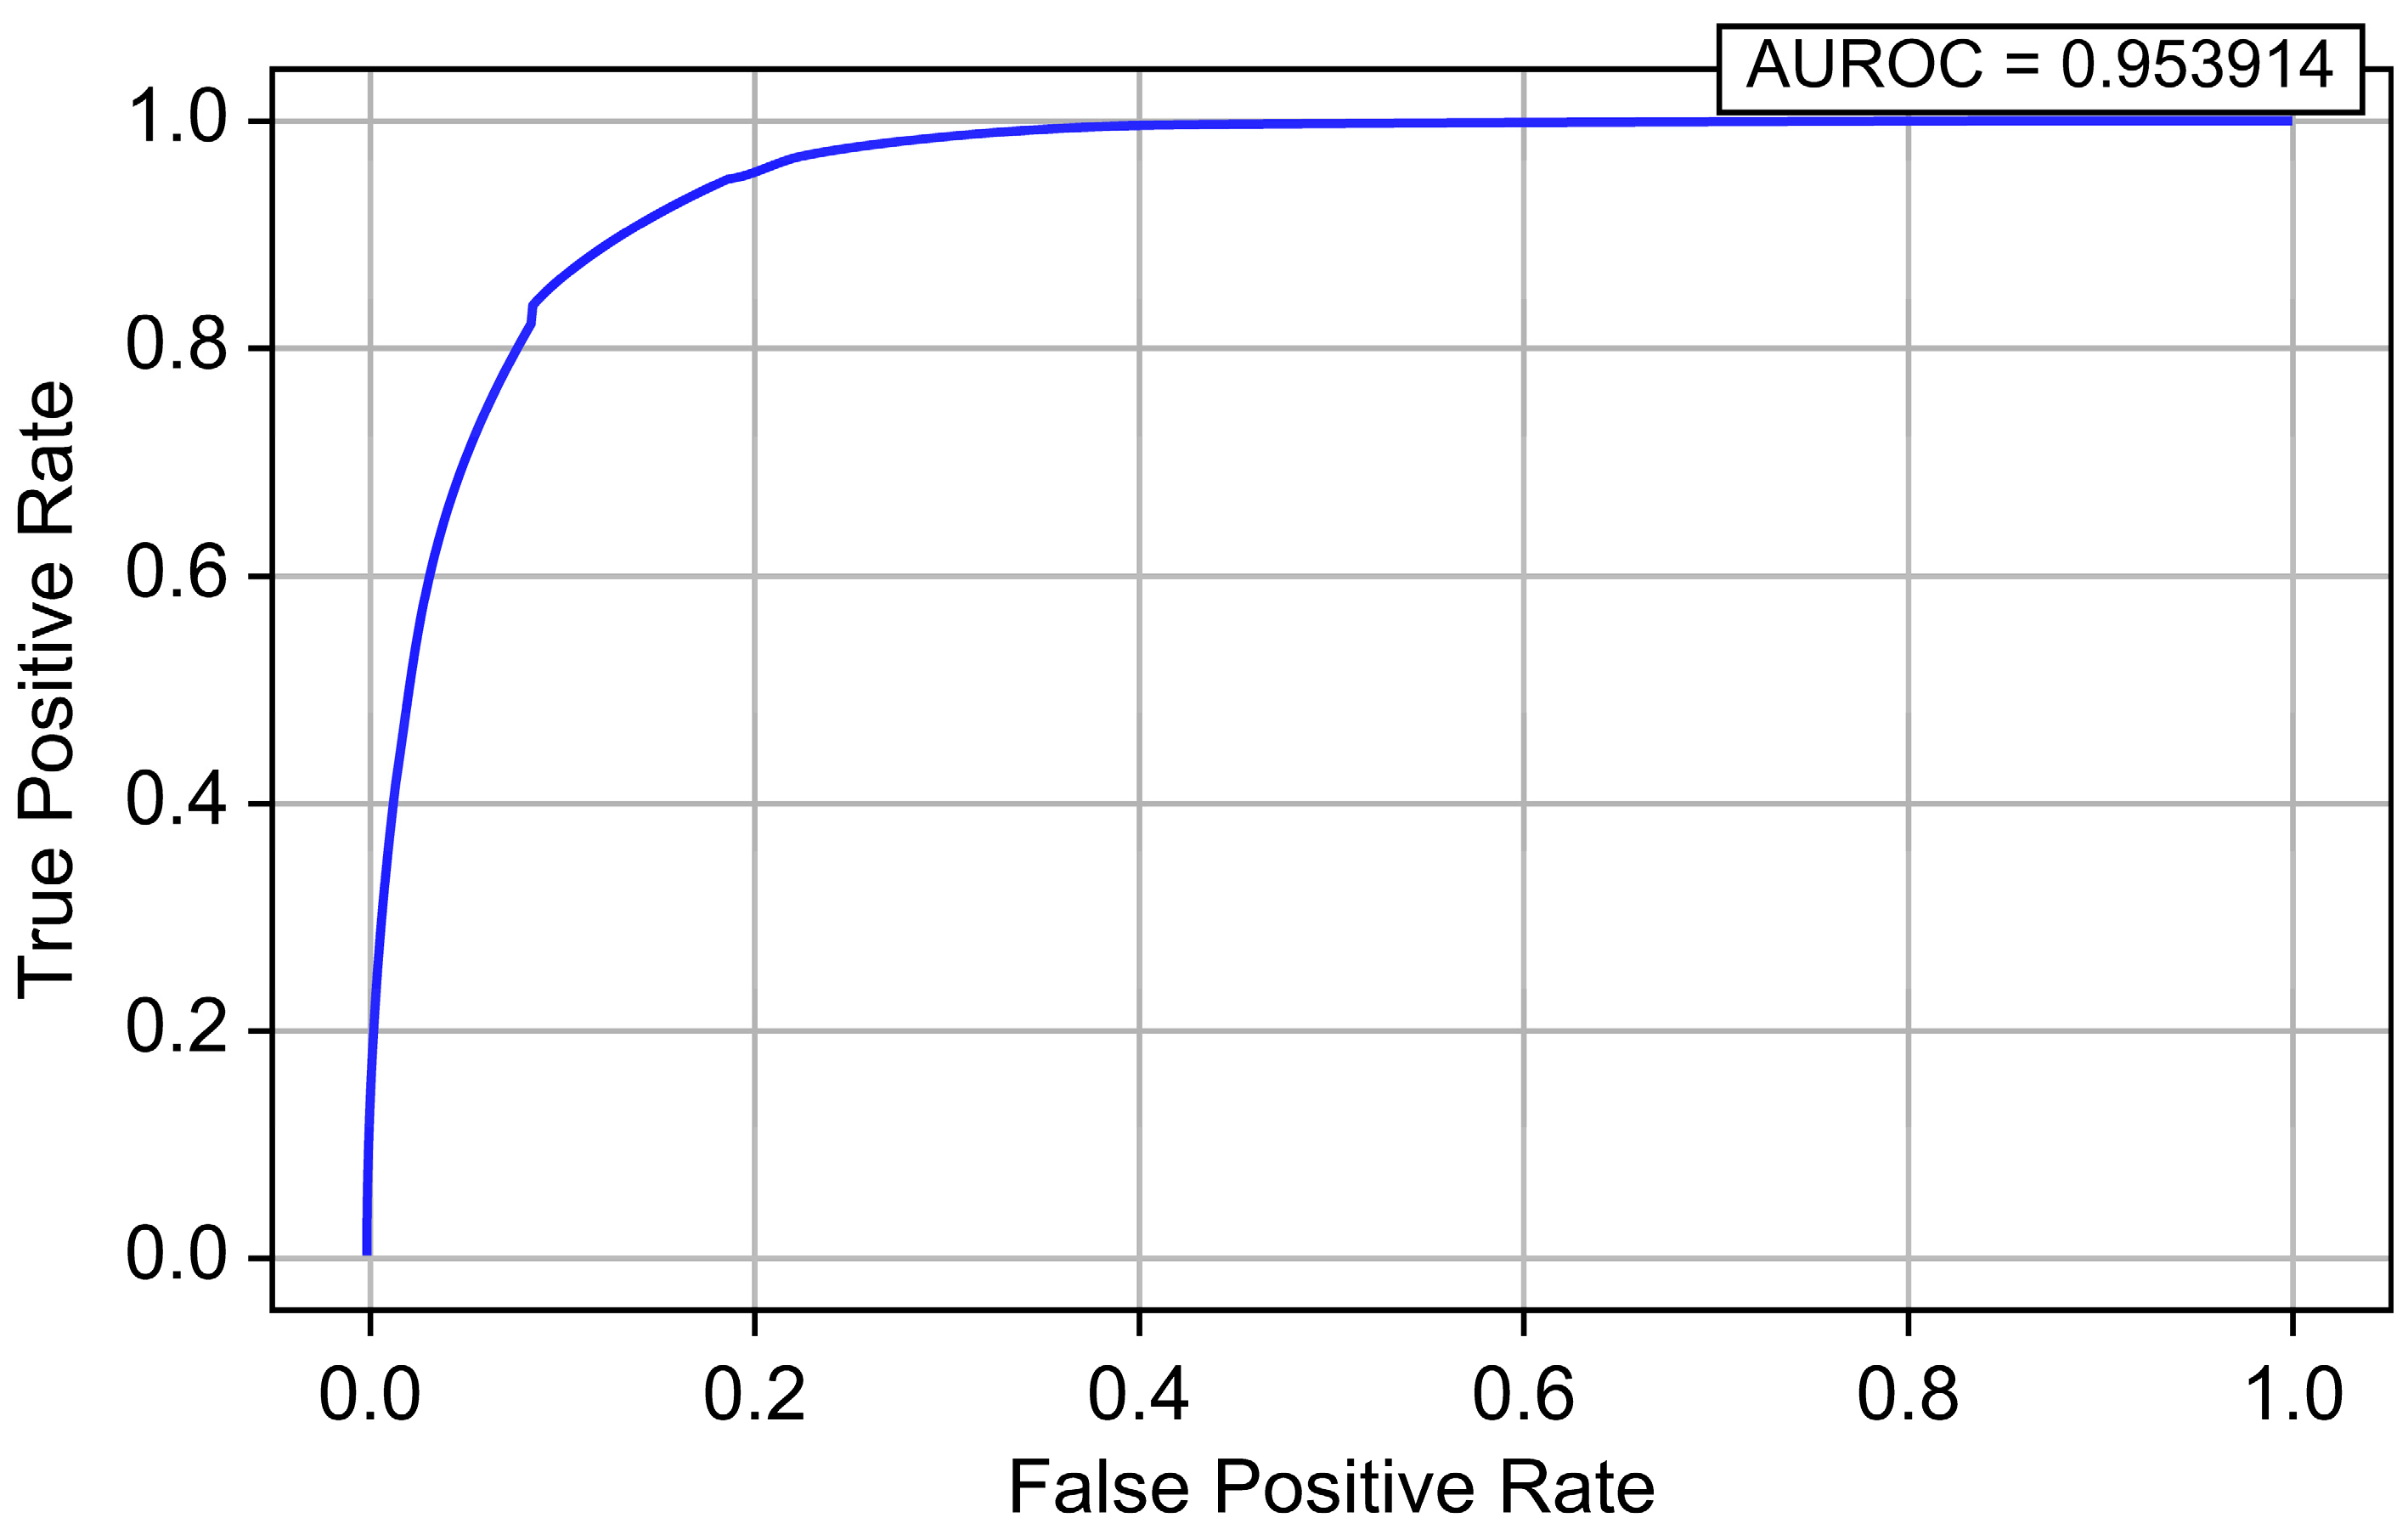
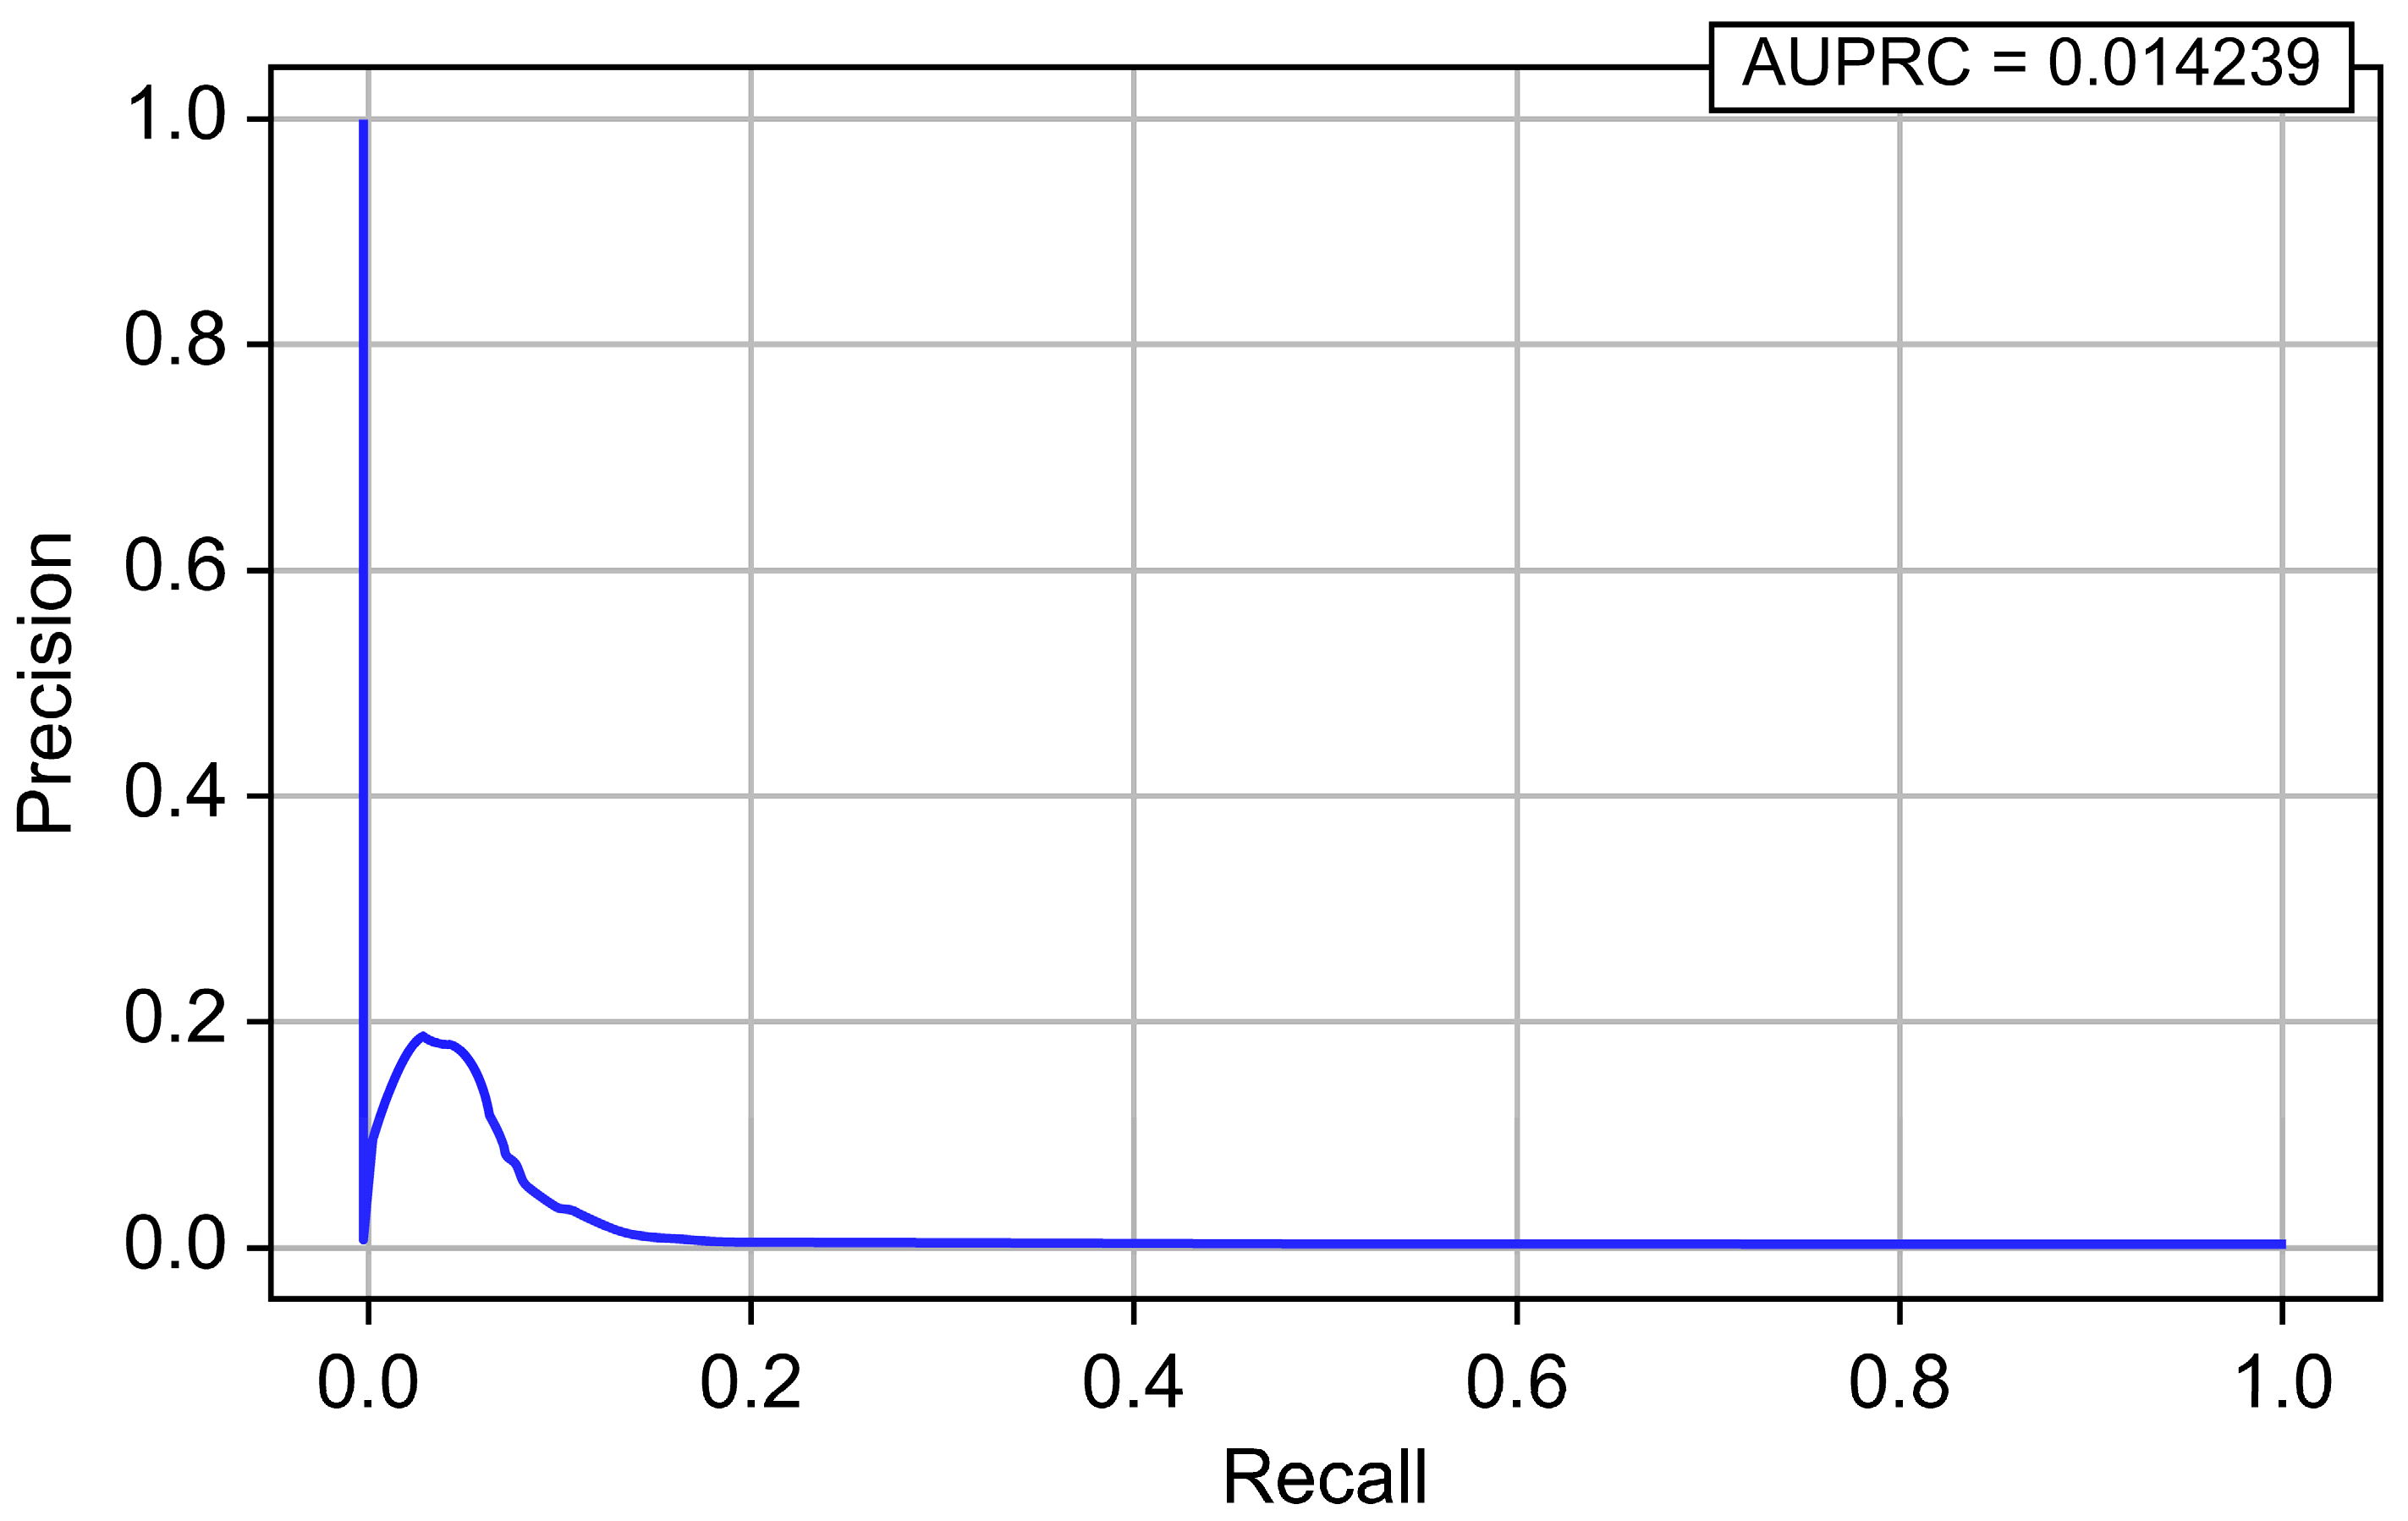
4.1.1. Evaluation of Logistic Regression
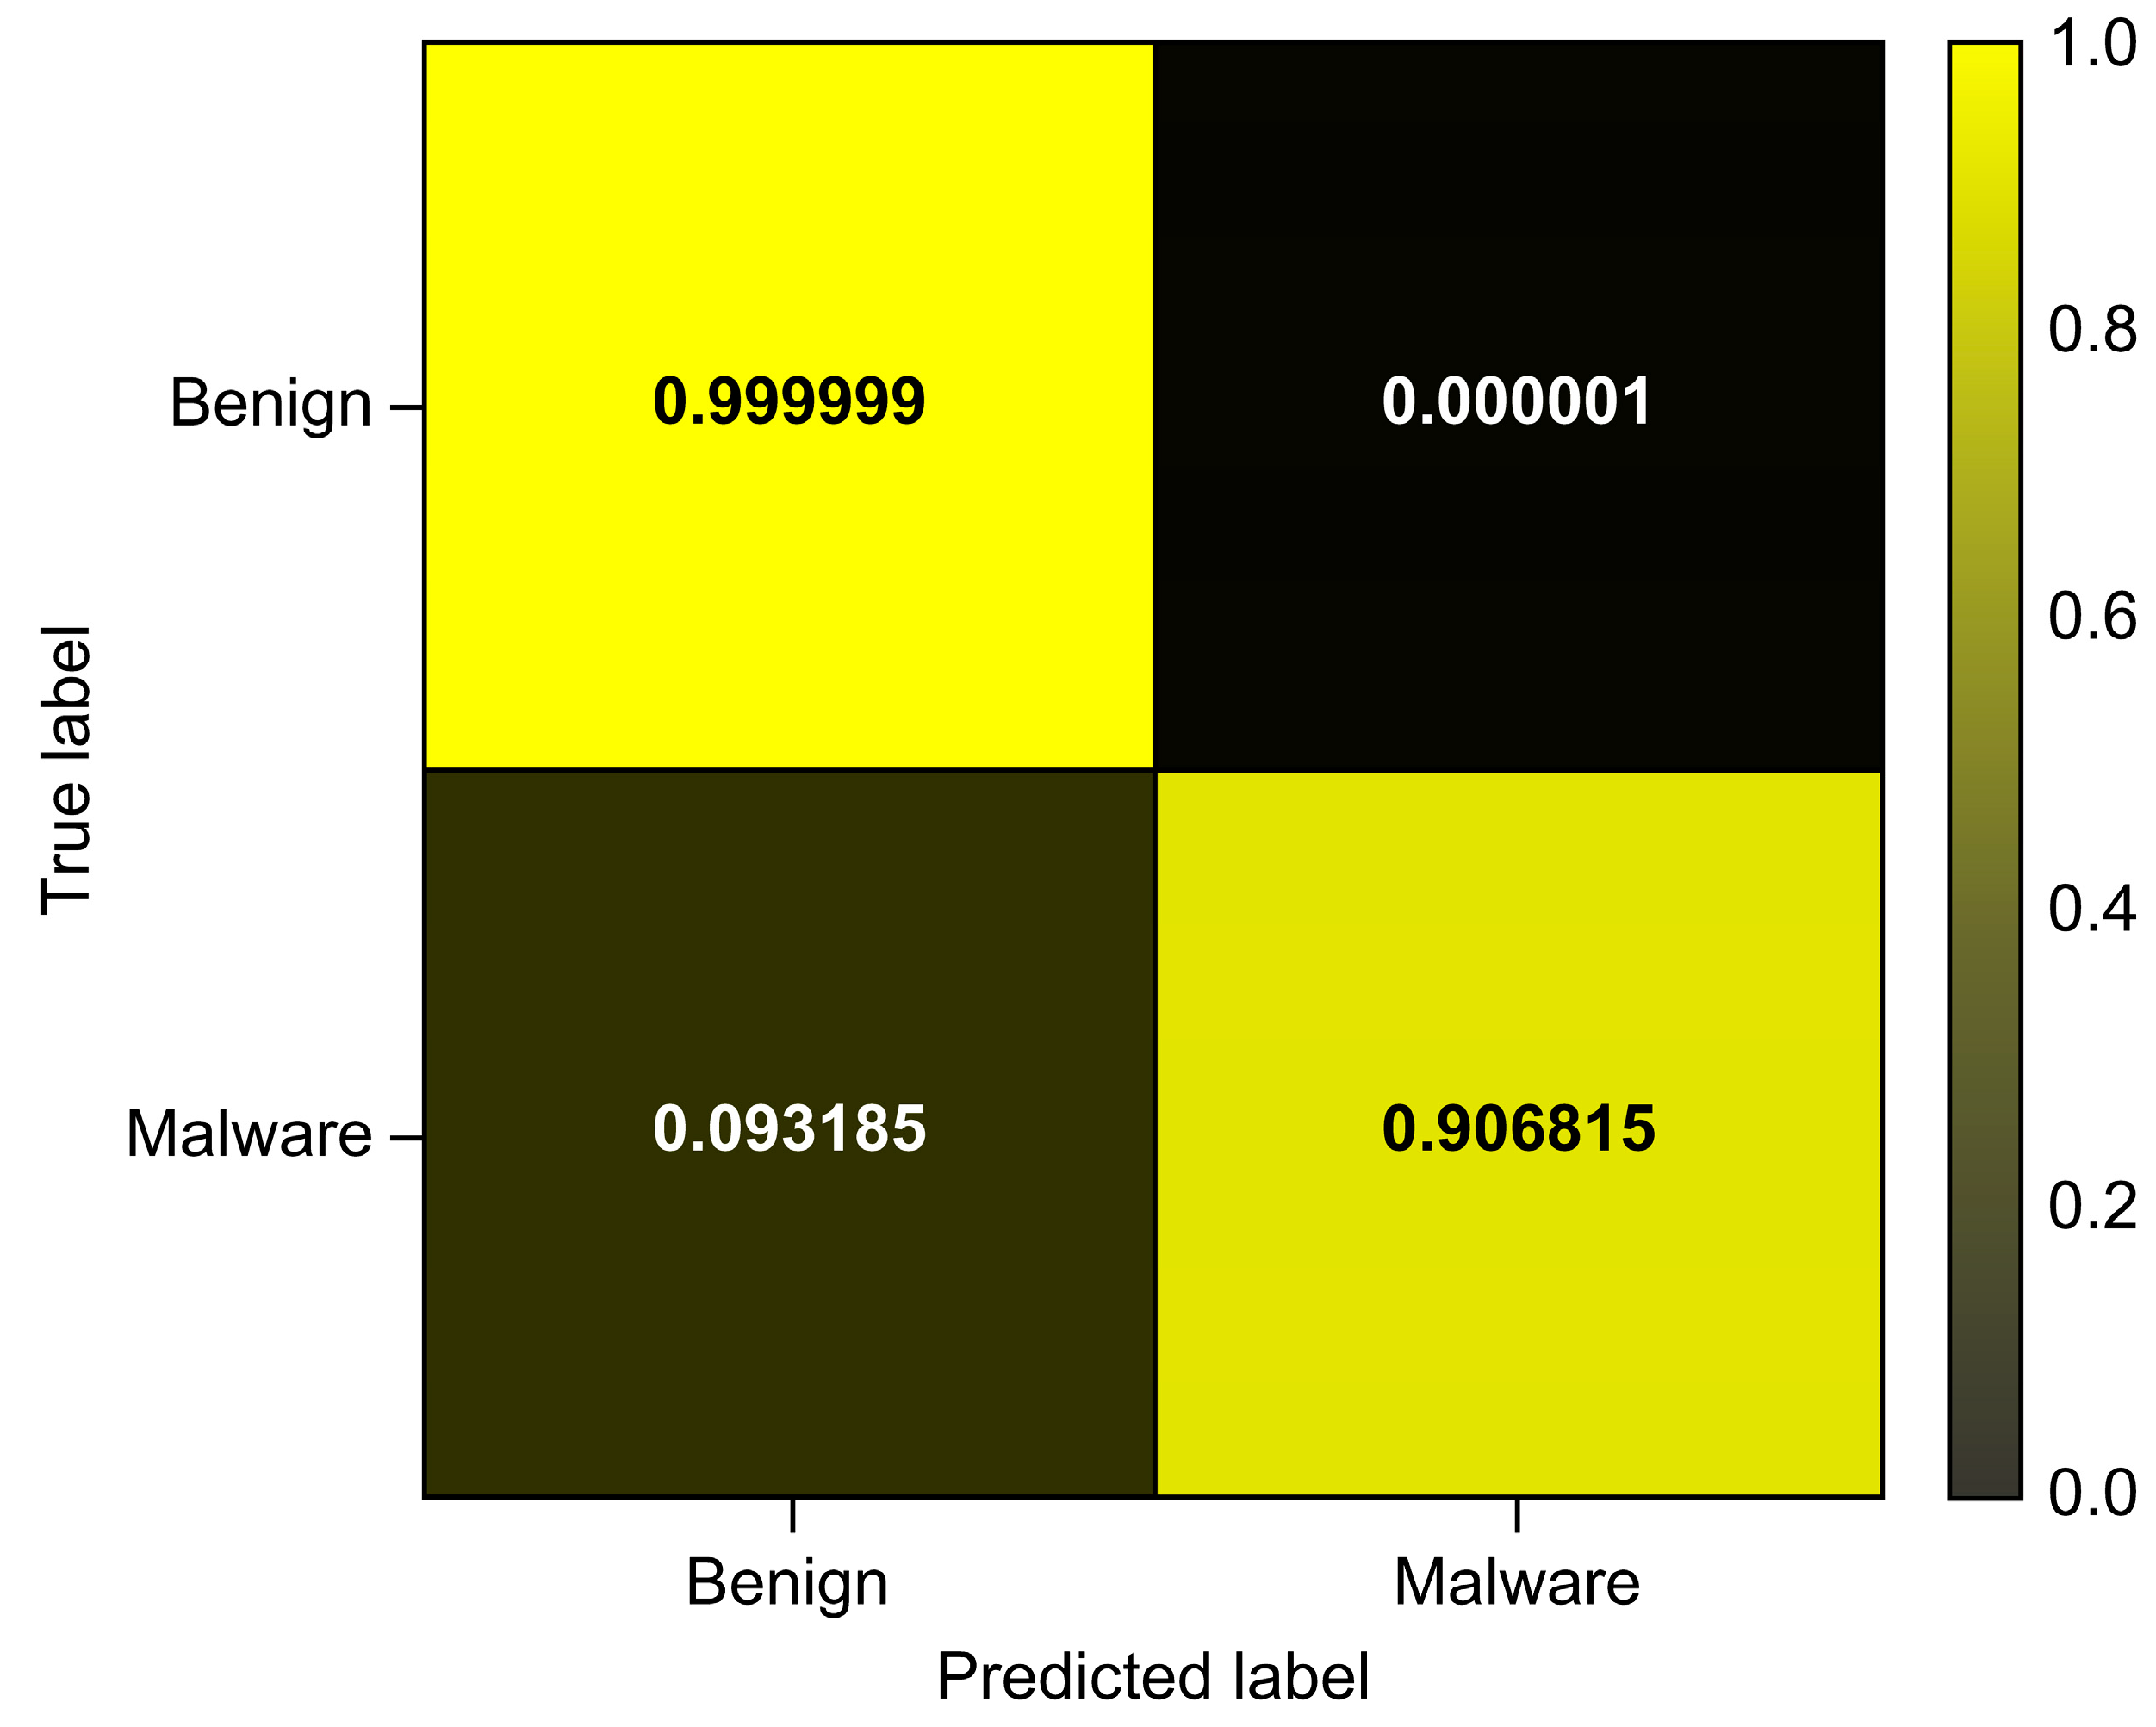
4.1.2. Evaluation of Random Forest
4.1.3. Evaluation of LightGBM
4.1.4. Evaluation of XGBoost
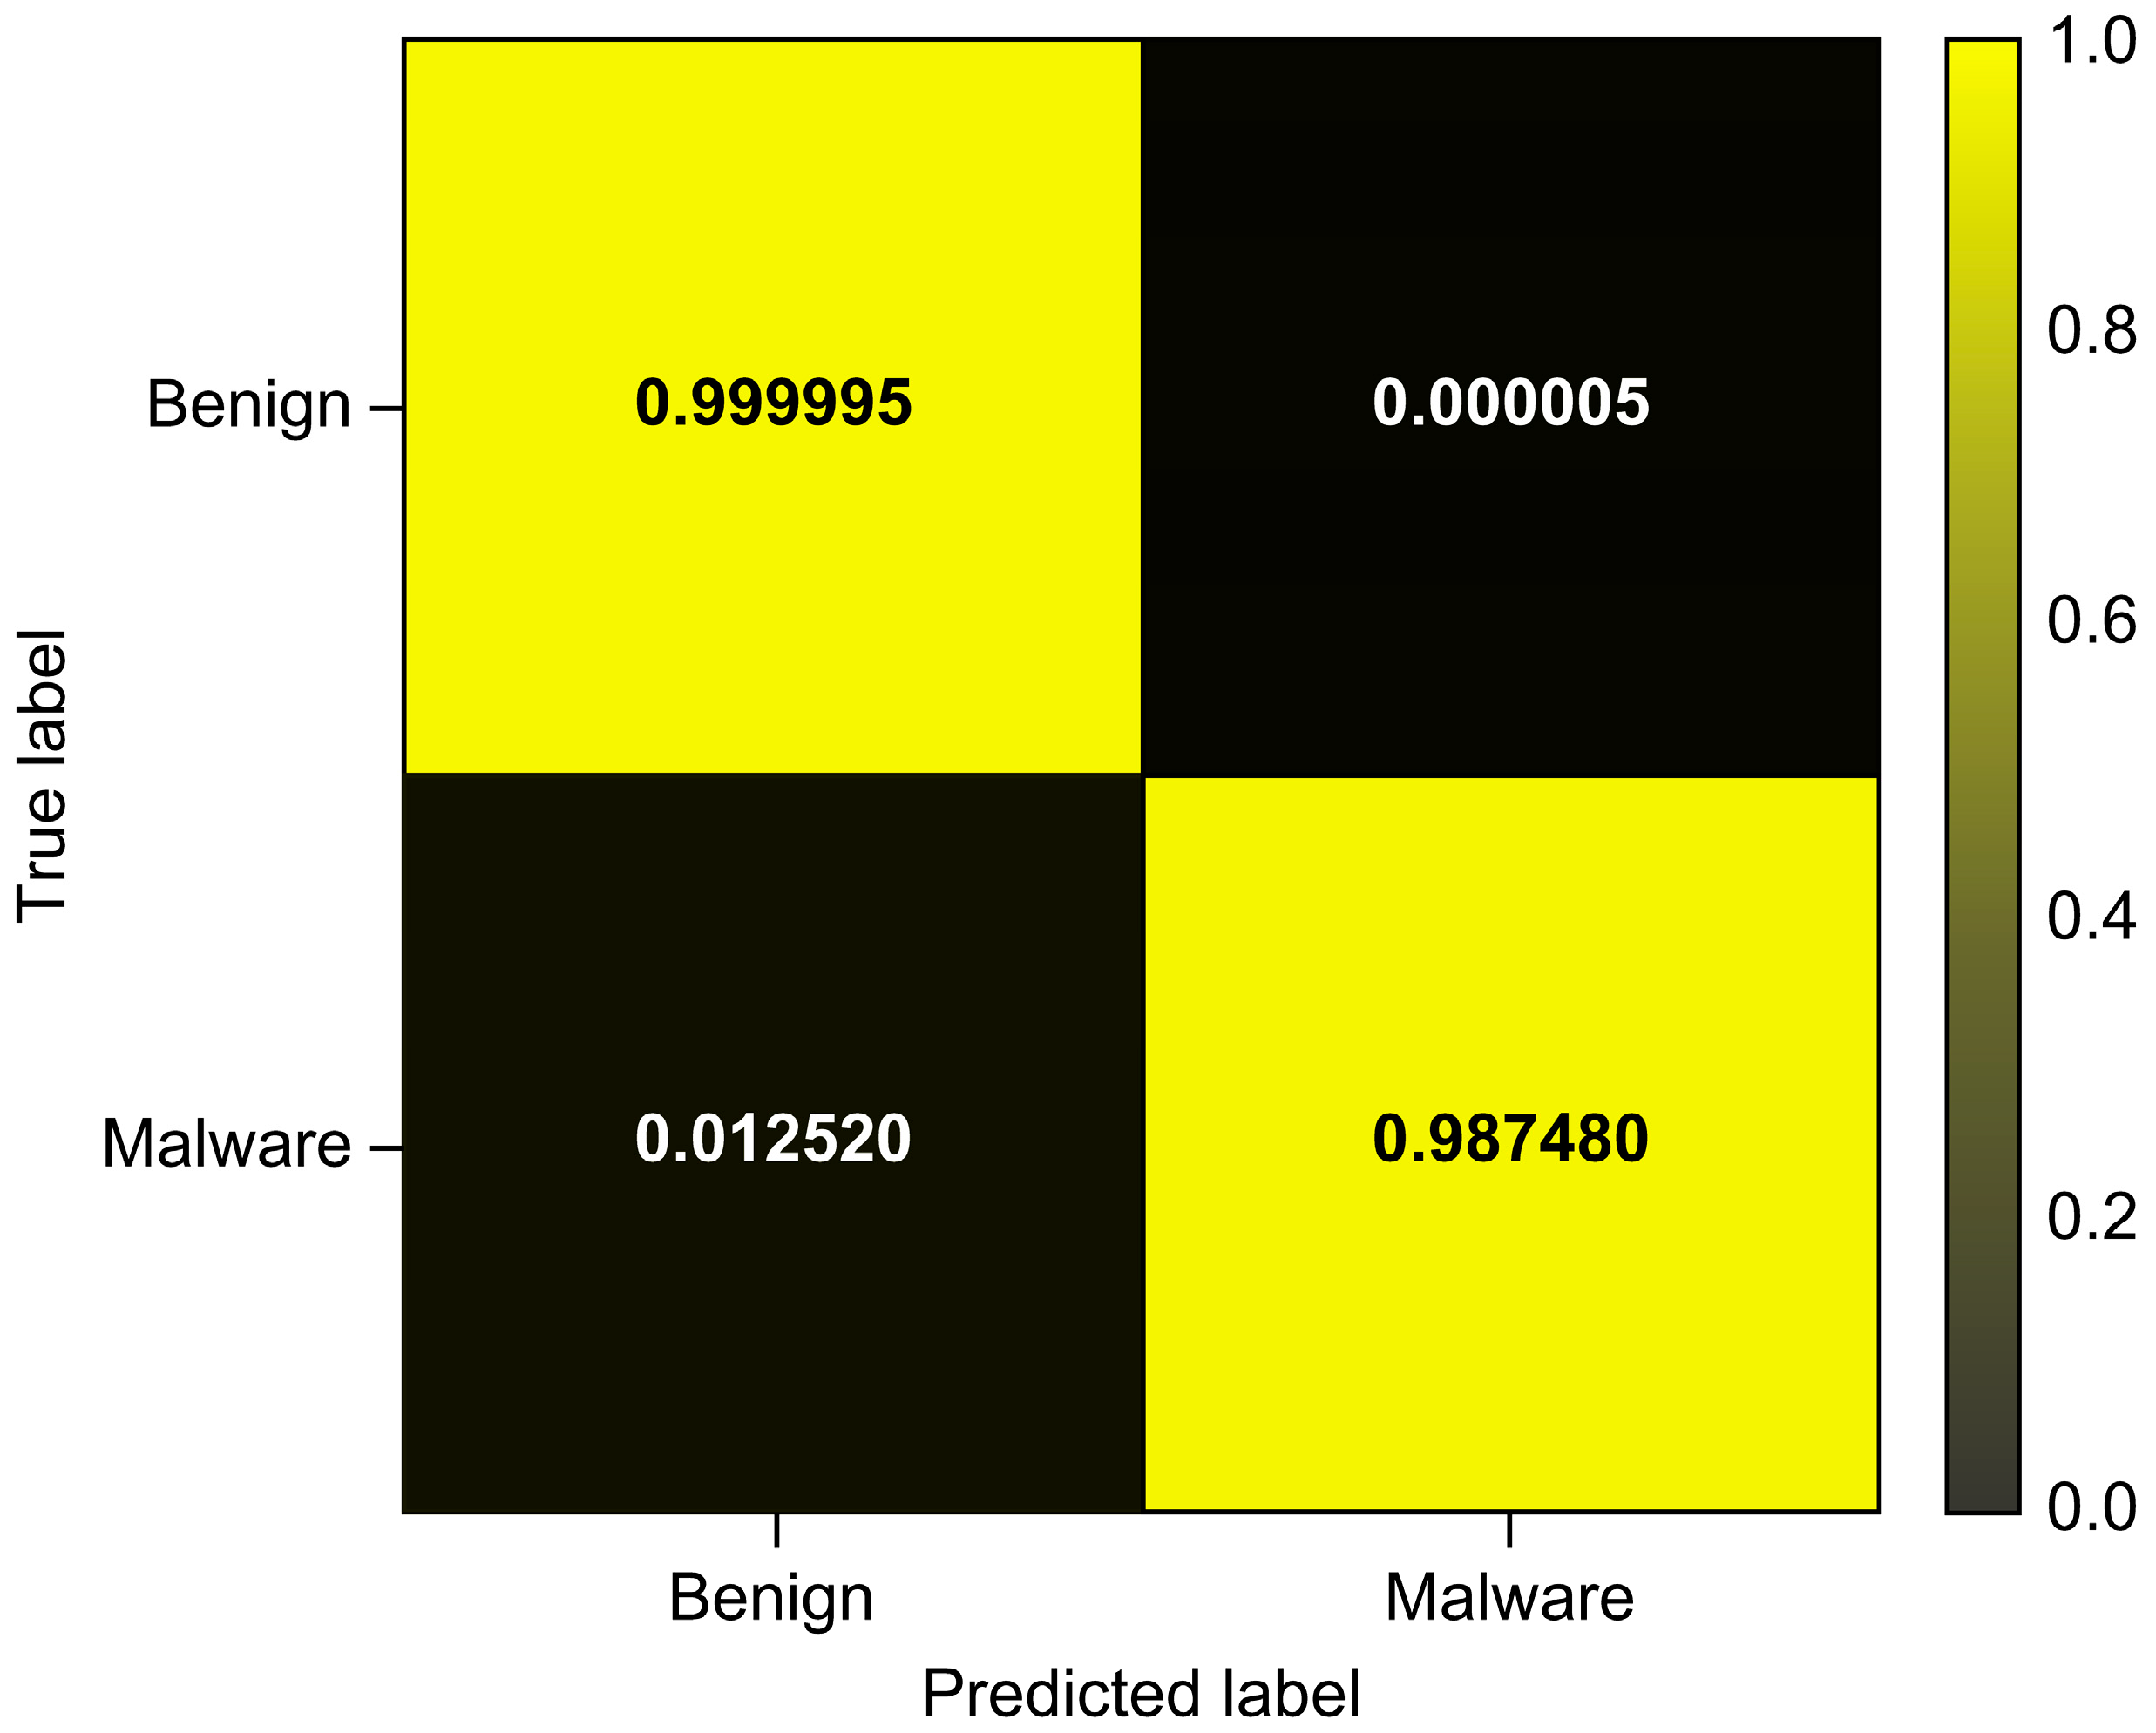
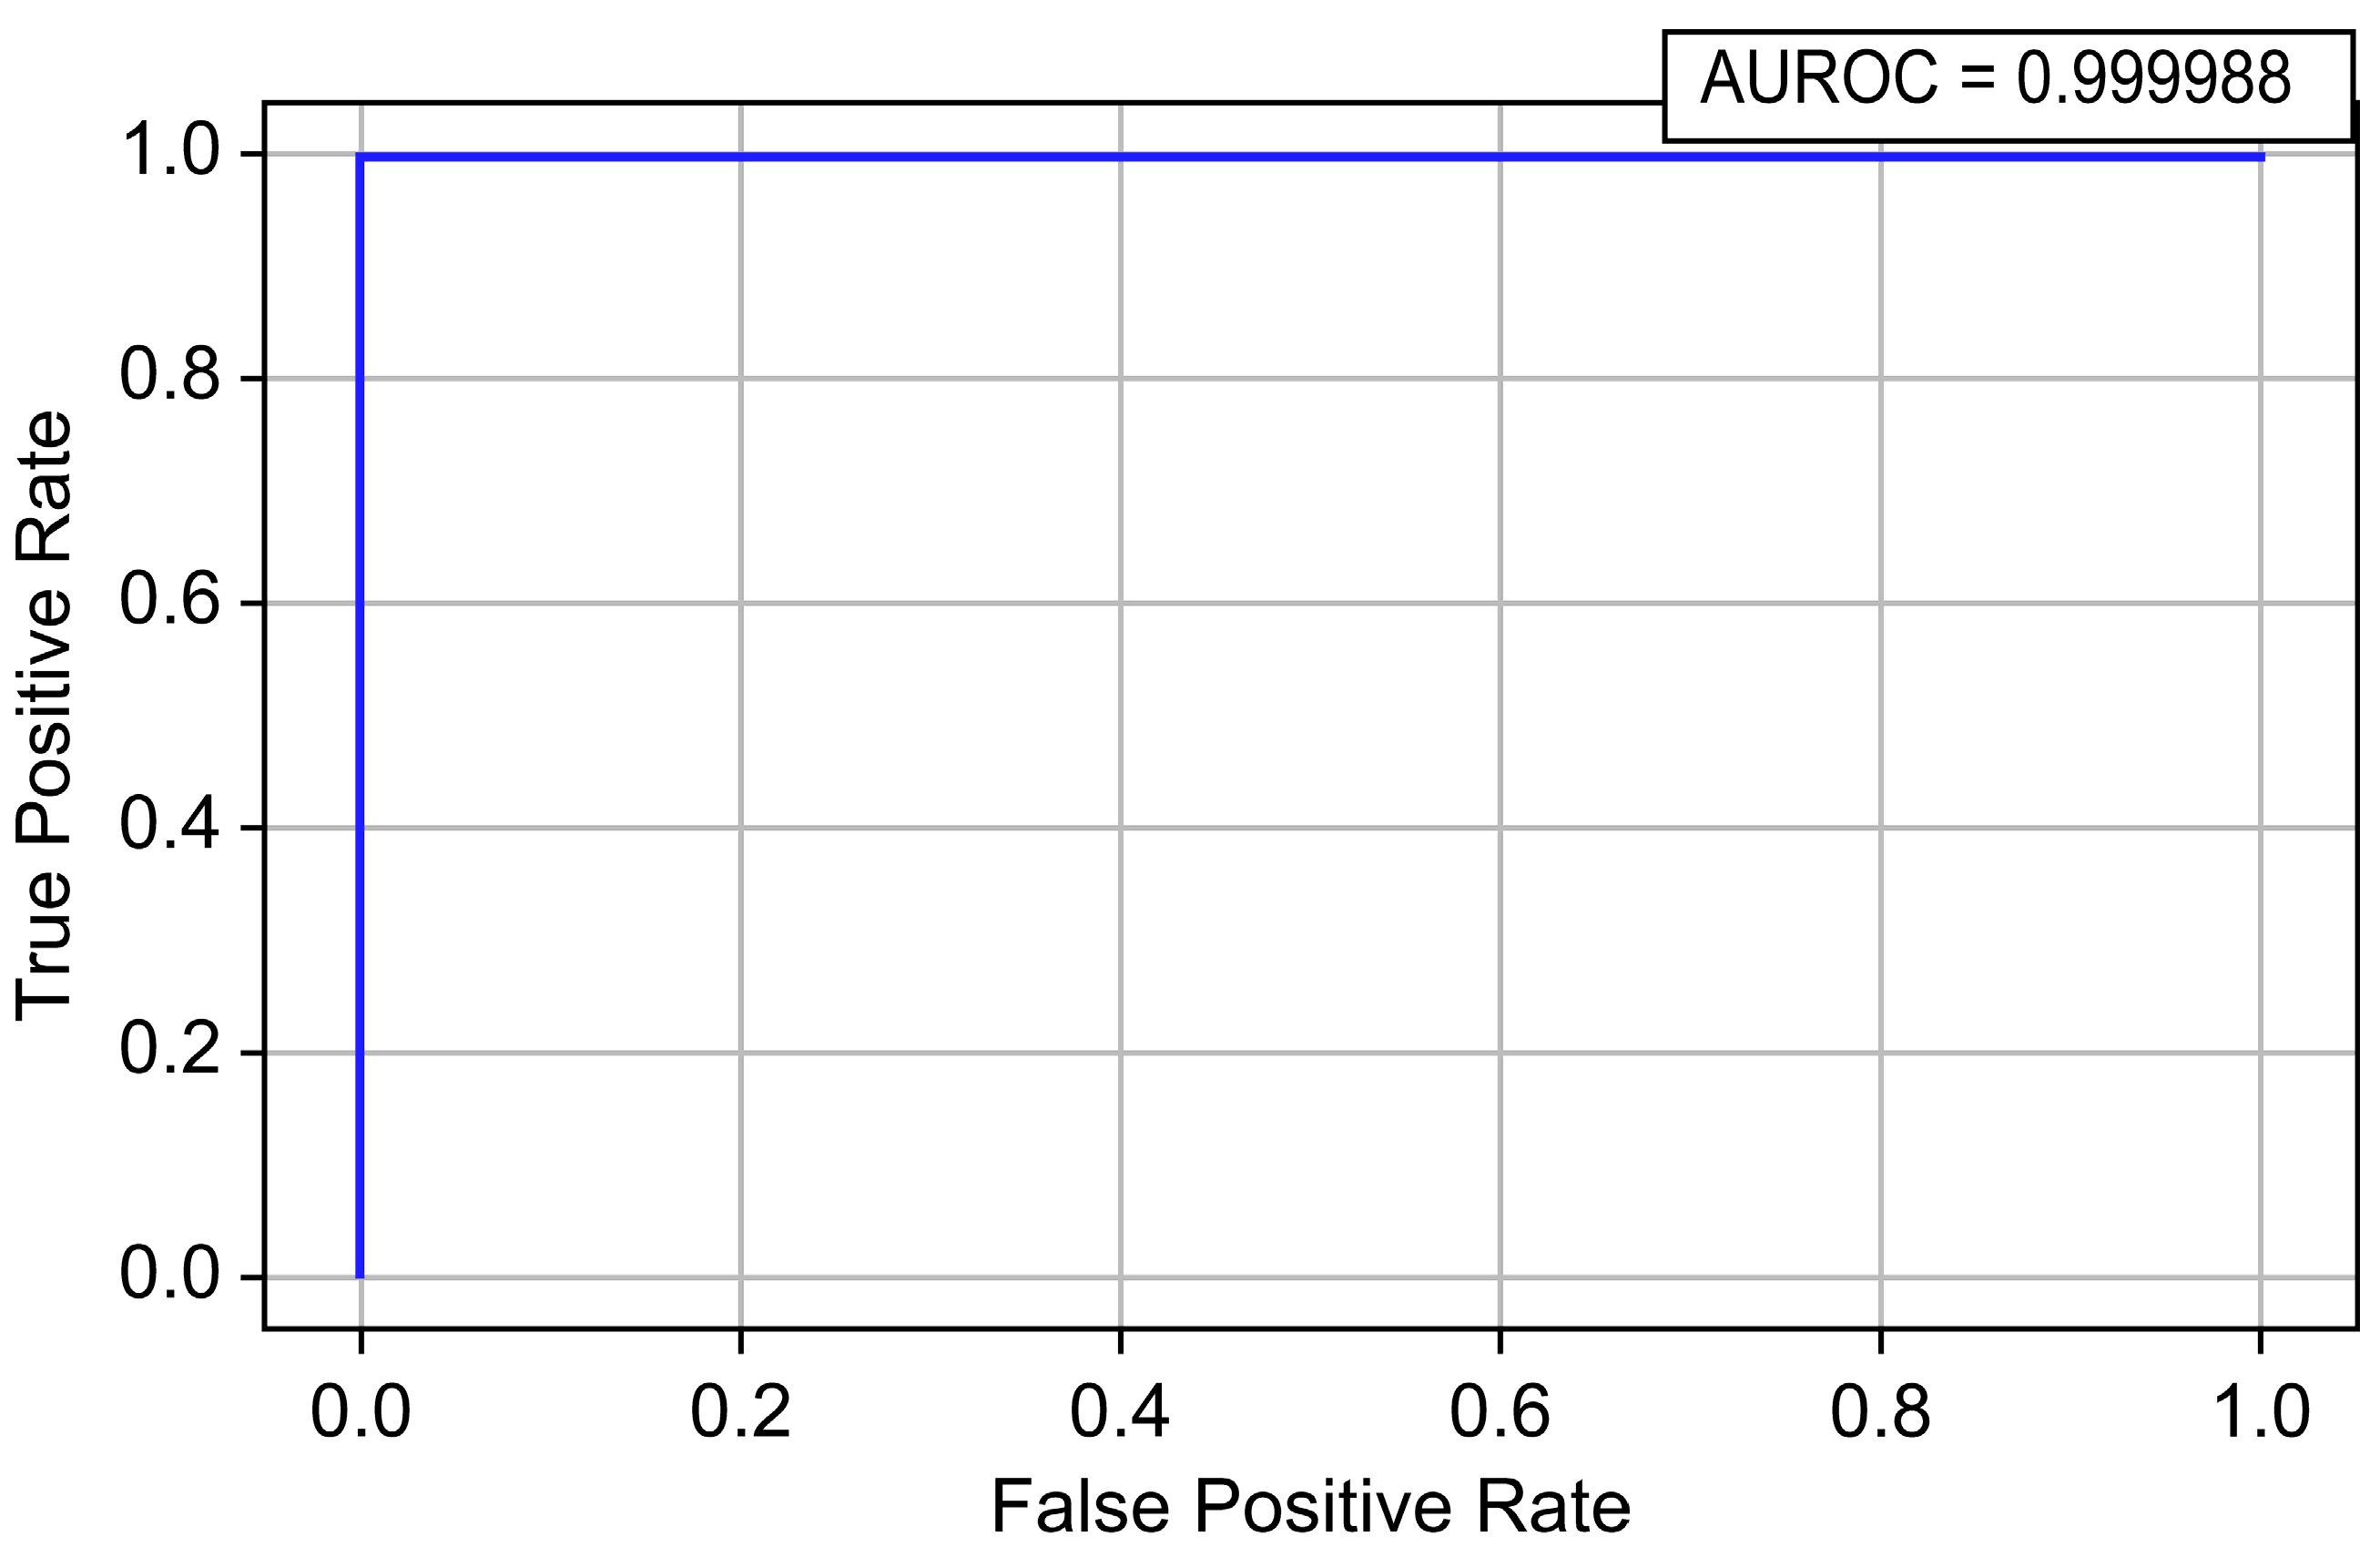
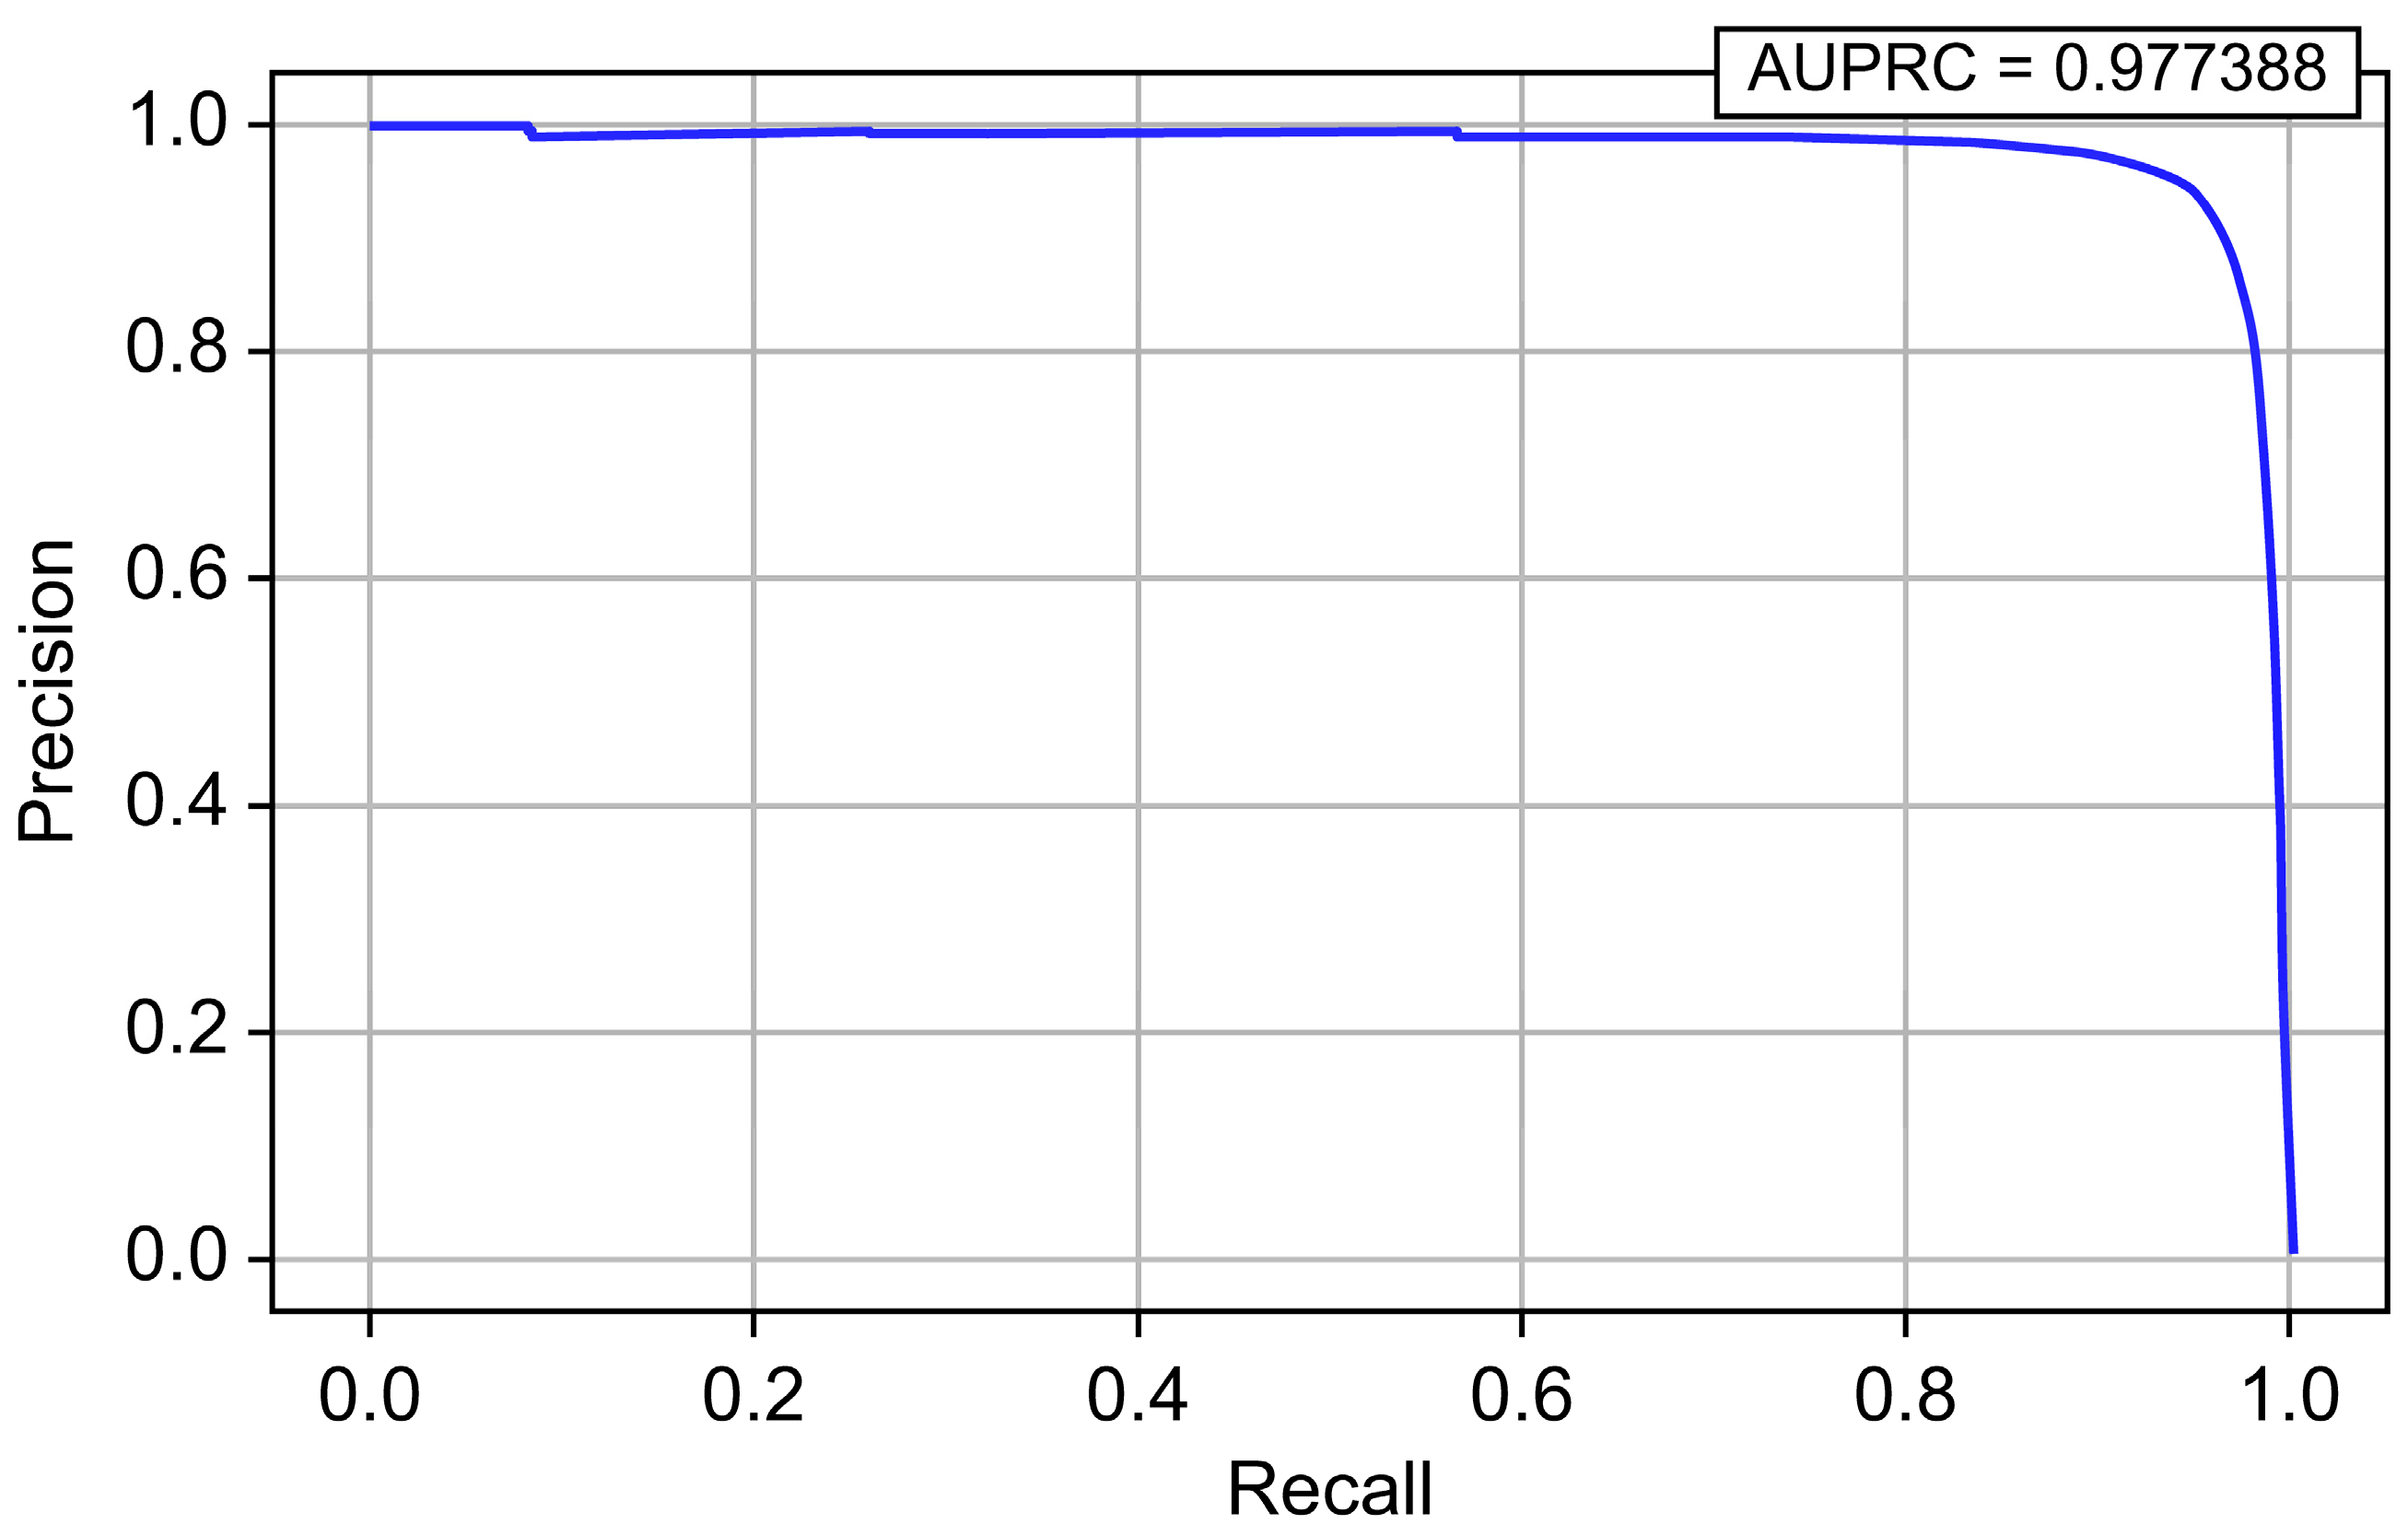
4.1.5. Evaluation of CatBoost
4.2. Selected Model and Decision Threshold
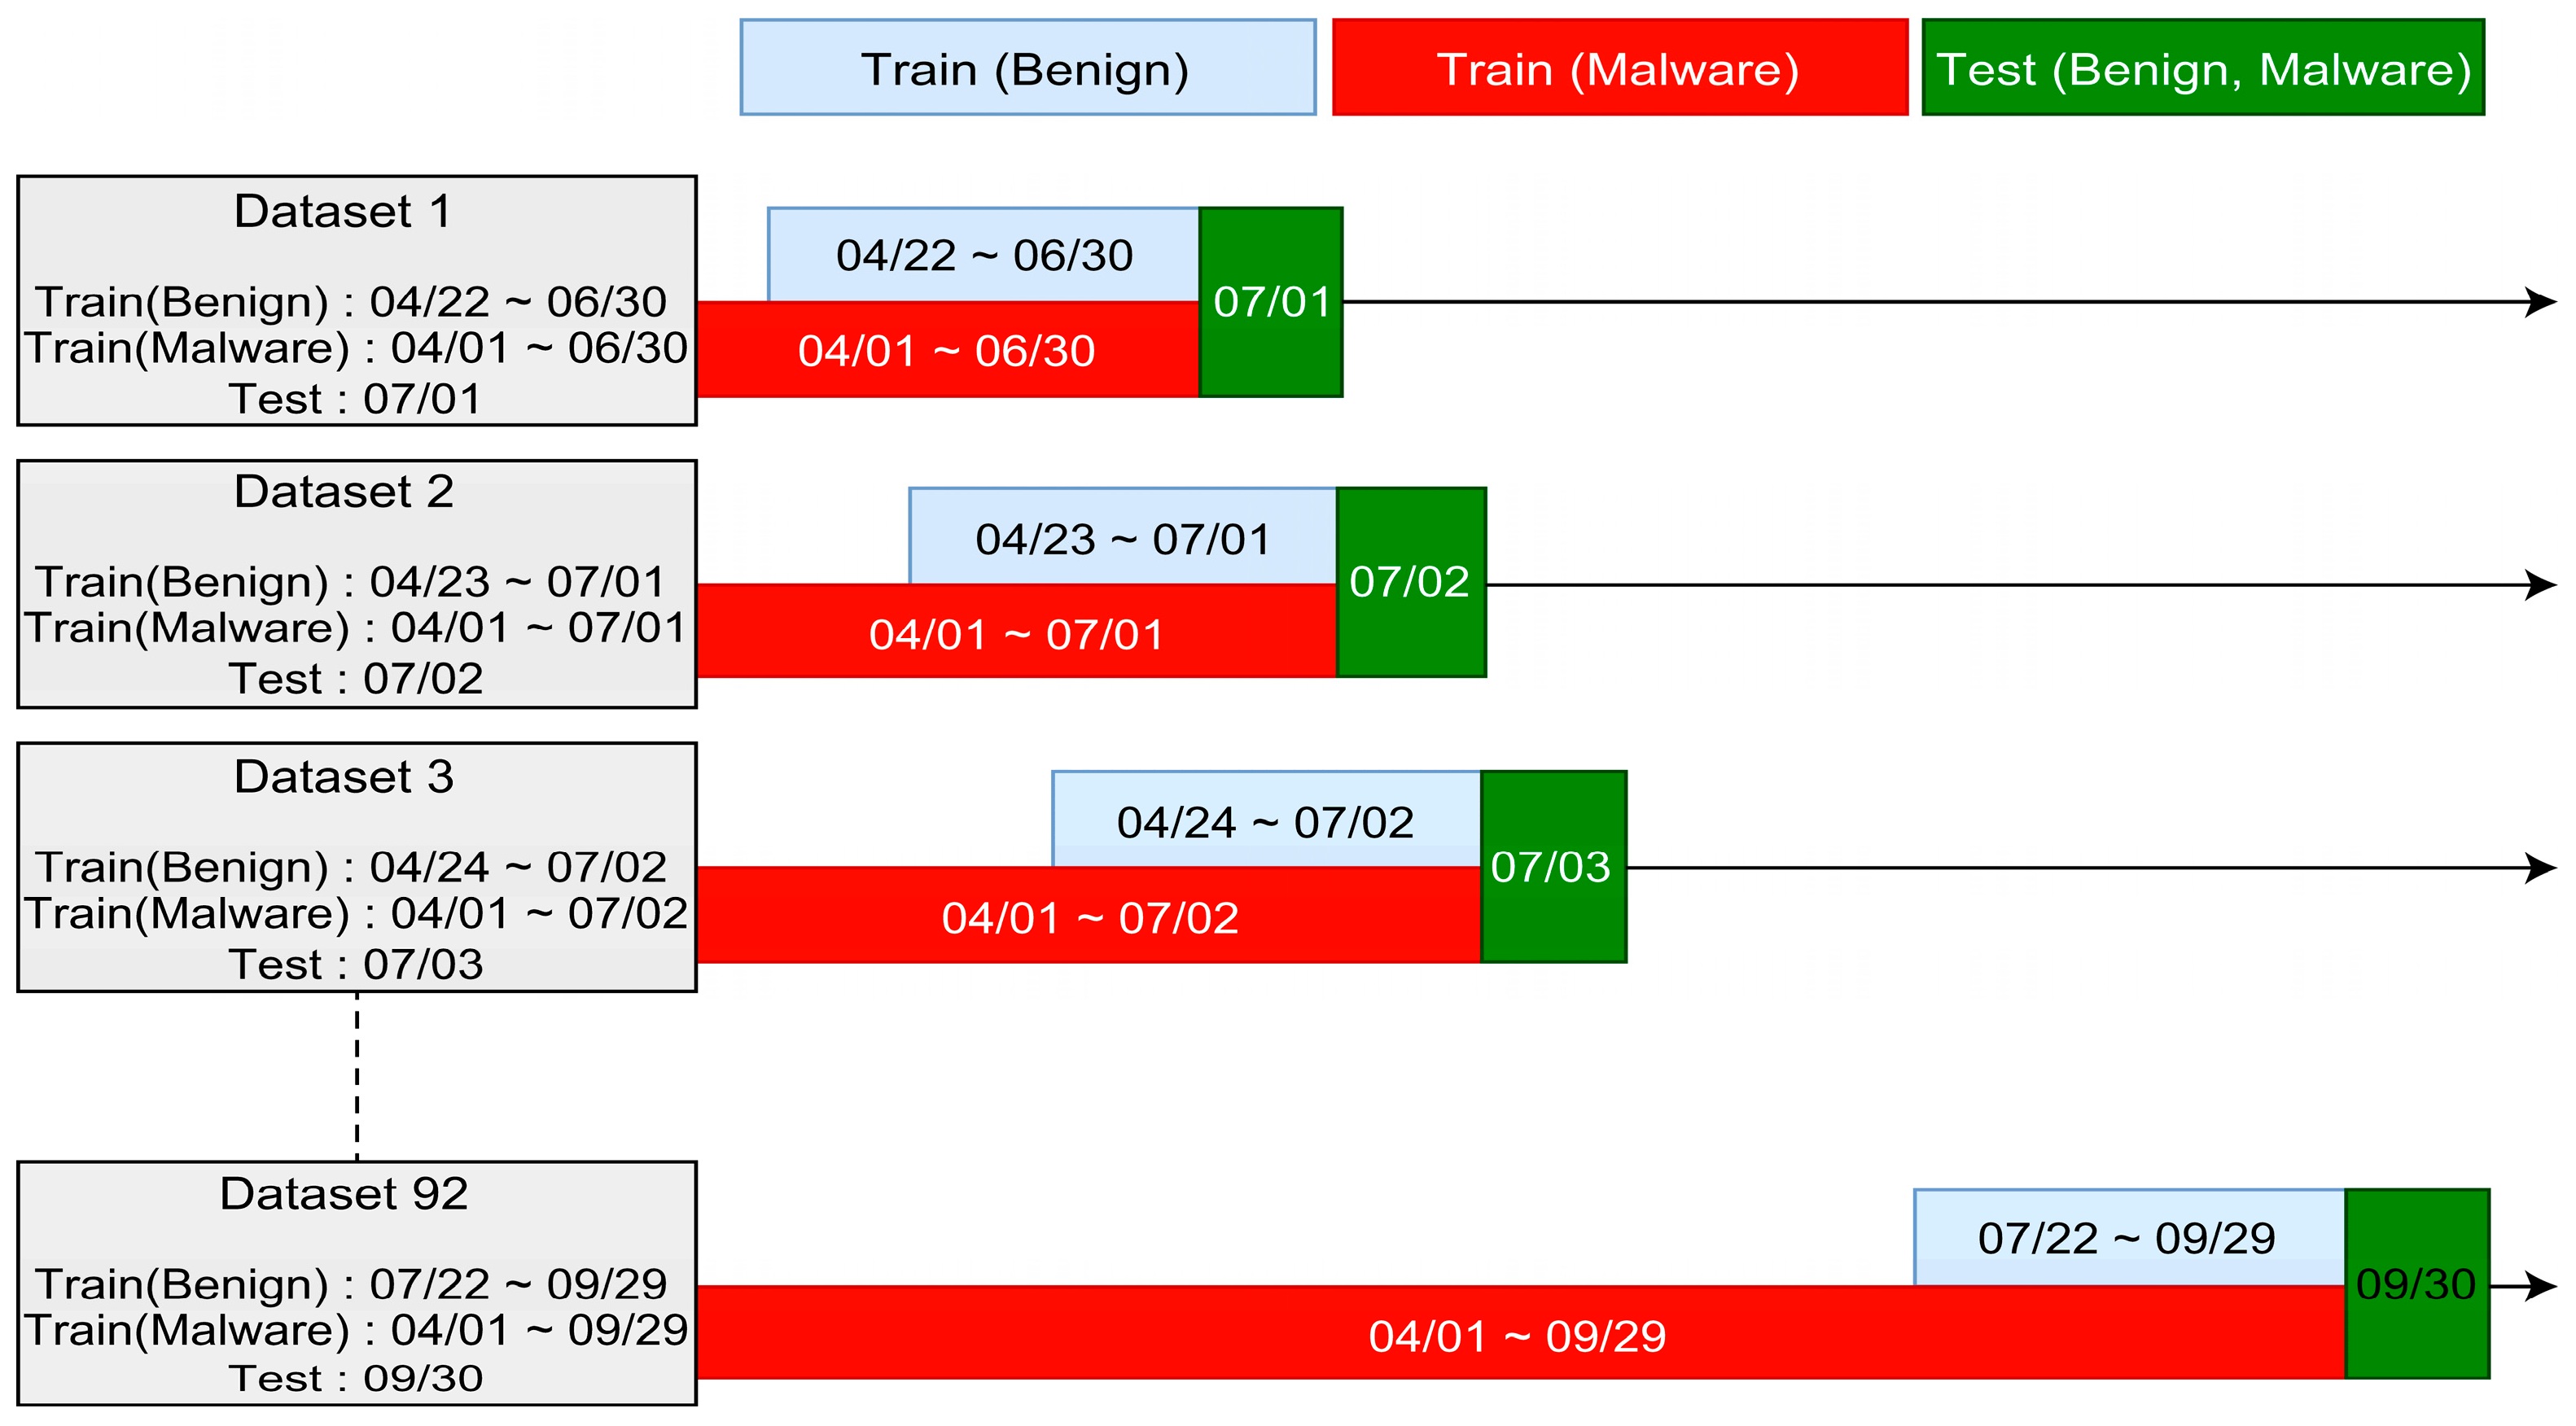
- Threshold 1: Threshold that always changes according to the model and date. For each test date, D, the model was fitted from D-70 to D-15. Subsequently, the threshold that produced a high F1-Score for the benign and malware samples from D-14 to D-1 was selected.
- Threshold 2: The default threshold value was fixed at 0.5.
- Threshold 3: The threshold was fixed at a single value of 0.603, which produces high F1-Scores for all 92 datasets measured ex post facto (for reference).
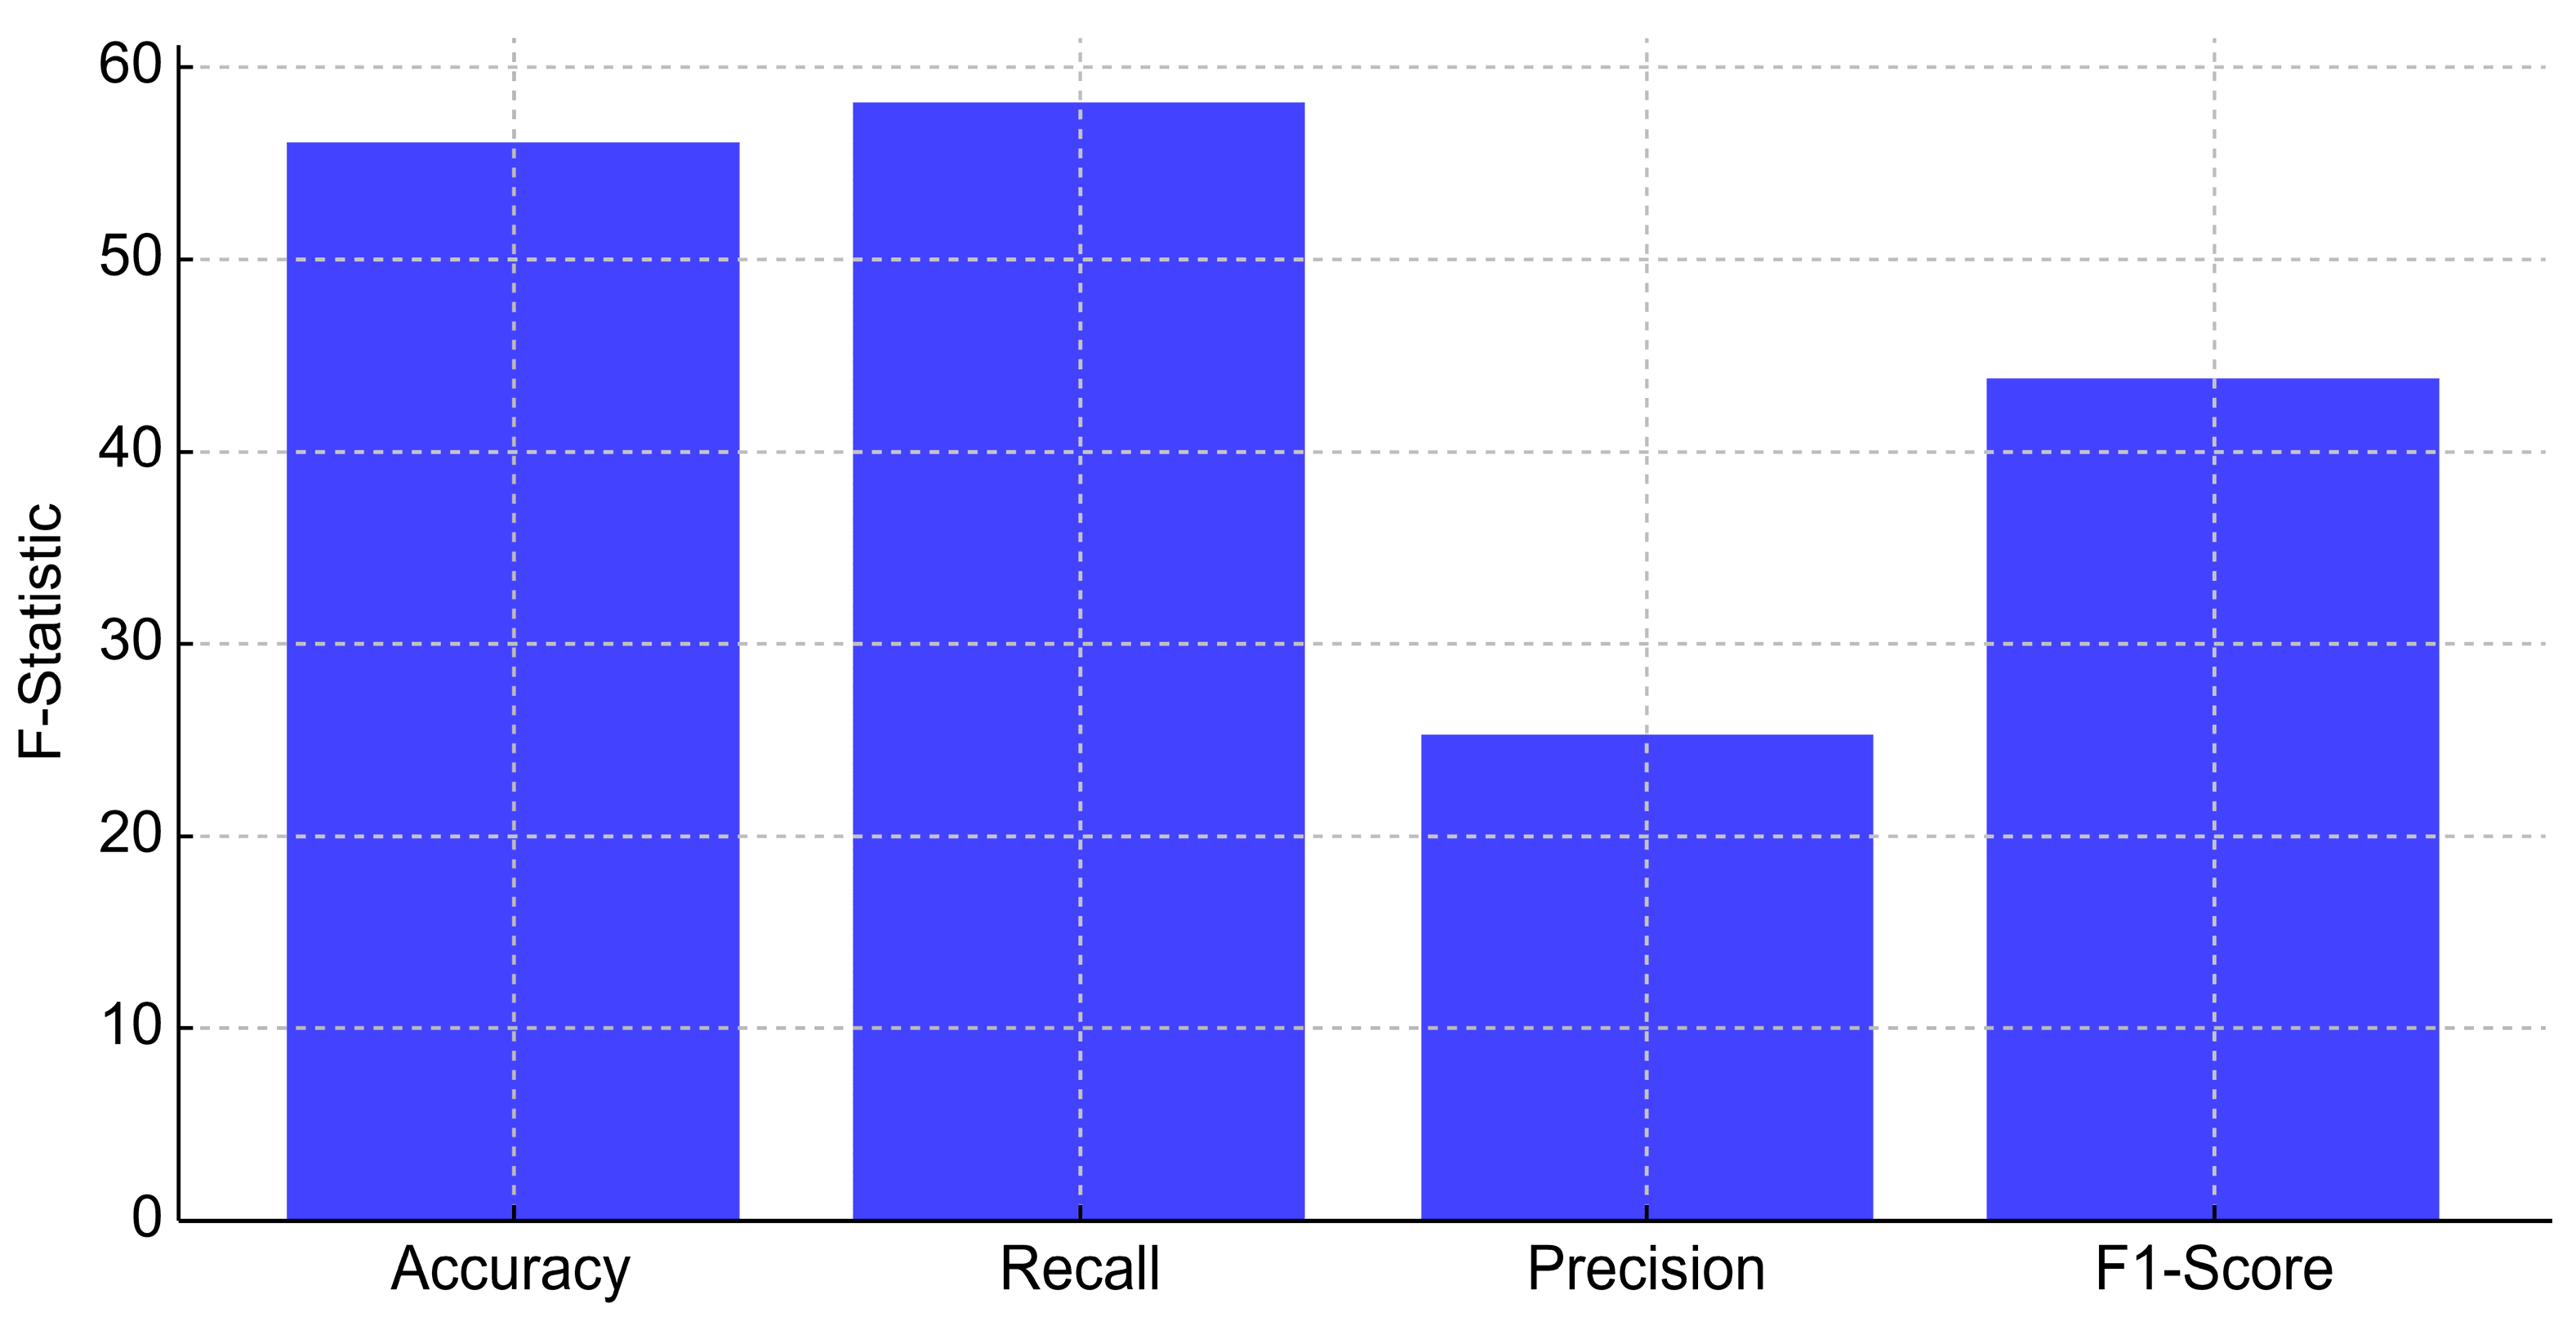
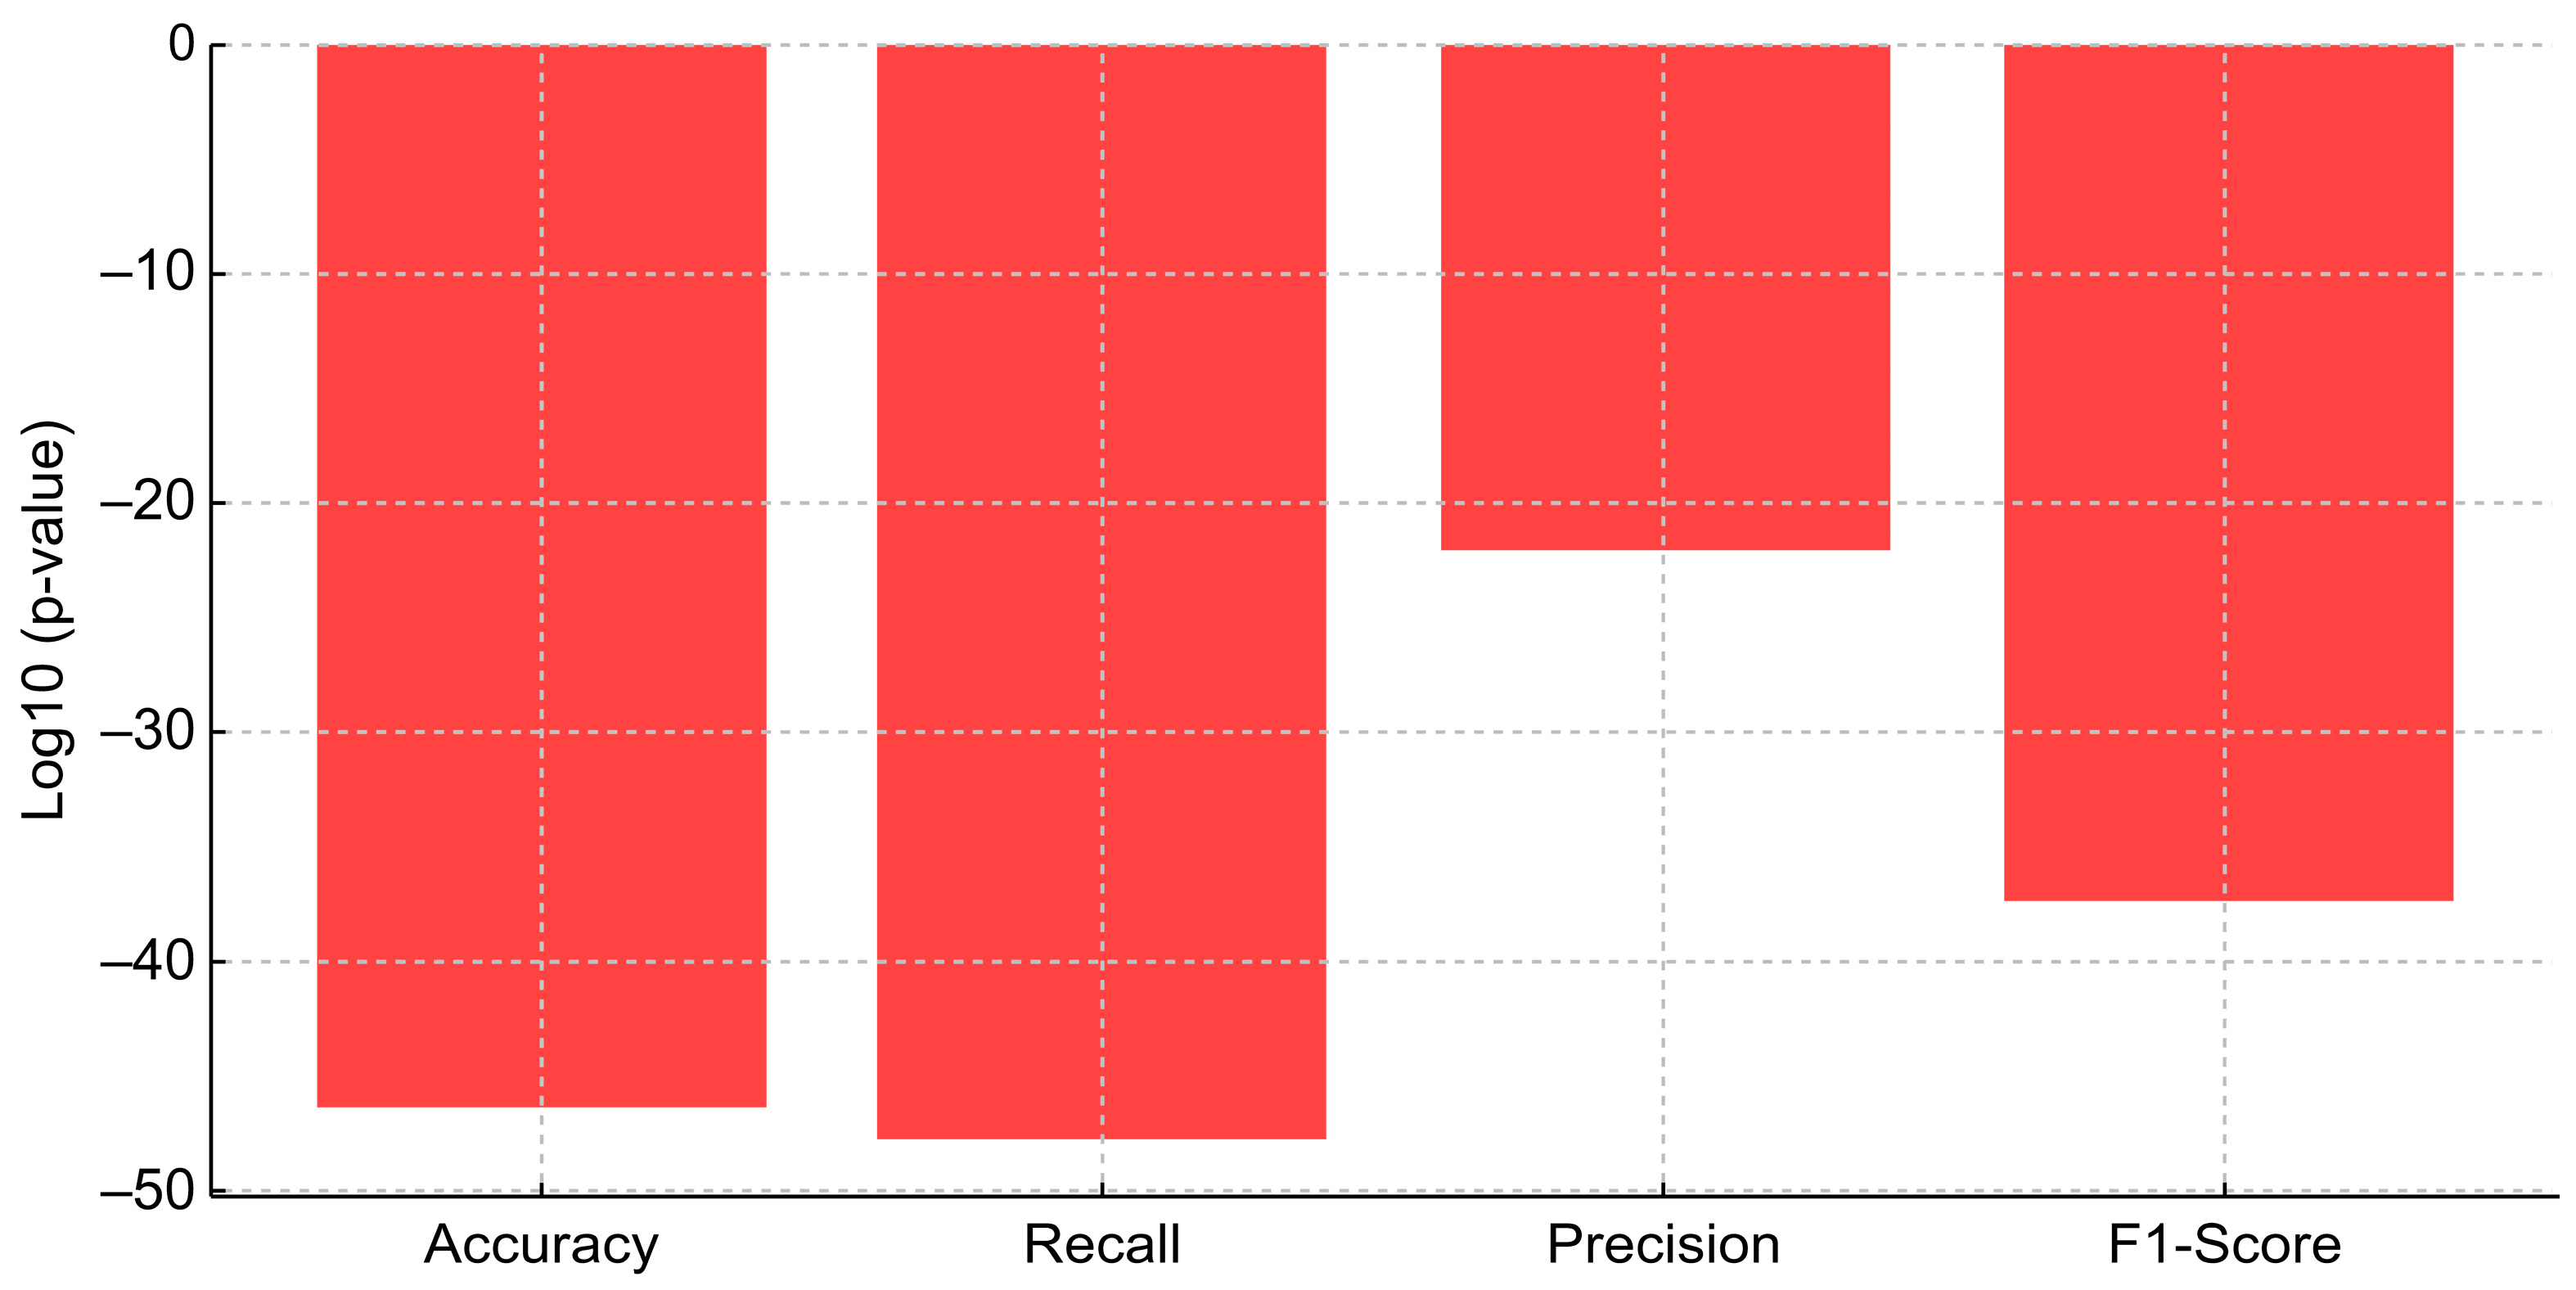
4.3. Comparative Analysis and Statistical Validation of Proposed Model
- Accuracy: F-Statistic = 56.22, p-value = 3.91 × 10−47
- Recall: F-Statistic = 58.19, p-value = 1.60 × 10−48
- Precision: F-Statistic = 25.25, p-value = 6.16 × 10⁻²³
- F1-Score: F-Statistic = 43.92, p-value = 4.42 × 10−38
4.4. Feature Importance
4.5. Comparison with Related Works
5. Limitations and Future Directions
- The validity of the study may be influenced by dataset bias, as it relies on data from a single bank. Additionally, challenges related to imbalanced data, potential scalability issues in real-world deployment, and the need for continuous adaptation to evolving malware threats must be considered.
- Since this model is designed for static analysis-based financial fraud malware detection, it has not been evaluated against advanced malware evasion techniques (e.g., code obfuscation, zero-day exploits). This limitation may result in an overestimation of its actual detection effectiveness against APT.
- Future research will focus on enhancing the model’s generalizability by incorporating datasets from multiple banks and financial institutions across different countries.
- Since random undersampling may lead to the loss of critical malicious patterns, potentially affecting detection performance, future work will explore hybrid resampling methods, such as SMOTE, cost-sensitive learning, and ensemble-based strategies, to assess their impact on performance and robustness.
- Further research will investigate the application of natural language processing techniques on app names to enhance financial fraud malware detection models.
6. Conclusions
Author Contributions
Funding
Data Availability Statement
Conflicts of Interest
Abbreviations
| ANOVA | Analysis of variance |
| APK | Android package kit |
| AUPRC | Area under the precision–recall curve |
| AUROC | Area under the ROC curve |
| BiLSTM | Bidirectional long short-term memory |
| CNN | Convolutional neural network |
| DAN | Discriminative adversarial network |
| FDS | Fraud detection system |
| FN | False negative |
| FP | False positive |
| GBDT | Gradient boosting decision tree |
| GPU | Graphics processing unit |
| GRU | Gated recurrent unit |
| IBK | Instance-based k |
| KNN | k-nearest neighbor |
| LDC | Linear discriminant classification |
| LightGBM | Light gradient-boosting machine |
| LSTM | Long short-term memory |
| ML | Machine learning |
| MLP | Multi-layer perceptron |
| PARZC | Parametric zero-cost |
| RBF | Radial basis function |
| ROC | Receiver operating characteristic |
| SVM | Support vector machine |
| TAN | Tree-augmented naïve Bayes |
| TN | True negative |
References
- Karunanayake, N.; Rajasegaran, J.; Gunathillake, A.; Seneviratne, S.; Jourjon, G. A multi-modal neural embeddings approach for detecting mobile counterfeit apps: A case study on Google Play Store. IEEE Trans. Mob. Comput. 2022, 21, 16–30. [Google Scholar] [CrossRef]
- Statista, Google Play Store: Number of Apps 2024. 2024. Available online: https://www.statista.com/statistics/266210/number-of-available-applications-in-the-google-play-store/ (accessed on 31 December 2024).
- IDC Research, Apple Grabs the Top Spot in the Smartphone Market in 2023 Along with Record High Market Share Despite the Overall Market Dropping 3.2%, According to IDC Tracker. 2024. Available online: https://www.idc.com/getdoc.jsp?containerId=prUS51776424 (accessed on 31 December 2024).
- Statista, Mobile OS Market Share Worldwide 2009–2024. 2024. Available online: https://www.statista.com/statistics/272698/global-market-share-held-by-mobile-operating-systems-since-2009/ (accessed on 31 December 2024).
- Arora, A.; Peddoju, S.K.; Conti, M. PermPair: Android malware detection using permission pairs. IEEE Trans. Inf. Forensics Secur. 2020, 15, 1968–1982. [Google Scholar] [CrossRef]
- Zhu, H.; Gu, W.; Wang, L.; Xu, Z.; Sheng, V.S. Android malware detection based on multi-head squeeze-and-excitation residual network. Expert Syst. Appl. 2023, 212, 118705. [Google Scholar] [CrossRef]
- Financial IT, 4 Banking Malware Types Detected on Users’ Devices in 2023. 2023. Available online: https://financialit.net/news/banking/4-banking-malware-types-detected-users-devices-2023 (accessed on 31 December 2024).
- Kyung-don, N. [Graphic News] Damages from Phishing Scams Jump over 35%, Korea Herald. 2024. Available online: https://www.koreaherald.com/article/3361908 (accessed on 31 December 2024).
- Allix, K.; Bissyandé, T.F.; Jérome, Q.; Klein, J.; State, R.; Le Traon, Y. Empirical assessment of machine learning-based malware detectors for Android. Empir. Softw. Eng. 2016, 21, 183–211. [Google Scholar] [CrossRef]
- Odat, E.; Yaseen, Q.M. A novel machine learning approach for Android malware detection based on the co-existence of features. IEEE Access 2023, 11, 15471–15484. [Google Scholar] [CrossRef]
- Talha, K.A.; Alper, D.I.; Aydin, C. APK Auditor: Permission-based Android malware detection system. Digit. Investig. 2015, 13, 1–14. [Google Scholar] [CrossRef]
- Enck, W.; Gilbert, P.; Han, S.; Tendulkar, V.; Chun, B.-G.; Cox, L.P.; Jung, J.; McDaniel, P.; Sheth, A.N. TaintDroid: An information-flow tracking system for realtime privacy monitoring on smartphones. ACM Trans Comput Syst. 2014, 32, 1–29. [Google Scholar] [CrossRef]
- Lindorfer, M.; Neugschwandtner, M.; Weichselbaum, L.; Fratantonio, Y.; van der Veen, V.; Platzer, C. ANDRUBIS—1,000,000 apps later: A view on current Android malware behaviors. In Proceedings of the Third International Workshop on Building Analysis Datasets and Gathering Experience Returns for Security (BADGERS), Wroclaw, Poland, 11 September 2014; pp. 3–17. [Google Scholar] [CrossRef]
- Bayazit, E.C.; Koray Sahingoz, O.; Dogan, B. Malware detection in Android systems with traditional machine learning models: A survey. In Proceedings of the 2020 International Congress on Human-Computer Interaction, Optimization and Robotic Applications (HORA), Ankara, Turkey, 26–28 June 2020; pp. 1–8. [Google Scholar] [CrossRef]
- Google Play Protect, Malware Categories. Available online: https://developers.google.com/android/play-protect/phacategories (accessed on 31 December 2024).
- Beroual, A.; Al-Shaikhli, I.F. A Survey on Android malwares and defense techniques. J. Comput. Theor. Nanosci. 2020, 17, 1557–1565. [Google Scholar] [CrossRef]
- EyalSalman, R.T. Android stalkerware detection techniques: A survey study. In Proceedings of the 2023 IEEE Jordan International Joint Conference on Electrical Engineering and Information Technology (JEEIT), Amman, Jordan, 22–24 May 2023; pp. 270–275. [Google Scholar] [CrossRef]
- Play Console Help, Hostile Downloaders. Available online: https://support.google.com/googleplay/android-developer/answer/11189134?hl=en# (accessed on 31 December 2024).
- Aonzo, S.; Merlo, A.; Tavella, G.; Fratantonio, Y. Phishing attacks on modern Android. In Proceedings of the 2018 ACM SIGSAC Conference on Computer and Communications Security, Toronto, ON, Canada, 15–19 October 2018; Association for Computing Machinery: New York, NY, USA, 2018; pp. 1788–1801. [Google Scholar] [CrossRef]
- Kaspersky, Android Spyware Detection & Removal. Available online: https://www.kaspersky.com/resource-center/preemptive-safety/spyware-on-android (accessed on 31 December 2024).
- Tao, G.; Zheng, Z.; Guo, Z.; Lyu, M.R. MalPat: Mining patterns of malicious and benign Android apps via permission-related APIs. IEEE Trans. Reliab. 2018, 67, 355–369. [Google Scholar] [CrossRef]
- Google. Google Play Store. Available online: https://play.google.com/store/games (accessed on 31 December 2024).
- VirusShare.com. Available online: https://virusshare.com/ (accessed on 31 December 2024).
- Parkour, M. Contagio Mini-Dump. Available online: http://contagiominidump.blogspot.com/ (accessed on 31 December 2024).
- Tiwari, S.R.; Shukla, R.U. An Android malware detection technique based on optimized permissions and API. In Proceedings of the 2018 International Conference on Inventive Research in Computing Applications (ICIRCA), Coimbatore, India, 11–12 July 2018; pp. 258–263. [Google Scholar] [CrossRef]
- AndroidPRAGuardDataset. Available online: https://sites.unica.it/pralab/en/AndroidPRAGuardDataset (accessed on 31 December 2024).
- Zhang, Y.; Yang, Y.; Wang, X. A novel Android malware detection approach based on convolutional neural network. In Proceedings of the 2nd International Conference on Cryptography, Security and Privacy, Guiyang, China, 16–19 March 2018; Association for Computing Machinery: New York, NY, USA, 2018; pp. 144–149. [Google Scholar] [CrossRef]
- Arp, D.; Spreitzenbarth, M.; Hübner, M.; Gascon, H.; Rieck, K. Drebin: Effective and explainable detection of Android malware in your pocket. In Proceedings of the 2014 Network and Distributed System Security Symposium; Internet Society, San Diego, CA, USA, 23–26 February 2014; Available online: https://cir.nii.ac.jp/crid/1363670320772385920 (accessed on 31 December 2024).
- Baldini, G.; Geneiatakis, D. A performance evaluation on distance measures in KNN for mobile malware detection. In Proceedings of the 2019 6th International Conference on Control, Decision and Information Technologies (CoDIT), Paris, France, 23–26 April 2019; pp. 193–198. [Google Scholar] [CrossRef]
- Amin, M.; Tanveer, T.A.; Tehseen, M.; Khan, M.; Khan, F.A.; Anwar, S. Static malware detection and attribution in Android byte-code through an end-to-end deep system. Future Gener. Comput. Syst. 2020, 102, 112–126. [Google Scholar] [CrossRef]
- Rijin, F. Malware Dataset [Dataset]. 2017. Available online: https://www.kaggle.com/datasets/blackarcher/malware-dataset (accessed on 31 December 2024).
- Millar, S.; McLaughlin, N.; Martinez del Rincon, J.; Miller, P. Multi-view deep learning for zero-day Android malware detection. J. Inf. Secur. Appl. 2021, 58, 102718. [Google Scholar] [CrossRef]
- İbrahim, M.; Issa, B.; Jasser, M.B. A method for automatic Android malware detection based on static analysis and deep learning. IEEE Access 2022, 10, 117334–117352. [Google Scholar] [CrossRef]
- VirusTotal. Available online: https://www.virustotal.com/gui/home/upload (accessed on 31 December 2024).
- Bayazit, E.C.; Sahingoz, O.K.; Dogan, B. A deep learning based Android malware detection system with static analysis. In Proceedings of the 2022 International Congress on Human-Computer Interaction, Optimization and Robotic Applications (HORA), Ankara, Turkey, 9–11 June 2022; pp. 1–6. [Google Scholar] [CrossRef]
- Investigation on Android Malware [Dataset], Datasets|Research|Canadian Institute for Cybersecurity|UNB. 2019. Available online: https://www.kaggle.com/datasets/malikbaqi12/cic-invesandmal2019-dataset (accessed on 31 December 2024).
- Akbar, F.; Hussain, M.; Mumtaz, R.; Riaz, Q.; Wahab, A.W.A.; Jung, K.-H. Permissions-based detection of Android malware using machine learning. Symmetry 2022, 14, 718. [Google Scholar] [CrossRef]
- Afonso, V.M.; de Amorim, M.F.; Grégio, A.R.A.; Junquera, G.B.; de Geus, P.L. Identifying Android malware using dynamically obtained features. J. Comput. Virol. Hacking Tech. 2015, 11, 9–17. [Google Scholar] [CrossRef]
- MalGenome Project, Yajins Homepage. Available online: http://www.malgenomeproject.org/ (accessed on 31 December 2024).
- Dash, S.K.; Suarez-Tangil, G.; Khan, S.; Tam, K.; Ahmadi, M.; Kinder, J.; Cavallaro, L. DroidScribe: Classifying Android malware based on runtime behavior. In Proceedings of the 2016 IEEE Security and Privacy Workshops (SPW), San Jose, CA, USA, 22–26 May 2016; pp. 252–261. [Google Scholar] [CrossRef]
- Cai, H.; Meng, N.; Ryder, N.; Yao, D. DroidCat: Effective Android malware detection and categorization via app-level profiling. IEEE Trans. Inf. Forensics Secur. 2019, 14, 1455–1470. [Google Scholar] [CrossRef]
- Allix, K.; Bissyandé, T.F.; Klein, J.; Traon, Y.L. AndroZoo: Collecting millions of Android apps for the research community. In Proceedings of the 13th International Conference on Mining Software Repositories, Austin, TX, USA, 14–22 May 2016; ACM: New York, NY, USA, 2016; pp. 468–471. [Google Scholar] [CrossRef]
- Shakya, S.; Dave, M. Analysis, detection, and classification of Android malware using system calls. arXiv 2022, arXiv:2208.06130. [Google Scholar] [CrossRef]
- Lashkari, A.H.; Kadir, A.F.; Taheri, L.; Ghorbani, A.A. Toward Developing a Systematic Approach to Generate Benchmark Android Malware Datasets and Classification. In Proceedings of the 52nd IEEE International Carnahan Conference on Security Technology (ICCST), Montreal, QC, Canada, 22–25 October 2018. [Google Scholar]
- Hashem El Fiky, A.; Madkour, M.A.; El Shenawy, A. Android malware category and family identification using parallel machine learning. J. Inf. Technol. Manag. 2022, 14, 19–39. [Google Scholar] [CrossRef]
- Rahali, A.; Lashkari, A.H.; Kaur, G.; Taheri, L.; Gagnon, F.; Massicotte, F. DIDroid: Android Malware Classification and Characterization Using Deep Image Learning. In Proceedings of the 10th International Conference on Communication and Network Security (ICCNS2020), Tokyo, Japan, 27–29 November 2020; pp. 70–82. [Google Scholar]
- Chen, S.; Xue, M.; Tang, Z.; Xu, L.; Zhu, H. StormDroid: A streaminglized machine learning-based system for detecting Android malware. In Proceedings of the 11th ACM on Asia Conference on Computer and Communications Security, Xi’an China, 30 May–3 June 2016; Association for Computing Machinery: New York, NY, USA, 2016; pp. 377–388. [Google Scholar] [CrossRef]
- Saracino, A.; Sgandurra, D.; Dini, G.; Martinelli, F. MADAM: Effective and efficient behavior-based Android malware detection and prevention. IEEE Trans. Dependable Secure Comput. 2018, 15, 83–97. [Google Scholar] [CrossRef]
- Kouliaridis, V.; Kambourakis, G.; Geneiatakis, D.; Potha, N. Two anatomists are better than one—Dual-level Android malware detection. Symmetry 2020, 12, 1128. [Google Scholar] [CrossRef]
- Hadiprakoso, R.B.; Kabetta, H.; Buana, I.K.S. Hybrid-based malware analysis for effective and efficiency Android malware detection. In Proceedings of the 2020 International Conference on Informatics, Multimedia, Cyber and Information System (ICIMCIS), Jakarta, Indonesia, 19–20 November 2020; pp. 8–12. [Google Scholar] [CrossRef]
- Mahdavifar, S.; Kadir, A.F.A.; Fatemi, R.; Alhadidi, D.; Ghorbani, A.A. Dynamic Android Malware Category Classification using Semi-Supervised Deep Learning. In Proceedings of the 18th IEEE International Conference on Dependable, Autonomic, and Secure Computing (DASC), Calgary, AB, Canada, 17–24 August 2020. [Google Scholar]
- Surendran, R.; Thomas, T.; Emmanuel, S. A TAN based hybrid model for Android malware detection. J. Inf. Secur. Appl. 2020, 54, 102483. [Google Scholar] [CrossRef]
- sk3ptre. sk3ptre/AndroidMalware_2019. 2024. Available online: https://github.com/sk3ptre/AndroidMalware_2019 (accessed on 31 December 2024).
- Yuan, Z.; Lu, Y.; Xue, Y. Droiddetector: Android malware characterization and detection using deep learning. Tsinghua Sci. Technol. 2016, 21, 114–123. [Google Scholar] [CrossRef]
- He, H.; Garcia, E.A. Learning from imbalanced data. IEEE Trans. Knowl. Data Eng. 2009, 21, 1263–1284. [Google Scholar] [CrossRef]
- Saito, T.; Rehmsmeier, M. The precision-recall plot is more informative than the ROC plot when evaluating binary classifiers on imbalanced datasets. PLoS ONE 2015, 10, e0118432. [Google Scholar] [CrossRef]
- Provost, F.J.; Fawcett, T.; Kohavi, R. The case against accuracy estimation for comparing induction algorithms. In Proceedings of the Fifteenth International Conference on Machine Learning, Madison, WI, USA, 24–27 July 1998; Morgan Kaufmann Publishers Inc.: San Francisco, CA, USA, 1998; pp. 445–453. [Google Scholar]
- Google Cloud Platform Console Help, Unverified Apps. Available online: https://support.google.com/cloud/answer/7454865?hl=en (accessed on 31 December 2024).
- Zhou, Y.; Jiang, X. Dissecting Android malware: Characterization and evolution. In Proceedings of the 2012 IEEE Symposium on Security and Privacy, San Francisco, CA, USA, 20–23 May 2012; pp. 95–109. [Google Scholar] [CrossRef]
- Felt, A.P.; Greenwood, K.; Wagner, D. The effectiveness of application permissions. In Proceedings of the 2nd USENIX Conference on Web Application Development, Portland, OR, USA, 15–16 June 2011; Available online: https://www.usenix.org/events/webapps11/tech/final_files/Felt.pdf (accessed on 31 December 2024).
- Shabtai, A.; Fledel, Y.; Elovici, Y. Securing Android-powered mobile devices using SELinux. IEEE Secur. Priv. 2010, 8, 36–44. [Google Scholar] [CrossRef]
- Android Developers, Services Overview|Background Work. Available online: https://developer.android.com/develop/background-work/services (accessed on 31 December 2024).
- Mohammed, R.; Rawashdeh, J.; Abdullah, M. Machine learning with oversampling and undersampling techniques: Overview study and experimental results. In Proceedings of the 2020 11th International Conference on Information and Communication Systems (ICICS), Irbid, Jordan, 7–9 April 2020; pp. 243–248. [Google Scholar] [CrossRef]
- Vijayvargiya, S.; Kumar, L.; Murthy, L.; Misra, S.; Krishna, A.; Padmanabhuni, S. Empirical analysis for investigating the effect of machine learning techniques on malware prediction. In Proceedings of the 18th International Conference on Evaluation of Novel Approaches to Software Engineering ENASE, Lisbon, Portugal, 24–25 April 2023; SciTePress: Prague, Czech Republic, 2023; pp. 453–460. [Google Scholar] [CrossRef]
- Statistics Solutions, What Is Logistic Regression? Available online: https://www.statisticssolutions.com/free-resources/directory-of-statistical-analyses/what-is-logistic-regression/ (accessed on 31 December 2024).
- Breiman, L. Random forests. Mach. Learn. 2001, 45, 5–32. [Google Scholar] [CrossRef]
- Ke, G.; Meng, Q.; Finley, T.; Wang, T.; Chen, W.; Ma, W.; Ye, Q.; Liu, T.-Y. LightGBM: A highly efficient gradient boosting decision tree. In Proceedings of the 31st International Conference on Neural Information Processing Systems, Long Beach, CA, USA, 4–9 December 2017; Advances in Neural Information Processing, Systems. Guyon, I., Luxburg, U.V., Bengio, S., Wallach, H., Fergus, R., Vishwanathan, S., Garnett, R., Eds.; Curran Associates Inc.: Red Hook, NY, USA, 2017. Available online: https://proceedings.neurips.cc/paper_files/paper/2017/file/6449f44a102fde848669bdd9eb6b76fa-Paper.pdf (accessed on 30 December 2017).
- Chen, T.; Guestrin, C. XGBoost: A scalable tree boosting system. In Proceedings of the 22nd ACM SIGKDD International Conference on Knowledge Discovery and Data Mining, San Francisco, CA, USA, 13–17 August 2016; Association for Computing Machinery: New York, NY, USA, 2016; pp. 785–794. [Google Scholar] [CrossRef]
- Prokhorenkova, L.; Gusev, G.; Vorobev, A.; Dorogush, A.V.; Gulin, A. CatBoost: Unbiased boosting with categorical features. In Proceedings of the 32nd International Conference on Neural Information Processing Systems, Montréal, QC, Canada, 3–8 December 2018. [Google Scholar]
- Dorogush, A.V.; Ershov, V.; Gulin, A. CatBoost: Gradient boosting with categorical features support. arXiv 2018, arXiv:1810.11363. [Google Scholar] [CrossRef]
- Kumar, L.; Hota, C.; Mahindru, A.; Neti, L.B.M. Android malware prediction using extreme learning machine with different kernel functions. In Proceedings of the 15th Asian Internet Engineering Conference, Phuket, Thailand, 7–9 August 2019; Association for Computing Machinery: New York, NY, USA, 2019; pp. 33–40. [Google Scholar] [CrossRef]
- Lundberg, S.M.; Erion, G.; Chen, H.; DeGrave, A.; Prutkin, J.M.; Nair, B.; Katz, R.; Himmelfarb, J.; Bansal, N.; Lee, S.-I. Explainable AI for trees: From local explanations to global understanding. arXiv 2019, arXiv:1905.04610. [Google Scholar] [CrossRef]
- Nascita, A.; Aceto, G.; Ciuonzo, D.; Montieri, A.; Persico, V.; Pescapé, A. A survey on explainable artificial intelligence for Internet traffic classification and prediction, and intrusion detection. IEEE Commun. Surv. Tutor. 2024. [Google Scholar] [CrossRef]
- Xu, X.; Zhang, X.; Zhang, Q.; Wang, Y.; Adebisi, B.; Ohtsuki, T.; Sari, H.; Gui, G. Advancing malware detection in network traffic with self-paced class incremental learning. IEEE Internet Things J. 2024, 11, 21816–21826. [Google Scholar] [CrossRef]


| Studies | Year | Feature(s) | Dataset(s) | Algorithm(s) | Performance Evaluation |
|---|---|---|---|---|---|
| Tao et al. [21] | 2017 | API calls | Google Play [22], VirusShare [23], and Contagio [24] | DT | F1-score: 98.24% |
| Tiwari et al. [25] | 2018 | Permissions, API calls | RPAGaurd [26] and Google Play | Logistic regression | Accuracy: 97.25% Accuracy: 95.87% |
| Zang et al. [27] | 2018 | Permissions, Intent filters, API calls, Constant strings | Drebin [28] and Chinese app markets | CNN | Accuracy: 97.40% |
| Baldini et al. [29] | 2019 | Permissions, API calls, Components, Network addresses | Drebin [28] | KNN | Accuracy: 99.48% |
| Amin et al. [30] | 2020 | Opcodes | AMD [31], Drebin [28], and VirusShare [23] | BiLSTM, LSTM, CNN, and DBN | Accuracy: 99.90% F1-score: 99.60% |
| Millar et al. [32] | 2021 | Raw opcodes, Permissions and API calls | Drebin [28] | DAN | F1-score: 97.30% |
| İbrahim et al. [33] | 2022 | Permissions, Services, API calls, Broadcast receivers, File size, Fuzzy Hash, Opcode sequence | Virus Total [34], AMD [31], MalDozer, and Contactio Security Blog | Functional API-based deep learning | F1-score: 99.5%, F1-score: 97% |
| Bayazit et al. [35] | 2022 | Permissions, Intents | CICInvesAndMal2019 [36] | RNN-based LSTM, BiLSTM, and GRU | Accuracy: 98.85% F1-score: 98.21% |
| Akbar et al. [37] | 2022 | Permissions | VirusShare [23] | Random forest, SVM, rotation forest, and Naïve Bayes | Accuracy: Greater than or equal to 89% |
| Proposed Method | App information, App permissions, App Service, User activity, User information, App package name statistics | Private Dataset | LightGBM | Accuracy: 99.99% F1-score: 97.04% |
| Studies | Year | Feature(s) | Dataset(s) | Algorithm(s) | Performance Evaluation |
|---|---|---|---|---|---|
| Afonso et al. [38] | 2015 | API calls and System calls | MalGenome [39] and VirusShare [23] | RF, J.48, Simple Logistic, NB, SMO, BayesNet, and IBK | Accuracy: 96.66% |
| Dash et al. [40] | 2016 | Binder communication, System calls | Drebin [28] | SVM | Accuracy: 94.00% |
| Cai et al. [41] | 2019 | Method calls and Inter-component communication (ICC), Intents | Drebin [28], MalGenome [39], VirusShare [23], and AndroZoo [42] | DroidCat | Accuracy: 97.00% |
| Shakya et al. [43] | 2022 | System calls | CIC-ANDMAL2017 [44] | KNN and Decision tree | F1-score: 85% F1-score: 72% |
| El Fiky et al. [45] | 2022 | Memory Features, APIs, Networks, Batterys, Logcats, Processes | CCCS-CIC-AndMal (2020) [46] | J48, KNN, SVM, and random forest | Accuracy: 96.89% Accuracy: 99.65% |
| Studies | Year | Feature(s) | Dataset(s) | Algorithm(s) | Performance Evaluation |
|---|---|---|---|---|---|
| Chen et al. [47] | 2016 | Permissions, Sensitive API Call, Dynamic behavior Sequences | Google Play [22] and Contagio [24] | StormDroid (SVM, MLP, C4.5, IBK, NB, and Bagging predictor) | Accuracy: 93.80% |
| Saracino et al. [48] | 2018 | System calls, SMS, Critical API, User Activity, App Metadata | MalGenome [39], Contagio [24], and VirusShare [23] | K-NN, QDC, LDC, PARZC, MLP, and RBF | Accuracy: 96.90% |
| Kouliaridis et al. [49] | 2020 | API calls, Permissions, Intents, Network traffic, Java classes, Inter-process communication | Drebin [28], VirusShare [23], and AndroZoo [42] | LR, Naïve Bayes, RF, KNN, SGC, Adaboost, SVM, and Ensemble | Drebin: 100%, VirusShare: 100%, AndroZoo: 91.8% |
| Hadiprakoso et al. [50] | 2020 | MalGenome [39], Drebin [28], and CICMalDroid 2020 [51] | Gradient boost (GB) | Accuracy: 99.36% | |
| Surendran et al. [52] | 2020 | API calls, Permissions, System calls | Drebin [28], AMD [31], AndroZoo [38], Github [53], and Google Play | Tree Augmented Naïve Bayes (TAN) | Accuracy: 97.00% |
| Category | Variable Name | Description | Other Information |
|---|---|---|---|
| Target | lbl_cd | Label | “Benign” or “Malware” |
| Date | trsc_dt | Transaction date | Login date |
| App information | app_nm | App name | |
| app_pkg_nm | App package name | ||
| app_sz | App size | ||
| app_ist_dt | App installation date | ||
| App permissions | read_sms | SMS read permission | “Y” or “N” |
| receive_sms | SMS write permission | “Y” or “N” | |
| process_outgoing_calls | Permission to process outgoing calls | “Y” or “N” | |
| call_phone | Permission to make calls | “Y” or “N” | |
| request_install_packages | Permission to request the installation of packages | “Y” or “N” | |
| manage_external_storage | Permission to manage shared storage | “Y” or “N” | |
| App service | basc_phone_app | Whether it is the default phone app | “Y” or “N” |
| User activity | app_src | App source | “Source Verification” or “Source Unverified” |
| Feature Set | Feature Name | Description | Type |
|---|---|---|---|
| Target | lbl_cd | label | Categorical |
| Date | trsc_dt | Transaction date | Date |
| App information | app_pkg_nm | App package name | Categorical |
| app_sz | App size | Numerical | |
| app_sz_yn | Whether the app size is Null | Categorical | |
| App permissions | read_sms | SMS read permission | Categorical |
| receive_sms | SMS write permission | Categorical | |
| process_outgoing_calls | Permission to process outgoing calls | Categorical | |
| call_phone | Permission to make calls | Categorical | |
| request_install_packages | Permission to request the installation of packages | Categorical | |
| manage_external_storage | Permission to manage shared storage | Categorical | |
| App service | basc_phone_app | Whether it is the default phone app | Categorical |
| User activity | app_src | App source | Categorical |
| app_src_cnfm_yn | Whether the app source is verified | Categorical | |
| Ist_af_psg_drtm | The elapsed time after the installation (Installation date to Transaction date) | Numerical | |
| Ist_af_pst_drtm_yn | Whether the elapsed time after the installation is Null | Categorical | |
| User information | age | Age | Numerical |
| age_yn | Whether the age is Null | Categorical | |
| gndr_dv_cd | Gender | Categorical |
| Feature Set | Feature Name | Description | Type |
|---|---|---|---|
| App package name statistics | nm_len | Length | Numerical |
| word_len | Number of words | Numerical | |
| word_list_len_std | The standard deviation of the length of individual words in the word list | Numerical | |
| word_list_len_mean | The mean of the length of individual words in the word list | Numerical | |
| num_ratio | The ratio of numbers | Numerical | |
| vowel_ratio | The ratio of vowels | Numerical | |
| consonant_ratio | The ratio of consonants | Numerical | |
| consecutive_num_ratio | MAX (the ratio of consecutive numbers) | Numerical | |
| consecutive_vowel_ratio | MAX (the ratio of consecutive vowels) | Numerical | |
| consecutive_consonant_ratio | MAX (the ratio of consecutive consonants) | Numerical | |
| word_1_len | The length of the first word | Numerical | |
| word_1_num_ratio | The ratio of numbers in the first word | Numerical | |
| word_1_vowel_ratio | The ratio of vowels in the first word | Numerical | |
| word_1_consonant_ratio | The ratio of consonants in the first word | Numerical | |
| word_1_consecutive_num_ratio | MAX (the ratio of consecutive numbers in the first word) | Numerical | |
| word_1_consecutive_vowel_ratio | MAX (the ratio of consecutive vowels in the first word) | Numerical | |
| word_1_consecutive_consonant_ratio | MAX (the ratio of consecutive consonants in the first word) | Numerical | |
| word_6_consecutive_num_ratio | MAX (the ratio of consecutive numbers in the sixth word) | Numerical | |
| word_6_consecutive_vowel_ratio | MAX (the ratio of consecutive vowels in the sixth word) | Numerical | |
| word_6_consecutive_consonant_ratio | MAX (the ratio of consecutive consonants in the sixth word) | Numerical |
| Model Set (Daily) | Train Set | Test Set | ||
|---|---|---|---|---|
| Benign | Malware | Benign | Malware | |
| Dataset 1 | 66,027,370 | 6397 | 841,131 | 18 |
| Dataset 2 | 66,238,910 | 6415 | 607,316 | 24 |
| Dataset 3 | 66,287,400 | 6439 | 1,180,391 | 81 |
| ----- | ----- | ----- | ----- | ----- |
| Dataset 90 | 71,891,560 | 11,975 | 689,702 | 7 |
| Dataset 91 | 71,499,660 | 11,982 | 534,351 | 4 |
| Dataset 92 | 70,938,520 | 11,986 | 605,394 | 2 |
| Algorithm | Hyperparameter Grid |
|---|---|
| Logistic Regression | {“max_iter”: 100, “class_weight”: “balanced”, “fit_intercept”: True, “C” (regularization strength): 1.0, “penalty”: “l2”} |
| Random Forest | {“n_estimators”: 200, “class_weight”: “balanced”, “max_depth”: 64, “bootstrap”: false} |
| LightGBM | {“n_estimators”: 300, “learning_rate”: 0.1, “max_depth”: −1, “class_weight”: “balanced”, “max_delta_step”: 100, “num_leaves”: 128, “colsample_bytree”: 0.5, “subsample”: 1, “objective”: “binary”, “boost_from_average”: “false”} |
| XGBoost | {“n_estimators”: 200, “learning_rate”: 0.1, “scale_pos_weight”: num_neg_samples/num_pos_samples, “max_depth”: 0} |
| CatBoost | {“iterations”: 200, “learning_rate”: 0.03, “subsample”: 0.8, “scale_pos_weight”: num_benign_samples/num_malware_samples, “depth”: 16} |
| Model Dataset (Daily) | Accuracy | Precision | Recall | F1-Score |
|---|---|---|---|---|
| Dataset 1 | 0.856419 | 0.000149 | 1.000000 | 0.000298 |
| Dataset 2 | 0.860246 | 0.000271 | 0.958333 | 0.000542 |
| Dataset 3 | 0.853666 | 0.000411 | 0.876543 | 0.000821 |
| ----- | ----- | ----- | ----- | ----- |
| Dataset 91 | 0.860366 | 0.000073 | 1.000000 | 0.000145 |
| Dataset 92 | 0.878249 | 0.000061 | 1.000000 | 0.000123 |
| Total_Avg | 0.849444 | 0.000376 | 0.924700 | 0.000751 |
| Model Dataset (Daily) | Accuracy | Precision | Recall | F1-Score |
|---|---|---|---|---|
| Dataset 1 | 0.999999 | 1.000000 | 0.944444 | 0.971429 |
| Dataset 2 | 1.000000 | 1.000000 | 1.000000 | 1.000000 |
| Dataset 3 | 0.999997 | 1.000000 | 0.950617 | 0.974684 |
| ----- | ----- | ----- | ----- | ----- |
| Dataset 91 | 1.000000 | 1.000000 | 1.000000 | 1.000000 |
| Dataset 92 | 1.000000 | 1.000000 | 1.000000 | 1.000000 |
| Total_Avg | 0.999994 | 0.987150 | 0.906815 | 0.945278 |
| Model Dataset (Daily) | Accuracy | Precision | Recall | F1-Score |
|---|---|---|---|---|
| Dataset 1 | 0.999998 | 0.900000 | 1.000000 | 0.947368 |
| Dataset 2 | 1.000000 | 1.000000 | 1.000000 | 1.000000 |
| Dataset 3 | 1.000000 | 1.000000 | 0.978261 | 0.989011 |
| ----- | ----- | ----- | ----- | ----- |
| Dataset 91 | 1.000000 | 1.000000 | 1.000000 | 1.000000 |
| Dataset 92 | 1.000000 | 1.000000 | 1.000000 | 1.000000 |
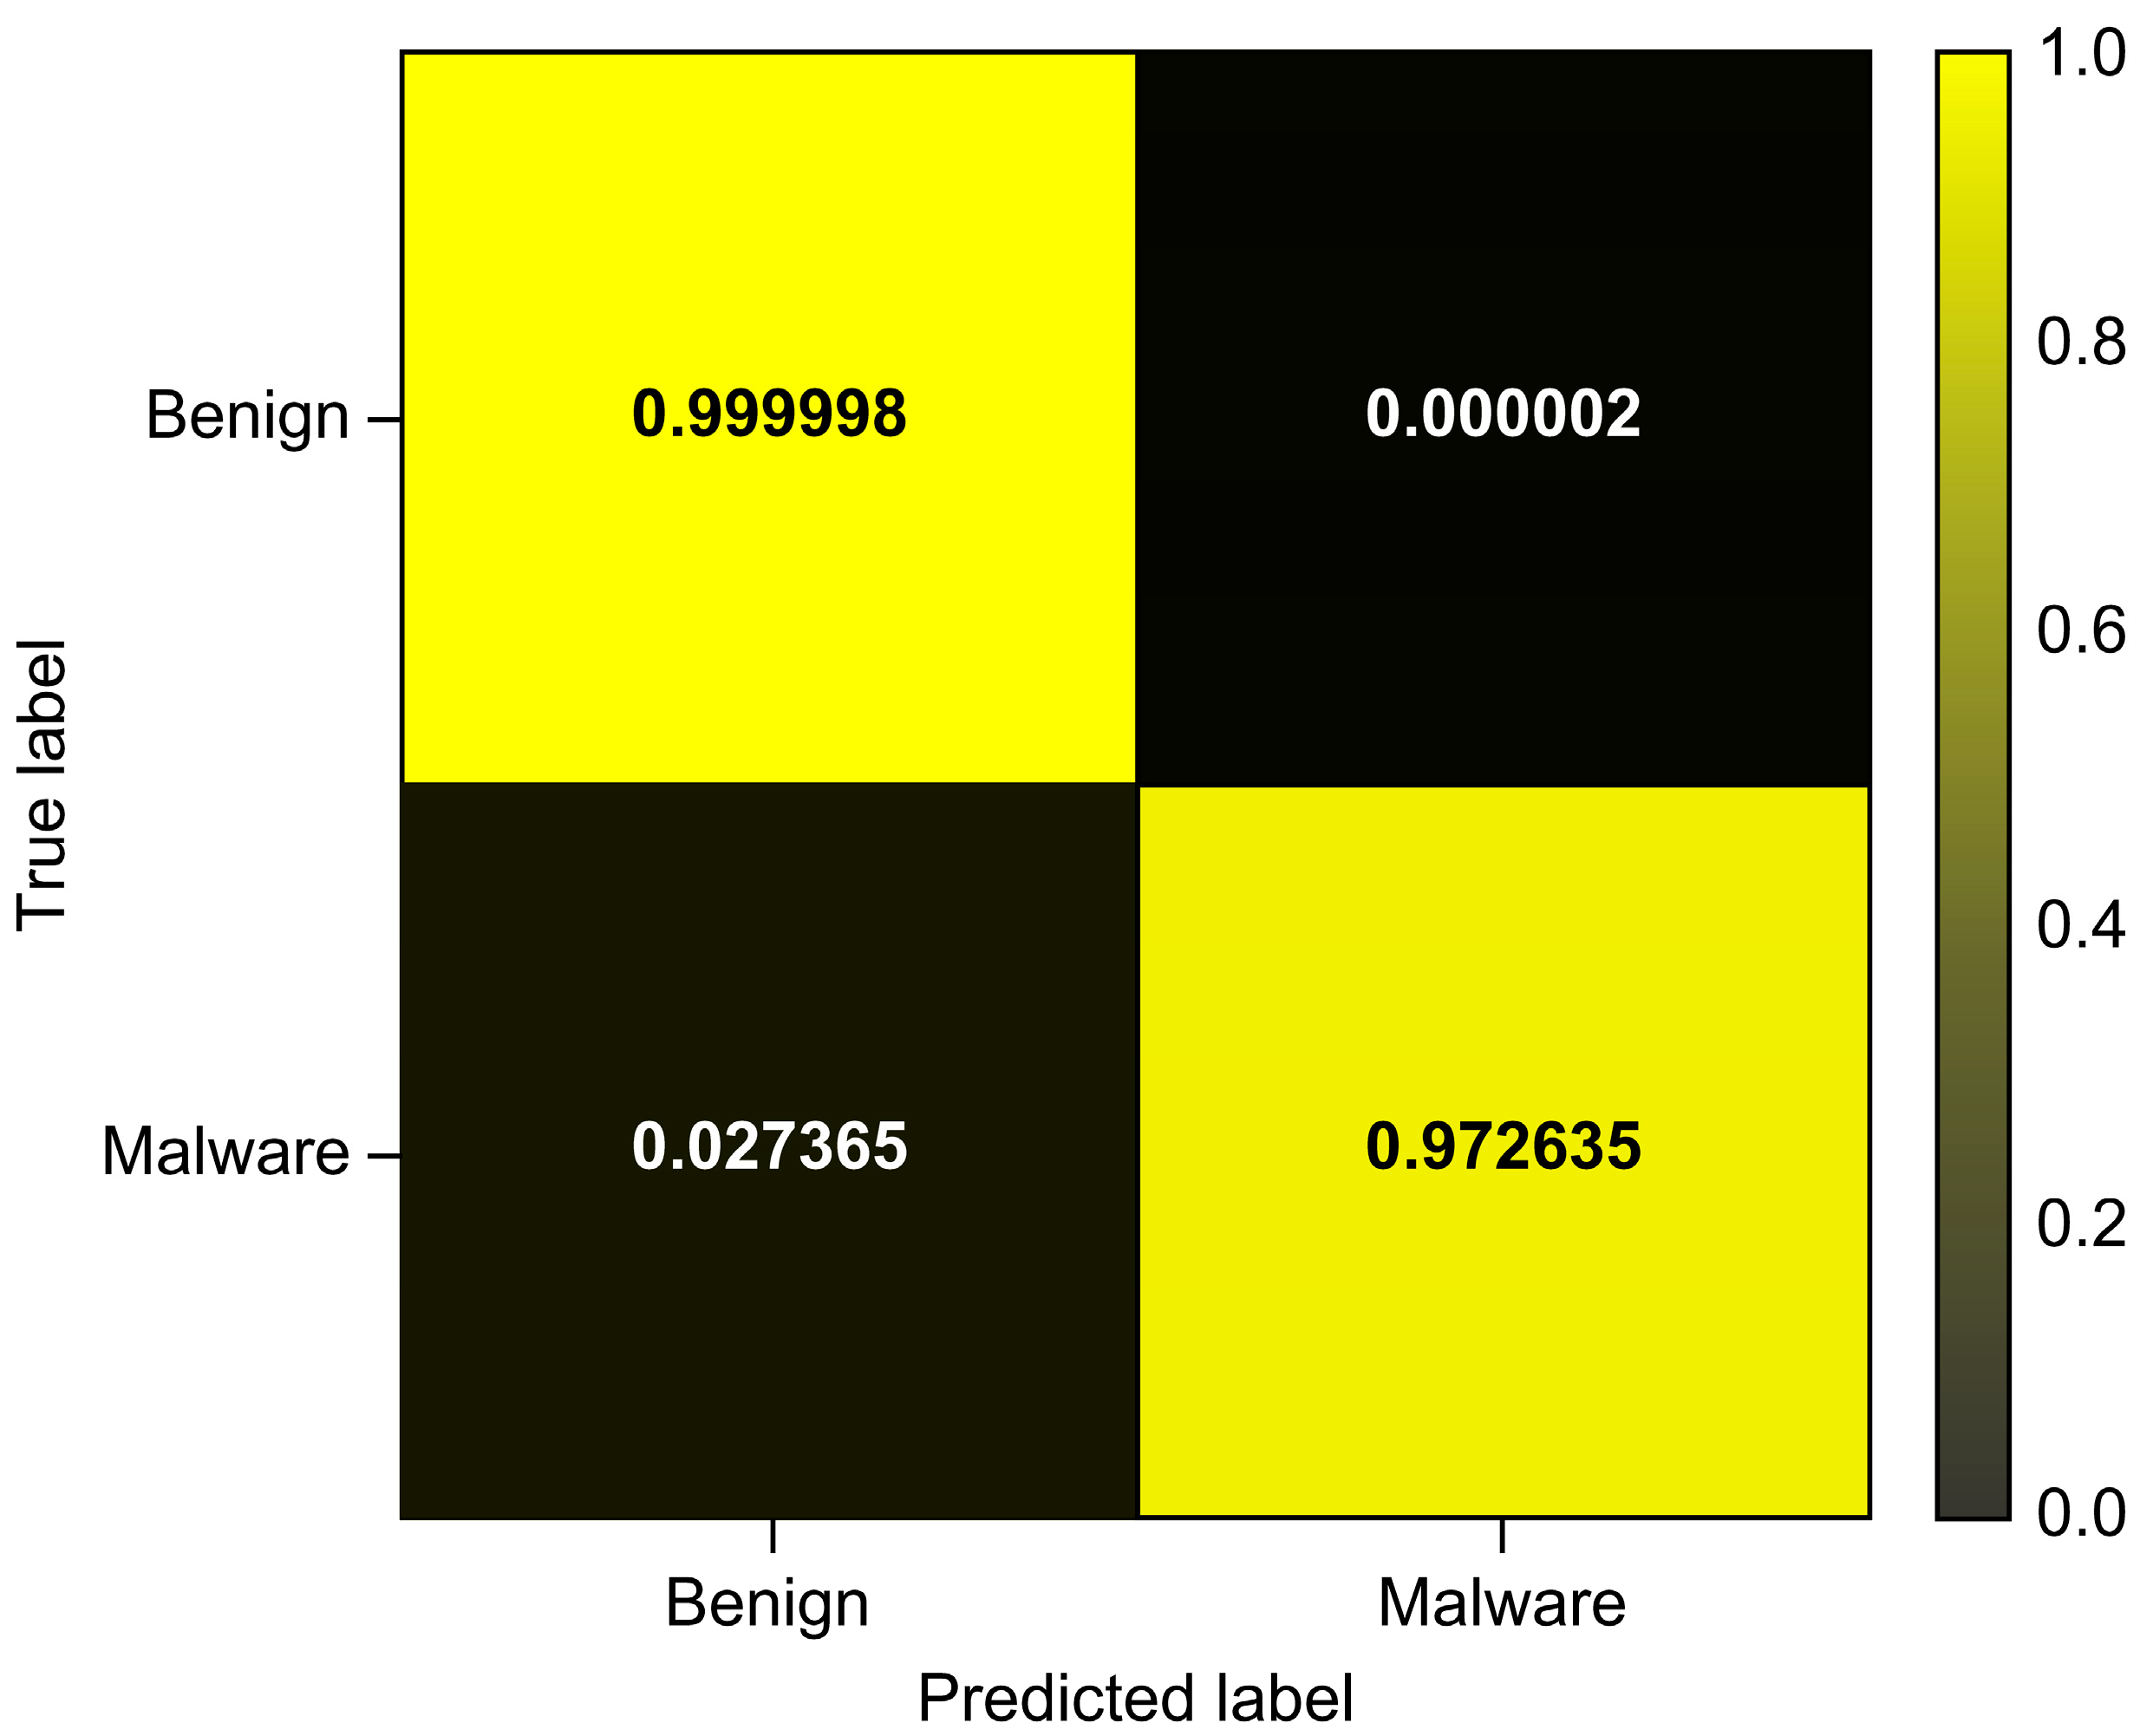
| Total_Avg | 0.999996 | 0.964526 | 0.972635 | 0.968564 |
| Model Dataset (Daily) | Accuracy | Precision | Recall | F1-Score |
|---|---|---|---|---|
| Dataset 1 | 0.999998 | 0.900000 | 1.000000 | 0.947368 |
| Dataset 2 | 1.000000 | 1.000000 | 1.000000 | 1.000000 |
| Dataset 3 | 0.999996 | 0.941860 | 1.000000 | 0.970060 |
| ----- | ----- | ----- | ----- | ----- |
| Dataset 91 | 0.999998 | 0.800000 | 1.000000 | 0.888889 |
| Dataset 92 | 1.000000 | 1.000000 | 1.000000 | 1.000000 |
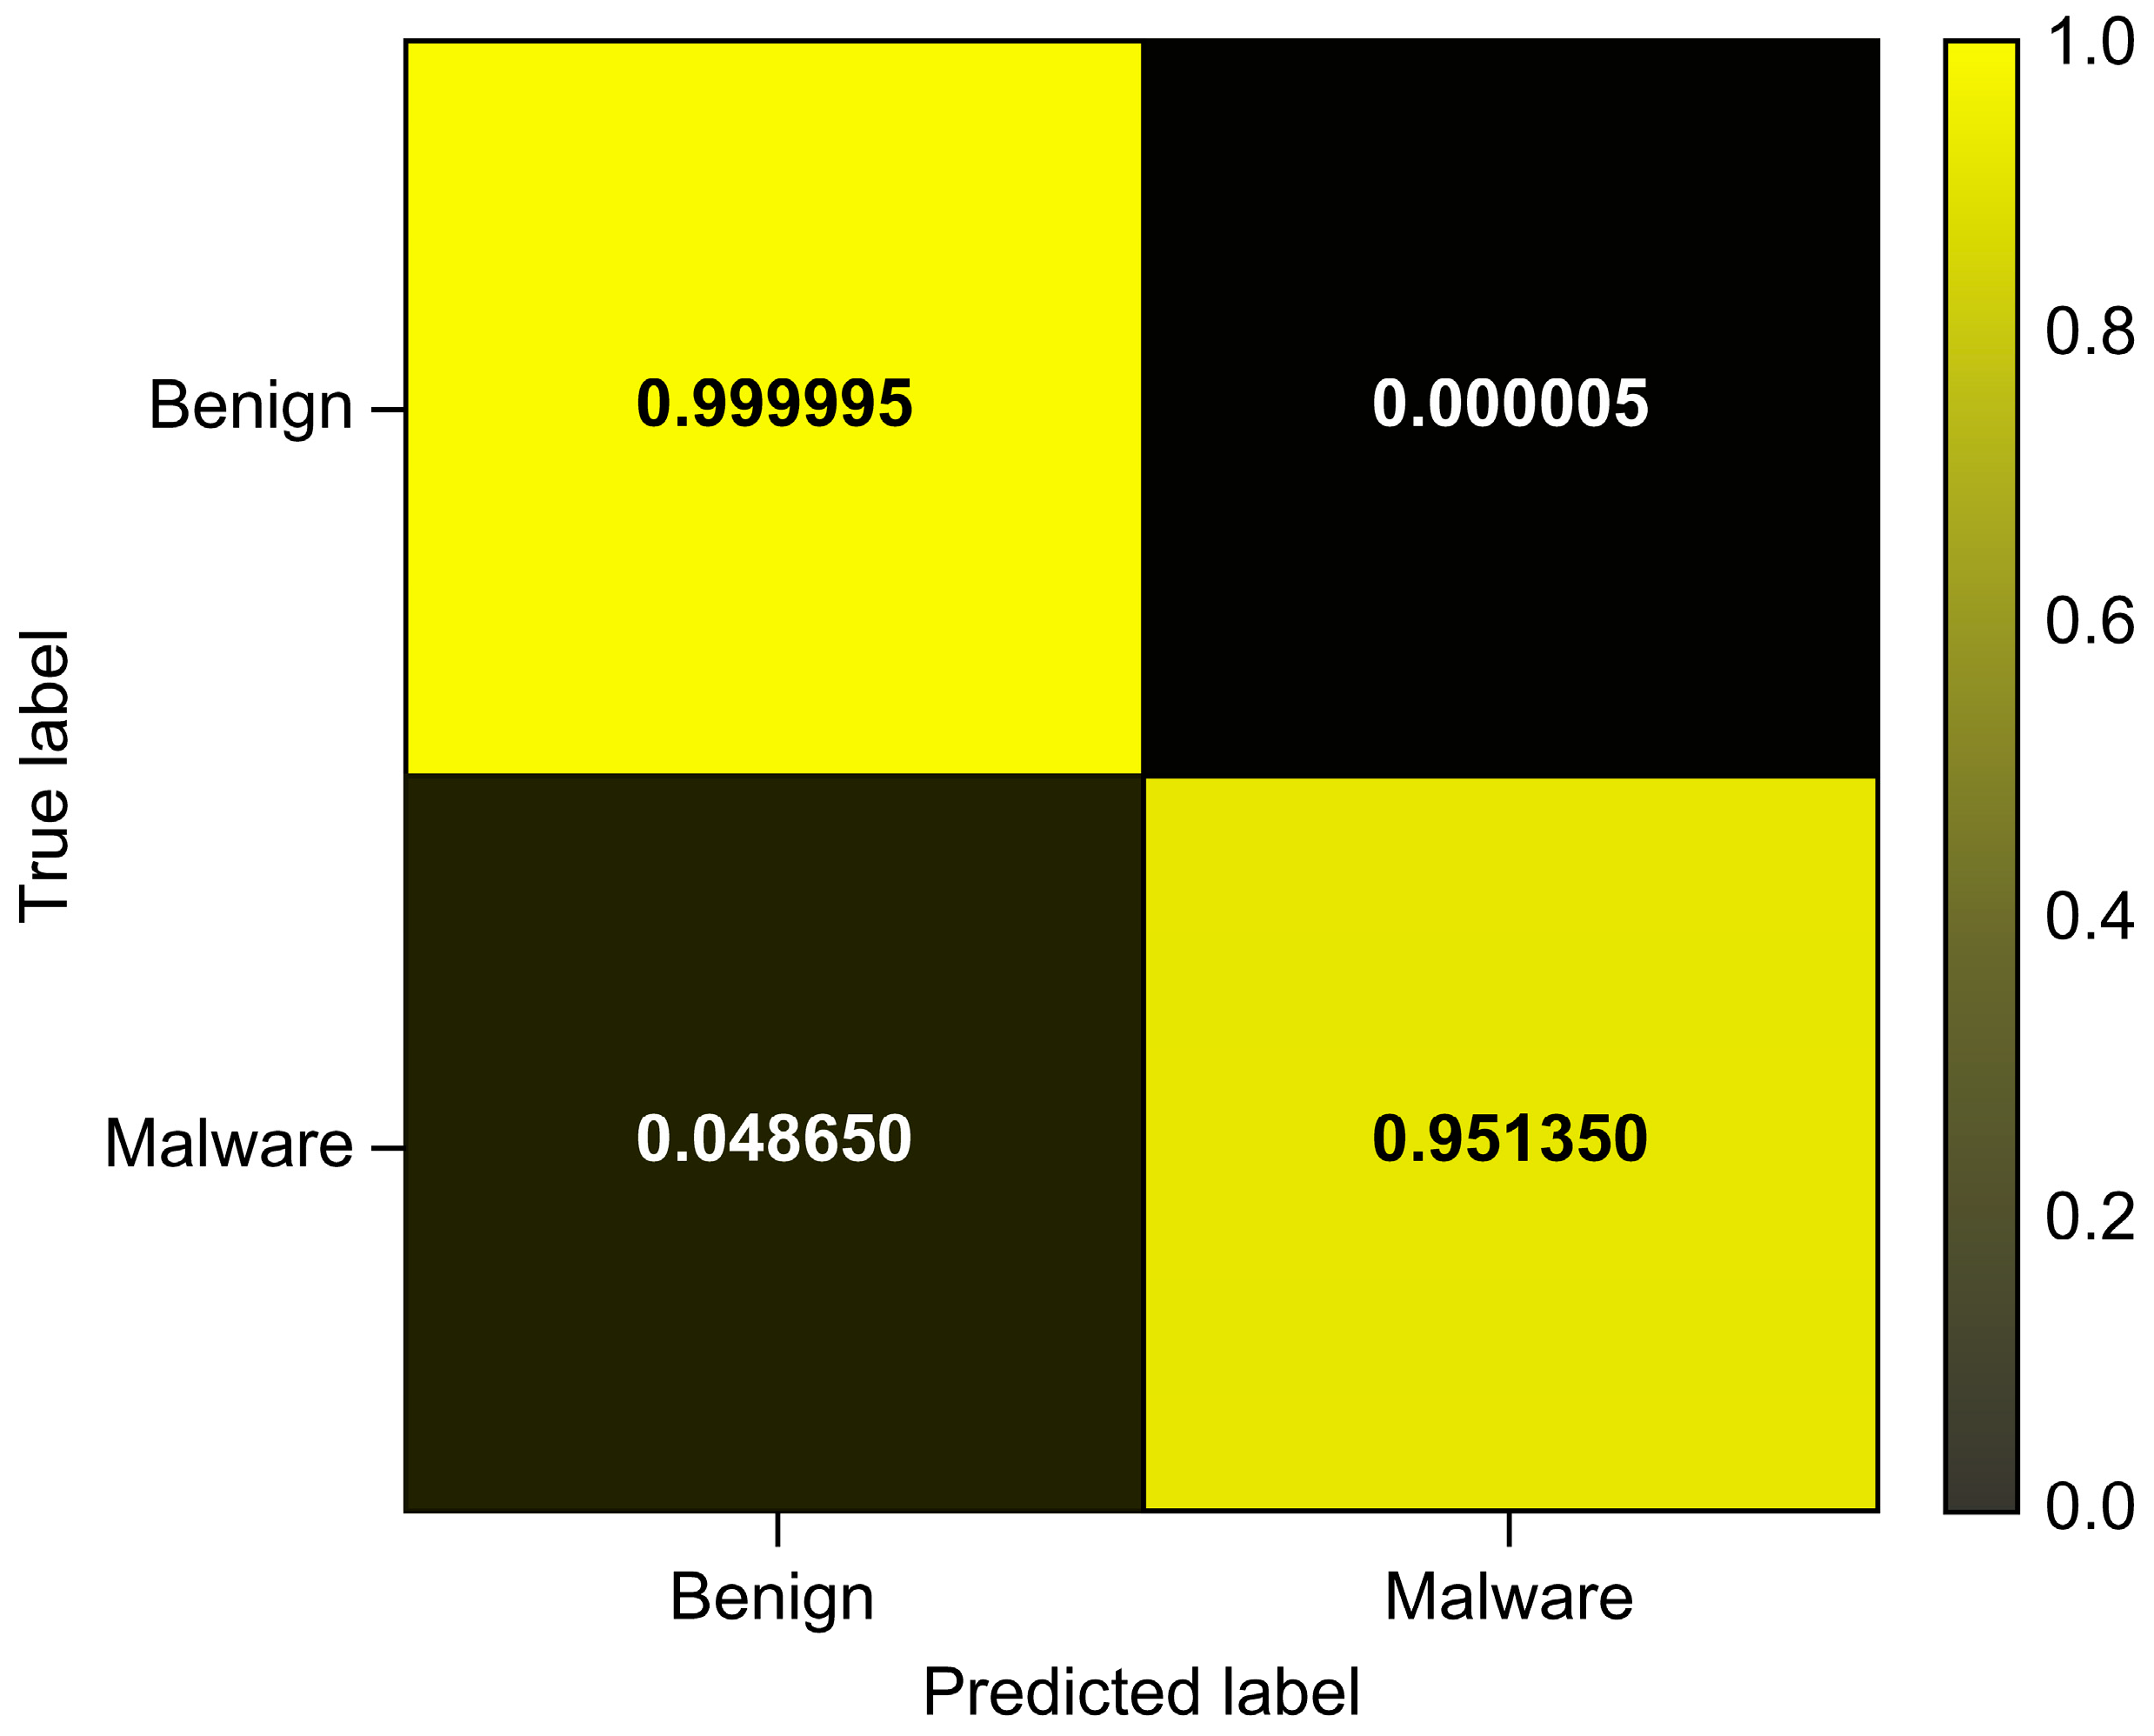
| Total_Avg | 0.999992 | 0.919447 | 0.951350 | 0.935127 |
| Model Dataset (Daily) | Accuracy | Precision | Recall | F1-Score |
|---|---|---|---|---|
| Dataset 1 | 0.999995 | 0.818182 | 1.000000 | 0.900000 |
| Dataset 2 | 0.999993 | 0.857143 | 1.000000 | 0.923077 |
| Dataset 3 | 0.999994 | 0.920455 | 1.000000 | 0.958580 |
| ----- | ----- | ----- | ----- | ----- |
| Dataset 91 | 1.000000 | 1.000000 | 1.000000 | 1.000000 |
| Dataset 92 | 1.000000 | 1.000000 | 1.000000 | 1.000000 |
| Total_Avg | 0.999995 | 0.929774 | 0.987480 | 0.957759 |
| Model | Accuracy | Precision | Recall | F1-Score | AUROC | AUPRC |
|---|---|---|---|---|---|---|
| Logistic Regression | 0.849444 | 0.000376 | 0.924700 | 0.000751 | 0.953914 | 0.014239 |
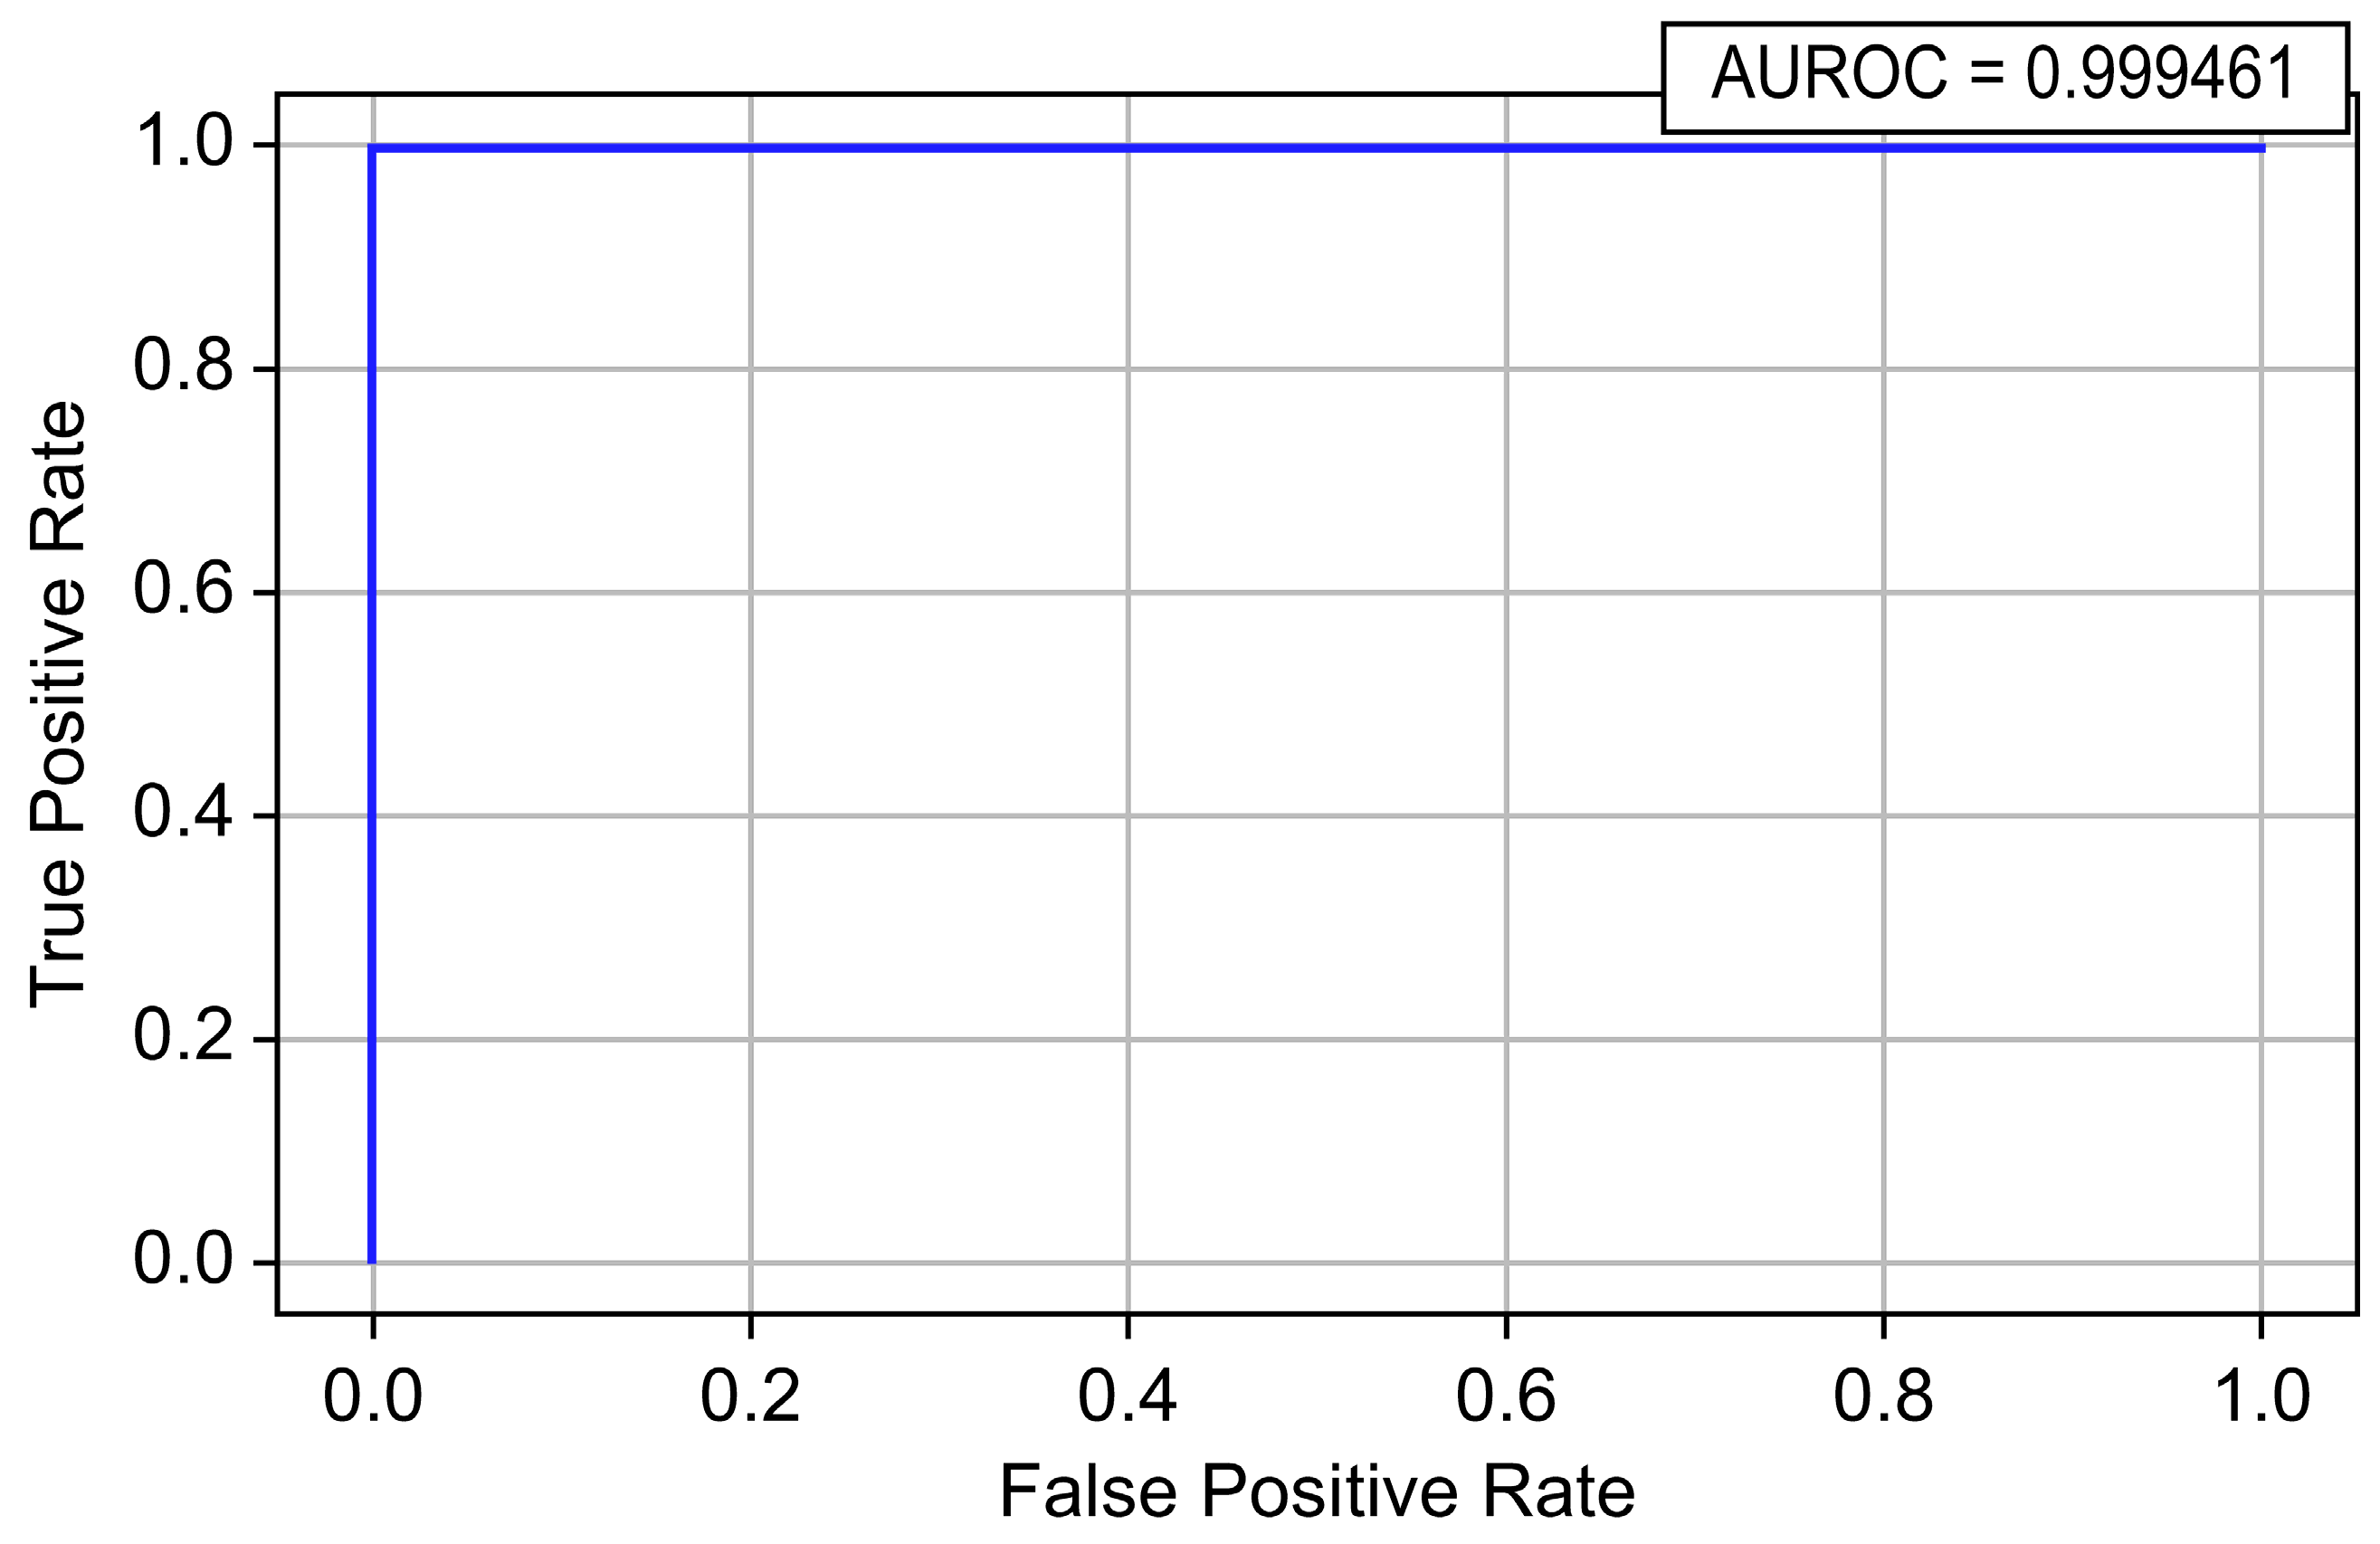
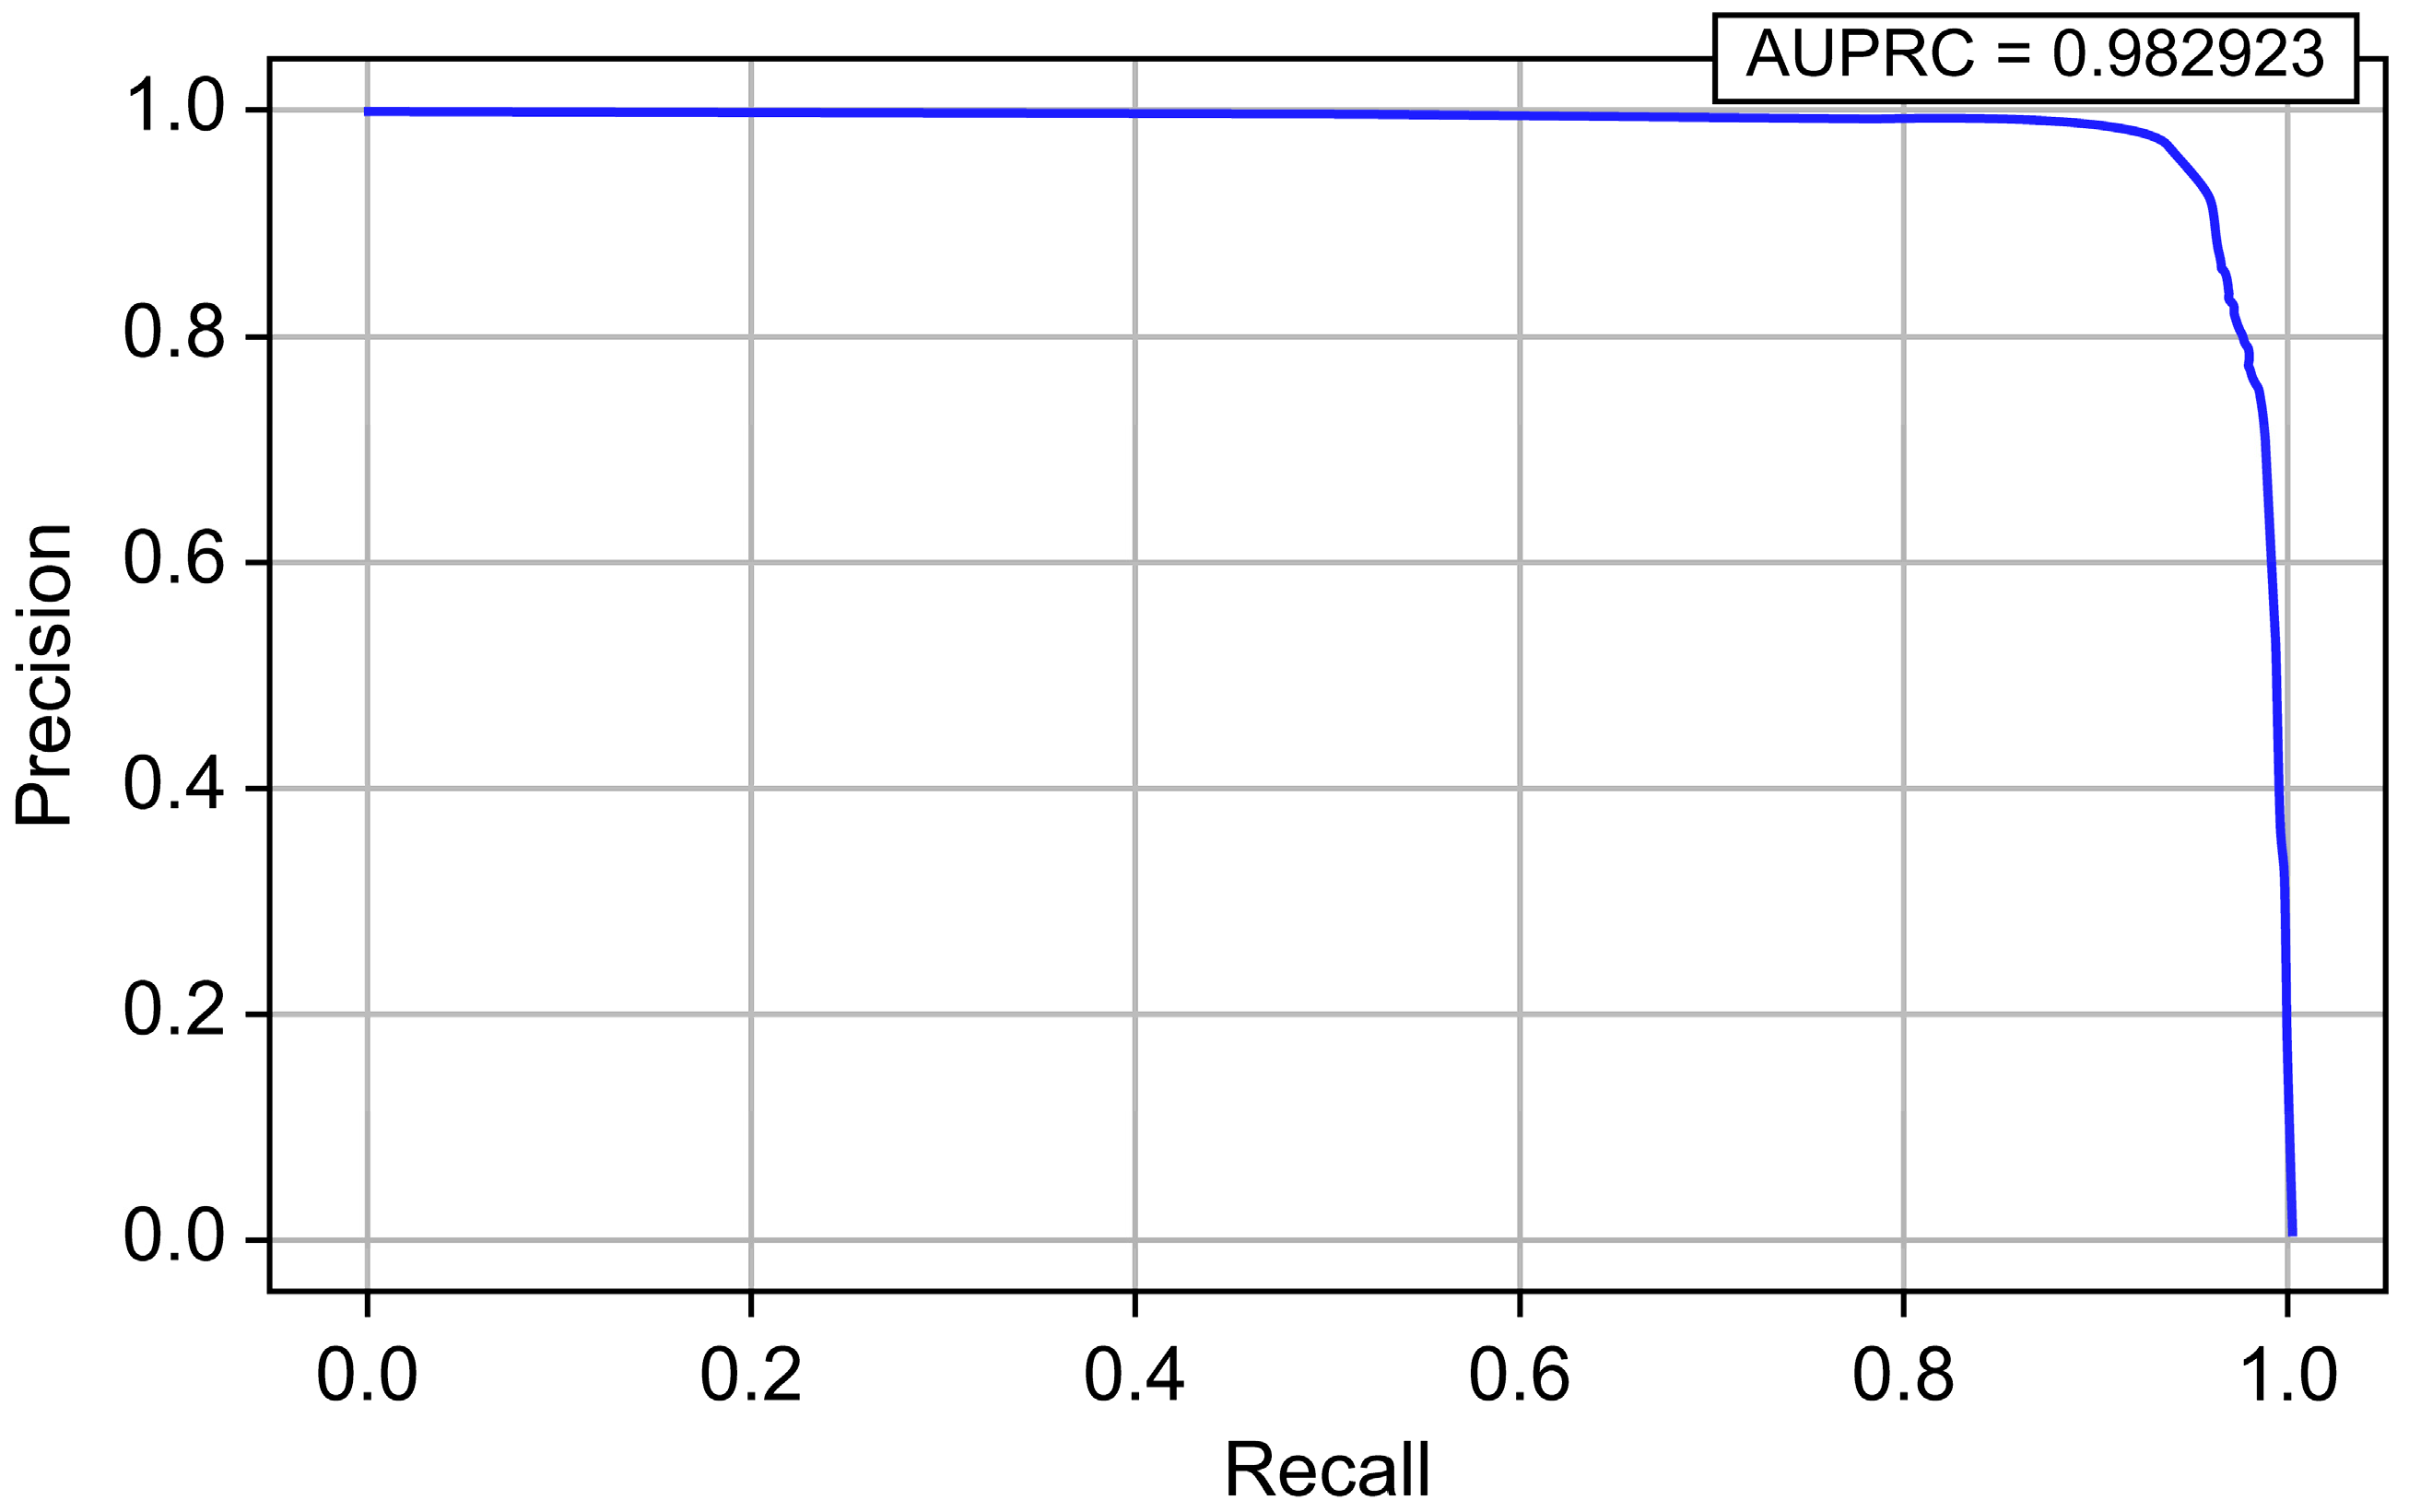
| Random Forest | 0.999994 | 0.987150 | 0.906815 | 0.945278 | 0.999461 | 0.982923 |
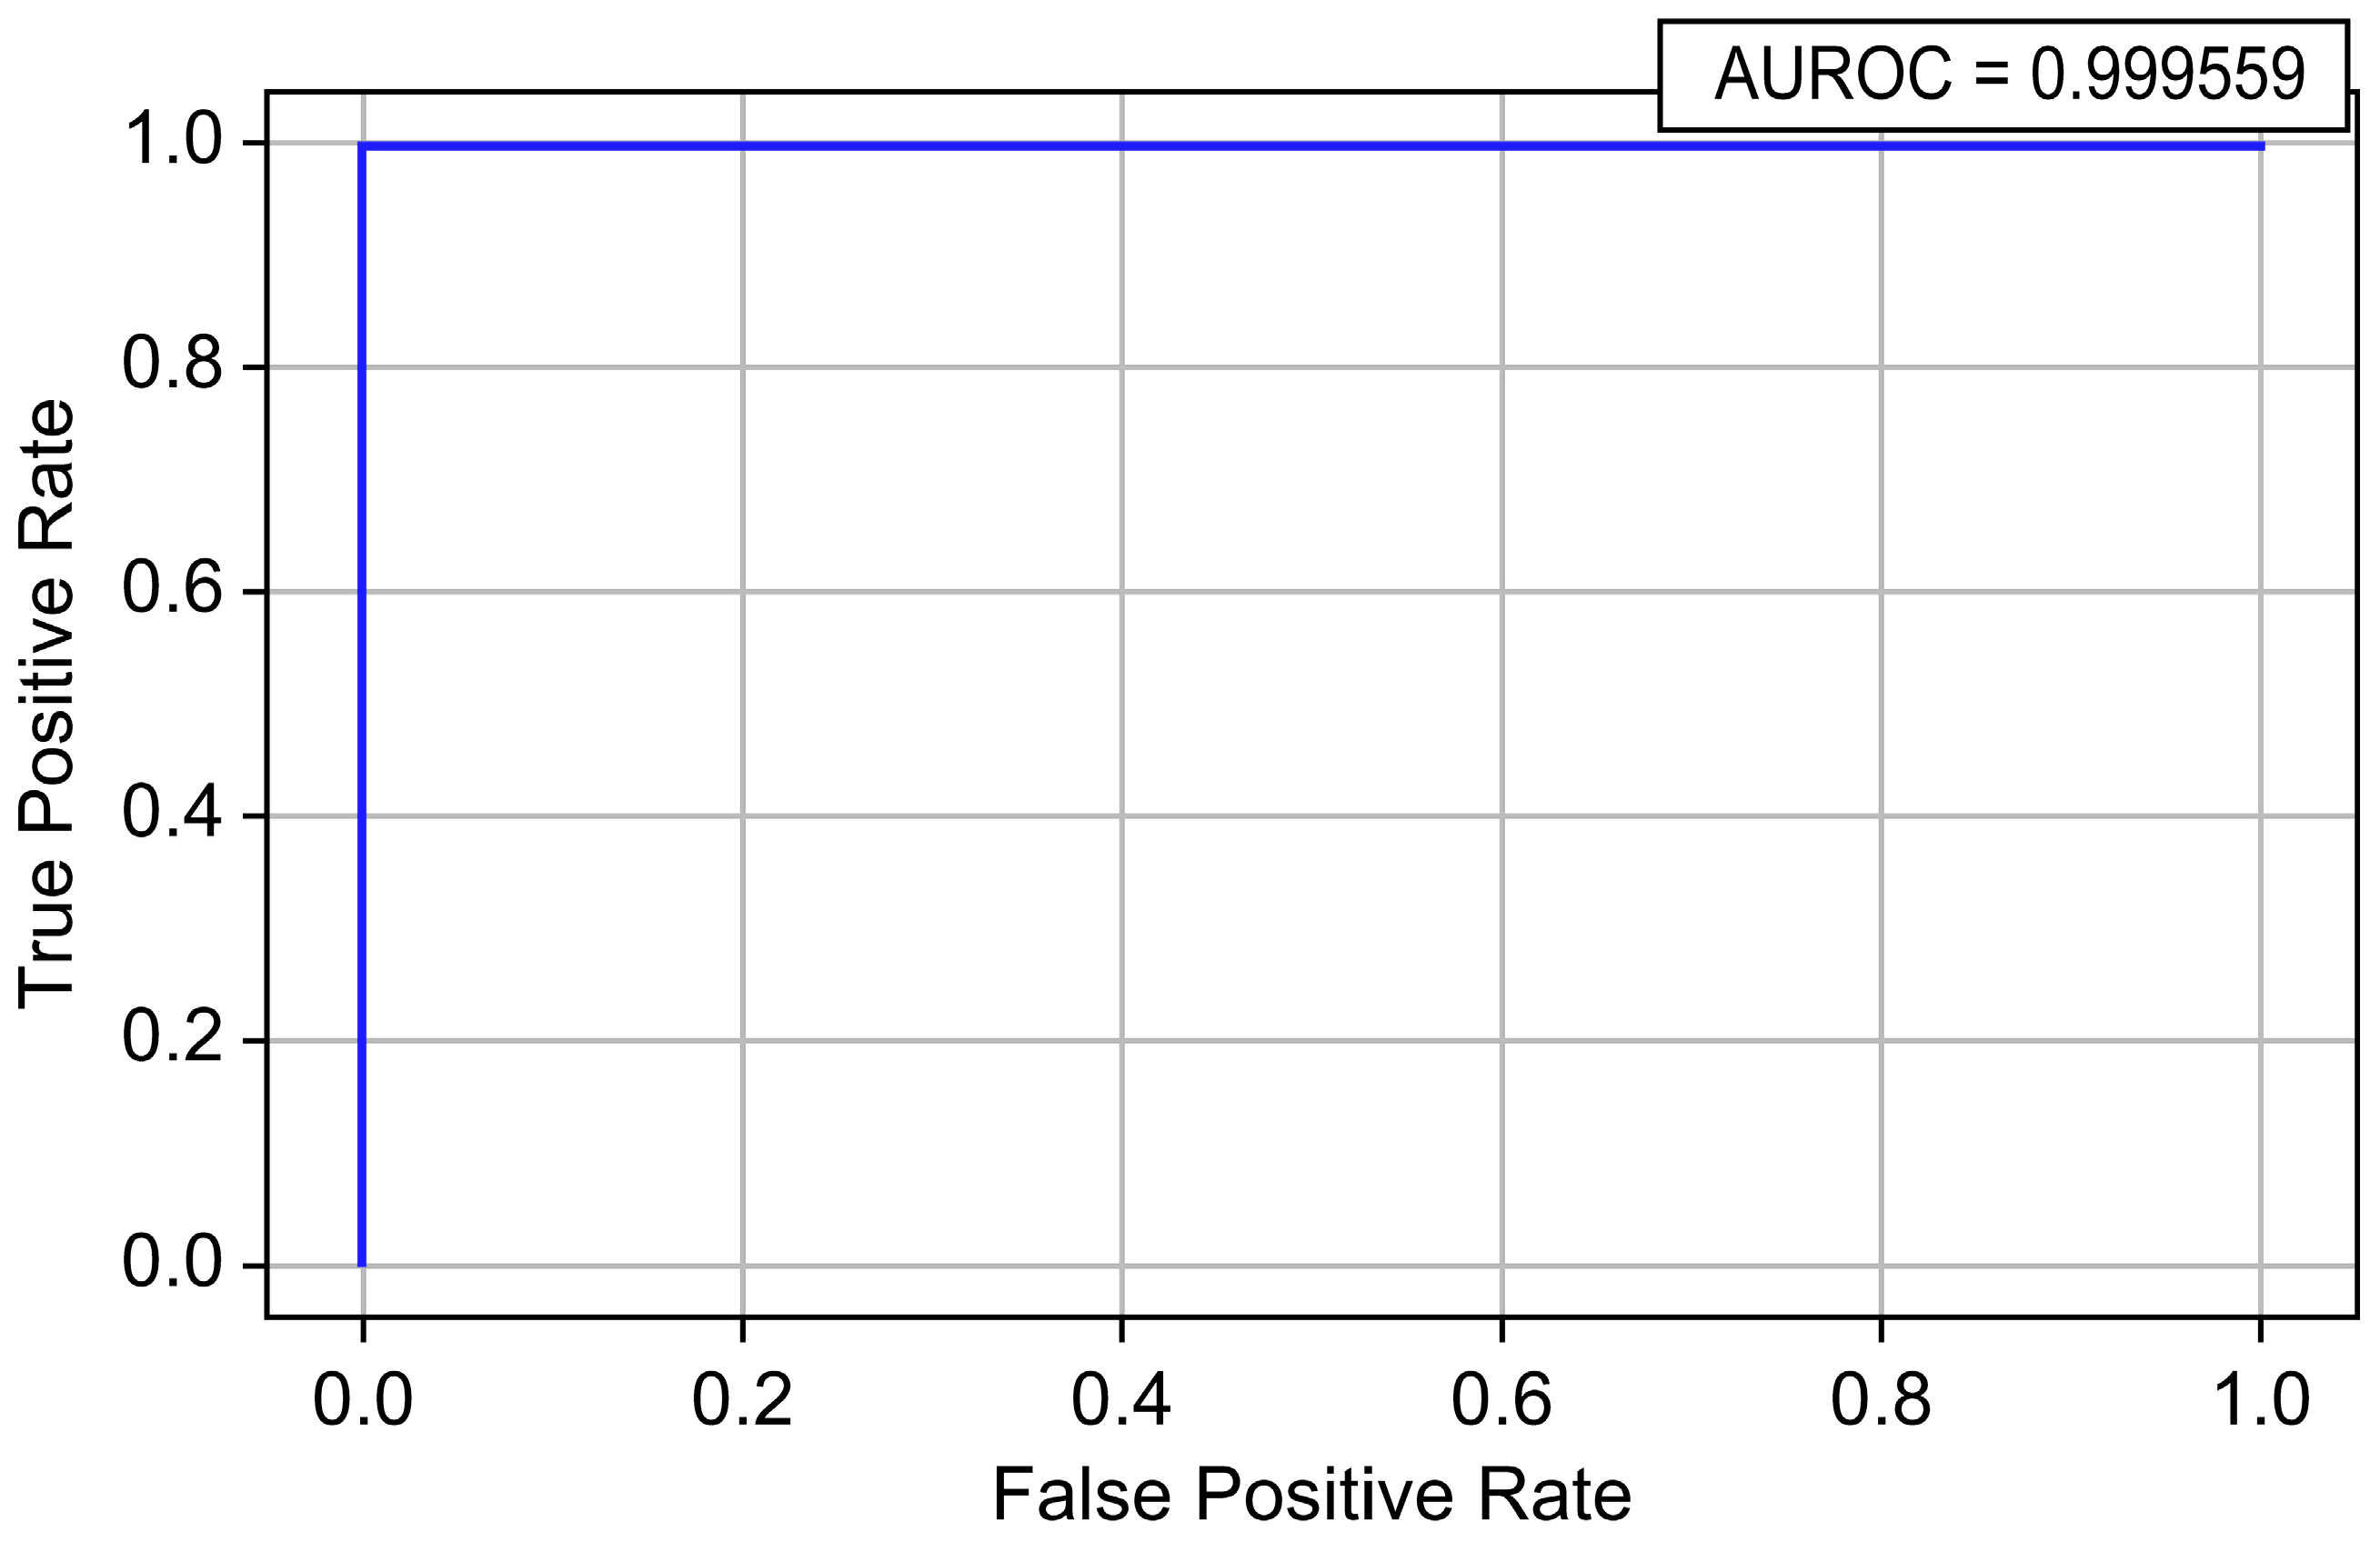
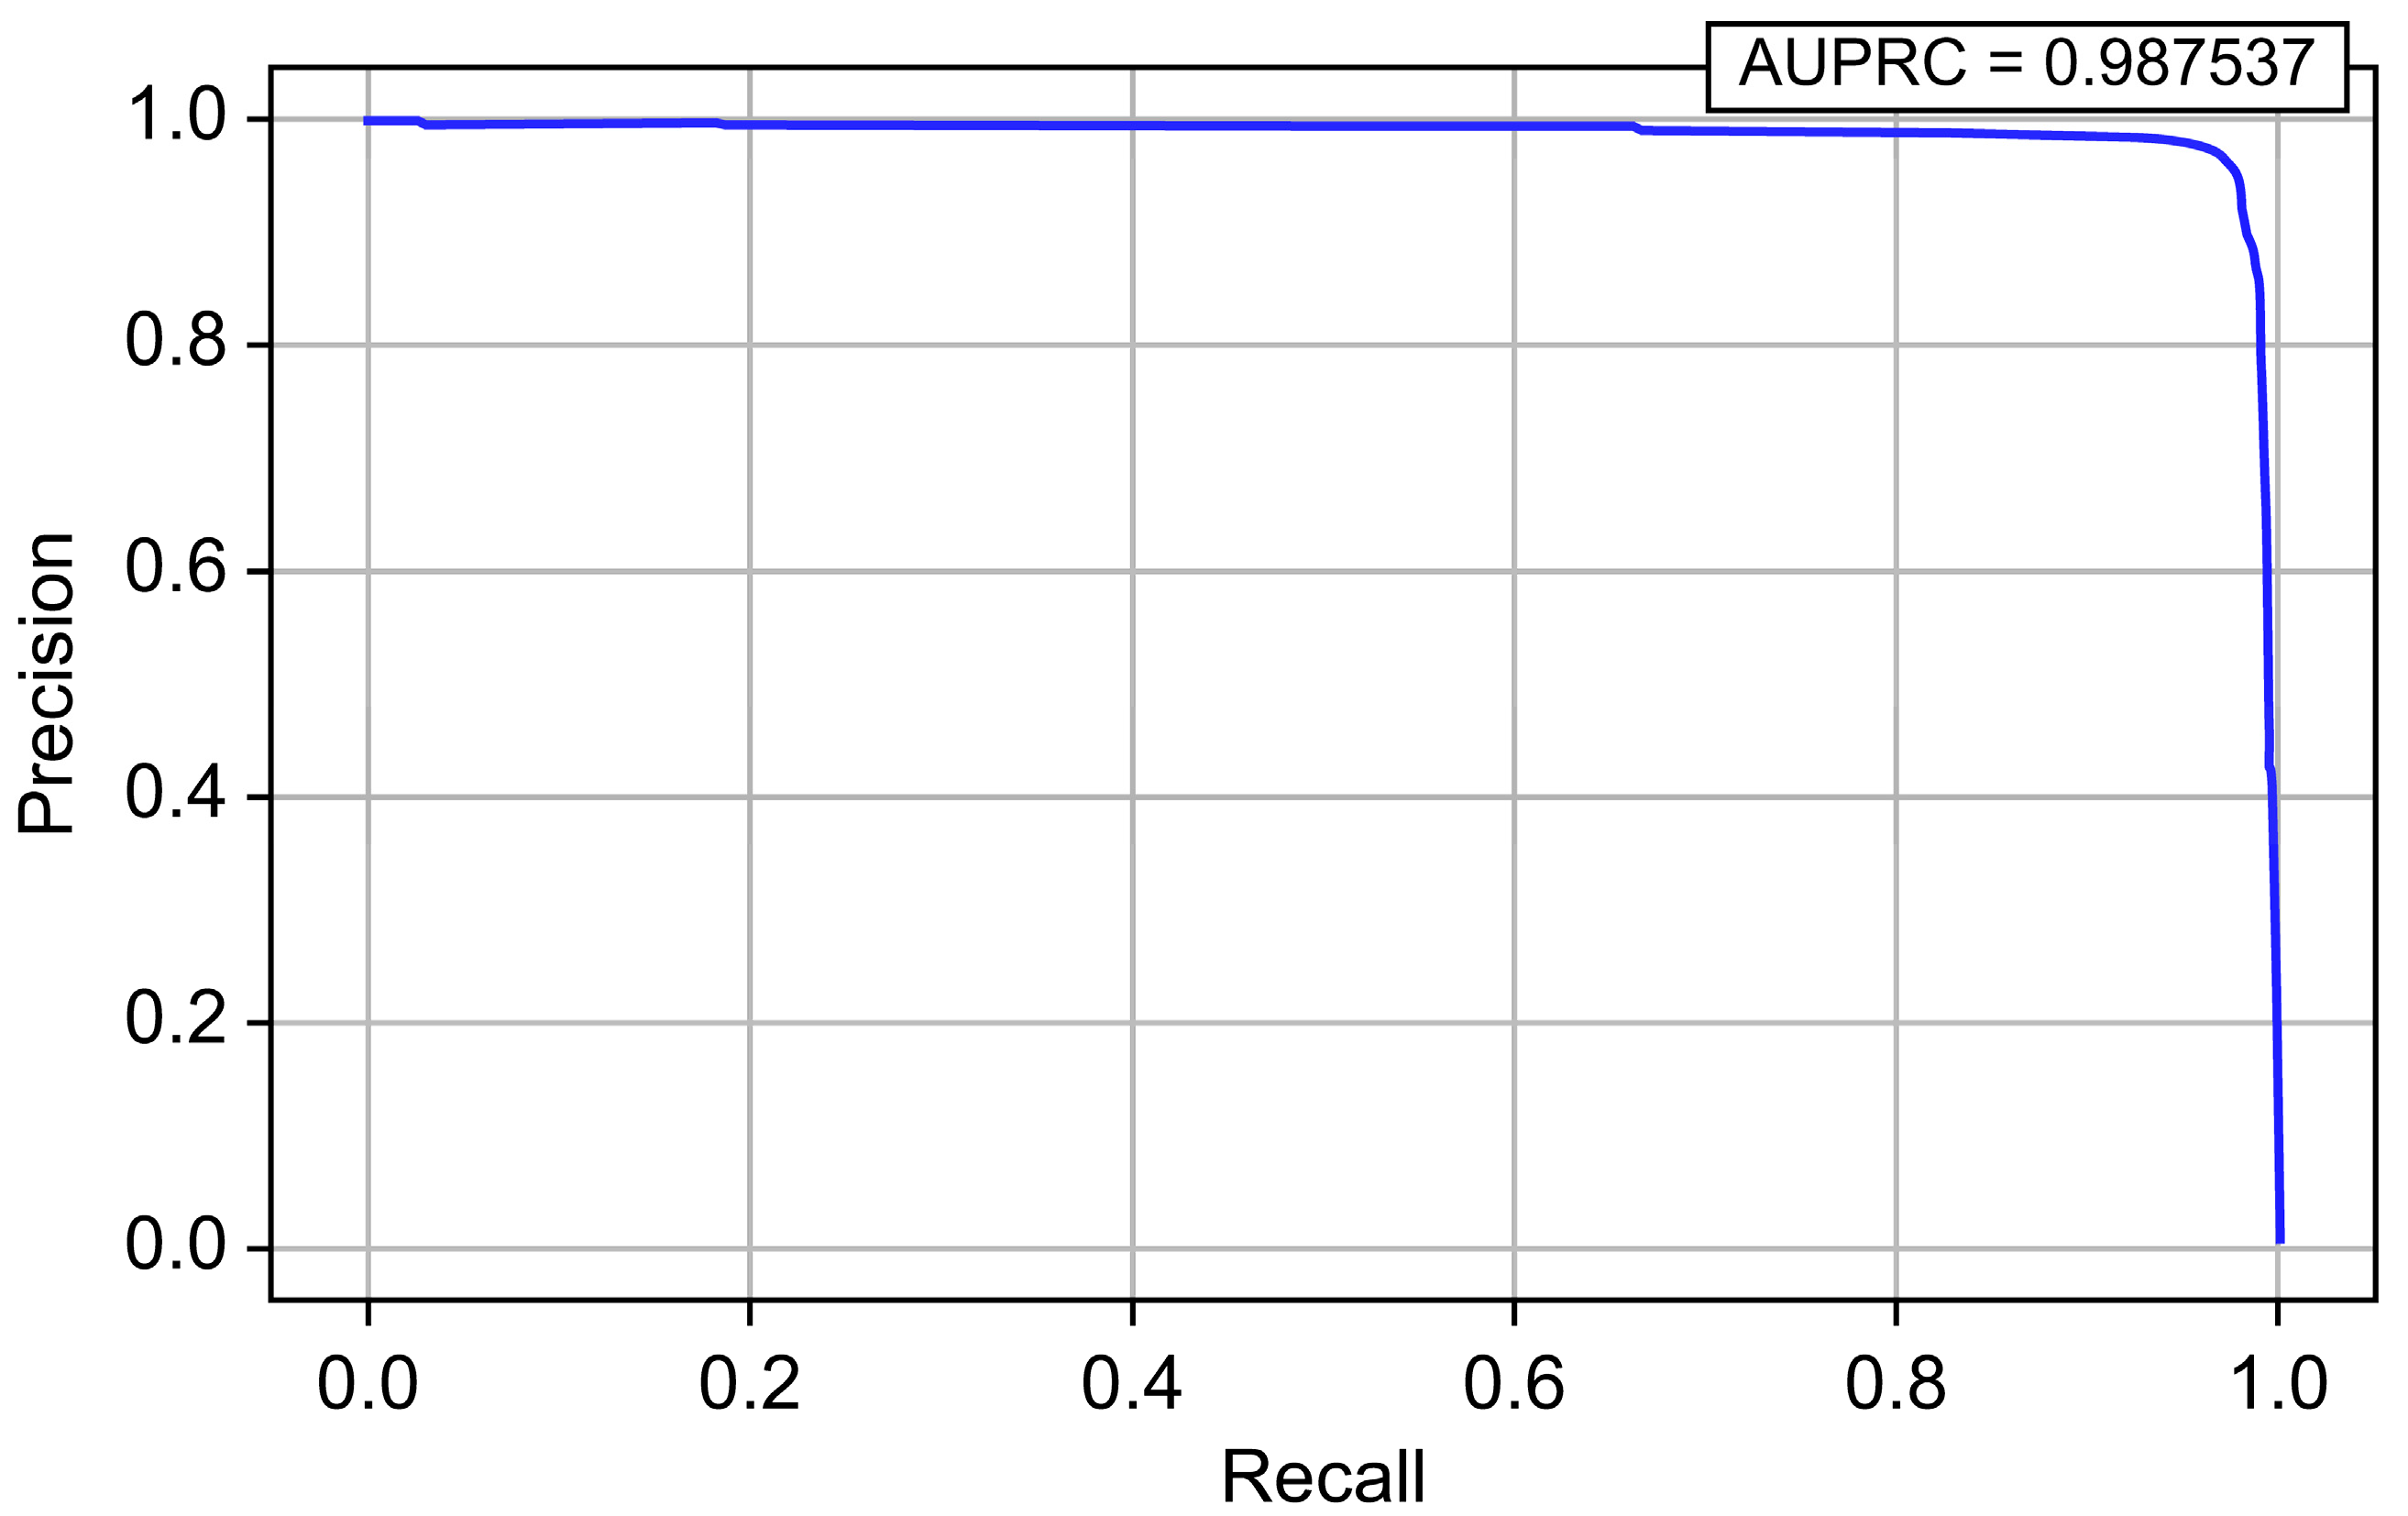
| LightGBM | 0.999996 | 0.964526 | 0.972635 | 0.968564 | 0.999559 | 0.987537 |
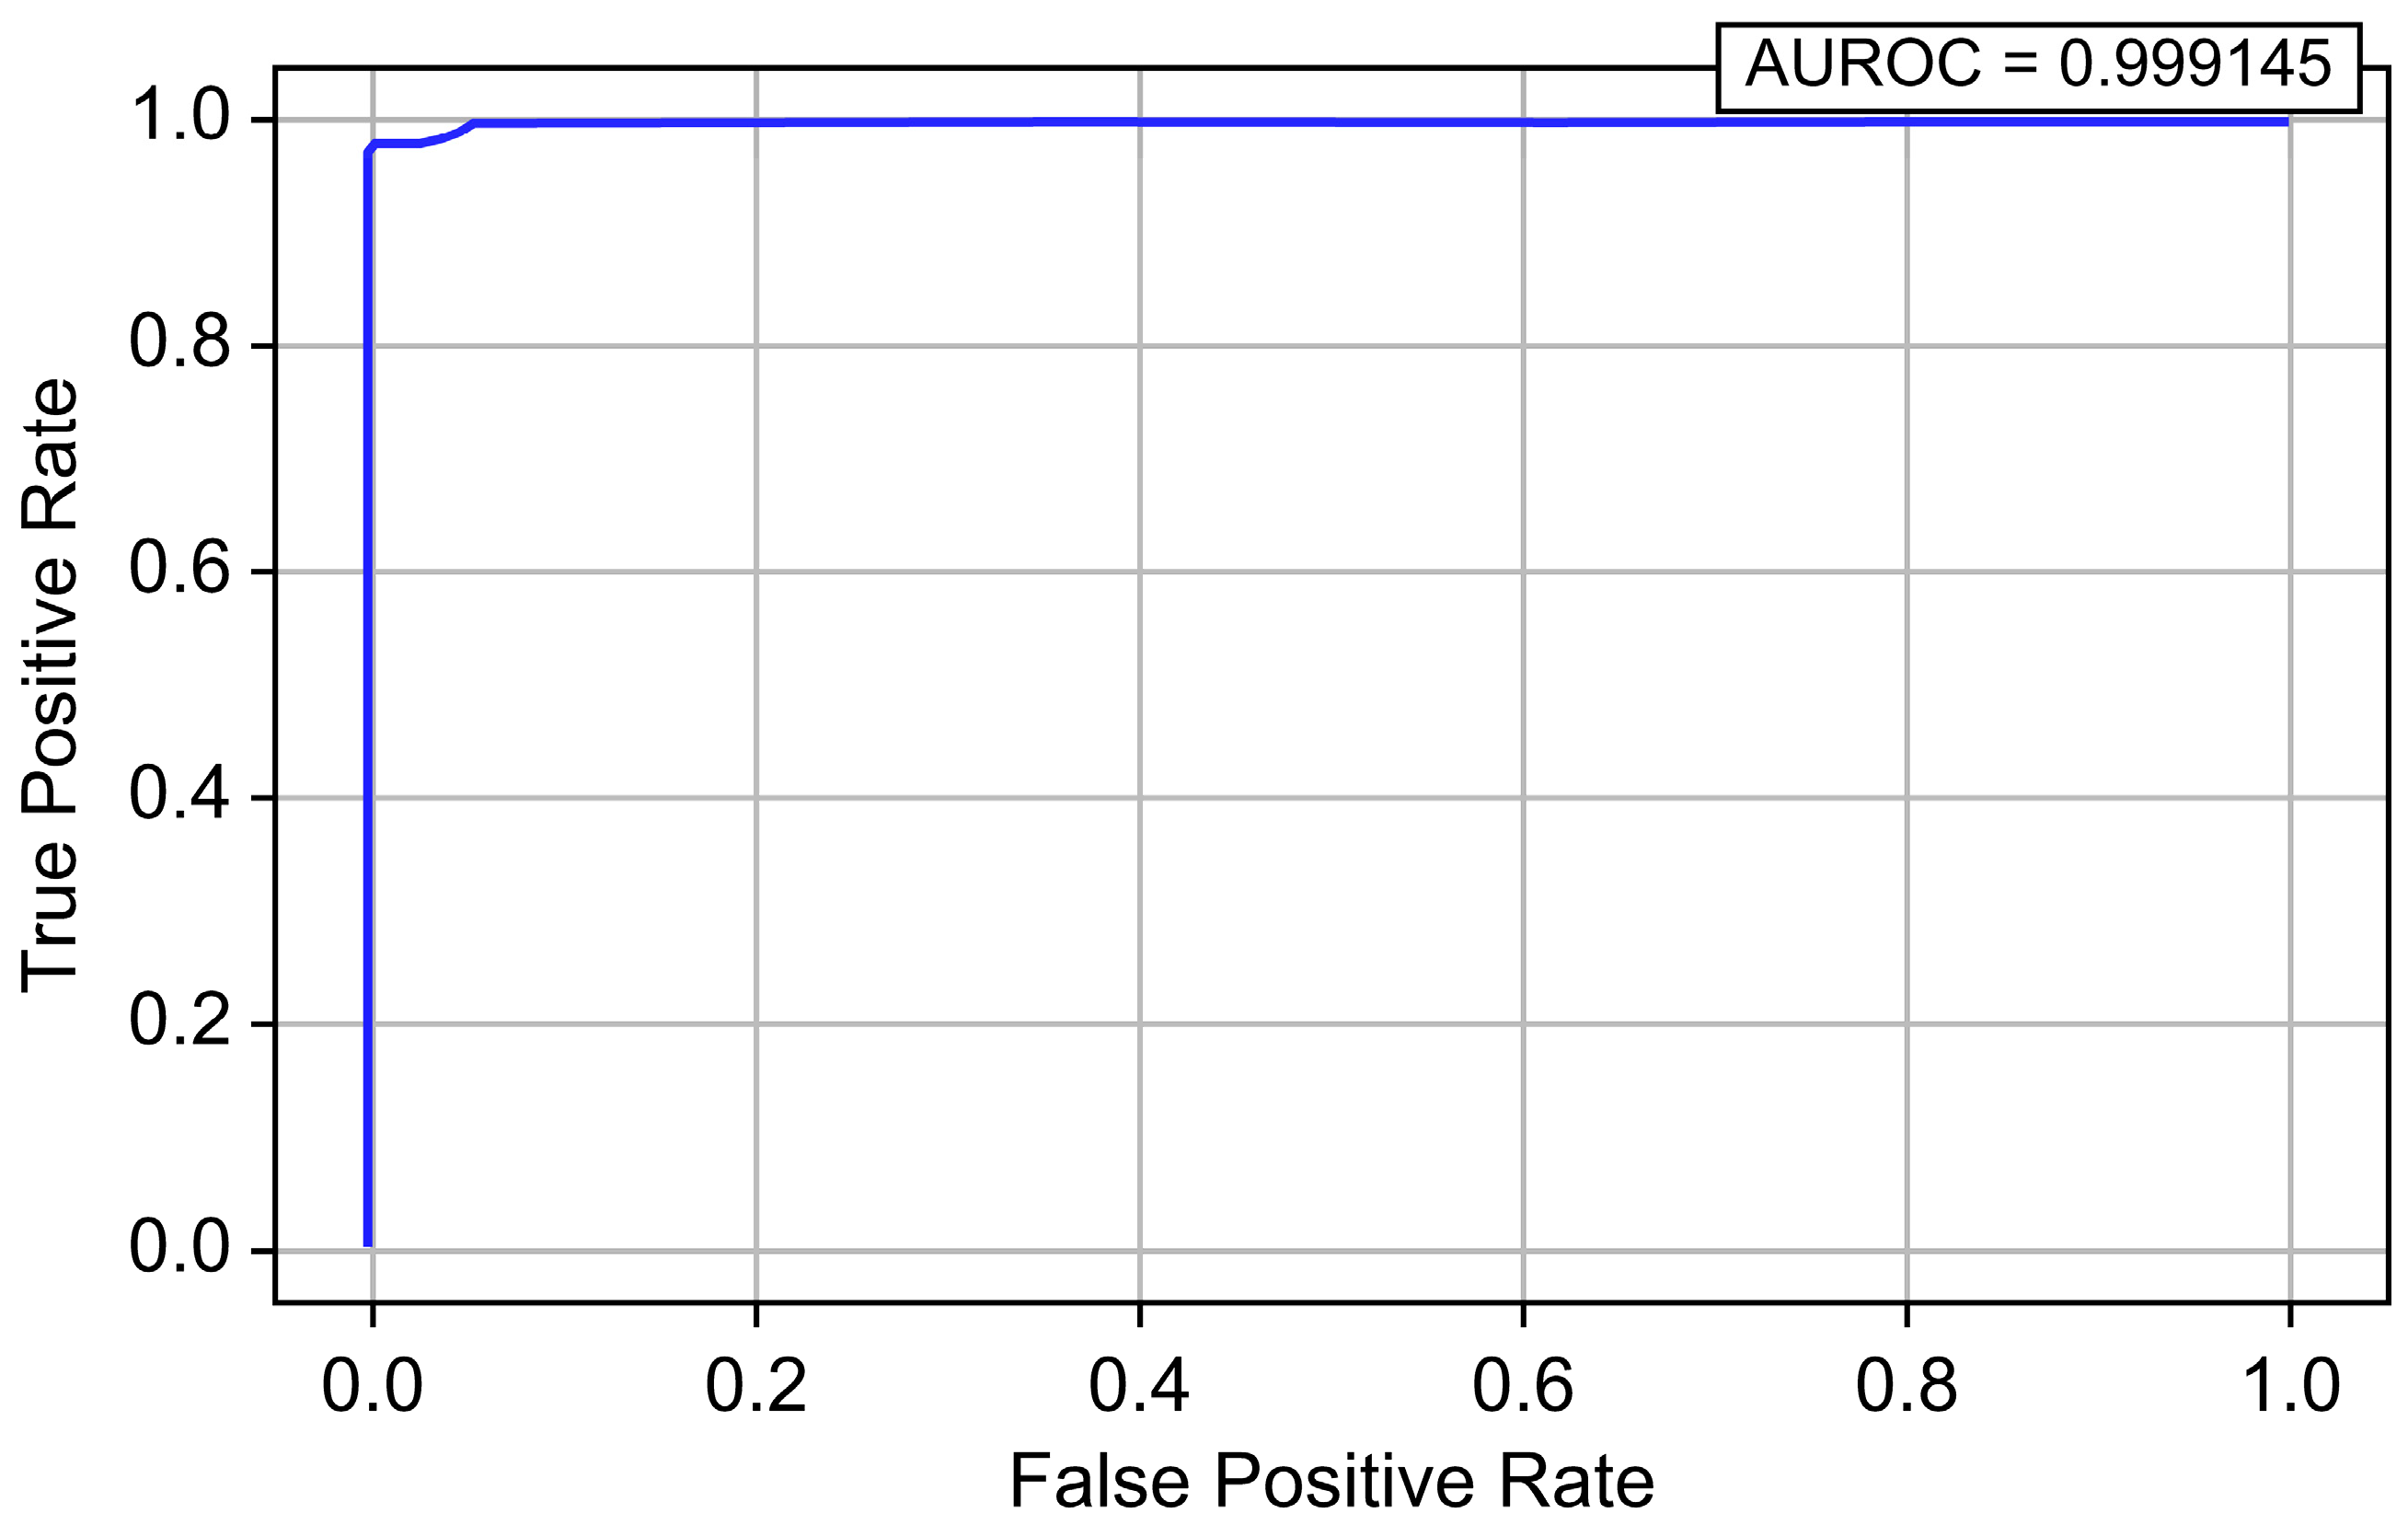
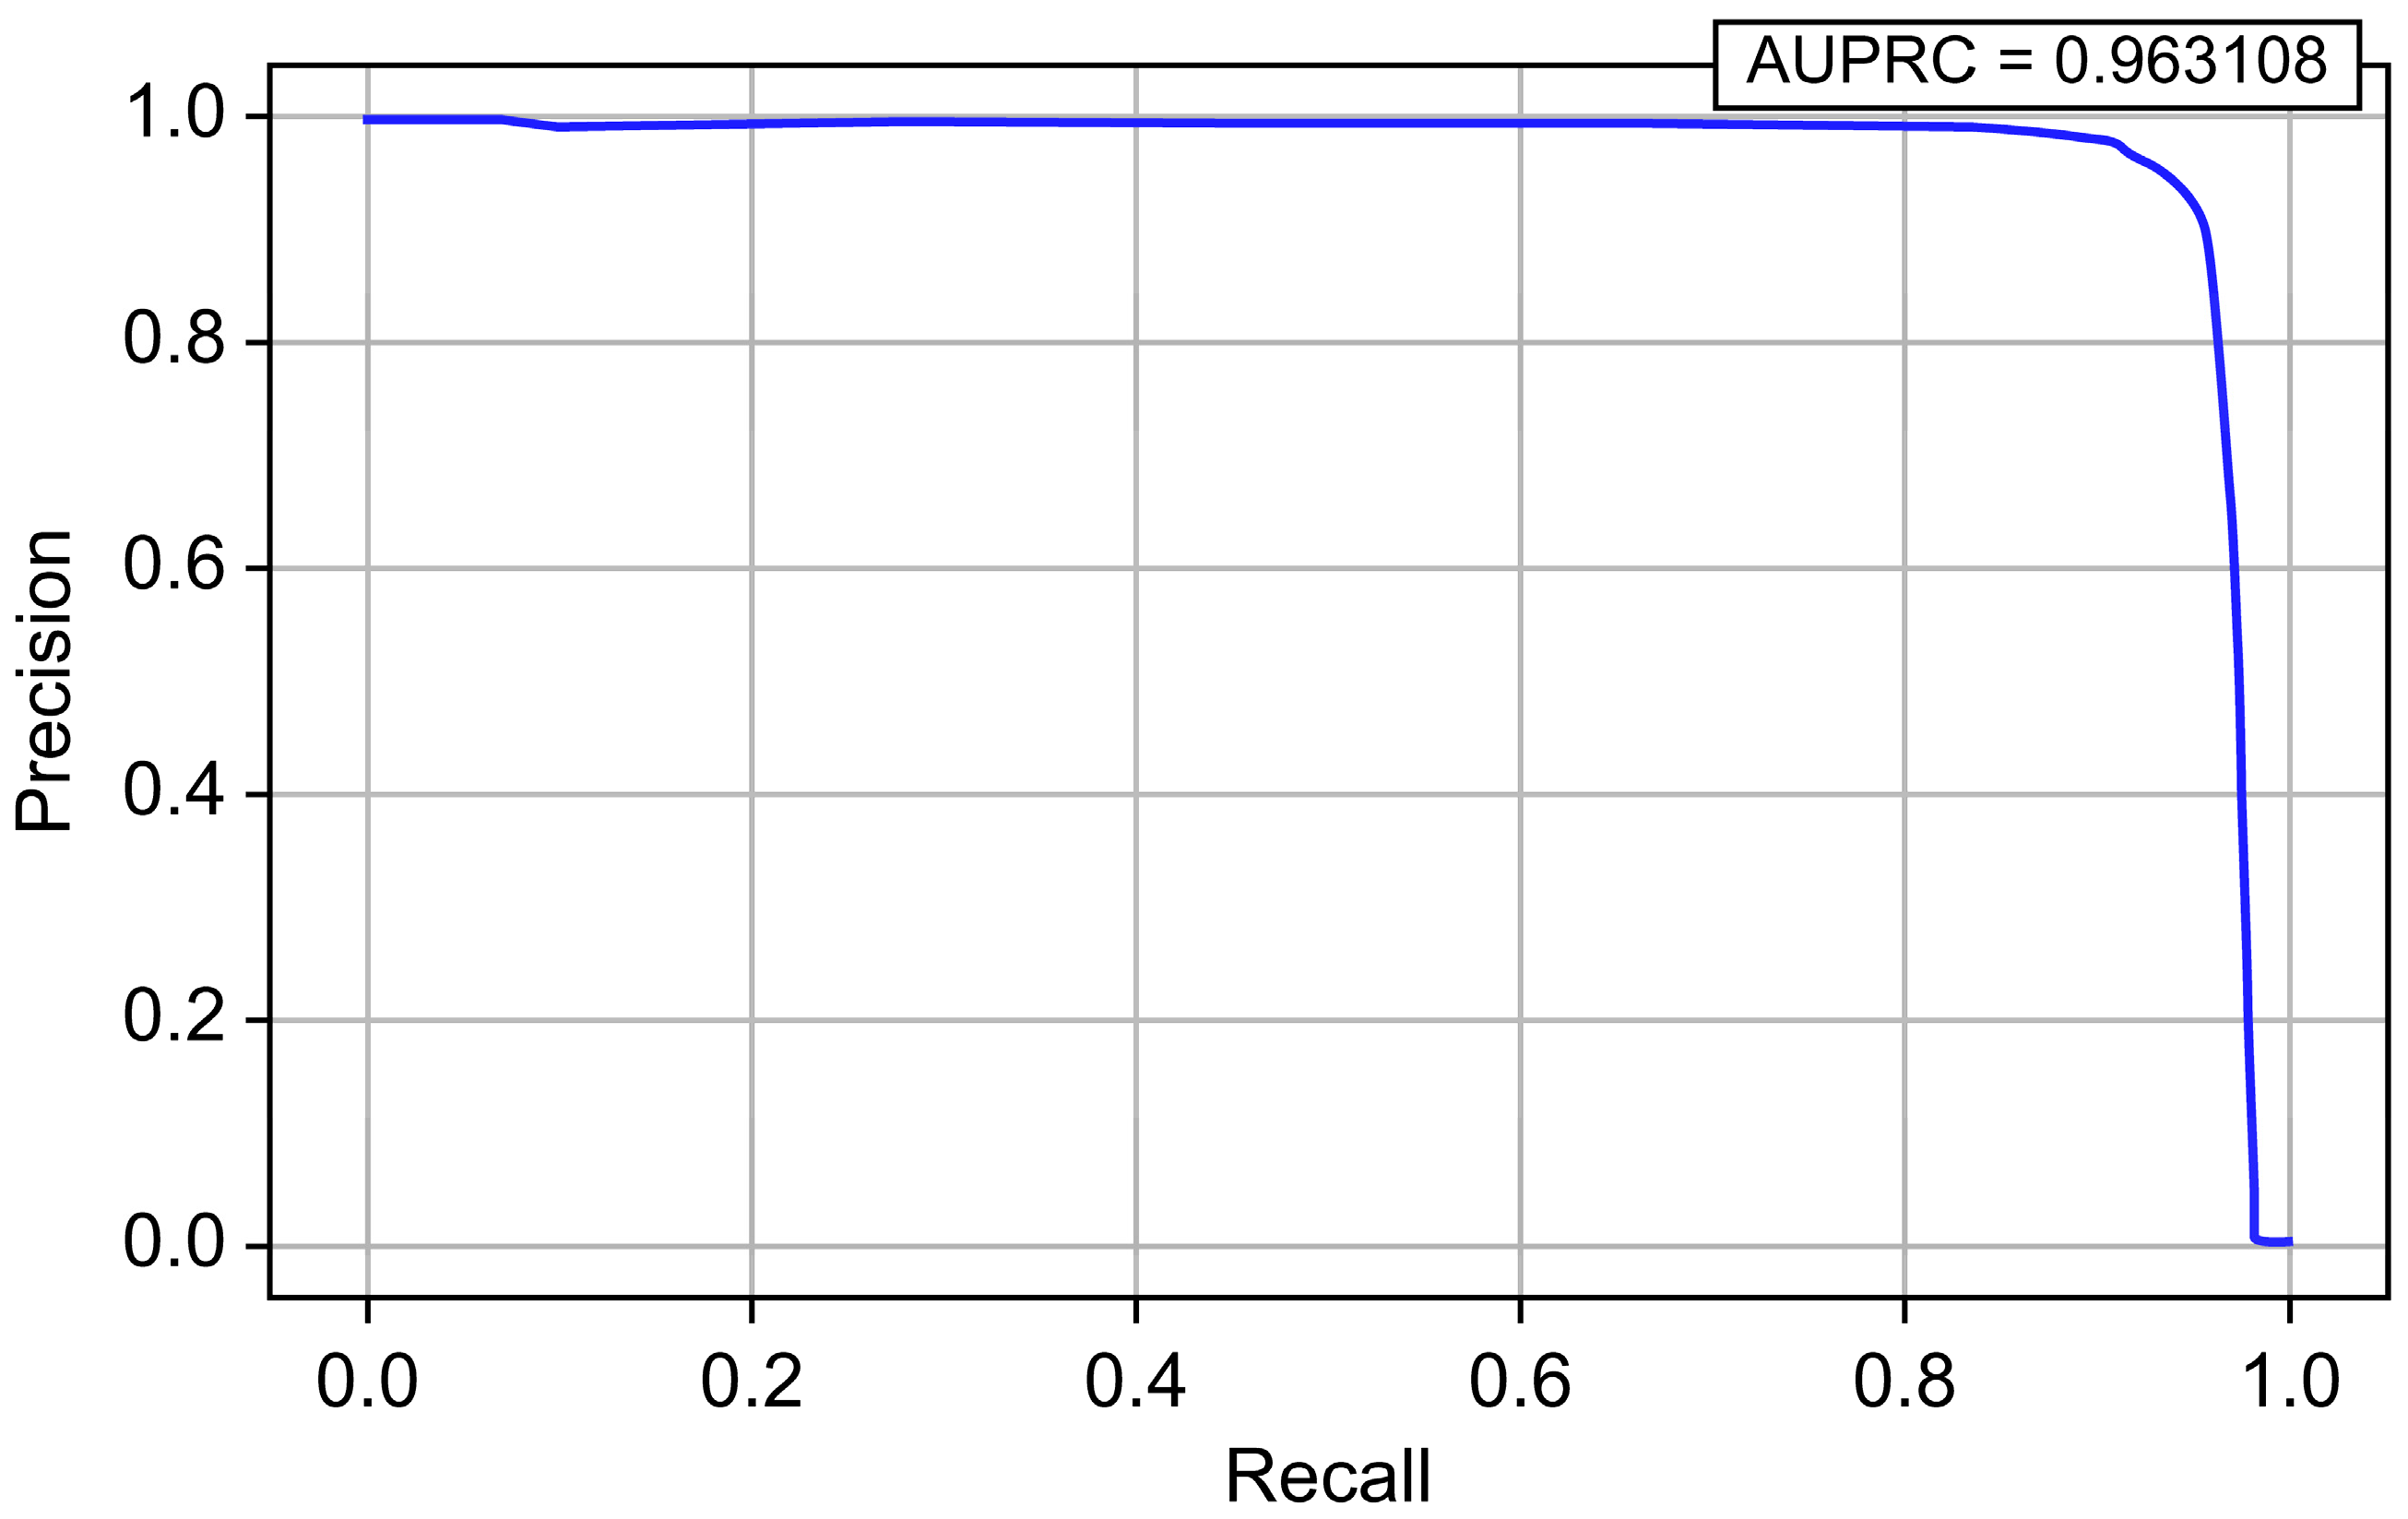
| XGBoost | 0.999992 | 0.919447 | 0.951350 | 0.935127 | 0.999145 | 0.963108 |
| CatBoost | 0.999995 | 0.929774 | 0.987480 | 0.957759 | 0.999988 | 0.977388 |
| Accuracy | Precision | Recall | F1-Score | |
|---|---|---|---|---|
| LightGBM + Threshold 1 | 0.999996 | 0.964526 | 0.972635 | 0.968564 |
| LightGBM + Threshold 2 | 0.999958 | 0.966507 | 0.974277 | 0.970376 |
| LightGBM + Threshold 3 | 0.999959 | 0.969151 | 0.972267 | 0.970706 |
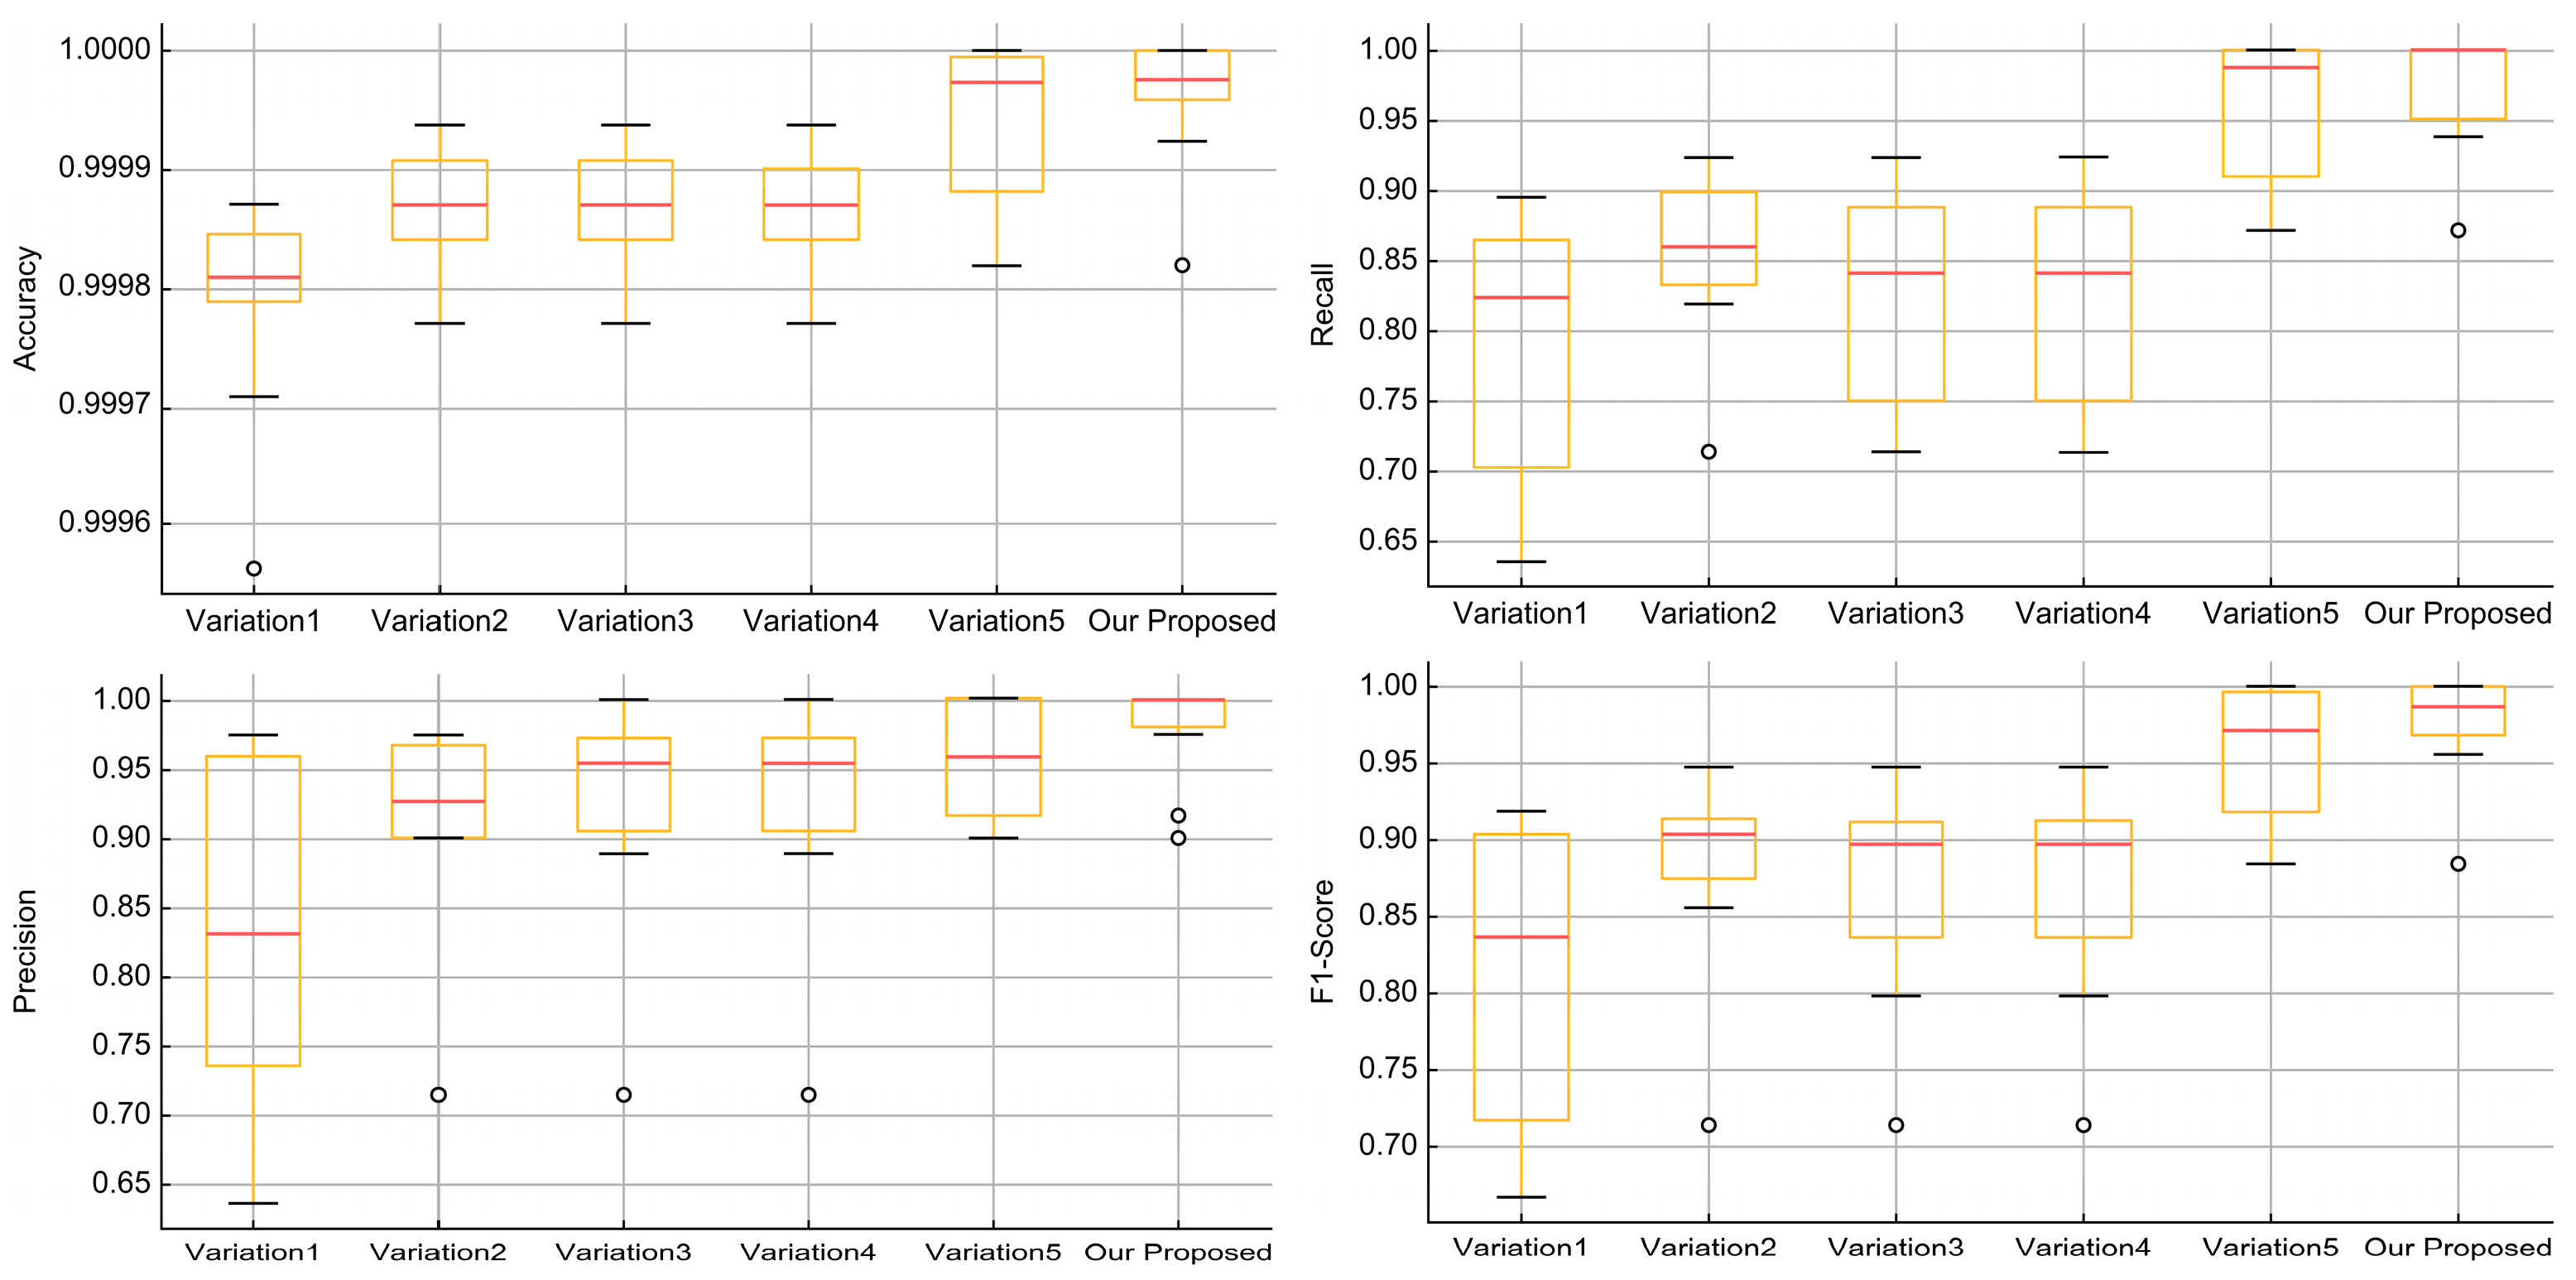
| Feature Sets | |
|---|---|
| Variation1 | App information, App permissions, App service |
| Variation2 | App information, App permissions, App service, User activity |
| Variation3 | App information, App permissions, App service, User information |
| Variation4 | App information, App permissions, App service, App package name statistics |
| Variation5 | App information, App permissions, App service, User activity, App package name statistics |
| Our Proposed | App information, App permissions, App service, User activity, User information, App package name statistics |
| Accuracy | ||||||
|---|---|---|---|---|---|---|
| Min | Max | Mean | Median | 25% | 75% | |
| Variation1 | 0.999551 | 0.999976 | 0.999813 | 0.999817 | 0.999763 | 0.999875 |
| Variation2 | 0.999646 | 0.999978 | 0.999901 | 0.999914 | 0.999875 | 0.999938 |
| Variation3 | 0.999526 | 1.000000 | 0.999848 | 0.999869 | 0.999795 | 0.999905 |
| Variation4 | 0.999615 | 1.000000 | 0.999873 | 0.999883 | 0.999841 | 0.999927 |
| Variation5 | 0.999773 | 1.000000 | 0.999934 | 0.999948 | 0.999902 | 0.999975 |
| Our Proposed | 0.999819 | 1.000000 | 0.999961 | 0.999972 | 0.999930 | 1.000000 |
| Recall | ||||||
| Min | Max | Mean | Median | 25% | 75% | |
| Variation1 | 0.500000 | 1.000000 | 0.829375 | 0.847826 | 0.782269 | 0.888889 |
| Variation2 | 0.500000 | 1.000000 | 0.879349 | 0.900980 | 0.833333 | 0.953611 |
| Variation3 | 0.500000 | 1.000000 | 0.838819 | 0.848913 | 0.780382 | 0.905844 |
| Variation4 | 0.500000 | 1.000000 | 0.846844 | 0.857143 | 0.797368 | 0.911275 |
| Variation5 | 0.714286 | 1.000000 | 0.966149 | 0.973684 | 0.945571 | 1.000000 |
| Our Proposed | 0.714286 | 1.000000 | 0.976437 | 1.000000 | 0.970129 | 1.000000 |
| Precision | ||||||
| Min | Max | Mean | Median | 25% | 75% | |
| Variation1 | 0.333333 | 0.975000 | 0.819563 | 0.851648 | 0.750000 | 0.921559 |
| Variation2 | 0.500000 | 1.000000 | 0.916453 | 0.950000 | 0.897222 | 0.968750 |
| Variation3 | 0.400000 | 1.000000 | 0.882924 | 0.907670 | 0.857143 | 0.963294 |
| Variation4 | 0.500000 | 1.000000 | 0.910078 | 0.948684 | 0.888889 | 0.972410 |
| Variation5 | 0.625000 | 1.000000 | 0.932044 | 0.942017 | 0.901829 | 0.974519 |
| Our Proposed | 0.714286 | 1.000000 | 0.961714 | 0.974359 | 0.944444 | 1.000000 |
| F1-Score | ||||||
| Min | Max | Mean | Median | 25% | 75% | |
| Variation1 | 0.400000 | 0.986667 | 0.821788 | 0.852459 | 0.747685 | 0.895522 |
| Variation2 | 0.500000 | 0.987013 | 0.895133 | 0.923077 | 0.857143 | 0.953416 |
| Variation3 | 0.444444 | 1.000000 | 0.857345 | 0.878356 | 0.819141 | 0.918254 |
| Variation4 | 0.500000 | 1.000000 | 0.875704 | 0.895522 | 0.841667 | 0.938776 |
| Variation5 | 0.714286 | 1.000000 | 0.947998 | 0.957746 | 0.932323 | 0.982456 |
| Our Proposed | 0.714286 | 1.000000 | 0.968545 | 0.978251 | 0.956522 | 1.000000 |
| Category | Proposed Work | Existing Work | Comparison |
|---|---|---|---|
| Datasets | Real-world dataset from Bank A (South Korea) with 183,938,730 benign transactions and 11,986 malware transactions; highly imbalanced | Most existing works (e.g., DroidDetector [54]) used smaller, lab-controlled datasets, often from third-party app stores or Google Play | The real-world, large-scale dataset offers better generalizability compared to smaller, simulated datasets used in existing work. |
| Detection Methodology | Static analysis (feature extraction) for both known and unknown malware. | Existing methods like DroidDetector [54] and Zhou et al. [59] rely primarily on dynamic analysis, with high computational overheads (e.g., TaintDroid [12]) | Static analysis in the proposed work is more scalable and resource-efficient for large operational environments. |
| Machine Learning Models | Tested models: Logistic Regression, Random Forest, LightGBM, XGBoost, CatBoost. LightGBM showed the best performance. | Random Forest and SVM are commonly used but struggle with large, imbalanced datasets; some use deep learning, which is computationally expensive | LightGBM is faster, scalable, and better at handling imbalanced data compared to traditional models like SVM and Random Forest. |
| Performance Metrics | Achieved 99.99% accuracy, 96.86% precision, 97.04% F1-score, AUROC of 0.999559, and AUPRC of 0.987537 | DroidDetector [54] had 96.76% accuracy and 92.85% F1-score; other models struggled with imbalanced datasets | The proposed model shows significant improvements in F1-score and AUPRC, effectively handling imbalanced data with fewer false positives. |
| Real-World Application | Designed for real-time deployment in financial institutions; uses a lightweight model (LightGBM) to handle large-scale data | Existing models such as TaintDroid [12] and DroidDetector [54] are not scalable or practical for real-time large-scale environments | The proposed framework is more scalable and applicable to real-world financial institutions compared to existing methods. |
Disclaimer/Publisher’s Note: The statements, opinions and data contained in all publications are solely those of the individual author(s) and contributor(s) and not of MDPI and/or the editor(s). MDPI and/or the editor(s) disclaim responsibility for any injury to people or property resulting from any ideas, methods, instructions or products referred to in the content. |
© 2025 by the authors. Licensee MDPI, Basel, Switzerland. This article is an open access article distributed under the terms and conditions of the Creative Commons Attribution (CC BY) license (https://creativecommons.org/licenses/by/4.0/).
Share and Cite
Shin, J.; Kim, D.; Lee, K. Advanced Financial Fraud Malware Detection Method in the Android Environment. Appl. Sci. 2025, 15, 3905. https://doi.org/10.3390/app15073905
Shin J, Kim D, Lee K. Advanced Financial Fraud Malware Detection Method in the Android Environment. Applied Sciences. 2025; 15(7):3905. https://doi.org/10.3390/app15073905
Chicago/Turabian StyleShin, Jaeho, Daehyun Kim, and Kyungho Lee. 2025. "Advanced Financial Fraud Malware Detection Method in the Android Environment" Applied Sciences 15, no. 7: 3905. https://doi.org/10.3390/app15073905
APA StyleShin, J., Kim, D., & Lee, K. (2025). Advanced Financial Fraud Malware Detection Method in the Android Environment. Applied Sciences, 15(7), 3905. https://doi.org/10.3390/app15073905