
A Quantitative-Qualitative Classification for Igneous Building Stones Based on Brazilian Tensile Strength: Application to the Stone Durability


Abstract
1. Introduction

| Source | Stone Type | Deterioration Process Type | BTS Changes | |||
|---|---|---|---|---|---|---|
| FT | SC | HC | WD | |||
| Fener and İnce [1] | Andesitic | × | Decreasing | |||
| Altindag et al. [5] | Ignimbrite | × | Decreasing | |||
| Torabi-Kaveh et al. [7] | Limestone | × | × | × | Decreasing | |
| Singh et al. [20] | Sandstone | × | Decreasing | |||
| Sharma et al. [21] | Limestone | × | Decreasing | |||
| Yavuz and Topal [22] | Marble | × | × | Decreasing | ||
| Jamshidi et al. [23] | Different stone types | × | Decreasing | |||
| Ghobadi and Torabi-Kaveh [24] | Limestone | × | Decreasing | |||
| Momeni et al. [25] | Granite | × | × | × | Decreasing | |
| Ghobadi et al. [11] | Tuff | × | Decreasing | |||
| Heidari et al. [16] | Limestone | × | × | Decreasing | ||
| Fereidooni and Khajevand [26] | Sedimentary stone types | × | Decreasing | |||
| Pu et al. [27] | Sandstone | × | Decreasing | |||
| Zalooli et al. [28] | Travertine | × | Decreasing | |||
| Quan et al. [29] | Sandstone | Decreasing | ||||
| Seyed Mousavi and Rezaei [30] | Schist | × | Decreasing | |||
| Jamshidi [31] | Limestone | × | × | × | × | Decreasing |
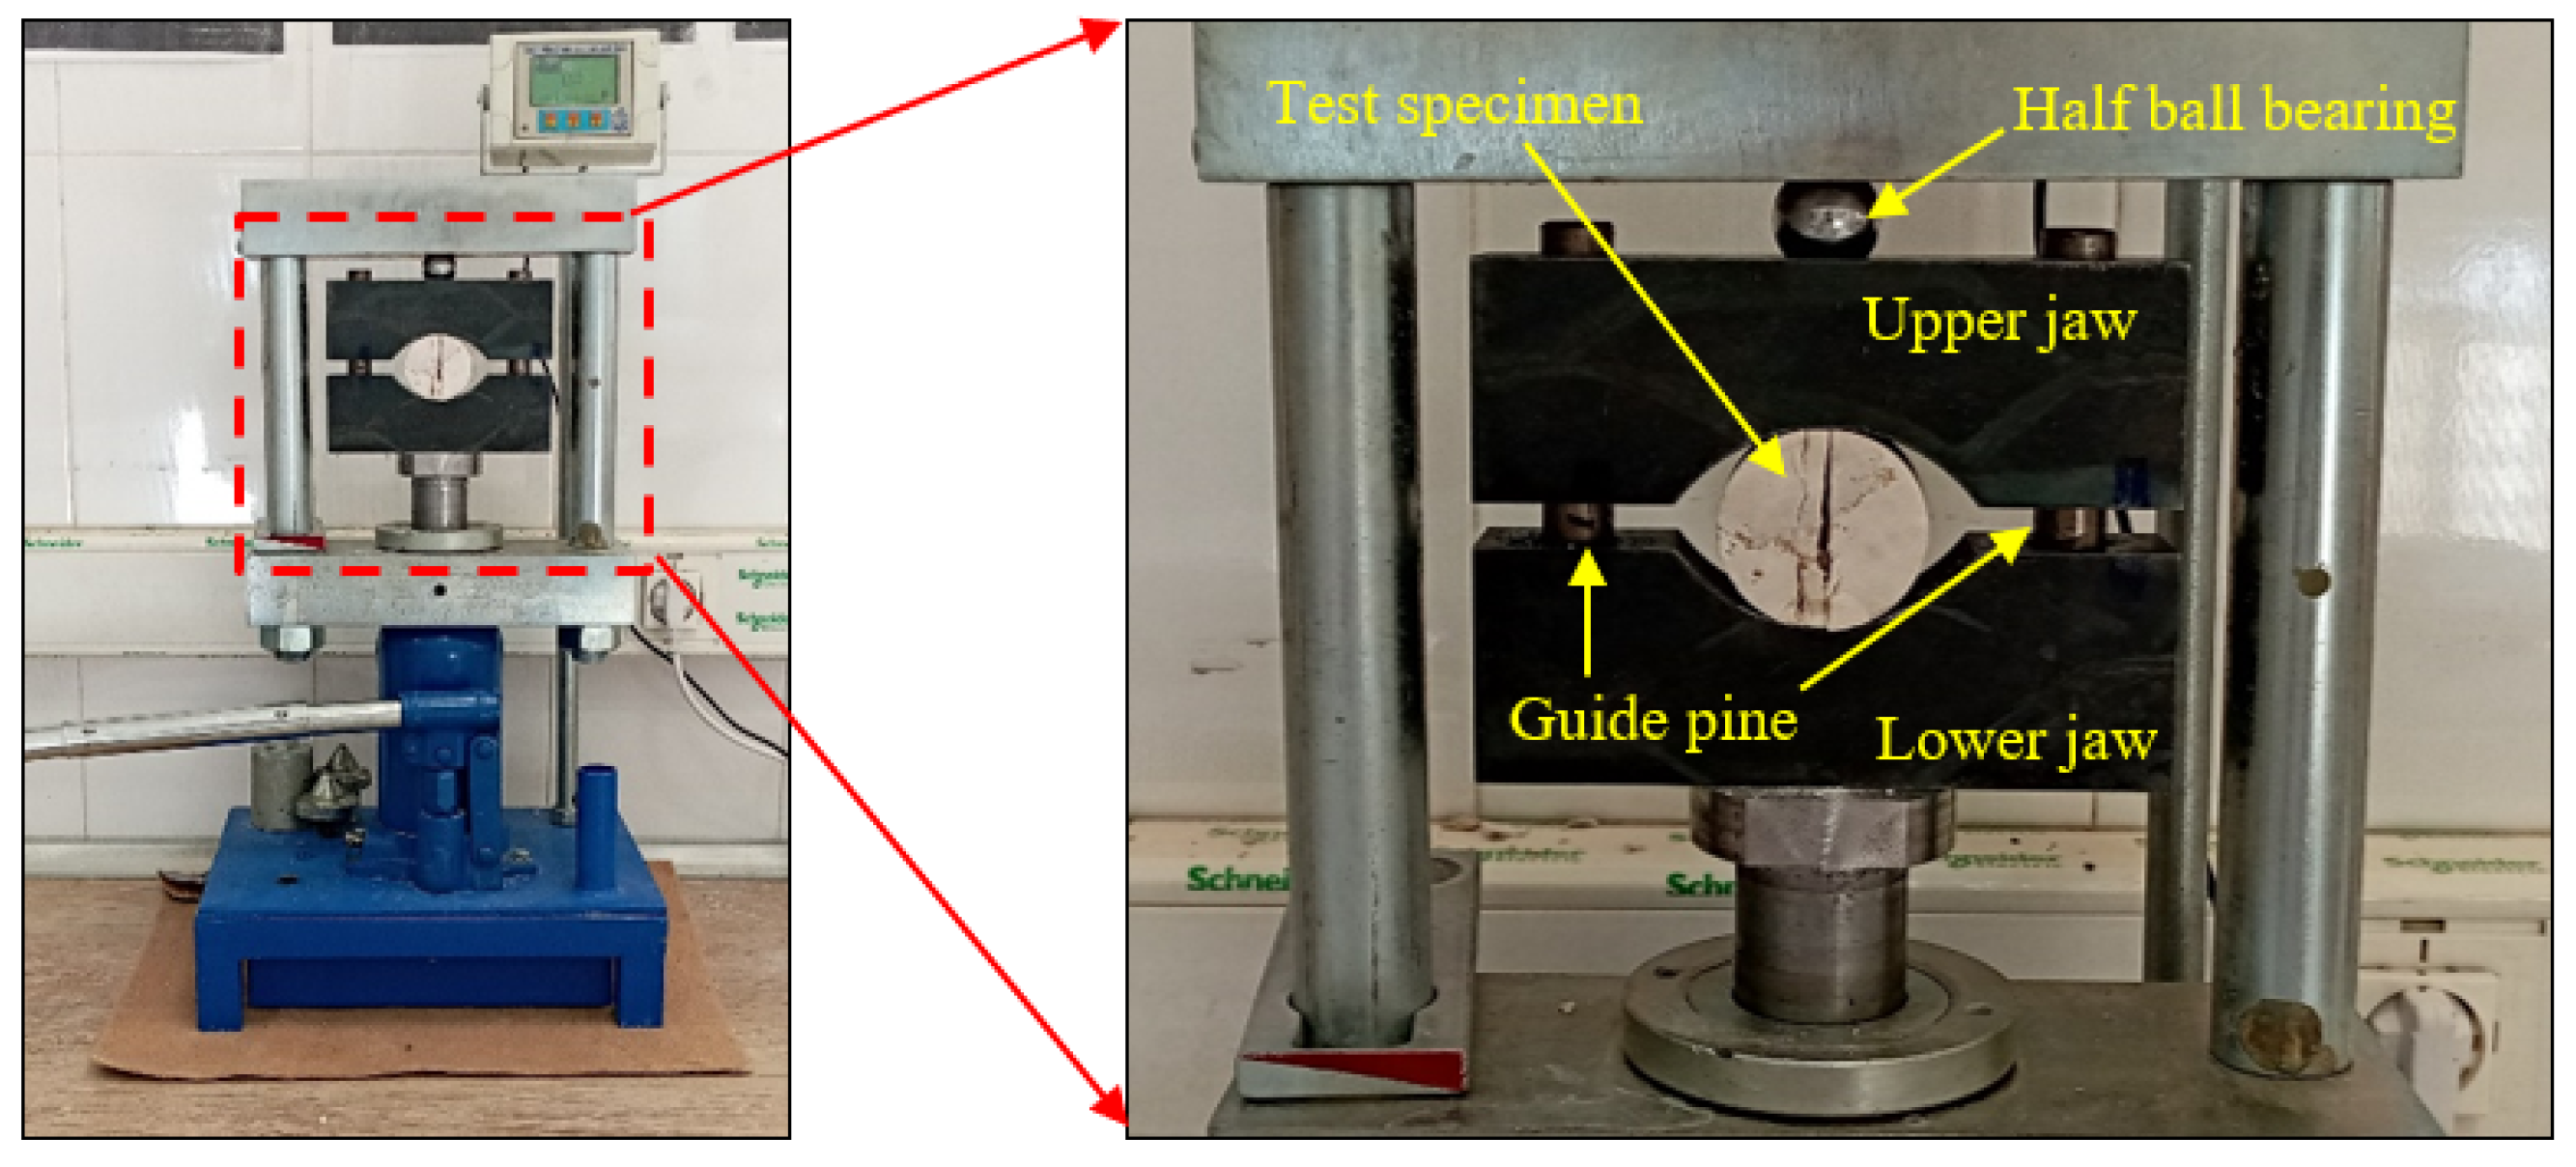
2. Brazilian Tensile Strength
3. Materials and Methods
| Source | Stone Type | No of Data | UCS Range (MPa) | BTS Range (MPa) |
|---|---|---|---|---|
| Fener and İnce [1] | Andesite | 6 | 44.3–60.3 | 4.0–5.05 |
| Ghobadi et al. [11] | Tuff | 48 | 55.0–245.0 | 3.7–25.7 |
| Zalooli et al. [28] | Granodiorite, Monzogranite | 2 | 124.3, 145.8 | 11.1, 13.0 |
| Momeni et al. [13] | Granite | 3 | 90.7–164.0 | 8.7–14.7 |
| Jamshidi [19] | Granite, Granodiorite, Monzogranite, Syenogranite | 16 | 68.0–123.0 | 5.3–13.3 |
| Schmidt [37] | Anorthosite, Basalt, Gabbro, Granite | 10 | 89.6–374.7 | 8.7–28.3 |
| Bilgin [38] | Granite | 1 | 179.1 | 10.8 |
| Clark [39] | Anorthosite, Basalt, Gabbro, Granite | 10 | 123.2–296.8 | 7.3–15.4 |
| Howarth [40] | Basalt, Granite, Syenite, Trachyte | 4 | 137.1–234.0 | 8.0–15.2 |
| Bilgin and Shahriar [41] | Andesite, Tuff | 7 | 27.9–53.0 | 2.3–6.2 |
| Bilgin et al. [42] | Tuff | 1 | 43.4 | 4.0 |
| Gupta and Rao [43] | Granite | 8 | 2.5–132.8 | 0.88–16.1 |
| Bearman [44] | Andesite, Diorite, Granite | 4 | 128.8–274.8 | 10.6–18.4 |
| Kahraman [45] | Diabase, Tuff | 2 | 10.1, 110.9 | 0.90, 10.1 |
| Tugrul and Zarif [46] | Granite | 19 | 109.2–193.3 | 14.9–28.0 |
| Ersoy et al. [47] | Andesite, Dacite, Gabbro, Granite, Syenite, Tuff | 10 | 6.4–168.0 | 0.50–8.7 |
| Ersoy and Atici [48] | Andesite, Dacite, Tuff | 4 | 6.4–65.3 | 0.50–4.8 |
| Dwivedi et al. [49] | Granite | 5 | 112.8-133.7 | 8.9–10.9 |
| Atici and Ersoy [50] | Andesite, Dacite, Diorite, Gabbro, Granite, Syenite, Tuff | 12 | 6.0–375.0 | 0.50–30.3 |
| Erguler and Ulusay [51] | Tuff | 6 | 1.3–12.9 | 0.00–1.80 |
| Yagiz [52] | Andesite, Basalt, Diabase, Gabbro, Granite, Granitoid, Syenite | 17 | 47.0–327.0 | 4.2–17.8 |
| Yilmaz et al. [53] | Granite | 3 | 11.8–131.4 | 10.4–11.4 |
| Karaca et al. [54] | Granite | 2 | 111.8–131.4 | 10.4–11.4 |
| Fener [55] | Andesite, Basalt, Granite, Ignimbrite, Tuff | 6 | 3.9–121.8 | 1.3–9.5 |
| Yarali and Kahraman [56] | Andesite, Basalt, Diabase, Granite, Granodiorite, Syenite | 18 | 28.6–182.1 | 2.6–16.5 |
| Ghobadi and Rasouli [57] | Granite, Granodiorite, Monzogranite, Tonalite | 21 | 18.6–123.0 | 3.0–14.6 |
| Kahraman et al. [58] | Andesite, Basalt, Gabbro, Granite, Granodiorite | 13 | 77.5–202.9 | 7.6–14.8 |
| Khanlari et al. [59] | Granodiorite, Monzogranite | 10 | 12.4–135.7 | 0.46–11.4 |
| Yavuz [60] | Tuff | 2 | 6.9, 14.9 | 0.43, 1.4 |
| Basu et al. [61] | Granite | 20 | 91.5–201.7 | 10.5–19.8 |
| Heidari et al. [62] | Granite, Granodiorite | 10 | 3.8–150.1 | 0.46–17.6 |
| Karakuş and Akatay [63] | Basalt | 18 | 17.2–145.2 | 1.1–12.2 |
| Khandelwal [64] | Diabase, Granite | 2 | 89.5, 121.5 | 6.9, 9.0 |
| Mikaeil et al. [65] | Granite | 10 | 125.0–218.0 | 7.4–24.6 |
| Heidari et al. [66] | Granite, Tuff | 2 | 122.0–124.3 | 9.96–11.2 |
| Majeed et al. [67] | Diabase | 17 | 154.6–258.5 | 15.5–22.2 |
| Sajid and Arif [68] | Granite | 21 | 17.3–63.3 | 1.2–6.4 |
| İnce and Fener [69] | Tuff | 10 | 7.6–48.6 | 1.1–4.8 |
| Ribeiro et al. [70] | Andesite, Diabase, Granite, Granodiorite, Monzogranite | 8 | 103.7–223.0 | 8.9–18.8 |
| Ronmar [71] | Basalt, Tuff | 2 | 212.0, 87.6 | 14.2, 8.3 |
| Akinbinu [72] | Anorthosite, Granite, Norite, Troctolite | 12 | 129.6–276.3 | 9.2–16.9 |
| Almasi et al. [73] | Andesite, Diorite, Gabbro, Granite, Syenite | 11 | 91.0–193.0 | 6.3–15.0 |
| Altindag and Guney [74] | Andesite, Anorthosite, Basalt, Dacite, Diabase, Diorite, Gabbro, Granite, Tuff | 39 | 5.7–375.2 | 0.20–30.3 |
| Bozdağ and İnce [75] | Andesite, Basalt, Granite, Spilite, Tuff | 23 | 7.6–144.1 | 1.0–11.5 |
| Jaques et al. [76] | Syenogranite | 5 | 1.2–160.6 | 0.19–9.7 |
| Teymen and Mengüç [77] | Andesite, Aplite, Basalt, Dacite, Diabase, Dunite, Gabbro, Granite, Granodiorite, Ignimbrite, Rhyolite, Spilite, Syenite, Trachyte, Tuff | 52 | 6.6–330.7 | 1.1–21.3 |
| Xue et al. [78] | Granite | 7 | 104.0–137.0 | 4.4–6.4 |
| Akbay and Altindag [79] | Andesite, Diabase, Granite | 3 | 102.4–154.0 | 10.0–11.6 |
| Hamzaban et al. [80] | Andesite, Basalt, Granite | 8 | 33.8–80.0 | 2.8–7.5 |
| Wei et al. [81] | Granite | 5 | 88.1–128.7 | 2.4–5.6 |
| Fereidooni [82] | Diorite, Gabbro, Granite, Granitoid, Monzogranite, Monzonite, Syenite, Tonalite | 16 | 69.7–129.5 | 2.3–4.3 |
| Pötzl et al. [83] | Tuff | 21 | 4.0–73.7 | 0.60–6.7 |
| Ajalloeian et al. [84] | Granite, Granodiorite, Monzogranite, Syenogranite | 10 | 67.9–112.3 | 5.2–12.1 |
| Diamantis et al. [85] | Peridotite | 70 | 52.3–241.6 | 9.7–24.9 |
| Kahraman et al. [86] | Andesite, Basalt, Diabase, Granite, Granodiorite, Syenite, Tuff | 27 | 3.6–204.9 | 0.40–13.5 |
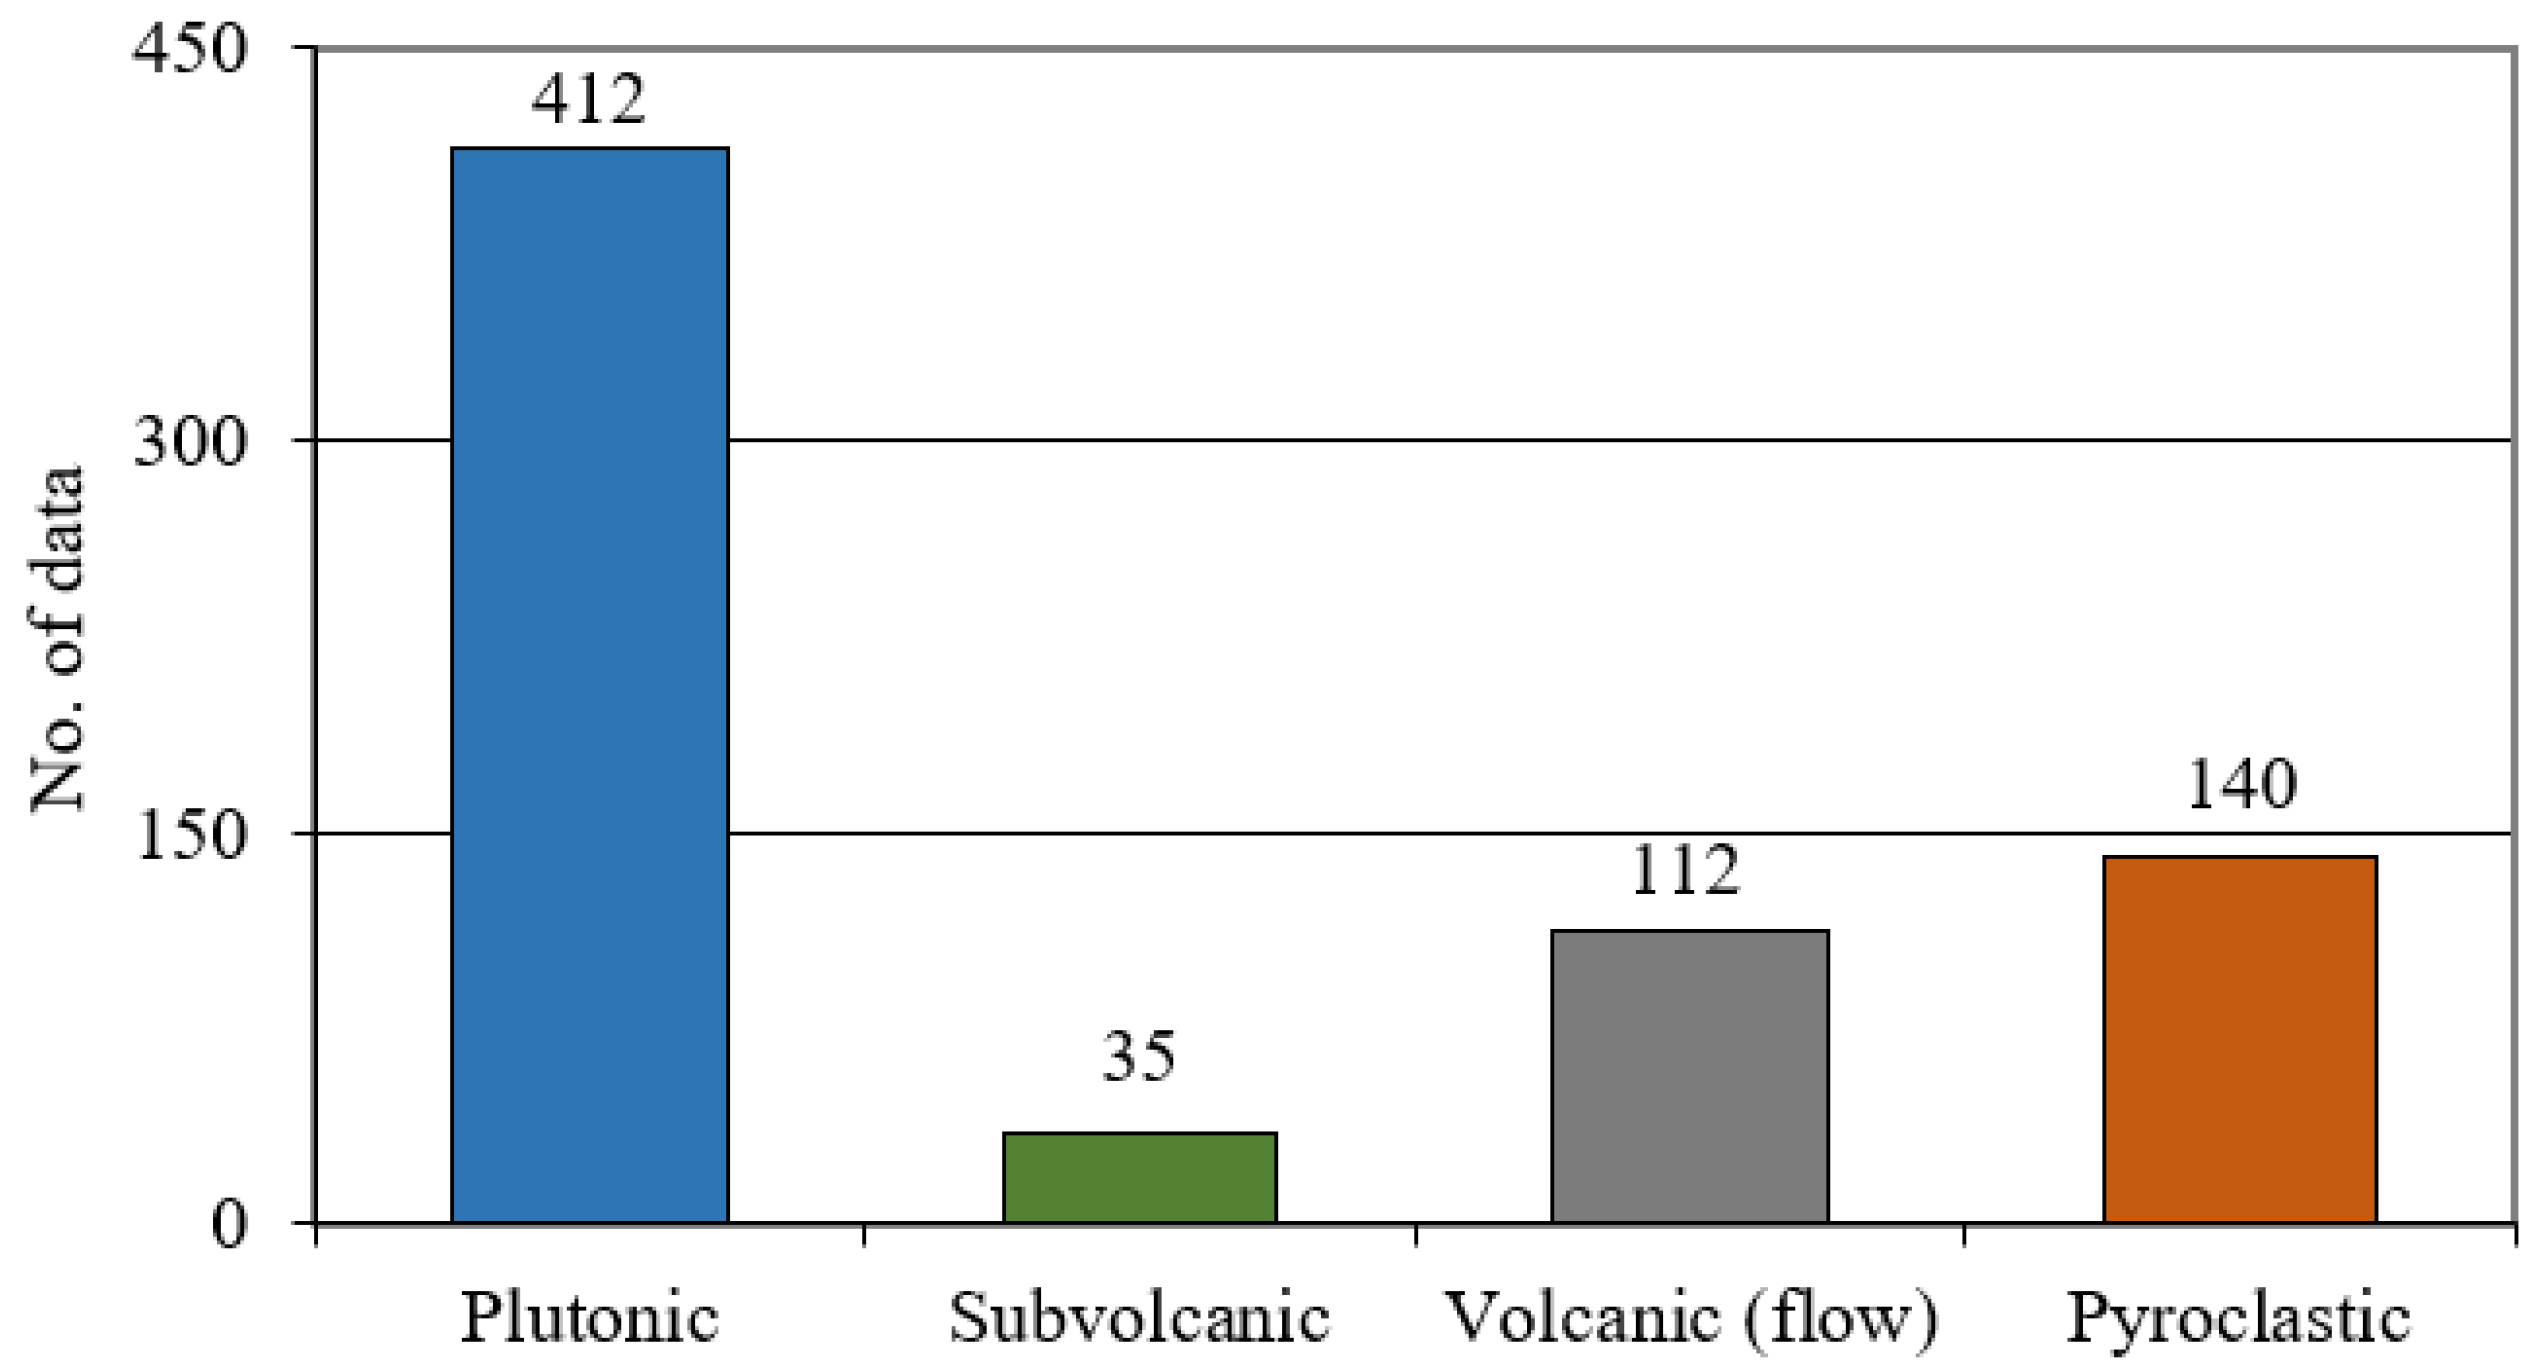
| Stone Class | Stone Subclass | Stone Type |
|---|---|---|
| Igneous | Plutonic | Anorthosite, Aplite, Diorite, Dunite, Gabbro, Granite, Granitoid, Granodiorite, Monzogranite, Monzonite, Norite, Peridotite, Syenite, Syenogranite, Tonalite, Troctolite |
| Subvolcanic | Diabase, Spilite | |
| Volcanic (flow) | Andesite, Basalt, Dacite, Rhyolite, Trachyte | |
| Pyroclastic | Ignimbrite, Tuff |
4. Data Analysis and Results
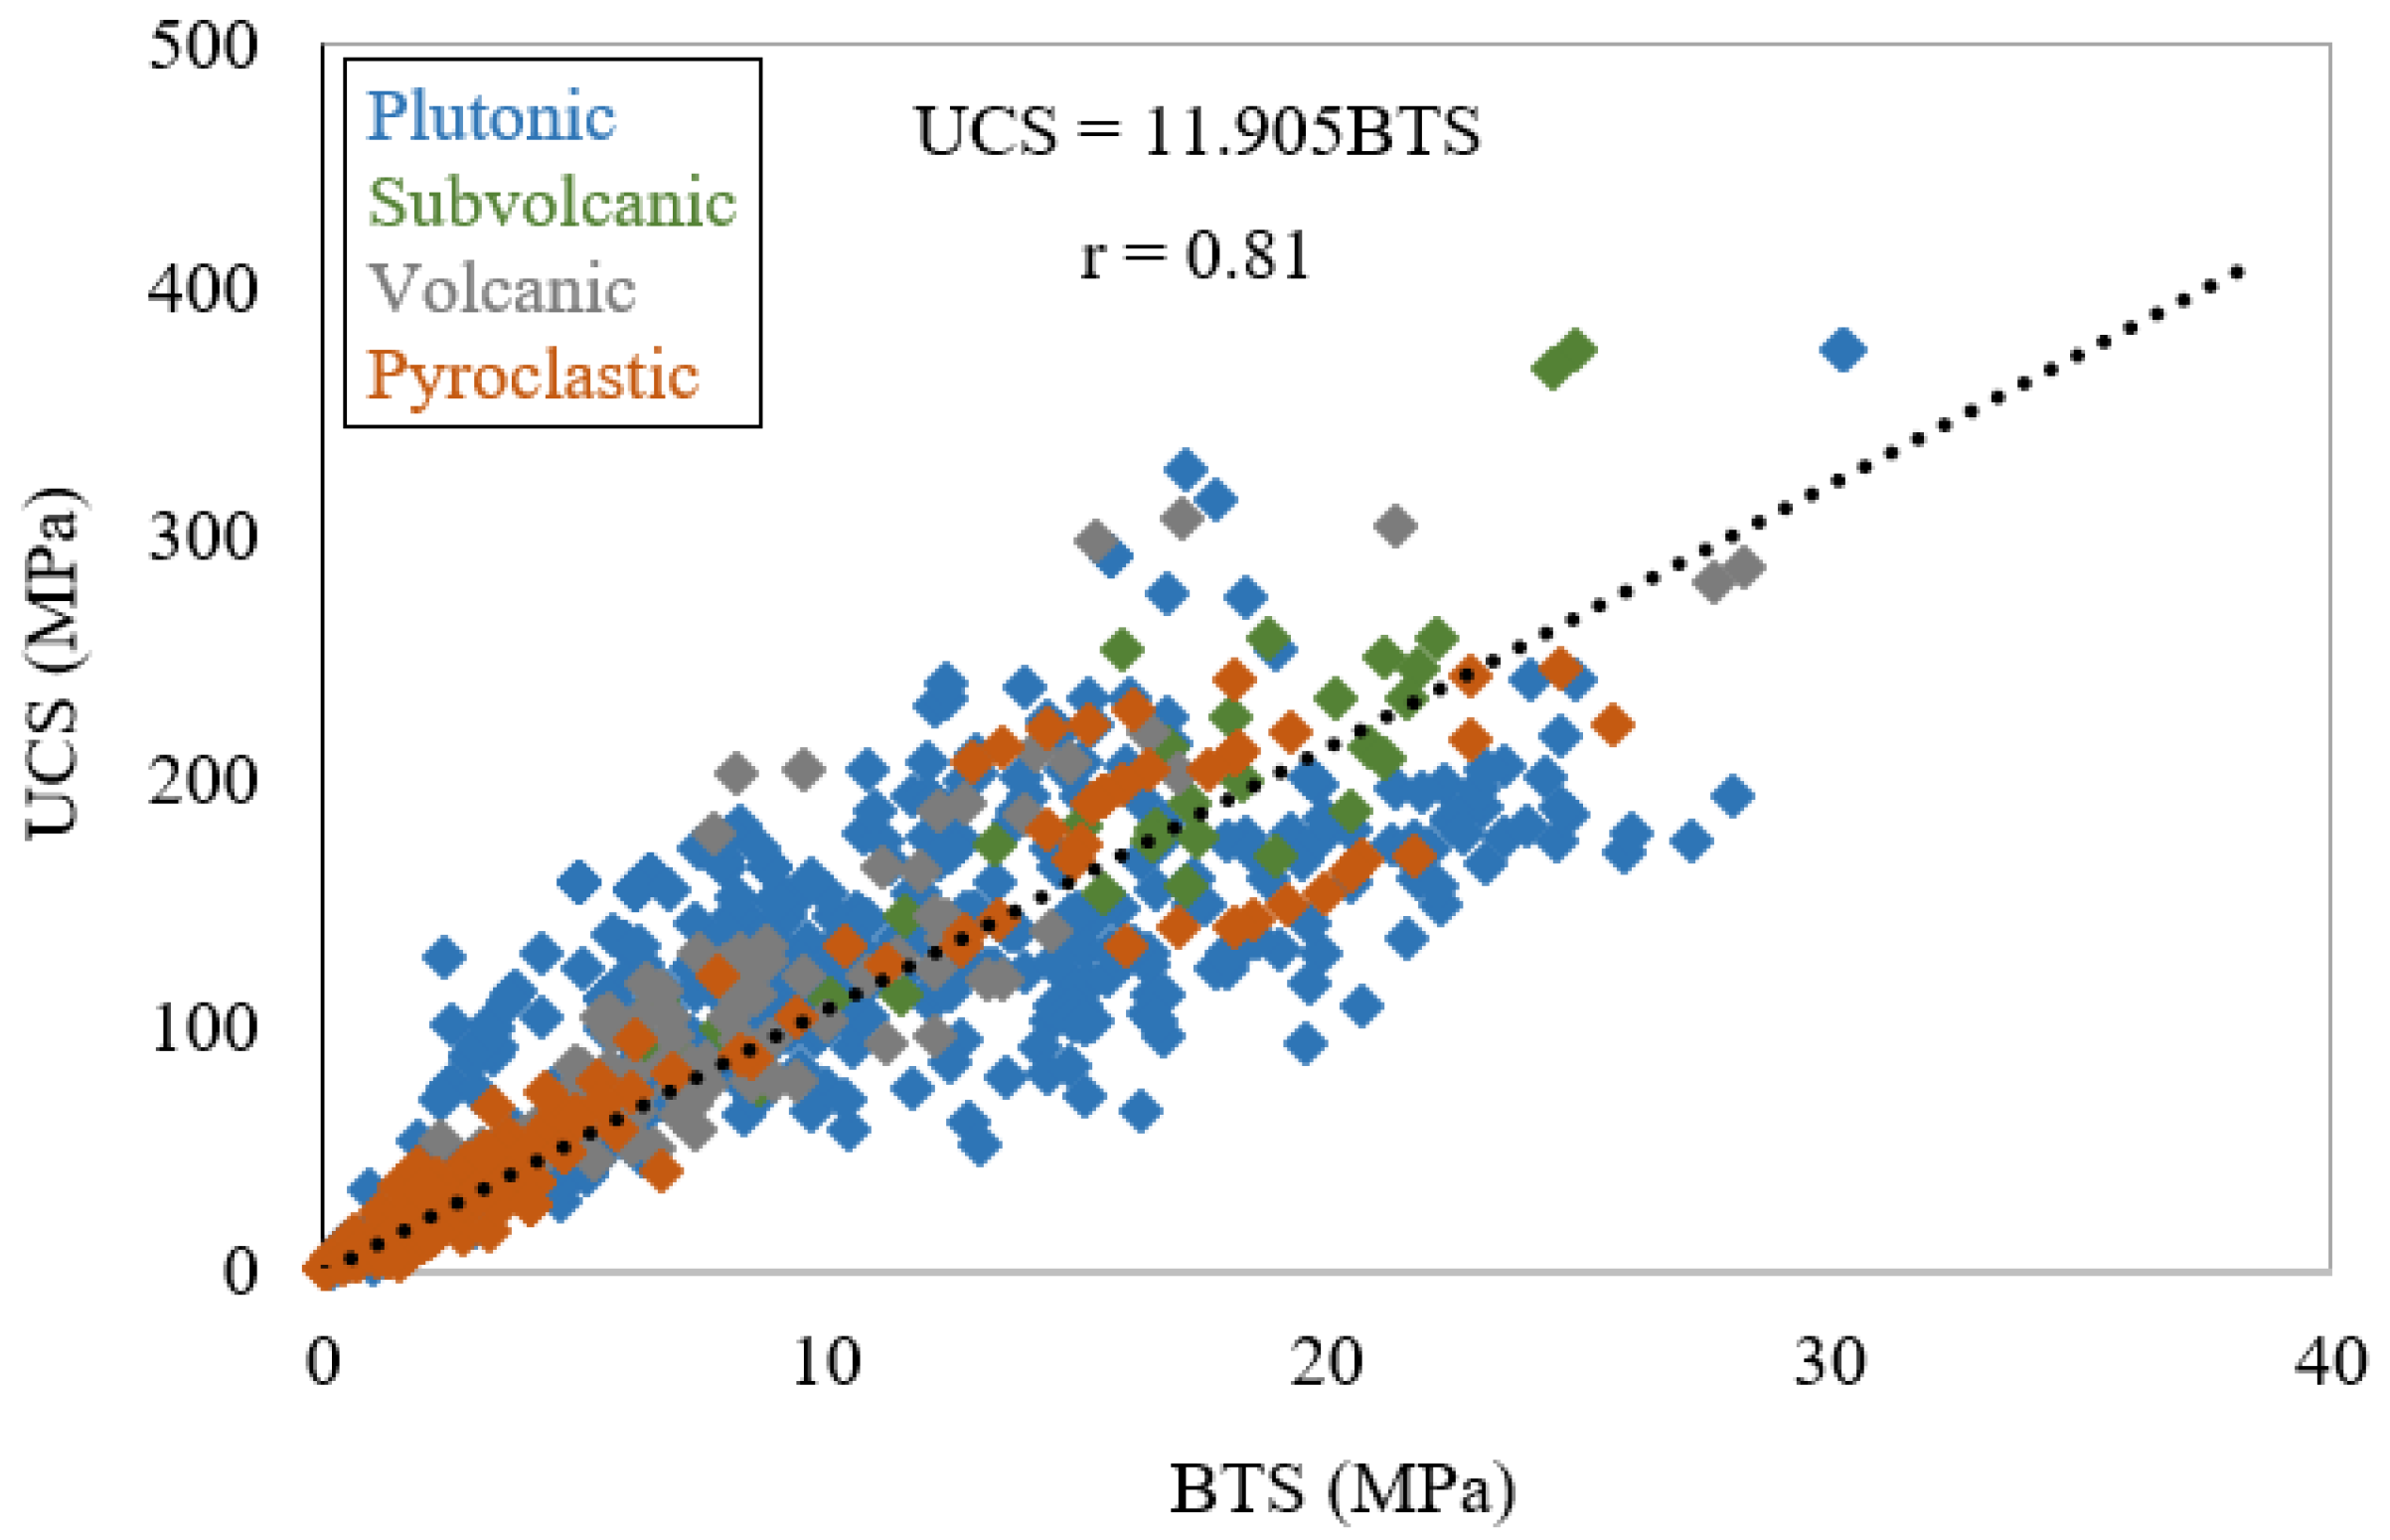
4.1. Correlation Between UCS and BTS
| Reference | Rock Class | Correlation Equation | Correlation Type | r |
|---|---|---|---|---|
| Tugrul and Zarif [46] | Igneous | Linear | 0.96 | |
| Kahraman et al. [58] | Various | Linear | 0.73 | |
| Altindag and Guney [74] | Various | Power | 0.95 | |
| Teymen and Menguc [77] | Various | Power | 0.95 | |
| Gunsallus and Kulhawy [98] | Sedimentary | Linear | 0.87 | |
| Chatterjee and Mukhopadhyay [88] | Sedimentary | Power | 0.97 | |
| Gokceoglu and Zorlu [89] | Sedimentary | Linear | 0.81 | |
| Farah [99] | Sedimentary | Linear | 0.96 | |
| Tahir et al. [90] | Sedimentary | Linear | 0.67 | |
| Nazir et al. [100] | Sedimentary | Power | 0.95 | |
| Yesiloglu-Gultekin et al. [91] | Igneous | Linear | 0.78 | |
| Kallu and Roghanchi [92] | Igneous | Power | 0.89 | |
| Mohamad et al. [93] | Various | Linear | 0.91 | |
| Fereidooni [94] | Metamorphic | Linear | 0.96 | |
| Aliyu et al. [95] | Sedimentary | Linear | 0.79 | |
| Arman [96] | Sedimentary | Linear | 0.73 | |
| Khajevand [97] | Sedimentary | Logarithmic | 0.97 | |
| The present study | Igneous | Linear | 0.81 |
4.2. Development of BTS Classification
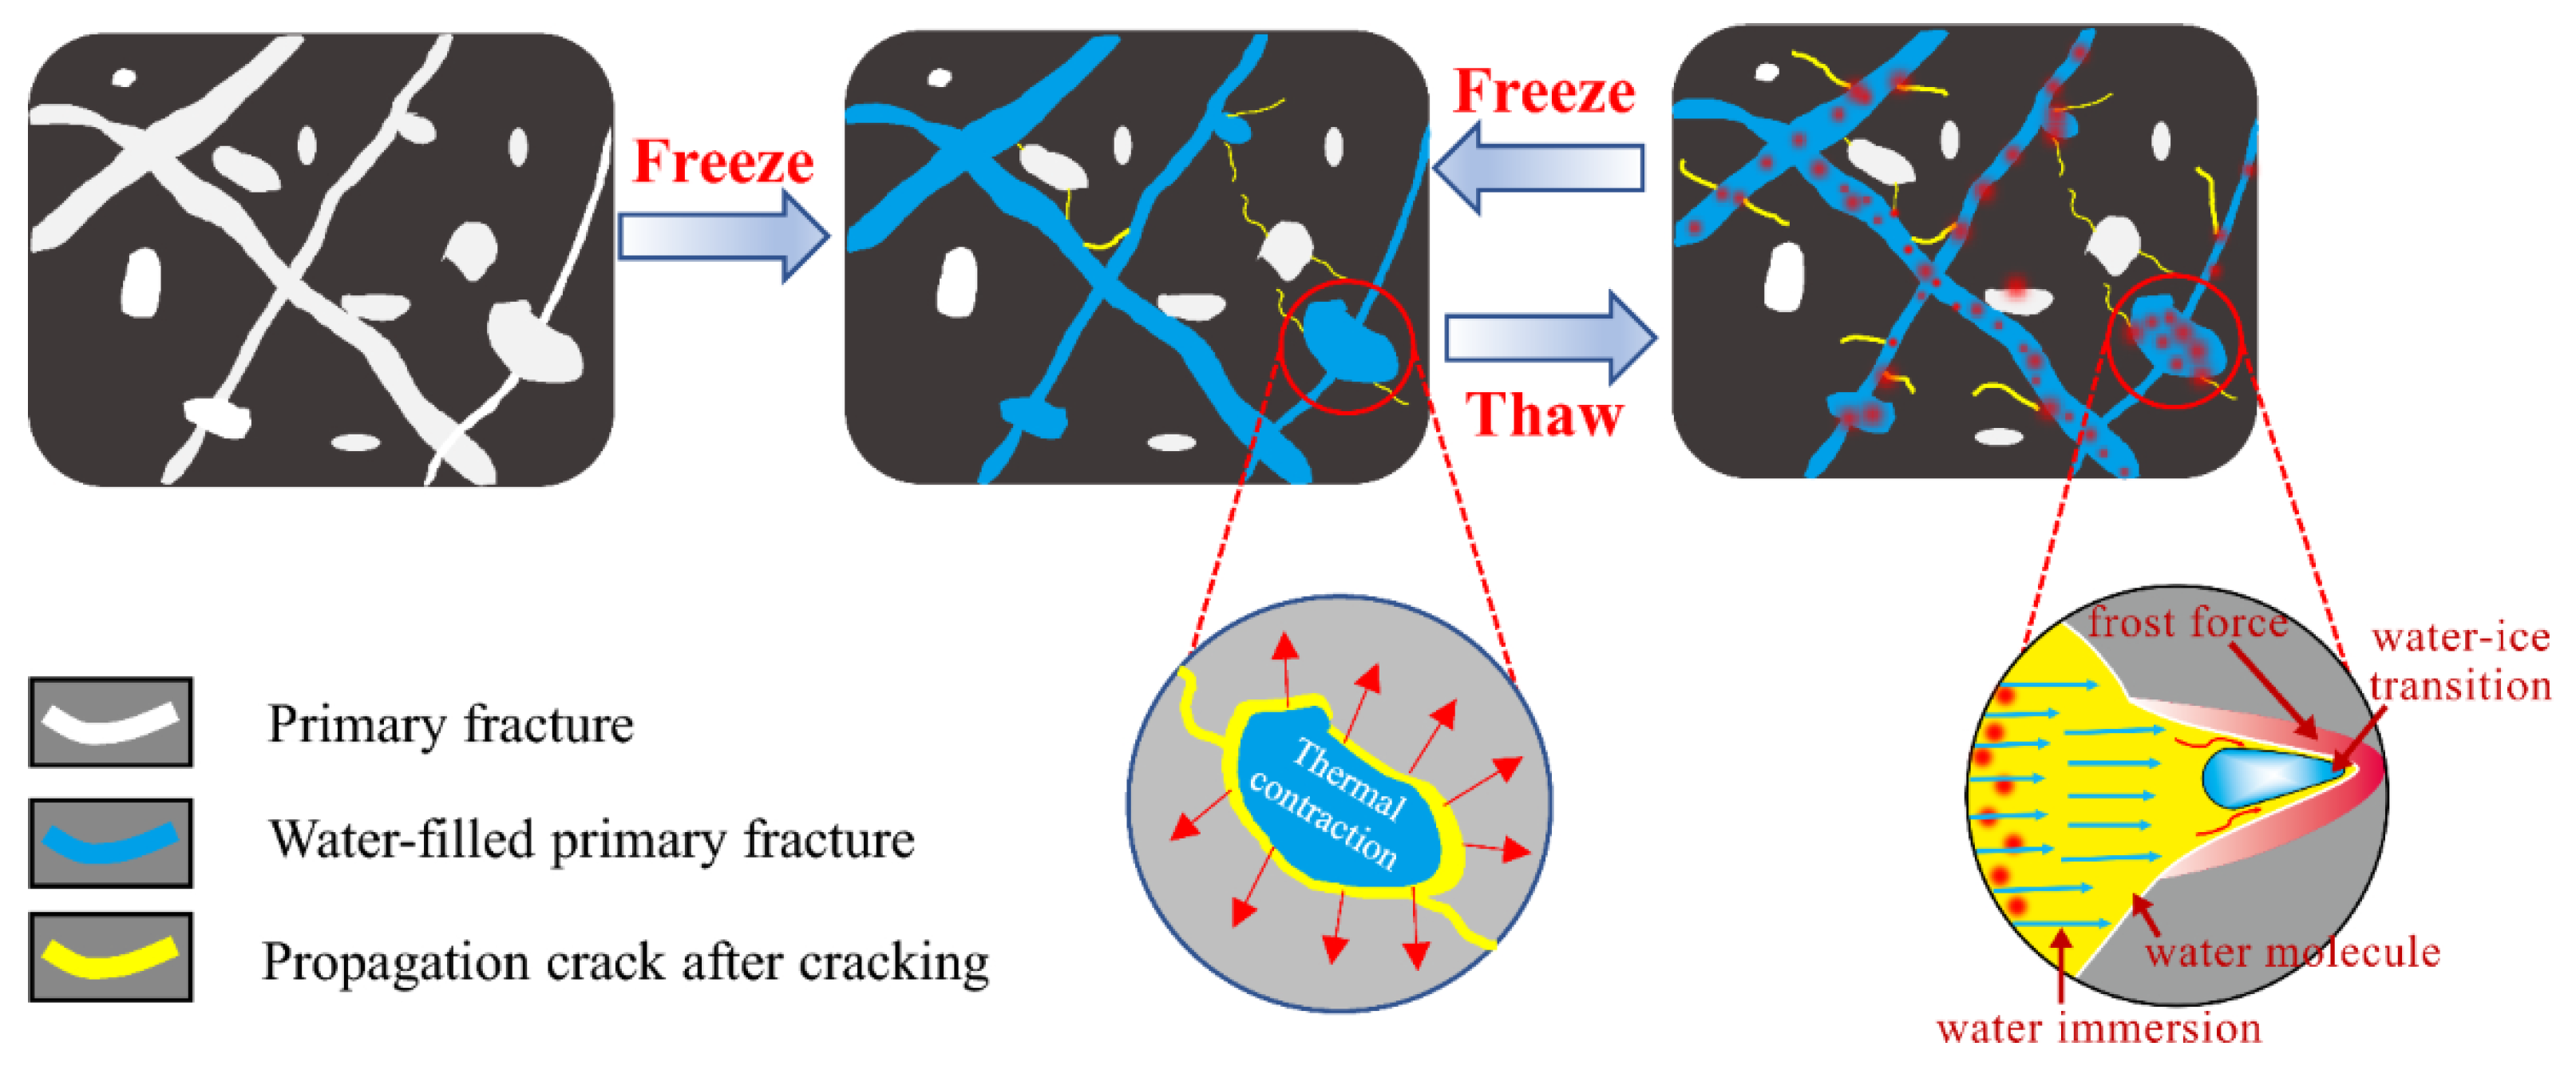
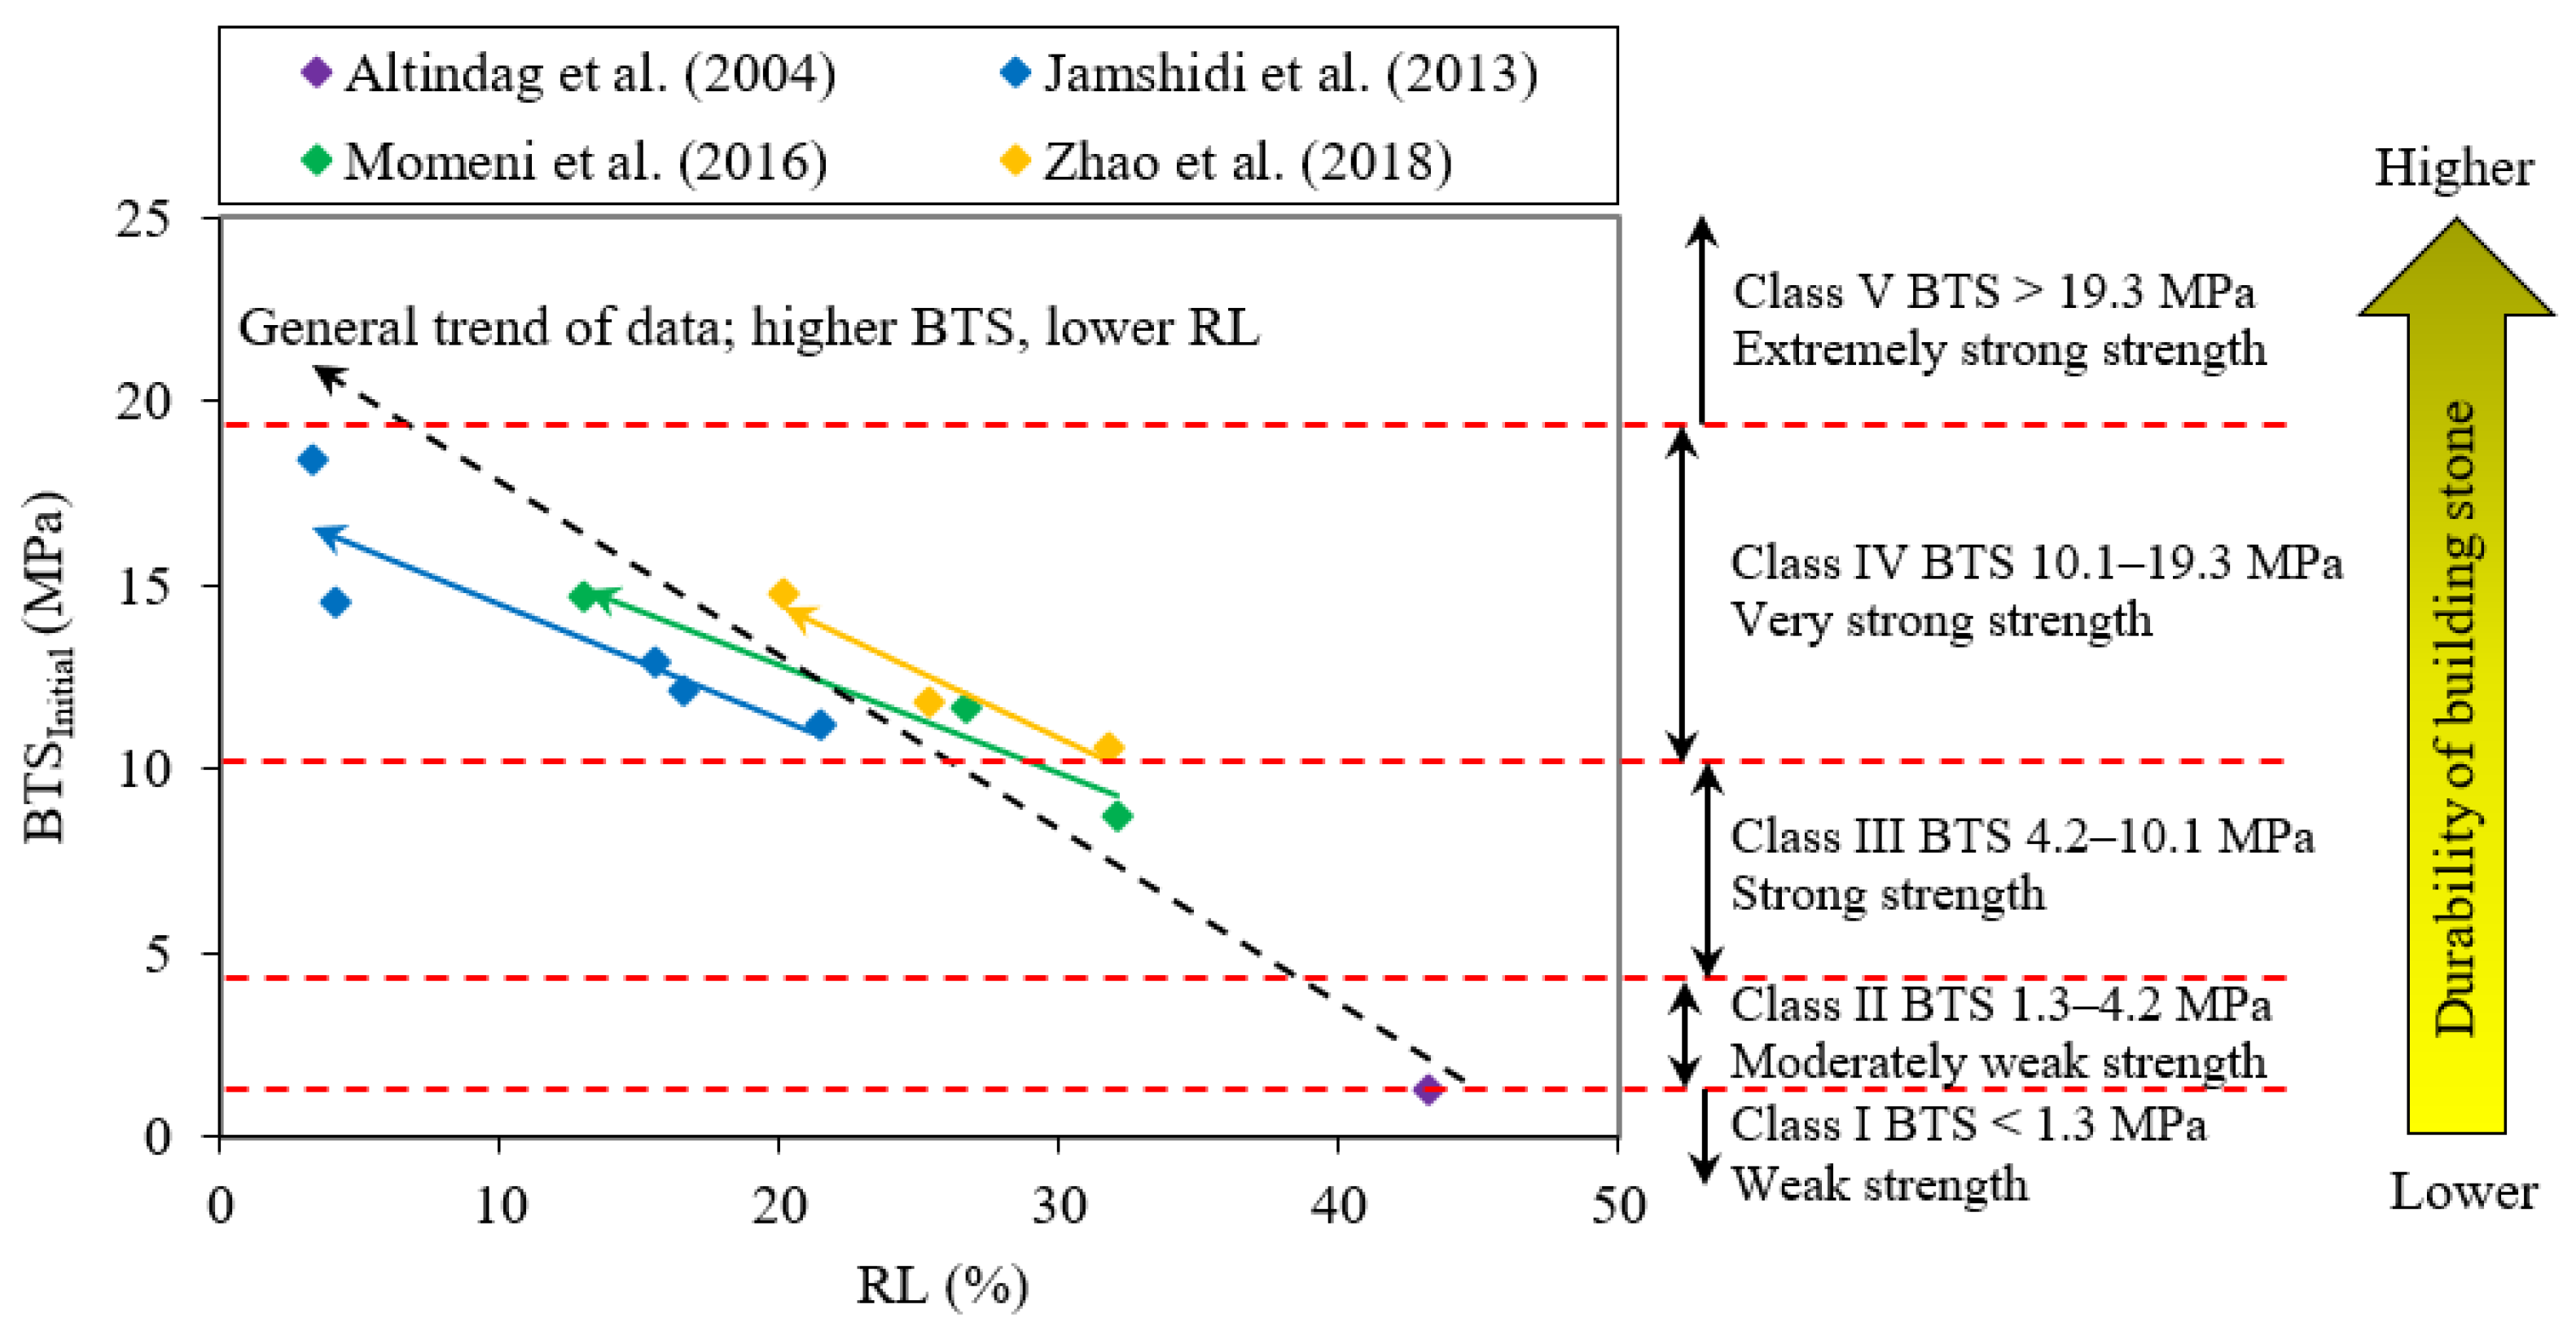
4.3. Validity and Applicability of the BTS Classification for Evaluating the Stone Durability
| Reference | Deterioration Process | Stone Type | BTS (MPa) | * RL (%) | ||
|---|---|---|---|---|---|---|
| Type | Cycle Number | Initial Conditions | Deteriorated | |||
| Altindag et al. [5] | Freezing–thawing | 55 | Ignimbrite | 1.25 | 0.71 | 43.2 |
| Jamshidi et al. [12] | Freezing–thawing | 30 | Ignimbrite | 12.9 | 10.9 | 15.5 |
| Granite | 12.1 | 10.1 | 16.5 | |||
| Granite | 14.5 | 13.9 | 4.1 | |||
| Dacite | 18.4 | 17.8 | 3.3 | |||
| Tuff | 11.2 | 8.8 | 21.4 | |||
| Momeni et al. [13] | Freezing–thawing | 300 | Monzogranite | 8.73 | 5.93 | 32.1 |
| Tonalite | 11.72 | 8.6 | 26.6 | |||
| Granodiorite | 14.67 | 12.76 | 13.0 | |||
| Zhao et al. [14] | Heating–cooling | 1 | Granite | 14.78 | 11.81 | 20.1 |
| Granite | 10.56 | 7.21 | 31.7 | |||
| Granite | 11.83 | 8.84 | 25.3 | |||
5. Conclusions
Author Contributions
Funding
Institutional Review Board Statement
Informed Consent Statement
Data Availability Statement
Conflicts of Interest
Abbreviations
| BTS | Brazilian tensile strength |
| DFM | Decay function model |
| UCS | Uniaxial compressive strength |
| PLI | Point load index |
| R | Coefficient of correlation |
| VAF | Variance account for |
| MAPE | Mean absolute percentage error |
References
- Fener, M.; İnce, İ. Effects of the freeze–thaw (F–T) cycle on the andesitic rocks (Sille-Konya/Turkey) used in construction building. J. Afr. Earth Sci. 2015, 109, 96–106. [Google Scholar] [CrossRef]
- Yavuz, A.B.; Kaputoglu, S.A.; Colak, M.; Tanyu, B.F. Durability assessments of rare green andesites widely used as building stones in Buca (Izmir), Turkey. Environ. Earth Sci. 2017, 76, 211. [Google Scholar] [CrossRef]
- Zalooli, A.; Freire-Lista, D.M.; Khamehchiyan, M.; Nikudel, M.R.; Fort, R.; Ghasemi, S. Ghaleh-khargushi rhyodacite and Gorid andesite from Iran: Characterization, uses, and durability. Environ. Earth Sci. 2018, 77, 315. [Google Scholar] [CrossRef]
- Strzałkowski, P.; EKöken, E.; Sousa, L. Guidelines for natural stone products in connection with European standards. Materials 2023, 16, 6885. [Google Scholar] [CrossRef]
- Altindag, R.; Alyildiz, I.S.; Onargan, T. Mechanical property degradation of ignimbrite subjected to recurrent freeze-thaw cycles. Int. J. Rock Mech. Min. Sci. 2004, 41, 1023–1028. [Google Scholar] [CrossRef]
- Yavuz, H. Effect of freeze-thaw and thermal shock weathering on the physical and mechanical properties of an andesite stone. Bull. Eng. Geol. Environ. 2011, 70, 187–192. [Google Scholar] [CrossRef]
- Torabi-Kaveh, M.; Heidari, M.; Mohseni, H.; Menendez, M. Role of petrography in durability of limestone used in construction of Persepolis complex subjected to artificial accelerated ageing tests. Environ. Earth Sci. 2019, 78, 297. [Google Scholar] [CrossRef]
- Ghobadi, M.H.; Babazadeh, R. Experimental studies on the effects of cyclic freezing-thawing, salt crystallization, and thermal shock on the physical and mechanical characteristics of selected sandstones. Rock Mech. Rock Eng. 2015, 48, 1001–1016. [Google Scholar] [CrossRef]
- Aral, I.F.; Boy, R.; Dincer, A.R. Effects of freeze-thawing cycles on the physical and mechanical properties of basaltic and dolomitic rocks evaluated with a decay function model. Bull. Eng. Geol. Environ. 2021, 80, 2955–2962. [Google Scholar] [CrossRef]
- Mutluturk, M.; Altidag, R.; Turk, G. A decay function model for the integrity loss of rock when subjected to recurrent cycles of freezing–thawing and heating–cooling. Int. J. Rock Mech. Min. 2004, 41, 237–244. [Google Scholar] [CrossRef]
- Ghobadi, M.H.; Taleb Beydokhti, A.R.; Nikudel, M.R.; Asiabanha, A.; Karakus, M. The effect of freeze–thaw process on the physical and mechanical properties of tuff. Environ. Earth Sci. 2016, 75, 846. [Google Scholar]
- Jamshidi, A.; Nikudel, M.R.; Khamehchiyan, M. Predicting the long-term durability of building stones against freeze–thaw using a decay function model. Cold Reg. Sci. Technol. 2013, 92, 29–36. [Google Scholar] [CrossRef]
- Momeni, A.; Abdilor, Y.; Khanlari, G.R.; Heidari, M.; Sepahi, A.A. The effect of freeze–thaw cycles on physical and mechanical properties of granitoid hard rocks. Bull. Eng. Geol. Environ. 2016, 75, 1649–1656. [Google Scholar]
- Zhao, Z.; Liu, Z.; Pu, H.; Li, X. Effect of thermal treatment on Brazilian tensile strength of granites with different grain size distributions. Rock Mech. Rock Eng. 2018, 51, 1293–1303. [Google Scholar] [CrossRef]
- Qi, L.; Wang, J.; Zhang, D.; Zhang, Y.; Ma, J. Evaluation of the influence of freeze–thaw cycles on the joint strength of granite in the Eastern Tibetan Plateau, China. Sci. Rep. 2024, 14, 24085. [Google Scholar]
- Heidari, M.; Torabi-Kaveh, M.; Mohseni, H. Assessment of the effects of freeze–thaw and salt Crystallization ageing tests on Anahita Temple Stone, Kangavar, West of Iran. Geotech. Geol. Eng. 2017, 35, 121–136. [Google Scholar]
- Liu, C.; Deng, H.; Zhao, Z.; Zhang, J. Effects of freeze-thaw treatment on the dynamic tensile strength of granite using the Brazilian test. Cold Reg. Sci. Technol. 2018, 155, 327–332. [Google Scholar] [CrossRef]
- Zalooli, A.; Khamehchiyan, M.; Nikudel, M.R. Durability assessment of Gerdoi and red travertines from Azarshahr. East Azerbaijan province, Iran. Bull. Eng. Geol Environ. 2019, 78, 1683–1695. [Google Scholar]
- Jamshidi, A. Predicting the strength of granitic stones after freeze–thaw cycles: Considering the petrographic characteristics and a new approach using petro-mechanical parameter. Rock Mech. Rock Eng. 2021, 54, 2829–2841. [Google Scholar]
- Singh, T.N.; Singh, S.K.; Mishra, A.; Singh, P.K.; Singh, V.K. Effect of acidic water on physico-mechanical behavoiur of rock. Indian J. Eng. Mater. Sci. 1999, 6, 66–72. [Google Scholar]
- Sharma, P.K.; Khandelwal, M.; Singh, T.N. Variation on physico-mechanical properties of Kota stone under different watery environments. Build. Environ. 2007, 42, 4117–4123. [Google Scholar] [CrossRef]
- Yavuz, A.B.; Topal, T. Thermal and salt crystallization effects on marble deterioration: Examples from Western Anatolia, Turkey. Eng. Geol. 2007, 90, 30–40. [Google Scholar] [CrossRef]
- Jamshidi, A.; Nikudel, M.R.; Khamehchiyan, M. Estimating the durability of building stones against salt crystallization: Considering the physical properties and strength characteristics. Geopersia 2013, 3, 35–48. [Google Scholar]
- Ghobadi, M.H.; Torabi-Kaveh, M. Assessing the potential for deterioration of limestones forming Taq-e Bostan monuments under freeze–thaw weathering and karst development. Environ. Earth Sci. 2014, 72, 5035–5047. [Google Scholar] [CrossRef]
- Momeni, A.; Khanlari, G.R.; Heidari, M.; Bagheri, R.; Bazvand, E. Assessment of physical weathering effects on granitic ancient monuments, Hamedan, Iran. Environ. Earth Sci. 2015, 74, 5181–5190. [Google Scholar] [CrossRef]
- Fereidooni, D.; Khajevand, R. Utilization of the accelerated weathering test method for evaluating the durability of sedimentary rocks. Bull. Eng. Geol. Environ. 2019, 78, 2697–2716. [Google Scholar] [CrossRef]
- Pu, H.; Sha, Z.; Liu, D.; Liu, S. Experimental Study on Mechanical Properties of Sandstone Under Freeze-Thaw Condition; Rock Mechanics/Geomechanics Symposium: New York, NY, USA, 2019. [Google Scholar]
- Zalooli, A.; Khamehchiyan, M.; Nikudel, M.R.; Freire-Lista, D.M.; Fort, R.; Ghasemi, S. Artificial microcracking of granites subjected to salt crystallization aging test. Bull. Eng. Geol. Environ. 2020, 79, 5499–5515. [Google Scholar] [CrossRef]
- Quan, D.; Lian, S.; Bi, J.; Wang, C. Analysis of mechanical properties of sandstone under freeze-thaw cycles based on digital image correlation (DIC). Geofluids 2021, 2021, 7101873. [Google Scholar] [CrossRef]
- Seyed Mousavi, S.Z.; Rezaei, M. Assessing the long-term durability and degradation of rocks under freezing-thawing cycles. Geomech. Eng. 2023, 34, 51–67. [Google Scholar]
- Jamshidi, A. A laboratory study on the durability of limestone wastes in harsh environments for their suitability as aggregate in concrete. Case Stud. Constr. Mater. 2024, 20, e03274. [Google Scholar] [CrossRef]
- Bell, F.G.; Lindsay, P. The petrographic and geotechnical properties of some sandstone from the newspaper member of the Natal Group near Durban, South Africa. Eng. Geol. 1999, 53, 57–81. [Google Scholar]
- Kilic, A.; Teymen, A. Determination of mechanical properties of rocks using simple methods. Bull. Eng. Geol. Environ. 2008, 67, 237–244. [Google Scholar] [CrossRef]
- Huang, L.; Asteris, P.G.; Koopialipoor, M.; Armaghani, D.J.; Tahir, M.M. Invasive weed optimization technique-based ANN to the prediction of rock tensile strength. Appl. Sci. 2019, 9, 5372. [Google Scholar] [CrossRef]
- Zheng, J.; Shen, M.; Motahari, M.R.; Khajehzadeh, M. Prediction of rock tensile strength using soft computing and statistical methods. Period. Polytech. Civ. 2023, 67, 902–913. [Google Scholar] [CrossRef]
- ISRM. Rock characterization, testing and monitoring. In ISRM Suggested Methods; Brown, E.T., Ed.; Pergamon Press: New York, NY, USA, 1981. [Google Scholar]
- Schmidt, R.L. Drillability Studies—Percussive Drilling in the Field; U.S. Department of the Interior: Washington, DC, USA, 1972; p. 31. [Google Scholar]
- Bilgin, N. Investigation into Mechanical Cutting Characteristics of Some Medium and High-Strength Rocks. Ph.D. Thesis, Newcastle University, Newcastle upon Tyne, UK, 1977. [Google Scholar]
- Clark, G.B. Principles of Rock Drilling; Colorado School of Mines: Golden, CO, USA, 1979; Volume 74, pp. 91–93. [Google Scholar]
- Howarth, D.F. The effect of pre-existing microcavities on mechanical rock performance in sedimentary and crystalline rocks. Int. J. Rock Mech. Min. Sci. Geomech. Abstr. 1987, 24, 223–233. [Google Scholar]
- Bilgin, N.; Shahriar, K. The development of a rock cutting rig for rapid excavation systems and its application to Amasra Coalfield. In Proceedings of 6th Coal Congress of Turkey Zonguldak, Turkey, 23–27 May 1988; Chamber of Mining Engineers of Turkey: Zonguldak, Turkey, 1988; pp. 13–28. (In Turkish) [Google Scholar]
- Bilgin, N.; Eskikaya, S.; Dincer, T. The performance analysis of large diameter blast hole rotary drills in Turkish Coal Enterprises. In Proceedings of the 2nd International Symposium on Mine Mechanization and Automation, Lulea, Sweden, 7–10 June 1993; pp. 129–135. [Google Scholar]
- Gupta, A.; Rao, K.S. Index properties of weathered rocks: Inter-relationships and applicability. Bull. Eng. Geol. Environ. 1998, 57, 161–172. [Google Scholar]
- Bearman, R.A. The use of the point load test for the rapid estimation of Mode I fracture toughness. Int. J. Rock Mech. Min. Sci. 1999, 36, 257–263. [Google Scholar]
- Kahraman, S. Rotary and percussive drilling prediction using regression analysis. Int. J. Rock Mech. Min. Sci. 1999, 36, 981–989. [Google Scholar] [CrossRef]
- Tugrul, A.; Zarif, I.H. Correlation of mineralogical and textural characteristics with engineering properties of selected granitic rocks from Turkey. Eng. Geol. 1999, 51, 303–317. [Google Scholar]
- Ersoy, A.; Buyuksagic, S.; Atici, U. Wear characteristics of circular diamond saws in the cutting of different hard abrasive rocks. Wear 2005, 258, 1422–1436. [Google Scholar]
- Ersoy, A.; Atici, U. Correlation of P and S-Waves with cutting specific energy and dominant properties of volcanic and carbonate rocks. Rock Mech. Rock Eng. 2007, 40, 491–504. [Google Scholar] [CrossRef]
- Dwivedi, R.D.; Goel, R.K.; Prasad, V.V.R.; Sinha, A. Thermo-mechanical properties of Indian and other granites. Int. J. Rock Mech. Min. Sci. 2008, 45, 303–315. [Google Scholar]
- Atici, U.; Ersoy, A. Correlation of specific energy of cutting saws and drilling bits with rock brittleness and destruction energy. J. Mater. Process. Technol. 2009, 209, 2602–2612. [Google Scholar]
- Erguler, Z.A.; Ulusay, R. Water-induced variations in mechanical properties of clay-bearing rocks. Int. J. Rock Mech. Min. Sci. 2009, 46, 355–370. [Google Scholar]
- Yagiz, S. Assessment of brittleness using rock strength and density with punch penetration test. Tunn. Undergr. Space Technol. 2009, 24, 66–74. [Google Scholar]
- Yilmaz, N.G.; Karaca, Z.; Goktan, R.M.; Akal, C. Relative brittleness characterization of some selected granitic building stones: Influence of mineral grain size. Constr. Build. Mater. 2009, 23, 370–375. [Google Scholar] [CrossRef]
- Karaca, Z.; Deliormanli, A.H.; Elci, H.; Pamukcu, C. Effect of freeze–thaw process on the abrasion loss value of stones. Int. J. Rock Mech. Min. Sci. 2010, 47, 1207–1211. [Google Scholar]
- Fener, M. The effect of rock sample dimension on the P-wave velocity. J. Nondestruct. Eval. 2011, 30, 99–105. [Google Scholar]
- Yarali, O.; Kahraman, S. The drillability assessment of rocks using the different brittleness values. Tunn. Undergr. Space Technol. 2011, 26, 406–414. [Google Scholar]
- Ghobadi, M.H.; Rasouli, M.R. Brittleness determination of granites by Schmidt rebound hammer hardness to evaluate drillability. New Find. Appl. Geol. 2012, 6, 16–28. [Google Scholar]
- Kahraman, S.; Fener, M.; Kozman, E. Predicting the compressive and tensile strength of rocks from indentation hardness index. J. S. Afr. Inst. Min. Metall. 2012, 112, 331–339. [Google Scholar]
- Khanlari, G.R.; Heidari, M.; Momeni, A.A. Assessment of weathering processes effect on engineering properties of Alvand granitic rocks (west of Iran), based on weathering indices. Environ. Earth Sci. 2012, 67, 713–725. [Google Scholar] [CrossRef]
- Yavuz, A.B. Durability assessment of the Alaçatı tuff (Izmir) in western Turkey. Environ. Earth Sci. 2012, 67, 1909–1925. [Google Scholar] [CrossRef]
- Basu, A.; Mishra, D.A.; Roychowdhury, K. Rock failure modes under uniaxial compression, Brazilian, and point load tests. Bull. Eng. Geol. Environ. 2013, 72, 457–475. [Google Scholar] [CrossRef]
- Heidari, M.; Momeni, A.A.; Naseri, F. New weathering classifications for granitic rocks based on geomechanical parameters. Eng. Geol. 2013, 166, 65–73. [Google Scholar] [CrossRef]
- Karakuş, A.; Akatay, M. Determination of basic physical and mechanical properties of basaltic rocks from P-wave velocity. Nondestruct. Test Eval. 2013, 28, 342–353. [Google Scholar] [CrossRef]
- Khandelwal, M. Correlating P-wave velocity with the physico-mechanical properties of different rocks. Pure Appl. Geophys. 2013, 170, 507–514. [Google Scholar] [CrossRef]
- Mikaeil, R.; Ataei, M.; Yousefi, R. Correlation of production rate of ornamental stone with rock brittleness indexes. Arab. J. Geosci. 2013, 6, 115–121. [Google Scholar] [CrossRef]
- Heidari, M.; Khanlari, G.R.; Torabi-Kaveh, M.; Kargarian, S.; Saneie, S. Effect of porosity on rock brittleness. Rock Mech. Rock Eng. 2014, 47, 785–790. [Google Scholar] [CrossRef]
- Majeed, Y.; Shahzad, M.; Ali, Z.; Iqbal, M.M.; Saqib, S. Estimation of uniaxial compressive strength and Brazilian tensile strength from block punch index. J. Pak. Int. Chem. Eng. 2015, 43, 5–13. [Google Scholar]
- Sajid, M.; Arif, M. Reliance of physico-mechanical properties on petrographic characteristics: Consequences from the study of Utla granites, north-west Pakistan. Bull. Eng. Geol. Environ. 2015, 74, 1321–1330. [Google Scholar] [CrossRef]
- İnce, İ.; Fener, M. A prediction model for uniaxial compressive strength of deteriorated pyroclastic rocks due to freeze–thaw cycle. J. Afr. Earth Sci. 2016, 120, 134–140. [Google Scholar]
- Ribeiro, P.; Oliveira, M.; Nelson, P. Correlation between uniaxial compressive strength and Brazilian tensile strength using different rock types. In Proceedings of the XVIII Brazilian Conference on Soil Mechanics and Geotechnical Engineering, Belo Horizonte, Brazil, 19–22 October 2016. [Google Scholar]
- Ronmar, C. Correlation of Rock Strength Between Uniaxial Compressive, Brazilian and Point Load Tests: A laboratory Study. Honours Thesis, School of Mechanical and Mining Engineering, The University of Queensland, St. Lucia, Australia, 2016. [Google Scholar]
- Akinbinu, V.A. Relationship of brittleness and fragmentation in brittle compression. Eng. Geol. 2017, 221, 82–90. [Google Scholar] [CrossRef]
- Almasi, S.N.; Bagherpour, R.; Mikaeil, R.; Ozcelik, Y. Analysis of bead wear in diamond wire sawing considering the rock properties and production rate. Bull. Eng. Geol. Environ. 2017, 76, 1593–1607. [Google Scholar]
- Altindag, R.; Guney, A. Predicting the relationship between brittleness and mechanical properties (UCS, TS and SH) of rocks. Sci. Res. Essays. 2010, 5, 2107–2118. [Google Scholar]
- Bozdağ, A.; İnce, İ. Predicting strength parameters of igneous rocks from slake durability index. J. Sci. Eng. 2018, 18, 1102–1109. [Google Scholar]
- Jaques, D.S.; Marques, E.A.G.; Marcellino, L.C.; Leao, M.F.; Ferreira, E.P.S.; dos Santos Lemos, C.C. Changes in the physical, mineralogical and geomechanical properties of a granitic rock from weathering zones in a tropical climate. Rock Mech. Rock Eng. 2020, 53, 5345–5370. [Google Scholar]
- Teymen, A.; Mengüç, E.C. Comparative evaluation of different statistical tools for the prediction of uniaxial compressive strength of rocks. Int. J. Rock Mech. Min. Sci. 2020, 30, 785–797. [Google Scholar]
- Xue, Y.; Kong, F.; Li, S.; Zhang, L.; Zhou, B.; Li, G.; Gong, H. Using indirect testing methods to quickly acquire the rock strength and rock mass classification in tunnel engineering. Int. J. Geomech. 2020, 20, 05020001. [Google Scholar]
- Akbay, D.; Altindag, R. Investigation of the availability of a new point load test device in characterization of rocks. Int. Adv. Res. Eng. J. 2021, 05, 387–397. [Google Scholar]
- Hamzaban, M.T.; Buyuksagis, I.S.; Milad, M.; Touranchehzadeh, A. The effect of saturation on the physical and mechanical behavior of some rock samples. Civ. Eng. Limits. 2021, 3, 23–31. [Google Scholar] [CrossRef]
- Wei, J.; Zhou, J.; Song, J.-J.; Chen, Y.; Kulatilake, P.H.S.W. Estimation of tensile strength and moduli of a tension-compression bi-modular rock. Geomech. Geoengin. 2021, 24, 349–358. [Google Scholar]
- Fereidooni, D. Importance of the mineralogical and textural characteristics in the mechanical properties of rocks. Arab. J. Geosci. 2022, 15, 637. [Google Scholar] [CrossRef]
- Pötzl, C.; Siegesmund, S.; López-Doncel, R.; Dohrmann, R. Key parameters of volcanic tuffs used as building stone: A statistical approach. Environ. Earth Sci. 2022, 81, 10. [Google Scholar]
- Ajalloeian, R.; Jamshidi, A.; Khorasani, R. Evaluating the effects of mineral grain size and mineralogical composition on the correlated equations between strength and Schmidt hardness of granitic rocks. Geotech. Geol. Eng. 2024, 42, 675–685. [Google Scholar]
- Diamantis, K.; Khajevand, R.; Fereidooni, D. Assessing the geotechnical properties of peridotite rocks in dry and saturated conditions. Innov. Infrastruct. Solut. 2024, 9, 130. [Google Scholar]
- Kahraman, S.; İnce, İ.; Rostami, M.; Dibavar, B. Predicting the strength, density, and porosity of rocks from roll crusher tests. J. S. Afr. Inst. Min. Metall. 2024, 124, 53–57. [Google Scholar]
- Anon, O.H. Classification of rocks and soil for engineering geological mapping, part 1: Rock and soil materials. Bull. Int. Assoc. Eng. Geol. 1979, 19, 364–371. [Google Scholar]
- Chatterjee, R.; Mukhopadhyay, M. Petrophysical and geomechanical properties of rocks from the oilfields of the Krishna-Godavari and Cauvery Basins, India. Bull. Eng. Geol. Environ. 2002, 61, 169–178. [Google Scholar]
- Gokceoglu, C.; Zorlu, K. A fuzzy model to predict the uniaxial compressive strength and the modulus of elasticity of a problematic rock. Eng. Appl. Artif. Intell. 2004, 17, 61–72. [Google Scholar]
- Tahir, M.; Mohammad, N.; Din, F. Strength parameters and their inter-relationship for limestone of Cherat and Kohat areas of Khyber Pakhtunkhwa. J. Himal. Earth Sci. 2021, 44, 45–51. [Google Scholar]
- Yesiloglu-Gultekin, N.; Gokceoglu, C.; Sezer, E.A. Prediction of uniaxial compressive strength of granitic rocks by various nonlinear tools and comparison of their performances. Int. J. Rock Mech. Min. Sci. 2013, 62, 13–122. [Google Scholar]
- Kallu, R.; Roghanchi, P. Correlations between direct and indirect strength test methods. Int. J. Min. Sci. Technol. 2015, 25, 355–360. [Google Scholar]
- Mohamad, E.T.; Armaghani, D.J.; Momeni, E.; Alavi Nehzad, S.V.; Abad, K. Prediction of the unconfined compressive strength of soft rocks: A PSO-based ANN approach. Bull. Eng. Geol. Environ. 2015, 74, 745–757. [Google Scholar] [CrossRef]
- Fereidooni, D. Determination of the geotechnical characteristics of hornfelsic rocks with a particular emphasison the correlation between physical and mechanical properties. Rock Mech. Rock Eng. 2016, 49, 2595–2608. [Google Scholar]
- Aliyu, M.M.; Shang, J.; Murphy, W.; Lawrence, J.A.; Collier, R.; Kong, F.; Zhao, Z. Assessing the uniaxial compressive strength of extremely hard cryptocrystalline flint. Int. J. Rock Mech. Min. Sci. 2019, 113, 310–321. [Google Scholar]
- Arman, H. Correlation of uniaxial compressive strength with indirect tensile strength (Brazilian) and 2nd cycle of slake durability index for evaporitic rocks. Geotech. Geol. Eng. 2021, 39, 1583–1590. [Google Scholar] [CrossRef]
- Khajevand, R. Prediction of the uniaxial compressive strength of rocks by soft computing approaches. Geotech. Geol. Eng. 2023, 41, 3549–3574. [Google Scholar]
- Gunsallus, K.L.; Kulhawy, F.H. A comparative evaluation of rock strength measures. Int. J. Rock Mech. Min. Sci. Geomech. Abstr. 1984, 21, 233–248. [Google Scholar]
- Farah, R. Correlations Between Index Properties and Unconfined Compressive Strength of Weathered Ocala Limestone. Master’s Thesis, University of North Florida, Jacksonville, FL, USA, 2011. [Google Scholar]
- Nazir, R.; Momeni, E.; Jahed Armaghani, D. Correlation between unconfined compressive strength and indirect tensile strength of limestone rock samples. Electr. J. Geotech. Eng. 2013, 18, 1737–1746. [Google Scholar]
- Zeng, Q.; Li, K.; Fen-Chong, T. Effect of supercooling on the instantaneous freezing dilation of cement-based porous materials. J. Build. Phys. 2016, 40, 101–124. [Google Scholar]
- Zheng, Y.; Jia, C.; Lei, M.; Huang, J.; Shi, C. Investigation of the constitutive damage model of rock under the coupled effect of freeze–thaw cycles and loading. Rock Mech. Rock Eng. 2024, 57, 1861–1879. [Google Scholar]
- Khanlari, G.; Zarei Sahamieh, R.; Abdilor, Y. The effect of freeze–thaw cycles on physical and mechanical properties of Upper Red Formation sandstones, central part of Iran. Arab. J. Geosci. 2015, 8, 5991–6001. [Google Scholar] [CrossRef]
- Abdi, Y.; Sabzi, M. The effect of salt crystallization on degradation of limestones used as heritage building stone in Lorestan, Iran. Geoheritage 2024, 16, 118. [Google Scholar]
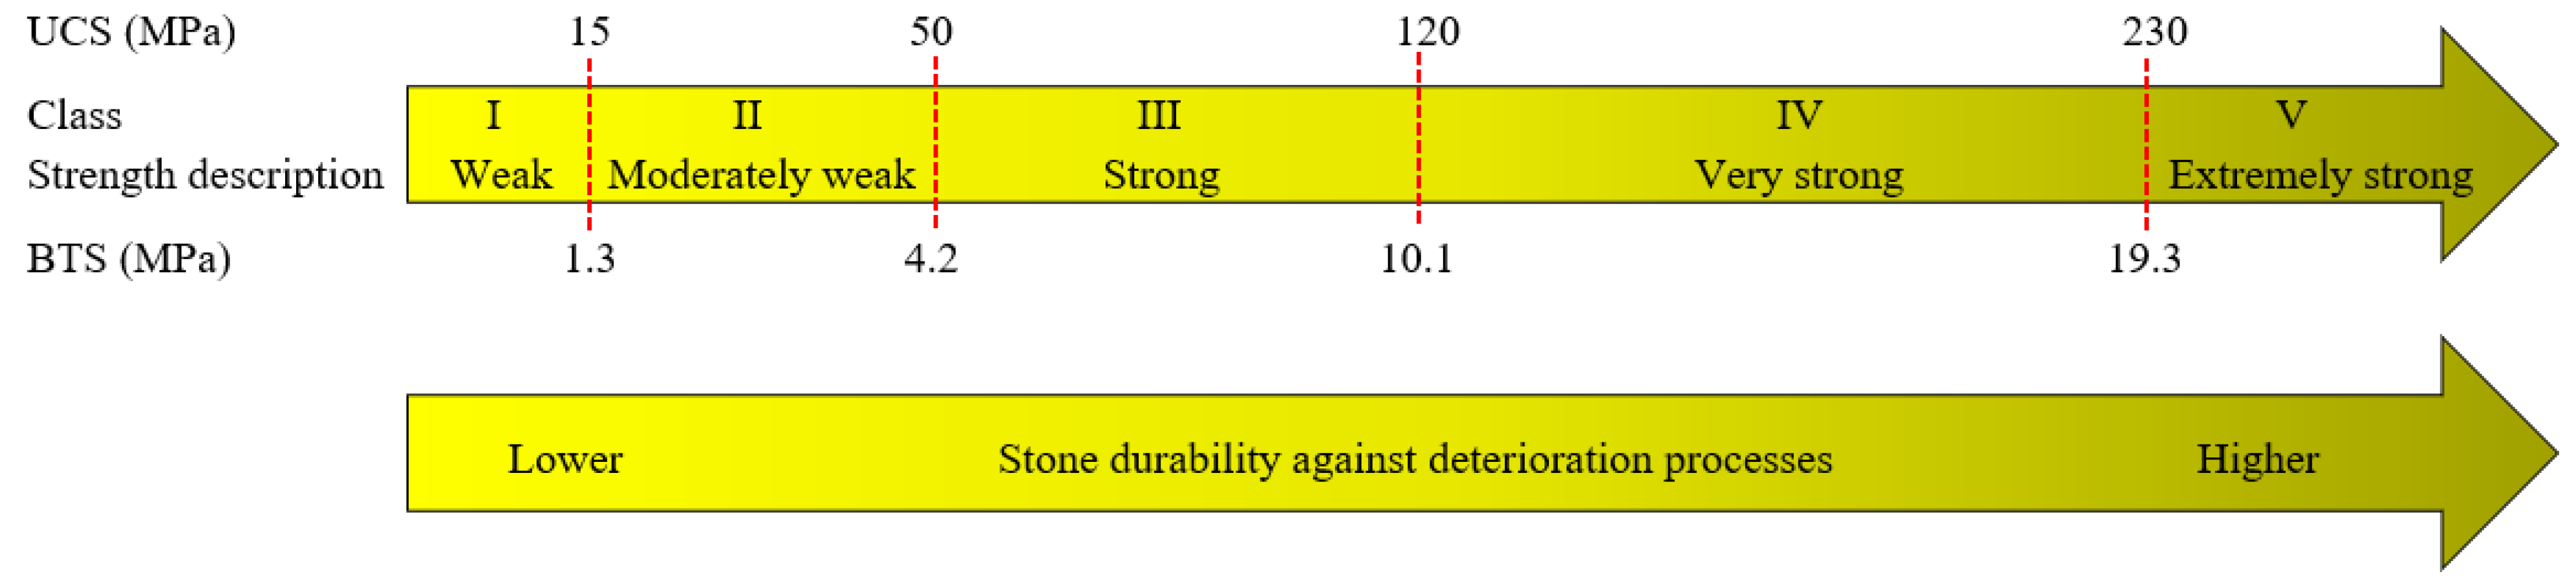
| Class | UCS (MPa) | UCS Description |
|---|---|---|
| I | <15 | Weak |
| II | 15–50 | Moderately weak |
| III | 50–120 | Strong |
| IV | 120–230 | Very strong |
| V | 230 < | Extremely strong |
Disclaimer/Publisher’s Note: The statements, opinions and data contained in all publications are solely those of the individual author(s) and contributor(s) and not of MDPI and/or the editor(s). MDPI and/or the editor(s) disclaim responsibility for any injury to people or property resulting from any ideas, methods, instructions or products referred to in the content. |
© 2025 by the authors. Licensee MDPI, Basel, Switzerland. This article is an open access article distributed under the terms and conditions of the Creative Commons Attribution (CC BY) license (https://creativecommons.org/licenses/by/4.0/).
Share and Cite
Jamshidi, A.; Sousa, L. A Quantitative-Qualitative Classification for Igneous Building Stones Based on Brazilian Tensile Strength: Application to the Stone Durability. Appl. Sci. 2025, 15, 3907. https://doi.org/10.3390/app15073907
Jamshidi A, Sousa L. A Quantitative-Qualitative Classification for Igneous Building Stones Based on Brazilian Tensile Strength: Application to the Stone Durability. Applied Sciences. 2025; 15(7):3907. https://doi.org/10.3390/app15073907
Chicago/Turabian StyleJamshidi, Amin, and Luís Sousa. 2025. "A Quantitative-Qualitative Classification for Igneous Building Stones Based on Brazilian Tensile Strength: Application to the Stone Durability" Applied Sciences 15, no. 7: 3907. https://doi.org/10.3390/app15073907
APA StyleJamshidi, A., & Sousa, L. (2025). A Quantitative-Qualitative Classification for Igneous Building Stones Based on Brazilian Tensile Strength: Application to the Stone Durability. Applied Sciences, 15(7), 3907. https://doi.org/10.3390/app15073907