Article

Characterization of the Solution of the Seismic Source Mechanism in Southeastern Sichuan

1
Sichuan Earthquake Agency, Chengdu 610041, China
2
College of Earth Science, Chengdu University of Technology, Chengdu 610059, China
3
The Laboratory of Seismic Technical Inspection, Chengdu 610041, China
*
Author to whom correspondence should be addressed.
Appl. Sci. 2025, 15(7), 3881; https://doi.org/10.3390/app15073881
Submission received: 20 February 2025 / Revised: 27 March 2025 / Accepted: 31 March 2025 / Published: 1 April 2025
(This article belongs to the Special Issue Exploration Geophysics and Seismic Surveying)

Abstract

:
Southeastern Sichuan has witnessed intensified seismic swarm activity since 2016, including events exceeding historical peak ground accelerations. This study integrates moment tensor solutions, stress field inversion, and Mohr–Coulomb analysis to investigate the interplay between tectonic processes and shale gas extraction in driving seismicity. Full-waveform moment tensor inversions of 118 earthquakes (M ≥ 3.5) reveal predominant double-couple mechanisms (62% with DC > 70%), with minor non-double-couple components linked to fluid-induced volume contraction. Stress field inversions demonstrate spatial heterogeneity: Region A (south) exhibits a counterclockwise-rotated maximum horizontal stress direction compared to Region B (north), which aligns with the regional NW-SE tectonic compression. Mohr’s circle analysis highlights distinct failure regimes—40% of the events in Region A fall below the failure threshold (pore-pressure-influenced), while 60% in Region B exceed it (stress-dominated). These findings underscore the combined roles of tectonic inheritance (NE-SW basement faults) and anthropogenic perturbations (fluid injection) in modulating seismic hazards.

1. Introduction

The 2008 Mw 7.9 Wenchuan earthquake, located on the Longmen shan Fault Zone in southwestern China, struck an area characterized by significant tectonic activity where the Tibetan Plateau converges with the Sichuan Basin, leading to tectonic compression and crustal shortening [1,2]. The Tibetan Plateau, situated to the west, is notorious for its frequent strong earthquakes, whereas the Sichuan Basin, located to the east, forms part of the South China Massif, historically experiencing fewer and less intense seismic events [1,2] (Figure 1a). Since 2016, the southern portion of the Sichuan Basin, encompassing areas such as Changning–Gongxian (Region A), Zigong–Weiyuan (Region B), and Luxian–Rongchang (Region C), has witnessed a notable increase in seismic activity (Figure 1b,c). This includes several significant earthquake swarms, notably, the Changning Ms 6.0 event on 17 June 2019, the Luxian Ms 6.0 event on 16 September 2021, and other quakes with a magnitude of 5 or more. As illustrated in Figure 1c, this period has seen a substantial increase in seismic frequency compared to pre-2016 levels, with intensities surpassing historical seismic records within the Sichuan Basin [3,4,5,6,7]. Historically, based on seismic and geological data, the PGA in the southeastern Sichuan region was approximately 50–150 gal [8]. However, the actual value recorded during the Changning Ms 6.0 earthquake in 2019 reached 599.16 gal [9], and the Luxian County Ms 6.0 earthquake in 2021 peaked at 756.02 gal [10]. These values not only exceeded regional seismic defense standards but also resulted in casualties and property damage.
The seismogenic mechanisms underlying the earthquake swarm activities in the southeastern Sichuan Basin have sparked intense debate within the geophysical community. Two predominant hypotheses have emerged from the current research: (1) Under the Stress Transfer Hypothesis, postseismic stress transfer following major earthquakes, particularly the 2008 Mw 7.9 Wenchuan earthquake, may modulate regional seismicity patterns. Multiple studies demonstrate that the Wenchuan event significantly elevated Coulomb stress levels within the Sichuan Basin [11,12,13], establishing a stress perturbation field capable of triggering small-to-moderate earthquakes in adjacent regions [14,15]. Notably, spatiotemporal correlations between stress field evolution and subsequent seismic swarm episodes provide empirical support for this mechanism [16]. (2) The Anthropogenic Triggering Hypothesis, an alternative perspective, posits that extensive shale gas extraction from the Silurian Longmaxi Formation in southeastern Sichuan’s fold–thrust belt may play a key role, alongside tectonic stresses, in contributing to recent seismicity. Multidisciplinary evidence reveals systematic correlations between the spatial distribution of induced seismicity and active well pads [17], temporal clustering of seismic events and hydraulic fracturing cycles [18], and statistical parameters and earthquake sequence evolution stages [19]. This mechanism aligns with global cases of induced seismicity, including Mw 5.7 events in Oklahoma (USA) [20], Mw 4.6 tremors in Alberta (Canada) [21], ML 5.5 earthquakes in Pohang (South Korea) [22], and the 2012 Emilia seismic sequence (Italy) [23], all linked to unconventional hydrocarbon extraction. As China’s largest shale gas production base, the Sichuan Basin exhibits a marked temporal correlation between escalating seismicity rates and intensive hydraulic fracturing activities. While causal attribution remains complex in tectonically active regions, mounting observational constraints increasingly implicate anthropogenic fluid injection as a key modulator of contemporary seismic hazards in this region [3,5,6,7].
While prior research has offered valuable insights into the seismic activity of this region, the current study seeks to deepen our understanding by integrating moment tensor solutions, stress field inversion, and Mohr circle analysis. Our focus is on unraveling the intricate interplay between tectonic processes and human-induced activities, such as shale gas extraction, in triggering seismic events. Specifically, we aim to provide a detailed spatial characterization of the stress field and its perturbations resulting from fluid injection. This approach not only sheds new light on the mechanisms driving induced seismicity in southeastern Sichuan but also enhances our comprehension of how natural and anthropogenic factors jointly influence local seismicity.

2. Geological Settings

The convergence of the Indian and Eurasian plates has led to the uplift of the Tibetan Plateau [24,25]. The eastward extrusion of the Tibetan Plateau material, obstructed by the Yangtze Craton, has formed the Longmen Shan orogenic belt along the eastern margin of the plateau and the adjacent Sichuan foreland basin [26,27,28]. Located on the western edge of the Yangtze Craton, the Sichuan Basin possesses a rigid Precambrian crystalline basement, with its top boundary gradually rising from northwest to southeast, ranging in depth from approximately 13 km to 7 km [29]. In contrast to the tectonically active and seismically frequent Longmen Shan orogenic belt, the interior of the Sichuan Basin exhibits high structural stability, with a very low present-day strain rate (4–8 × 10⁹/year) [30,31]. Historically, the basin has experienced almost no strong earthquakes with magnitudes exceeding 6.0 [4].
Since the Indosinian period, the Sichuan Basin has undergone multiple phases of tectonic activity influenced by surrounding orogenic belts, resulting in the superposition of multiple sets of structures. From west to east, the basin can be divided into three main tectonic units [32,33] (Figure 1a). Among them, the western subsidence zone is bounded by the Longmen Shan Fault Zone to the west and the Longquan Shan Fault Zone to the east. Its tectonic features are controlled by the compressive effect of the Longmen Shan Fault Zone, with the development of a series of northeast-trending thrust faults and related folds. The central dome zone lies between the Longquan Shan Fault and the Huaying Shan Fault, where gentle dome structures are widely developed. The closure conditions at the top and slope areas of the domes are favorable, and the carbonate reservoirs of the Middle Triassic and Lower Permian contain a large amount of conventional natural gas resources. The eastern fold zone is mainly bounded by the Huaying Shan Fault Zone and the Dalu Shan Fault, with the development of a series of northeast-trending tight linear folds, such as the Huaying Shan Anticline and the Changning Anticline. The regional fracture system is relatively complex, with a high density of high-angle reverse faults and local strike-slip faults, which jointly control the distribution of the stress field and the development of folds. Within the fold zone, the Silurian Longmaxi Formation is rich in organic shale, providing good fracture network conditions for the occurrence of shale gas.

3. Moment Tensor Inversion

The seismic moment tensor (MT) is an essential tool for elucidating the mechanisms of seismic sources. It is widely utilized in seismological studies to offer a comprehensive description of both double-couple and non-double-couple components at complex seismic sources. The decomposition of the moment tensor typically includes three independent components: the double-couple (DC), compensated linear vector dipole (CLVD), and isotropic (ISO) components [34]. Among these, the double-couple component is associated with shear rupture, while the CLVD and ISO components are linked to volumetric changes and fluid activity [34,35]. In practical observations, tectonic earthquakes generally display a pure double-couple source mechanism, reflecting crustal deformation primarily caused by shear rupture. However, various specific seismic sources, such as mining-induced earthquakes, volcanic events, explosions, and fluid-triggered earthquakes, often exhibit significant non-double-couple components. These components may be indicative of specialized physical processes at the source, including complex geological environments, inelastic volumetric changes, or intense fluid–rock interactions [36,37,38,39,40,41]. Consequently, analyzing the seismic moment tensor can profoundly investigate the quantitative relationship between seismic source mechanisms and crustal dynamic behaviors. Such analysis provides a scientific foundation for understanding the mechanisms underlying earthquake nucleation, triggering, and damage. By examining these relationships, we can gain deeper insights into how different factors, both natural and anthropogenic, contribute to seismic activity.
In the current investigation, we meticulously selected 16 seismic stations situated in the southern region of Sichuan Province, all within a radius of 150 km from the earthquake epicenter. These stations have diligently recorded seismic waveform data for all earthquakes with a magnitude of M ≥ 3.5 occurring in the area since 2010, as depicted in Figure 1a. For each seismic event, the waveform data were meticulously segregated into Pnl-wave and surface wave components, encompassing durations of 30 s and 60 s, respectively. Subsequent to this segmentation, the wave components underwent a rigorous analysis involving band-pass filtering within the frequency ranges of 0.05–0.3 Hz for Pnl-waves and 0.05–0.1 Hz for surface waves. Utilizing the grid point search technique, we successfully derived the full moment tensor parameters for each event [42].
In preparation for this analysis, we first acquired a comprehensive three-dimensional velocity model of the study region [43]. We then computed Green’s functions by employing the fk method [44]. For each earthquake, we calculated the Green’s functions at discrete depths ranging from 1 to 20 km. Applying the inversion outcomes, we ascertained the optimal centroid depth for each event, as illustrated in Figure 2a. To ensure data quality, we adhered to a strict criterion, selecting only data with a variance reduction (VR) of 60% or greater, as shown in Figure 2b. Ultimately, our study yielded complete moment tensor solutions for a total of 118 earthquakes within the defined research area.
Certainly, the accuracy of the velocity model significantly influences the effectiveness of waveform modeling and ultimately determines the correctness of the full moment tensor inversion. Nevertheless, the waveform floating fitting method adopted by GCAP effectively mitigates the reliance on the precision of the velocity structure. Utilizing GCAP, we recalculated the full moment tensor for the Ms3.6 earthquake that occurred on 24 September 2021, based on a 1-D velocity model of the Sichuan Basin [5]. It was observed that the full moment tensors derived from both the 3-D (represented by blue beach balls in Figure 2a) and local 1-D velocity models (represented by green beach balls in Figure 2a) yielded similar optimal centroid depths and showed no significant differences in their optimal full moment tensors. The subtle distinctions lie in the fact that, compared to the 1-D model, the full moment tensor based on the 3-D model exhibited an overall better fitting quality (higher variance reduction, VR) and a more stable depth distribution of the full moment tensor solutions.
However, we did not obtain a large number of moment tensor results in the study area calculated by other researchers using GCAP or similar methods, making it difficult for us to systematically compare and analyze the validity of our results. In fact, there is no significant difference between the double-couple solutions extracted from our moment tensor solutions and those directly reversed using the CAP method [5,6,7].
The computational outcomes presented in Figure 3a reveal that the majority of the earthquakes within the study area manifest as double-couple (DC) events, with 62% of the seismic occurrences exhibiting a DC component proportion exceeding 70%. However, a minority of the seismic events display a non-double-couple signature, a characteristic observed across all three regions under investigation. To facilitate a more direct visualization of the distribution of various moment tensor components, we constructed the Tk source-type lune [45], as depicted in Figure 3b. The lune analysis indicates that the predominant cluster of earthquakes is centered within the DC region, illustrating that the focal process is dominated by shear deformation, which is a typical characteristic of tectonic earthquakes. Nonetheless, a subset of the seismic events extends towards the negative ISO region, implying that these earthquakes involved volume contraction during the source rupture process.
The observed non-double-couple (non-DC) components in mining-induced seismic events can be attributed to intricate interactions involving fluid injection, pre-existing fault networks, and the anisotropic characteristics of the rock formations. The process of hydraulic fracturing introduces high-pressure fluids into shale strata, which diminishes the effective normal stress on fault planes and facilitates a combination of shear and tensile failure modes. This leads to volumetric alterations—either expansion or contraction—that are superimposed upon shear displacement, thereby giving rise to non-DC seismic mechanisms [38,46,47]. The pre-existing faults within shale reservoirs frequently display geometric intricacies, such as intersecting fractures and curved fault planes. Fluid injection has the potential to initiate slip along these complex structures, thereby producing non-DC moment tensors [48,49]. The intrinsic anisotropy of shale, exemplified by bedding planes and aligned fractures, induces asymmetric stress responses during the hydraulic fracturing process. This asymmetry results in deviations from the classical model of shear failure [50]. Moreover, the rapid withdrawal or injection of fluids can induce localized volumetric changes within the rock matrix, which may be implosive or explosive in nature, thereby contributing to isotropic components in the computed moment tensors [38].
Accounting for the multifaceted origins of non-double-couple (non-DC) seismic events, reliance on a high ISO ratio alone is insufficient to delineate the specific role of individual factors in the seismic generation process. Nevertheless, the experimental studies and numerical simulations conducted by Dong et al. [51] in the region offer insights into explaining this phenomenon. These findings indicate that the shales in the southeastern Sichuan area are clay-rich, which are susceptible to collapse upon water intrusion, potentially triggering local seismic activity. Consequently, for earthquakes exhibiting negative ISO components, it is postulated that they are intimately associated with fluid intrusion induced by hydraulic fracturing and water injection activities during shale gas extraction. The alteration in fluid pressure is believed to induce the collapse and subsequent volume contraction of the clay-rich shale layers, manifesting as a negative ISO signature in the moment tensor of the seismic source.
Figure 3. (a) Map of moment tensor solutions, colored by the percentage of double-couple. The black beach balls illustrate the focal mechanism solutions of 91 earthquakes with magnitudes of 2.5–3.4 derived by HASH [52] and evaluated as quality “A” during the period of 2018–2022. The colored beach balls in (a) represent the full moment tensor solutions of 118 earthquakes with magnitudes Ms ≥ 3.5, where different colors indicate the degree of the double-couple (DC) component (refer to the color scale below (a). (b) The Tk source-type plot after Tape and Tape [45]. The yellow dots in (b) represent individual earthquake events. The white region within the two dashed lines indicates areas with significant double-couple (DC) components. The gray regions outside the dashed lines correspond to non-DC events, which are further divided into two parts: the upper part represents the +ISO component region, indicating volumetric expansion, while the lower part corresponds to the -ISO component region, indicating volumetric contraction.
Applsci 15 03881 g003

4. Stress Field Inversion

4.1. Focal Mechanism Types

The focal mechanism type is indicative of the stress and deformation state of geological structures. Initially, we decomposed the double-couple components from the full moment tensor solutions of 118 earthquakes with magnitudes Ms ≥ 3.5 (Figure 3). To enhance the statistical significance of our analysis, we compiled an additional 91 focal mechanism solutions derived using HASH [52] for earthquakes with magnitudes ranging from 2.5 to 3.4, recorded between 2018 and 2022. These data were classified using the FMC program (Version 1.3) [53], which employs a hierarchical clustering algorithm and supports various distance metrics, facilitating the identification of spatial or mechanical clustering signatures associated with seismic activity (Figure 4).
In the southeast Sichuan region, the seismic source mechanism solutions predominantly feature the reverse type (approximately 51%), followed by the strike-slip type (about 11%), with only a small fraction exhibiting the normal fault type (around 7%). The remaining solutions are of mixed types (Figure 4). Concurrently, the type of seismic mechanism exhibits significant spatial variability. Region A, in particular, displays the greatest complexity (Figure 5a), with a predominance of thrust and strike-slip types and a minor occurrence of normal fault and mixed types. This complexity is echoed in the studies by Yi Guixi et al. [5] and Dai et al. [54], which also highlight substantial differences in seismic mechanisms and deformation characteristics within this area. This may be attributed to the southern margin of the Sichuan Basin being situated in a transition zone of tectonic deformation modes, leading to a complex array of source mechanism solutions due to varying tectonic environments [3].
Region B is characterized by a dominance of the reverse type, with a minor normal component (Figure 5b), while Region C is primarily composed of reverse-type earthquakes, albeit with a concurrent presence of a small number of strike-slip events (Figure 5c). The main focal mechanism types in each region align with the findings of previous classifications based on smaller sample sizes [7,55]. However, our analysis, which is based on a larger sample size, reveals a more nuanced depiction of focal mechanism solution types in each region, suggesting the involvement of multiple faults in the rupture process rather than a single fault or a few.

4.2. Stress Field Spatial Characteristics

The determination of stress-field orientation through the analysis of earthquake focal mechanisms serves as a critical tool for comprehending crustal mechanics and seismological phenomena [55]. The inversion process yields the orientations of the three principal stress axes and the relative stress magnitude, R, which is calculated using the following equation:
R = 1σ2)/(σ1σ3)
in which σ1~σ3 are the magnitudes of the three principal stress axes obtained from the deviatoric stress tensor. The relative stress magnitude quantifies whether the magnitude of the intermediate principal stress σ2 is closer to the magnitude of the most compressive (σ1) or the least compressive principal stress (σ3).
Concurrently, to investigate the spatial distribution characteristics of the regional stress field in southeastern Sichuan, we conducted an inversion and analysis of the regional stress field utilizing MSATSI software (Version 1.0.9) [56,57], based on the focal mechanism solutions obtained from our study.
The inversion results indicate that the comprehensive stress fields of the three regions share some common features (Figure 5), such as the near-horizontal maximum principal stress axis σ1(with a plunge close to 0°) and the near-vertical minimum principal stress axis σ3 (with a plunge close to 90°). According to the classification criteria of Zoback [58], this region is controlled by nearly horizontal extrusion, and the seismogenic structures are dominated by thrust faulting, consistent with the classification result of the last section.
Subtle variations in stress orientations are observed across different regions. Region B, positioned in the northern segment of the study area (Figure 5b), exhibits a σ1 orientation that corresponds with the principal compressive stress field direction of the Sichuan Basin, as depicted in the stress map by Wang et al. [59] and the velocity direction of GNSS stations [59]. This stress direction is a legacy of the southeastward escape of the Tibetan Plateau [60], which exerts a compressive force in the northwest–southeast direction on the Sichuan Basin. Conversely, Region A, located in the southern part of the study area (Figure 5a), features a σ1 orientation that is more aligned with the east–west direction. In situ borehole stress measurements, as reported by Tang et al. [61], indicate that the σ1 orientation in Region A is counterclockwise-rotated relative to the background stress field of the Sichuan Basin, implying that a perturbation superimposed on the regional stress field has influenced the local stress orientation. For Region C, Figure 5c illustrates that the principal stress axes are dispersed during the bootstrap resampling process. This dispersion is generally attributed to an insufficient number of samples, which leads to unstable constraints. Consequently, we refrain from a detailed analysis of the stress field directionality in this region.
To delineate the finer spatial characteristics of the stress field within the study area, we implemented a mesh grid with a resolution of 0.1° and conducted a statistical sampling of seismic mechanism solutions within a window of 0.2°. MSATSI software was utilized for 2D stress field inversion, as it provides a well-established and robust framework for resolving discontinuities and ambiguities in the inverted stress field directions, a challenge commonly encountered in traditional inversion algorithms. MSATSI also allows for precise control over model complexity through its damping parameter, enabling an optimal balance between residual minimization and solution stability, as shown by the trade-off curve in Figure 6. These features make MSATSI a suitable and effective choice for capturing finer details of stress variability in seismically active regions.
Utilizing MSATSI software, we performed a 2D stress field inversion. The trade-off curve depicted in Figure 6 indicates that an optimal balance between model complexity and data fitting residuals is achieved with a damping parameter e value of 1.4.
Subsequently, we obtained the spatial distribution of the stress field across the southern Sichuan Basin, as presented in Figure 7. The inversion outcomes for the maximum horizontal stress (σHmax) exhibit consistency with the results from individual area analyses. In the northern segment of the study area, the stress orientation trends WNW-ESE, aligning with the principal compressive stress field of the Sichuan Basin and the velocity direction of the GNSS stations in this region. Conversely, the principal stress field in the southern segment aligns nearly east–west, displaying a counterclockwise rotation relative to the background principal compressive stress field direction.
Furthermore, we identified spatial variations in the distribution of earthquakes with distinct focal mechanisms. As previously discussed in the section on focal mechanism solution classification, Region A is predominantly characterized by reverse and strike-slip earthquakes. Figure 7 elucidates that reverse earthquakes are predominantly clustered in the northern part of Region A, whereas strike-slip events are concentrated in its southeastern quadrant.

4.3. Mohr Circles

According to the Mohr–Coulomb damage criterion [62,63,64], on an activated fault, the shear traction must exceed the critical value τc, which is calculated from the cohesion C, fault friction μ, compressive normal traction σn, and pore pressure p as
τc = C + μ(σnp)
In the context of Mohr’s circle, the Mohr–Coulomb failure criterion is represented by a straight line with a slope of μ. A fault surface that extends beyond this line meets the conditions for failure, as defined by the Mohr–Coulomb criterion. Vavryčuk et al. [65] introduced the concept of fault instability, where an increase in fault instability signifies that the fault plane is closer to the periphery of the Mohr’s circle. Concurrently, an increase in pore pressure p results in a rightward shift of the Mohr–Coulomb failure line, intersecting a more central region of the Mohr circle. This shift implies that elevated pore pressure diminishes the stress requirements for seismic rupture to occur. Consequently, earthquakes associated with fault surfaces located within the inner region of the Mohr’s circle are indicative of the influence of pore pressure on the faulting process.
Drawing upon the theoretical framework outlined above, we utilized the Mohr’s circles derived from the inversion of STRESSINVERSE [66] for various regions in southeastern Sichuan (Figure 8). Our analysis reveals that Regions A and B share similar stress shape ratios and distributions of fault planes. However, Region A is distinguished by a higher concentration of fault planes situated within the Mohr’s circle. Through statistical evaluation, we determined that the proportions of fault planes located outside the Mohr–Coulomb failure criterion line are 40% for Region A and 60% for Region B. This finding suggests that Region B exhibits a higher level of fault instability relative to Region A, where the initiation of fault rupture is predominantly influenced by pore pressure.
In light of the potential uncertainties associated with inversion results due to limited sampling data, we elected not to interpret the characteristics of the Mohr’s circle for Region C at this juncture. We plan to pursue a more comprehensive analysis in this domain once a sufficient dataset has been assembled for further investigation.

5. Discussion

The inversion results of the full moment tensor for earthquakes occurring in southeastern Sichuan indicate that a significant number of these seismic events feature a pronounced proportion of non-double-couple (non-DC) components, necessitating further inquiry into their origins. The relatively shallow focal depths (<5 km), the strong anisotropy in the near-surface velocity structure [67], and the extensive fracturing within the shallow crust [6] in the region may all contribute to the increased non-DC components. Nevertheless, we suggest that fluid activity is a pivotal factor in this occurrence. This hypothesis is substantiated by several key observations: the earthquake source locations show a strong spatial correlation with the locations and operational depths of the fluid injection wells involved in shale gas extraction [4]; there is compelling evidence of fluid infiltration in the shallow velocity structures [67]; and both experimental and theoretical research confirm that shale dissolution during seismic events results in a decrease in source volume, which aligns with the higher negative isotropic (ISO) component identified in our computed full moment tensors. Furthermore, both Regions A and B exhibit pore pressure signatures within their respective Mohr circles. These collective findings imply that fluid activities exert direct or indirect influences on the emergence of non-DC components in the study area.
The prevalence of thrust faulting activity in the study area is anticipated, given that the Sichuan Basin, located within the stable Yangtze Platform, is subject to compressional forces emanating from the Tibetan Plateau. Within the basin, a network of NE-SW trending faults has formed, aligning with the Longmen Shan Fault Zone. Some studies suggest that these faults might be continuations of the Longmen Shan thrust structures into the basin, potentially linked by a common detachment surface at greater depths [68]. However, due to the differential slip rates along various segments of these faults, new structures akin to “transform faults” have developed, orienting perpendicular to the main fault strike. These structures appear to accommodate stress release associated with the varying slip velocities. In the context of an overall NW-SE oriented tectonic stress field, the structural elements parallel to the Longmen Shan Fault Zone exhibit thrust faulting characteristics, whereas those oriented perpendicular to it display strike-slip faulting traits.
In the study area, two distinct regions, A and B, are situated at the northern and southern extremities, respectively. A comparison of the stress fields in these regions reveals two primary differences:
Firstly, Region B, located to the north, aligns with the orientation of the maximum horizontal stress (σHmax) observed across the Sichuan Basin. In contrast, Region A, to the south, exhibits a noticeable counterclockwise rotation from this common orientation. This discrepancy suggests that Region B adheres to the sliding rupture assumption under a uniform stress field [69,70], while Region A does not conform to this model. The extensive hydraulic fracturing operations for shale gas extraction in Region A may lead to stress transfer due to high-pressure fluid injection, potentially creating new resultant forces that interact with the existing background stress field [71], thereby modifying the regional stress field direction. However, this raises a conundrum, as similar shale gas extraction activities in Region B have not induced comparable alterations.
A plausible explanation for this discrepancy may be attributed to the spatial heterogeneity in the background stress levels within the basin. The tectonic forces exerted by the Tibetan Plateau generate a notable stress gradient across the Sichuan Basin. In situ stress measurements indicate that the maximum horizontal principal stress in Region B, which is closer to the Tibetan Plateau, reaches approximately 130 MPa [72], while in Region A, located at a greater distance, this value is around 112 MPa [73]. These data suggest that Region A, with its relatively lower background stress levels, is more susceptible to stress field deflection under the influence of equivalent stress perturbations.
The stress gradient within the Sichuan Basin also provides insight into the second major difference between Regions A and B, namely, the variations in their seismicity patterns as indicated by their respective Mohr circles. In Region B, where the background stress level is higher, stress perturbations are more likely to precipitate rupture in unstable faults. Conversely, in Region A, the lower background stress level, in conjunction with the injection of high-pressure fluids during shale gas extraction, facilitates more pronounced pore pressure changes, thereby increasing the likelihood of seismic events.

6. Conclusions

This research focuses on seismic cluster areas in the shale gas extraction regions of southeastern Sichuan. We computed moment tensor solutions for M ≥ 3.5 earthquakes using the GCAP method based on a regional three-dimensional velocity model. Meanwhile, using focal mechanism solutions for smaller earthquakes obtained via the HASH method, we classified the focal mechanisms with the FMC method and inverted the regional stress field using the MSATSI (Version 1.0.9) approach. Based on the above results and considering the interaction between fluids and faults, a comprehensive analysis was conducted on the characteristics of earthquake moment tensors and the stress field in southeastern Sichuan. Furthermore, the stress state and fluid interaction mechanisms in different subregions of southeastern Sichuan were discussed, leading to the following conclusions:
(1)
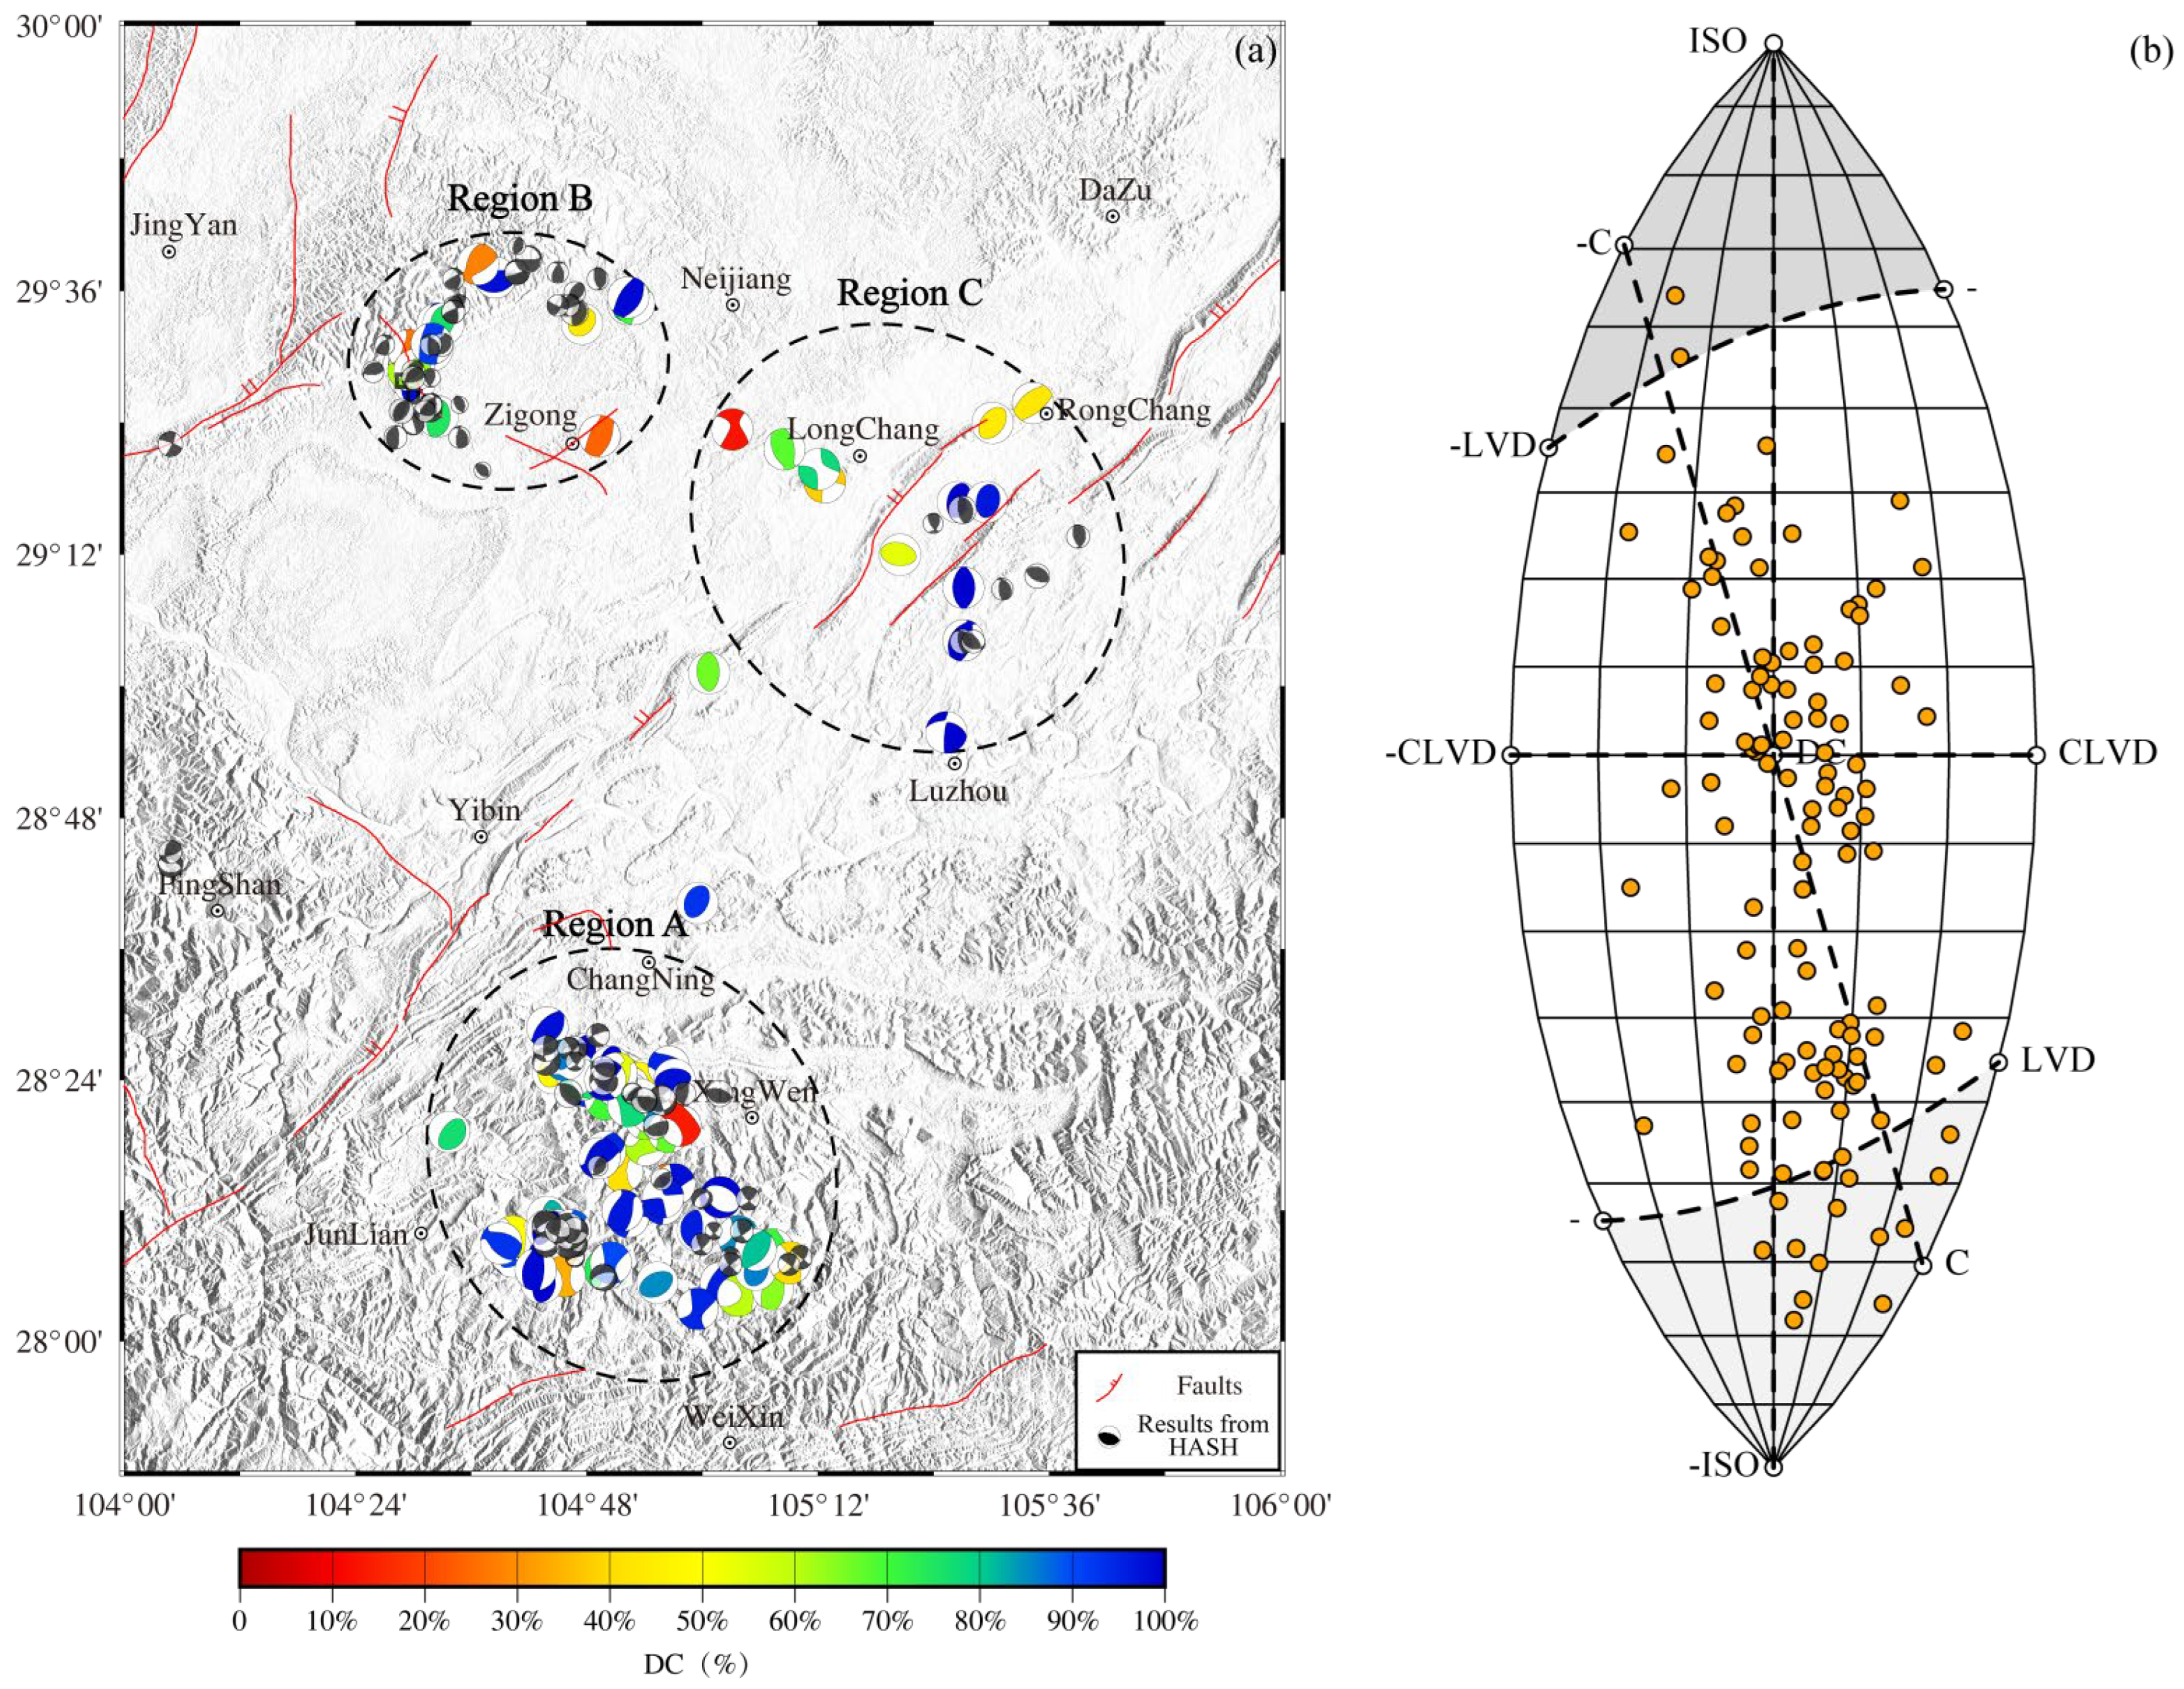
The seismic activity in the southeastern Sichuan region is predominantly characterized by double-couple (DC) mechanisms, indicating that shear faulting is the primary mode of fault movement, consistent with the typical features of tectonic earthquakes. However, some earthquake events still exhibit non-double-couple components, particularly negative isotropic (ISO) components. This is speculated to be related to fluid intrusion caused by hydraulic fracturing and water injection activities during shale gas extraction.
(2)
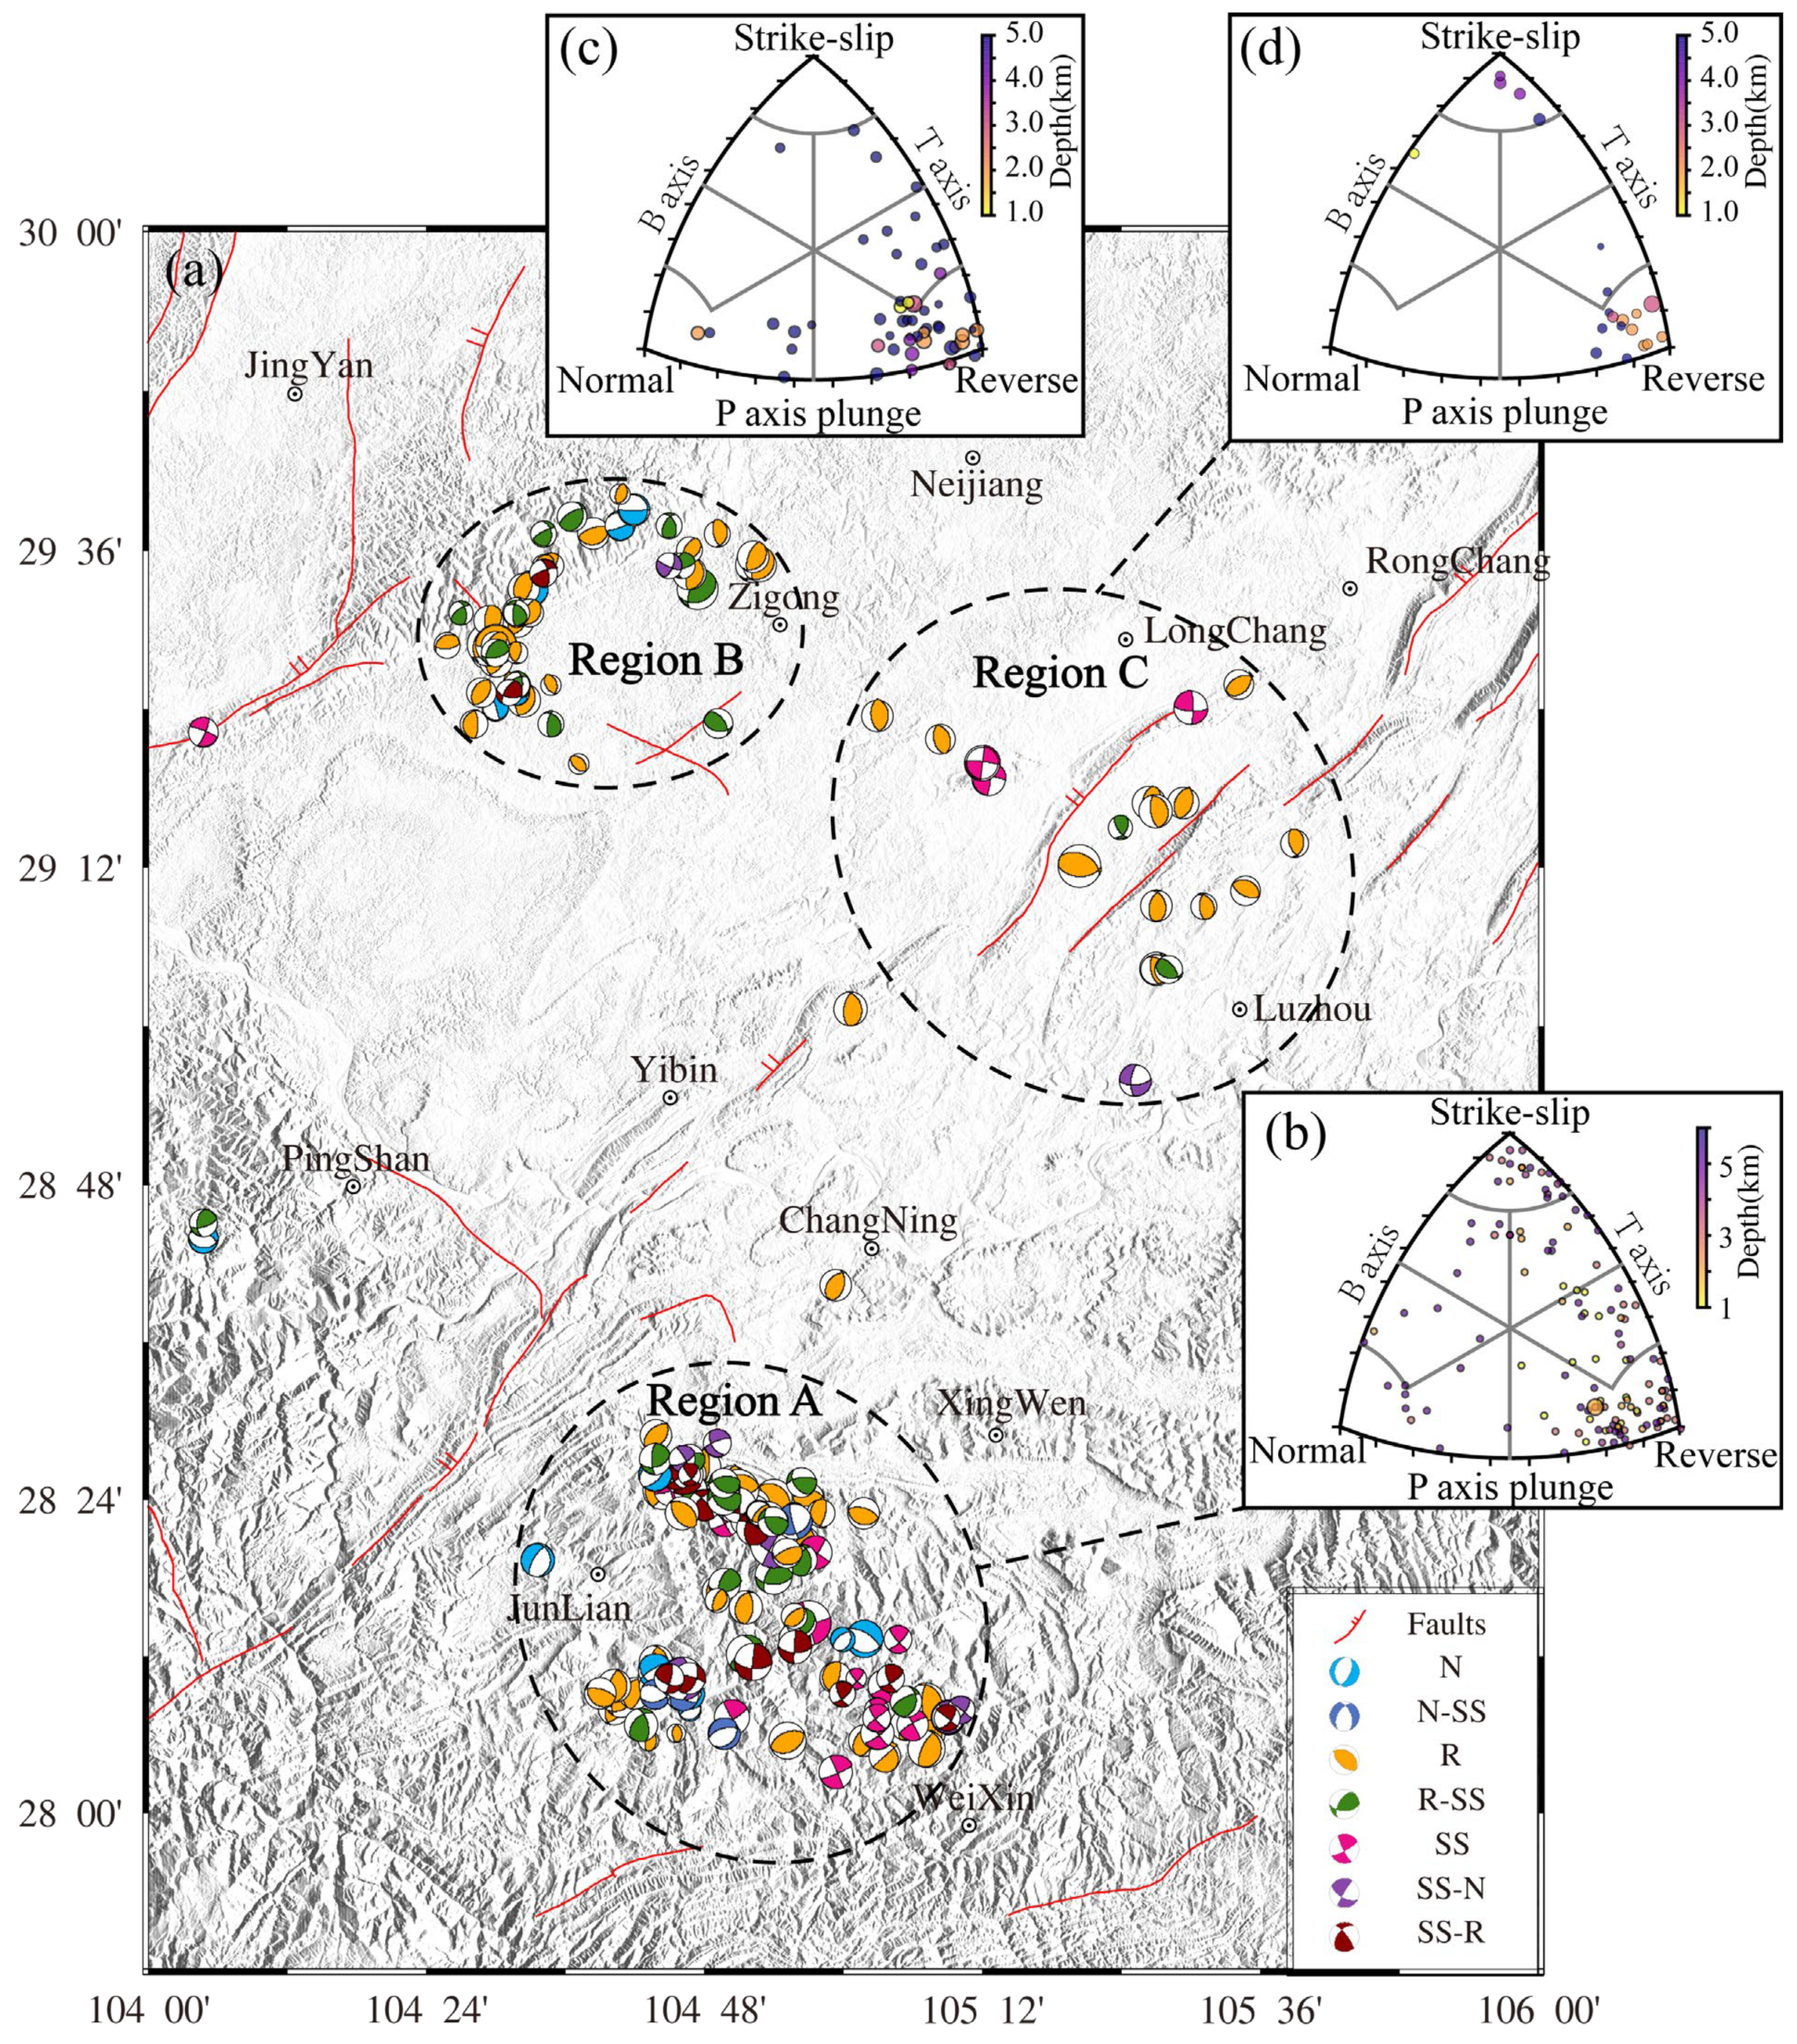
The focal mechanism solutions in the southeastern Sichuan region predominantly exhibit thrust faulting patterns (approximately 51%), followed by strike-slip mechanisms (about 11%), with normal faulting representing a minor proportion (around 7%). The remaining solutions correspond to mixed-type mechanisms. Significant spatial heterogeneity characterizes the distribution of seismic mechanism types. In region A, thrust and strike-slip mechanisms dominate while minor normal faulting and mixed-type solutions coexist. Region B primarily features thrust faulting with subordinate normal faulting components. Region C consists mainly of thrust-faulting earthquakes accompanied by occasional strike-slip events. The complexity of these mechanism solutions primarily reflects the involvement of multiple faults in seismic rupture processes rather than single or limited fault systems in the southeastern Sichuan region.
(3)
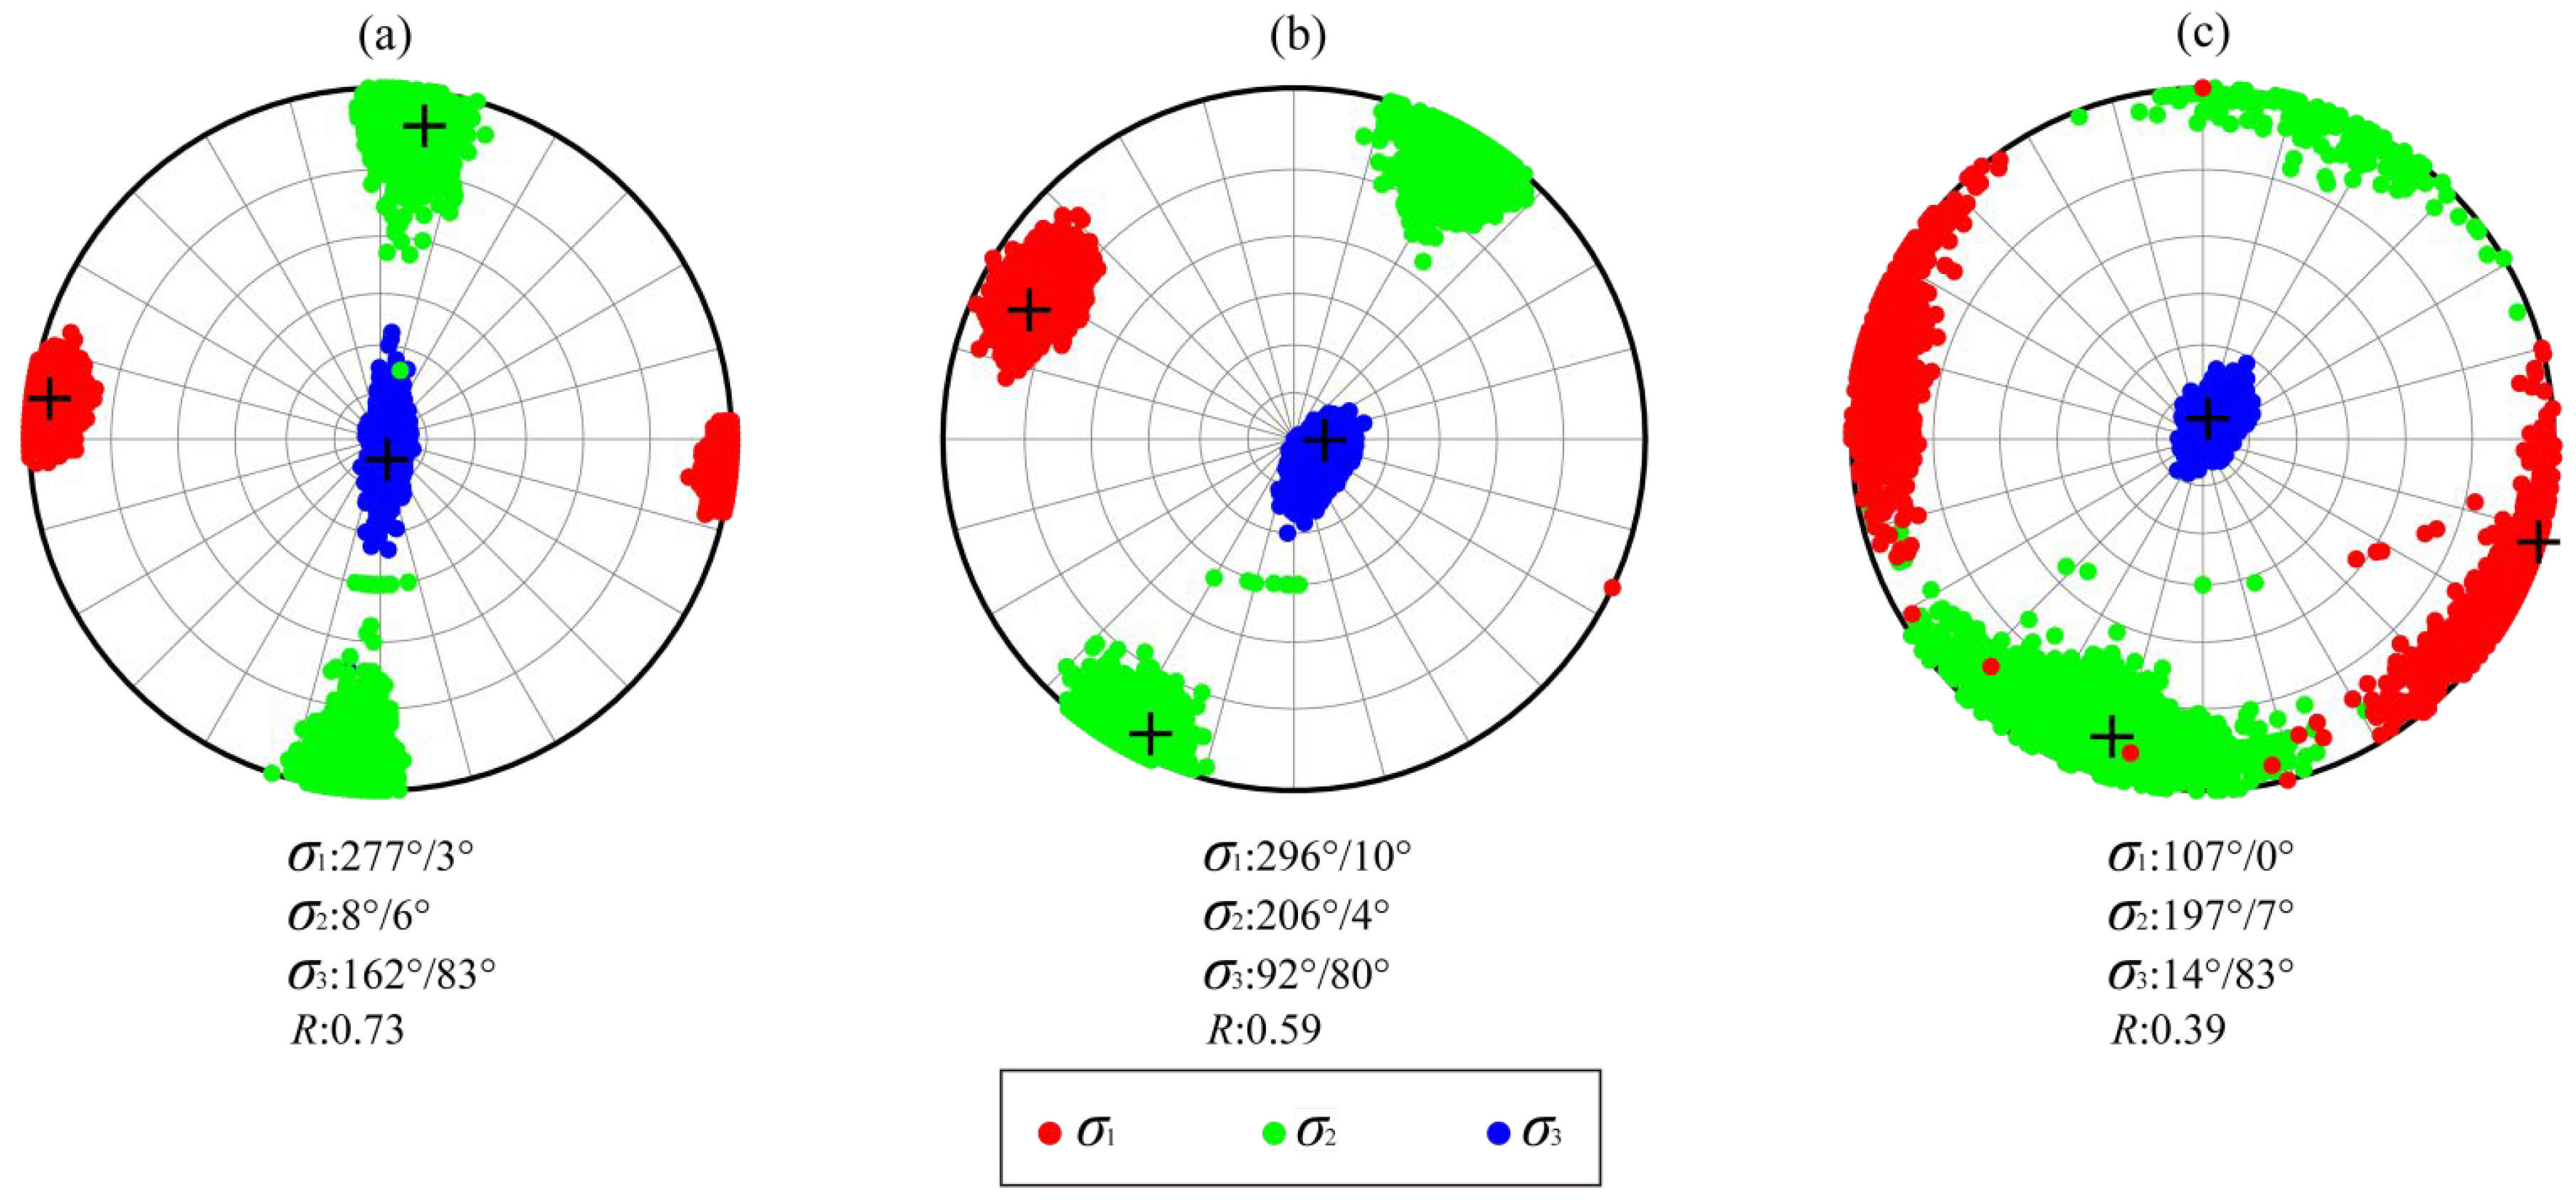
The stress field in southeastern Sichuan, determined through seismic focal mechanism solutions, demonstrates fundamental consistency in orientation across subregions, predominantly governed by near-horizontal compressional stress with thrust faulting as the principal seismogenic structure. Regional variations nevertheless emerge in stress orientations: the σ1 axis in the northern segment (Region B) trends WNW-ESE, aligning with both the principal compressive stress field of the Sichuan Basin and GNSS station velocity vectors, whereas the southern segment (Region A) exhibits an E-W oriented σ1 axis displaying counterclockwise rotation relative to the background principal compressive stress field. This rotational pattern indicates that superimposed perturbations on the regional stress field have modified local stress orientations in Area A.
(4)
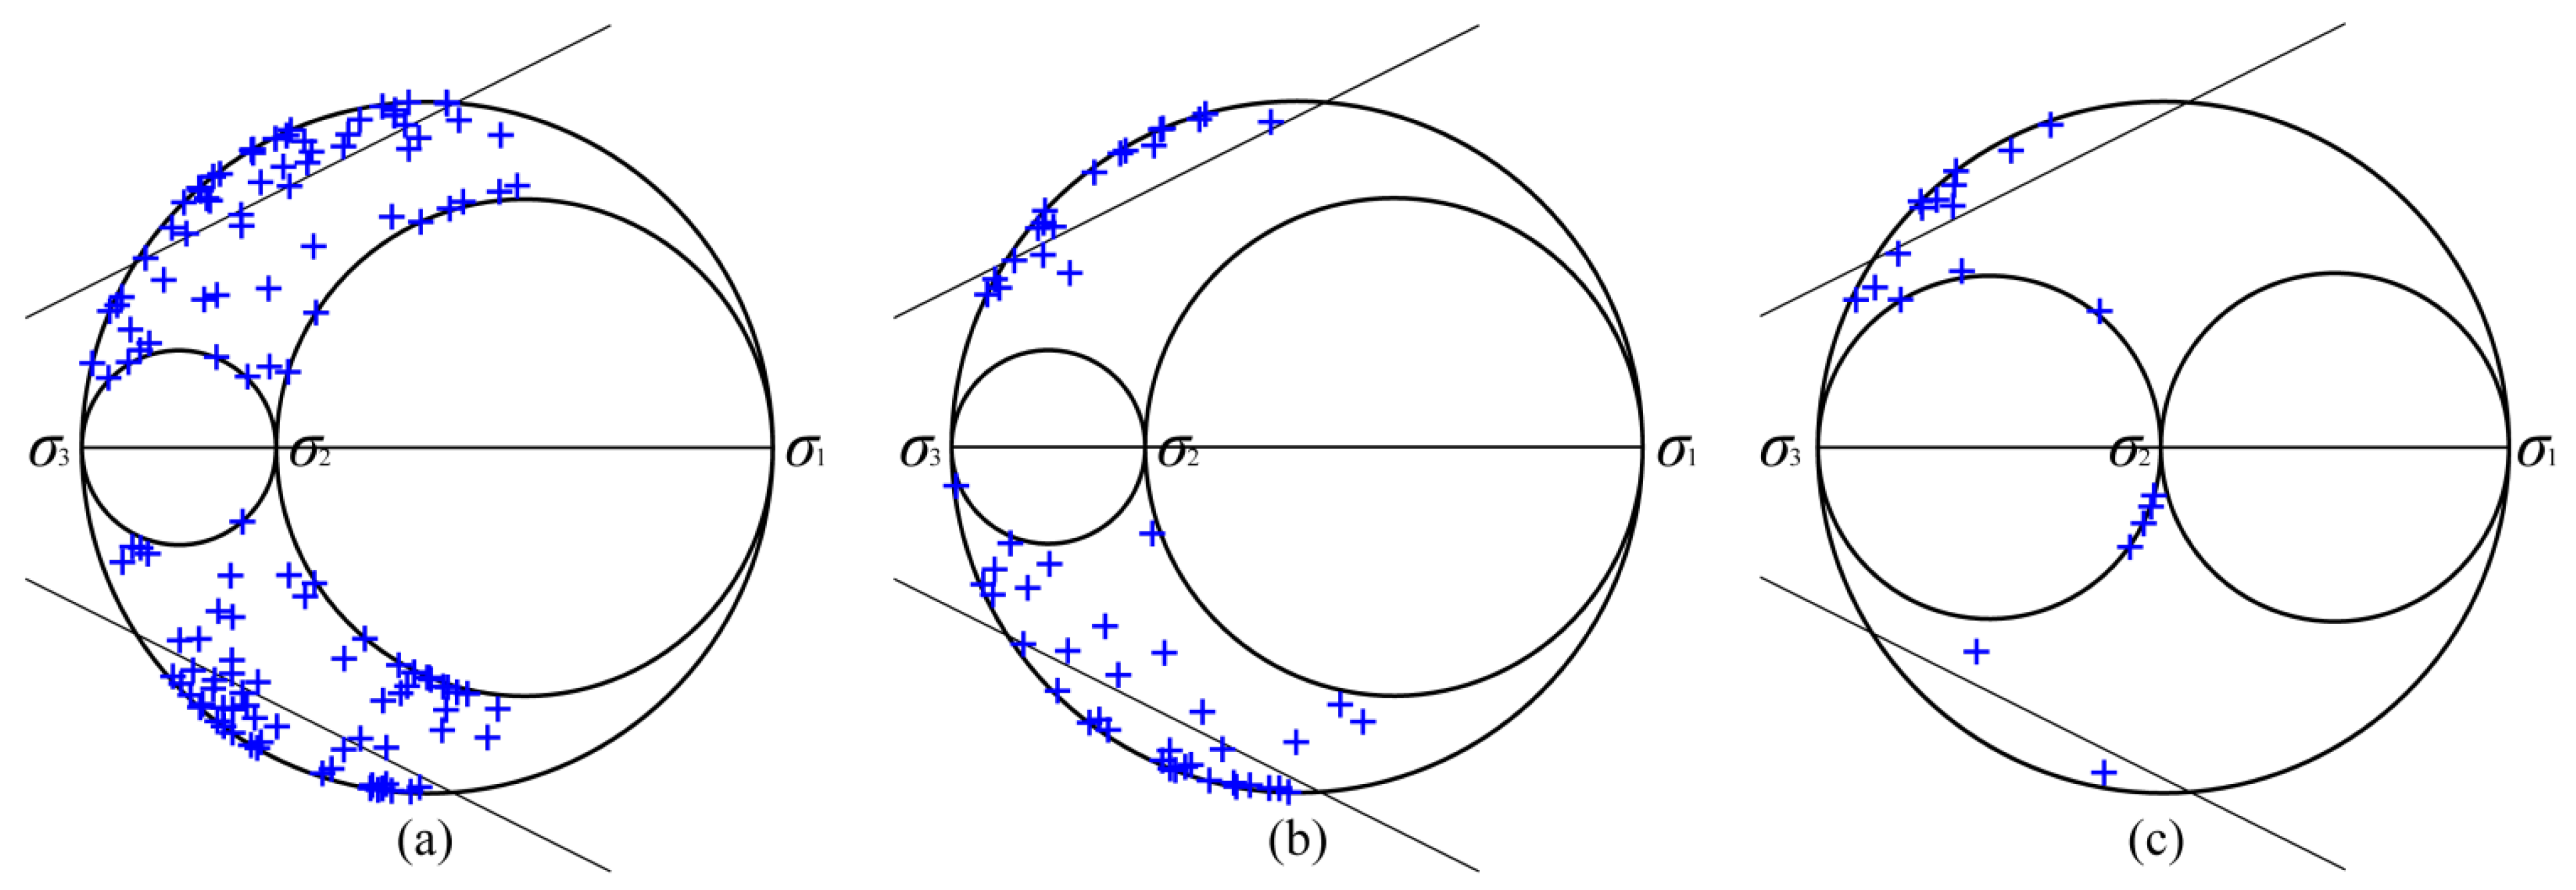
The inversion of Mohr circles using STRESSINVERSE software (Version 1.1.3) for subregions in southeastern Sichuan reveals that Areas A and B possess similar stress shape ratios and fault plane distributions. However, Region A exhibits a relatively higher proportion of fault planes located within Mohr circles compared to Region B. This observation indicates that Region B demonstrates higher levels of fault instability, whereas the initiation of fault ruptures in Region A is primarily controlled by pore pressure effects.
The above analysis indicates that the seismicity in southeastern Sichuan is generally characterized by thrust faulting governed by tectonic stress, while high-pressure fluid injection during shale gas extraction exerts a crucial influence on the non-double-couple component of earthquakes. Differences in the stress field and rupture mechanisms suggest that regional seismic activity is jointly controlled by the overall tectonic stress regime and pore pressure changes induced by local fluid processes. In areas with higher background stress levels, stress perturbations are more likely to trigger unstable fault rupture, whereas, in regions with lower background stress levels, the additional effect of high-pressure fluid injection during shale gas extraction causes more pronounced pore pressure changes, thereby increasing the likelihood of seismic events.
Although this study offers a relatively detailed investigation of the moment tensor and stress field characteristics in southeastern Sichuan, the limited number of earthquake samples in the Luxian region (Region C) introduces some uncertainties. As seismic activity increases and observational data accumulate in that area, further studies will be necessary. In addition, obtaining detailed fluid injection parameters (such as volume, pressure, and rate) and quantitatively analyzing the precise spatiotemporal relationships and dynamic processes between hydraulic fracturing and seismic activity will provide important support for developing more targeted monitoring and preventive measures in shale gas extraction zones.

Author Contributions

Conceptualization, F.L. and M.Z.; methodology, F.L. and M.Z.; software, F.L. and M.Z.; validation, L.P., M.Z., Y.Q., X.R., D.W. and C.H.; formal analysis, F.L. and M.Z.; investigation, M.Z., L.P. and F.L.; resources, F.L. and M.Z.; data curation, Y.Q., M.Z., C.H., X.R. and D.W.; writing—original draft preparation, F.L. and M.Z.; writing—review and editing, M.Z. and L.P.; visualization, L.P. and M.Z.; supervision, F.L. All authors have read and agreed to the published version of the manuscript.

Funding

This study was supported by the Spark Program of Earthquake Sciences (No. XH23033A).

Institutional Review Board Statement

Not applicable.

Informed Consent Statement

Not applicable.

Data Availability Statement

The original contributions presented in this study are included in the article. Further inquiries can be directed to the corresponding author.

Acknowledgments

We sincerely thank the three anonymous reviewers for their valuable comments and suggestions, as well as their patience during the review process, which greatly improved the quality of this manuscript. We also extend our heartfelt gratitude to the Strong Earthquake Numerical Prediction Team for their generous support and assistance throughout this work. Their contributions have been instrumental in the successful completion of this study.

Conflicts of Interest

The authors declare no conflicts of interest.

References

  1. Burchfiel, B.C.; Royden, L.H.; Van Der Hilst, R.D.; Hager, B.H.; Chen, Z.; King, R.W.; Li, C.; Lü, J.; Yao, H.; Kirby, E. A geological and geophysical context for the Wenchuan earthquake of 12 May 2008, Sichuan, People’s Republic of China. GSA Today 2008, 18, 4–11. [Google Scholar] [CrossRef]
  2. Zhang, P.Z.; Xu, X.W.; Wen, X.Z.; Ran, Y.K. Slip Rates and Recurrence Intervals of the Longmen Shan Active Fault Zone, and Tectonic Implications for the Mechanism of the May 12 Wenchuan Earthquake, 2008, Sichuan, China. Chin. J. Geophys. 2008, 51, 1066–1073. (In Chinese) [Google Scholar]
  3. Lei, X.; Wang, Z.; Su, J. The December 2018 ML 5.7 and January 2019 ML 5.3 earthquakes in South Sichuan Basin induced by shale gas hydraulic fracturing. Seismol. Res. Lett. 2019, 90, 1099–1110. [Google Scholar] [CrossRef]
  4. Lei, X.; Su, J.; Wang, Z. Growing seismicity in the Sichuan Basin and its association with industrial activities. Sci. China Earth Sci. 2020, 63, 1633–1660. [Google Scholar] [CrossRef]
  5. Yi, G.X.; Long, F.; Liang, M.J.; Zhao, M.; Wang, S.W.; Gong, Y.; Qiao, H.Z.; Su, J.R. Focal mechanism solutions and seismogenic structure of the 17 June 2019 MS6.0 Sichuan Changning earthquake sequence. Chin. J. Geophys. 2019, 62, 3432–3447. (In Chinese) [Google Scholar] [CrossRef]
  6. Yi, G.X.; Long, F.; Liang, M.J.; Zhao, M.; Wang, S.W. Geometry and tectonic deformation of seismogenic structures in the Rongxian-Weiyuan-Zizhong region, Sichuan Basin: Insights from focal mechanism solutions. Chin. J. Geophys. 2020, 63, 3275–3291. (In Chinese) [Google Scholar] [CrossRef]
  7. Yi, G.X.; Zhao, M.; Long, F.; Liang, M.J.; Wang, M.M.; Zhou, R.J.; Wang, S.W. Characteristics of the seismic sequence and seismogenic environment of the MS6.0 Sichuan Luxian earthquake on September 16, 2021. Chin. J. Geophys. 2021, 64, 4449–4461. (In Chinese) [Google Scholar] [CrossRef]
  8. GB 18306-2015; General Administration of Quality Supervision, Inspection and Quarantine of the People’s Republic of China (AQSIQ); Standardization Administration of China (SAC). Seismic Ground Motion Parameter Zonation Map of China; Standards Press of China: Beijing, China, 2015. (In Chinese)
  9. Shao, Z.G. Earthquake Cases in China (Volume for Year 2019); Seismological Press: Beijing, China, 2022. (In Chinese) [Google Scholar]
  10. Li, P.P.; Jiang, P.; Li, T.L.; Ma, K.X.; Wen, R.Z.; Su, J.R.; Jiang, W.S. The strong ground motion characteristics of MS6.0 Luxian, Sichuan, earthquake on 16 September 2021. Acta Seismol. Sin. 2022, 44, 260–270. (In Chinese) [Google Scholar] [CrossRef]
  11. King, G.C.P.; Stein, R.S.; Lin, J. Static stress changes and the triggering of earthquakes. Bull. Seismol. Soc. Am. 1994, 84, 935–953. [Google Scholar]
  12. Stein, R.S. The role of stress transfer in earthquake occurrence. Nature 1999, 402, 605–609. [Google Scholar] [CrossRef]
  13. Harris, R.A. Introduction to special section: Stress triggers, stress shadows, and implications for seismic hazard. J. Geophys. Res. Solid Earth 1998, 103, 24347–24358. [Google Scholar] [CrossRef]
  14. Toda, S.; Lin, J.; Meghraoui, M.; Stein, R.S. 12 May 2008 M = 7.9 Wenchuan, China, earthquake calculated to increase failure stress and seismicity rate on three major fault systems. Geophys. Res. Lett. 2008, 35, L17305. [Google Scholar] [CrossRef]
  15. Parsons, T.; Ji, C.; Kirby, E. Stress changes from the 2008 Wenchuan earthquake and increased hazard in the Sichuan basin. Nature 2008, 454, 509–510. [Google Scholar] [CrossRef]
  16. Qian, Q.; Han, Z.Z. The research in the change of the earthquake occurrence probability in Longquan Shan fault after the Wenchuan earthquake. Prog. Geophys. 2011, 26, 489–497. (In Chinese) [Google Scholar] [CrossRef]
  17. Meng, L.; McGarr, A.; Zhou, L.; Zang, Y. An investigation of seismicity induced by hydraulic fracturing in the Sichuan Basin of China based on data from temporary seismic network. Bull. Seismol. Soc. Am. 2019, 109, 348–357. [Google Scholar] [CrossRef]
  18. Lei, X.; Huang, D.; Su, J.; Jiang, G.; Wang, X.; Wang, H.; Guo, X.; Fu, H. Fault reactivation and earthquakes with magnitudes of up to Mw4.7 induced by shale-gas hydraulic fracturing in Sichuan Basin, China. Sci. Rep. 2017, 7, 7971. [Google Scholar] [CrossRef]
  19. Long, F.; Du, F.; Ruan, X.; Deng, Y.; Zhang, T. Water injection triggered earthquakes in the Zigong mineral wells in ETAS model. Earthq. Res. China 2010, 26, 164–171. (In Chinese) [Google Scholar]
  20. Ellsworth, W.L. Injection-induced earthquakes. Science 2013, 341, 1225942. [Google Scholar] [CrossRef]
  21. Schultz, R.; Atkinson, G.; Eaton, D.W.; Gu, Y.J.; Kao, H. Hydraulic fracturing volume is associated with induced earthquake productivity in the Duvernay play. Science 2018, 359, 304–308. [Google Scholar] [CrossRef]
  22. Geological Society of Korea. Summary Report on Pohang Earthquake; Geological Society of Korea: Seoul, Republic of Korea, 2019; Available online: https://www.gskorea.or.kr/custom/27/data/Summary_Report_on_Pohang_Earthquake_March_20_2019.pdf (accessed on 9 February 2025).
  23. Lavecchia, G.; de Nardis, R.; Costa, G.; Tiberi, L.; Ferrarini, F.; Cirillo, D.; Brozzetti, F.; Suhadolc, P. Was the Mirandola thrust really involved in the Emilia 2012 seismic sequence (northern Italy)? Implications on the likelihood of triggered seismicity effects. Bull. Geophys. Theor. Appl. 2015, 56, 461–488. [Google Scholar] [CrossRef]
  24. Molnar, P.H.; Tapponnier, P. Cenozoic tectonics of Asia: Effects of a continental collision. Science 1975, 189, 419–426. [Google Scholar] [CrossRef]
  25. Yin, A.; Harrison, T.M. Geologic evolution of the Himalayan-Tibetan orogen. Annu. Rev. Earth Planet. Sci. 2000, 28, 211–280. [Google Scholar] [CrossRef]
  26. Chen, S.F.; Wilson, C.; Deng, Q.D.; Zhao, X.L.; Zhi, L.L. Active faulting and block movement associated with large earthquakes in the Min Shan and Longmen Mountains, northeastern Tibetan plateau. J. Geophys. Res. 1994, 99, 24025–24038. [Google Scholar] [CrossRef]
  27. Burchfiel, B.C.; Chen, Z.L.; Liu, Y.; Royden, L.H. Tectonics of the Longmen Shan and adjacent regions, Central China. Int. Geol. Rev. 1995, 37, 661–735. [Google Scholar] [CrossRef]
  28. Kirby, E.; Reiners, P.W.; Krol, M.A.; Whipple, K.X.; Hodges, K.V.; Farley, K.A.; Tang, W.; Chen, Z. Late Cenozoic evolution of the eastern margin of the Tibetan Plateau: Inferences from 40Ar/39Ar and (U-Th)/He thermochronology. Tectonics 2002, 21, 1001. [Google Scholar] [CrossRef]
  29. Xiong, X.S.; Gao, R.; Guo, L.H.; Wang, H.Y.; Jiang, W.W. The deep structure feature of the Sichuan Basin and adjacent orogens. Acta Geol. Sin. 2015, 89, 1153–1164. [Google Scholar] [CrossRef]
  30. Zhang, P.Z.; Shen, Z.; Wang, M.; Gan, W.; Bürgmann, R.; Molnar, P.; Wang, Q.; Niu, Z.; Sun, J.; Wu, J.; et al. Continuous deformation of the Tibetan Plateau from global positioning system data. Geology 2004, 32, 809–812. [Google Scholar] [CrossRef]
  31. Wang, M.; Shen, Z.K. Present-day crustal deformation of continental China derived from GPS and its tectonic implications. J. Geophys. Res. Solid Earth 2020, 125, e2019JB018774. [Google Scholar] [CrossRef]
  32. Bureau of Geology and Mineral Resources of Sichuan Province. Regional Geology of Sichuan Province; Geological Publishing House: Beijing, China, 1991. (In Chinese) [Google Scholar]
  33. Guo, Z.W.; Deng, K.L.; Han, Y.H. Formation and Evolution of the Sichuan Basin; Geological Publishing House: Beijing, China, 1996. (In Chinese) [Google Scholar]
  34. Jost, M.L.; Herrmann, R.B. A student’s guide to and review of moment tensors. Seismol. Res. Lett. 1989, 60, 37–57. [Google Scholar] [CrossRef]
  35. Aki, K.; Richards, P.G. Quantitative Seismology: Theory and Methods, 2nd ed.; University Science Books: Sausalito, CA, USA, 2002; ISBN 978-0935702965. [Google Scholar]
  36. McGarr, A. An implosive component in the seismic moment tensor of a mining-induced tremor. Geophys. Res. Lett. 1992, 19, 1579–1582. [Google Scholar] [CrossRef]
  37. Frohlich, C. Earthquakes with Non-double-couple Mechanisms. Science 1994, 264, 804–809. [Google Scholar] [CrossRef] [PubMed]
  38. Ross, A.; Foulger, G.R.; Julian, B.R. Non-Double-Couple Earthquake Mechanisms at the Geysers Geothermal Area, California. Geophys. Res. Lett. 1996, 23, 877–880. [Google Scholar] [CrossRef]
  39. Dreger, D.S.; Ford, S.R.; Walter, W.R. Source Analysis of the Crandall Canyon. Science 2008, 321, 217–219. [Google Scholar] [CrossRef]
  40. Evans, K.F.; Zappone, A.; Kraft, T.; Deichmann, N.; Moia, F. A survey of the induced seismic responses to fluid injection in geothermal and CO2 reservoirs in Europe. Geothermics 2012, 41, 30–54. [Google Scholar] [CrossRef]
  41. Wang, R.; Gu, Y.J.; Schultz, R.; Zhang, M.; Kim, A. Faults and non-double-couple components for induced earthquakes. Geophys. Res. Lett. 2018, 45, 8966–8975. [Google Scholar] [CrossRef]
  42. Zhu, L.; Ben-Zion, Y. Parametrization of general seismic potency and moment tensors for source inversion of seismic waveform data. Geophys. J. Int. 2013, 194, 839–843. [Google Scholar] [CrossRef]
  43. Liu, Y.; Yu, Z.; Zhang, Z.; Yao, H.; Wang, W.; Zhang, H.; Fang, H.; Fang, L. The high-resolution community velocity model V2.0 of southwest China, constructed by joint body and surface wave tomography of data recorded at temporary dense arrays. Sci. China Earth Sci. 2023, 66, 2368–2385. [Google Scholar] [CrossRef]
  44. Zhu, L.; Rivera, L.A. A note on the dynamic and static displacements from a point source in multilayered media. Geophys. J. Int. 2002, 148, 619–627. [Google Scholar] [CrossRef]
  45. Tape, W.; Tape, C. A Geometric Comparison of Source-Type Plots for Moment Tensors. Geophys. J. Int. 2012, 190, 499–510. [Google Scholar] [CrossRef]
  46. Cesca, S.; Grigoli, F. Discrimination of Induced Seismicity by Full Moment Tensor Inversion and Decomposition. J. Seismol. 2015, 19, 147–163. [Google Scholar] [CrossRef]
  47. Song, C.H.; Lu, C.P.; Liu, H.Q.; Song, J.F.; Liu, C.Y.; Cui, H.W.; Zhang, J.R. Moment Tensor and Stress Field Inversions of Mining-Induced Seismicity in a Thick-Hard Roof Zone. Rock Mech. Rock Eng. 2024, 57, 2267–2287. [Google Scholar] [CrossRef]
  48. Collins, D.S.; Pettitt, W.S.; Young, R.P. High-Resolution Mechanics of a Microearthquake Sequence. In The Mechanism of Induced Seismicity; Trifu, C.I., Ed.; Birkhäuser: Basel, Switzerland, 2002; pp. 193–208. [Google Scholar] [CrossRef]
  49. Grigoli, F.; Cesca, S.; Rinaldi, A.P.; Manconi, A.; Lopez-Comino, J.A.; Clinton, J.F.; Westaway, R.; Cauzzi, C.; Dahm, T.; Wiemer, S. The November 2017 Mw 5.5 Pohang Earthquake: A Possible Case of Induced Seismicity in South Korea. Science 2018, 360, 1003–1006. [Google Scholar] [CrossRef]
  50. Foulger, G.R.; Julian, B.R. Non-Double-Couple Earthquakes. In Encyclopedia of Earthquake Engineering; Beer, M., Kougioumtzoglou, I., Patelli, E., Au, I.K., Eds.; Springer: Berlin/Heidelberg, Germany, 2015. [Google Scholar] [CrossRef]
  51. Dong, W.X.; Tian, J.; Chen, Q.; Zhang, X.; Liu, X.; Wang, F. Relationship between shale hydration and shale collapse. ACS Omega 2022, 7, 42913–42922. [Google Scholar] [CrossRef] [PubMed]
  52. Hardebeck, J.L.; Shearer, P.M. A new method for determining first-motion focal mechanisms. Bull. Seismol. Soc. Am. 2002, 92, 2264–2276. [Google Scholar] [CrossRef]
  53. Álz-Gómez, J.A. FMC-Earthquake focal mechanisms data management, cluster and classification. SoftwareX 2019, 9, 299–307. [Google Scholar] [CrossRef]
  54. Dai, J.; Liu, J.; Yang, J.; Xue, F.; Wang, L.; Shi, X.; Dai, S.; Hu, J.; Liu, C. Seismicity associated with hydraulic fracturing in Changning shale gas field, China: Constraints from source mechanisms, stress field and fluid overpressure thresholds. J. Rock Mech. Geotech. Eng. 2024; in press. [Google Scholar] [CrossRef]
  55. Cirillo, D.; Totaro, C.; Lavecchia, G.; Orecchio, B.; de Nardis, R.; Presti, D.; Ferrarini, F.; Bello, S.; Brozzetti, F. Structural complexities and tectonic barriers controlling recent seismic activity in the Pollino area (Calabria-Lucania, southern Italy)—Constraints from stress inversion and 3D fault model building. Solid Earth 2022, 13, 205–228. [Google Scholar] [CrossRef]
  56. Hardebeck, J.L.; Michael, A.J. Damped regional-scale stress inversions: Methodology and examples for southern California and the Coalinga aftershock sequence. J. Geophys. Res. Solid Earth 2006, 111, B11310. [Google Scholar] [CrossRef]
  57. Martínez-Garzón, P.; Kwiatek, G.; Ickrath, M.; Bohnhoff, M. MSATSI: A MATLAB package for stress inversion combining solid classic methodology, a new simplified user-handling and a visualization tool. Seismol. Res. Lett. 2014, 85, 896–904. [Google Scholar] [CrossRef]
  58. Zoback, M.L. First-and second-order patterns of stress in the lithosphere: The World Stress Map Project. J. Geophys. Res. Solid Earth 1992, 97, 11703–11728. [Google Scholar] [CrossRef]
  59. Wang, X.-S.; Lü, J.; Xie, Z.-J.; Long, F.; Zhao, X.-Y.; Zheng, Y. Focal mechanisms and tectonic stress field in the North-South Seismic Belt of China. Chin. J. Geophy.s 2015, 58, 4149–4162. (In Chinese) [Google Scholar] [CrossRef]
  60. England, P.; Molnar, P. Right-lateral shear and rotation as the explanation for strike-slip faulting in eastern Tibet. Nature 1990, 344, 140–142. [Google Scholar]
  61. Tang, R.; Li, J.X.; Luo, C. Differences in crustal stress direction in the southern section of the Huayingshan fault zone in Sichuan Basin: Insights from in situ borehole image logging. J. Geomech. 2024, 30, 547–562. [Google Scholar] [CrossRef]
  62. Beeler, N.M.; Simpson, R.W.; Hickman, S.H.; Lockner, D.A. Pore fluid pressure, apparent friction, and Coulomb failure. J. Geophys. Res. Solid Earth 2000, 105, 25533–25542. [Google Scholar] [CrossRef]
  63. Scholz, C.H. The Mechanics of Earthquakes and Faulting, 2nd ed.; Cambridge University Press: Cambridge, UK, 2002. [Google Scholar]
  64. Zoback, M.D. Reservoir Geomechanics; Cambridge University Press: Cambridge, UK, 2010. [Google Scholar]
  65. Vavryčuk, V.; Bouchaala, F.; Fischer, T. High-resolution fault image from accurate locations and focal mechanisms of the 2008 swarm earthquakes in West Bohemia, Czech Republic. Tectonophysics 2013, 590, 189–195. [Google Scholar] [CrossRef]
  66. Vavryčuk, V. Iterative joint inversion for stress and fault orientations from focal mechanisms. Geophys. J. Int. 2014, 199, 69–77. [Google Scholar] [CrossRef]
  67. Long, F.; Zhang, Z.W.; Qi, Y.P.; Liang, M.J.; Ruan, X.; Wu, W.W.; Jiang, G.M.; Zhou, L.Q. Three-dimensional velocity structure and accurate earthquake location in Changning–Gongxian area of southeast Sichuan. Earth Planet. Phys. 2020, 4, 163–177. [Google Scholar] [CrossRef]
  68. Tang, L.J.; Yang, K.M.; Jin, W.Z.; Lü, Z.; Yu, Y. Multi-level decollement zones and detachment deformation of Longmenshan thrust belt, Sichuan Basin, southwest China. Sci. China Ser. D-Earth Sci. 2008, 51 (Suppl. S2), 32–43. [Google Scholar] [CrossRef]
  69. Wallace, R.E. Geometry of shearing stress and relation to faulting. J. Geol. 1951, 59, 118–130. [Google Scholar] [CrossRef]
  70. Bott, M.H.P. The mechanics of oblique slip faulting. Geol. Mag. 1959, 96, 109–117. [Google Scholar] [CrossRef]
  71. Xu, X.-W.; Peters, S.G.; Liang, G.-H.; Zhang, B.-L. Elastic stress transmission and transformation (ESTT) by confined liquid: A new mechanics for fracture in elastic lithosphere of the earth. Tectonophysics 2016, 672–673, 129–138. [Google Scholar] [CrossRef]
  72. Huang, T.; Li, R.; Deng, H.; He, J.; Li, K.; Liu, Y.; Xiang, Z.; Du, Y.; Ye, T. Prediction and zoning evaluation of in-situ stress field in deep tight sandstone reservoirs of Western Sichuan Depression, Sichuan Basin: A case study of the second member of Xujiahe Formation in Xinchang and Fenggu area. Pet. Geol. Exp. 2024, 46, 1198–1214. [Google Scholar] [CrossRef]
  73. Deng, N.; Xu, H.; Deng, H.; He, J.; Liu, S.; Li, K.; Zheng, Z.; Sheng, L.; Song, W. Characteristics of fracture system disturbance on present-day geostress: An example of deep shale gas in the North Luzhou district, Sichuan Basin. Geol. China 2025, 52, 95–110. [Google Scholar] [CrossRef]
Figure 1. (a) Structural geological map and earthquake epicenters of the Sichuan Basin and its surroundings. Black triangles represent the entire seismic network available in the region, and green triangles indicate stations used in full moment tensor inversion. Active faults are shown in red, with fault kinematics marked. The dashed box highlights the study area containing three earthquake clusters (Regions A, B, and C), which are further analyzed in panels (b,c) and will be studied in the next sections. The red rectangle in the upper-right subplot illustrates the location of the Sichuan Basin and its surroundings. (b) Zoomed-in map of the study area (dashed box in panel (a)) showing the detailed seismicity distribution. Earthquake epicenters are colored by magnitude, and Regions A, B, and C are outlined in green. (c) Temporal evolution of seismicity in the study area from 2008. Blue curves represent the cumulative frequency of earthquakes, with different line styles indicating the entire study area and Regions A, B, and C. Stems show magnitudes with time.
Applsci 15 03881 g001
Figure 2. (a) Variance reduction with focal depth during the moment tensor inversion for an Ms3.6 event on 24 September 2021. The highest VR indicates the best centroid depth; the blue and green beach balls are derived from the 3-D and 1-D velocity models, respectively. (b) The full moment tensor results and the waveform fit diagram of the same event when its focal depth is 4 km based on the 3-D velocity model. Observed (black) and synthetic (red) waveforms for the station observations that were used to constrain the moment tensor inversion. The letters on the left represent station names. The numbers below the station names, separated by a “/”, represent the epicentral distance (in km) and azimuth (in degrees), respectively. Numbers below the waveforms are the time shifts (in s) in the synthetic waveforms relative to the observed waveforms (upper) and the cross-correlation coefficients (in %; lower). The FM at the top of the diagram represents the optimal double-couple solution, while Mw indicates the moment magnitude. MT refers to the full moment tensor solution for this seismic event, and the six numbers following MT correspond to the six parameters of the complete moment tensor solution (Mrr, Mtt, Mpp, Mrt, Mrp, Mtp).
Applsci 15 03881 g002
Figure 4. Map of focal mechanism types, colored by focal mechanism types classified by FMC. (a) shows the distribution of the double-couple component decomposed from the full moment tensor solutions of 118 earthquakes with magnitudes Ms ≥ 3.5. Insets (bd) illustrate detailed clustering analyses for Region A, Region B, and Region C, respectively.
Applsci 15 03881 g004
Figure 5. Principal stress axes inversion in different tectonic regions of southeastern Sichuan. (a) Region A: The σ1 axis exhibits a near-horizontal orientation trending approximately E-W. (b) Region B: The σ1 axis reflects NW-SE compression. (c) Region C: The inversion results show significant dispersion of the principal stress axes.
Applsci 15 03881 g005
Figure 6. The trade-off curve of the 2D stress field inversion of the study region. An optimal balance between model complexity and data misfit is achieved at a damping parameter e value of 1.4.
Applsci 15 03881 g006
Figure 7. Map of the maximum horizontal stress direction (σHmax). Blue arrows represent the directions of σHmax derived from the regional stress field inversion. The faulting regime is categorized by different colors: blue indicates thrust faulting, and green denotes strike-slip faulting. The red lines represent fault traces, and the thick black arrow shows the GNSS-derived velocity direction.
Applsci 15 03881 g007
Figure 8. Mohr circles for (a) Region A, (b) Region B, and (c) Region C. (a) Mohr circle for Region A with R = 0.7. (b) Mohr circle for Region B with R = 0.7. (c) Mohr circle for Region C with R = 0.5. The blue crosses indicate the fault planes, and the black lines denote the Mohr–Coulomb failure criterion. The Mohr–Coulomb failure criterion line is specified with a friction coefficient μ = 0.5. The circles represent the distributions of stress states, where each Mohr circle corresponds to the deviatoric stress tensor derived from focal mechanisms.
Applsci 15 03881 g008
Disclaimer/Publisher’s Note: The statements, opinions and data contained in all publications are solely those of the individual author(s) and contributor(s) and not of MDPI and/or the editor(s). MDPI and/or the editor(s) disclaim responsibility for any injury to people or property resulting from any ideas, methods, instructions or products referred to in the content.

