1. Introduction
Recent advancements have boosted demand for poultry products like meat and eggs. Meat ducks, valued for their high-quality proteins and fats [
1], grow faster than other poultry, quickly reaching market weight. Proper breeding density is critical for maximizing survival rates and barn space efficiency [
2], which are essential for large-scale production and animal welfare. Enhancing breeding efficiency requires real-time monitoring of density and effective management of duck populations. As large-scale breeding emerges as the predominant operational model within the industry, challenges arise when relying exclusively on manual labor for the management of duck houses and the control of breeding density. The need for human observation of extensive surveillance footage not only results in inefficiencies and a heavy reliance on the subjective judgment of personnel, lacking a standardized approach [
3]. This not only increases labor intensity and expenses but also poses a barrier to the advancement of the farming sector. By leveraging intelligent farming technologies grounded in deep learning algorithms, it is possible to elevate production efficiency through automation and smart decision-making support systems. These advancements facilitate precise calculation of optimal breeding densities and streamline farming processes. Consequently, while lowering labor costs, they contribute to an overall enhancement in productivity and economic returns [
4].
Girshick et al. [
5] introduced the R-CNN algorithm, marking a significant advancement in object detection. However, R-CNN was constrained by its requirement for fixed-size candidate regions, leading to slower detection speeds and substantial storage needs for region proposals. To address these limitations, Fast R-CNN [
6] and Faster R-CNN [
7] were subsequently developed. Fast R-CNN incorporated Spatial Pyramid Pooling (SPP) to accelerate processing, while Faster R-CNN introduced Region Proposal Networks (RPNs) to significantly boost both speed and detection accuracy.
In large-scale breeding, high poultry density often leads to occlusion and crowding. Traditional machine learning methods struggle to perform effectively under such conditions. Zhang et al. [
8] pioneered the use of deep learning for crowd counting with a multi-column convolutional neural network, marking the first application of this technique to counting tasks. Although object detection-based counting methods have demonstrated effectiveness, they require significant manual effort for bounding box annotation, which is both costly and time-consuming. In densely occluded real-world settings, these methods often produce inaccurate counts. To overcome these challenges, Cao et al. [
9] enhanced the point-supervised localization and counting method proposed by Laradji et al. [
10], aiming to enable real-time processing of camera-captured images. By using DenseNet, introduced by Huang et al. [
11], as the backbone network and employing point annotation instead of bounding boxes, their approach significantly reduces annotation time and boosts data processing efficiency compared to traditional methods.
Since then, research has advanced these methods, particularly in breeding scenarios. Tian et al. [
12] developed a 13-layer convolutional network combining Count CNN [
13] and ResNeXt [
14] for pig counting, achieving low error rates on sparse datasets. Wu et al. [
15] addressed fish counting on dense datasets using dilated convolutions to increase the receptive field without reducing resolution and channel attention modules to enhance feature selection, achieving a mean absolute error (MAE) of 7.07 and a mean squared error (MSE) of 19.16. Li et al. [
16] used a multi-column neural network with
convolutions replacing fully connected layers, resulting in an MAE of 3.33 and MSE of 4.58 on a dataset of 3200 seedling images. Sun et al. [
17] introduced a comprehensive dataset of 5637 fish images and proposed an innovative two-branch network that merges convolutional layers with Transformer architectures. By integrating density maps from the convolution branch into the Transformer encoder for regression purposes, their model attained state-of-the-art performance, achieving an MAE of 15.91 and an MSE of 34.08.
Despite these advancements, significant challenges remain in large-scale breeding counting methods. Low-quality images can negatively impact model detection accuracy, while dense scenes further exacerbate the cost and complexity of bounding box annotations. Traditional labeling approaches also face difficulties in achieving precise identification, particularly in areas with severe occlusion and indistinct features.
To address the specified challenges, this study investigates a point-based detection method that reduces data annotation costs and minimizes computational demands by focusing on the approximate positioning of target points rather than bounding box regression. Leveraging PENet [
18] and IOCFormer [
17], we propose the Feature Enhancement Module with Parallel Network Architecture (FE-P Net), tailored for the current application. FE-P Net comprises two branches: the primary branch employs a Transformer framework with a regression head for final detection outputs, while the auxiliary convolutional branch generates density maps to enhance feature extraction in the primary branch’s encoder. Additionally, to handle low-resolution images common in industrial settings, a Gaussian pyramid module is integrated into the feature extraction process, improving feature representation and mitigating uneven illumination effects. To address feature redundancy caused by low-quality images, spatial and channel reconstruction units are incorporated into the convolutional branch, filtering out irrelevant information and emphasizing crucial features. Our method enhances annotation efficiency and detection accuracy, particularly for livestock farming data, ensuring robust performance under challenging conditions.
2. Materials and Methods
2.1. Image Acquisition for Meat Duck Counting in Large-Scale Farm
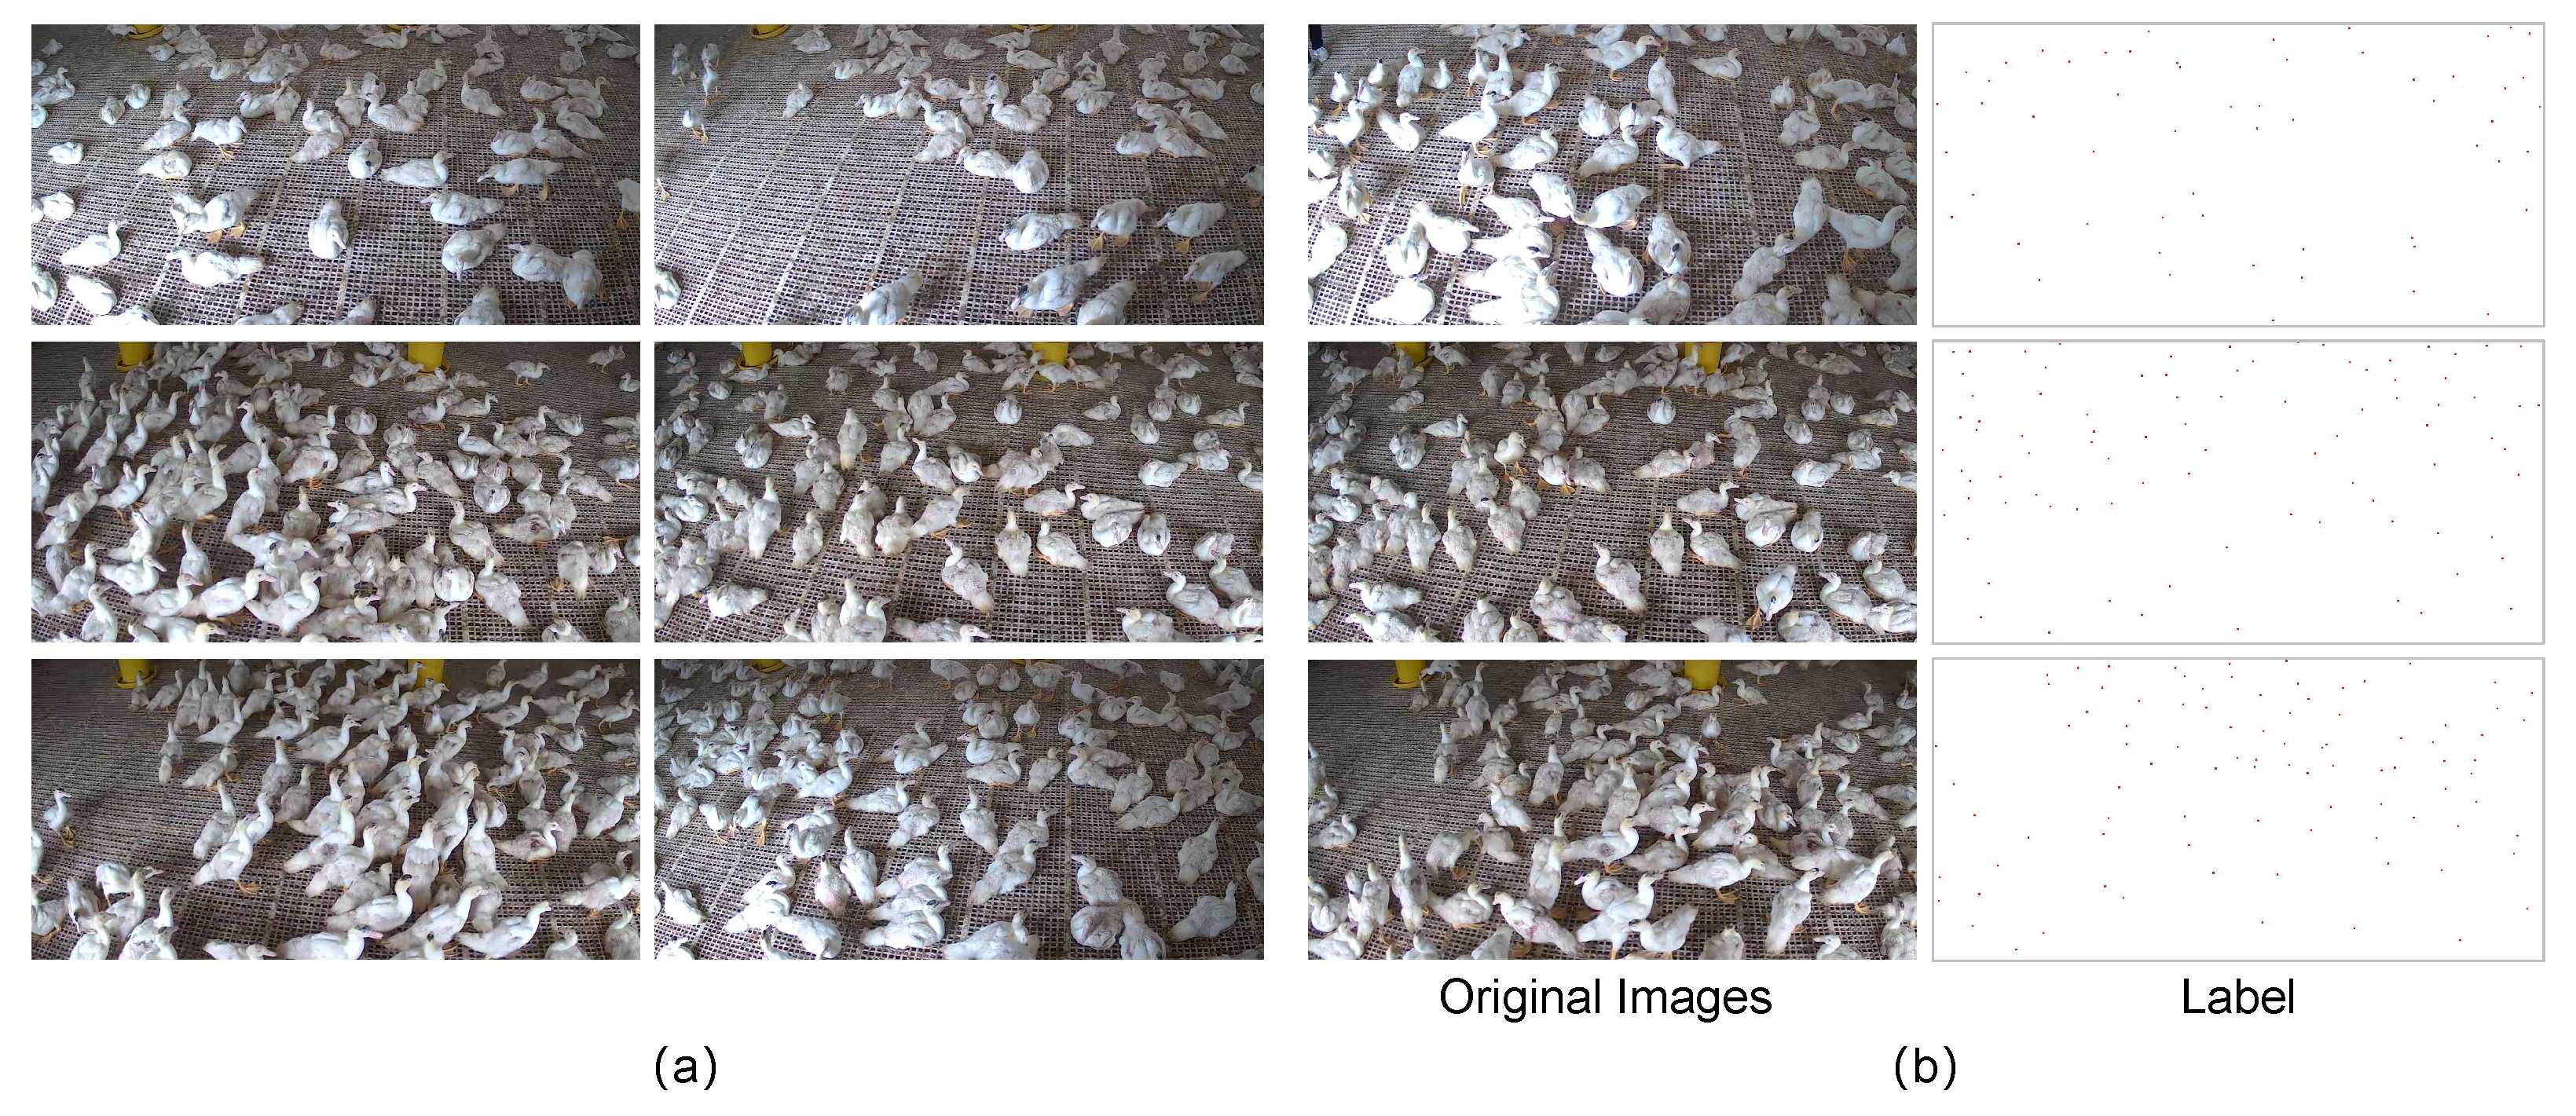
The dataset used in this experiment was collected from a poultry house located in Lishui District, Nanjing City. Spanning approximately 500 square meters, the poultry house uses net-bed breeding methods. Data were collected over June and July 2023 using Hikvision Ezviz CS-CB2 (2WF-BK) cameras, which have a resolution of 1920 × 1080 and a viewing angle of about 45°. Over 136 min of video footage were recorded, with frames sampled every 30 s. After filtering out insect-obscured images, 242 usable images were obtained, containing 20,550 meat duck instances, averaging 84.92 instances per image.
As shown in
Figure 1a, the collected images exhibit low resolution, significant occlusion between targets, considerable variations in individual sizes, and varying densities across different regions. These factors present substantial challenges for detection tasks.
2.2. Dataset Construction for Meat Duck Counting in Large-Scale Farm
The 242 collected images were randomly split into training and testing sets at a ratio of 7:3, yielding 171 images for the training set and 71 images for the testing set. The images were then annotated using Labelme 4.5.9, with the annotation results shown in
Figure 1b.
2.3. Detail-Enhanced Parallel Density Estimation Model Architecture
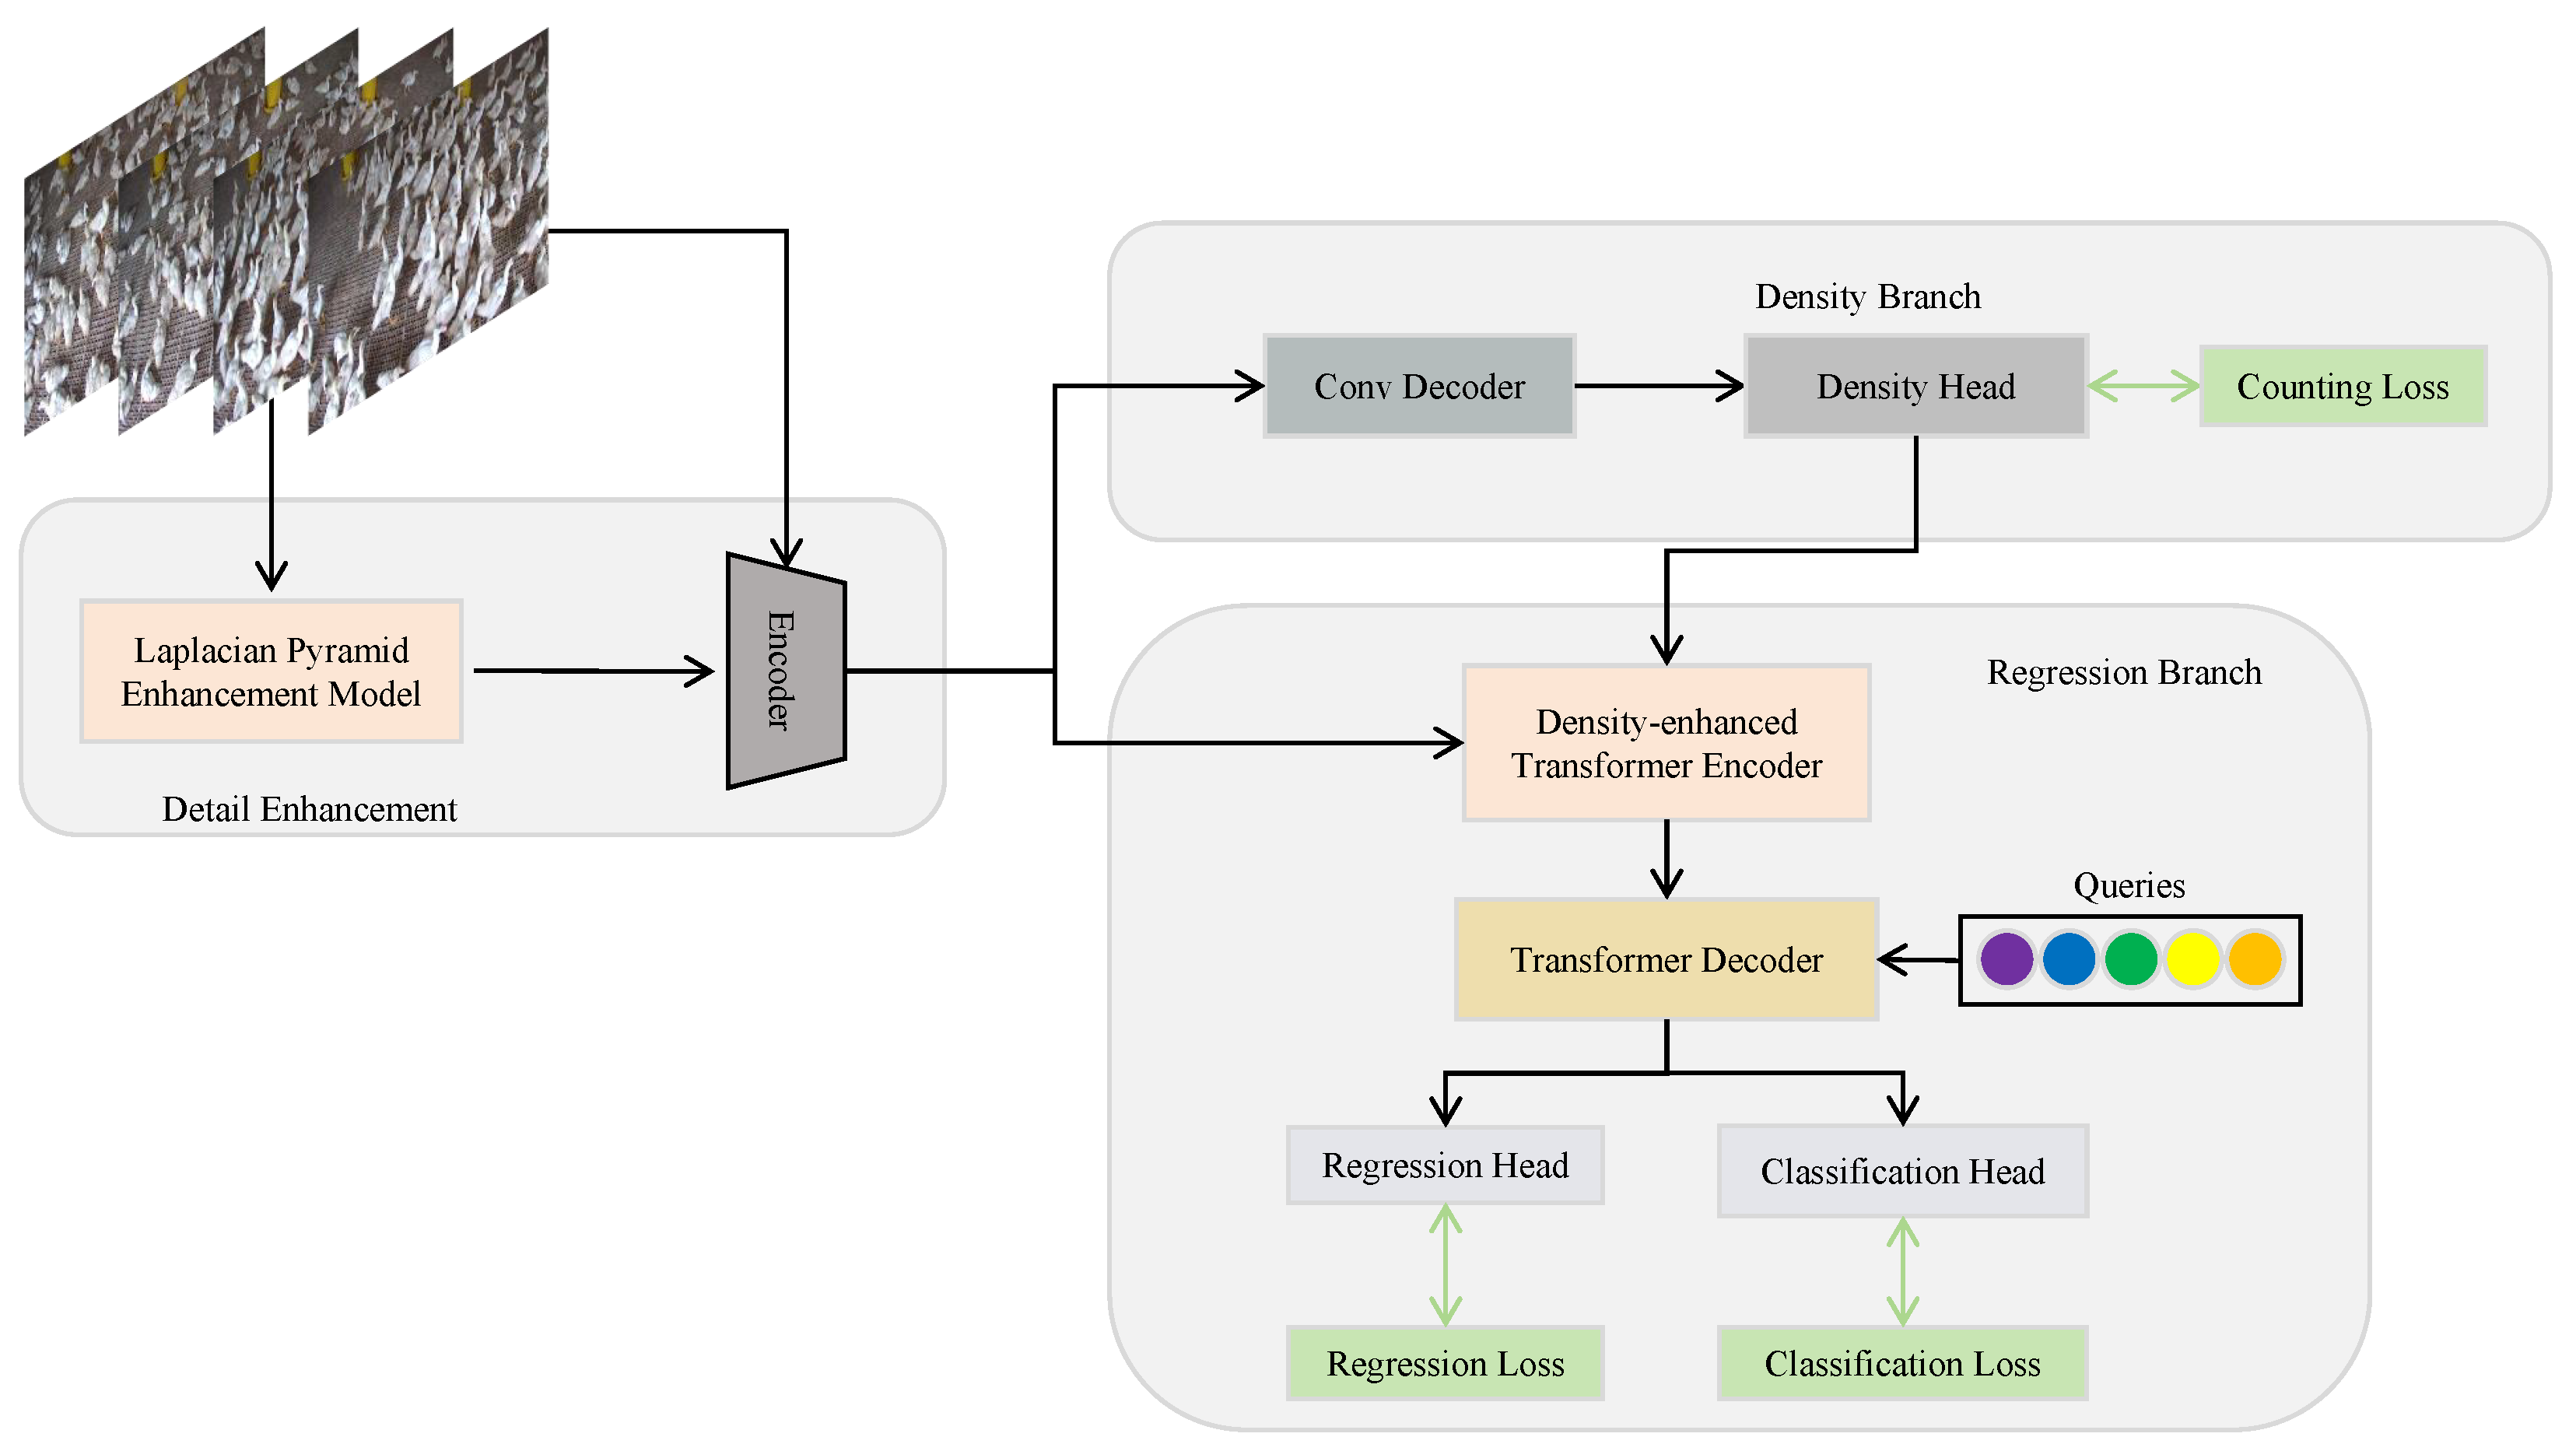
As shown in
Figure 2, our proposed network model combines density-based [
19] and regression-based [
20] approaches through three key components: the Detail Enhancement Module (DEM), a density branch utilizing convolutional networks, and a regression branch leveraging Transformers.
The DEM enhances edge details using the Laplacian operator and captures multi-scale features via a pyramid module. It highlights duck-specific features while reducing high-frequency background noise through convolutional and pooling operations, thereby mitigating ambiguities caused by low-resolution images. The density branch generates location-sensitive density maps through a convolutional encoder. These maps are shared between the density head and the regression branch, enhancing duck position extraction and preserving spatial context. The regression branch integrates positional information from the density branch with global semantics extracted by the Transformer. This fusion of local details and global context enables highly accurate quantity prediction.
Composed of these components, the architecture ensures synergistic performance, effectively addressing the complexities of large-scale poultry breeding. This enables FE-P Net to achieve accurate meat duck counts even under challenging conditions.
2.3.1. Detail Enhancement Module (DEM)
The overall structure of the DEM is illustrated in
Figure 3. It first uses the Laplacian Pyramid Enhancement Model (LPEM) [
21], which is based on a pyramid structure, to extract multi-level features from input images. These feature maps are then refined by the Edge Enhancement and Background Noise Reduction Model (EBM), significantly improving their quality and providing a robust foundation for both the density and regression branches. The enhanced high-level features are subsequently upsampled, combined with low-level features, fused with the original image, and finally passed to the encoder.
The Laplacian pyramid employs a
Gaussian kernel to capture multi-scale information. Each Gaussian pyramid operation halves the image dimensions, reducing the resolution to one-fourth of the original. For an input image
, involving downsampling
and Gaussian filtering
, the Gaussian pyramid operation is
Since Gaussian pyramid downsampling is irreversible and leads to information loss, the Laplacian pyramid is employed to enable the reconstruction of the original image:
where
and
represent the Laplacian pyramid and the Gaussian pyramid at the
i-th level, respectively, and
is the upsampling function. During image reconstruction, the original image resolution can be restored by performing inverse operations. Ultimately, the Laplacian pyramid generates multi-scale features
.
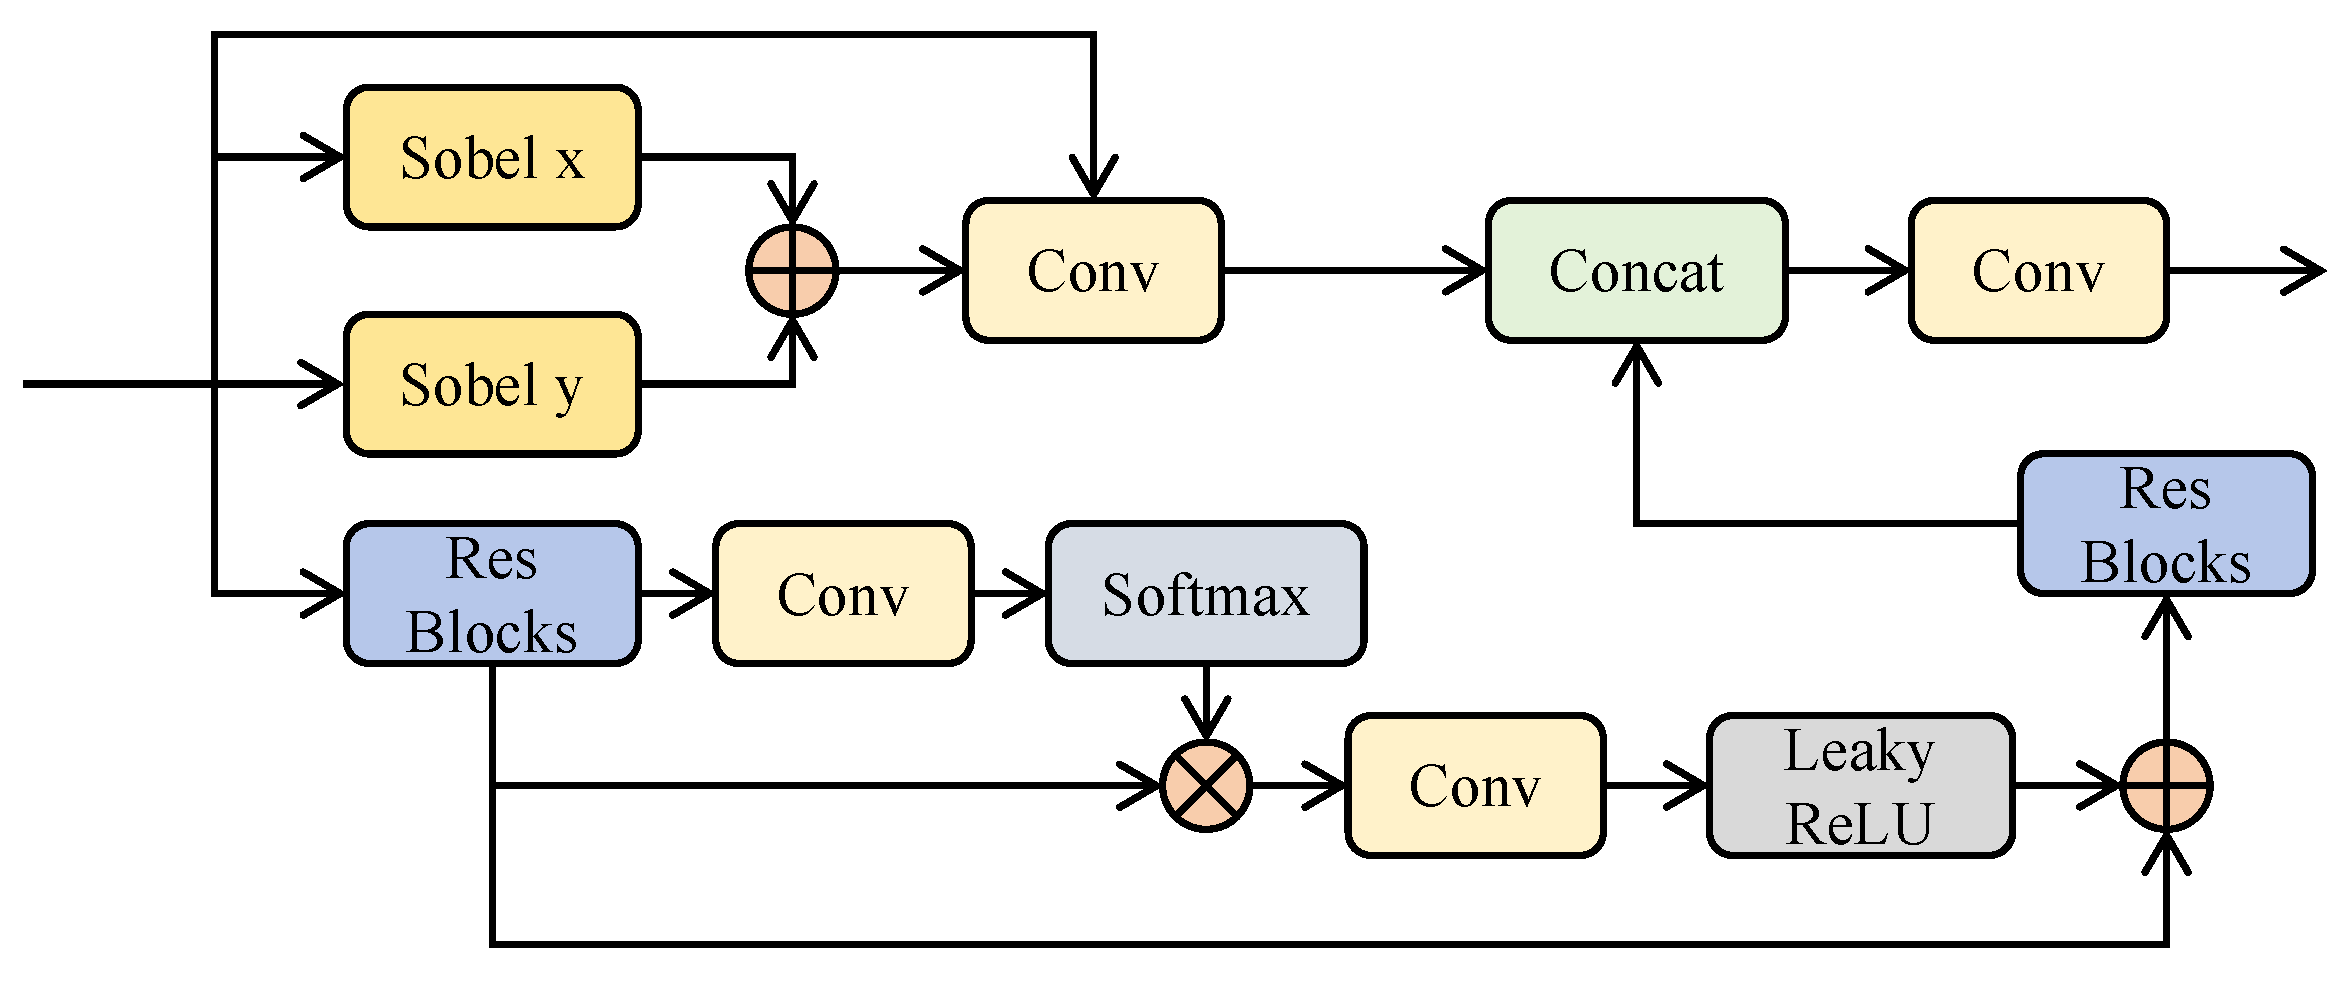
The EBM was designed to enhance local detail extraction and suppress high-frequency noise. It processes multi-scale information through two components: the Edge Enhancement module (illustrated in
Figure 4 and the Low-Frequency Filter module.
The context branch captures global context by modeling remote dependencies and processes them with residual blocks to extract semantic features. For a given feature
, with
as a linear activation function,
F as a
convolution operation,
as a residual block, and
as the Softmax function, the processed feature
is defined as:
The edge branch utilizes the
and
operators to process input features, enhancing texture information through gradient extraction. The processed feature
is
The concatenated outputs are fused via convolution to generate the final feature .
The Low-Frequency Filter module captures multi-scale low-frequency semantic information, as detailed in
Figure 5, enriching the semantic content of images.
For input features
, a
convolution adjusts the channel count to 32, yielding features
. These features are then separated into channel-wise and filtered components [
22] with adaptive average pooling using kernel sizes of
,
,
, and
, followed by upsampling. The pooling operation is defined is:
Here, represents the feature component after channel separation, denotes bilinear interpolation upsampling, and refers to adaptive average pooling with varying kernel sizes. The resulting feature tensor is concatenated and processed with a convolution operation to recover .
2.3.2. Density Branch Based on Convolutional Networks
CNNs employ fixed-size kernels to capture local semantic information [
22], excelling in extracting detailed local features. However, the similarity in color and texture between the background and objects in our dataset necessitates the EBM to differentiate their features. Convolution operations can introduce redundancy by indiscriminately extracting features across both spatial and channel dimensions [
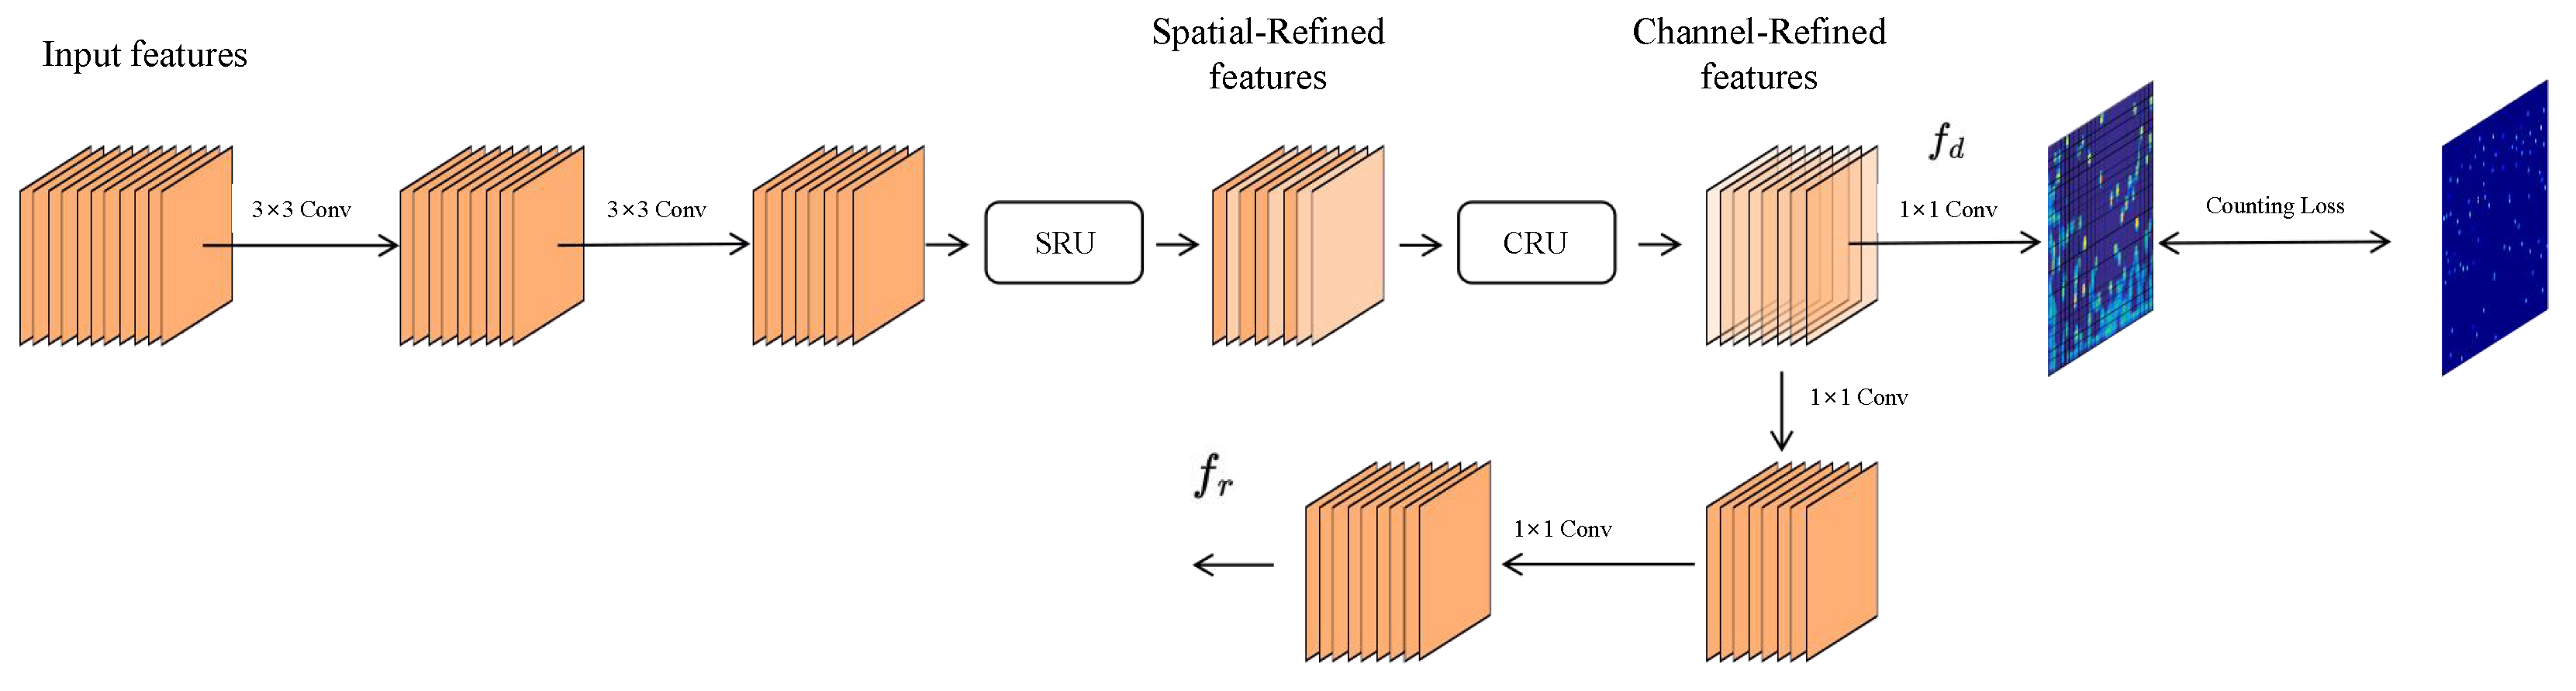
23], potentially impacting final predictions. To address this redundancy, this section integrates a Spatial Reconstruction Unit (SRU) and Channel Reconstruction Unit (CRU) into the convolution branch [
24]. The structure of the density branch, based on convolutions, is illustrated in
Figure 6.
The input features first undergo two sequential
convolutions to compress the channel dimensions. These features are then refined by SRU and CRU modules to reduce redundancy. Finally, the processed features are used for counting loss calculation and feature fusion in the regression branch. The final expression is
Notably, the convolutional branch incorporates both an SRU and CRU in addition to convolution operations to address information redundancy. The SRU primarily comprises separation and reconstruction stages. The separation stage identifies feature maps rich in spatial information from those with less spatial detail. This is achieved using weight factors from group normalization (GN) layers [
25] to evaluate the richness of the feature maps. The GN formula is
where
and
are the mean and variance of the features in the group,
is a trainable factor that evaluates the richness of the feature mapping,
is a bias parameter, and
is a small positive number to avoid division by zero. To unify the sample distribution and accelerate network convergence, normalization layers process the trainable parameter
, yielding the normalized weights
. The expression is as follows:
After obtaining the normalized weights, the
function processes the weight vector to amplify differences between rich features and coefficient features. The gating unit then inputs the processed weight vectors into two directions. Based on a set threshold
, elements greater than
are set to 1 (
), and those less than or equal to
are set to 0 (
). The expression for
is as follows:
The threshold operation generates two weight vectors, which are then multiplied by the input features to generate and . contains richer feature information, while contains less semantic information. To eliminate redundancy while preserving features, a spatial reconstruction module is designed to restructure the features.
Traditional convolution operations, which use fixed-size kernels for feature extraction along each channel, can introduce channel redundancy. To address this, the CRU module employs a separation and fusion strategy. Specifically, the input features are grouped, and
convolutions are applied to compress the channels of these groups, thereby reducing computational costs. The key components GWC [
26] and PWC [
27] minimize channel redundancy: GWC applies
convolutions to the grouped feature maps, while PWC uses
convolutions to enhance inter-channel communication. The final output is refined to reduce redundancy and improve efficiency:
where
is the trainable weight parameter of the GWC module, and
is the learnable parameter of the PWC module in the upper branch. Additionally,
is the input to the upper branch.
The lower branch concatenates the PWC-processed image with the original input to obtain the output
:
where
is the trainable parameter of the PWC module in the lower branch, and
is the input to the lower branch.
The features from both branches are then fused. First, the features are concatenated and undergo adaptive pooling to obtain the pooled feature weight vector
S:
The obtained weight vector is then used as a weighting coefficient to scale the original features. Finally, with
and
representing the sums of vectors derived from adaptive average pooling operations, the weighted features are aggregated to produce final output:
2.3.3. Regression Branch Based on Transformer
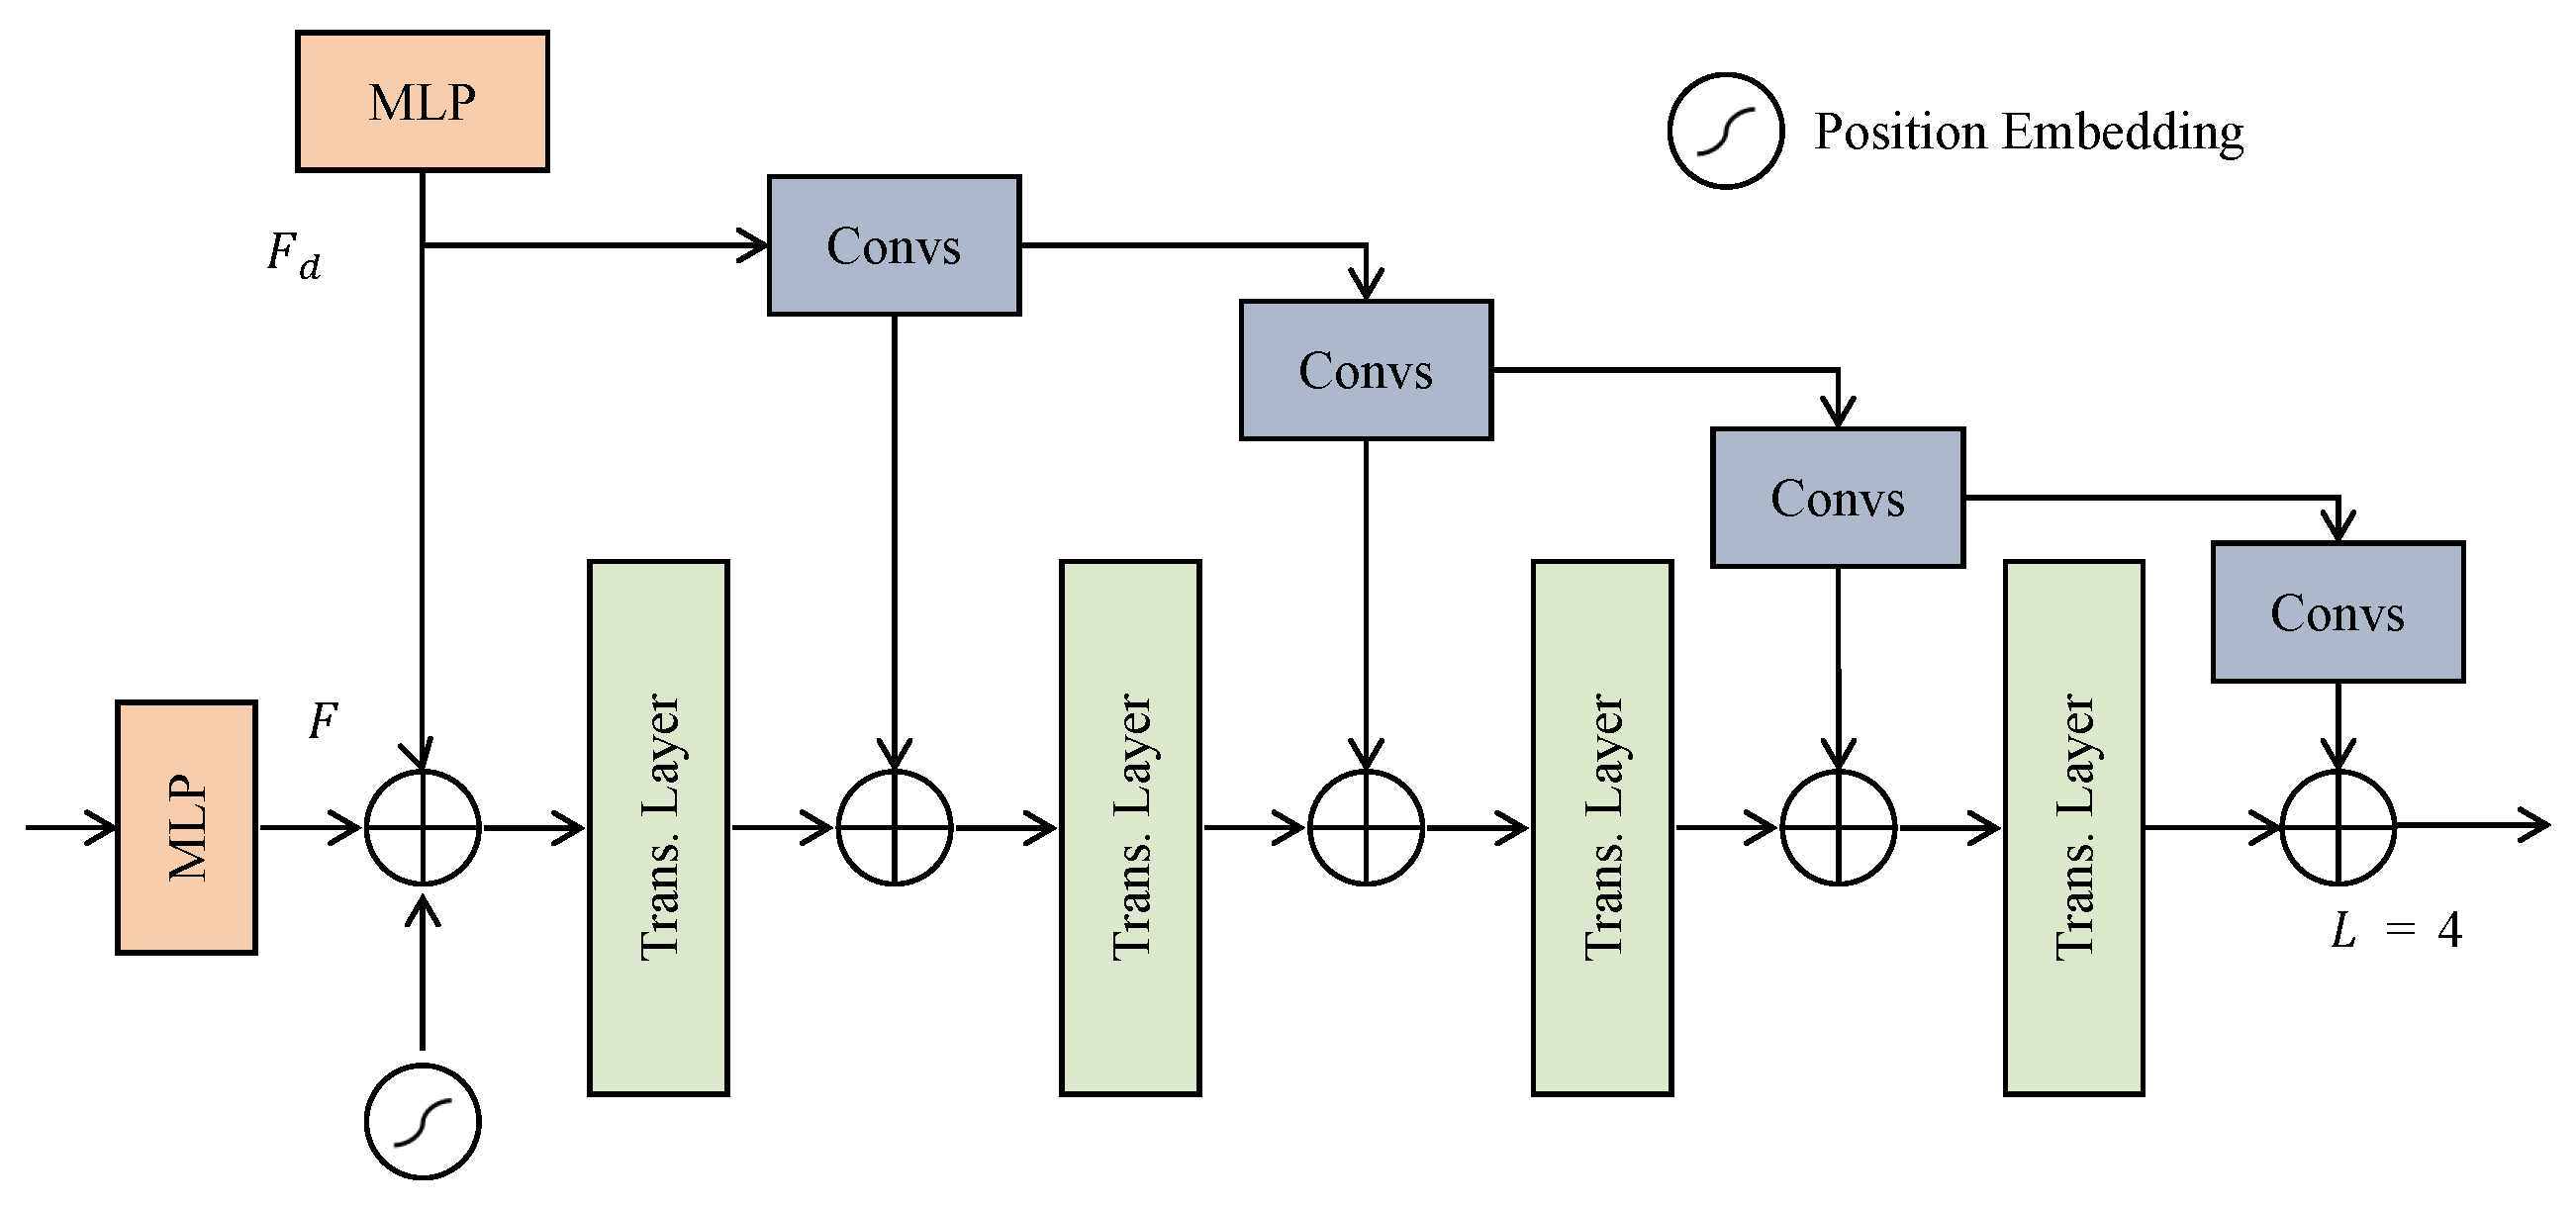
The regression branch comprises three main components: a density-enhanced encoder based on the Transformer (DETE), a Transformer decoder [
28], and a regression head. Unlike traditional Transformer encoders, the DETE module enhances feature extraction by integrating outputs from a convolutional branch. This integration enables more precise capture of both global semantic information and local detail features, improving the precision of duck localization and quantity estimation. The detailed architecture of the DETE module is illustrated in
Figure 7.
The module maps the information extracted by the detail enhancement module to
while simultaneously mapping the features extracted by the density branch to
. These features are then combined with positional embeddings
and fed into a Transformer layer. The expressions for this process are as follows:
Here,
represents the flattening of feature maps for subsequent Transformer processing, and
represents the Transformer layer. The module consists of four layers, with each layer processing features as follows:
where
represents convolution operations. The DETE module merges the output of the previous layer with the convolved density features before each Transformer layer. This process gradually combines global and local information, enabling the extraction of richer and more accurate features. After processing by the DETE module, the resulting feature maps contain precise information. The Transformer decoder then takes the obtained features
and trainable query vectors
as inputs, and outputs the decoded embedding vectors
.
2.3.4. Loss Function
After forward propagation, the classification head maps the output to a confidence score vector, and the regression head maps it to point coordinates [
20]. Assuming the query results are
, where
is the predicted confidence score for the pixel corresponding to the target, and
are the network-predicted coordinates. These predictions are compared with ground truth points
. By setting
, each ground truth point can be matched with one prediction using the Hungarian algorithm [
29]. To compute the average distance difference, first the average distances from the prediction to other points and from the corresponding ground truth to other points are calculated. For the
i-th ground truth point
and its corresponding prediction point
, first the average distances
and
are computed:
With
being the confidence score of the
i-th prediction point, the cost function is
After determining the matching relationships between prediction points and ground truth points, the classification loss
evaluates the confidence loss for each point. A higher loss function value indicates that the features around the point are more distinct from the target object. This loss is calculated using binary cross-entropy:
During loss calculation, the predicted confidence values are first mapped to the range [0, 1]. To make the predicted coordinates closer to the true values, the classification loss
is used to express the difference between predictions and labels:
With
being the weight for the density branch loss, and
denoting the density branch loss. The overall loss function is
2.4. Implementation Details
The experiment used Linux Ubuntu 20.04 with 32 GB RAM and a 2080Ti GPU, using Python 3.7.13 and PyTorch 1.13.0. The parameters were initialized using the Kaiming uniform distribution initialization method. The Adam optimizer was used with a weight decay of 0.0005. Training ran for 3500 iters with an initial learning rate of 0.00001, which was reduced to 0.1 times its value at the 1200th epoch using MultiStepLR.
2.5. Evaluation Metrics
The evaluation metrics used for flow counting were MAE and MSE. MAE measures the difference between predicted individual counts and ground truth counts:
where
N is the quantity of prediction images,
and
are the predicted and true values for the
i-th image, respectively, and
denotes the absolute value. In counting tasks, MAE represents the average error in estimating individual counts; a smaller MAE indicates more accurate predictions. However, MAE does not highlight outliers. MSE, which uses squared differences to emphasize larger errors and highlight outliers, is defined by the formula:
4. Conclusions
In practical production environments, image quality is often low, and traditional bounding box annotation methods are labor-intensive. Our study introduces the FE-P Net architecture, which uses point annotations combined with a feature enhancement module to refine image features and improve detection accuracy. This approach offers a novel solution for enhancing poultry counting accuracy in farming scenarios.
Unlike existing methods that struggle with low-resolution images, FE-P Net employs a dual-branch architecture to integrate local detail extraction and global semantic understanding. By refining edge details and enhancing feature representations while reducing redundancy in both the spatial and channel dimensions, FE-P Net effectively mitigates issues related to low resolution, blurred edges, and uneven lighting. This results in significant performance improvements, achieving 96.46% accuracy on the meat duck dataset. Comparative experiments confirm that FE-P Net outperforms other models on this dataset, successfully completing the counting task. Ablation studies further validate the contributions of each module to overall network performance.
The findings have profound practical implications for poultry breeding. Deploying FE-P Net in real-time monitoring systems enables automated and accurate population counts, crucial for optimizing space utilization, improving animal welfare, and enhancing farm management efficiency. The use of point annotations significantly reduces the labor required for labeling, facilitating scalable deployment across large farming operations. However, there are areas for improvement. Eye-based point annotations require precise calibration, especially in highly crowded scenes with frequent occlusions. Further research should explore the model’s robustness under varying lighting and environmental conditions. Combining FE-P Net with larger models could enhance performance and adaptability.
In conclusion, this study advances the application of deep learning techniques in poultry breeding management. By addressing key challenges in image quality and object density, FE-P Net provides a promising solution for automating meat duck counting. As agriculture continues its digital transformation, innovations like ours will be essential in driving productivity and sustainability.


 ,
, 


