Article

Differences Research on Human Overall Comfort Under Low Pressure

1
College of Civil Engineering & Architecture, Qingdao Agricultural University, Qingdao 266109, China
2
School of Environmental and Municipal Engineering, Qingdao University of Technology, Qingdao 266520, China
*
Authors to whom correspondence should be addressed.
Appl. Sci. 2025, 15(7), 3815; https://doi.org/10.3390/app15073815
Submission received: 14 February 2025 / Revised: 20 March 2025 / Accepted: 24 March 2025 / Published: 31 March 2025

Abstract

:
A low-pressure environment can significantly affect human physiological mechanisms. It causes differences in human overall comfort evaluation at different pressures. Current research mainly focuses on the impact of single environmental factors on human comfort under low pressure. However, studies considering multiple environmental factors are lacking. This paper was based on the effective-function method. Thermal, luminous, and acoustic comfort experimental studies were carried out under standard atmospheric pressure and low pressure. In this study, we conducted an in-depth exploration of the human overall comfort differences under low pressure. The key findings were as follows: (1) There were differences in single environmental comfort evaluation under low pressure. (2) The influence order of unit changes in environmental factors on overall comfort was determined. Within the comfort zone, the variations of 1 °C, 100 lx, and 5 dB caused similar changes in overall comfort evaluation. When a factor deviated from the comfort zone, it became the dominant factor affecting the POCV (Predicted Overall Comfort Vote). (3) In the peak zone of overall comfort evaluation under low pressure, considering energy-saving needs, a slightly cooler environment in winter and a slightly warmer environment in summer were chosen. And the illuminance was shifted to the left of the x-coordinate. The tolerable zone became smaller, and it was easier to reach the lower limit. (4) The comfort zone nomograms for common working condition parameters were drawn. Through parameter interaction, “superior” parameters were used to compensate for “inferior” ones, thereby improving the human overall comfort evaluation. Based on these findings, this research provides a theoretical basis and data support for the design of aerospace and high-altitude environments. It offers beneficial references and ideas for the integrated development of interdisciplinary fields.

1. Introduction

According to statistics, people spend 80~90% of their time in indoor environments [1,2]. With the improvement of living standards and the advancement of science and technology, people’s activity range has gradually expanded. They often find themselves in low-pressure environments. However, the conventional indoor environment under standard atmospheric pressure is what people meet earliest and are most familiar with. Indoor parameters not only affect people’s comfort but also their work efficiency [3,4,5,6,7]. Previously, scholars also conducted some research on the overall comfort evaluation of different types of indoor environments.
Dong X. summarized recent research and pointed out that studies on three-directional interactions involving thermal, acoustic, and luminous environments were lacking, especially in underground spaces [8]. Huang H.J. [9] conducted a survey on the physical environmental comfort of classrooms in Chongqing Nankai Middle School. Questionnaire surveys and on-site tests were carried out on the thermal environment, luminous environment, and acoustic environment. Based on the results of the surveys and tests, existing problems were pointed out, and improvement measures were proposed. However, the indoor environment was not considered as an integrated and overall factor. Solange Leder [10] processed data obtained over a decade using the stepwise regression analysis method. The survey included six subjective aspects as well as the measurement of 18 physical parameters related to them. The results showed that the pollutant concentration and the office type had the greatest impact on job satisfaction. P. Xue [11] proposed a three-step method for constructing overall environmental satisfaction by objectively evaluating the impact of various indoor environmental quality aspects on occupants’ overall environmental satisfaction. The results indicated that the combination of indoor air quality and thermal comfort had the most significant impact on overall environmental satisfaction. The indoor air quality and thermal comfort were most significantly influenced by air freshness, followed by air velocity and temperature. Xiao A.Y. considered the environmental quality in terms of acoustic, visual, and thermal environments and found that it significantly affects people’s comfort levels [12]. Zeng F.X. explored subjective responses towards various environmental quality parameters. They confirmed that the effects of sound pressure and light intensity were not always significant, while thermal stress played a significant role in people’s overall comfort [13]. Wu H.Z.’s research implied that temperature had a cross-effect on acoustic and visual comfort, and both sound level and illuminance had a cross-effect on thermal comfort [14]. Chen P. investigated the effects of thermal–acoustic environments on human comfort. They thought acoustic comfort evaluations were generally higher in colder and warmer environments [15]. Du M. considered acoustic and thermal comfort as having a one-vote veto tendency relative to overall comfort but no absolute veto power. Thermal comfort was the most important factor affecting overall comfort in summer, while acoustic comfort was the most important in spring [16]. Meanwhile, Zhao J.Y.’s investigation showed that the one-vote veto effect was present [17,18]. Guan H.Y. studied people’s subjective and physiological responses to combined thermal–acoustic environments. They suggested that the acoustic environment and thermal environment should be considered comprehensively when creating a comfortable indoor environment and that music can be used to improve indoor environment satisfaction to save energy in a building [19,20].
In recent years, there has been an increasing number of studies on indoor environments’ overall comfort where people make short-term stops, such as in airport lounges, train carriages, and aircraft cabins [21]. Wang Z. [22] conducted objective parameter measurements and used subjective questionnaires in airport terminals in eight different building thermal zones in China. The study adopted the Post-Occupancy Evaluation (POE) system for evaluating a built environment after its use. Based on the results, it was considered that the thermal environment and air quality were two key factors affecting overall satisfaction. At the same time, it was also found that changes in the level of thermal environment satisfaction were not significant compared with changes in the thermal qualification rate. Yang G. [23], on the one hand, investigated the actual indoor air quality in Chinese airport terminals by combining objective measurements and subjective surveys. On the other hand, Yang et al. clarified the impact of single factors in indoor environmental quality on passengers’ overall comfort. Fan C.J. [24] studied the overall comfort evaluation for high-speed railway passengers. Their findings demonstrated that emotional regulation and seat improvements were key factors for the future improvement of HSR passengers’ overall comfort.
Previous studies have conducted in-depth research on human overall comfort evaluation in indoor environments. However, under low-pressure conditions such as aircraft cabins and high-altitude trains, low pressure significantly impacts human physiological mechanisms [25,26,27], thereby influencing human overall comfort. Currently, research on human overall comfort under low pressure remains limited, with most studies focusing on the effects of a single factor under low pressure [28,29,30,31,32,33,34,35]. Moreover, the combined effects of thermal, luminous, acoustic, and low-pressure conditions on human overall comfort evaluation have not been thoroughly explored.
This paper aims to study human overall comfort in thermal, luminous, and acoustic environments under different pressure conditions and to establish overall comfort evaluation models under standard atmospheric pressure and low-pressure conditions. Based on the evaluation models, the parameter ranges of comfort are determined, and commonly used nomograms are presented. This study will provide references for the design of low-pressure environments such as aircraft cockpits and high-altitude trains.
Since the air pressure in modern aircraft cabins is generally controlled between 75 kPa and 85 kPa (equivalent to an altitude between 1524 m and 2440 m) [36] and given that the human body remains in the asymptomatic reaction zone at altitudes below 2500 m to 3000 m [37], the low-pressure experiment was set at 80 kPa.

2. Method

2.1. Human Overall Comfort Evaluation Method

Under standard atmospheric and low-pressure conditions, human comfort is affected by the thermal, luminous, and acoustic environment [38]. In the evaluation process, a relatively concise evaluation approach involves the following: (1) making the evaluation indicators dimensionless through a specific method and (2) weighting them into a comprehensive evaluation value using a synthesis model. This constitutes the overall evaluation method based on the effective function.
Compared with other overall evaluation methods, the effective-function method has two main characteristics. First, it presents the conclusions intuitively, which facilitates the evaluation and analysis of human overall comfort. Second, its evaluation process is direct for each component without cross information interference and offers multiple selectable methods for each component. Since thermal comfort, luminous comfort, and acoustic comfort reflect different physiological mechanisms in response to the surrounding environment, it was therefore reasonable to establish an overall comfort evaluation model using the effective-function method. Meanwhile, the practical application examples of the effective-function method at home and abroad are also worthy of reference [39,40,41].
The effective-function expression of the overall evaluation method is given by Equation (1):
C = ξ ( y i , ω i / i = 1 , 2 , , n )
where C is the human overall comfort evaluation value; ξ is the synthesis model of y i and ω i ; y i , = ( x i ) is the single factor dimensionless value; xi is the single factor variable; and ω i is the single factor weight value. The specific description of the symbols can be found in Appendix A.
ξ   represents the synthesis model of evaluation indicators, meaning that it uses a mathematical function to combine multiple evaluation indicators into a single overall evaluation indicator. Moreover, the physical meaning of the individual indicators must be consistent with that of the overall evaluation value. ωi denotes the weight coefficient. Since each indicator’s influence on human overall comfort varies in importance, the quantitative value of each indicator’s significance must be determined through an appropriate weighting method. Thermal comfort, luminous comfort, and acoustic comfort exhibit different physiological responses to the indoor environment, requiring different methods to obtain their dimensionless values yi.
Therefore, when applying the effective-function method to evaluate human overall comfort, three components need to be determined: (1) the single-factor function fi, (2) the weight value ωi, and (3) the synthesis model ξ.

2.1.1. Single-Factor Dimensionless Processing and Weight Value

In the indoor environment, no unified evaluation standard exists for human thermal comfort, luminous comfort, and acoustic comfort [42,43,44,45,46,47,48,49]. Therefore, dimensionless processing of single-factor evaluation values was necessary. The prerequisite for dimensionless processing was to unify the evaluation indices, ensuring that the new indices maintained consistent scales. This study adopted a five-level scale from 0 to −4 scores matching the thermal comfort vote (TCV) [50] for all three factors’ evaluation indices. Table 1 presents the corresponding relationship. Since the evaluation index variables differed for thermal, luminous, and acoustic environments and different functions yi were employed for dimensionless processing, the form of the function yi was determined based on the experimental relationship between the single-factor variables and subjects’ comfort evaluations.
To convert subjective human responses into quantitative indices, different weight coefficients needed to be assigned to the evaluation indices [51]. This study combined the Analytic Hierarchy Process (AHP) and Value Engineering Theory methods for weighting. The obtained weights for the thermal environment, luminous environment, and acoustic environment were [0.417, 0.267, 0.316] [52]. These weight values indicate that the order of factors affecting human overall comfort was as follows: (1) thermal environment, (2) acoustic environment, and (3) luminous environment [16].

2.1.2. Overall Evaluation Model Synthesis Method

The evaluation model synthesis represents the second fundamental theoretical aspect of the effective-function method. This study adopted the penalty substitution synthesis method, as shown in Equation (2). The evaluation principle states that when any index reaches its lower limit, the overall evaluation value will also reach its lower limit, regardless of other indices’ performance. Additionally, the penalty substitution method exhibits effective compensatory properties: when the subjective evaluation of one environmental parameter is low, overall comfort can be enhanced by improving other environmental parameters.
POCV = L + i = 1 n ( y i L ) ω i
where POCV is the Predicated Overall Comfort Vote; L is the lower limit of single-factor evaluation; and y1~y3 respectively represent the single-factor dimensionless functions of the thermal environment, luminous environment, and acoustic environment.

2.2. Experimental Research

Thermal, luminous, and acoustic environment comfort experiments were conducted in the plateau simulation cabin at Qingdao University of Technology. Qingdao is classified as a Cold Region (Zone II). The thermal comfort experiments were carried out in summer and winter, while the luminous and acoustic comfort experiments were conducted in summer. Single-factor dimensionless functions yi were determined by adjusting and controlling the plateau simulation cabin parameters under both standard atmospheric pressure and low-pressure conditions.

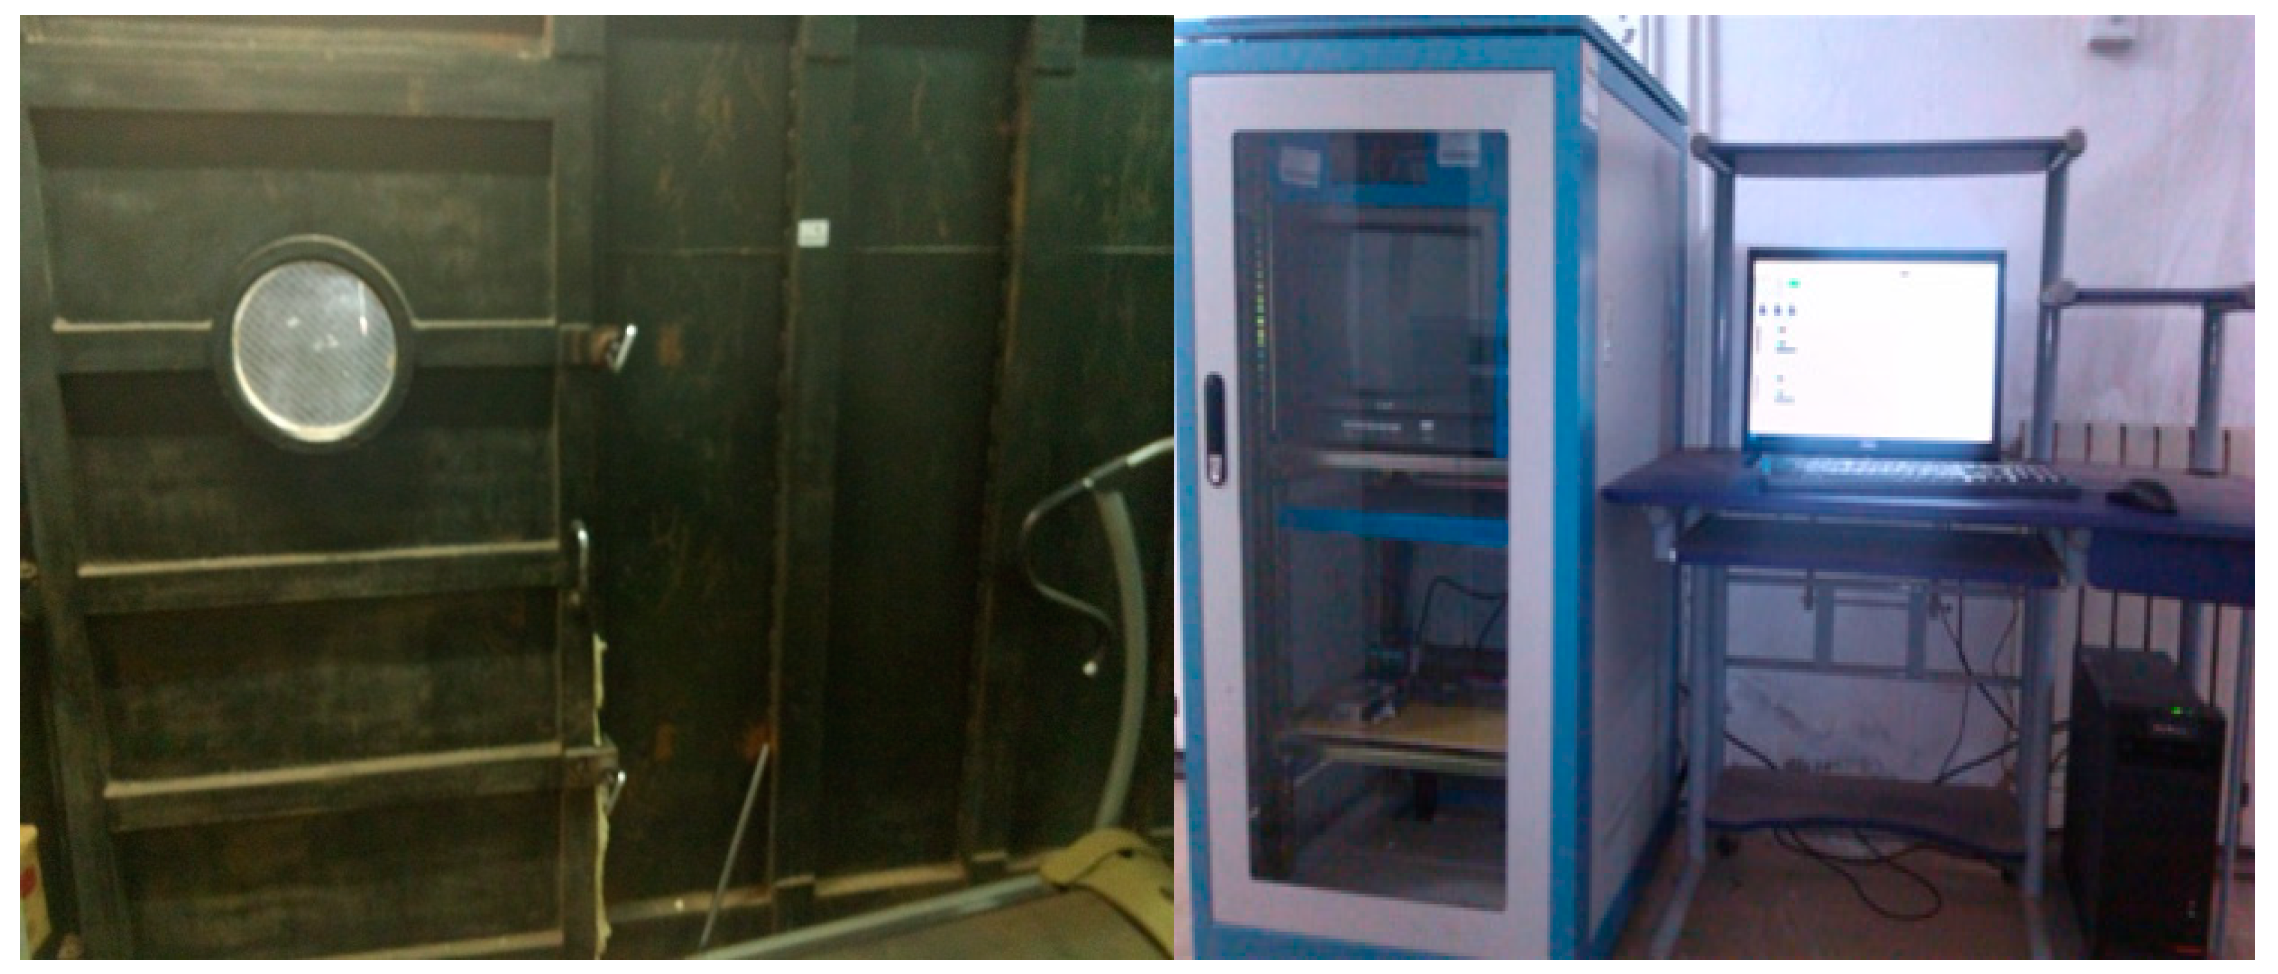
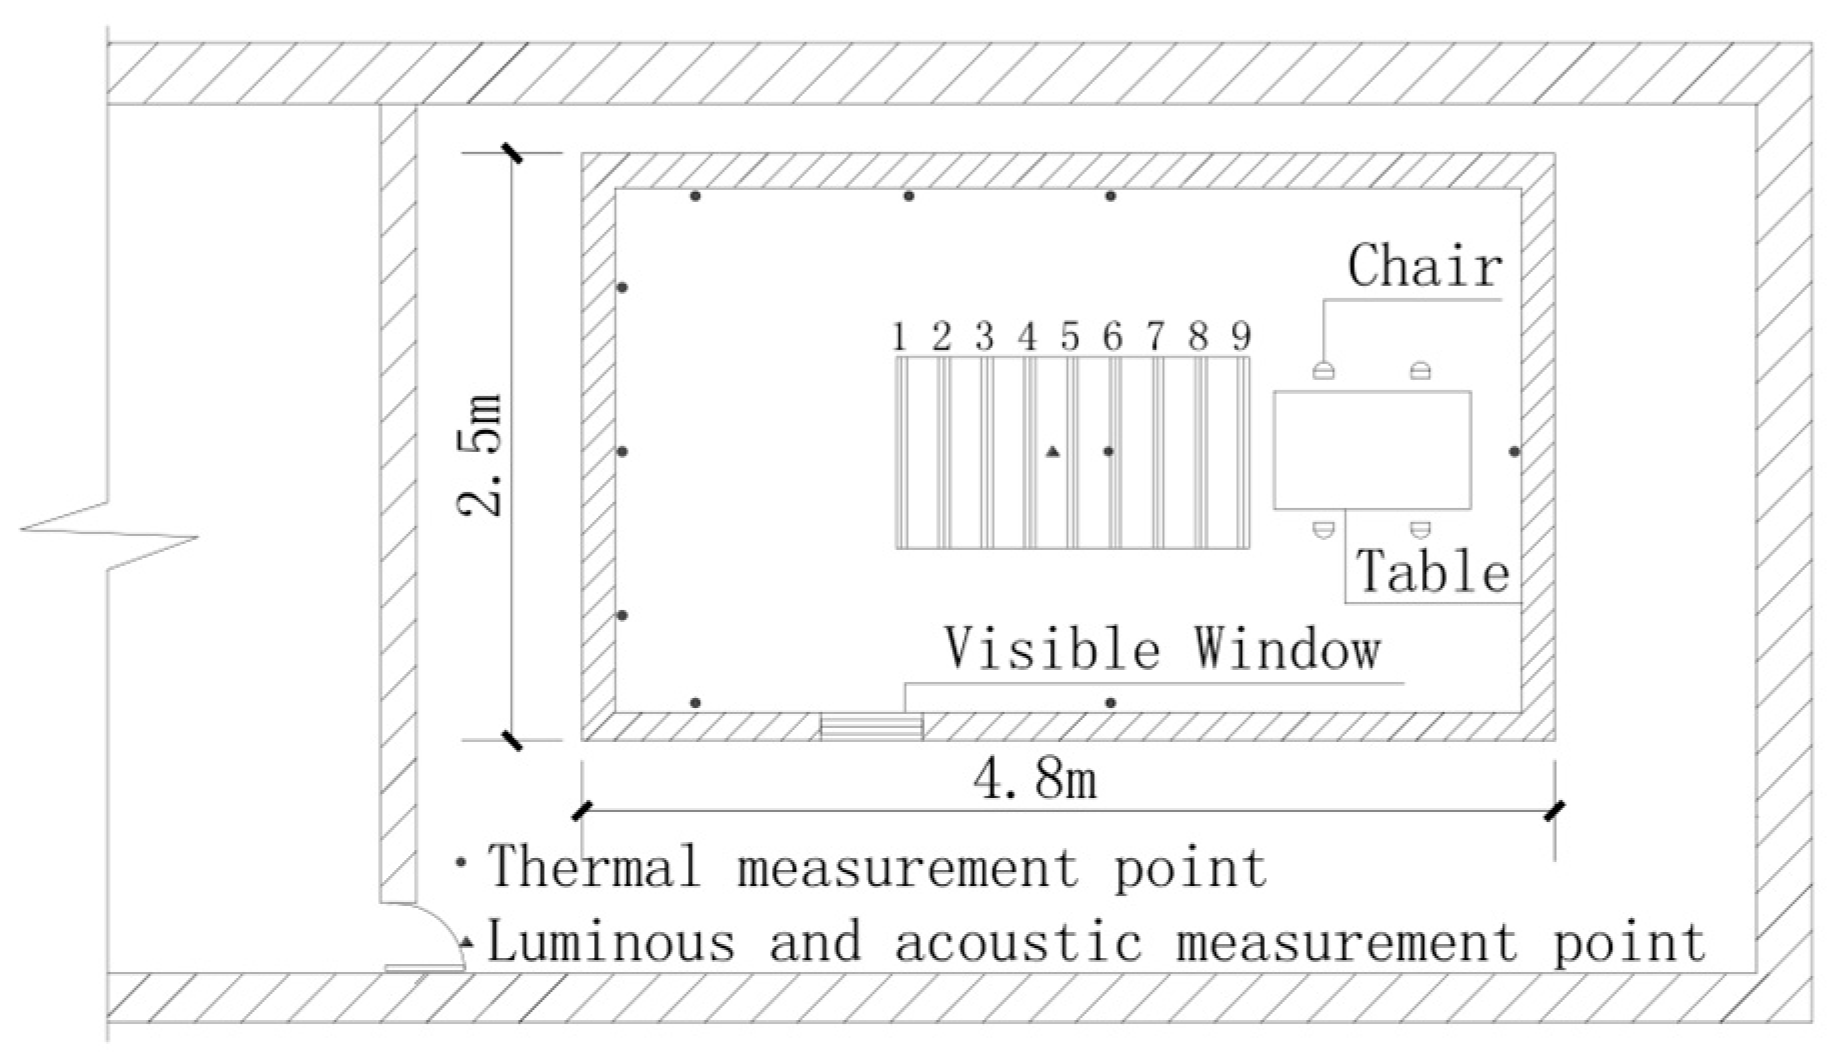
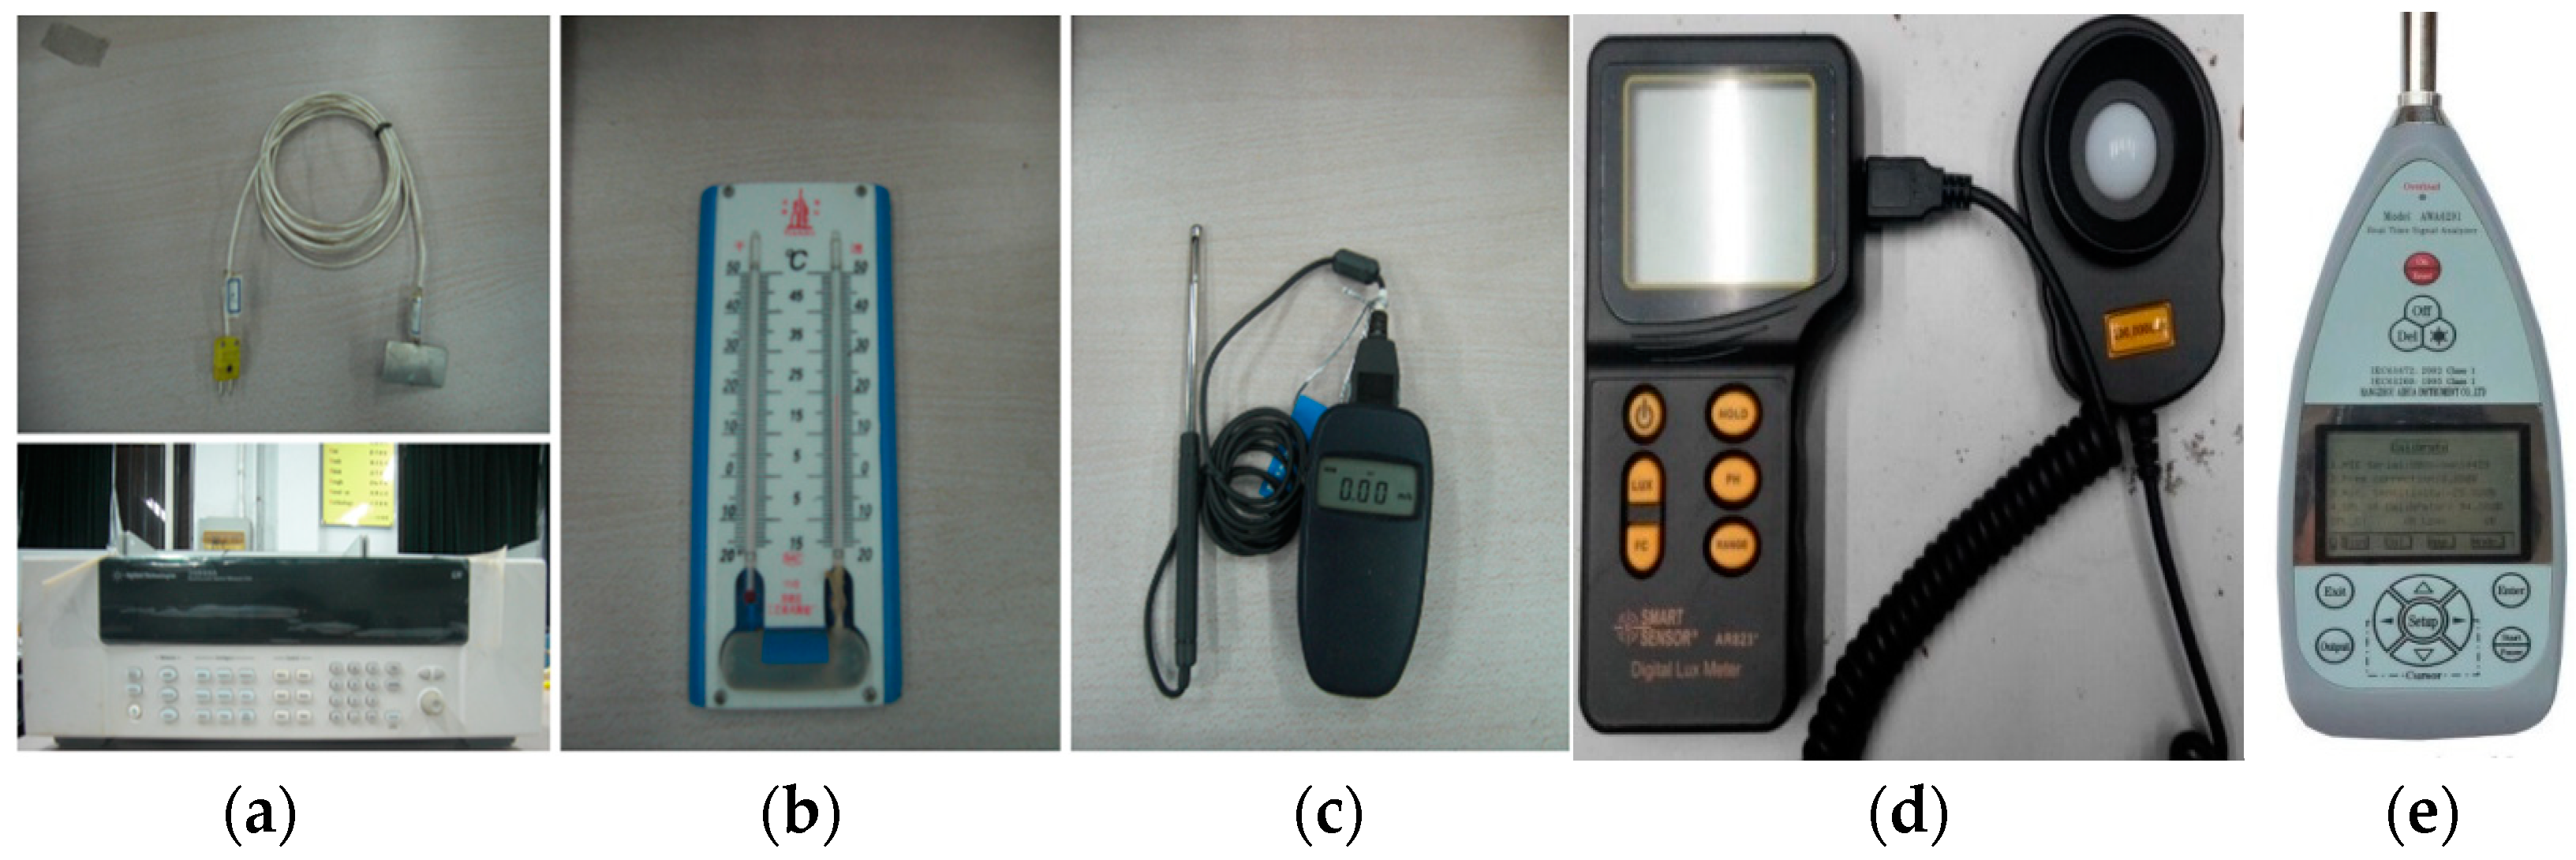
2.2.1. Experimental Device

The cabin body and cabin door were constructed from steel plates of a specific thickness, effectively ensuring their airtightness. Moreover, a visible window was installed on the cabin door, which provided great convenience for observing the experimental process. The control device is shown in Figure 1.
The pressure control range was from 20 kPa to 101.325 kPa, with a control accuracy of ±0.5 kPa. The two pressure conditions tested were 101 kPa and 80 kPa. The plateau simulation cabin could also control and measure the physical parameters of the thermal, luminous, and acoustic environment inside the cabin. The structural dimensions of the simulation cabin and the locations of measurement points are shown in Figure 2.

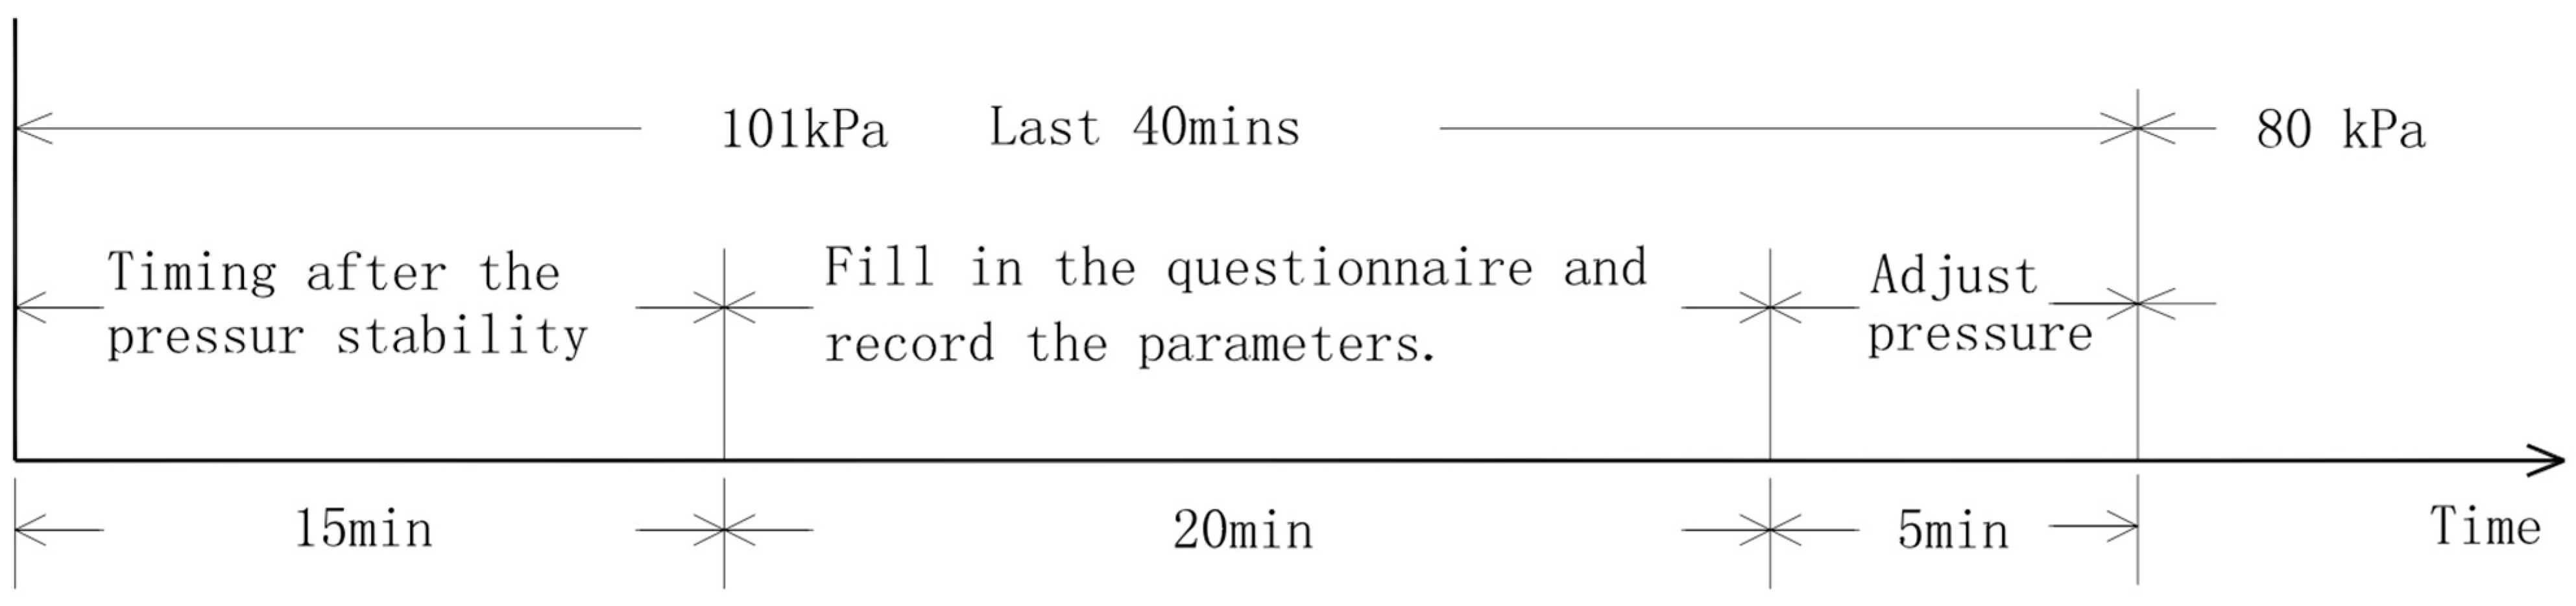
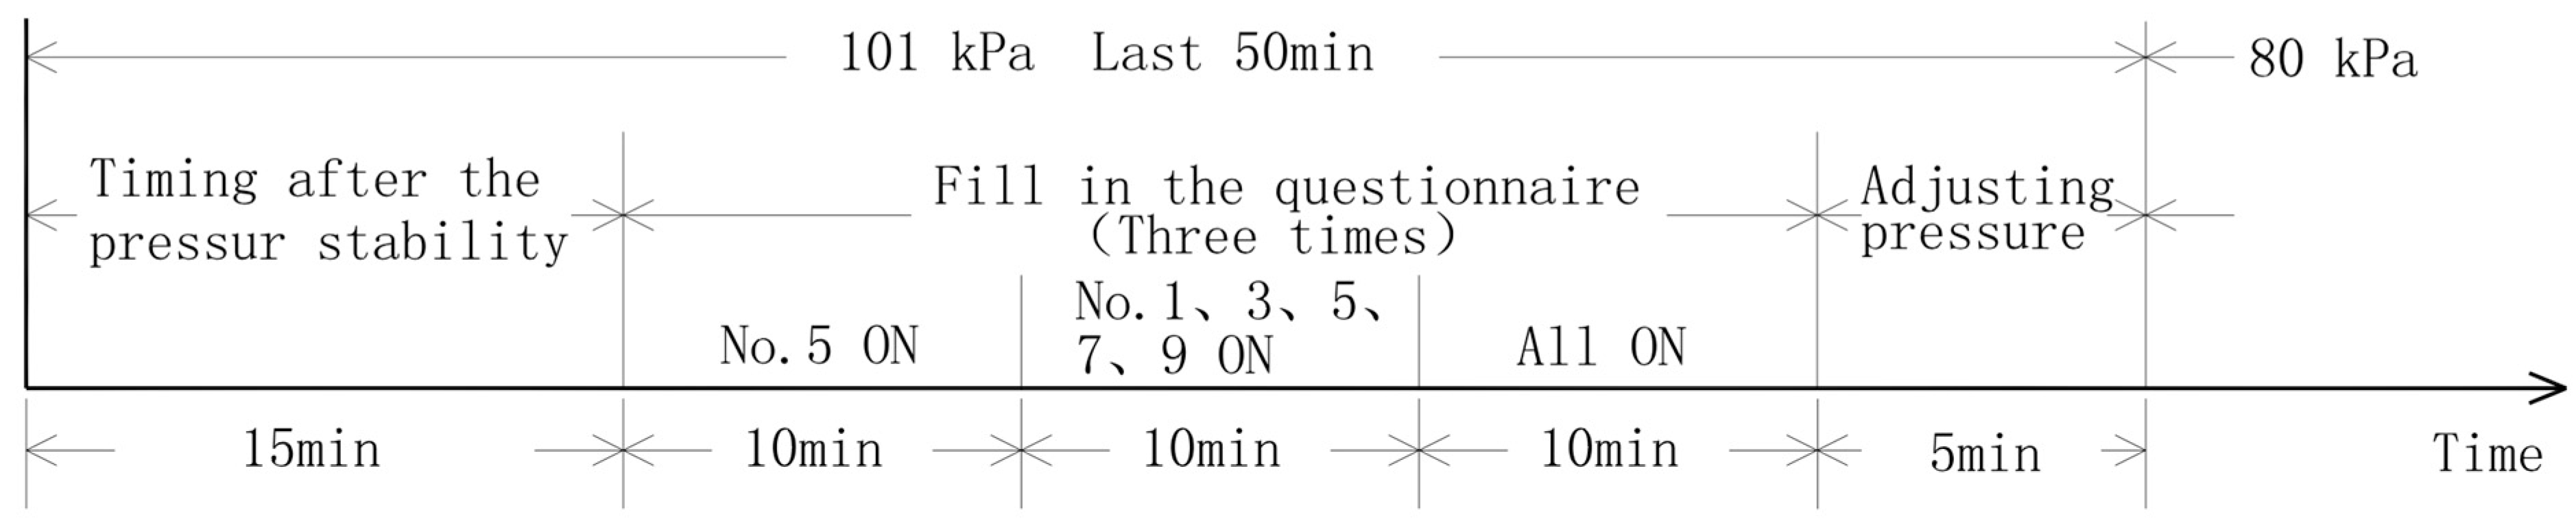
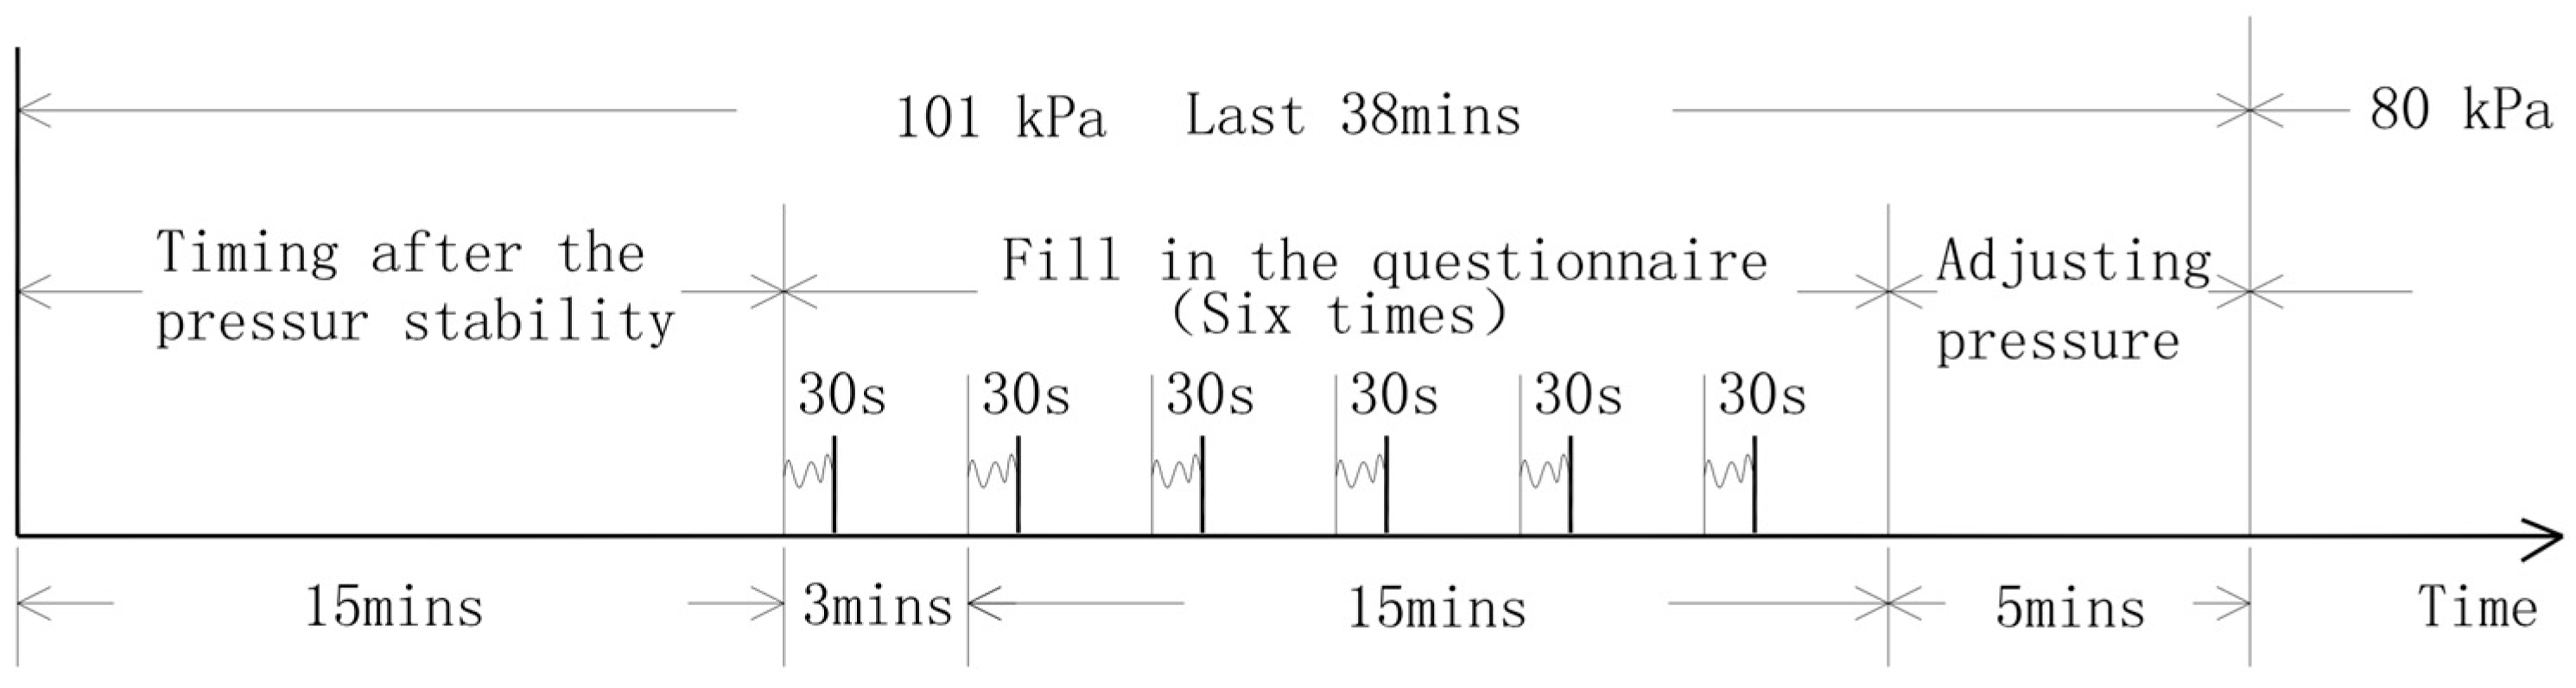
2.2.2. Experimental Design

The subjects were all healthy college students, totaling 60 subjects, primarily recruited from Shandong Province. The detailed information of the subjects is presented in Table 2. In terms of their physiological characteristics, since the study population consisted predominantly of young adults, the sample exhibited a certain degree of homogeneity. In the future, participants from different age ranges and various occupations will also be included to enhance the generalizability of the model findings. All experimental procedures were reviewed and approved by the Institutional Review Board of Qingdao University of Technology.
A priori sample size calculation and a statistical power analysis were performed. Under the premise of considering a large effect size, it was concluded that the minimum required sample size was 24 subjects, which was smaller than the 60 subjects in this experiment. Therefore, the reliability of the experiment could be ensured. At the same time, based on the actual number of 60 subjects, the statistical power was calculated to be 1 (100%). The current experimental design could reliably detect the significant impact of a single environmental factor on the comfort score. The calculation parameters are shown in Table 3.
Before entering the cabin, the subjects received simple training, including the experimental content introduction. They were randomly divided into groups of 2 or 4 people. The subjects were required to sit still for 15 min before the experimental survey. During this sitting period, they could engage in light conversation and read books and newspapers but were not allowed to discuss the comfort evaluation. The instruments required for the experiment are shown in Figure 3.
(1) Thermal comfort experiment
The thermal comfort experiment was divided into winter and summer conditions. To reduce the influence of air velocity, the subjects were required to remain in a windless state during the experiment. The human activity intensity was defined as sitting still. The clothing thermal resistance was relatively fixed: 1.0 clo in winter and 0.5 clo in summer. The main parameters controlled in the thermal comfort experiment included the following: air temperature, wall surface temperature, air velocity, and air pressure. The relative humidity was only measured but not controlled. The measurement instruments are shown in Figure 3a–c. The information about the equipment manufacturer is shown in Table 4. The measuring range of the thermal anemometer is 0.1–20 m/s. The instruments were calibrated prior to the experiment using a standard reference device. According to the literature [50], the objective parameters affecting human thermal comfort include the following: air temperature, relative humidity, average air velocity, and surface radiation temperature. Here, the operative temperature was used as the comprehensive index for evaluating thermal comfort [53]. Three temperature conditions were selected for winter and summer, respectively: 16 °C, 22 °C, and 24 °C for winter and 22 °C, 25 °C, and 28 °C for summer. For each pressure condition, the temperature level was maintained for 40 min. The first 15 min of each condition were an adaptation period, during which subjects filled in their personal information on the questionnaire. In the middle 20 min, the subjects filled out a thermal comfort questionnaire and scored it according to Table 1, while the experiment organizers recorded various parameters. The last 5 min were used for parameter adjustment. The experimental process is shown in Figure 4.
(2) Luminous comfort experiment
In relevant luminous regulations, the illuminance values are mostly used as the main parameter to measure the luminous environment [48,49]. The illuminance was measured by a photometer as shown in Figure 3d, with a measurement range of 0 to 200,000 lx and an accuracy of ±3%. By controlling the number of lamps that were switched on or off, the illuminance value was changed in the luminous experiment. The luminous experiment had three conditions, which were 120 lx (No. 5), 660 lx (No. 1, 3, 5, 7, 9), and 1200 lx (all lights on). Lamps with a 3200 K color temperature were installed on the top of the cabin. The layout is shown in Figure 2.
Due to differences in human visual adaptation to light sources, the light adaptation time (the process of the eyes adapting from darkness to light) is relatively short, about 2~3 min [37]. The illuminance levels were gradually increased from dark to bright. Each pressure condition was maintained for 50 min. The experimental process is shown in Figure 5.
(3) Acoustic comfort experiment
The degree of noise interference to people was directly proportional to the noise intensity, increasing with higher sound pressure levels. In this study, the noise intensity served as an objective parameter for the acoustic comfort evaluation. Most countries around the world set the noise upper limit at 90 dB. Considering the measured noise in transportation cabins, a total of 6 conditions for sound intensity in the experiment were established. They were 60 dB, 65 dB, 70 dB, 75 dB, 80 dB, and 85 dB. The noise source was played through audio equipment. White noise was generated using Cool Edit Pro music editing and production software. According to research [54], rail transit and urban railways are the main sources of low-frequency noise. Therefore, a filter was used to allow only the white noise in the low-frequency band (<1000 Hz) to pass through, and the rest of the frequency components were attenuated. The sound intensity was measured using an AWA6291 handheld real-time signal analyzer (Figure 3e), with a measurement range of 25–140 dB (A) and an accuracy of ±0.7 dB. Each pressure condition lasted for 38 min. The experimental process is shown in Figure 6.

3. Results

Based on the curve regression of the experimental data, the dimensionless functions were obtained under different pressures, respectively. The fitted equations had a high R2, indicating a strong correlation.

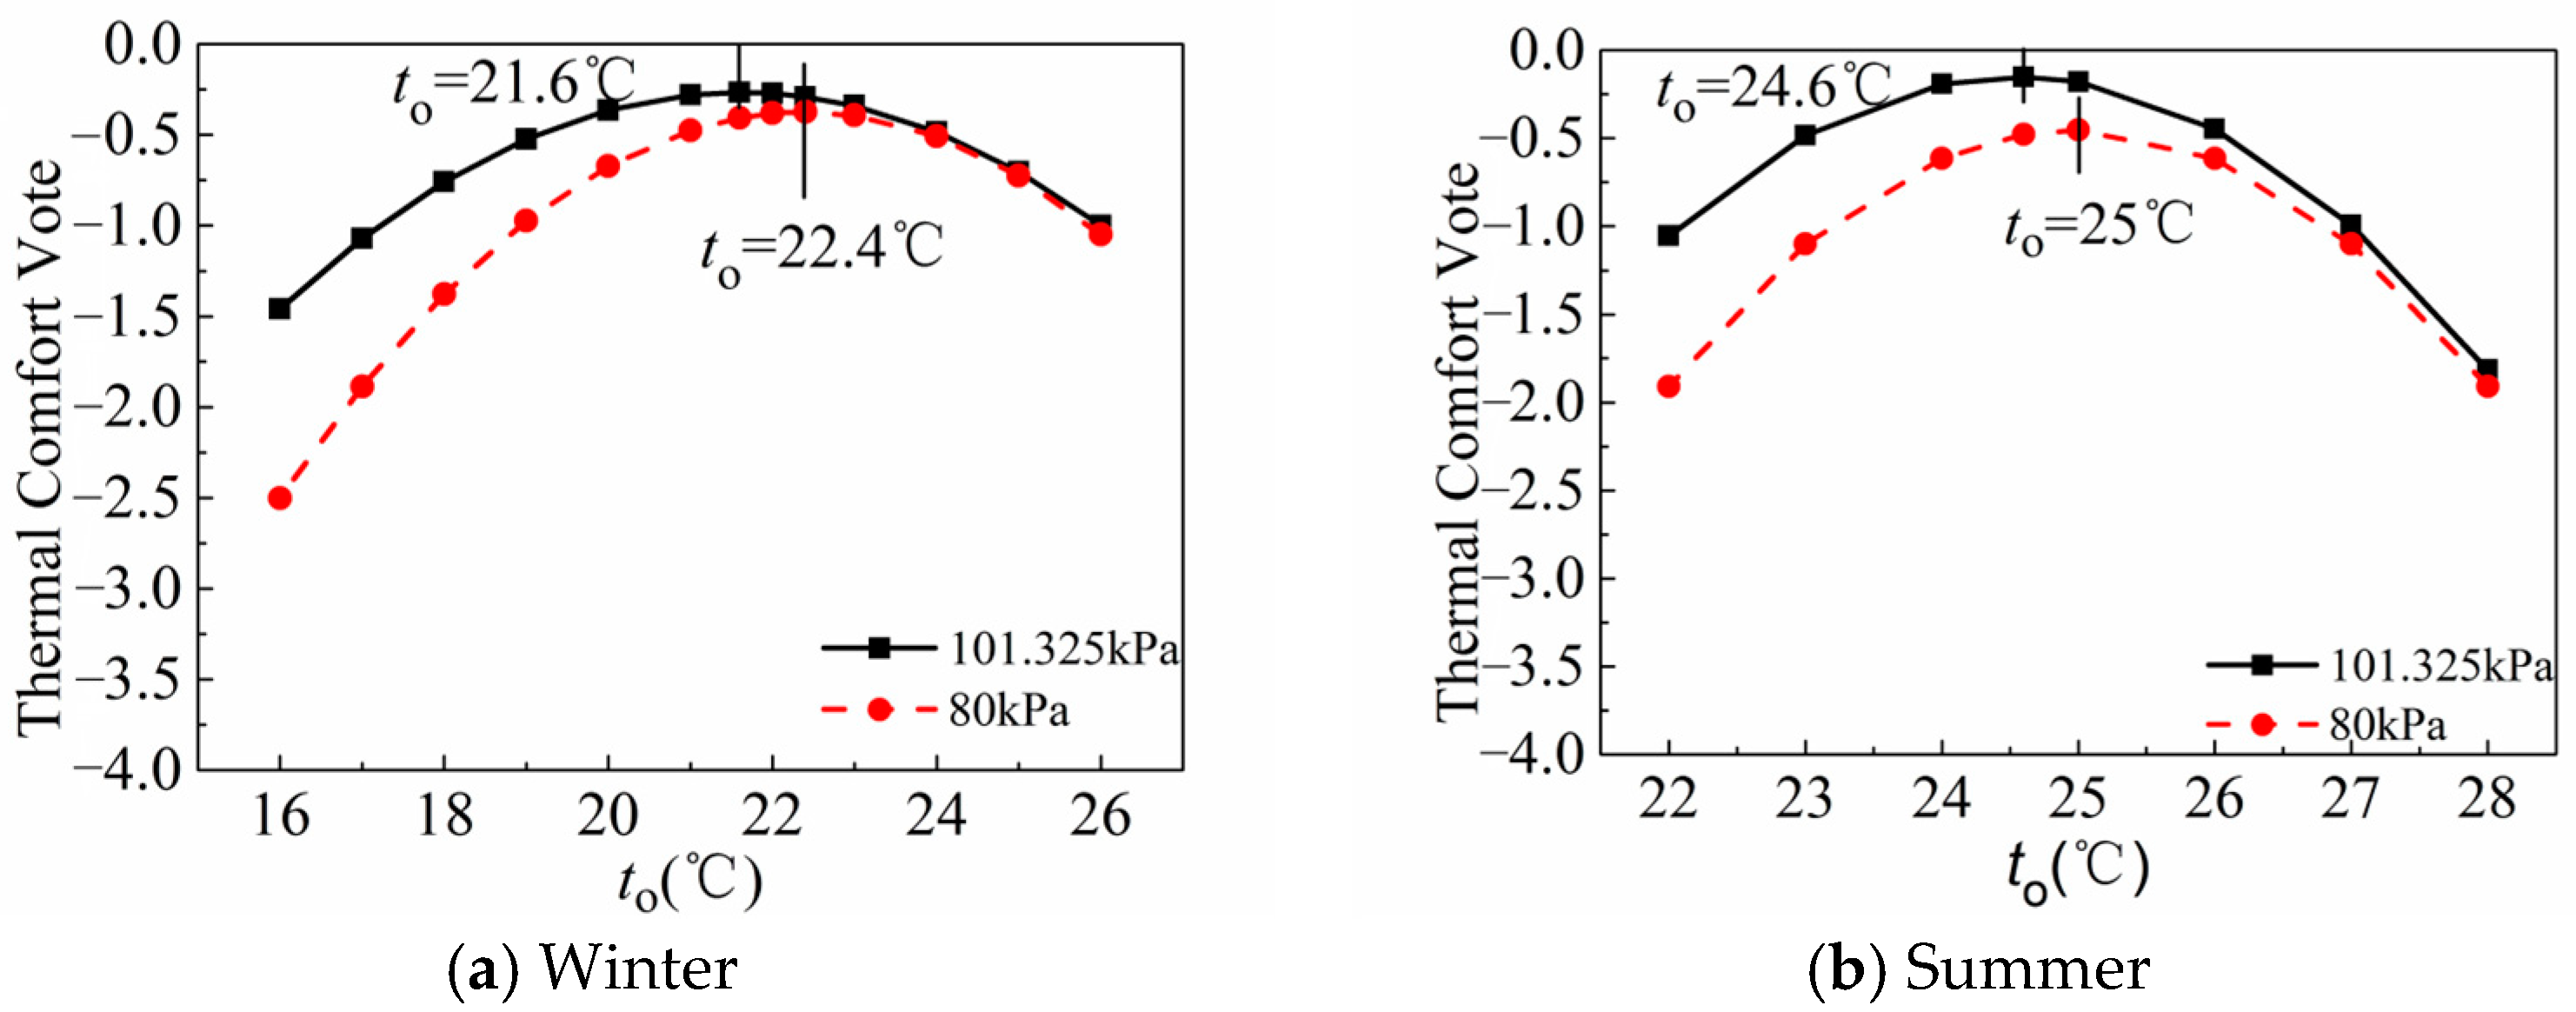
3.1. Thermal Experiment Results

According to the fitting results, there was a quadratic relationship between the operative temperature and the thermal comfort vote, with a significant correlation. Therefore, a quadratic function was selected as the dimensionless function for the thermal environment, and its expression is presented in Table 5.
Figure 7 compares the winter and summer human thermal comfort votes under different pressures. Taking the operative temperature corresponding to the peak evaluation value as the center, the subjects’ thermal votes decreased regardless of whether the operative temperature increased or decreased. Notably, the thermal comfort peak values did not reach 0, which aligns with findings from previous research [50] and China’s standards [55]. Even when the PMV of most people in the same environment indicates a neutral state, 5% still report dissatisfaction. Additionally, as the pressure decreased, the thermal comfort peak value declined, while the operative temperature corresponding to the peak value increased—a trend more pronounced in winter.

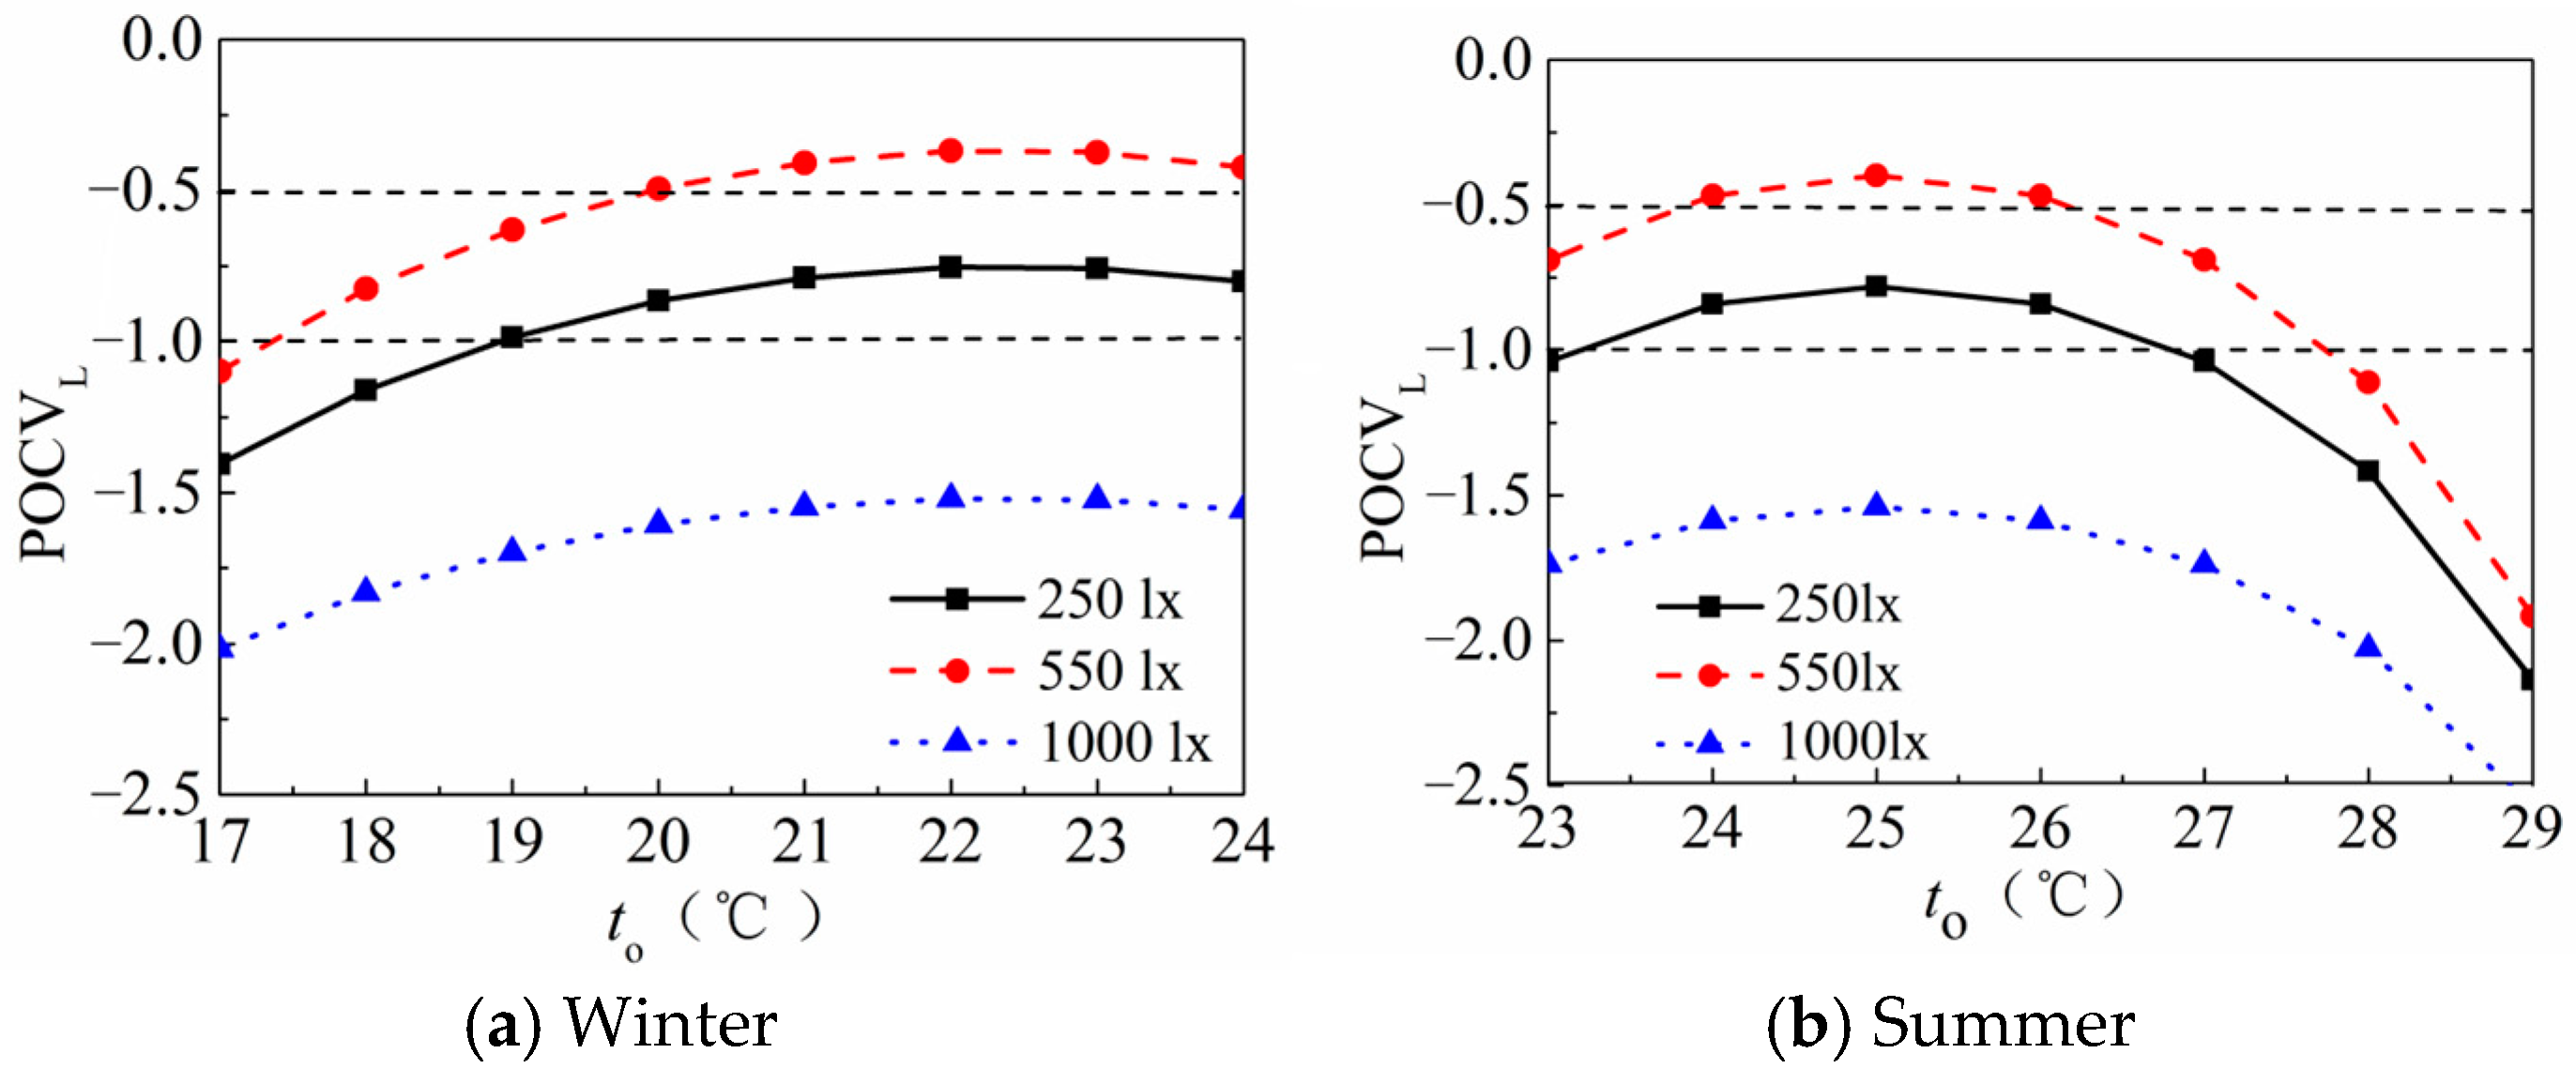
3.2. Luminous Experiment Results

The fitting results indicated a quadratic relationship between illuminance and luminous comfort votes, with a goodness-of-fit (R2 > 0.7) demonstrating a statistically significant correlation. Based on this analysis, the quadratic function was adopted as the dimensionless function for the luminous environment. The corresponding function expression is presented in Table 6.
Figure 8 compares the subjects’ luminous comfort votes under different pressures. The peak illuminance of the luminous comfort vote was consistent with the recommended illuminance for civil buildings in China [48]. This also indicates that the simulation cabin can accurately reflect the actual luminous environment. In addition, when the pressure decreased, the luminous comfort vote for lower illuminance was high, while the luminous comfort vote for relatively high illuminance was higher under standard atmospheric pressure.

3.3. Acoustic Experiment Results

The fitting results revealed a linear relationship between sound intensity and acoustic comfort votes, with a goodness-of-fit (R2 > 0.8) indicating strong statistical significance. Consequently, the linear function was adopted as the dimensionless function for the acoustic environment, with its mathematical expression presented in Table 7.
Figure 9 presents the subjects’ acoustic comfort votes under different pressure conditions. The results demonstrate an inverse monotonic relationship, where the acoustic comfort votes decreased with increasing sound intensity. A distinct inflection point occurs at 80 dB, beyond which the slope of the comfort vote curve becomes steeper. When sound intensity exceeded 80 dB (N > 80 dB), most subjects’ evaluation spanned two comfort zones, changing from “slightly uncomfortable” to “very uncomfortable”.

3.4. Human Overall Comfort Evaluation Model and Verification

Incorporating the punitive substitution evaluation concept, when any single-environment comfort vote reaches its lowest value, the overall evaluation should reach its minimum. This requires modification of the (yiL)ωi term in Equation (2), as presented in Equation (3). The range of the single-environment dimensionless function was constrained to the interval [−4, 0].
Y i = max ( y i ,   4 )
The overall comfort evaluation model was as follows:
POCV = L + [ max 4 , y 1 L ] 0.417 [ max 4 , y 2 L ] 0.267 [ max 4 , y 3 L ] 0.316
POCV L = L + [ max 4 , y 1 L ] 0.417 [ max 4 , y 2 L ] 0.267 [ max 4 , y 3 L ] 0.316
where POCVL is the Predicted Overall Comfort Vote (80 kPa) and y′1, y′2, and y′3 are the dimensionless functions of the thermal environment, luminous environment, and acoustic environment at 80 kPa, respectively.
Using the summer conditions as a case study, we selected subjects to assess the human overall comfort in indoor environments. The validation experiment was conducted in a plateau simulation cabin with controlled pressure at 101 kPa. Environmental parameters were set randomly within the subjects’ acceptable range, excluding extreme conditions. As reported in the literature [43], the validation data for the evaluation model showed a strong correlation between subjects’ overall assessments and the POCV (Predicted Overall Comfort Vote). These results confirm the theoretical validity and accuracy of the POCV model.

4. Discussion

4.1. The Physiological Mechanisms That Affect Thermal, Luminous, and Acoustic Perception Under Low Pressure

4.1.1. Thermal Perception

Under reduced atmospheric pressure conditions, peripheral blood vessels exhibit measurable dilation [25]. Both blood flow velocity and heart rate demonstrate altitude-dependent variations. However, at moderate altitude (<3000 m), studies have shown no statistically significant correlation between heart rate and atmospheric pressure [56,57].
Under low pressure, the air density decreases, and both the thermal conductivity and heat capacity of the air change. The main forms of heat exchange between the human body and the surrounding air are convection, evaporation, and thermal radiation. At constant temperature, a decrease in air density reduces convective heat transfer and increases evaporative heat transfer [58,59]. The change in human thermal comfort with atmospheric pressure must also consider the proportion of convective heat transfer to evaporative heat transfer. Therefore, experimental research needs to be carried out to perform specific quantitative analyses.

4.1.2. Luminous Perception

Low pressure leads to relatively higher intraocular pressure, which exerts pressure on the retinal blood vessels [60], reducing retinal blood perfusion. This affects normal retinal metabolism and function. The retina contains cone cells and rod cells. Insufficient blood supply impairs their photochemical reactions [61], thereby reducing sensitivity and discrimination abilities, ultimately leading to visual decline.
In addition, the reduced partial pressure of oxygen in the air decreases oxygen availability in the human body. This oxygen insufficiency inhibits aerobic respiration in retinal cells and disrupts their normal physiological functions. These effects include impaired reception and processing of visual information by the brain, ultimately affecting luminous perception [62].

4.1.3. Acoustic Perception

The speed of sound in a medium is dependent on the density of the medium. The relationship between the speed of sound and the pressure and density of the sound field is expressed in Equation (6).
c 0 2 = γ P 0 ρ 0
where c0 is the speed of sound; the γ of air is 1.4; P0 is static pressure; and ρ 0 is the density of the medium.
For an ideal gas, the speed of sound can be calculated using Equation (7). As shown in Equation (7) [37], the speed of sound remains essentially constant under low-pressure conditions when the temperature is maintained.
c 0 = 331.4 T 0 273
In addition, low pressure changes the air acoustic impedance, which reduces the sound intensity transmitted to the inner ear and results in a decrease in auditory sensitivity. The ability to distinguish the frequency, intensity, and other characteristics of sound is reduced [63,64,65,66].

4.2. Single-Environment Differences Under Low Pressures

4.2.1. Thermal Environment Differences Under Low Pressure

When the thermal comfort vote was −1 in Table 1, it represented “slightly uncomfortable”. Therefore, when y1 was in [−1.0, 0], it could be considered as the comfort zone. Based on this, thermal comfort was divided into two levels. Level I represented relatively high thermal comfort (−0.5 ≤ y1 ≤ 0), and Level II represented relatively low thermal comfort (−1.0 ≤ y1 ≤ −0.5). With the premise of fulfilling thermal comfort and reducing energy consumption, a cooler environment was preferred in winter, and a warmer environment was preferred in summer. The critical temperature zone was used as the basis for determining the indoor temperature in the transitional seasons. The thermal comfort zones are shown in Table 8. The temperature ranges of different thermal comfort zones under standard atmospheric pressure were basically consistent with the Chinese specifications [55]. The comfort zone in Table 8 was narrower than the range recommended by Zhou (23.3~28.6 °C) at 61.6 kPa [67]. The comfortable temperature ranges included the transitional seasons, which supplement the indoor temperature ranges in Chinese specifications.
The thermal comfort zone underwent two changes under low pressure. First, the temperature increased in winter and remained the same in summer for the same thermal comfort level. Zhang believed that the comfortable outdoor temperature in summer in high-altitude areas increased, which showed some differences from the results of this study [68]. This may be because the results of the two experiments came from an outdoor environment and a simulation cabin, respectively. Second, the range of the thermal comfort zone narrowed. This indicated that when the atmospheric pressure decreased, to achieve a certain thermal comfort level, the temperature needed to be raised, especially in a cooler environment. These conclusions were consistent with the research results [28,29,69].
Heat loss between the human body and the external environment is related to both atmospheric pressure and temperature. The percentage of convective heat loss decreased with increasing temperature. While the percentage of evaporative heat loss increased, the total heat loss decreased. Thus, the effects of lower pressure and higher temperature offset each other in terms of the human body’s total heat loss. When the indoor temperature was relatively high in summer, the effect of lower pressure on thermal comfort was weakened. And the thermal comfort zone at 80 kPa was basically the same as that under standard atmospheric pressure. In contrast, when the indoor temperature was relatively low in winter, the temperatures within the thermal comfort zone all increased at 80 kPa.

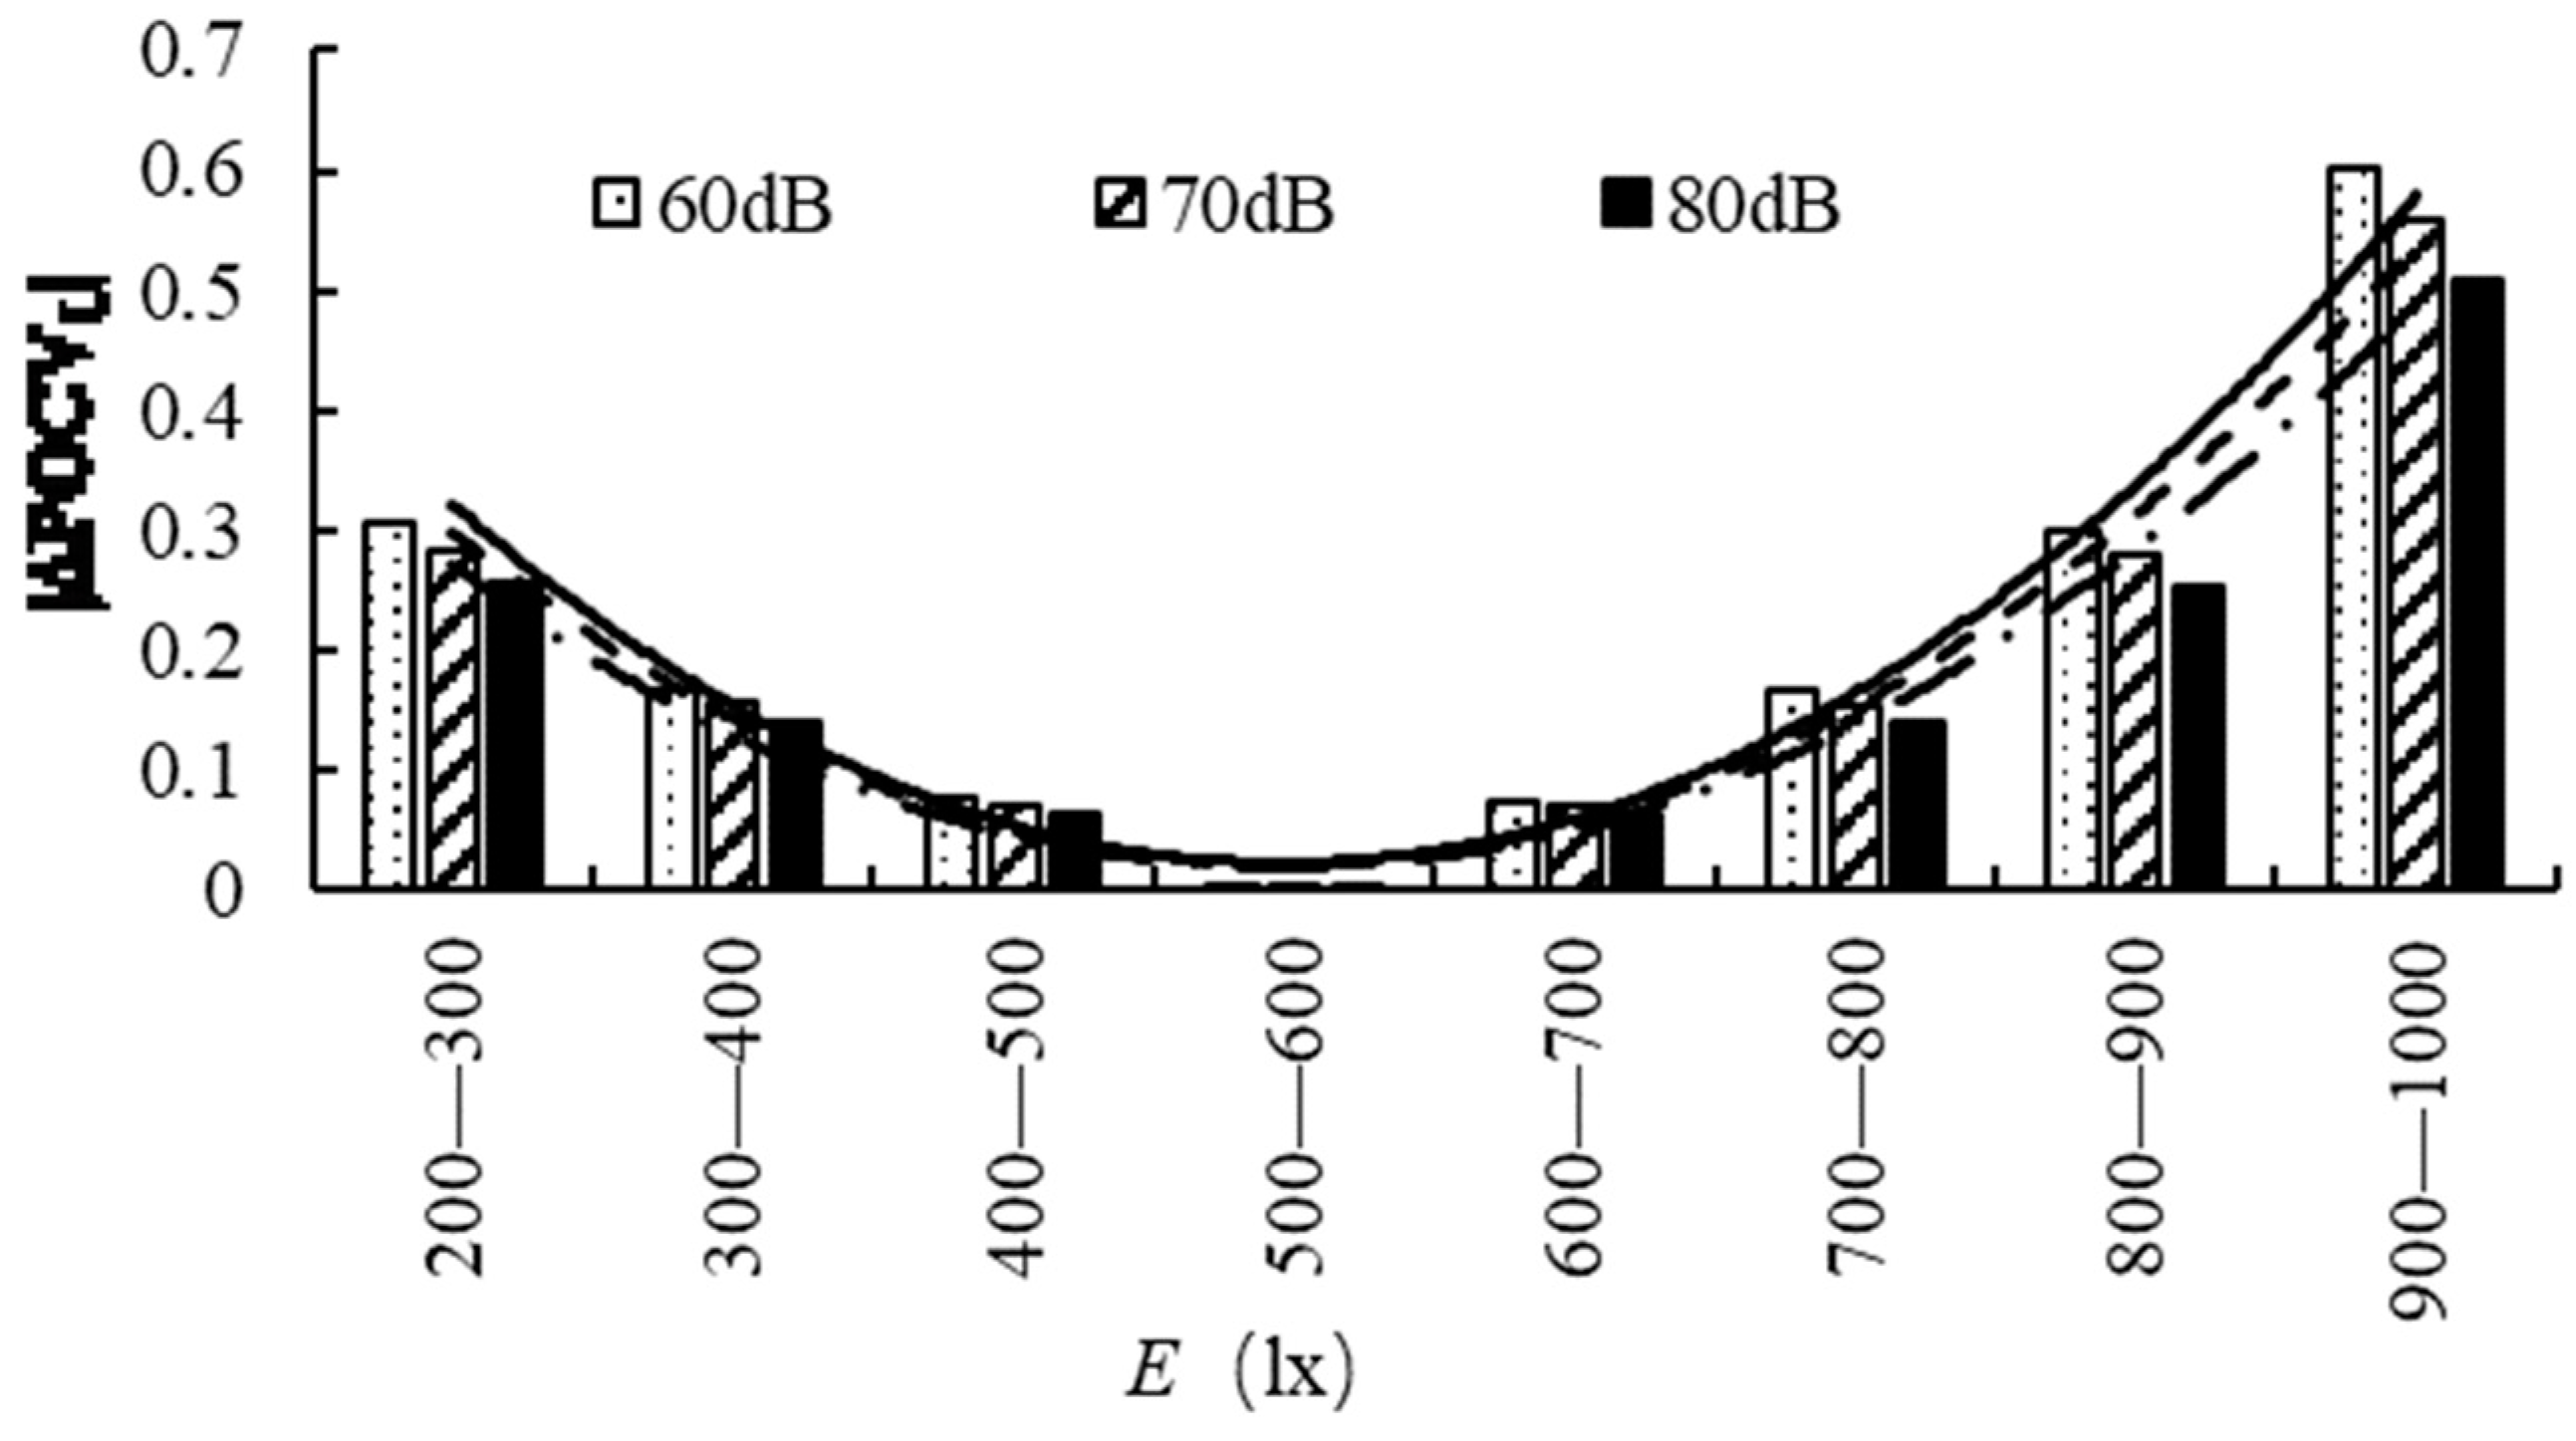
4.2.2. Luminous Environment Differences Under Low Pressure

The luminous comfort zone was evaluated using the same standards as those applied to the thermal environment. The luminous comfort zones are shown in Table 9 under different pressures. The recommended luminous comfort zones at 101 kPa were close to the values for Chinese civil buildings [70]. This indicated that the luminous values provided in the simulation cabin were consistent with those of the actual office environment.
When the pressure dropped to 80 kPa, the peak illuminance of the luminous environment vote decreased. The luminous comfort zones became narrower, and the comfort zone shifted toward lower illuminance. According to the visual system’s response to the surrounding environment, only the visible light spectrum can produce an appropriate stimulus to the photoreceptive organs. And the visible light is hardly absorbed or weakened during its propagation in the air. There is almost no energy loss during visible light propagation. Therefore, the reasons why the luminous comfort under low pressure was lower than that under the standard atmospheric pressure needed to be analyzed from the physiological perspective of visual sensory organs. The results indicated that hypoxia had a certain impact on visual function, resulting in visual impairment starting from an altitude of 1500 m [71,72,73,74]. Specific phenomena included multiple aspects such as prolonged dark adaptation time, weakened dynamic visual acuity, and decreased color contrast sensitivity. This was mainly because the tolerance of the retina decreased under low pressure, which impaired the blood supply to the retinal terminal arteries [75,76]. Thus, this led to a reduction in visual efficiency. This was also the main reason for the reduction in the luminous comfort evaluation under low pressure.

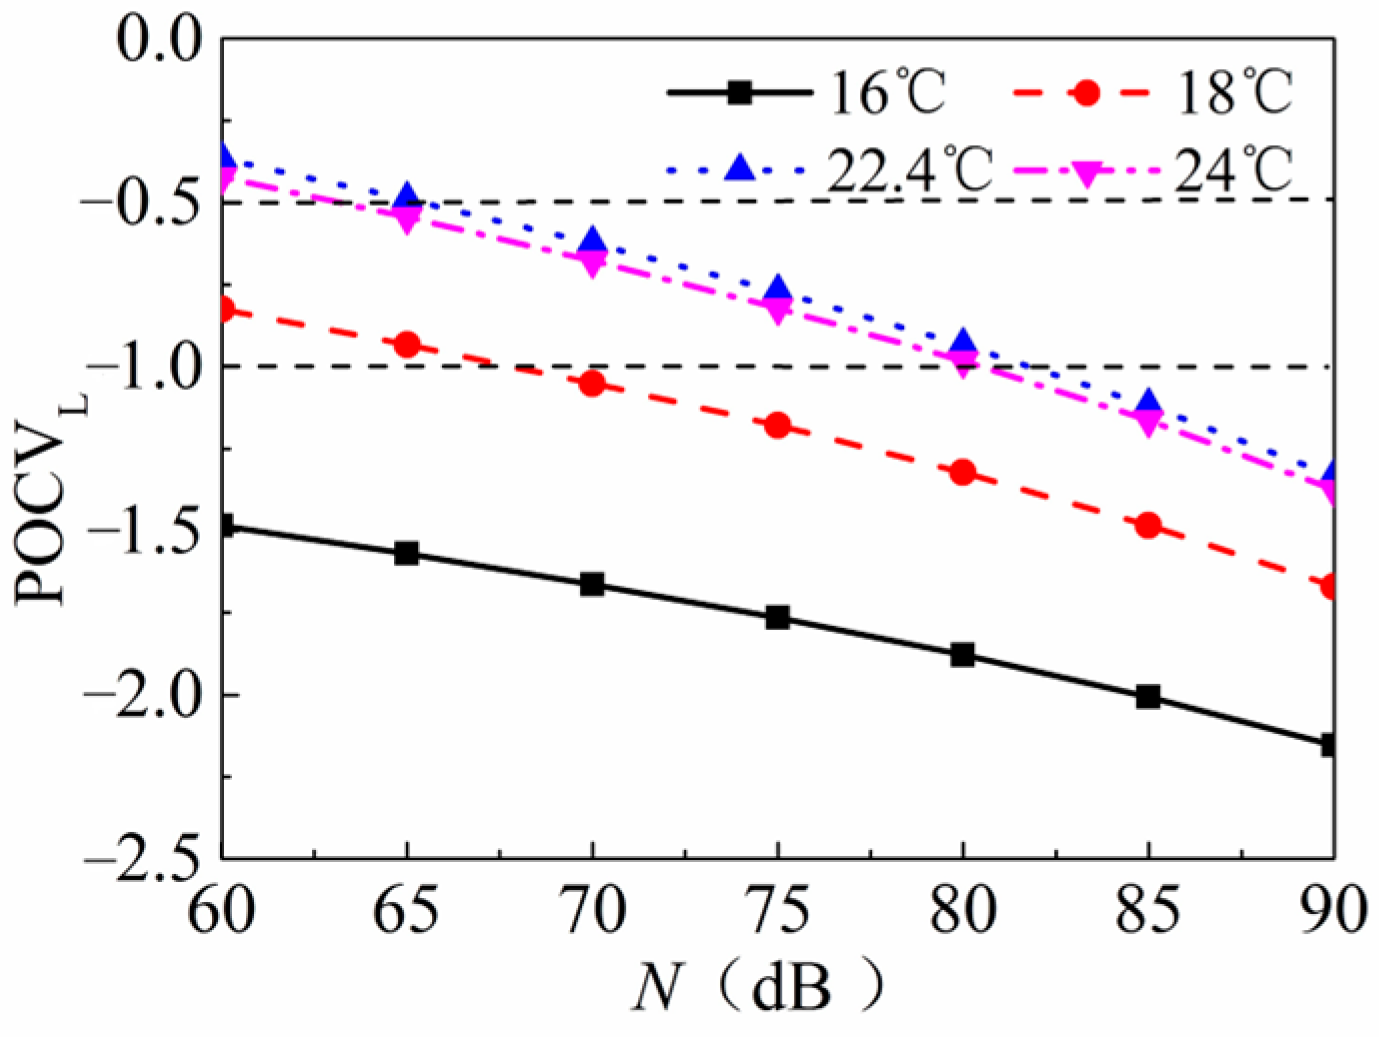
4.2.3. Acoustic Environment Differences Under Low Pressure

The lower the acoustic environment noise level, the more comfortable it was. Both domestic and international regulations set an upper noise limit. In accordance with the regulations for the thermal comfort zone, acoustic comfort was classified into Level I and Level II, as shown in Table 10.
The noise levels under standard atmospheric pressure in Table 10 were basically consistent with references [42,43,44,45,46,47]. Moreover, the noise limits recommended in Table 10 were more suitable for high-background-noise areas, such as train carriages or aircraft cabins. The noise limits increased by 1~2 dB at both acoustic comfort level I and level II under low pressure. This also indicated that lower pressure had an impact on the acoustic environment evaluation and enhanced the subjects’ tolerance to noise. According to the analysis in Section 4.1.3, when the atmospheric pressure decreased, the air density decreased, and the speed of sound remained basically unchanged. However, the air characteristic impedance decreased. The human middle ear also plays a role in acoustic impedance matching in sound transmission. The sound energy transmitted from the middle ear to the inner ear was calculated under standard atmospheric pressure and low pressure, respectively. The sound energy under low pressure was 15.6% less than that under standard atmospheric pressure [65,66]. The low-pressure factor had an impact on the human ear’s physiological function. Low-pressure hypoxia hinders the conversion of sound energy to nerve impulses, thereby increasing the auditory threshold.
Therefore, there were two aspects to explain why the acoustic comfort votes and tolerance were higher under low pressure than under standard atmospheric pressure. First, the sound energy transmitted from the external auditory canal to the inner ear was reduced under low pressure. Second, the hypoxia caused by lower pressure led to disorders in the physiological mechanisms of the inner ear and a decrease in the auditory threshold.

4.3. Differences Analysis in Human Overall Comfort Evaluation Under Low Pressure

Through the above analysis, the single-environment comfort vote showed significant differences under low pressure. The indoor environment contains multiple parameter variables. Different variables have compound effects on the overall comfort evaluation under low pressure. This requires further analysis and discussion.

4.3.1. The Influence of the Factor Unit Changes on the Overall Comfort

1. Operative temperature influence on POCVL
Taking the winter conditions as an example, the influence of operative temperature on the overall comfort evaluation was analyzed under low pressure. When the atmospheric pressure decreased, Figure 10 showed that the POCVL variation trend was the same as that under standard atmospheric pressure [52]. Taking to = 22.4 °C as the center, when the temperature increased or decreased, the changes in POCVL gradually increased. Under low pressure, the indoor temperature needed to be increased by 1~1.5 °C to obtain the same overall comfort evaluation as under standard atmospheric pressure. That is, a slightly warm environment could improve the POCVL under low pressure.
In Figure 11, with the noise level N = 60 dB, the changes in POCVL per operative temperature unit change were different. The POCVL change columns were connected in sequence, and the change trend followed a quadratic curve. The illuminance conditions corresponding to the curve positions from high to low were 550 lx, 250 lx, and 1000 lx. The closer the illuminance condition was to the luminous comfort zone, the greater the POCVL change caused by the to change.
As shown in Figure 7, the maximum difference in POCV caused by a unit change in operative temperature was about 0.15 under standard atmospheric pressure [52]. The difference in POCVL ranged from 0 to 0.3 under low pressure, representing a doubling of the variation. When the operative temperature decreased, the temperature difference for heat transfer increased, and the total heat loss from the human body increased [77]. Lower pressure also increases the body’s heat loss. Therefore, low pressure had a greater influence at lower temperatures.
From the above analysis, the influence of a unit change in operative temperature on POCVL was non-uniform. When both the noise level and the illuminance were in the comfort zone, the operative temperature became the dominant factor affecting POCVL. However, as the other two parameters deviated from the comfort zone, the dominant role of the operative temperature was weakened. Changes in operative temperature more easily led to discomfort under low pressure.
2. Illuminance’s influence on POCVL
Figure 12 shows the POCVL variation with illuminance. Taking ∆E = 100 lx as the unit variable, it led to a non-uniform change in POCVL. When POCVL was in the higher comfort zone of E [500 lx, 600 lx], the POCVL change was gradual. As the illuminance either increased or decreased, the variation in POCVL increased.
In Figure 13, let to = 22.4 °C. The 100 lx change is represented on the x-coordinate, while the |∆POCVL| change is represented on the y-coordinate. The maximum difference in |∆POCVL| increased to 0.6 under low pressure. Compared with the maximum value of |∆POCV| of 0.3 under standard atmospheric pressure [52], it nearly doubled.
Connecting the differences in |∆POCVL| in sequence, the curve followed a quadratic function. The curves from high to low corresponded to the noise levels of 60 dB, 70 dB, and 80 dB. When the noise level was close to the comfort zone, the greater the illuminance change, the greater the POCVL change. In this case, illuminance was the main influencing factor for POCVL.
3. Noise level’s influence on POCVL
Figure 14 shows the variation trend of POCVL with noise level. The higher the noise level, the lower the POCVL and the worse the comfort. The variation trend of POCVL with the noise level was the same as that under standard atmospheric pressure. However, as seen in Figure 9, POCVL under low pressure was higher than that under standard atmospheric pressure between 75 dB and 90 dB. The change in POCV under different pressures was not significant between 60 dB and 75 dB.
In Figure 15, the illuminance E was set to 551 lx. A change of ΔN = 5 dB was taken as the x-coordinate, and |ΔPOCVL| was taken as the y-coordinate, comparing the impact of unit changes in noise level on POCVL. The change columns of |∆POCVL| were connected in sequence, and their trend followed a linear pattern. The operative temperatures corresponding to the slopes of the straight line, in decreasing order, were 22.4 °C, 18 °C, and 16 °C. The closer the operative temperature was to the comfort zone, the larger the slope, meaning a larger |∆POCVL|. At this point, the noise level became the dominant influencing factor on POCVL.
The analysis of the above three points is summarized as follows:
(1)
When ∆to = 1 °C, ∆E = 100 lx, and ∆N = 5 dB, the magnitude of the changes in POCVL caused under low pressure was equivalent. Thus, the order of influence of the operative temperature, illuminance, and noise level on POCVL can be determined: to > N > E.
(2)
The influence of operative temperature and illuminance on POCVL under low pressure was approximately twice as large as that under standard atmospheric pressure.
(3)
The dominant influencing factor for POCVL changed with the comfort states of other factors. The more a single factor deviated from the comfort zone, the greater the change in POCVL caused by its variation, and the more likely this factor became the dominant influencing factor for POCVL.

4.3.2. The Overall Comfort Peak and the Tolerable Zone

1. The overall comfort peak
When the overall comfort vote reached its peak, the thermal environment, luminous environment, and acoustic environment were required to simultaneously reach their highest vote values. The peak value of POCV/POCVL was calculated using the logical “AND” method, as shown in Equation (8). The subscript “max” indicates the evaluation peak for each individual factor.
POCV(max)/POCVL(max) = y1(max)y2(max)y3(max)
The parameters corresponding to the peak values can be calculated from the fitting formulas for the thermal environment and luminous environment. The lower the noise level in the acoustic environment, the higher the subjects’ overall comfort vote. Within the experimental conditions, the minimum noise level was 60 dB. The peak values of POCV/POCVL are listed in Table 11.
Under standard atmospheric pressure, the evaluation peaks were −0.325 in winter and −0.295 in summer. The body’s sensory perception cannot distinguish the difference in POCV between summer and winter. As a result, the evaluation peaks for winter and summer tended to be consistent. The POCV under low pressure was slightly lower than that under standard atmospheric pressure, indicating that low-pressure conditions led to a decrease in the overall comfort vote. When −0.5 < POCV (max) < 0, the overall comfort vote was between comfortable and slightly uncomfortable, which was still considered a neutral state by most people. A non-zero value indicated that a small number of people felt uncomfortable or dissatisfied due to individual subjective differences.
Among the individual environments, the direction of comfort evaluation changes caused by low pressure was inconsistent. Low pressure reduced comfort evaluations in the thermal and luminous environments but increased comfort evaluation in the acoustic environment. Therefore, the overall comfort change under low pressure still requires analysis and calculation.
The subjects in this study were adequately clothed, properly insulated, and in a quiet state. The requirement for the thermal environment was not that the hotter conditions in winter and the cooler conditions in summer would be more comfortable. Instead, it was sufficient to remain on both sides of the peak comfort level. Similarly, for the indoor luminous environment, higher illuminance did not necessarily mean better comfort. Instead, it only needed to fall within both sides of the peak while meeting people’s visual task requirements and avoiding visual fatigue. Therefore, from the energy conservation perspective, the comfortable zone in winter should be on the left side of the temperature peak (indicating a relatively cooler environment), while in summer, it should be on the right side (indicating a relatively warmer environment). For illuminance, the offset strategy was to shift toward the left side.
2. The overall comfort tolerable zone
The main characteristic of the synthetic model for human overall comfort vote was that when a certain indicator reached the intolerable level (penalty zone), the evaluation value would reach its lower limit (indicating an intolerable condition), even if all other indicators were satisfactory. Therefore, it was necessary to calculate the parameters reaching this lower limit. The tolerable zone of the indoor overall environment had been obtained, which also provided data support for preventing the overall comfort from reaching its lower limit. The intolerable (penalty) zone was determined using the logical “OR” method. That is, as long as yi = −4, then POCV/POCVL = −4, as shown in Equation (9). The tolerable zone was defined as the complement of the intolerable critical value.
{POCV/POCVL = −4} = {y1} ∪ {y2} ∪ {y3}
Among the three parameters for overall comfort vote, the noise level was a limit value. Therefore, the tolerable critical values of operative temperature and illuminance formed a closed area, as shown in Figure 16. The parameters within this closed area represented the overall comfort tolerable zone. However, for the operating points outside the closed area, or those exceeding the noise level limit, they all fell within the overall comfort intolerable zone.
As shown in Figure 16, the critical value of the operative temperature in winter increased by 2~3 °C, while that in summer remained basically unchanged under 80 kPa. This indicated that subjects had a greater preference for a relatively warmer environment in winter under low pressure. The low-pressure factor accelerated the entry of the thermal environment into the intolerable zone. The illuminance tolerable zone shifted toward the lower values. Lower illuminance alleviated the low-pressure factor’s impact on visual performance. Through the calculation of the function y3, the critical value of the noise level was found to have increased by 2 dB. In the acoustic environment, the tolerance to noise was found to have increased due to the low-pressure factor. Therefore, the low-pressure factor slowed down the process of the acoustic environment reaching the intolerable zone.

4.3.3. The Overall Comfortable Zone

Scholars from home and abroad do not share a consistent view on the definition of “comfort”. Both Gagge [78] and Fanger [79] believe that “comfort” is a neutral state. However, Cabance [37] argues that the pleasant feeling brought by comfort can only be observed in a dynamic state. The overall comfort zone discussed in this paper mainly refers to the physiological and psychological comfort sensation. It combines the perception and balance judgment of the overall environment through one’s own sensory organs.
1. Basis for the overall comfort zone division
Based on the classification principles of thermal comfort levels in China’s standard [55] and the international standard ISO 7730 [80], thermal comfort was divided into two levels: a higher thermal comfort level I and a lower thermal comfort level II. In most indoor environments, apart from operative temperature, illuminance and noise level also affect people’s comfort [81,82]. Therefore, similar classification principles were adopted for POCV/POCVL with POCV = −1 (slightly uncomfortable) serving as the threshold for the comfort zone. The POCV range from −1 to 0 was defined as the comfort zone, which was then evenly divided into two evaluation intervals: −0.5 ≤ POCV < 0, representing the higher overall comfort level I, and −1 ≤ POCV < −0.5, representing the lower overall comfort level II.
2. Commonly used overall comfort zone nomograms
According to the previous analysis, parameter changes such as operative temperature, illuminance, pressure, and noise level all caused changes in POCV/POCVL. If the POCV/POCVL is to reach the comfort zone, the influencing factors need to each reach a certain range and then interact to achieve this condition.
In the indoor environment, parameters such as operative temperature and illuminance can be controlled manually. These two parameters’ values directly affect the building’s energy consumption simultaneously. Therefore, when drawing the nomogram for the overall comfort zone, the operative temperature and illuminance were respectively taken as the x-coordinate. The noise level depends on the sound insulation performance of the enclosure structure and the absorption characteristics of indoor surface materials. It is also related to the background noise generated by the equipment’s operation. As it is difficult to control manually, the noise level was used as the y-coordinate. In daily life, a quiet conversation is about 20 dB, while a car honking can reach 90 dB [83]. The y-coordinate range was limited to between 20 dB and 90 dB. According to the above principles, the commonly used nomograms for the overall comfort zone were drawn, as shown in Figure 17 and Figure 18.
As shown in Figure 17 and Figure 18, there was an interaction among the parameters. It was possible to “compensate” for the lower comfort levels of certain parameters by improving the comfort levels of other parameters in order to achieve or enhance the overall comfort vote. This “compensation” approach could also be used to maintain a higher overall comfort vote while reducing energy consumption.

5. Conclusions

This study applied the effective-function method to conduct experimental research under standard atmospheric pressure and low pressure. The research analyzed and compared the human overall comfort evaluations under different pressures. The main conclusions were as follows:
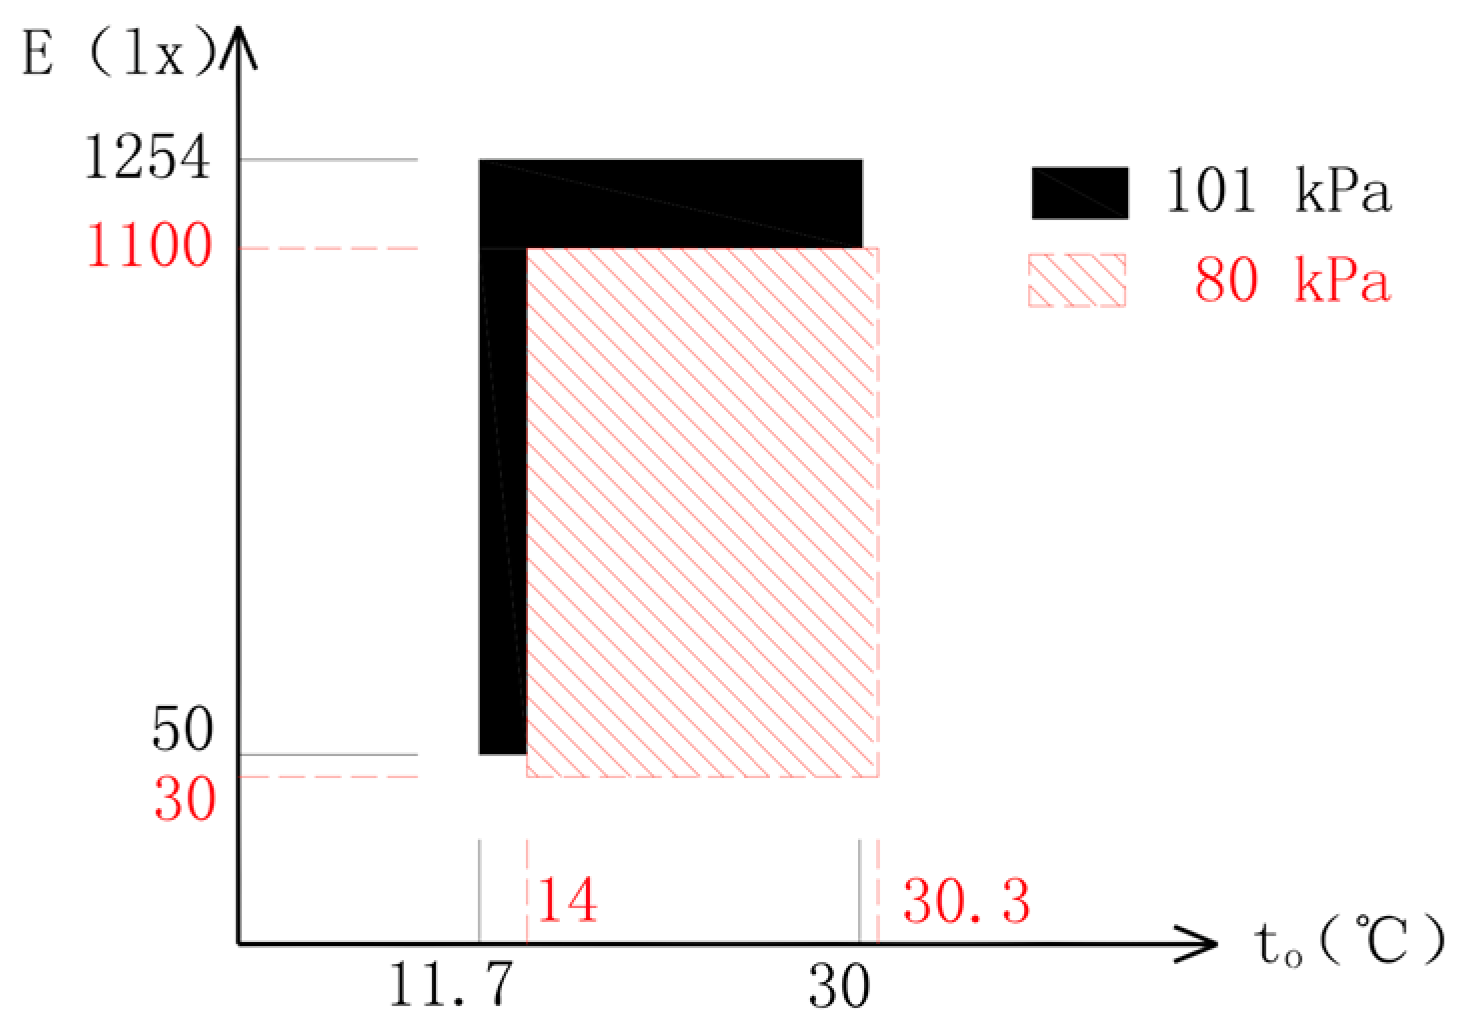
  • There were differences in comfort votes for individual environments under low pressure. At 80 kPa, the operative temperature of the comfort zone increased in winter. The luminous comfort zone narrowed, and the luminous comfort vote decreased. However, the acoustic comfort vote increased, indicating an enhanced noise tolerance.
  • The ranking of the factors’ unit effects on the overall comfort vote was as follows: to > N > E. In the overall comfort zone, changes of 1 °C, 100 lx, or 5 dB caused comparable POCV/POCVL changes. When a certain factor deviated from the overall comfort zone, it became the dominant factor affecting POCV/POCVL.
  • Under low pressure, energy-saving strategies were determined for the POCVL peak: selecting a relatively cold environment in winter and a relatively warm environment in summer. The illuminance selection shifted to the left side of the x-coordinate. The tolerable zone became smaller, making it easier to reach the lower limit.
  • Nomograms of the commonly used overall comfort zone were drawn. Through parameter interactions, using “superior” parameters to compensate for “inferior” ones can improve the human overall comfort vote.
However, this study has several limitations that should be acknowledged. First, the group structure of the subjects was relatively homogeneous, which may limit the generalizability of the results. Second, the experiment was conducted in a plateau simulation cabin, which may not fully reflect real-world conditions. Finally, the measurement of certain parameters, such as wind speed, color temperature, and sound frequency, was not included.
Future research could address these limitations in several ways. Expanding the group structure of the subjects and conducting field studies could help validate the findings. The theoretical model could be further improved and its applications expanded. Additionally, future work could incorporate the measurement of airflow organization, odor, and vibration to provide a more comprehensive understanding of human overall comfort.

Author Contributions

The numerical simulation and analysis were carried out by T.G. and Q.L. T.G. wrote the manuscript; S.H. supervised the work; all authors discussed the results and contributed to the manuscript. All authors have read and agreed to the published version of the manuscript.

Funding

The work was supported by Shandong Provincial Natural Science Foundation No. ZR2021ME051 and Qingdao Agriculture University Doctoral Start-up Fund No. 20210055.

Institutional Review Board Statement

The study was conducted in accordance with the Declaration of Helsinki and approved by the Qingdao University of Technology.

Informed Consent Statement

Informed consent was obtained from all subjects involved in the study.

Data Availability Statement

Data are contained within the article.

Acknowledgments

We would like to thank Songtao Hu of Qingdao University of Technology, Lab of Plateau Environment Simulation, and Qingqing Li of Qingdao Agricultural University, Institute of Architectural Engineering, for their precious support with this research.

Conflicts of Interest

We declare that this research was conducted in the absence of any commercial or financial relationships that could be construed as a potential conflict of interest.

Appendix A

A. Table of symbolic parameters.
SymbolDescription (Unit)
CThe overall evaluation value of the effective function
ξ The composite function of yi and ω i
ω i The single-factor weight value
y1~y3 (yi)The dimensionless function of a single environment
y′1~y3 (y′i)The dimensionless function of a single environment under low pressure
LThe low evaluation index of a single environment
toOperative temperature ( ° C )
EIlluminance (lx)
NNoise level (dB)
POCVThe evaluation value of punitive substitution, namely the Predicted Overall Comfort Vote
POCVLThe evaluation value of punitive substitution under low pressure, namely the Predicted Overall Comfort Vote Low

References

  1. Liu, F.; Yan, L.; Meng, X.; Zhang, C. A review on indoor green plants employed to improve indoor environment. J. Build. Eng. 2022, 53, 104542. [Google Scholar] [CrossRef]
  2. Rasheed, H.; Jayasree, T.K. The multifaceted role of indoor plants: A comprehensive review of their impact on air quality, health, and perception. Energy Build. 2025, 330, 115312. [Google Scholar] [CrossRef]
  3. Feige, A.; Wallbaum, H.; Janser, M.; Windinger, L. Impact of sustainable office buildings on occupant’s comfort and productivity. J. Corp. Real Estate 2013, 15, 7–34. [Google Scholar] [CrossRef]
  4. Gabay, H.; Meir, I.A.; Schwartz, M.; Werzberger, E. Cost-benefit analysis of green buildings: An Israeli office buildings case study. Energy Build. 2014, 76, 558–564. [Google Scholar] [CrossRef]
  5. Clements-Croome, D. Creative and productive workplaces: A review: Intelligent Buildings International. Intell. Build. Int. 2015, 7, 164–183. [Google Scholar] [CrossRef]
  6. Al Horr, Y.; Arif, M.; Kaushik, A.; Mazroei, A.; Katafygiotou, M. Occupant productivity and office indoor environment quality: A review of the literature. Build. Environ. 2016, 105, 369–389. [Google Scholar] [CrossRef]
  7. Yang, W.; Moon, H.J. Combined effects of acoustic, thermal, and illumination conditions on the comfort of discrete senses and overall indoor environment. Build. Environ. 2018, 148, 623–633. [Google Scholar] [CrossRef]
  8. Dong, X.; Wu, Y.; Chen, X.; Li, H.; Cao, B.; Zhang, X.; Yan, X.; Li, Z.; Long, Y.; Li, X. Effect of thermal, acoustic, and lighting environment in underground space on human comfort and work efficiency: A review. Sci. Total Environ. 2021, 786, 147537. [Google Scholar] [CrossRef]
  9. Huang, H.J.; Wang, Y.J.; Zheng, K.L.; Ge, Y.X.; Tao, Y.L.; Luo, H.R.; Zeng, M.Q. Research and Analysis on the Comfort of Classroom Physical Environment: A Case Study of Nankai Middle School in Chongqing. Lamp Illum. 2016, 40, 8–11+26. [Google Scholar] [CrossRef]
  10. Newsham, G.R. Effects of office environment on employee satisfaction: A new analysis. Build. Res. Inf. 2016, 44, 34–50. [Google Scholar]
  11. Xue, P.; Mak, C.M.; Ai, Z.T. A structured approach to overall environmental satisfaction in high-rise residential buildings. Energy Build. 2016, 116, 181–189. [Google Scholar] [CrossRef]
  12. Xiao, A.; Cheng, B.; Zhang, J.; Peng, H.Y.; Lai, Y.M.; Zeng, F.X.; Liu, T.; Zhu, F. A study of acoustic-light-thermal effects on pedestrians’ overall comfort in a Cfa-climate campus during the summer. J. Therm. Biol. 2024, 121, 103839. [Google Scholar] [CrossRef] [PubMed]
  13. Zeng, F.; Liang, S.; Zhang, J.; Chen, Y.; Feng, S.; MO, Q.; Zhou, T.; Lai, Y.; Liu, T.; Wang, S. The effects of acoustic-light-thermal environment quality parameters on pedestrians’ overall comforts in residential districts. Sci. Rep. 2024, 14, 19625. [Google Scholar] [CrossRef] [PubMed]
  14. Wu, H.; Sun, X.; Wu, Y. Investigation of the relationships between thermal, acoustic, illuminous environments and human perceptions—ScienceDirect. J. Build. Eng. 2020, 32, 101839. [Google Scholar] [CrossRef]
  15. Chen, P.; Dai, Y.; Zhen, M. Effects of thermal and acoustic environments on human comfort in urban and suburban campuses in the cold region of China. Environ. Sci. Pollut. Res. 2024, 31, 30735–30749. [Google Scholar] [CrossRef]
  16. Du, M.; Hong, B.; Gu, C.; Li, Y.; Wang, Y. Multiple effects of visual-acoustic-thermal perceptions on the overall comfort of elderly adults in residential outdoor environments. Energy Build. 2023, 283, 112813. [Google Scholar] [CrossRef]
  17. Zhao, Y.; Li, D. Multi-domain indoor environmental quality in buildings: A review of their interaction and combined effects on occupant satisfaction. Build. Environ. 2022, 228, 109844. [Google Scholar] [CrossRef]
  18. Wu, H.; Wu, Y.; Sun, X.; Liu, J. Combined effects of acoustic, thermal, and illumination on human perception and performance: A review. Build. Environ. 2020, 169, 106593. [Google Scholar] [CrossRef]
  19. Guan, H.; Hu, S.; Lu, M.; He, M.; Mao, Z.; Liu, G. People’s subjective and physiological responses to the combined thermal-acoustic environments. Build. Environ. 2020, 172, 106709. [Google Scholar] [CrossRef]
  20. Guan, H.; Hu, S.; Liu, G.; Zhang, L. The combined effects of temperature and noise on the comfort perceptions of young people with a normal Body Mass Index. Sustain. Cities Soc. 2019, 54, 101993. [Google Scholar] [CrossRef]
  21. Zhang, Y.; Du, X.; Zhao, S. Research on interaction effect of thermal, light, and acoustic environment on human comfort in waiting hall of high-speed railway station. Build. Environ. 2021, 207, 108494. [Google Scholar] [CrossRef]
  22. Wang, Z.; Zhao, H.; Lin, B.; Zhu, Y.; Ouyang, Q.; Yu, J. Investigation of indoor environment quality of Chinese large-hub airport terminal buildings through longitudinal field measurement and subjective survey. Build. Environ. 2015, 94, 593–605. [Google Scholar] [CrossRef]
  23. Geng, Y.; Yu, J.; Lin, B.; Wang, Z.; Huang, Y. Impact of individual IEQ factors on passengers’ overall satisfaction in Chinese airport terminals. Build. Environ. 2017, 112, 241–249. [Google Scholar] [CrossRef]
  24. Fan, C.; Lin, Y.; Lin, S.; Li, Y.; Wu, F. Influencing factors and mechanism of high-speed railway passenger overall comfort: Insights from source functional brain network and subjective report. Front. Public Health 2022, 10, 993172. [Google Scholar]
  25. Hao, G.S.; Fan, Q.L.; Hu, Q.Z.; Hou, Q. Research progress on the mechanism of cerebral blood flow regulation in hypoxia environment at plateau. Bioengineered 2022, 13, 6353–6358. [Google Scholar] [CrossRef]
  26. Herbig, B.; Norrefeldt, V.; Mayer, F.; Reichherzer, A.; Lei, F.; Wargocki, P. Effects of increased recirculation air rate and aircraft cabin occupancy on passengers’ health and well-being—Results from a randomized controlled trial. Environ. Res. 2023, 216, 114770. [Google Scholar] [CrossRef]
  27. Guo, C.; Xu, J.; Wang, M.; Tao, Y.; Lu, Y.; Sun, Z. Study on Oxygen Supply Standard for Physical Health of Construction Personnel of High-Altitude Tunnels. Int. J. Environ. Res. Public Health 2015, 13, 64. [Google Scholar] [CrossRef]
  28. Wang, H.Y. Research on Human Thermal Comfort Under Medium Activity Level and Low Pressure. Ph.D. Thesis, Xi’an University of Architecture and Technology, Xi’an, China, 2012. [Google Scholar]
  29. Tong, L. Research on the Human Thermal Regulation Model Under Low Pressure Considering the Influence of Local Heat Transfer. Ph.D. Thesis, Qingdao University of Technology, Qingdao, China, 2014. [Google Scholar]
  30. Zhang, J.C. Research on the Influence of Light Environment on Human Comfort under Low Pressure. Master’s Thesis, Qingdao University of Technology, Qingdao, China, 2014. [Google Scholar]
  31. Li, L. Exploration on the Influence of Acoustic Environment on Human Comfort under Low Pressure. Master’s Thesis, Qingdao University of Technology, Qingdao, China, 2014. [Google Scholar]
  32. Mu, Y.P. Research on the Influence Mechanism of Noise Environment on Human Comfort under Low Pressure. Master’s Thesis, Qingdao University of Technology, Qingdao, China, 2015. [Google Scholar]
  33. Duan, G.; Song, C.; Liu, Y.; Fu, Z.; Zhang, C.; Han, X.; Li, Y.; Zhou, Y. Study on the dynamic effects of plateau hypoxic and cold environment on the thermal adaptation of short-term sojourners in Xizang. J. Therm. Biol. 2024, 119, 13. [Google Scholar] [CrossRef]
  34. Haiyan, Y.; Hongrui, L.I.; Jing, C.; Yang, L. Research on Influences of Plateau Climate on Thermal Adaptation of Human Body. Build. Sci. 2017, 33, 29–34. [Google Scholar]
  35. Zhao, G.H. Research on the Application of the Contrast Sensitivity Function in the Appraisal of Visual Function. Master’s Thesis, Air Force Military Medical University of the Chinese People’s Liberation Army (The Fourth Military Medical University), Xi’an, China, 2017. [Google Scholar]
  36. 2019 ASHRAE Handbook, HVAC Applications; ASHRAE: Atlanta, GA, USA, 2019; 30329: 1791 Tullie Circle, N.E.
  37. Zhu, Y.X. Building Environment, 5th ed.; China Architecture & Building Press: Beijing, China, 2024; Volume 8, p. 303. [Google Scholar]
  38. Iik, Z. Assessment of LEED Green Building Certificate Indoor Evironmental Quality Parameters from the Perspective of Occupant Satisfaction and Cost Performance. Megaron 2016, 11. [Google Scholar] [CrossRef]
  39. Wang, L.Z.; Yu, L.P. Research on the Selection and Comprehensive Application of Utility Function Synthesis Methods in Journal Evaluation. J. Intell. 2012, 31, 7. [Google Scholar] [CrossRef]
  40. Yu, L.P.; Pan, Y.T.; Wu, Y.S. A Comparative Study on the Utility Function Synthesis Methods in Scientific and Technological Evaluation. Sci. Technol. Prog. Policy 2010, 27, 106–110. [Google Scholar]
  41. Al-Salih, W.Q.; Esztergár-Kiss, D. Linking Mode Choice with Travel Behavior by Using Logit Model Based on Utility Function. Sustainability 2021, 13, 4332. [Google Scholar] [CrossRef]
  42. GB3096-2008; Environmental Quality Standards for Noise. China Environmental Science Press: Beijing, China, 2008.
  43. China National Environmental Monitoring Centre. Emission Standards for Industrial Enterprises Noise at Boundary; China Environmental Science Press: Beijing, China, 2008. [Google Scholar]
  44. GB22337-2008; Emission Standard for Community Noise. China Environmental Science Press: Beijing, China, 2008.
  45. GB12525-2011; Emission Standards and Measurement Methods of Railway Noise on the Boundary Alongside Railway Line. China Environmental Science Press: Beijing, China, 2011.
  46. GB9660-1988; Environment Standard of Aircraft Noise Around Airport. China Environmental Science Press: Beijing, China, 1988.
  47. GB50118-2022; Code for Design of Sound Insulation of Civil Buildings. China Environmental Science Press: Beijing, China, 2022.
  48. GB50034-2024; China Academy of Building Research. Standard for Lighting Design of Buildings. China Architecture & Building Press: Beijing, China, 2024.
  49. TB10089-2015; Code for Design of Lighting for Railways. National Railway Administration of the People’s Republic of China: Beijing, China, 2018.
  50. ASHRAE Standard 55-2013; Thermal Environmental Condition for Human Occupancy; American Society of Heating. Refrigerating and Air-Conditioning Engineers, Inc.: Atlanta, GA, USA, 2013.
  51. Du, D.; Pang, Q.H.; Wu, Y. Modern Comprehensive Evaluation Methods and Case Selections, 3rd ed.; Tsinghua University Press: Beijing, China, 2015. [Google Scholar]
  52. Guo, T.M.; Hu, S.T.; Liu, G.D. Evaluation Model of Specific Indoor Environment Overall Comfort Based on Effective-Function Method. Energies 2017, 10, 1634. [Google Scholar] [CrossRef]
  53. Arun, S.; Radha, G.; Richie, M. Indoor Environmental Quality; Springer: Berlin/Heidelberg, Germany, 2020. [Google Scholar]
  54. Zhai, G.Q. Low—Frequency Noise; Zhejiang University Press: Hangzhou, China, 2013. [Google Scholar]
  55. GB50736-2012; Design Code for Heating, Ventilation and Air Conditioning of Civil Buildings. China Architecture & Building Press: Beijing, China, 2012.
  56. Boos, C.J.; Kyo, B.; Luke, S.; Josh, B.D.; Woods, D.R.; Mark, S.; Tom, Q.; Adrian, M. High Altitude Affects Nocturnal Non-linear Heart Rate Variability: PATCH-HA Study. Front. Physiol. 2018, 9, 390. [Google Scholar] [CrossRef]
  57. Álvarez-Herms, J.; Julia-Sanchez, S.; Gatterer, H.; Corbi, F.; Viscor, G.; Burtscher, M. Effects of a Single Power Strength Training Session on Heart Rate Variability When Performed at Different Simulated Altitudes. High Alt. Med. Biol. 2020, 21, 292–296. [Google Scholar] [CrossRef]
  58. West, J.B. Prediction of barometric pressures at high altitude with the use of model atmospheres. J. Appl. Physiol. 1996, 81, 1850–1854. [Google Scholar] [CrossRef] [PubMed]
  59. Guo, T.M.; Hu, S.T.; Liu, G.D. A preliminary study on indoor environmental comfort under low pressure. Sichuan Build. Sci. Res. 2016, 42, 4. [Google Scholar] [CrossRef]
  60. Raghu, B.R.; Krishna, J.V. A Comprehensive Analysis of Diabetic Retinopathy Using Deep Learning Techniques. In Proceedings of the 2024 4th International Conference on Mobile Networks and Wireless Communications (ICMNWC), Tumkuru, India, 4–5 December 2024. [Google Scholar] [CrossRef]
  61. Zhao, G.H.; Ding, Y.F.; Cao, R.D.; Chen, T.; Yan, M.W.; Wang, B.; Zhang, Z.M. Effects of mild to moderate hypoxia on visual contrast sensitivity and reaction ability. Chin. J. Aerosp. Med. 2017. [Google Scholar] [CrossRef]
  62. Bosnyak, I.; Farkas, N.; Molitor, D.; Meresz, B.; Patko, E.; Atlasz, T.; Vaczy, A.; Reglodi, D. Optimization of an ischemic retinopathy mouse model and the consequences of hypoxia in a time-dependent manner. Int. J. Mol. Sci. 2024, 25, 8008. [Google Scholar] [CrossRef]
  63. He, J.; Wan, H.; Kao, X.B.; Guo, S.W.; Li, L.; Guo, X.W.; Kong, W. Research on the impact of plateau environment on crew operational capability. Chin. J. Ergon. 2023, 29, 53–56. [Google Scholar]
  64. Zhang, H.B.; Yao, Q.; Bu, W.P.; Su, F.; Wang, L.P.; Wang, L.; Zhao, X.L.; Liu, L. Preliminary study on the human-machine adaptability of physiological functions in flight personnel. J. Mil. Med. Logist. 2024, 38, 793–796. [Google Scholar]
  65. Du, G.H. Fundamentals of Acoustics, 3rd ed.; Nanjing University Press: Nanjing, China, 2012. [Google Scholar]
  66. Jiang, Z.R. Human Physiology, 3rd ed.; Science Press: Beijing, China, 2024; Volume 5. [Google Scholar]
  67. Zhou, B.; Jiao, B.; Chen, B.; Sun, C.; Ding, L.; Ao, T. Physiological and perceptual responses of exposure to different thermal environments at low pressure (61.6 kPa). Build. Environ. 2022, 226, 109774. [Google Scholar] [CrossRef]
  68. Zhang, Y.; Zhang, X.; Han, J.; Liu, X. Study on the outdoor thermal comfort of college students under different activity intensities in a high-altitude climate zone. Front. Public Health 2024, 12, 1365470. [Google Scholar] [CrossRef] [PubMed]
  69. Liu, G.D. Study on Human Thermal Comfort Within Lower-Pressure Environment of Asymptomatic Altitude Reaction. Ph.D. Thesis, Xi’an University of Architecture and Technology, Xi’an, China, 2008. [Google Scholar]
  70. GB51348-2019; Standard for Electrical Design of Civil Buildings. National Standards of the People’s Republic of China. China Architecture & Building Press: Beijing, China, 2019.
  71. Yin, D.C.; Zhang, Y.; Yu, L.H.; Shi, W.R.; Wen, D.Q.; Tu, L.; Wang, G.Y.; Wu, J.B.; Xue, L.H. Sensitivity of visual function indexes in hypoxic environment. Aviat. Med. Air Force 2023, 40, 12–14. [Google Scholar] [CrossRef]
  72. Yan, W.M.; Wu, F.; Sun, K.; Ma, Y.F.; Chen, W.L.; Wang, T.; Chen, T.; Zhang, Z.M. Effects of Acute Mild to Moderate Hypoxia on Color Vision Contrast Sensitivity in Human Eyes. Med. J. Air Force 2016, 6, 58–59. [Google Scholar]
  73. Jin, E.Z.; Xiao, L.; Yao, J.L.; Liu, P.G.; Wang, B.S.; Shi, H.; Chu, G. Effect of altitude change on train stsffs’ intraocular pressure on highland. Int. Eye Sci. 2013, 13, 4. [Google Scholar] [CrossRef]
  74. Wang, H.; Ma, Q.; Ma, B.A. Effects of Plateau Environment on human health. Med. Inf. 2020, 33, 4. [Google Scholar] [CrossRef]
  75. Xin, X.; Yang, K.; Liu, H.; Li, Y. Hypobaric hypoxia triggers pyroptosis in the retina via NLRP3 inflammasome activation. Apoptosis 2022, 27, 222–232. [Google Scholar] [CrossRef]
  76. Xin, X.; Li, Y.; Liu, H. Hesperidin ameliorates hypobaric hypoxia-induced retinal impairment through activation of Nrf2/HO-1 pathway and inhibition of apoptosis. Sci. Rep. 2020, 10, 19426. [Google Scholar] [CrossRef]
  77. Zhang, X.M. Heat Transfer, 6th ed.; China Architecture & Building Press: Beijing, China, 2014. [Google Scholar]
  78. Olesen, B.M. Thermal Comfort; Bruel & Kjaer: Nærum, Denmark, 1982; Volume 2. [Google Scholar]
  79. Fanger, P.O. Thermal Comfort; Danish Technical Press: Copenhagen, Denmark, 1970. [Google Scholar]
  80. ISO/FDIS7730-2005; Ergonomics of the Thermal Environment-Analysis Determination and Interpretation of Thermal Comfort Using Calculation of the PMV and PPD Indices and Local Thermal Comfort Criteria. ISO: Geneva, Switzerland, 2005.
  81. Xie, H.; Ge, Y.; Luo, F. Effects of socio-economic indicators on perceptions of urban acoustic environments in Chinese megacities. Indoor Built Environ. 2021, 30, 1663–1675. [Google Scholar] [CrossRef]
  82. Zhang, F.; Seshadri Pattupogula VP, D.; Badrinath, C.; Liu, S. Visitors’ satisfaction towards indoor environmental quality in Australian hotels and serviced apartments. Build. Environ. 2023, 244, 17. [Google Scholar] [CrossRef]
  83. Liu, X.T. Building Physics, 3rd ed.; China Architecture & Building Press: Beijing, China, 2010. [Google Scholar]
Figure 1. Plateau simulation cabin.
Applsci 15 03815 g001
Figure 2. The structural dimensions of the simulation cabin and lamp layout.
Applsci 15 03815 g002
Figure 3. Experimental instruments: (a) temperature data acquisition (Agilent34980A); (b) dry–wet bulb thermometer (TJ-103); (c) thermal anemometer (KANOMAX 6004); (d) illumination meter (SIMAA AS803); (e) sound level meter (AWA6291).
Applsci 15 03815 g003
Figure 4. Thermal comfort experimental process.
Applsci 15 03815 g004
Figure 5. Luminous comfort experimental process.
Applsci 15 03815 g005
Figure 6. Acoustic comfort experimental process.
Applsci 15 03815 g006
Figure 7. Comparison of thermal comfort votes under different pressures.
Applsci 15 03815 g007
Figure 8. Comparison of luminous comfort under different pressures.
Applsci 15 03815 g008
Figure 9. Comparison of different pressures of acoustic comfort vote.
Applsci 15 03815 g009
Figure 10. The changes in POCVL with operative temperature (N = 60 dB).
Applsci 15 03815 g010
Figure 11. The POCVL difference changes with operative temperature (N = 60 dB).
Applsci 15 03815 g011
Figure 12. The changes in POCVL with illuminance (to = 22.4 °C).
Applsci 15 03815 g012
Figure 13. The POCVL difference changes with illuminance (to = 22.4 °C).
Applsci 15 03815 g013
Figure 14. The changes in POCVL with noise level (E = 551 lx).
Applsci 15 03815 g014
Figure 15. The POCVL difference changes with noise level (E = 551 lx).
Applsci 15 03815 g015
Figure 16. Tolerable zone of parameters.
Applsci 15 03815 g016
Figure 17. Commonly used nomograms under standard atmospheric pressure.
Applsci 15 03815 g017
Figure 18. Commonly used nomograms under low pressure.
Applsci 15 03815 g018aApplsci 15 03815 g018b
Table 1. The evaluation index of thermal environment, luminous environment, acoustic environment, and overall environment correspond to the comfort of physical stimulation.
Cx0−1−2−3−4
Thermal ComfortComfortSlightly UncomfortableUncomfortableVery UncomfortableUnbearable
Luminous ComfortComfortSlightly Brighter (Dim)Bright (Dark)Very Bright (Dark)Unbearable Bright (Dark)
Acoustic ComfortComfortSlightly UncomfortableUncomfortableVery UncomfortableUnbearable (Caused by noise)
Overall ComfortComfortSlightly UncomfortableUncomfortableVery UncomfortableUnbearable
Note: The above evaluation index value can be taken to a decimal point.
Table 2. Subjects’ essential information.
SexMaximumMinimumAverageStandard Deviation
AgeMale2623241.08
Female2619241.39
Height/cmMale181170174.63.34
Female170150162.56.85
Weight/kgMale1005471.113.65
Female654652.85.72
Table 3. The sample size calculation and statistical power analysis.
Sample Size CalculationStatistical Power Analysis
Test Family:F TestsTest Family:F Tests
Statistical test:Linear multiple regressionStatistical test:Linear multiple regression
Effect Size f20.35Effect Size f20.35
An error probability0.05An error probability0.05
Number of predictors1Number of predictors1
Power (1 − β )0.8N’60
N24Power (1 − β )1 (100%)
Table 4. The information of the equipment manufacturer.
EquipmentNameCityCountry
Agilent34980AKeysihgt TechnoligiesSanta RosaAmerica
TJ-103Tianjin Hongda Instrument FactoryTianjinChina
KANOMAX 6004Kanomax Japan Inc.OsakaJapan
SIMAA AS803Sima Instrument Group Co., Ltd.DongguanChina
AWA6291Hangzhou Aihua Instrument Co., Ltd.HangzhouChina
Table 5. Function of the operative temperature and thermal comfort vote.
Pressure (kPa)SeasonFunction R 2 p
101Winter y 1 = 18.004 + 1.642 t o   0.038 t o 2 0.7710.001 **
Summer y 1 = 84.130 + 6.843 t o 0.139 t o 2 0.9470.012 *
80Winter y 1 = 26.452 + 2.329 t o   0.052 t o 2 0.9250.00 **
Summer y 1 = 101.702 + 8.100 t o 0.162 t o 2 0.8690.048 *
Note: * for p < 0.05 and ** for p < 0.01.
Table 6. Function of illuminance and luminous comfort votes.
Pressure (kPa)Function R 2 p
101 y 2 = 4.573 + 0.012 E 9.206 × 10 6 E 2 0.7560.000 **
80 y 2 = 4.494 + 0.014 E 1.270 × 10 5 E 2 0.7050.000 **
Note: ** for p < 0.01.
Table 7. Function of acoustic comfort vote and N.
Pressure (kPa)FunctionR2p
101 y 3 = 5.965 0.101   N 0.9390.001 **
80 y 3 = 4.751 0.08   N 0.8740.006 **
Note: ** for p < 0.01.
Table 8. Thermal comfort zones in the simulation cabin.
Pressure (kPa)Thermal LevelWinter
(°C)
Transitional Seasons (°C)Summer
(°C)
101I
II
19.1~21.6
17.2~19.1
21.6~24.6
24.0~24.5
24.6~26.0
26.0~27.0
80I
II
20.8~24.0
18.9~20.8
24.5~26.0
26.0~26.8
Table 9. Peak of luminous comfort vote.
Pressure (kPa)Peak Luminous (lx)Comfort Luminous Zones (lx)
101
80
652
551
460~843
382~720
Table 10. Noise level range of acoustic comfort zones.
Pressure (kPa)Comfort LevelNoise (dB)
101I≤64.0
II≤69.0
80I≤64.8
II≤71.0
Table 11. The peak parameters of the overall comfort vote.
Pressure (kPa)Operative Temperature (°C)
Winter/Summer
Illuminance
(lx)
Noise
(dB)
POCV(POCVL)
Winter/Summer
10121.6/24.665260−0.325/−0.295
8022.4/2555160−0.366/−0.399
Disclaimer/Publisher’s Note: The statements, opinions and data contained in all publications are solely those of the individual author(s) and contributor(s) and not of MDPI and/or the editor(s). MDPI and/or the editor(s) disclaim responsibility for any injury to people or property resulting from any ideas, methods, instructions or products referred to in the content.

