1. Introduction
The contamination of agricultural soils with heavy metals, such as lead (Pb), arsenic (As), chromium (Cr), mercury (Hg), and cadmium (Cd), has raised global environmental and public health concerns due to their persistence, bioaccumulating properties, and toxicity to ecosystems and human health [
1,
2,
3,
4]. leading to serious health complications, including kidney dysfunction, osteoporosis, respiratory disorders, and increased carcinogenic risks [
5,
6,
7,
8,
9].
The continuous deposition of these metals in soil not only degrades soil fertility but also facilitates their entry into the food chain, posing severe risks, including kidney dysfunction, osteoporosis, respiratory issues, and increased carcinogenic risk [
5,
6,
7,
8,
9]. Numerous studies have documented heavy metal contamination in agricultural regions worldwide, emphasizing the necessity for continuous monitoring and effective mitigation strategies [
2].
Among these pollutants, Cd is particularly alarming due to its high mobility in soils, strong bioavailability, and persistence in agricultural environments. Unlike other toxic metals, Cd is readily absorbed by crops, especially rice, resulting in direct exposure through dietary intake [
6,
7,
10,
11,
12]. Annual global Cd emissions are estimated to reach 1.0 × 10
6 tons, reflecting its widespread prevalence and ecological impact [
13]. In regions such as Dhaka, Bangladesh, over 90% of agricultural soils are contaminated with Cd and Cr [
14]. Similarly, India’s agricultural soils exhibit elevated Cd concentrations compared to Brazil, South Korea, and China [
15,
16,
17,
18]. In China, approximately 7% of agricultural soils are affected by Cd contamination [
19,
20], with Cd identified as the primary pollutant impacting soil environmental quality [
21]. Despite national-scale mitigation efforts, Cd concentrations in Chinese agricultural soils continue to rise by an average of 4 μg/kg annually [
22,
23].
Research over the past five decades has highlighted a consistent temporal increase in Cd concentrations across various regions of China [
24]. The persistence and cumulative nature of heavy metal contamination, coupled with rapid industrialization, urbanization, and intensive farming, have made Cd pollution a severe and escalating challenge [
25,
26,
27,
28]. However, most studies focus on eastern coastal and northwestern regions, with limited attention paid to tropical areas. Even at the national scale, there are few studies that include the spatiotemporal trends of soil cadmium in tropical regions [
13]. For instance, while Cd concentrations in farmland soils of Ningxia decreased by 0.03 mg/kg between 2017 and 2021 [
29], regions like the Yangtze River Delta experienced fluctuating trends, with Cd levels declining from 0.33 mg/kg in 2014 to 0.29 mg/kg in 2019 [
18]. There are also studies indicating that soil Cd pollution in the Yangtze River Delta region is severe, showing a gradual accumulation trend, but the accumulation rate is gradually slowing down [
30]. The intensification and persistence of Cd pollution underscore the pressing necessity for long-term continuous monitoring [
26,
27].
Tropical agricultural systems, characterized by high temperatures, heavy rainfall, and intensive cropping, exhibit unique heavy metal dynamics compared to temperate regions. Hainan Island, China’s largest tropical island province, presents a unique case for studying trends of contamination with metals. Compared to other metals, such as Ni, Zn, Cr, Cu, Pb, and As, Cd exhibits a significantly higher degree of enrichment in Hainan’s agricultural soils and contributes the most to overall soil pollution [
31,
32]. This suggests that, while other heavy metals are present, Cd remains the primary environmental risk factor in this region.
Historically, Hainan has experienced relatively low pollution levels. However, rapid urbanization, intensive farming practices, and tourism expansion have introduced new complexities to Cd contamination patterns. Additionally, Hainan’s tropical climate—characterized by frequent heavy rainfall and high temperatures—may enhance Cd mobility and alter its bioavailability. While previous studies have investigated spatial distribution, pollution risk, and contamination sources in Hainan’s soils [
31,
33,
34], comprehensive assessments of long-term spatiotemporal trends remain limited [
32], with few addressing the evolution of pollution sources. The primary challenge lies in obtaining extensive, continuous sampling data over long periods. However, advancements in meta-analytic and systematic review methodologies provide opportunities to synthesize existing data and derive meaningful insights into Cd pollution trends [
7,
28].
Therefore, this study utilizes a meta-analysis approach to examine the spatiotemporal trends of Cd pollution in agricultural land soil on Hainan Island, based on measured soil Cd data collected from published literature between 2000 and 2024. The study highlights the regional variability and long-term changes in Cd contamination and also explores the evolution of contamination sources. Furthermore, it quantitatively assesses the contribution of various environmental and anthropogenic factors to Cd pollution in agricultural soils. The findings contribute to a deeper understanding of Cd contamination in tropical agricultural systems, providing valuable insights for promoting sustainable farming practices, improving environmental quality, and mitigating risks to human health. Moreover, the study offers important references for the development of future policies and strategies for managing soil contamination and ensuring agricultural sustainability in tropical regions.
2. Materials and Methods
2.1. Overview of the Study Area
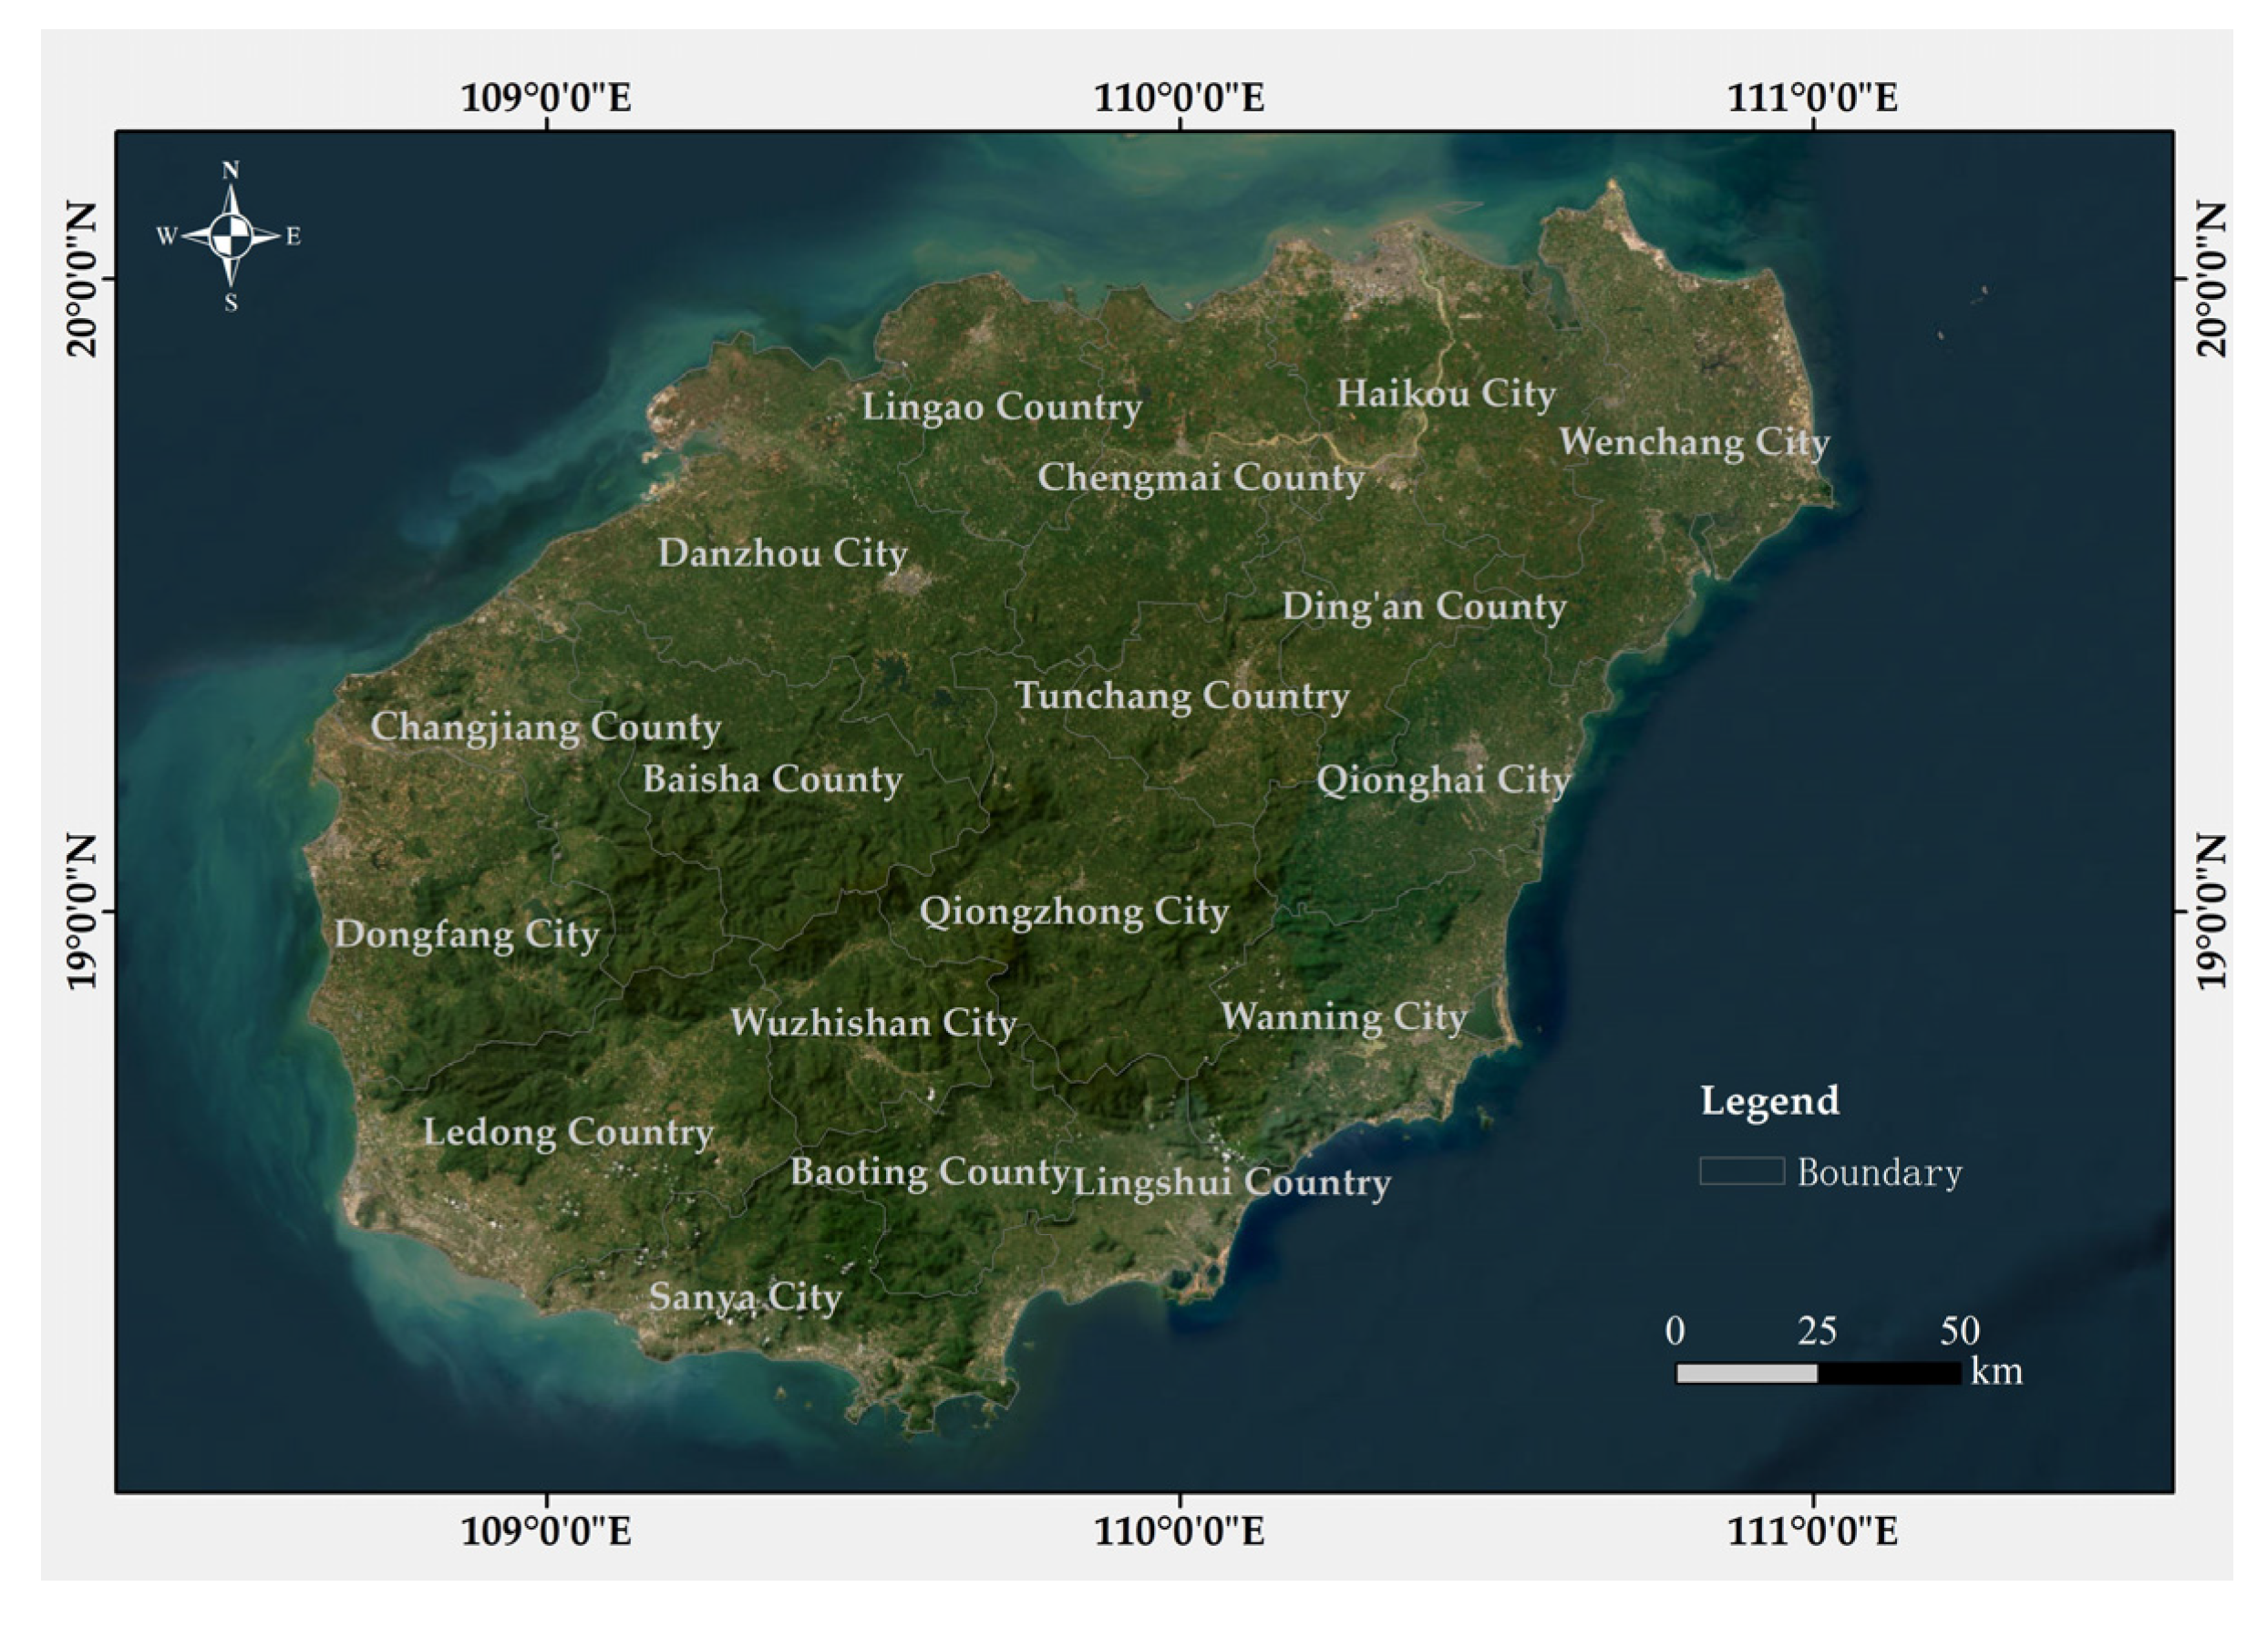
Hainan Island, positioned at the southernmost tip of China (18°10′–20°10′ N, 108°37′–111°03′ E) (
Figure 1), is the nation’s largest tropical province. The island’s warm climate and fertile land support intensive agricultural activities, enabling multiple cropping cycles per year. With the potential for two to three harvests annually, Hainan plays a crucial role in advancing high yield tropical agriculture. Additionally, the region is renowned for its specialized farming systems, including seed cultivation, eco-friendly agricultural practices, and the large-scale production of off-season fruits and vegetables, which contribute significantly to national and international markets [
35].
2.2. Data Sources
Research data were primarily gathered from published literature indexed in major academic databases, including CNKI (
https://www.cnki.net/) and Web of Science (
https://www.webofknowledge.com/). These sources provide extensive research on Cd contamination in agricultural soils across Hainan Island.
Search terms included “Hainan”, “cadmium”, “heavy metal pollution”, “farmland”, and “agricultural land”, resulting in an initial collection of 1278 articles.
To compile a comprehensive dataset, a structured literature search was performed across CNKI and Web of Science, targeting studies published between 2000 and 2024 on Cd contamination in Hainan’s agricultural soils. Search terms included “Hainan”, “cadmium”, “heavy metal”, “farmland”, “cultivated land”, and “agricultural land”, resulting in an initial collection of 1278 articles.
The selection process was guided by two main exclusion stages: exclusion based on abstracts and titles, and exclusion based on full-text content (
Figure 2).
Step 1: Exclusion Based on Abstracts and Titles
A preliminary review of abstracts and titles narrowed the dataset to 143 articles, excluding studies in which the following were true:
- (1)
Titles or abstracts did not mention “cadmium”;
- (2)
Studies were not conducted in Hainan;
- (3)
Research focused on non-soil subjects, such as crops or water;
- (4)
Non-agricultural land was studied, such as mining areas;
- (5)
The research area was not precisely described, and vague terms like “a certain place” were used.
Step 2: Exclusion Based on Full-Text Content
To establish a high-quality dataset, a rigorous selection framework was applied to assess full-text articles, ensuring reliability and methodological consistency. The criteria were as follows:
- (1)
Studies must be based on field sampling of agricultural soils rather than controlled laboratory experiments.
- (2)
Surface soil samples (0–15 cm or 0–20 cm) must be collected from agricultural fields.
- (3)
The research area or scope (e.g., city/latitude and longitude) must be explicitly defined, along with detailed information on sampling points (e.g., quantity and location).
- (4)
The Cd content statistics must be explicitly reported, including mean, standard deviation, range, and coefficient of variation.
- (5)
Sampling time must be recorded; if it was missing, it was estimated as ‘publication year—2’ for consistency.
- (6)
All sampling and analytical procedures must be strictly followed to meet certified industry standards to ensure data comparability, reproducibility, and compliance with international environmental monitoring frameworks. Adherence to these protocols minimizes methodological biases and enhances the reliability of risk assessments.
- (7)
Rigorous quality assurance and quality control procedures must be followed during soil preparation and analysis.
Following a detailed full-text assessment, 60 articles were deemed suitable based on predefined selection criteria. After eliminating duplicate records, 38 unique articles (see
Table S1) were included in the final dataset to ensure data reliability and representativeness, covering 4110 sampling points. These sampling points were distributed across Hainan Island to ensure geographical diversity and representativeness.
2.3. Data Extraction
The data extraction process involved collecting key information across the following dimensions:
Literature Metadata: Includes the title, author, publication year, and journal.
Study Area Details: Geographic location or coordinates, administrative division, and area size (where unspecified, inferred from administrative data or statistical yearbooks).
Soil pH: Predominantly acidic soils with pH values below 6.5 (average ~5.5).
Soil/Crop Type: Includes paddy soils, brick-red soils, red soils, and volcanic ash soils. The main crops are rice and vegetables, with some fruit cultivation.
Measurement Methods of Cd Concentration: Includes inductively coupled plasma mass spectrometry (ICP-MS, ICP-AES, ICP-OES), flame atomic absorption spectroscopy, and graphite furnace atomic absorption spectroscopy (GF-AAS).
Detection Limits and Accuracy: Cd detection limits reported in the literature ranged up to 0.003 mg/kg. Where unspecified, a default limit of 0.01 mg/kg was assumed based on significant figures.
Sampling Details: Includes the number of sampling points and sampling time, inferred as the publication year minus two years when not explicitly stated.
Cd Content in Soil: Cd data extracted from text, tables, or figures, including minimum, maximum, standard deviation, and coefficient of variation. When these were unavailable, an estimated standard deviation was calculated as one-tenth of the Cd concentration [
36].
After full-text screening and validation (
Figure 2), the final dataset comprised 165 records of Cd concentrations from 4110 sampling points across Hainan Island, sourced from 38 publications spanning 2000–2024 (
Table S1).
2.4. Calculation of Weighted Average
Given the characteristics of field surveys, both sampling density and study area size play a pivotal role in data reliability. Typically, studies covering larger areas with denser sampling and lower variance yield more results, warranting higher weighting. The weight
is computed using the following formula:
where
denotes the study area size,
represents the number of soil samples, and
corresponds to the calculated standard deviation of Cd concentrations in each study.
The weighted mean concentration
C is determined by the formula:
If weight distribution is skewed, it can disproportionately amplify the influence of a few studies with excessively high weights. A logarithmic transformation is applied to mitigate skewness and approximate a normal weight distribution. The log-transformed weights (
) are as defined Equation (3), and the weighted mean content (
C) is as follows:
The log-transformed weight coefficients follow a normal distribution across regions, enhancing representativeness.
2.5. Database Quality Control and Outlier Analysis
In environmental pollution research, extreme values often attract significant attention but may introduce biases that distort the results. To maintain the reliability of the analysis and reduce the influence of outliers on Cd concentration estimates, a robust quality control procedure was adopted. This process involved assessing publication bias, generating probability histograms, and conducting sensitivity analyses to identify and mitigate outliers.
2.5.1. Publication Bias
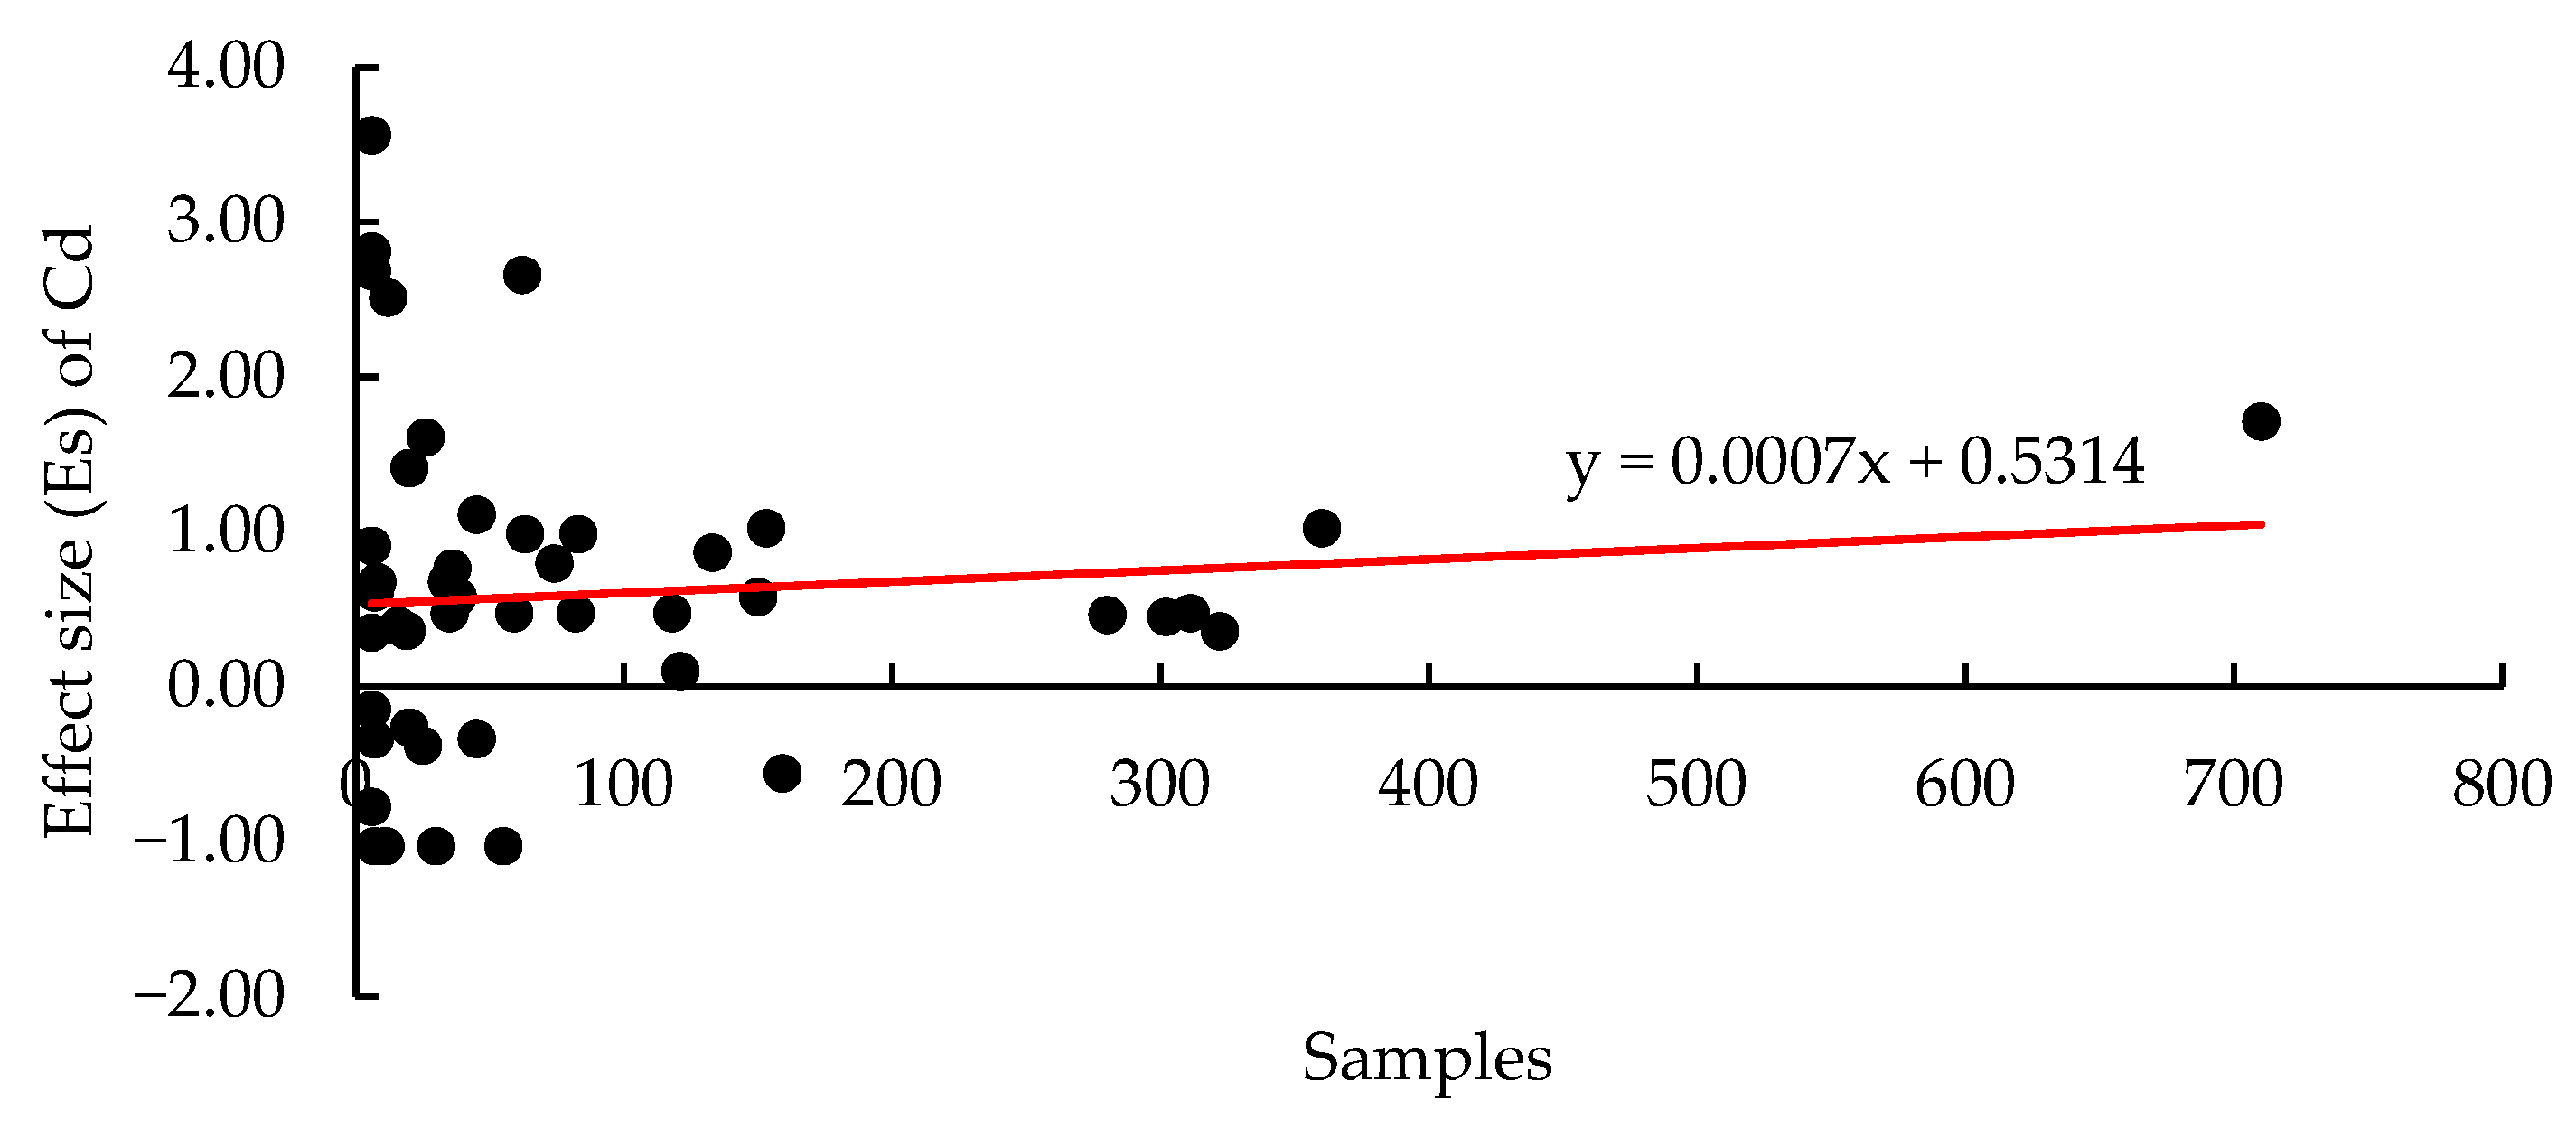
To ensure a thorough literature review and improve the accuracy of the subsequent meta-analysis, a test for publication bias was performed. In this test, the effect size (Es) of Cd was treated as the dependent variable, with the sample size (n) as the independent variable. A linear regression model was used to evaluate the relationship between these variables. A slope near zero in the linear regression indicates minimal publication bias, enhancing the reliability of the data.
Figure 3 illustrates the results of the publication bias test for the literature data from the study area.
Figure 3 shows that the linear regression slope for Cd is 0.0007, indicating a value close to zero, which suggests minimal publication bias and reinforces the high credibility of the research data. This finding supports proceeding with further analysis.
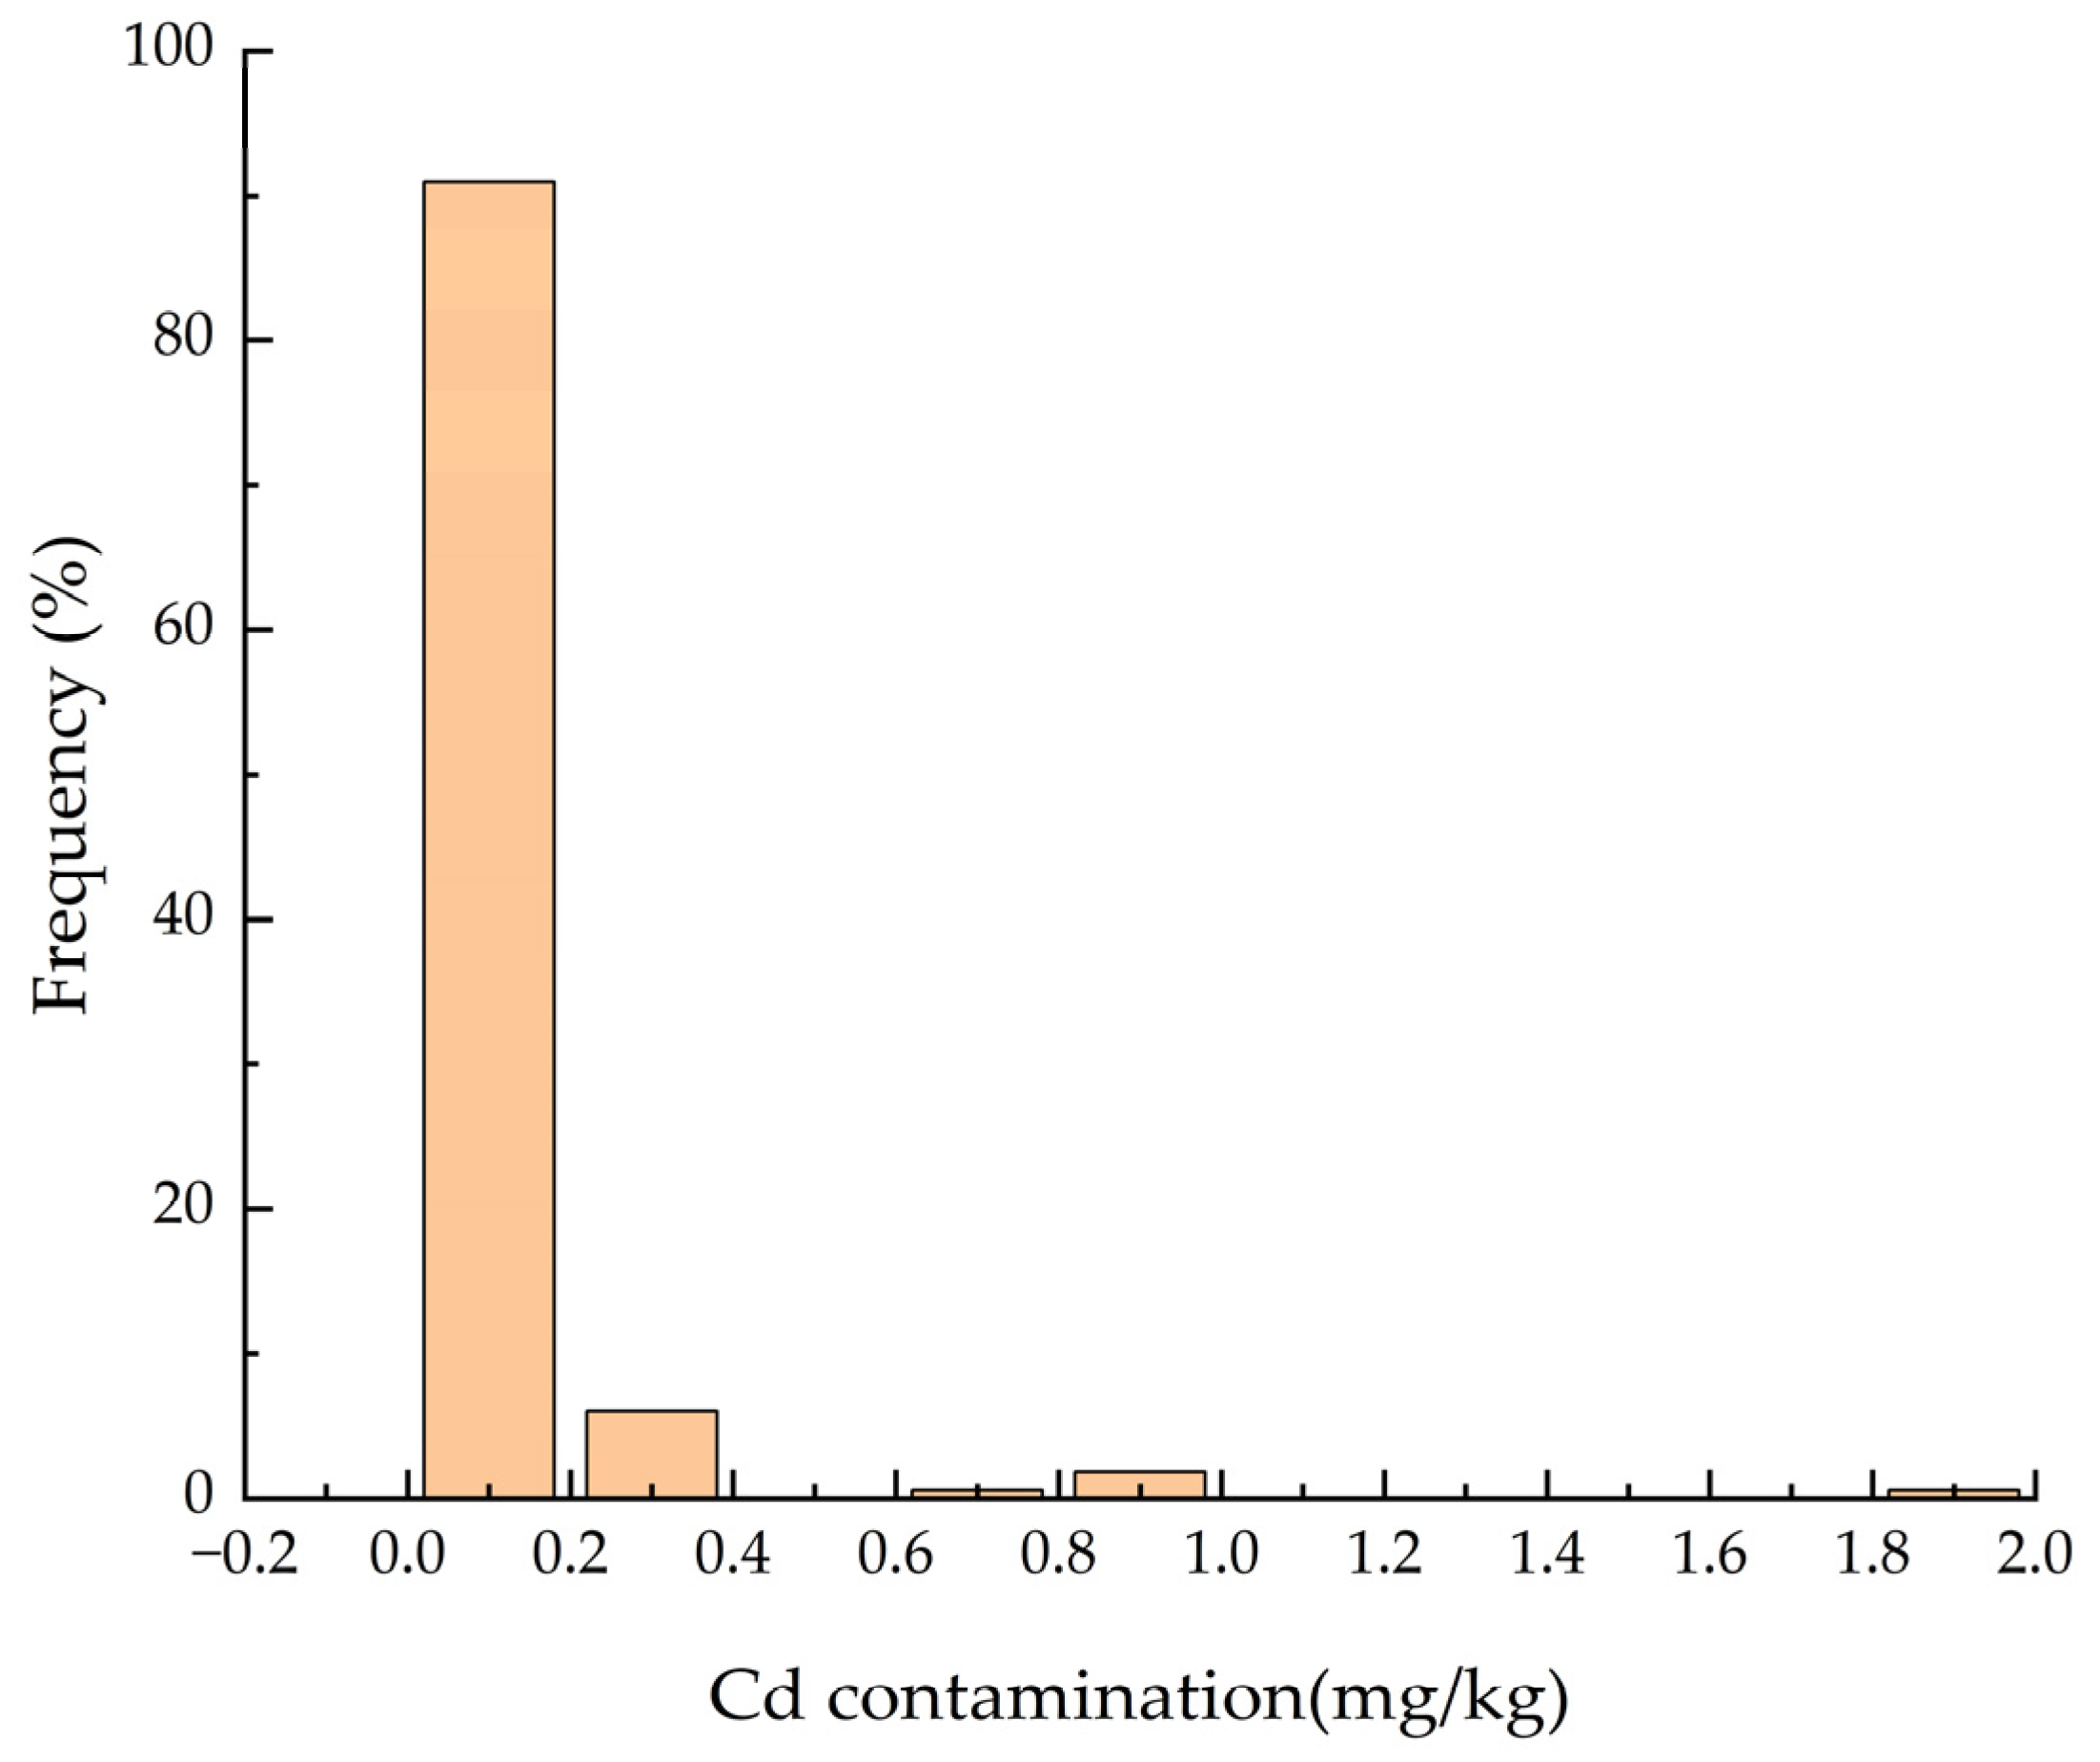
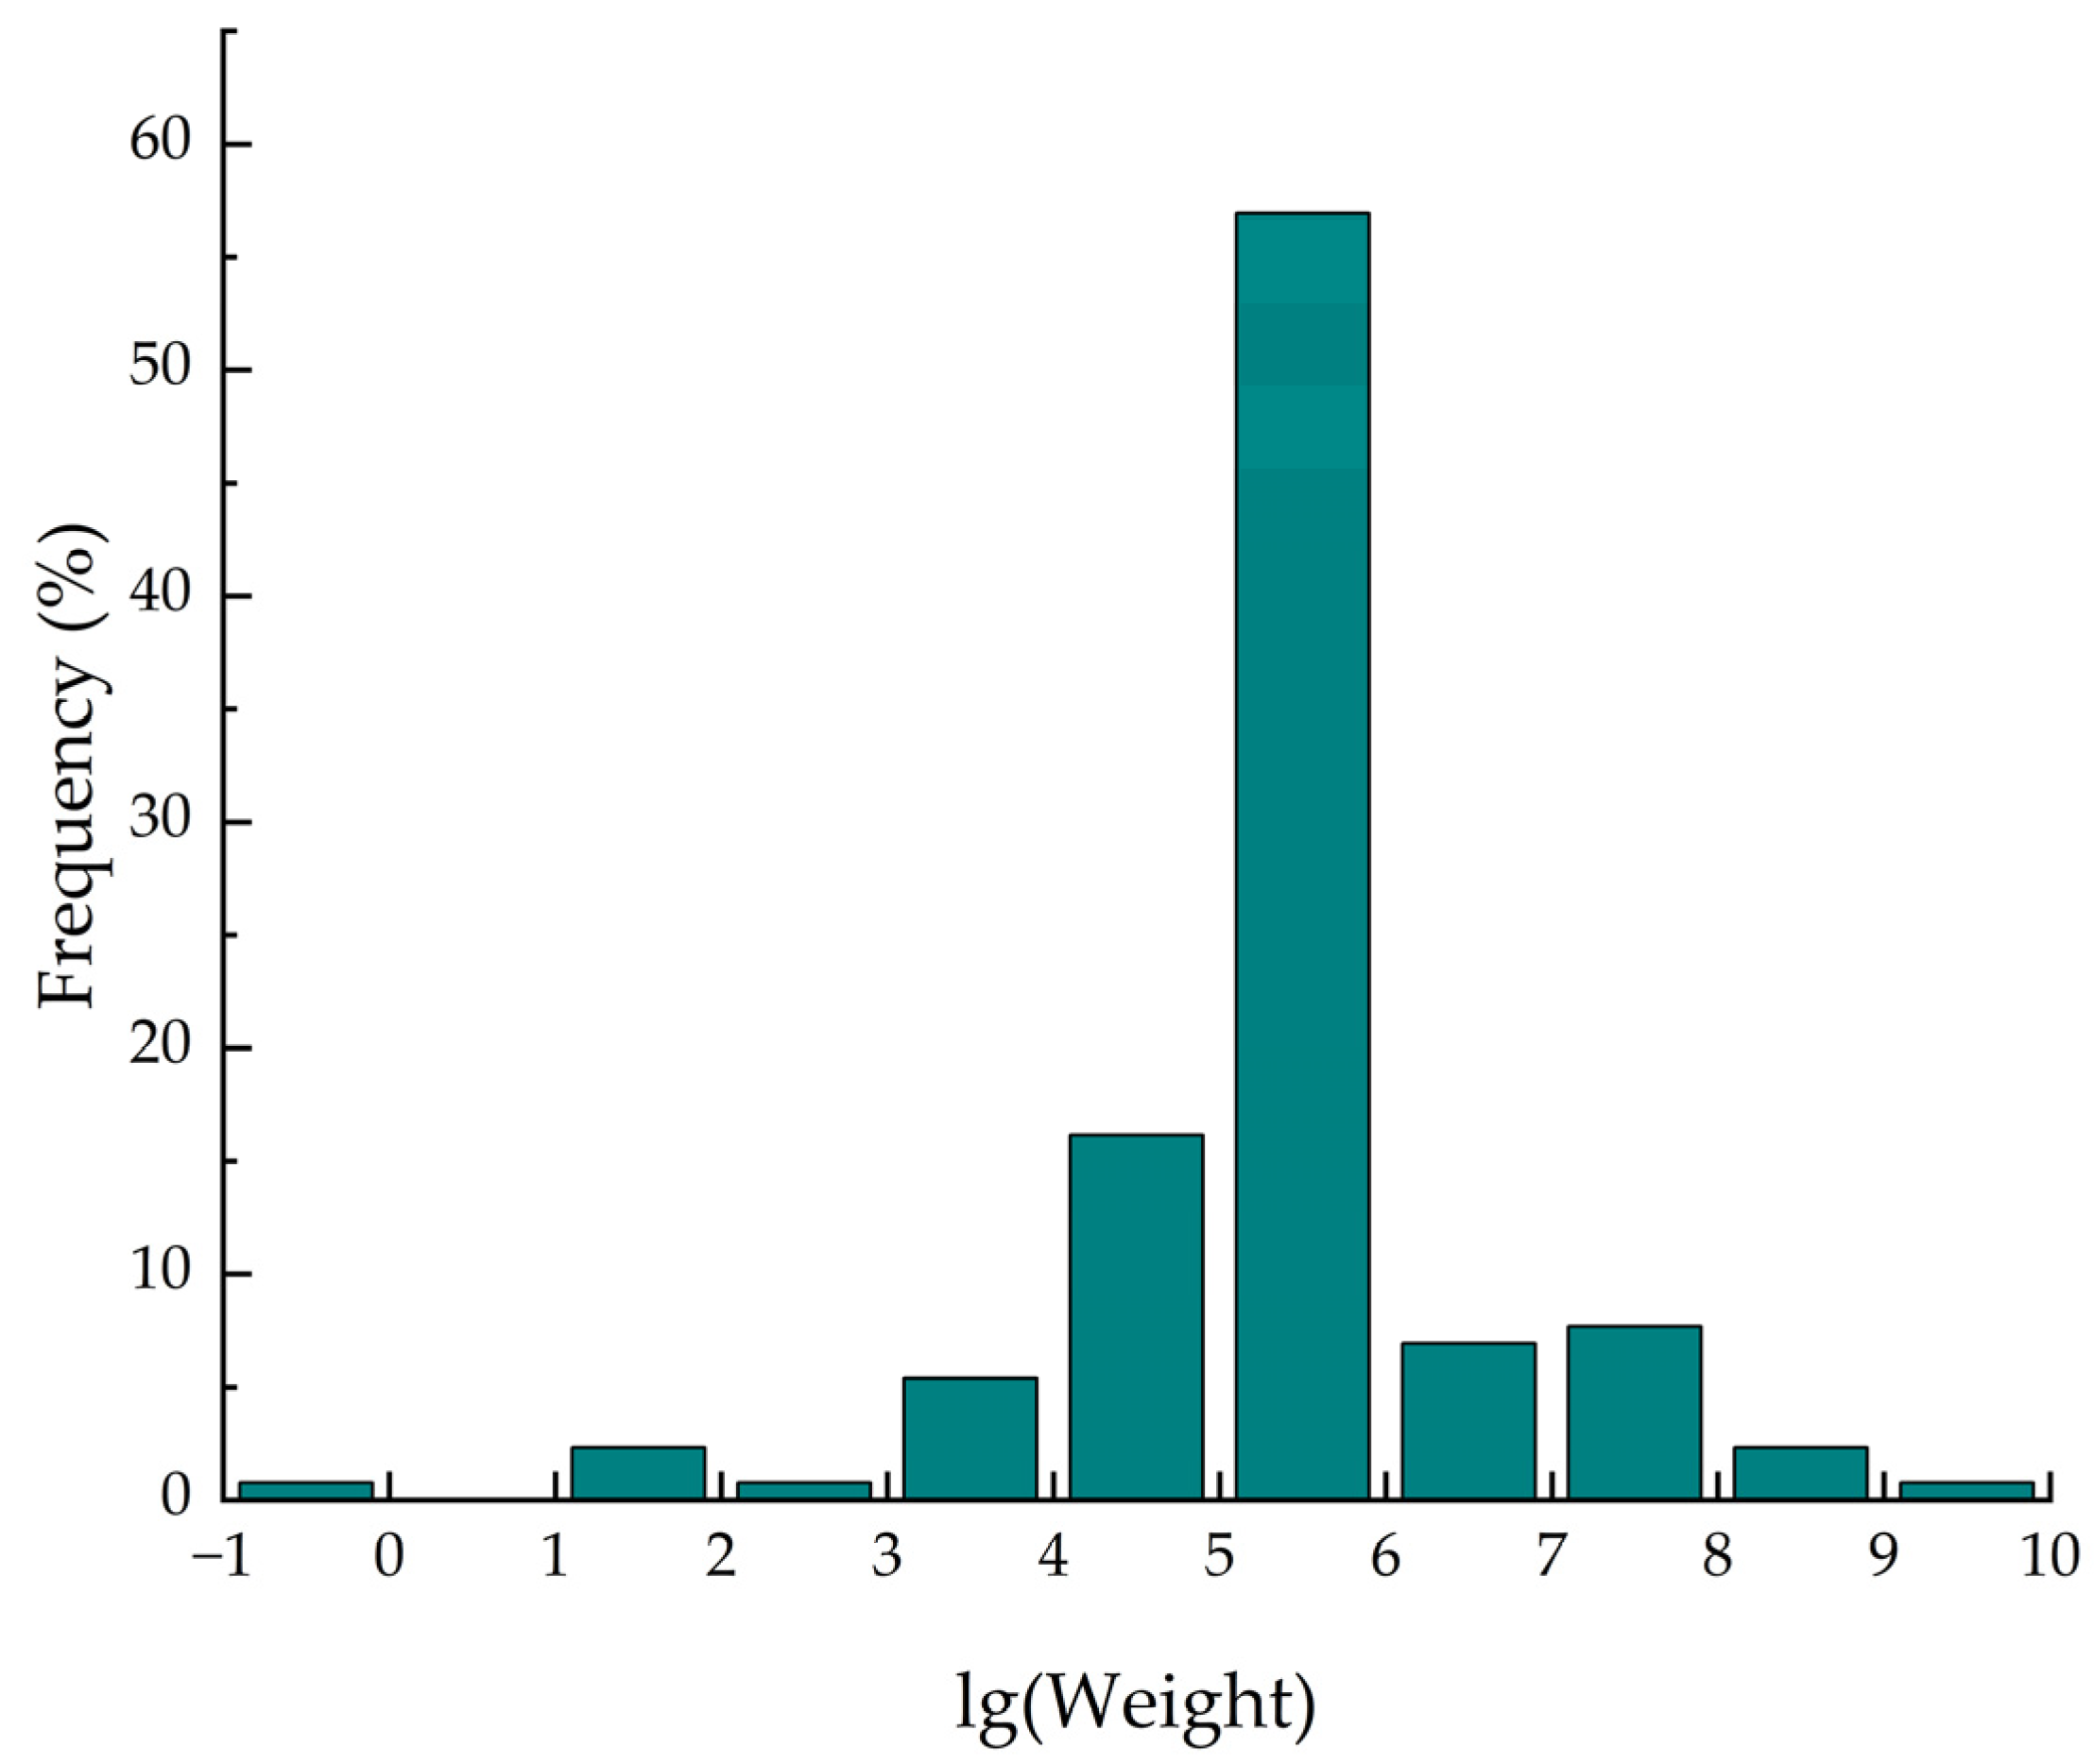
2.5.2. Data Distribution Testing
The Cd concentration data extracted from the literature were assessed for probability distribution through histograms, which revealed a distinct skew (
Figure 4). Weighting factors were calculated using Equation (1), and distribution statistics were performed. The histogram for each weight factor also displayed a marked skew (
Figure 5).
This skewness suggests the presence of extreme values in both the Cd concentration data and weight coefficients. These discrepancies are due to variations in the study area size and the number of sampling points among studies. Such extreme values in weight coefficients could introduce significant biases in the combined ES calculations. To mitigate this issue, a logarithmic transformation (Equation (3)) was applied to minimize data variability. This transformation effectively shifted the skewed data toward a normal distribution (
Figure 6), improving the reliability and reasonableness of the final weighted results.
2.5.3. Sensitivity Analysis
We performed a sensitivity analysis by iteratively excluding individual studies to confirm that the meta-analysis results were not disproportionately influenced by any single dataset. The results demonstrated the robustness of our findings.
2.6. Pollution Risk Evaluation Techniques
2.6.1. Pollution Index
The pollution index (PI) reflects the level of contamination by Cd and is calculated using the following formula:
where
represents the single pollution index of Cd;
denotes the concentration of Cd in soil samples, and
corresponds to the regulatory screening value for Cd contamination risk, as specified in GB15618-2018 [
37]. The classification criteria are outlined in
Table 1.
2.6.2. Geological Accumulation Index Method
The geo-accumulation index (
) is utilized to assess the degree of heavy metal accumulation in soil and to distinguish between natural and anthropogenic sources. Developed in the late 1960s [
38], this method considers environmental geochemical background values and the influence of natural activities on these baselines. The index serves as a foundation for pollution source identification. The calculation formula is as follows:
where
denotes the concentration of Cd in soil samples, and
represents the natural background value of Cd (0.056 mg/kg), representing the baseline element concentration in soil. The background values utilized in this study are based on background values obtained from a nationwide survey conducted in Hainan Province during the mid-1970s. These background values, derived from a uniform sampling strategy with 167 sampling points, have been widely adopted as a benchmark in previous studies to ensure comparability across different research efforts. A coefficient of 1.5 was used to accommodate possible variations in background values resulting from geological differences across regions. A higher
value signifies increased pollution. When the
surpasses 0, it indicates that the heavy metals in the soil primarily originate from anthropogenic activities rather than natural geological processes. The classification criteria are outlined in
Table 1.
2.6.3. Potential Ecological Risk Index Method
The potential ecological risk index (ER) integrates the environmental impact of metals with toxicological factors to evaluate their ecological risks [
39]. In agricultural soils, this method assesses the potential threats posed by Cd to soil microorganisms and crop health, which may, in turn, affect the broader ecological systems. The calculation formula is as follows:
where
is the toxicity coefficient, with a value of 30 for Cd, and
is the ratio of the concentration
of the Cd to its reference value
(0.3 mg/kg), based on the risk screening criteria of GB15618-2018 [
37], attributed to the metal’s toxicity and ecological sensitivity. The classification of levels for
are detailed in
Table 1.
2.6.4. Geographical Detector Analysis
The geographical detector is a statistical method designed to explore the spatial heterogeneity of variables, reveal the relationships between them, and identify their driving forces. This method enables the assessment of the impact of individual influencing factors on the spatial differentiation of Cd. As the core component of the model, the factor detector employs the q-statistic to precisely identify and quantify the relative importance of explanatory variables in geographical phenomena [
40]. The q-statistic ranges from 0 to 1, where a higher value indicates a stronger explanatory power of the independent variable for the spatial heterogeneity of the dependent variable. The formula for the q-statistic is expressed as follows:
and
represent the number of samples in classification (or region) j and the entire study area, respectively; M denotes the categories or regions of soil heavy metal influencing factors;
and
refer to the sum of intra-regional variance and the total variance of the entire study area, respectively. Geographical detector analysis was conducted using Geodetector software, which is available for download at
http://www.geodetector.cn/.
To quantitatively assess the contribution of various environmental and anthropogenic factors to Cd contamination in agricultural soils, soil Cd concentration data from the 2023 sampling sites on Hainan Island [
31], along with spatial distribution data for four major pollution sources corresponding to these sites (
Figure S3), were analyzed.
3. Results and Discussion
3.1. Cd Concentration in Soil of Agricultural Land in Hainan Island
Analysis of 4110 soil samples revealed a sample-weighted mean Cd concentration of 0.12 mg/kg (
Table 2), approximately 2.14 times the natural background value of Hainan Province (0.056 mg/kg), as established in the 1970s [
41]. Although the Cd concentration exceeds the natural background level, it remains below the regulatory threshold of 0.30 mg/kg set by GB15618-2018 [
37], indicating a generally safe level for agricultural soils. The observed mean Cd concentration is marginally lower than the five-year average of 0.15 mg/kg in Hainan’s agricultural soils, potentially reflecting variations in sampling conditions [
31,
35]. Additionally, the current Cd level is notably lower than the national mean concentration of 0.16 mg/kg for Chinese farmlands [
42].
While the overall Cd levels remain within acceptable limits, certain regions exhibit significantly elevated concentrations, necessitating targeted pollution control measures. For instance, the maximum recorded Cd concentration reached 3.11 mg/kg—10.37 times the risk screening threshold—indicating severe contamination in specific areas. This highlights the urgent need for continuous monitoring of anthropogenic pollution sources and the implementation of remediation strategies to mitigate potential risks.
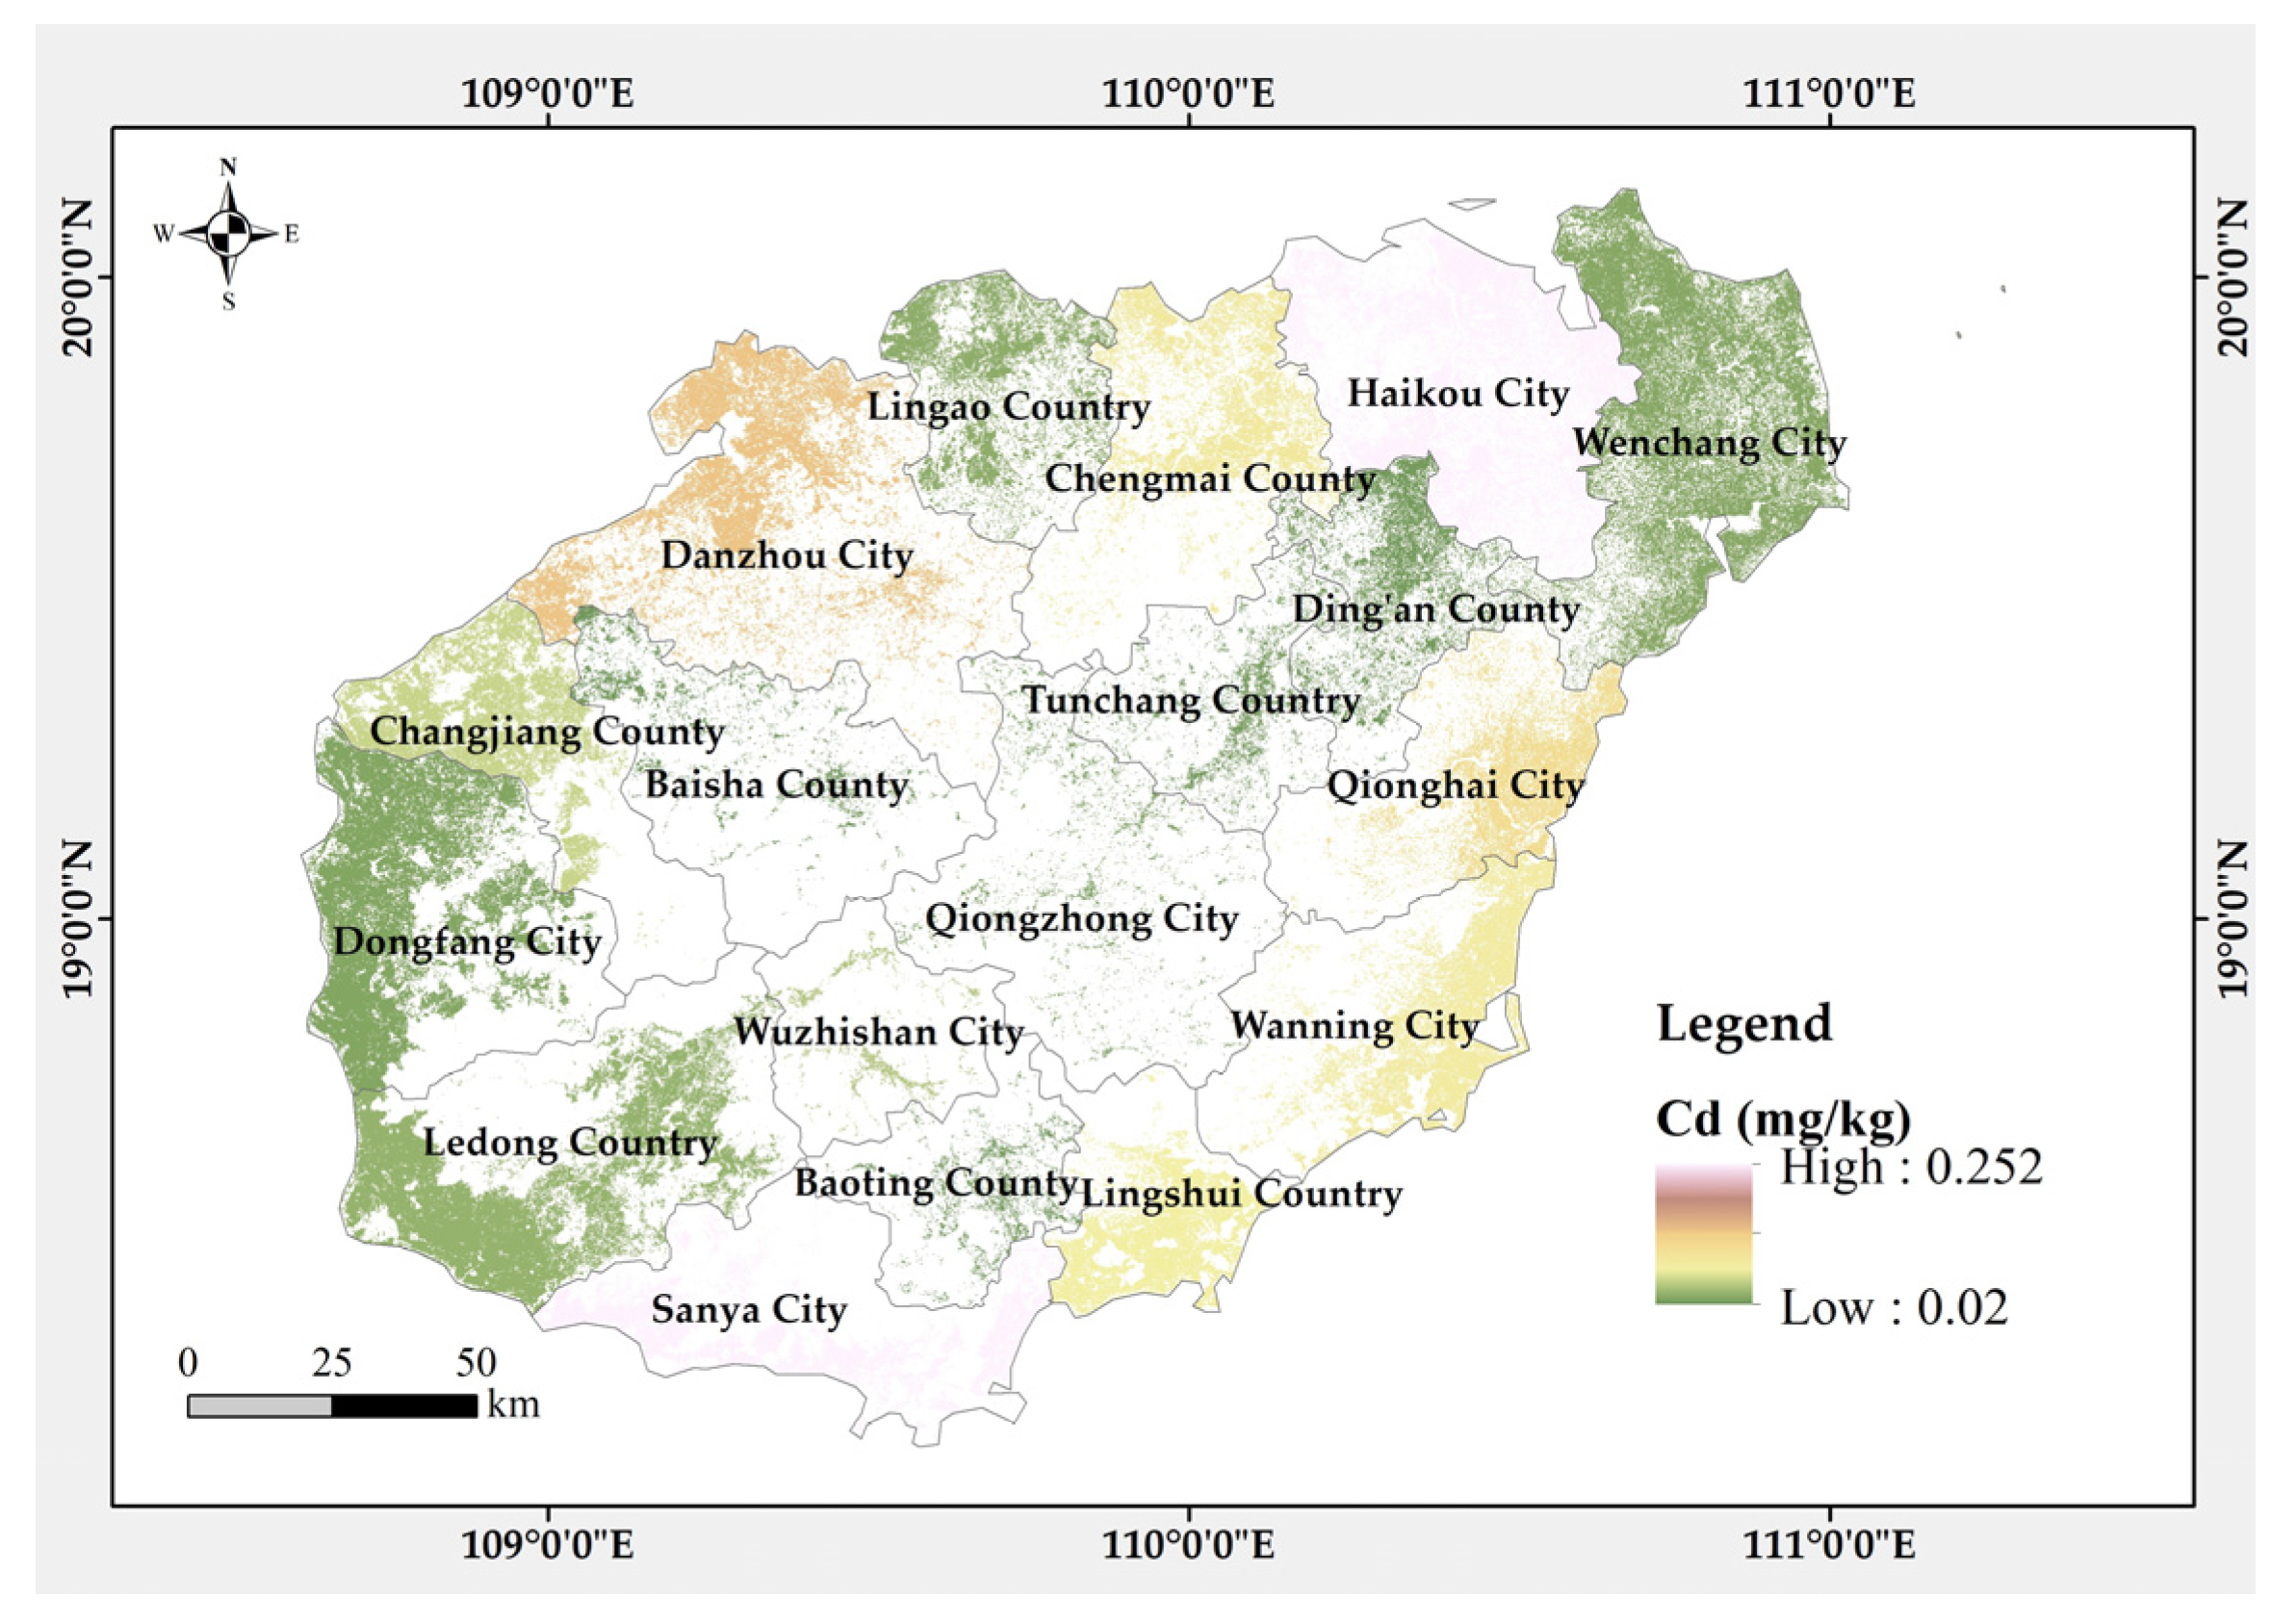
3.2. Spatial Distribution of Cd in Hainan Island
Figure 7 and
Table 3 illustrate the spatial variation of Cd concentrations across agricultural soils in the 18 administrative regions of Hainan Island. Cd concentrations exhibit a distinct spatial pattern, with lower levels in the central Hainan and increased concentrations in the northwest and southeast. The highest Cd concentrations are predominantly found in Haikou and Danzhou City in the northwest, as well as Sanya City in the south, with levels significantly exceeding background values. Prior studies, including those by Hao Lihong, align with the observed trend of significant Cd accumulation in Haikou City, reinforcing the need for ongoing surveillance in this region [
43].
Spatial differences in Cd concentration arise from a combination of natural processes and human activities. In certain northern areas of Hainan, geological conditions contribute to higher natural background Cd levels, which partially explains the elevated Cd concentrations in these regions. However, human activities are the dominant contributors to Cd accumulation in agricultural soils. Urban expansion, industrial growth, and tourism development in Haikou and Sanya have significantly contributed to increased anthropogenic emissions. These emissions include waste disposal, construction activities, and industrial discharges, all of which contribute to soil contamination. Moreover, Hainan’s tropical climatic, with its high temperatures and frequent rainfall, enhances soil leaching, which in turn affects Cd mobility and redistribution. Additionally, long-term use of phosphate fertilizers and farm chemicals with varying Cd content is a major contributor to Cd buildup in agricultural soils [
44,
45]. Regions with intensive farming activities, such as Haikou and Danzhou, are more susceptible to elevated Cd levels due to continuous fertilizer application.
Conversely, central Hainan, including Baisha County, Tunchen County, and Qiongzhong County, reports Cd concentrations that are significantly lower than the provincial background value, indicating relatively clean conditions. This may be due to a combination of lower anthropogenic input, less intensive agricultural activity, and natural soil characteristics that limit Cd accumulation.
Despite overall safe Cd levels in most agricultural soils of the elevated concentrations in urban and intensively cultivated areas of the northwest and southeast call for targeted pollution mitigation strategies, such as enhanced waste management, optimized fertilizer and farm chemicals use, and sustained environmental monitoring.
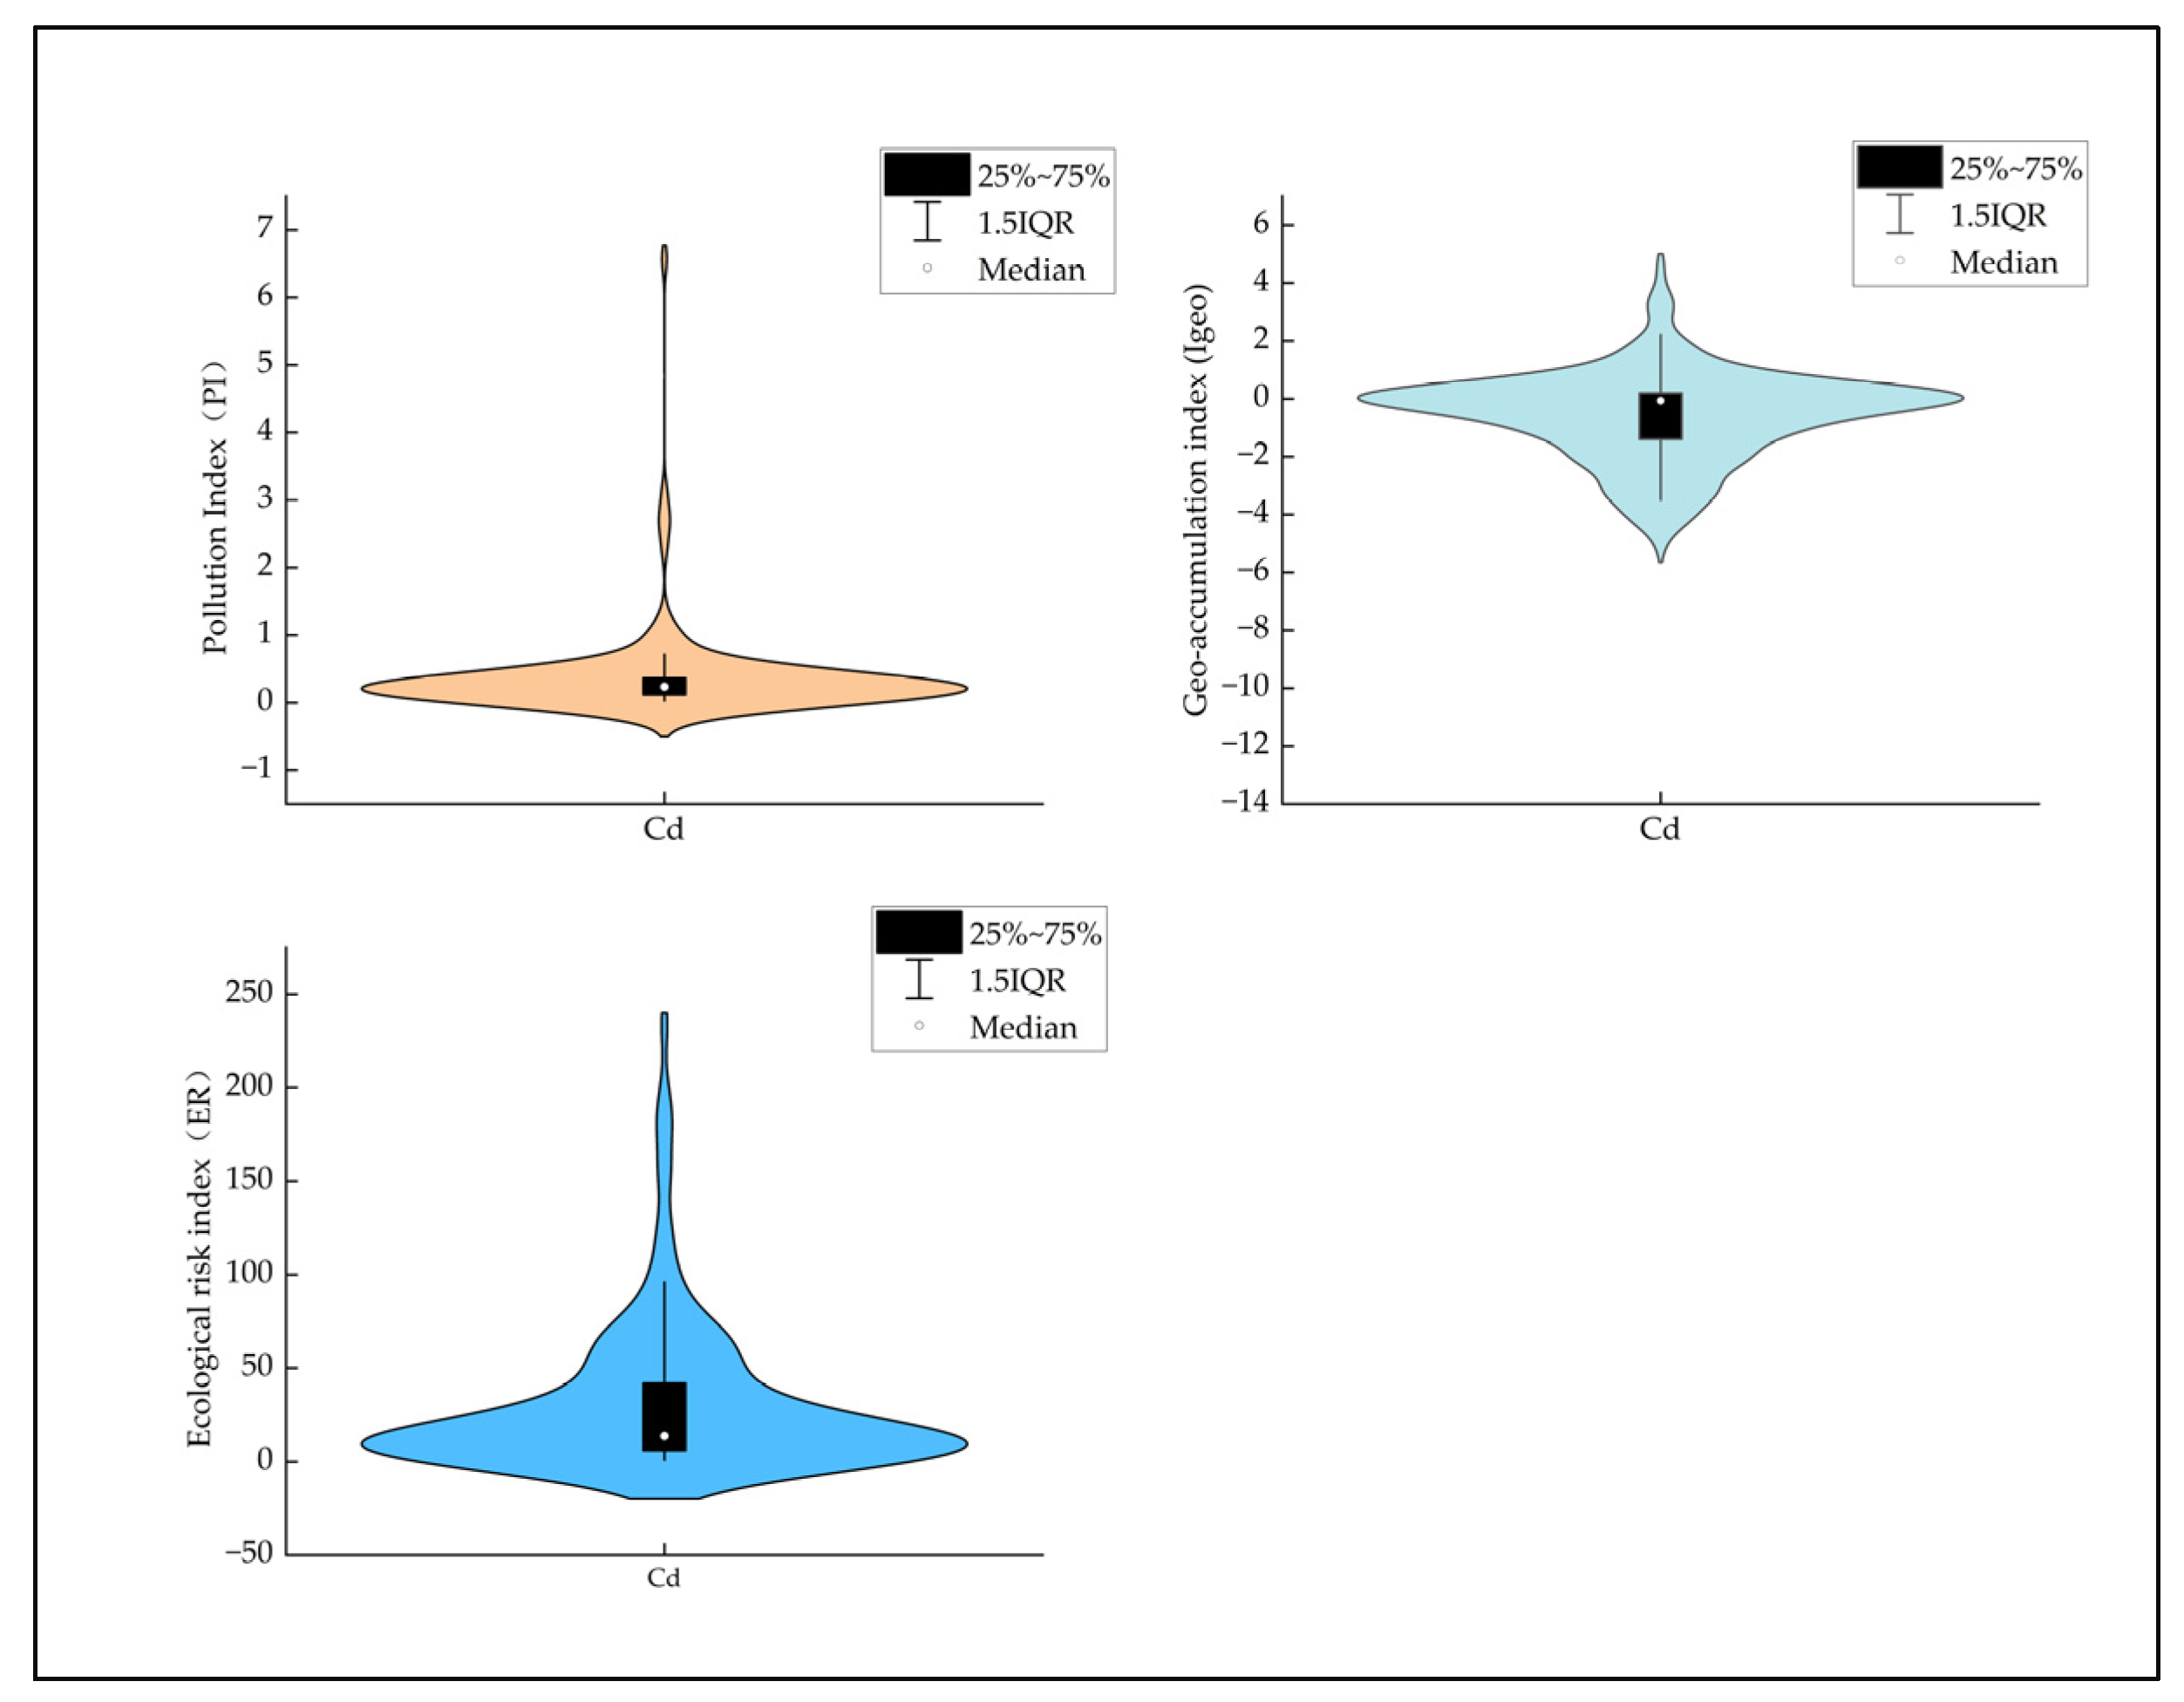
3.3. Assessment of Cd Pollution Risk in Agricultural Soils of Hainan Island
According to the criteria of GB 15618-2018, we assessed the heavy metal pollution status in agricultural soils in the study area using the single-factor pollution index (PI), Geo-accumulation Index (Igeo) and the Potential Ecological Risk Index (ER). Results are shown in
Figure 8. From the perspective of the single-factor pollution index, the agricultural soils on Hainan Island are generally classified as clean, but cadmium pollution is evident in some areas.
According to the , Cd levels in most of Hainan’s agricultural soils remain below 1, indicating an unpolluted or unpolluted to moderately polluted classification, covering approximately 80.44% of the area. Heavy and above pollution (Igeo > 3) accounts for around 10.87%, while a minimal portion of sites (2.17%) shows severe pollution.
Based on the ER (
Figure 8), about 89.36% of the area falls under low ecological risk (Level I). Additionally, 8.51% of the area is classified as having considerable or higher ecological risk, while 2.13% faces extremely high risk (Level V).
While the majority of agricultural soils in Hainan Island exhibit low Cd pollution and ecological risk, the presence of heavily polluted areas and extreme ecological risks necessitates focused attention. Continuous monitoring and proactive remediation strategies are critical for mitigating the cumulative and localized risks associated with Cd contamination.
3.4. Temporal Trends in Cd Concentration
This study focused on analyzing the temporal variations of Cd pollution in Hainan’s agricultural soils, incorporating data from studies that involved island-wide sampling, random sampling methodologies, and more than 70 sample points across multiple periods. The analysis identified six key periods (2005, 2009, 2014, 2017, 2019, and 2023) to track changes in Cd pollution trends across Hainan’s agricultural soils. The annual sample size ranged from a minimum of 83 to a maximum of 366 (
Table 4).
Table 4 indicates a fluctuating but overall increasing trend, with Cd peaking between 2017–2023. The increasing rise in Cd concentrations can likely be attributed to the intensification of agricultural activities, including the increased use of fertilizers, pesticides, and herbicides, along with industrial and mining wastewater discharge driven by rapid economic development growth.
From 2017 to 2023, both average and maximum Cd concentrations were notably higher than those observed between 2005 and 2014. Specifically, the average Cd level rose from 0.09 mg/kg to 0.16 mg/kg, an increase of approximately 77%. The maximum concentration also surged from 0.64 mg/kg to 2.63 mg/kg, representing an increase of roughly 3.11 times. The trends in Cd concentration across these two periods differ markedly. From 2005 to 2014, Cd concentrations in Hainan’s agricultural soils ranged from 0.01 to 0.64 mg/kg, with a relatively stable mean of 0.09 mg/kg. Although slightly above Hainan’s natural background level, these concentrations remained below risk thresholds, indicating relatively safe conditions. However, from 2017 to 2023, the average Cd concentration fluctuated between 0.133 and 0.156 mg/kg, showing an initial decline followed by an increase, with variations from around 11% to 12%.
The maximum Cd concentrations during 2017–2023 were 2.5 to 3.5 times higher than those recorded during 2005–2014, with the highest value of 2.3 mg/kg observed in 2023. This concentration is 41 times higher than the natural background value and 7.67 times above the risk screening threshold, indicating severe pollution in some areas. In 2017, maximum concentrations were 29 times the background value. The observed rise in Cd concentrations during 2017–2023 aligns with the intensive use of phosphate fertilizers, which contain Cd levels ranging from 0.1 to 170 mg/kg [
46]. Phosphate fertilizers are a primary means of enhancing crop yields in Hainan [
31], and their long-term application likely contributes to the progressive Cd accumulation in soils. Alternatively, the accumulation could be caused by the combined effect of tailings and cadmium-contaminated fertilizers [
35].
Overall, from 2005 to 2023, the Cd concentrations in Hainan’s agricultural soils exhibited a fluctuating yet consistent upward trend in Cd concentrations, with a marked rise during 2017–2023. While the overall average concentration of 0.12 mg/kg remains below the 0.30 mg/kg risk screening threshold (GB15618-2018), the maximum concentration of 3.11 mg/kg exceeds the threshold by 10.37 times, highlighting severe pollution in localized areas. These findings highlight the critical need for ongoing monitoring and remediation strategies to mitigate Cd pollution and its adverse effects on agricultural productivity, crop health, and soil ecology.
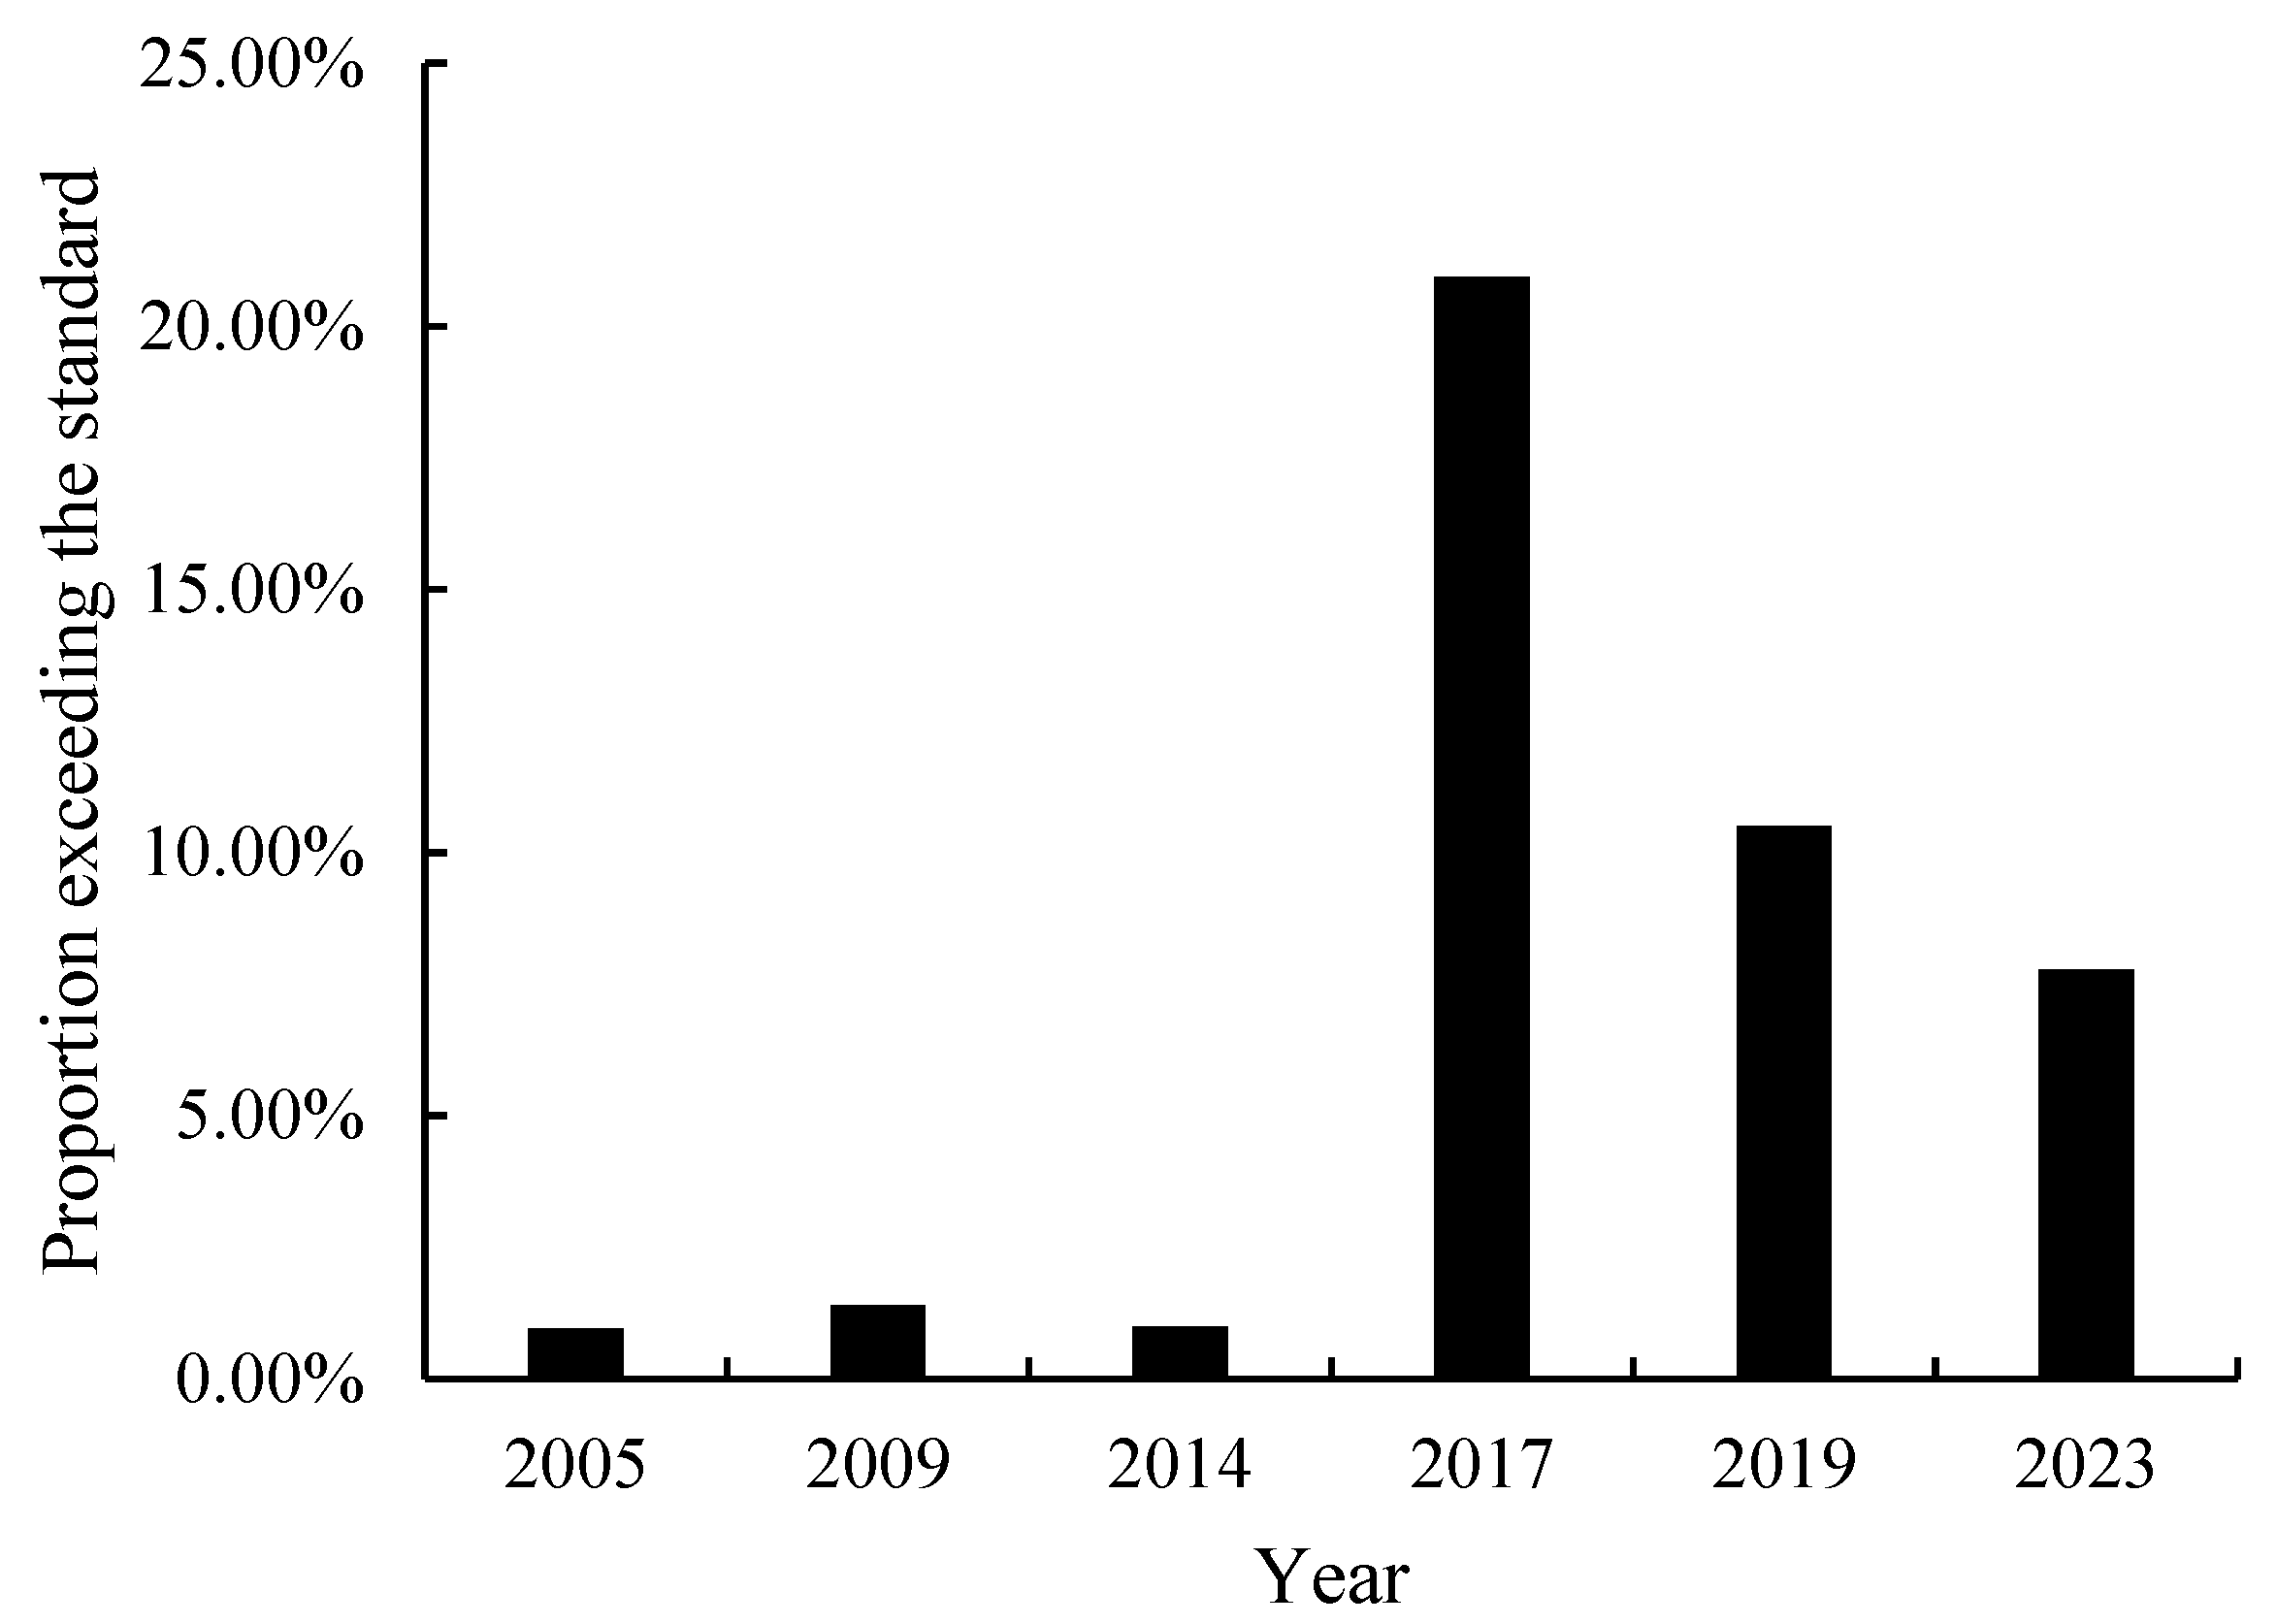
3.5. Trend of Cd Pollution Exceeding the Standard
Before assessing the exceedance rates of Cd pollution in Hainan Island’s agricultural soils, we conducted a comparative analysis of evaluation standards referenced in the literature before and after the implementation of the GB15618-2018. Notably, prior to this standard, studies often employed a more stringent benchmark of 0.3 mg/kg as the exceedance threshold for soil Cd using the single-factor index method. To ensure consistency and rigor, this study also uses 0.3 mg/kg as the baseline for assessing Cd exceedance across different periods.
Cd exceedance rates have exhibited a notable rise over the past two decades, with levels recorded from 2017 to 2023 surpassing those from 2005 to 2014 by over sevenfold, underscoring an escalating pollution issue (
Figure 9). However, the trends within the two periods differ significantly. Specifically, from 2005 to 2014, Cd exceedance rate remained relatively stable at approximately 1%, with peak of 1.40% in 2009 and a low of 0.96% in 2005. Conversely, from 2017 to 2023, the exceedance rate exhibited a sharp decline, decreasing from 20.93% in 2017 to 10.50% in 2019, and further down to 7.78% in 2023. Despite signs of improvement, Cd pollution levels in soils remain considerably higher than those recorded two decades ago. The reduction in Cd exceedance rates during 2019–2021 may partly reflect decreased human activity during the COVID-19 pandemic, which reduced anthropogenic Cd inputs. Future research should compare soil Cd concentration and exceedance rates before and after 2019.
The observed pattern, characterized by rising exceedance rates between periods (2005–2017) and declining rates within periods (2017–2023), can be attributed to two main factors. One key factor for this trend is the intensification of agricultural activities, industrialization and urbanization, which has led to soil degradation and increased Cd accumulation, as evidenced by the significantly higher exceedance rates in 2017–2023 relative to 2005–2014. Another factor is the implementation of policy measures, including the enforcement of stricter environmental pollution standards, which have helped in raising awareness and curbing further Cd accumulation, as reflected in the declining exceedance rates during 2017–2023. These results highlight the pressing need for sustained monitoring and strategies management efforts to combat Cd contamination and preserve the integrity of Hainan’s agricultural land.
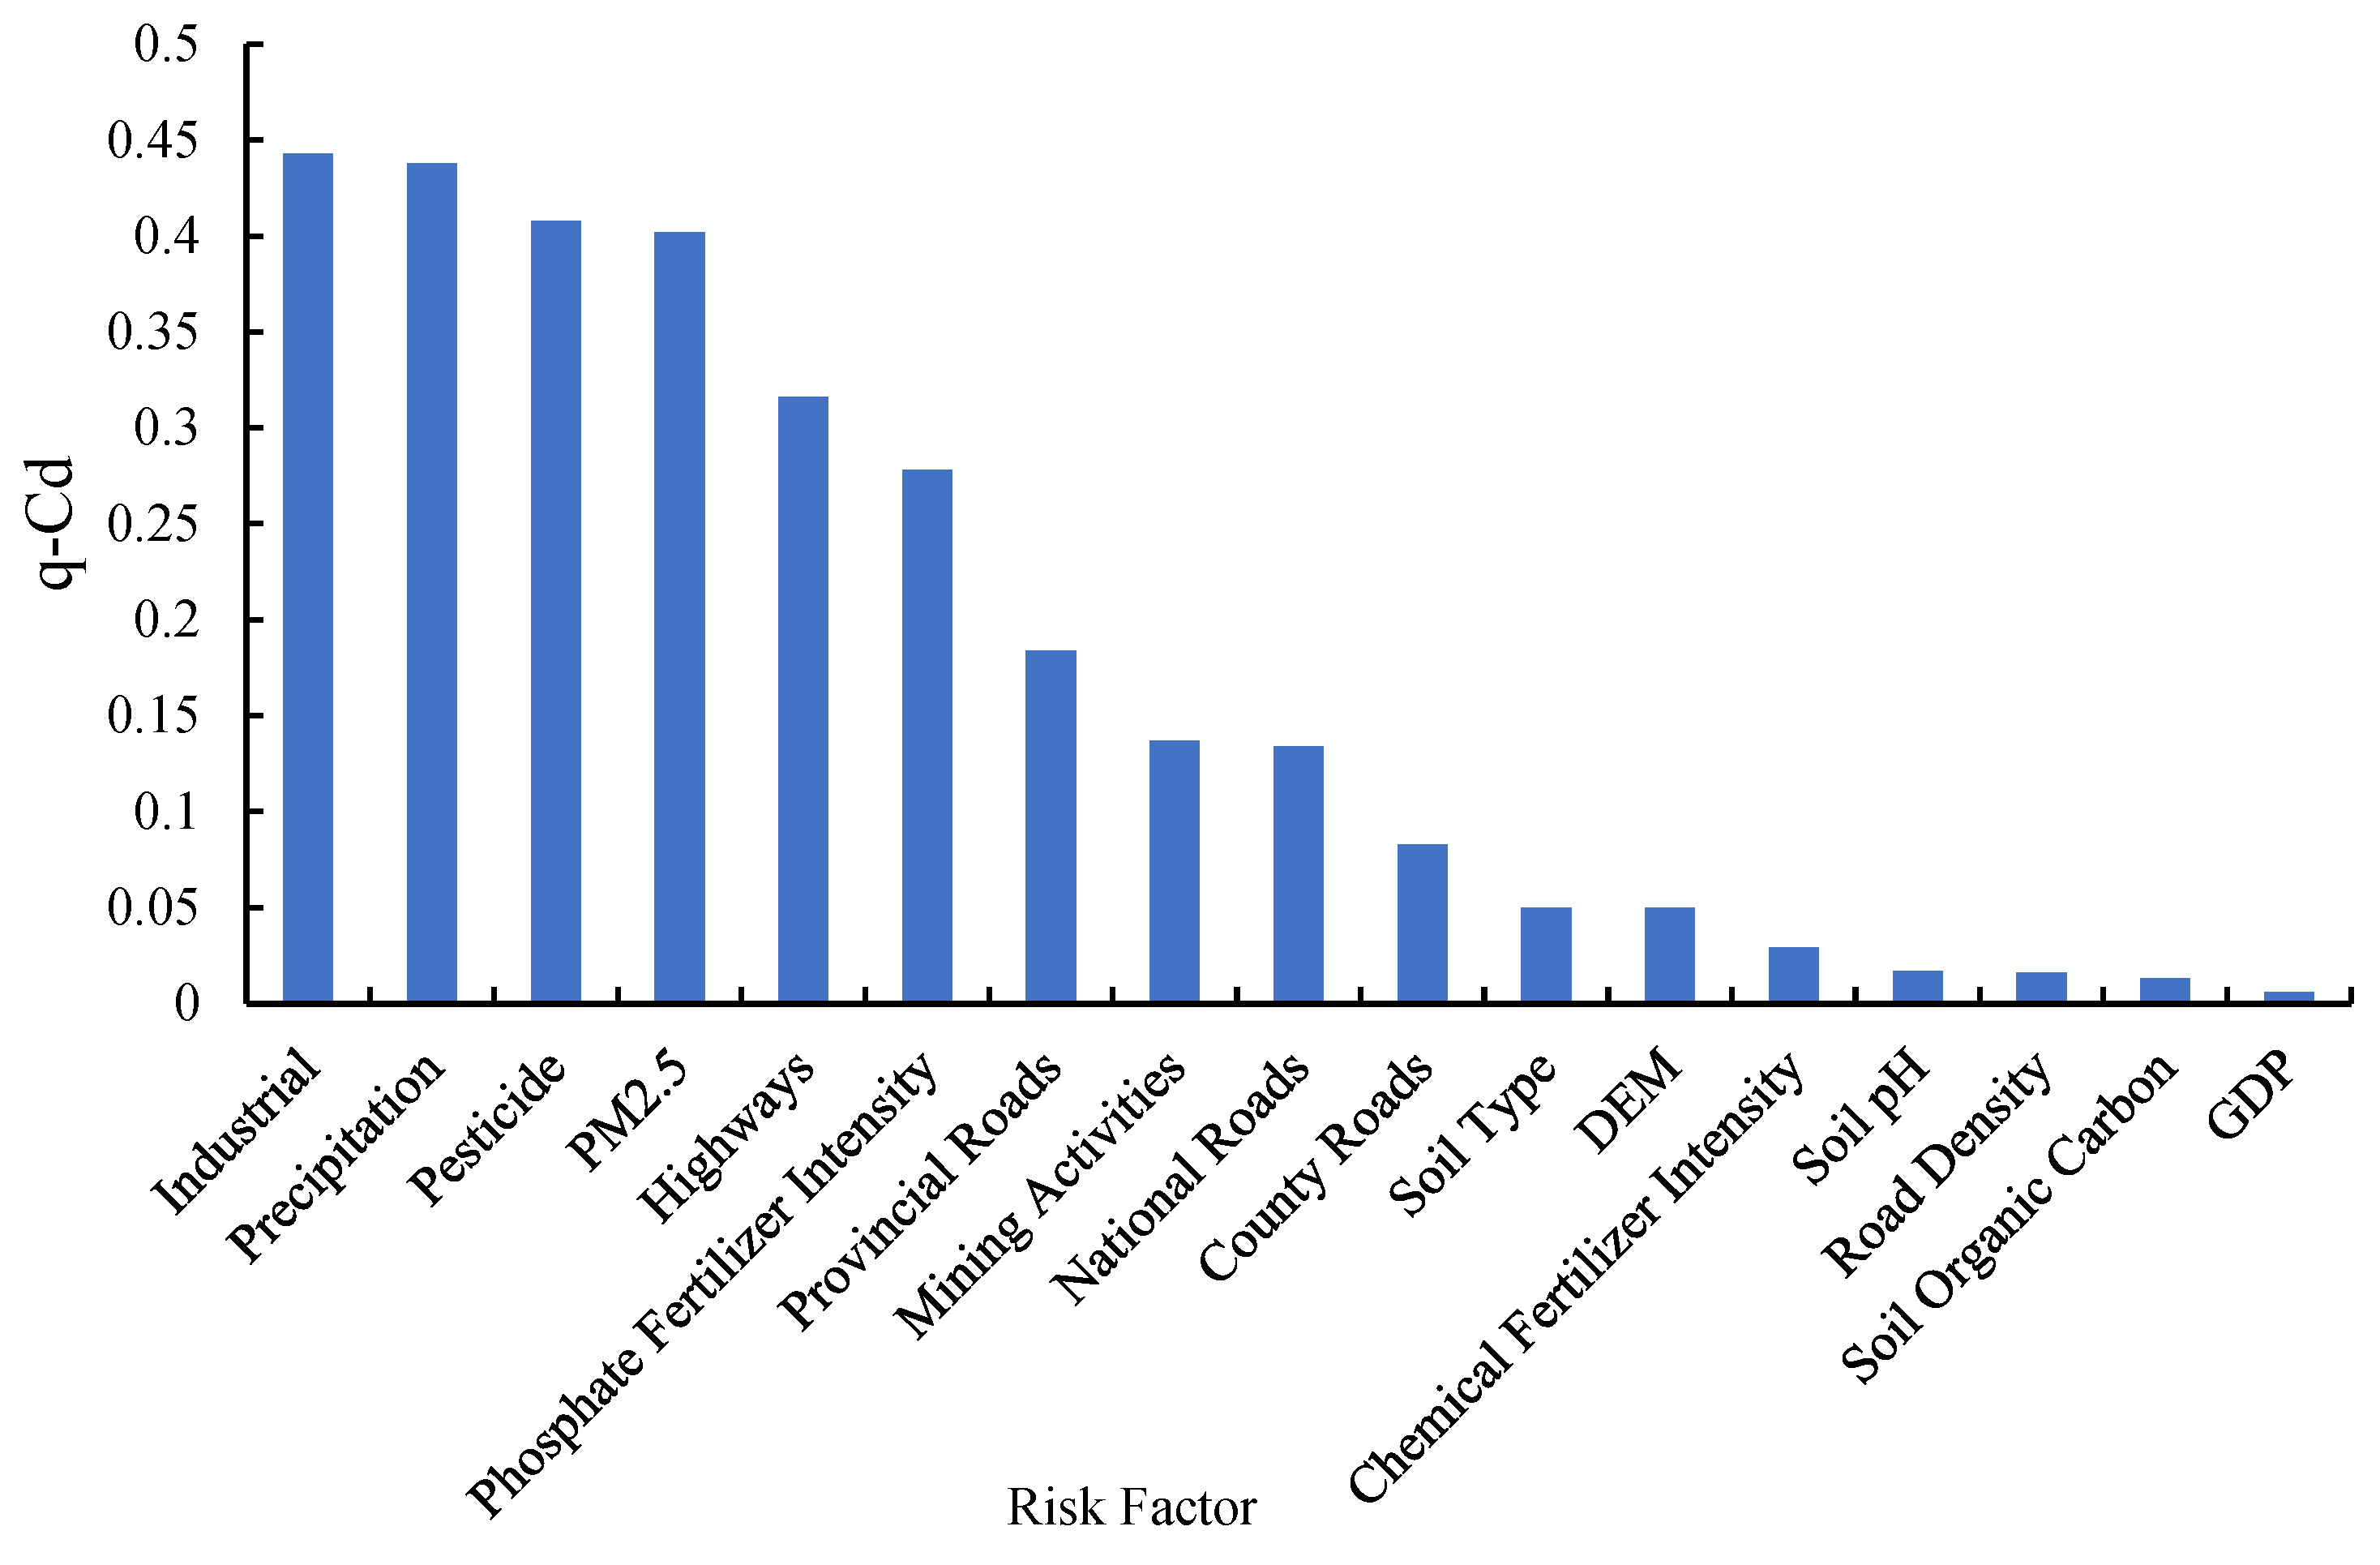
3.6. Evolution of Cd Pollution Risk Sources
Over the past two decades, the risk of Cd contamination in agricultural soils has progressively intensified, transitioning from predominantly geogenic influences to a complex interplay of agricultural, industrial, traffic-related, and natural sources. In the early years, soil Cd concentrations remained below natural background levels, primarily governed by inherent geochemical properties [
47]. However, as time progressed, isolated instances of Cd exceedance emerged, particularly in mining-intensive regions, where mineral extraction and associated activities contributed to elevated Cd levels. Notably, in 2012, high Cd concentrations were observed near the Changjiang mining area, indicating localized enrichment due to mining activities. In recent years, agricultural production, industrial emissions, and transportation-related pollution have collectively become the primary contributors to Cd accumulation in agricultural soils. The geographical detector model was applied, and the q-statistic values derived from the factor detector indicate the explanatory power of each variable for the spatial differentiation of Cd concentrations (
Figure 10).
Agricultural sources play a critical role in Cd accumulation, with pesticide application intensity and phosphate fertilizer usage exhibiting the highest explanatory power. The substantial impact of pesticides may be attributed to the increased reliance on Cd-containing agrochemicals in response to the high-temperature and high-humidity conditions that exacerbate pest outbreaks. Similarly, the extensive application of phosphate fertilizers, which may contain trace amounts of Cd, further contributes to Cd enrichment in agricultural soils.
Industrial sources significantly influence Cd contamination, with manufacturing activities and PM2.5 emissions identified as the primary risk factors. Industrial processes release Cd through atmospheric deposition, wastewater discharge, and solid waste disposal, all of which contribute to Cd accumulation in soil.
Regarding transportation, highways have a more pronounced impact than provincial roads, national roads, or county roads. This can be attributed to the high traffic volume and associated emissions, including vehicle exhaust, tire wear, and road maintenance materials, particularly along Hainan Island’s ring highway.
Natural sources were found to influence Cd mobility and distribution, with precipitation identified as a key driver. The tropical marine climate of Hainan, characterized by high temperatures and humidity, accelerates organic matter decomposition and enhances Cd solubility. Increased rainfall contributes to soil acidification by reducing cation exchange capacity and base saturation, thereby increasing the bioavailability and ecological risk of Cd. Soil type and DEM exhibit lower explanatory power, suggesting that while geological characteristics play a role, anthropogenic sources dominate Cd distribution patterns. Similarly, soil pH and soil organic carbon contribute minimally, likely due to the overriding influence of external Cd inputs.
These findings suggest that the spatial and temporal dynamics of Cd pollution in agricultural soils are governed by a combination of anthropogenic and natural factors. Given the increasing contribution of agricultural inputs, industrial emissions, and transportation activities to Cd accumulation, targeted mitigation strategies are essential. Future efforts should focus on optimizing agricultural management practices, strengthening industrial pollution controls, and implementing comprehensive monitoring systems to assess the impact of environmental factors on Cd mobility. These measures will be crucial for reducing Cd contamination risks and ensuring the long-term sustainability of agricultural production on Hainan Island.
4. Conclusions
With an average concentration of Cd 0.12 mg/kg, Cd levels in Hainan’s agricultural soils are 2.14 times higher than the natural background value of 0.056 mg/kg, and although they remain below the regulatory threshold of 0.30 mg/kg established by GB 15618-2018, localized areas exhibit severe contamination, with maximum concentrations of 3.11 mg/kg, 10.37 times than the threshold.
The spatial analysis of Cd levels reveals a heterogeneous distribution across Hainan Island, with relatively lower concentrations in central counties like Baisha and Tunchang, whereas urbanized and agriculturally intensive regions, such as Haikou, Danzhou, and Sanya, exhibit elevated contamination. While most areas remain within unpolluted to moderately polluted categories, 2.17% of sampling points show heavy to extreme Cd accumulation, and 2.13% fall into high ecological risk zones (Level IV). These high-risk zones require immediate intervention to mitigate potential ecological and agricultural impacts. These regional differences stem from both natural geological factors and anthropogenic influences. In certain northern areas of Hainan, elevated natural background Cd levels contribute to higher soil concentrations. However, human activities remain the dominant driver of Cd accumulation. Rapid urbanization, industrialization, and tourism expansion in Haikou and Sanya have led to increased anthropogenic emissions, including waste disposal and construction, industrial, and mining activities. Additionally, long-term agricultural practices, particularly the application of phosphate fertilizers with varying Cd content, have exacerbated Cd accumulation in agricultural soils.
Temporal data spanning from 2005 to 2023 indicate a discernible increase in Cd levels in agricultural soils, with mean concentrations rising from 0.09 mg/kg in earlier years to 0.16 mg/kg in more recent assessments, reflecting intensified anthropogenic influences. The exceedance rate also escalated from approximately 1% to over 20% in some years. This increase correlates with intensified anthropogenic activities, including the use of tailings and the widespread application of phosphate fertilizers, both of which are primary contributors to Cd accumulation in soils. Despite adhering to regulatory safety thresholds overall, hotspots of excessive Cd accumulation highlight the need for reinforced monitoring and targeted mitigation efforts to curb further contamination risks.
The risk of Cd contamination in agricultural soils has shifted from predominantly geogenic influences to a complex mix of agricultural, industrial, and transportation-related sources. Pesticide application, phosphate fertilizer use, industrial emissions, and transportation activities are the main contributors to Cd accumulation. These findings emphasize the urgent need for targeted mitigation strategies, enhanced monitoring, and sustainable agricultural practices to ensure the long-term sustainability of agricultural production on Hainan Island. Future research should focus on quantifying and tracking Cd pollution sources, optimizing pesticide and fertilizer use to minimize heavy metal inputs, and implementing precision agriculture to further reduce contamination risks. These efforts are crucial for protecting soil health, maintaining sustainable agricultural practices, and reducing ecological risks linked to Cd pollution.


