Article

Research on the Time-Dependent Behavior of Uplift Piles in Structured Clay Foundations in Zhanjiang Formation

Guangxi Key Laboratory of Geotechnical Mechanics and Engineering, Guilin University of Technology, Guilin 541004, China
*
Author to whom correspondence should be addressed.
Appl. Sci. 2025, 15(7), 3814; https://doi.org/10.3390/app15073814
Submission received: 4 March 2025 / Revised: 27 March 2025 / Accepted: 27 March 2025 / Published: 31 March 2025

Abstract

:
The structural clay of the Zhanjiang Formation exhibits significant thixotropy, and there are considerable differences in the ultimate bearing capacity of pulled-out piles under different resting times. Using the structural clay from the Zhanjiang Formation as the foundation, direct shear tests on the soil surrounding nine groups of model single piles of different sizes were conducted at various resting times, along with static pullout tests on the pile foundations. The results indicate that the cohesion and internal friction angle of the surrounding soil increase following a logarithmic function with increasing resting time; specifically, the growth rate is rapid in the early resting period and gradually slows down in the later period. A quantitative relationship describing the variation of cohesion and internal friction angle over time was established. The load–displacement curves for single piles at different resting times exhibit a distinct steep drop. The uplift single pile exhibits significant time-dependency, with the ultimate uplift bearing capacity increasing more rapidly in the early stages and gradually stabilizing in the later stages. Under different resting times, for each load level, the maximum side friction resistance of the pile gradually shifts to the middle and lower parts of the pile body, while the ultimate side friction resistance is evenly distributed along the lower part of the pile body, with the side friction resistance of the pile bearing the uplift load. Based on the quantitative relationship of the cohesion and internal friction angle of the surrounding soil around the pile varying with time, a predictive formula for the axial pullout ultimate bearing capacity of a single pile in the Zhanjiang Group structured clay foundation has been established. Using existing pile foundation projects, model experiments were designed to verify the validity of the formula; however, there is a lack of field-scale validation. The research findings can provide a reference for predicting the axial pullout ultimate bearing capacity of single piles in practical engineering applications.

1. Introduction

Zhanjiang City is an important city in the “Belt and Road” initiative in China. Additionally, as a result of the needs of national economic development, many engineering projects based on uplift piles have emerged in this area [1]. The structured clay of the Zhanjiang Group is abundant in this area, serving as the foundation soil for this type of foundation. The structural clay of the Zhanjiang Formation forms a high-porosity rigid structure due to coastal sedimentation flocculent structures, cementation, and the activity of montmorillonite. Disturbance disrupts the cementation, causing particle dispersion and a sudden drop in strength. Following a period of rest, partial recovery occurs through physicochemical processes, resulting in strong structural integrity and significant thixotropic properties [2,3,4], which in turn result in pronounced changes in strength when the foundation soil is disturbed. Consequently, the bearing capacity of piles within this soil layer experiences considerable variations in strength after disturbance, initially exhibiting low bearing capacity that gradually increases with extended resting time, demonstrating clear time-dependent behavior. Existing uplift bearing capacity calculation methods do not take into account that the initial uplift bearing capacity of uplift piles in the structured clay foundations of the Zhanjiang Formation is relatively low due to the structural characteristics of the surrounding soil, while the bearing capacity improves as the surrounding soil recovers its thixotropic strength.
Thixotropy is a common property of many materials. Boswell’s [5] research found that many materials exhibit thixotropic behavior, except for clean sand. Research by Landrou et al. [6] suggests that the reason for the thixotropic phenomenon in clay is the process of soil particles transitioning from dispersion to reaggregation. Chen et al. [7] investigated the interlocking patterns and interaction potential between soil particles and found that the transformation of interlocking forms among clay particles is an intrinsic reason for the recovery of thixotropic strength in clays. Zhang et al. [8] interpreted the thixotropy of the structured clay from the Zhanjiang Formation through the perspective of the interaction forces between soil particles using scanning electron microscopy and mercury intrusion porosimetry. Zhao et al. [9] conducted unconfined compressive strength tests on the structured clay of the Zhanjiang Formation to investigate the changes in basic physical parameters, such as soil water content and pore size, during the thixotropic process, establishing a thixotropic measurement standard for the structured clay of the Zhanjiang Formation. Yang et al. [10] explored the thixotropic behavior of marine clay by examining the relationship trends between thixotropic strength ratios, flow index, and moisture content. The above research explored thixotropy from various aspects, including the interactions between soil particles and the mechanical properties of the soil, laying a foundation for the study of thixotropy in the structured clay of the Zhuhai Group.
Wendel was the first to discover the phenomenon of pile bearing capacity changing over time, which he referred to as time-dependent behavior. This was followed by a series of studies conducted by scholars both domestically and abroad. Kul’chitskii et al. [11], through the study of the thixotropy of soft clay from a bay, found that due to the disturbance caused by pile driving, the strength of the soft clay changes significantly over time. The bearing capacity of the pile foundation exhibits notable time-dependent characteristics, with a rapid initial increase followed by a slower growth compared to the early stage. The uncertainty in the pile foundation bearing capacity does not provide accurate reference values for pile foundation design, posing risks to engineering safety and resulting in unnecessary costs. Yu et al. [12] studied the time-dependent behavior of the bearing capacity of bored and cast-in-place uplift piles located in a clay-weathered granite foundation. They discovered that the uplift bearing capacity of these piles also exhibits significant time-dependent behavior, with earlier increases being more rapid compared to the later stages. This is attributed to the disturbance of the surrounding soil during pile installation and the recovery of the thixotropic properties of the slurry used for retaining walls. Zhang et al. [13] conducted intermittent reloading tests and static load tests on static pressure piles, discovering that the pile foundation exhibits significant time-dependence, with the thixotropy of the soil being a primary influencing factor on the bearing capacity of the pile foundation. Zhang et al. [14] investigated the uplift bearing capacity of bored and cast-in-place piles in sandy soil and weathered sandstone foundations. The results indicated that the uplift bearing capacity of the cast-in-place piles exhibits significant time-dependent behavior, primarily due to the thickness of the mud cake formed by the slurry used for wall support, with rapid initial increases and slower growth in the later stages. Hu et al. [15] studied the recovery process of the bearing capacities of large-diameter steel pipe piles based on a project in West Africa. They found that the initial driving and re-driving of piles after different resting times display notable time-dependent behavior. The above studies analyzed the effects of thixotropy, consolidation effects, construction techniques, and different resting times on the time-dependent behavior of pile bearing capacity, providing insights for exploring the time-dependent behavior of uplift pile bearing capacity in the structural clay of the Zhanjiang Formation.
In the design of uplift piles, determining their uplift bearing capacity is a crucial aspect. Many researchers have studied and proposed different methods for calculating uplift bearing capacity. For instance, Meyerhof. [16] and Das. [17] proposed a semi-empirical algorithm based on model tests of pullout piles. They only considered the increase in side friction resistance with depth and did not take into account the increase in side friction resistance caused by the surrounding soil over time. Chattopadhyay et al. [18] established a model based on the composite shear failure surface of sandy soil for solution, without considering the contribution of clay cohesion to the pullout bearing capacity, as well as the increase in side friction resistance over time. Shanker et al. [19] investigated the pullout bearing capacity of pile foundations at different slenderness ratios, but this model similarly did not consider the cohesion as well as the recovery of side friction resistance over time. He et al. [20] established a predictive model for pullout piles using the horizontal strip method. They initially assumed the type of failure mode for the pullout piles and then established equations based on the limit equilibrium method to derive a calculation method. This method considers the contribution of soil cohesion to the pullout bearing capacity, but it does not account for the increase in bearing capacity due to the recovery of soil strength around the pile. Zou et al. [21] used software to simulate the variation of uplift bearing capacity of driven piles on offshore platforms over time. They proposed a time-dependent calculation formula for the uplift bearing capacity of piles, considering the influence of permeability coefficients, and validated the model’s accuracy through field tests. However, the aforementioned calculation methods for pullout bearing capacity are mostly applicable to sandy soils and do not consider the effect of cohesion on pullout bearing capacity, nor do they take into account the impact of strength changes in the soil surrounding the pile on the pullout bearing capacity. Therefore, there is a significant error when applied to the structured clay of the Zhanjiang Formation. Additionally, current standards primarily calculate the pullout bearing capacity based on the compressive bearing capacity of piles and do not account for the time-dependent effects of thixotropic soil around the pile on bearing capacity. This presents a challenge in applicability for pullout piles in the structured clay foundation of the Zhanjiang Formation.
This study investigates the thixotropic behavior of the cohesion and internal friction angle of remolded structured clay from the Zhanjiang Formation, as well as the ultimate bearing capacity of uplift piles under different resting times, through direct shear tests of surrounding soil and static loading tests on model piles under varying resting durations. Based on these findings, a time-dependent predictive model for the ultimate bearing ability of uplift piles in structured clay foundations from the Zhanjiang Formation has been established and validated through model tests.

2. Indoor Model Testing

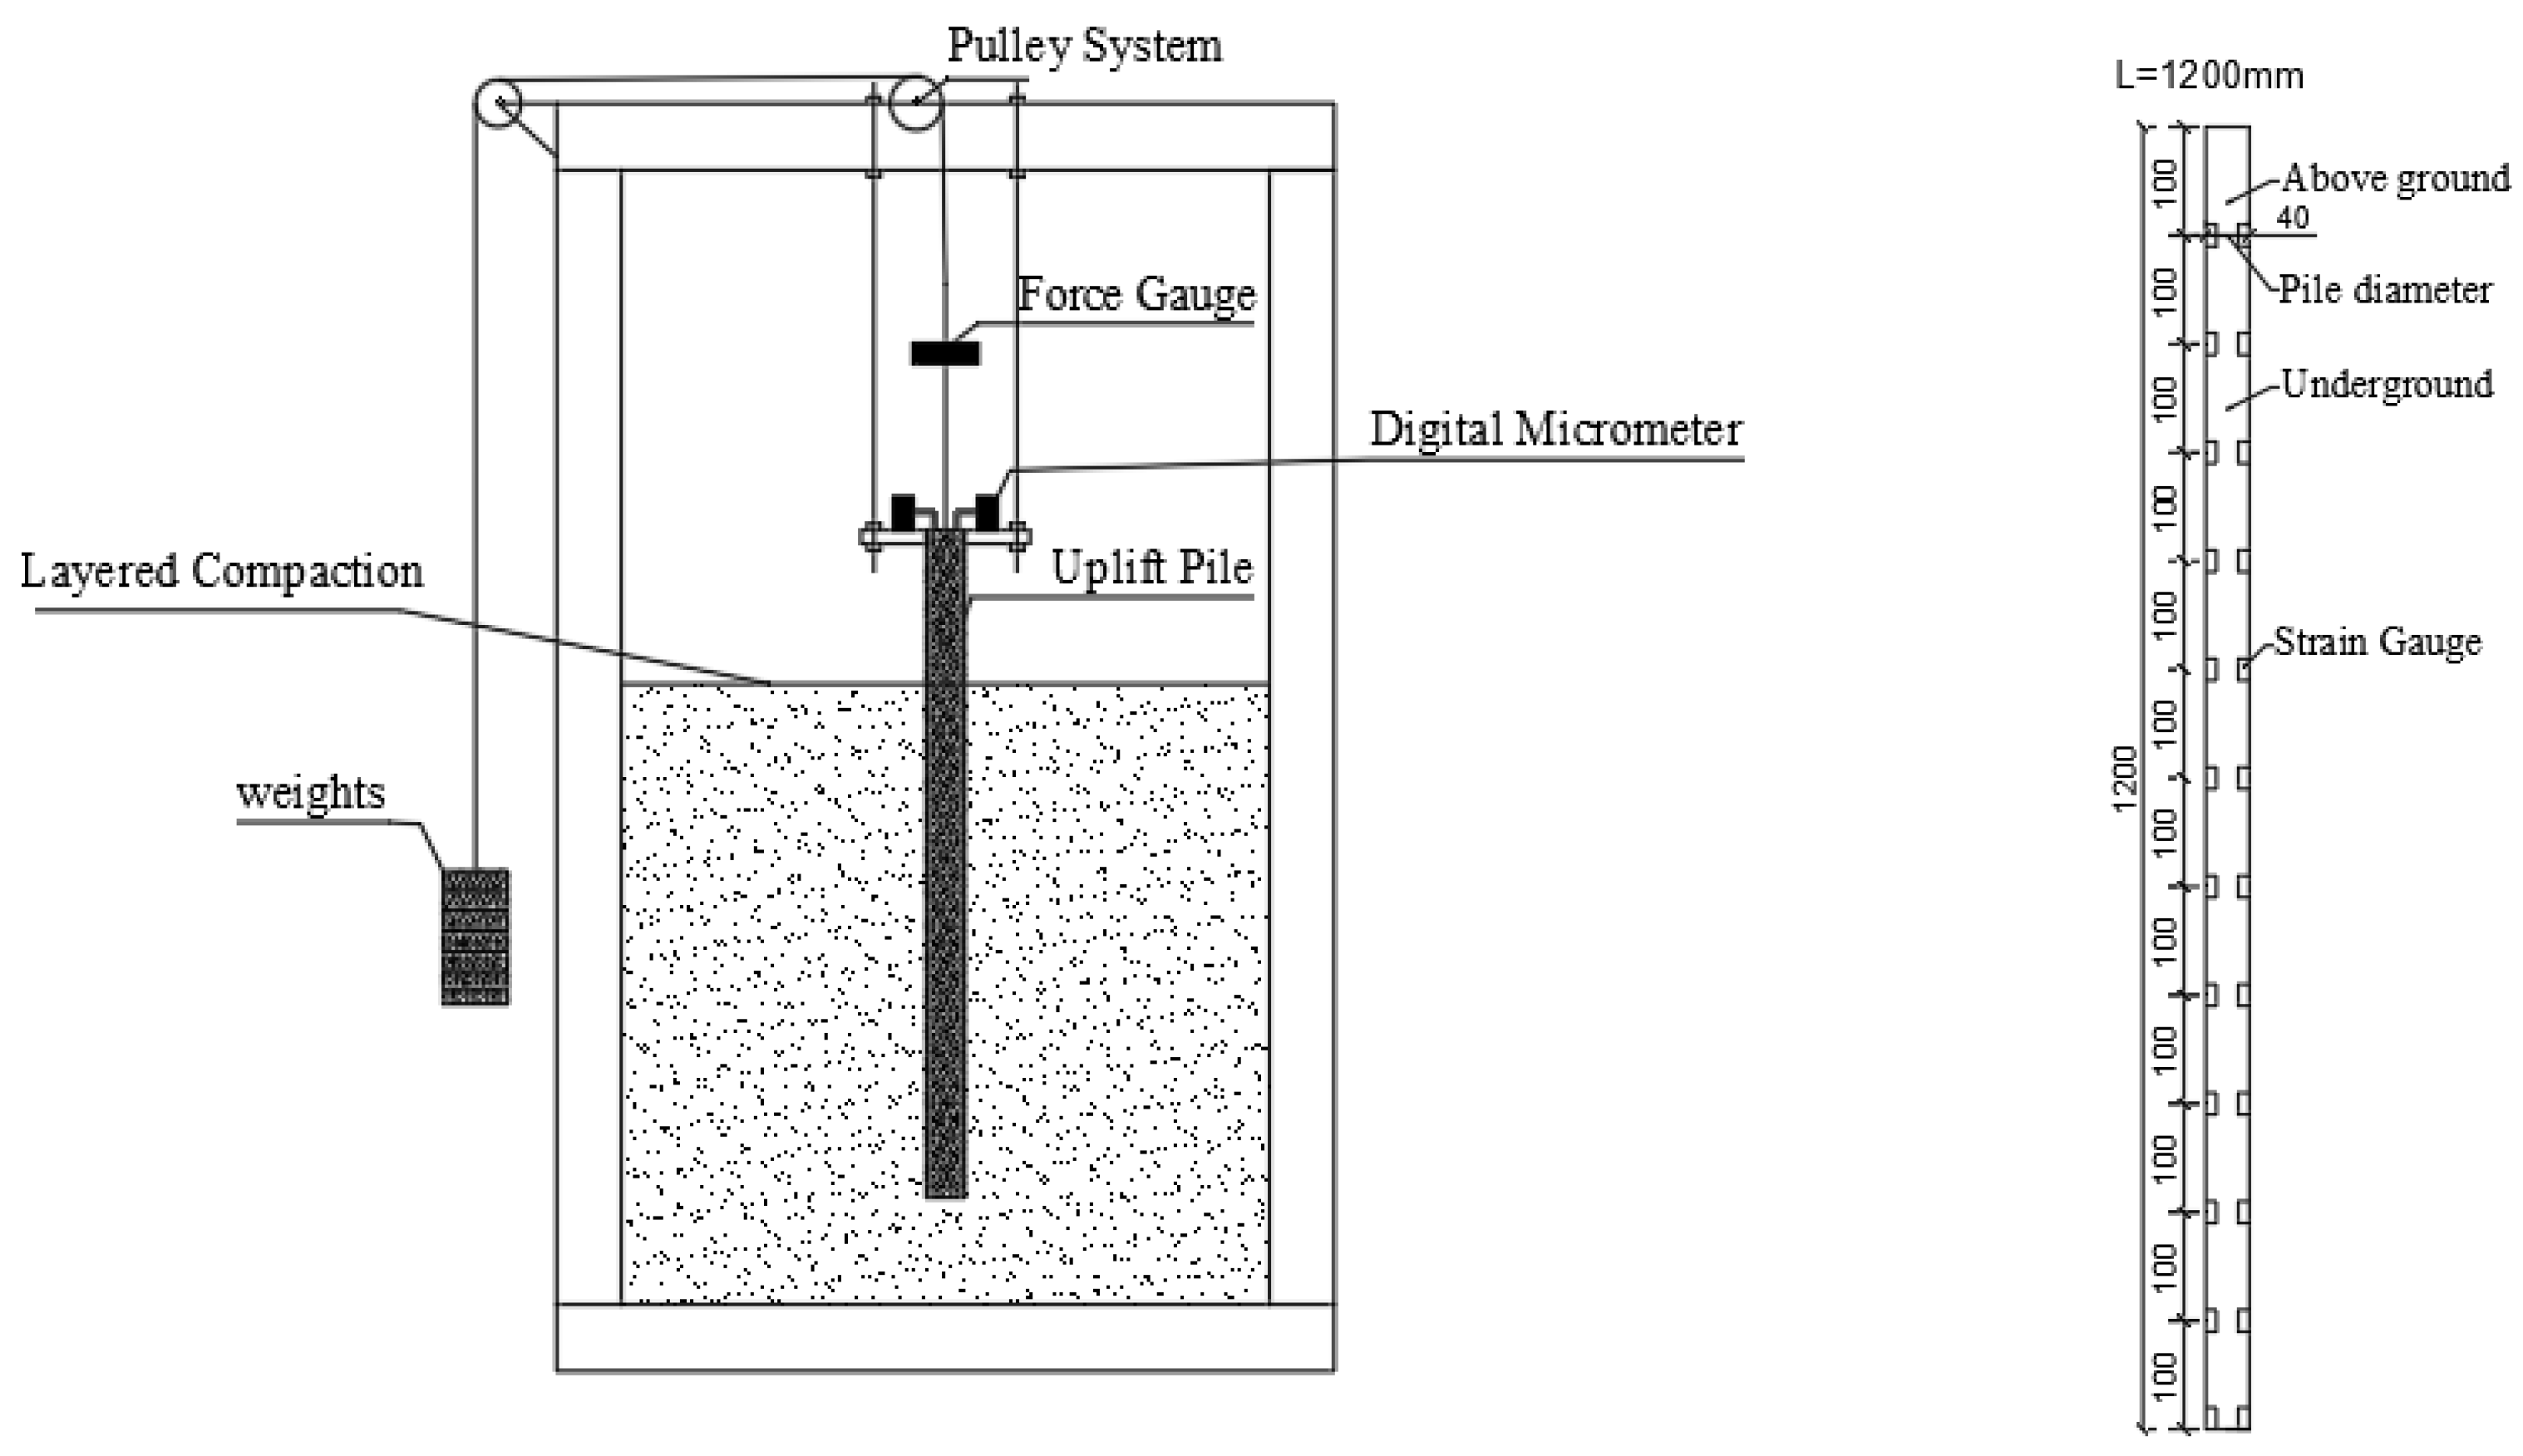
2.1. Model Testing Apparatus

2.1.1. Model Box

The experiment used a custom-built model box that meets engineering practices and similarity theory. The dimensions of the model box were designed to be 0.7 m × 0.5 m × 1.7 m, with a surrounding frame made of stainless steel and sides constructed from transparent, thickened tempered glass to ensure strength. The model testing setup is illustrated in Figure 1.

2.1.2. Model Pile

Based on engineering practice, a model was created to simulate a pullout pile with a length of 20 m and a diameter of 0.5 m, made of pre-cast reinforced concrete, with a concrete strength grade of C30 and an elastic modulus of 30 GPa. Considering the operability of the experiment, the impact of data collection, and testing duration, this experimental study strictly follows the theory of similarity and uses a model test research method. Through similarity verification of the surrounding soil and the model pile used in the model test, the similarity ratio for the model is determined to be 1:20. A PC pipe is selected as the model pile, with an elastic modulus of 7.5 GPa. The embedment depths were selected as 600 mm, 900 mm, and 1100 mm, with pile diameters of 20, 25, and 40 mm. To facilitate the reading of experimental data, the total length of the model pile was made 100 mm longer than the embedment depth, as shown in Figure 1.
The PC pipe is composed of two half-shells cut along the axis. Strain gauges are symmetrically pasted on the inner wall at intervals of 100 mm, starting from 100 mm below the pile top. The surface of the strain gauges is coated with a layer of epoxy resin for waterproofing. Finally, the two half-shells are bonded and fixed together using adhesive to form the model pile. The parameters of different model piles and soil depths are shown in Table 1.

2.1.3. Loading Device

This experiment uses a pulley–weight combination loading method that does not require pressure compensation during the loading process compared to a hydraulic jack. The graded loads during loading are more clearly defined, which reduces the error in the experimental data. A sliding I-beam is installed at the upper part of the model box. Pulleys are welded to the lower part of the I-beam and the side of the model box. A flexible steel cable is used to convert the weight of the weights into the uplift force applied at the pile top. A load cell is connected between the weights and the pile to measure the magnitude of the applied uplift force.

2.1.4. Measurement System

The cohesion and internal friction angle of the soil around the pile can be obtained using the ZJ-type strain-controlled direct shear apparatus (four-way shear). A digital micrometer is used to collect the displacement at the pile top. Load data collection is performed using the GGD-330 type measuring controller. Strain data collection is carried out using the BZ2205C program-controlled static resistance strain gauge. The strain gauge model is BX/BF120-5AA, with a resistance value of 120 Ω.

2.2. Soil Surrounding the Pile

Measure the physical properties of the undisturbed soil sample taken. The results are shown in Table 2.
The undisturbed soil is dried, crushed, and remolded to create reconstituted soil that matches the natural density and moisture content of the original soil. During backfilling, a 30 cm thick layer of the soil sample is first placed in the model box. The position of the model piles is marked within the box. After fixing the model piles in place, the soil sample is filled in layers, each 5 cm thick. To verify the uniformity of the backfill, a ring cutter is used to take samples from each layer to determine whether the density of the filled soil samples is consistent. Before introducing the next layer of soil, the surface of the upper layer needs to be treated to create a rough surface so that the layers can tightly bond together and integrate as one. This process is repeated until the fill reaches the predetermined burial depth of the model piles.

2.3. Experimental Design

After the soil layering in the model container is completed, and referencing Tang Bin’s [22] research on the ultimate bearing capacity of compressive piles in the Zhanjiang Formation structured clay, it is decided to carry out static uplift load tests on the pile foundation and direct shear tests on the soil surrounding the pile at rest periods of 1 d, 7 d, 14 d, 28 d, 60 d, and 90 d. The ultimate uplift bearing capacity of the model pile, the strain in the pile body, the displacement at the pile head, and the cohesion and internal friction of the surrounding soil are measured after different rest periods. Curves are fitted to show how the cohesion and internal friction angle of the surrounding soil change over time. Based on the pile body strain values, the axial force distribution and side friction resistance distribution of the pile are obtained. Using the quantified relationship of the surrounding soil’s cohesion and inside friction angle over time, a predictive model for the ultimate bearing capacity of pullout piles in the Zhanshan Group’s structured clay foundation is established.

3. Analysis of Test Results

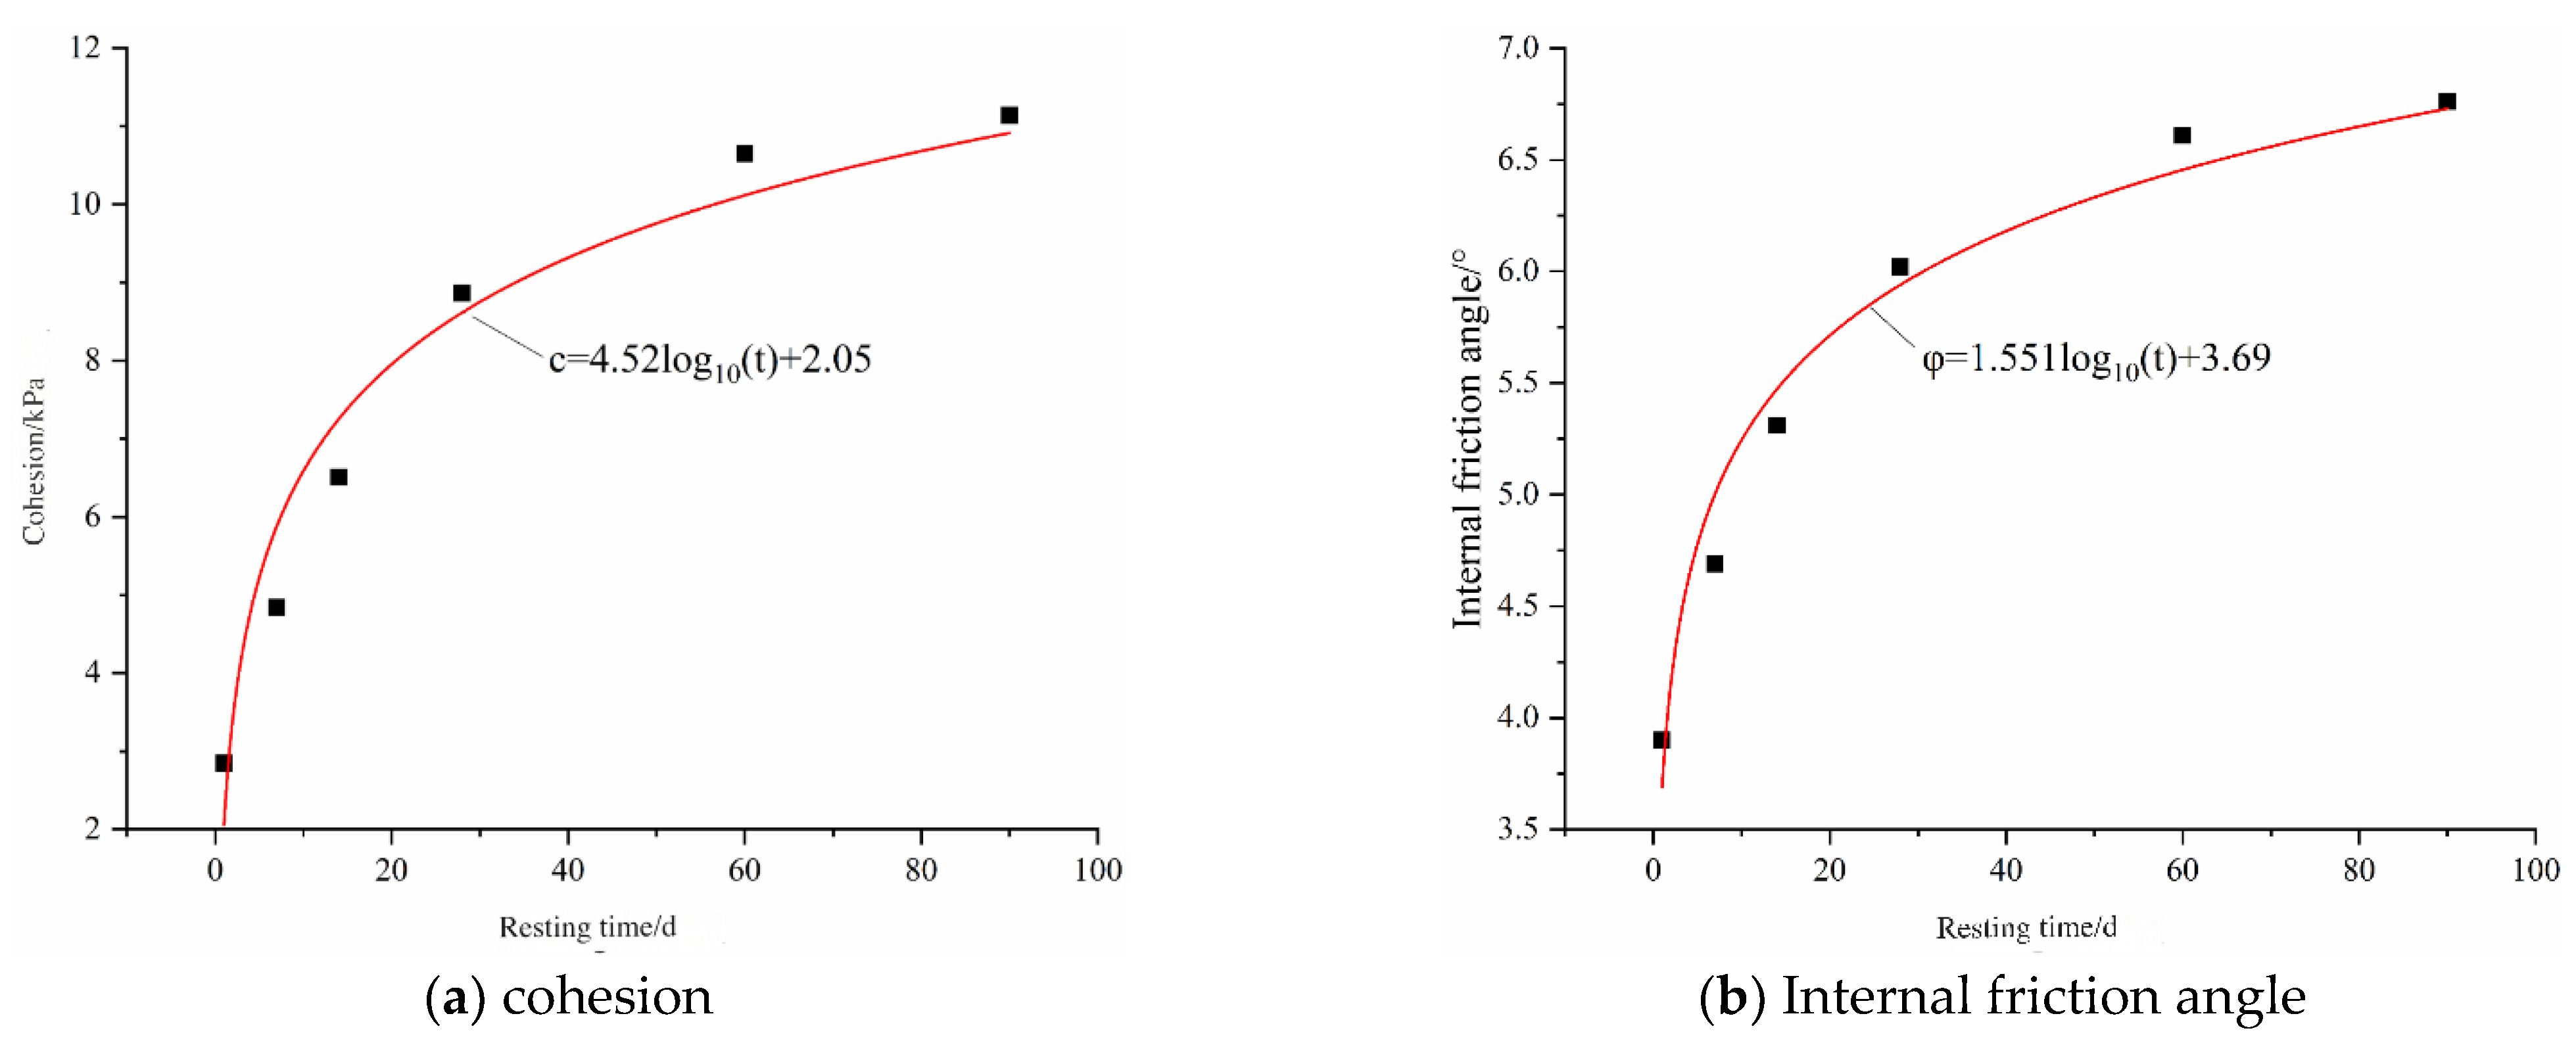
3.1. Thixotropy of Soil Surrounding the Pile

The rapid direct shear tests conducted on the soil surrounding the pile yielded the cohesion (c) and internal friction angle (φ) of the surrounding soil at different resting times, as shown in Table 3.
As shown in Table 3, the internal friction angle and cohesive strength of the soil surrounding the pile exhibit similar increasing trends as the resting time is increase. Specifically, the growth rate is rapid during the first 30 days, slower during the middle 30 days, and slowest in the final 30 days. Throughout the entire testing period, the cohesive strength increased by 291% and the internal friction angle increased by 73%. The soil surrounding the pile demonstrates a significant thixotropic recovery. Analyzing the reasons, the structural clay of the Zhanjiang Formation exhibits thixotropic properties. During the processes of soil sampling and mixing, the structural integrity of the soil is compromised, resulting in the disruption of aggregate structures, increased particle spacing, reduced interlocking forces between particles, and the breakdown of connections between particles. Cohesive strength arises from factors such as the cementation effect and electrostatic forces between soil particles. After resting, the aggregation of soil particles allows the cohesive strength and internal friction angle of the soil to recover. The disturbance process in the experiment can simulate the disturbance of the soil surrounding the pile during engineering construction, which similarly causes damage to the soil structure. As construction is completed, the surrounding soil is in a resting state, and the strength of the soil gradually recovers with the passage of time.
The curves of cohesive strength (c) and internal friction angle (φ) of the soil surrounding the pile as a function of resting time (t) were fitted respectively, as shown in Figure 2.
From Figure 2a, it can be seen that the relationship between the cohesion (c) of the soil surrounding the pile and the resting time (t) can be expressed as:
c = 4.52 l o g 10 t + 2.05
From Figure 2b, it can be seen that the relationship between the internal friction angle (φ) of the soil surrounding the pile and the resting time (t) can be expressed as:
φ = 1.551 l o g 10 t + 3.69

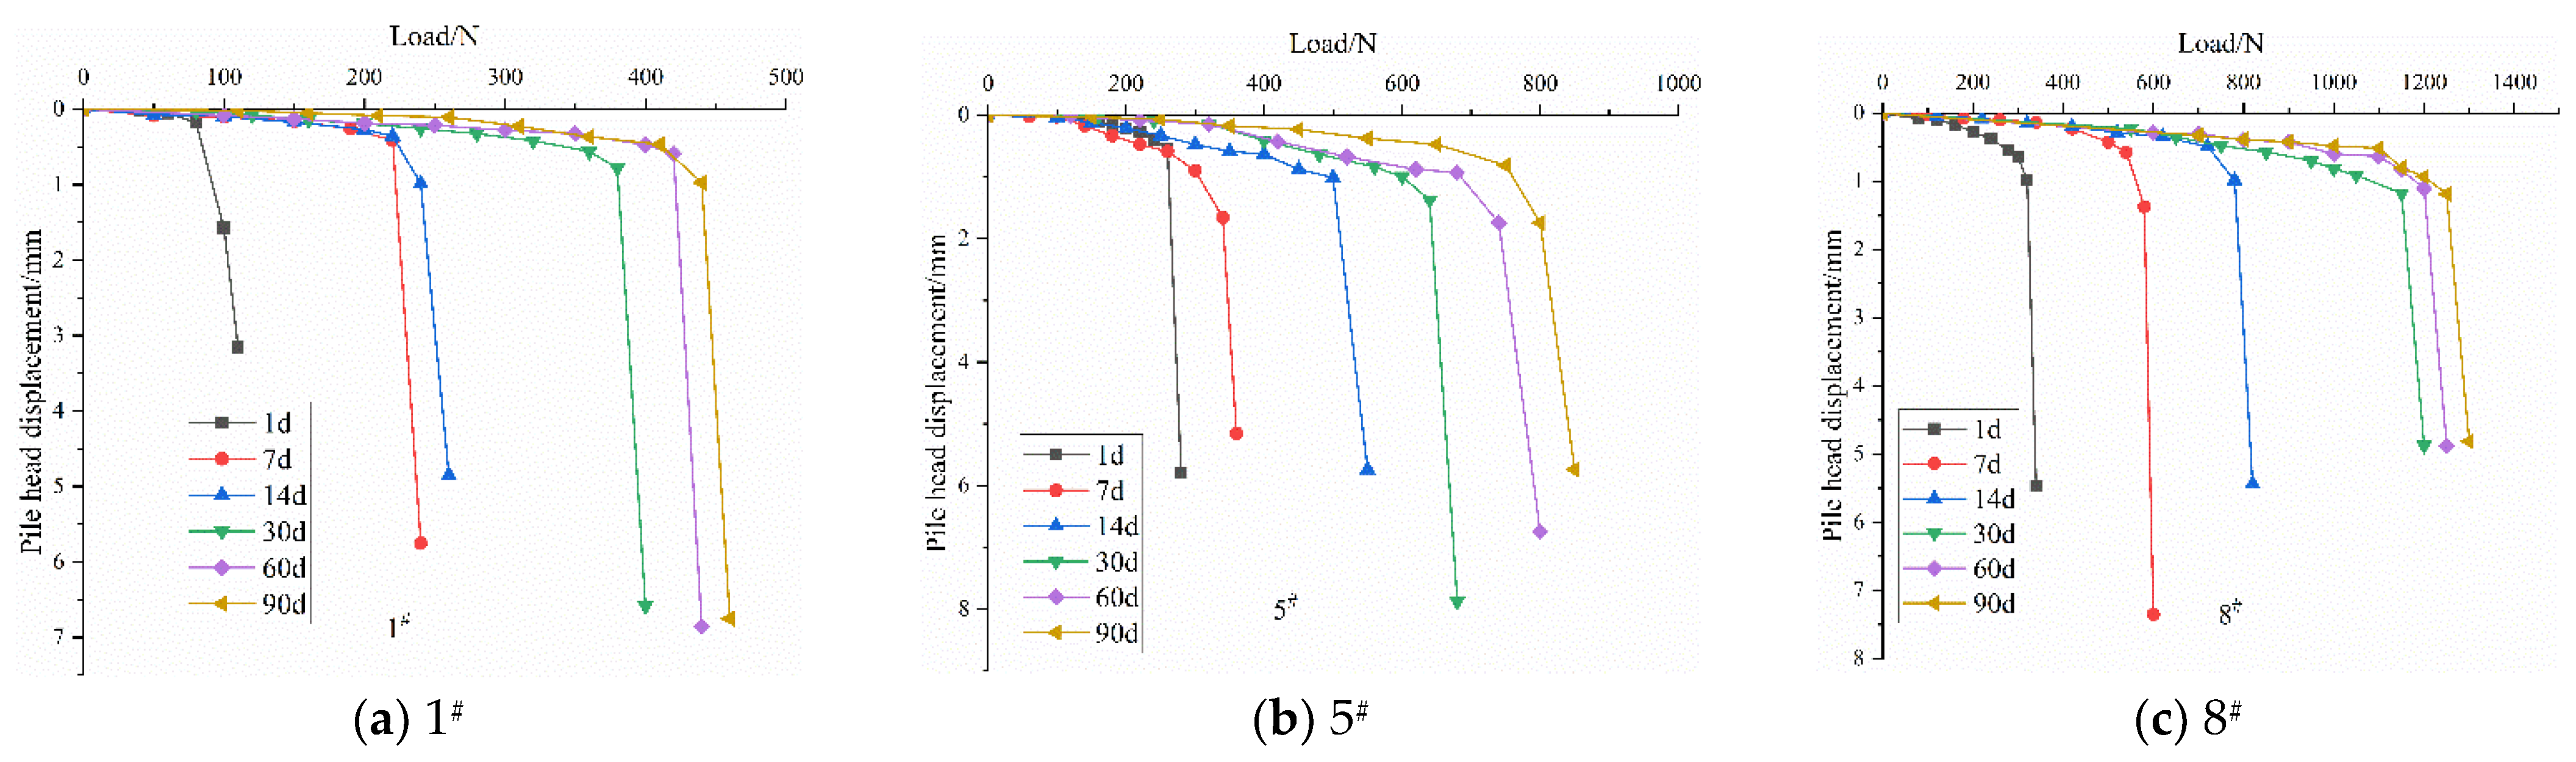
3.2. The Time-Dependent Behavior of the Uplift Pile Bearing Capacity

The ultimate uplift bearing capacity of the model pile was obtained through static loading tests on the pile foundation. The increase in bearing capacity after resting for 60 days compared to 1 day is shown in Table 4.
From Table 4, it can be observed that:
The ultimate pullout bearing capacity of the model piles increases with the increase in resting time. Among the piles, piles 7#, 4#, 1#, and 3# exhibit significant increases, all exceeding 300%, with the maximum increase reaching 350%. In contrast, piles 9#, 5#, and 2# have relatively smaller increases of 180%, 188%, and 195%, respectively.
The ultimate pullout bearing capacity of a single pile exhibits a rapid increase in the initial phase of testing, followed by a more gradual rise in subsequent stages. This behavior can be ascribed to the pronounced structural and thixotropic characteristics of the Zhanjiang Group structured clay. During soil sampling and preparation, the natural soil structure is compromised, leading to reduced soil strength and consequently a lower pullout capacity for the model piles. As the resting period is extended, the soil structure begins to rehabilitate, enhancing the thixotropic effects. The cohesion and internal friction angle of the soil surrounding the piles gradually return to higher levels. Since the ultimate pullout capacity primarily depends on the cohesion and frictional forces between the pile and the surrounding soil, it exhibits notable time-dependent characteristics.
Figure 3 shows a comparative diagram of the effects of pile length and diameter on the load–displacement curves of the pullout piles for model piles 1#, 5#, and 8# at different resting times.
From Figure 3, it can be inferred that:
(1)
The U~s curves for each single pile exhibit a sharp decline and have distinct inflection points. When the pile length and diameter are the same, as the resting time increases, the pullout load and the top displacement of the model piles in the ultimate pullout state both increase. This can be attributed to the restoration of the surrounding soil strength with increasing resting time, which enhances the cooperative working ability of the pile–soil system. Consequently, the model piles have a greater pullout strength reserve, leading to improved pullout capacity and increased top displacement.
(2)
A comparative analysis of 5# (L = 900 mm, D = 25 mm) and 8# (L = 900mm, D = 40 mm) was conducted on the displacement corresponding to the failure load at different rest periods. It was found that when the pile length is 900 mm, as the pile diameter increases from 25 mm to 40 mm, the displacement at the pile head corresponding to the ultimate state of the model pile becomes smaller. The reason for this is that an increase in pile diameter improves the load transfer mechanism, making the load transfer more efficient. A larger pile diameter can better mobilize the shear intension of the soil and leads to a more reasonable stress distribution along the pile shaft, thereby reducing the upward displacement of the pile shaft.
(3)
Under the same resting times, for small-diameter short piles 1# (L = 600 mm, D = 20 mm), the load–displacement curve is steep, with a small ultimate displacement, and failure is primarily governed by slip failure at the pile–soil interface, while the effect of embedment time is limited. This analysis suggests that for small-diameter short piles, due to the small length-to-diameter ratio, the distribution of lateral friction resistance is relatively narrow and the recovery space of the soil is limited. As a result, the time effect on the recovery of the soil structure strength is offset by the rapid failure, leading to a weak time effect on the bearing capacity of the pile foundation. Therefore, short-term bearing capacity data should be used for design. For large-diameter long piles 8# (L = 900 mm, D = 40 mm), the load–displacement curve is more gradual and the time effect on the recovery of the bearing capacity is more pronounced. The analysis indicates that for large-diameter long piles, the larger lateral friction area allows for a greater participation of soil in the load-bearing effect, leading to the better long-term performance of large-diameter long piles.

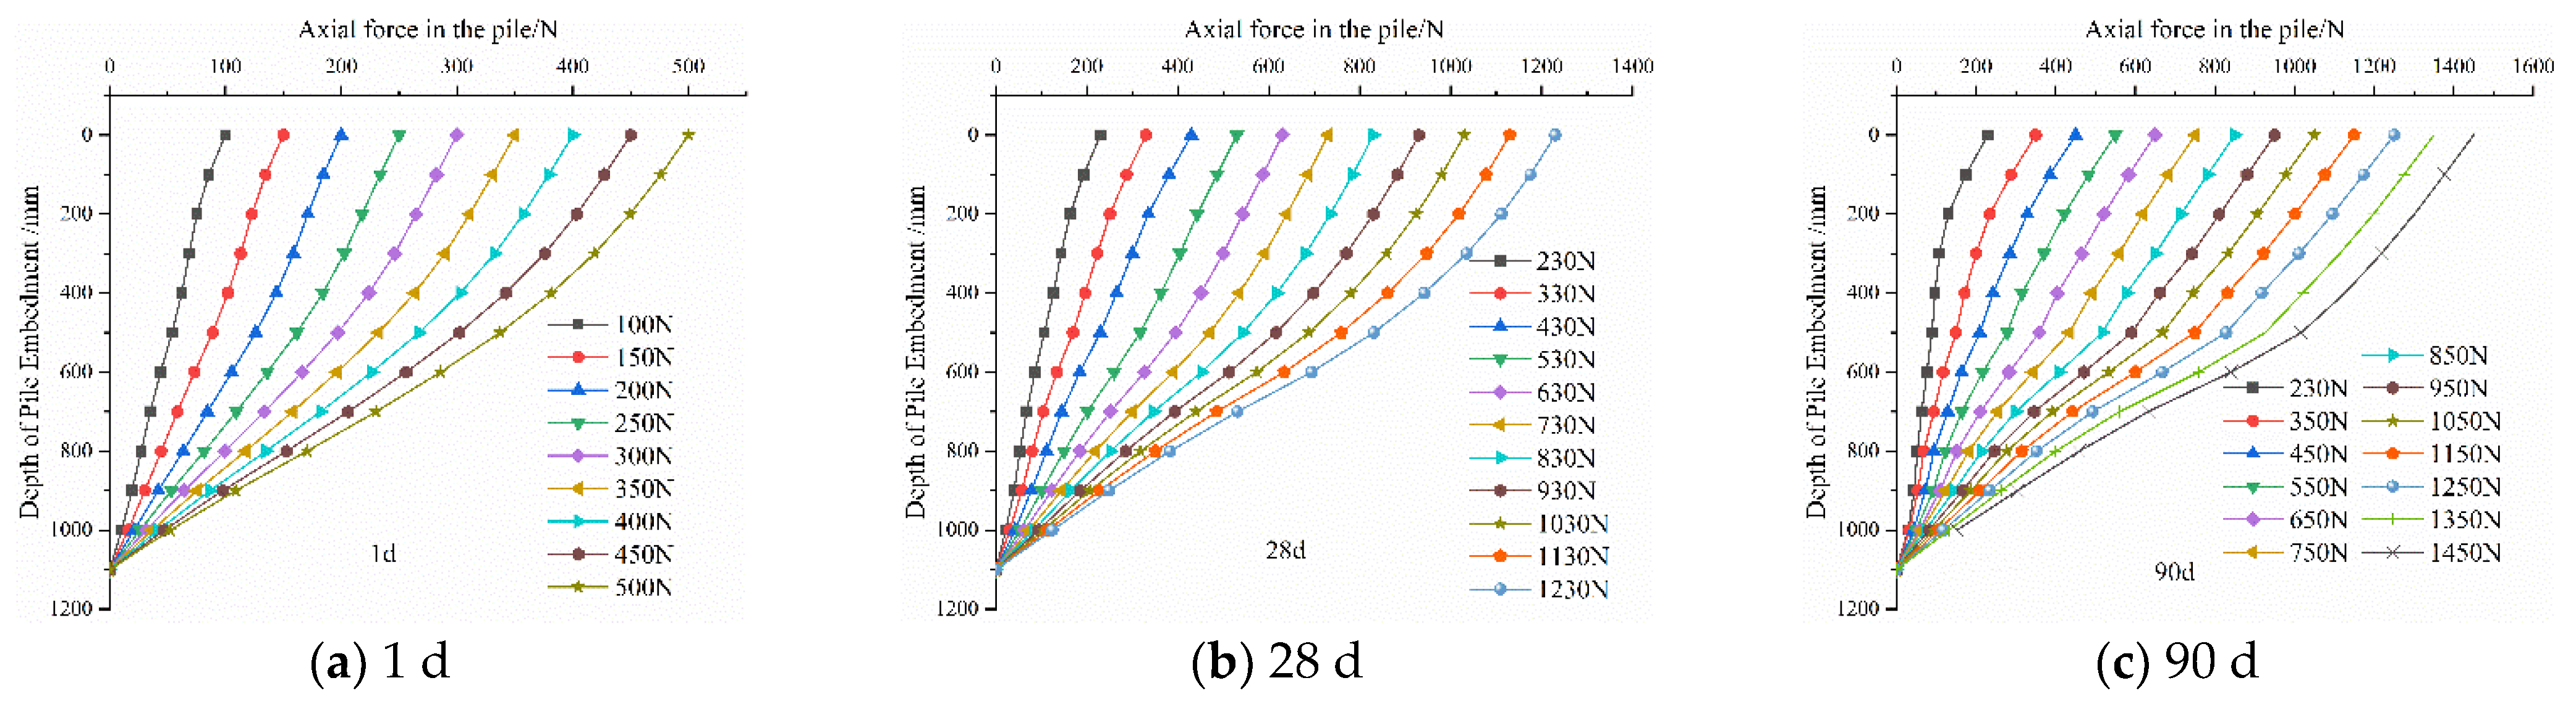
3.3. Analysis of Axial Forces in Piles

Taking the axial forces of the No. 9 model pile at rest periods of 1 day, 28 days, and 90 days as examples, the axial forces of the model pile are analyzed, as shown in Figure 4.
As shown in Figure 4, the axial force in the pile is largest at the pile head and continuously decreases down the pile shaft, reducing to zero at the pile tip. This indicates that the side friction of the pile plays an important role in the downward transfer of the load from the pile head. The figure also shows that the slope of the axial force curve of the model pile is smaller in the lower part compared to the upper part, and the rate of decrease of the axial force along the pile shaft becomes faster as you move downward. This suggests that the side friction resistance is primarily distributed in the lower part of the pile shaft.

3.4. Analysis of Side Friction Resistance of Piles
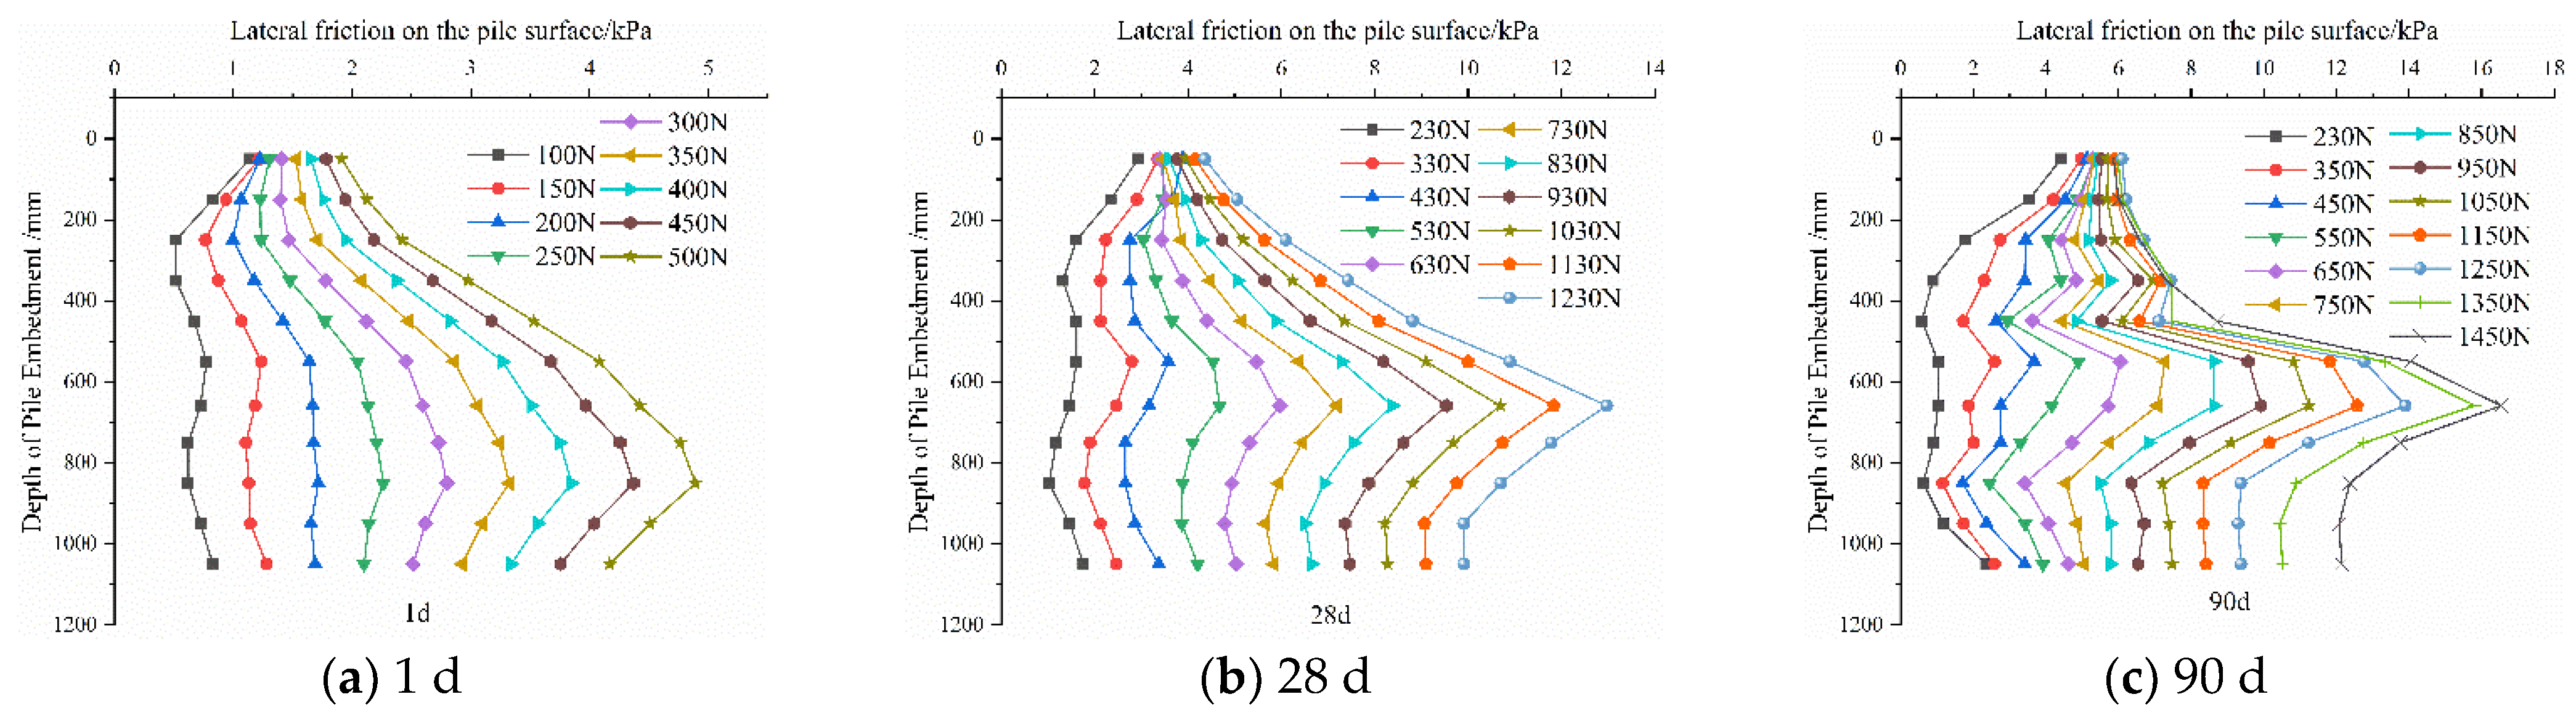
The side frictional resistance of the pile can be derived from the axial force in the pile. Figure 5 shows the side frictional resistance for model pile 9# at resting times of 1 day, 28 days, and 90 days.
As shown in Figure 5:
(1)
After different rest periods, the side friction resistance of the pile is primarily concentrated in the lower section of the pile body, while the side friction resistance at the pile top and pile toe is relatively small. The ultimate side friction resistance of the pile occurs in the lower segment of the single pile, indicating that the distribution of side friction resistance is related to the position of the pile body.
(2)
The development of the side friction resistance is asynchronous; with the increase in load, the side friction resistance in the upper soil layers activates before that in the lower layers. The load at the pile top is gradually transmitted downward, and with an increase in the rest period, there is a significant growth in the ultimate side friction resistance of the pile. Throughout the entire testing period, the ultimate side friction resistance of the pile increased from 4.89 kPa to 16.54 kPa, representing an increase of 238.2%, demonstrating a significant time effect.
(3)
As the resting time increases, the lateral friction resistance at the upper part of the pile does not show a significant increase due to the recovery of the surrounding soil strength. The analysis suggests that with an increase in rest time, the recovery of the surrounding soil strength leads to an increase in lateral friction resistance and the uplift bearing capacity of the pile. However, as the uplift bearing capacity increases, the Poisson effect in the pile becomes more pronounced and the reduction in lateral friction resistance due to the loosening of the pile–soil contact offsets the contribution of the recovery of the surrounding soil’s thixotropic properties. Therefore, if the uplift structure has strict requirements for its own displacement, the elastic modulus of the pile should be increased to reduce the elongation deformation caused by tensile forces.

4. Prediction Model for Time-Dependent Capacity of Uplift Piles

In cohesive soils, the uplift bearing capacity of suction piles is primarily composed of the cohesive force cc and the frictional force FF formed at the pile–soil interface. It is assumed that under the action of uplift loads, the side friction develops stably and sufficiently and the pile–soil interface conforms to the friction law. For the purpose of this study, a differential element dz of the pile body is considered, with the coordinate at the pile top being (0, 0) and the coordinate at the pile bottom being (0, L), as illustrated in Figure 6.
For normally consolidated soil, during the interaction between the pile and the soil, the normal pressure acting on the infinitesimal surface at a depth of z is:
σ = k 0 γ z
In the equation, σ represents the normal stress on the pile’s side surface. For normally consolidated soils, the coefficient of at-rest earth pressure k0 is given by k0 = 1 − sin(δ), where δϕ and ϕ is the angle of internal friction of the soil. γ denotes the effective unit weight of the soil, and z indicates the depth of the calculation point. Under ultimate equilibrium conditions, experiments have shown that the failure mode of the model pile in uplift is characterized by the pile–soil contact interface acting as the failure surface, and the frictional resistance on the side of the infinitesimal element is given by:
F = μ π D σ d z
In the equation, μ is the pile–soil friction coefficient, taken as μ = tan(ϕ); D is the pile diameter.
The lateral resistance acting on the infinitesimal element is:
f = π D ( c + μ k 0 γ z ) d z
By integrating the lateral resistance along the pile body, the calculation formula for the uplift bearing capacity in uniform soil can be obtained:
U = 0 L π D ( c + μ k 0 γ z ) d z
By integrating, we can obtain:
U = π D c L + 1 2 μ k 0 γ L 2
In the formula, L represents the pile length and c denotes the cohesion of the soil.
Since the internal friction angle ϕ and cohesion c are both functions of time and vary with the duration of rest, incorporating the functional relationships of cohesion and internal friction angle with respect to time yields a prediction formula for the limit bearing capacity against uplift considering aging effects, which is as follows:
U = π D c ( t ) L + 1 2 t a n φ ( t ) 1 s i n φ ( t ) γ L 2

5. Validation of Time-Dependent Prediction Model for Uplift Capacity

To verify the validity of the formula, indoor static pullout tests of model piles 2#, 4#, and 7# were conducted under the same experimental conditions. The load–displacement curves for these three groups of model piles were obtained, as shown in Figure 7. Through the load–displacement curves, the measured ultimate pullout load capacities of model piles 2#, 4#, and 7# after different rest periods were obtained. See Table 4.
As shown in Figure 7, the load–displacement curves for the model piles in the comparative tests of groups 2#, 4#, and 7# are all steeply descending, indicating that the model piles exhibit distinct failure loads. The calculated values of the uplift ultimate bearing capacity for piles 2#, 4#, and 7# after different resting times were obtained using the predictive model for the time-dependent behavior of uplift ultimate bearing capacity, as shown in Table 5.
The curves fitting the calculated uplift limit bearing capacities of piles 2#, 4#, and 7# and the measured values in Table 4 with respect to time are shown in Figure 8.
As shown in Figure 8, the measured and calculated values of the uplift ultimate bearing capacity for the model piles in groups 2#, 4#, and 7# increased rapidly from 1 d to 28 d, slowed down from 28 d to 60 d, and gradually stabilized from 60 d to 90 d. Both values exhibited a similar growth trend as the resting time increased. A comparison of the calculated values and measured values of the ultimate pullout capacity of model piles across three experimental groups revealed that, among the 18 predicted and calculated values, when excluding 3 outliers where the error exceeded 10%, the errors of the remaining 15 points were all below 10%, resulting in a prediction accuracy of 83%. This indicates that the prediction model is feasible for estimating the ultimate pullout capacity at different resting times in the structured clay of the Zhanjiang Formation. The predictive model provides a reference for forecasting the uplift bearing capacity of piles at different times in the structured clay foundation of the Zhanjiang Formation.

6. Conclusions

This article investigates the thixotropy of the structured clay of Zhanjiang and the time-dependent uplift bearing capacity of pile foundations through direct shear tests of the surrounding soil and static uplift load tests on the piles, leading to the following conclusions.
(1)
The internal friction angle and cohesion of the Zhanjiang Group structured clay show a significant time effect as the rest time increases after disturbance. The increase is rapid in the initial stage of the test but slows down in the later stage, which is the primary reason for the increase in uplift capacity of the piles in this foundation soil.
(2)
With the increase in rest time, the uplift bearing capacity of the model pile shows a clear time-dependent effect. When the bearing capacity is insufficient in the early stages of pile driving, the increase in pile foundation bearing capacity due to the time effect can be taken into account when reasonably scheduling the project.
(3)
The axial force of the model pile decreases rapidly in the lower part of the pile shaft and is nearly zero at the pile tip, indicating that the pullout bearing capacity of the pile is entirely provided by the side friction resistance. The side friction resistance and the ultimate side friction resistance of the pile are mainly distributed in the lower part of the pile shaft, and they show a significant increase with the prolongation of the resting time.
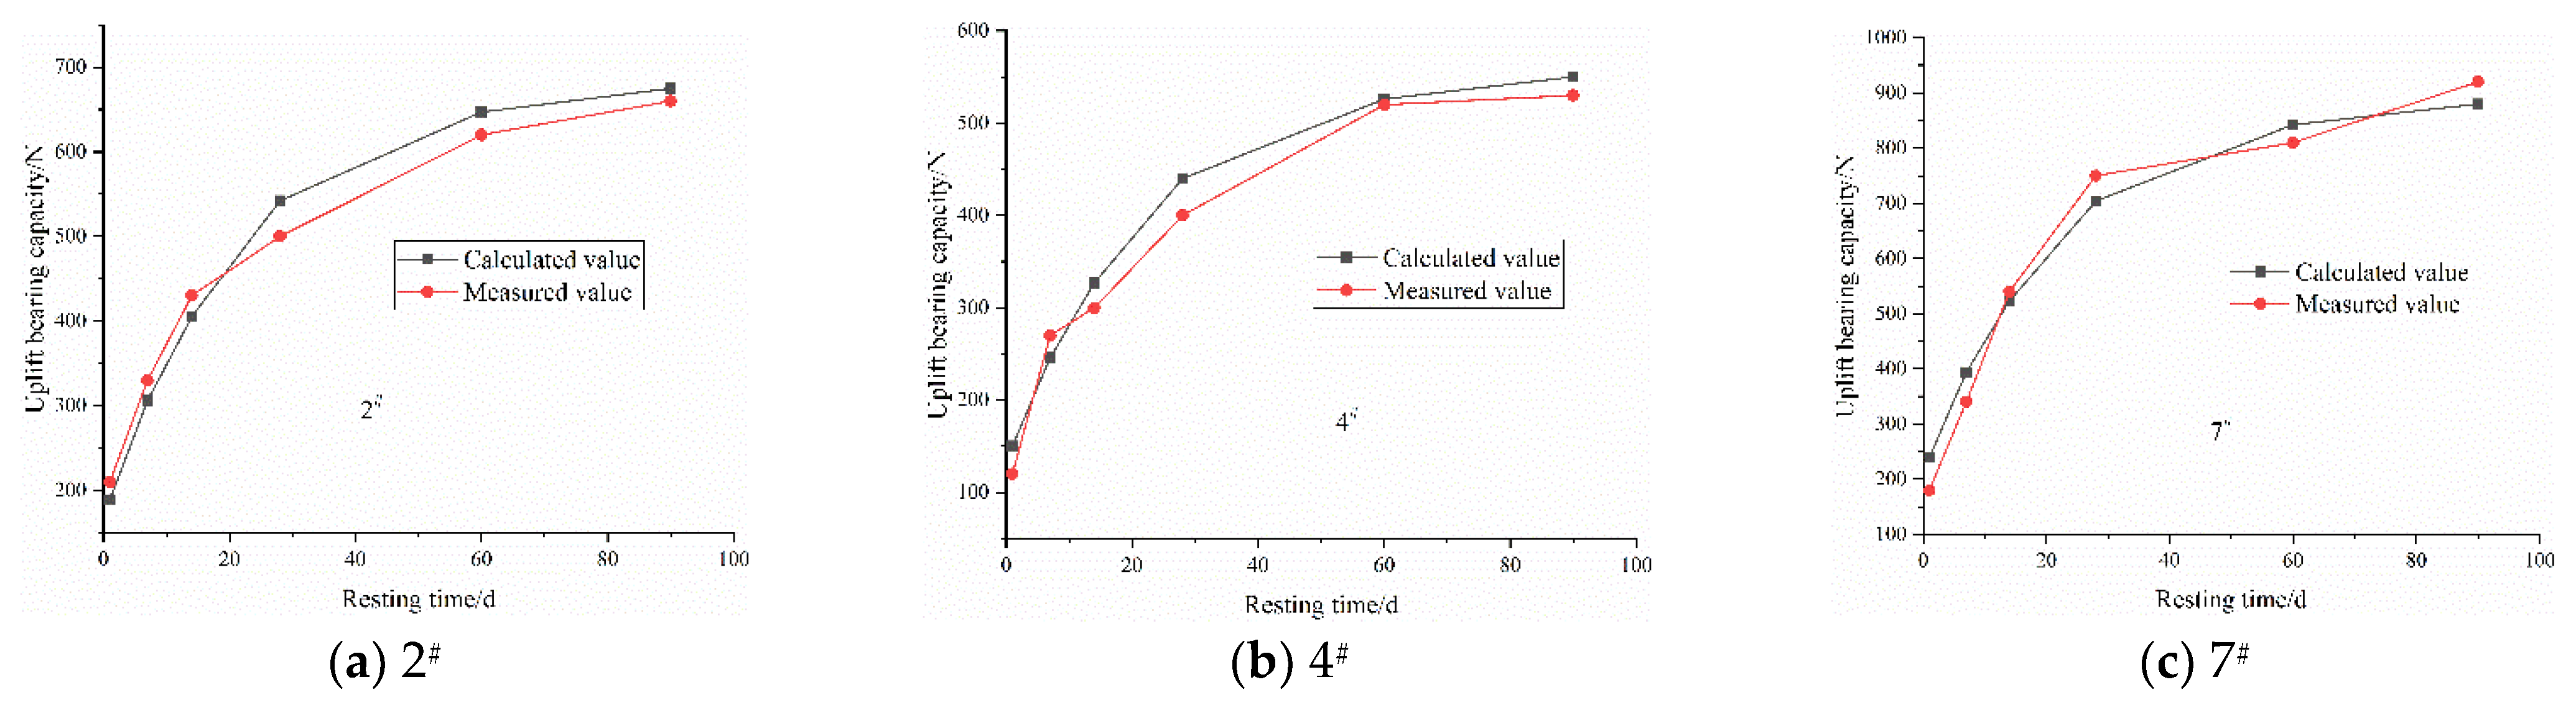
(4)
A predictive model for the axial pullout ultimate bearing capacity that considers the time-dependence of Zhanjiang Group structured clay has been established. The validity of the predictive model has been verified through model experiments. This provides a reference for predicting the axial pullout bearing capacity of piles in the Zhanjiang Group structured clay foundation in engineering practices.

Author Contributions

Conceptualization, Y.Y. and T.B.; funding acquisition, T.B.; investigation, Y.Y., T.B., Y.W., X.H. and Z.Y.; project administration, Y.Y. and T.B.; validation, Y.Y., T.B., Y.W., X.H. and Z.Y.; writing—original draft, Y.Y. and T.B. All authors have read and agreed to the published version of the manuscript.

Funding

This project was financially supported by the National Natural Science Foundation of China (No. 42367020) and Guangxi Natural Science Foundation project (No. 2024GXNSFAA010450).

Institutional Review Board Statement

Not applicable.

Informed Consent Statement

Not applicable.

Data Availability Statement

The original contributions presented in this study are included in the article. Further inquiries can be directed to the corresponding author.

Conflicts of Interest

The authors declare no conflicts of interest.

References

  1. Liu, Z.D. Antipull Pile Foundation. Geotech. Treat. 1995, 6, 12. Available online: https://xueshu.baidu.com/usercenter/paper/show?paperid=227373c044c3e96244ae4fe3066fc4d3&site=xueshu_se (accessed on 26 March 2025).
  2. Zhang, X.W.; Kong, L.W.; Guo, A.G.; Yongfei, T. Physical and mechanical properties of strong structural clay in Zhanjiang and correlation analysis. J. Eng. Geol. 2011, 19, 447–454. [Google Scholar] [CrossRef]
  3. Zheng, Y.; Wang, R.; Lü, H.B. Discussion on regional characteristics of structural clay in Zhanjiang Formation. In Proceedings of the National Academic Conference on Engineering Geology, China Geological Society Engineering Geology Professional Committee, China Geological Survey, Qinghai Provincial Land and Resources Department, Xining, China, 3 August 2011; p. 4. [Google Scholar]
  4. Shen, J.H.; Wang, R.; Zhu, C.Q. Study on spatial distribution law of gray clay in Zhanjiang Formation. Rock Soil Mech. 2013, 34, 331–336+339. [Google Scholar] [CrossRef]
  5. Boswell, P.G.H. A preliminary examination of the thixotropy of some sedimentary rocks. Q. J. Geol. Soc. 1948, 104, 499–526. [Google Scholar] [CrossRef]
  6. Landrou, G.; Brumaud, C.; Pltze, M.L. A fresh look at dense clay paste: Deflocculation and thixotropy mechanisms. Colloids Surf. A Physicochem. Eng. Asp. 2018, 539, 252–260. [Google Scholar] [CrossRef]
  7. Chen, B.; Shu, Q.F.; Deng, R.S. Microscopic explanation of clay strength aging considering the interaction between plate-like particles. Chin. J. Geotech. Eng. 2021, 43, 271–280. [Google Scholar]
  8. Zhang, X.W.; Kong, L.W.; Li, J.; Aiwu, Y. Microscopic mechanism of strength recovery during thixotropic process of clay. Chin. J. Geotech. Eng. 2014, 36, 1407–1413. [Google Scholar]
  9. Zhao, S.N.; Leng, Y.K.; Liu, X.G. Comprehensive evaluation of thixotropy of structural clay in Zhanjiang Formation based on gray correlation analysis. Soil Found. 2024, 38, 86–89. [Google Scholar]
  10. Yang, S.; Andersen, K.H. Thixotropy of marine clays. Geotech. Test. J. 2016, 39, 331–339. [Google Scholar] [CrossRef]
  11. Kul’Chitskii, G.B. Thixotropy of soils of the Middle Ob region and its consideration when constructing pile foundations. Soil Mech. Found. Eng. 1975, 12, 168–170. [Google Scholar]
  12. Yu, M.Y.; Wu, Z.H.; Wang, Q.; Changjiang, L.I.; Lixiang, C. Time effect analysis of uplift bearing capacity of drilled pile in clay-weathered rock strata. Ind. Archit. 2018, 48, 85–88+96. [Google Scholar] [CrossRef]
  13. Zhang, M.Y.; Shi, W.; Wang, C.G.; Linjun, P. Aging effect on the ultimate bearing capacity of static load piles. Chin. J. Rock Mech. Eng. 2002, 21, 2601–2604. [Google Scholar] [CrossRef]
  14. Zhang, M.Y.; Liu, J.W. Time effect study on uplift bearing capacity of drilled piles in sandy weathered rock foundations. Rock Soil Mech. 2008, 29, 3153–3156. [Google Scholar] [CrossRef]
  15. Hu, X.H.; Huang, B.; Wang, X. Experimental study on the recovery process of bearing capacity of large-diameter steel pipe piles. Waterw. Eng. 2018, 193–197+219. [Google Scholar] [CrossRef]
  16. Meyerhof, G.G.; Adams, J.I. The ultimate uplift capacity of foundations. Can. Geotech. J. 1968, 5, 225–244. [Google Scholar]
  17. Das, B.M. A procedure for estimation of uplift capacity of rough piles. Soils Found. 1983, 23, 122–126. [Google Scholar]
  18. Chattopadhyay, B.C.; Pise, P.J. Uplift capacity of piles in sand. J. Geotech. Eng. 1986, 112, 888–904. [Google Scholar] [CrossRef]
  19. Shanker, K.; Basudhar, P.K.; Patra, N.R. Uplift capacity of single piles: Predictions and performance. Geotech. Geol. Eng. 2007, 25, 151–161. [Google Scholar] [CrossRef]
  20. He, S.M. Research on failure characteristics and bearing capacity of uplift piles. Rock Soil Mech. 2001, 308–310. [Google Scholar] [CrossRef]
  21. Zou, J.S.; Wang, T. Time effect analysis of uplift bearing capacity of driven piles in ocean platforms. Sci. Technol. Eng. 2013, 13, 7143–7147. [Google Scholar] [CrossRef]
  22. Tang, B.; Tu, W.J.; Yu, X. Experimental Study on the Creep Behavior of Single Piles in Zhanjiang Structural Clay. J. Wuhan Univ. Technol. (Mater. Sci. Ed.) 2018, 51, 516–521. [Google Scholar] [CrossRef]
Figure 1. Model box and model pile schematic diagram.
Applsci 15 03814 g001
Figure 2. Logarithmic relationship between cohesion, internal friction angle, and standing time.
Applsci 15 03814 g002
Figure 3. U-s curves of model piles.
Applsci 15 03814 g003
Figure 4. Axial force diagram of the 9# model pile after different resting times.
Applsci 15 03814 g004
Figure 5. Distribution of side friction resistance of the 9# model pile after different resting times.
Applsci 15 03814 g005
Figure 6. Calculation and analysis diagram of uplift pile.
Applsci 15 03814 g006
Figure 7. Pile load–displacement curves of the 2#, 4#, and 7# model piles after different resting times.
Applsci 15 03814 g007
Figure 8. Curves of calculated values and measured values of the bearing capacities of pile foundations.
Applsci 15 03814 g008
Table 1. Model pile parameters.
Pile NumberPile Length
L/mm
Depth of Pile Embedment/mmPile Diameter
D/mm
1#70060020
2#100090020
3#1200110020
4#70060025
5#100090025
6#1200110025
7#70060040
8#100090040
9#1200110040
Table 2. Undisturbed soil parameters.
Dry Density/g·cm−3Moisture Content/%Cohesion/kPaInternal Friction Angle/°Sensitivity
1.194652.2511.213.89
Table 3. Cohesion c and internal friction angle φ of soil around piles after different resting times.
Strength IndicatorsDifferent Curing Times of Pile Foundations/dMagnitude of Growth%
1 d7 d14 d28 d60 d90 d
c/kPa2.854.846.518.8610.6511.14291
φ3.94.695.316.026.616.7673
Table 4. Ultimate uplift bearing capacity of pile after different rest times.
Pile NumberPullout Ultimate Bearing Capacity of Piles After Different Resting Times/NMagnitude of Growth %
1 d7 d14 d28 d60 d90 d
1#100 220 240 380 430 450 330
2#210330430500620660195
3#200 360 540 640 830 840 315
4#120270300400520530333
5#260 350 530 640 750 800 188
6#250 430 670 810 900 950 260
7#180340540750810920350
8#320 580 770 1150 1200 1250 275
9#500 720 850 1230 1400 1450 180
Table 5. The 2#, 4#, and 7# pile uplift ultimate bearing capacity calculation values.
Pile NumberDifferent Curing Times of Pile Foundations t/d
1 d7 d14 d30 d60 d90 d
2#189306405542647675
4#150246327440526550
7#239394523704842880
Disclaimer/Publisher’s Note: The statements, opinions and data contained in all publications are solely those of the individual author(s) and contributor(s) and not of MDPI and/or the editor(s). MDPI and/or the editor(s) disclaim responsibility for any injury to people or property resulting from any ideas, methods, instructions or products referred to in the content.

