Article

Effect of Ultrasound on Fermentation of Thick Molasses Worts by Distiller’s Yeast

by
Andrea Maria Patelski
1,*,
Aleksandra Kobalczyk
1,
Urszula Dziekońska-Kubczak
1,
Bartłomiej Januszewicz
2 and
Jarosław Domański
3
1
Institute of Fermentation Technology and Microbiology, Faculty of Biotechnology and Food Sciences, Lodz University of Technology, 90-924 Lodz, Poland
2
Institute of Material Science and Engineering, Faculty of Mechanical Engineering, Lodz University of Technology, 90-924 Lodz, Poland
3
Department of Environmental Biotechnology, Faculty of Biotechnology and Food Sciences, Lodz University of Technology, 90-924 Lodz, Poland
*
Author to whom correspondence should be addressed.
Appl. Sci. 2025, 15(7), 3811; https://doi.org/10.3390/app15073811
Submission received: 19 February 2025 / Revised: 25 March 2025 / Accepted: 28 March 2025 / Published: 31 March 2025
(This article belongs to the Special Issue Bioprocessing and Fermentation Technology for Biomass Conversion)

Abstract

:

Featured Application

Ultrasonic treatment at 24 kHz enhances fermentation dynamics and boosts ethanol yield by up to 20%, especially in high-density worts. This approach can improve the efficiency and profitability of industrial ethanol production.

Abstract

This study investigates the effect of ultrasonic treatment on the fermentation of molasses wort with a density range of 18–24 °Blg, using two high-performance Saccharomyces cerevisiae yeast strains: Thermosacc Dry and Ethanol Red. The primary objective was to determine if ultrasound could accelerate fermentation and increase ethanol yield. The research showed that ultrasonic treatment at 24 kHz significantly increased fermentation dynamics and ethanol yield by 5 to 20%, depending on the yeast strain and wort density. Higher wort densities (22–24 °Blg) showed more pronounced positive effects. Ultrasound treatment caused visible indentations in the yeast cell walls and promoted cell aggregation. In addition, the study investigated the influence of different ultrasound amplitudes on fermentation efficiency and showed that higher amplitudes further improved ethanol production in 22–24 °Blg worts. These results suggest that ultrasound can improve the efficiency and profitability of ethanol production, highlighting the potential for further research to optimise industrial fermentation processes. The application of ultrasound in biotechnology, particularly in fuel ethanol production, could lead to significant economic benefits on a global scale.

1. Introduction

The most common and oldest application of ethanol is for food purposes, such as in alcoholic beverages. Another common industrial application of ethanol is as an industrial solvent for various products, including paints and varnishes. It is also used in the medical industry, for example, in pharmaceuticals, chemicals, antiseptics, perfumes, deodorants, and aerosols [1]. The application of ethanol as a biofuel is one of the most significant challenges currently facing the global community, and it is gaining worldwide importance due to increasing environmental pollution and decreasing fossil fuel resources [2]. The most commonly used sugar-containing raw materials are sugar cane, both its juice and molasses, which are almost exclusively the resources used in Brazil, where ethanol production is the second largest in the world. In addition, beet molasses, sugar beets, sweet sorghum, and fruit are popular raw materials, especially in Europe. Starchy raw materials are also necessary, with corn being the most commonly used due to its extensive use in the U.S. [3]. Each raw material has its own unique properties, and one key metric is the ethanol yield (see Table 1). It is understood that this value is a crucial determinant for choosing a raw material for an ethanol production process. Another critical factor that affects the choice of raw material is its price. According to the literature, financial expenses constitute 45–86% of the total production costs of ethanol [4,5,6,7,8,9]. Therefore, ways of reducing costs should be sought in making cheap feedstock choices [3].
The efficiency and profitability of the fermentation process, as well as the quality of the final product, are contingent upon the selection of industrially relevant microorganisms [11]. Irrespective of the type of microorganism, they must possess several essential characteristics that are indispensable for an effective fermentation process: high tolerance to ethanol, tolerance for low pH values, tolerance to elevated temperatures, stability under process conditions, high fermentation ability, and high yield of the product per unit of the substrate assimilated [12]. The first listed feature—the ability of microorganisms to withstand high ethanol concentrations—is the key to successful fermentation. However, several factors are thought to contribute to the tolerance of ethanol, which are the following: toxicity of ethanol or intermediates, genetic components, environmental influence, physiological yeast condition, and composition of wort [13]. Yeast is the most employed microorganism in ethanol production. During glycolysis, they convert sugars, mostly hexoses, including glucose and fructose, into pyruvate, which is later reduced to ethanol. Overall, two moles of ATP and ethanol are derived per molecule of converted hexose [14]. Saccharomyces cerevisiae yeast, isolated from fermentation environments and improved over many years to efficiently carry out targeted fermentation of selected media, has relatively narrow fermentation capabilities compared to other yeast genera. S. cerevisiae strains usually are able to ferment glucose, fructose, sucrose, galactose, mannose, and maltose. Sugars such as cellobiose, lactose, arabinose, xylose, and sorbose are not metabolised. Some saccharides, including trehalose and raffinose, are metabolised, but relatively slowly or to a partial extent [15].
Notwithstanding the importance of sugars during the fermentation process, it is noteworthy that the effectiveness of this process is influenced by more than just saccharides. Every organism requires sufficient water and nutrients to grow and conduct the fermentation process efficiently. Following the carbon source, another necessary component is assimilable nitrogen. As most yeast species cannot fix atmospheric nitrogen, it must be supplied either in organic nitrogen (as amino acids, urea, or other compounds) or inorganic nitrogen (as ammonium salts). This element is pivotal in biosynthesis, forming various proteins, including enzymes [16]. The subsequent essential component for effective fermentation is the proper amount of inorganic ions. The requirement for millimolar concentrations of elements such as phosphorus, sulphur, potassium, and magnesium is essential. Also, micromolar concentrations of sodium, calcium, iron, cobalt, zinc, copper, manganese, nickel, and selenium are required [17].
Another critical factor in the fermentation process is the concentration of ethanol, the end product of primary importance, which can exert inhibitory effects on cells. Increased ethanol concentrations can harm cell growth and fermentation rate, so their levels must be closely monitored. Higher ethanol concentrations can denature various enzymes, inhibit sugar and amino acid transport systems, and contribute to thermal death. Finally, it is essential to note that ethanol can modify cell membranes, resulting in changes to their permeability and structural organisation [18].
Sugar is the principal substrate for microorganisms during the alcoholic fermentation process; thus, its concentration in the wort is significant—generally, an increase in sugar concentration results in an increase in ethanol, a fermentation product. However, a high sugar concentration can have a detrimental effect on the fermentation process, potentially leading to toxicity in microbial cells and the occurrence of hyperosmotic stress. Increases in sugar concentration may be attributable to sugar accumulation within the cell, consequent to the inactivation of sugar transport systems [19].
The drive towards production efficiency and the need to address growing demands has compelled manufacturers to adopt contemporary methods to enhance fermentation efficiency. Many techniques have been proposed to address not only the efficiency of the process but also the quality and safety of end products. Among these novel techniques, thermal processing, encompassing microwave heating, radiofrequency heating, ohmic heating, pulsed electric field, and ultrasound treatment, has emerged as up-and-coming areas of research [20,21,22,23,24,25,26,27,28,29,30].
Ultrasound can be defined as mechanical pressure waves with a frequency that exceeds the audible level (i.e., over 20,000 Hz). A piezoelectric transducer is a material that emits and receives ultrasound waves, thereby converting electrical energy into vibrational sound energy [31]. Ultrasound is ubiquitous in numerous industrial sectors, including chemical, bioprocessing, food processing, and the pharmaceutical and medical industries. In these sectors, both high-frequency and low-frequency ultrasound are utilised. For instance, in the food industry, high-frequency ultrasound (>1 MHz) is employed for non-destructive methods of control and quality assurance, while low-frequency ultrasound (approx. 20 kHz–1 MHz) is typically used for the intensification of a process [32]. The generation of particle displacement results from ultrasonic waves passing through a medium, with the wave source inducing a succession of compression and rarefaction phases [33]. In certain instances, the rarefaction phase can be so pronounced that it results in a significant separation between the molecules of the liquid, leading to the formation of voids known as cavitation bubbles. During the rarefaction phase, these bubbles undergo growth. Subsequently, when the compression phase ensues, the bubbles undergo a size reduction. Occasionally, the bubbles can diminish to such an extent that they reach a critical point, resulting in their subsequent collapse. The collapse of these bubbles can generate high pressure and temperature. The principal physical effects of this phenomenon are shockwave-induced damage and microjet impacts. Other mechanical effects include agitation, turbulence, vibration, pressure, shear forces, and acoustic streaming. In addition to the physical effects of cavitation, chemical effects occur. One of the most significant is the sonolysis of water (H2O → H+ + OH), which may produce free radicals. These radicals can combine to form other molecules, potentially affecting microorganisms or enzymes.
Recent studies on the application of ultrasound in fermentation processes indicate that it enhances mixing and facilitates the release of CO2 from the medium, thereby optimising the kinetics of cellular CO₂ expulsion [34,35,36,37,38,39]. Additionally, ultrasound has been reported to improve the transport of sugars into cells and the efflux of ethanol and carbon dioxide from cells. Elevated ethanol and carbon dioxide concentrations near the cell membrane have been observed to alter membrane integrity and potentially hinder fermentation rates. Therefore, sonification can eliminate this negative impact [40,41].
One of the trends in current ethanol production technologies is to reduce water consumption, among other things, before increasing the sugar content (and thus density) in fermentation wort. This is also aimed at reducing the amount of liquid subjected to distillation (and therefore the energy expenditure necessary to heat this wort to the process temperature) [42,43,44,45,46]. A significant problem with the fermentation of thick wort is forcing the yeast cells to work under increased osmotic pressure, translating on a macroscopic scale into a lengthening of fermentation and decreased ethanol yield. There are reports in the literature [30,47,48,49] suggesting that the efficiency and dynamics of fermentation can be improved by using ultrasound, so we thought it would be worth conducting a study in this area.
The strains Thermosacc Dry (Lallemand Inc., Milwaukee, WI, USA) and Ethanol Red (Leaf by Lesaffre, France), which we have selected as biological models, are high-performance distiller yeast strains of the species Saccharomyces cerevisiae from two of the world’s leading yeast producers. These strains are widely used to produce fuel ethanol and ethanol for the food, chemical, and pharmaceutical industries. These strains show high resistance to unfavourable fermentation conditions such as high osmotic pressure or the presence of fermentation inhibitors [50,51,52,53,54,55].
The main objective of our research was to determine whether the use of ultrasonic treatment can positively influence the fermentation of molasses wort, especially with a density higher than 18 °Blg, with a limited fermentation time of 72 h. The main positive effect should be an acceleration of fermentation and an increase in the yield of ethanol produced. An additional objective was to determine whether changing the sonication intensity by varying the ultrasound amplitude would cause changes in the course and efficiency of fermentation.

2. Materials and Methods

2.1. Raw Material

The raw material utilised in the experiment was sugar beet molasses, which had a sucrose content of approximately 50% and an extract content of approximately 80 °Blg. This material was obtained from the Dobrzelin sugar factory (Dobrzelin, Poland).

2.2. Biological Material

In the present experiment, two distillery yeast strains of Saccharomyces cerevisiae were utilised as biological material: Thermosacc Dry (TD) (Lallemand Inc., Milwaukee, WI, USA) and Ethanol Red (ER) (Leaf by Lesaffre, Marcq-en-Barœul Cedex, France). Ethanol Red is a commercial yeast strain predominantly employed in biofuel production due to its capacity to attain substantial final ethanol concentrations. This strain expedites fermentation and attains high yields even at elevated temperatures. [50]. Thermosacc Dry is a distillery strain that has also been employed in fuel ethanol production. The product contains a highly concentrated and stable form of yeast capable of efficient fermentation at 37 °C and ethanol concentrations over 20% v/v. Furthermore, the manufacturer guarantees a low level of fermentation by-products [51]. Both preparations containing yeast cells were within the shelf life declared by the manufacturers and were stored in their original packaging under the conditions recommended by the manufacturers. According to the manufacturer’s specifications, the stated quantity of live yeast cells was no less than 2 × 10¹⁰ CFU/g. One hour before inoculation, the dried yeast cells of these strains were suspended in a sterile 0.9% NaCl solution. The final yeast suspension’s dry matter (DM) content was measured using a spectrophotometer (Rayleight Analytical Instrument, Beijing, China) at 540 nm, based on a previously prepared standard curve. The yeast strains were dosed in 0.9% NaCl suspensions at a dry matter content of 1 g per 1 L of wort for fermentation.

2.3. pH and Total Extract Content

The pH was gauged using an SI Analytics HandyLab 100 pH meter (Xylem Analytics, Mainz, Germany). The total extract was quantified using a hand-held digital refractometer (Atago, Tokyo, Japan), with the results expressed as a Balling degree.

2.4. Preparation of Molasses Worts for the Fermentation Process

Due to the assumed limited fermentation time of 72 h (standard fermentation time in Polish distilleries), we chose wort densities of 22 and 24 °Blg. Fermentation experiments with 18 °Blg wort were a reference for the results obtained for worts with a higher density. The molasses worts, with extract of 18 °Blg, 22 °Blg and 24 °Blg, were prepared from the stock molasses solution of 80 °Blg by dilution. To enrich the media with the necessary nitrogen, phosphorus, zinc and magnesium, the following compounds were added: NH4(HPO4)2 [0.3 g/L]; ZnSO4 × 0.05 [g/L]; MgCl2 × 0.05 [g/L]. The pH level of each wort was carefully adjusted to between 4.8 and 5.1 by adding H2SO4 (25%) and using a pH meter to ensure precision. The fermentation process was initiated by adding the yeast suspension to achieve a concentration of 1 g of dry matter per litre.

2.5. Fermentation Process

The fermentation process of molasses worts was carried out in 500 mL flat-bottom flasks equipped with fermentation pipes filled with glycerine to minimise water evaporation (loss of sample weight) from fermented samples. Each flask contained 300 mL of non-sterilised molasses wort (18 °Blg, 22 °Blg or 24 °Blg of extract). The fermentation process was conducted for 72 h at 32 ± 1 °C. To determine the fermentation dynamics, the vessels were weighed at the beginning of fermentation, before and after the sonification of the sample (every 24 h of the process) to track mass change. It was assumed that the mass loss was primarily due to the carbon dioxide released by the yeast during the sugar-to-ethanol bioconversion process. The fermentation dynamics were presented as the percentage of the assumed theoretical weight loss (calculated for a sum of sugar fermented according to the stoichiometry of the ethanolic fermentation) during the mash’s fermentation. After fermentation, 100-mL samples were collected and stored within a −20 ± 1 °C freezer to ensure the preservation of the samples for subsequent analysis.

2.6. Ultrasound Treatment

The UP400S Ultrasonic Generator (Hielscher Ultrasonics GmbH, Teltow, Germany) was utilised for the ultrasound treatment. The following parameters characterised the device: efficiency: >90%; working frequency 24 kHz; output control: 20–100%; and pulse–pulse mode factor: 10–100% per second. The sonotrode (H3) used was found to have the following parameters: maximum submerged depth of 90 mm, tip diameter of 3 mm, maximum amplitude of 210 µm, and acoustic power density of 460 W/mL. The ultrasound treatment was performed at the beginning of fermentation and every 24 h of the process. The treatment time per sample was 5 min. The amplitude was set to 50% or 75%, and the pulse mode factor was 0.5 (i.e., the signal was generated for half a second during each second). The results of the samples fermented without sonification served as a reference.

2.7. Options of the Experiments and Sample Abbreviations

Table 2 and Table 3 illustrate the investigation options and the abbreviations used for the samples.

2.8. HPLC Analysis of Molasses Wort Before and After Fermentation

The media concentrations of glucose (GLU), fructose (FRU), lactic acid (LacA), acetic acid (AceA), succinic acid (SucA), glycerol (GlycOH), and ethanol (EtOH) were analysed using High-Performance Liquid Chromatography (HPLC). Before analysis, samples were mixed with a zinc sulphate solution to achieve a final concentration of 10% for protein precipitation. Centrifugation at 5000× g for 10 min (Laboratory Centrifuge MPW380R; MPW; Warsaw; Poland) was then employed to remove the solids, after which the samples were filtered using 0.45 µm PES membranes. Subsequently, inversion, a process of saccharose hydrolysis in acidic conditions, was conducted. A volume of 25 mL of the deproteinised solution was measured in the volumetric flask, followed by adding 5 mL of concentrated hydrochloric acid and 50 mL of water. The solution was then heated to 67 °C within 3 min, and the temperature was maintained for the subsequent 5 min. Thereafter, the solution was cooled within 2–3 min. The final step involved the neutralisation of the solution’s pH with NaOH. Samples after inversion were filtered through sterile syringe filters with a PES membrane with a pore diameter of 0.45 μm and a filter diameter of 25 mm. HPLC analysis was performed using an Agilent 1260 Infinity liquid chromatograph (Agilent Technologies, Santa Clara, CA, USA) equipped with a refractometric detector. The compounds were separated using a Hi-Plex H column (7.7 × 300 mm, 8 µm grain size; Agilent Technologies, Santa Clara, CA, USA). The analysis parameters were as follows: column temperature: 60 °C; RI detector temperature: 55 °C; injection volume: 20 µL; mobile phase: H2SO4 (0.005 M); phase flow rate: 0.7 mL/min. The concentrations of the detected compounds were calculated based on the measurement of the peak areas read from the chromatograms concerning the peak areas of the standard solutions. Concentration values were read from reports generated by the Agilent ChemStation software (C 0.1 0.6 version) (Agilent Technologies, Santa Clara, CA, USA).

2.9. Scanning Electron Microscopy (SEM)

Following the fermentation process, the yeast cells were subjected to a centrifugal process (4000× g/10 min) (Laboratory Centrifuge MPW380R; MPW; Warsaw; Poland) and then washed with distilled water on three occasions. Thereafter, the yeast biomass underwent a lyophilisation process. The prepared yeast biomass was then spread thinly on Petri dishes and placed in a ULTF low-temperature freezer at −70 °C for 24 h. Following this, the frozen biomass was transferred to a pre-cooled chamber of the Christ Alpha 1.2-LD plus freeze dryer (Martin Christ; Osterode am Harz, Germany) and freeze-dried in the following sequence: drying 7 h; 0.09 mbar; −43 °C and post-drying 20 h; 0.07 mbar (−45 °C). To observe microstructural changes in the yeast cells’ wall surface caused by ultrasound, scanning electron microscopy (JSM-6610LV, JEOL, 3-1-2 Musashino, Akishima, Tokyo, Japan) was performed at an accelerating voltage of 20 kV, vacuum level 50 Pa, and working distance of 20 mm; samples were mounted on the microscope by uniform spreading on double-sided adhesive carbon tape. The apparatus was equipped with a detector for low-vacuum conditions to obtain secondary electron images of potentially high resolution.

2.10. The Number of Replications and the Statistical Treatment Applied

All experiments and assays were carried out in quadruplicate. The subsequent statistical analysis, including variance analysis, SD determination, and Student’s t-test at a significance level of α = 0.05, was performed using the Origin 7.5 computer program.

3. Results and Discussion

3.1. Wort Analysis

Before the fermentation trials, molasses wort was prepared at the expected extract content and analysed for sucrose and selected organic acids. Due to the specificity of the HPLC column used, sucrose was determined after hydrolysis (inversion with hydrochloric acid) to fructose and glucose. This also allowed comparison of the loss of this sugar after fermentation, during which the yeast S. cerevisiae uses its beta-fructofuranosidase to break down sucrose into glucose and fructose and then into the form in which it is introduced into intracellular metabolic pathways. The results of the analysis of the initial worts are shown in Table 4.
The glucose and fructose content of the wort after inversion depended predictably on the density (extract) of the wort. The wort with a density of 18 °Blg contained about 61 g/L of glucose and fructose, while the wort with a density of 24 °Blg contained a little over 79 g/L of glucose and fructose. These measurements were the basis for determining the theoretical ethanol and carbon dioxide yields according to the stoichiometric equations of ethanol fermentation, which were referred to in the further presentation and discussion of the results. The worts also contained organic acids before fermentation. The available equipment was used to determine the content of succinic, acetic, and lactic acid. Wort 18 °Blg contained 1.04 ± 0.02 g/L succinic acid, 3.45 ± 0.14 g/L lactic acid, and 1.41 ± 0.04 g/L acetic acid. The concentrations of organic acids present increased predictably with the density of the wort: 24 °Blg medium contained 1.82 ± 0.02 g/L succinic acid, 4.46 ± 0.13 g/L lactic acid, and 1.83 ± 0.04 g/L acetic acid. However, the sugar and organic acid content of beet molasses can be influenced by many factors, such as sugar production technology, the method and conditions of molasses storage, its density and microbiological state. The results we present for molasses wort in the density range of 18–24 °Blg are consistent with the results of the molasses analysis presented by Beigbeder et al. [55]. The authors reported that they used molasses from a Canadian sugar factory containing 560.95 g/L sucrose, 55.23 g/L glucose, and 39.00 g/L fructose to prepare the fermentation wort. The molasses they analysed also contained 11.28 g/L lactic acid. Considering that our molasses was diluted from about 80 °Blg to the appropriate final density in the range of 18−24 °Blg, it can be seen that the results of our wort analysis are consistent in terms of scale of values with those described by the authors mentioned above.

3.2. The Influence of Ultrasound Treatment and Wort Density on the Fermentation Dynamics and Yields of the Selected Products

3.2.1. The Influence of Ultrasound Treatment on Sugar Utilisation

The following table (Table 5) shows the percentage of glucose and fructose utilisation with the concentrations of these sugars before fermentation.
The results of using sugars for wort with an initial density of 18 °Blg (Table 5) show that, regardless of the strain and sonification used, a reduction in glucose concentration of over 99% was observed. As for fructose, the lowest utilisation was observed for the control sample (without sonification) fermented by Thermosacc Dry yeast and was equal to 86.79 ± 4.23 g/L. In the case of the other options, for the TD strain and Ethanol Red, more than 92% fructose consumption was observed. The yeast Saccharomyces cerevisiae quickly assimilates both sugars. Hence, the actual consumption degree depends mainly on fermentation duration and possible factors inhibiting yeast metabolisms, such as ethanol concentration, wort density and the content of other metabolites (including organic acids, whose concentration will be discussed later in the article). The initial density of the wort of 18 °Blg and the sugar concentration of around 120 g/L are certainly not factors limiting the fermentation capacity of the two distiller’s yeasts tested, which are also suitable for producing fuel ethanol according to the manufacturer’s declaration.
As with the 18 °Blg wort, after 72 h of fermentation, the medium with an initial density of 22 °Blg showed a glucose utilisation of 96.68 ± 2.70% (TD control sample) to 98.82 ± 3.35% (for ER u75), and a fructose utilisation of 70.03 ± 1.45% (TD control sample) to 87.33 ± 3.71% (for ER u75) fructose utilisation. Comparing these series of results with the values after fermentation of wort at 18 °Blg, it can be seen that some unassimilated sugars remain in the medium after 72 h of fermentation. However, it can be assumed that the lower assimilation of sugars has translated into the efficiency of ethanol formation, which will be discussed later in the article regarding the ethanol production results. While this was not observable for the results of the 18 °Blg wort trials, in the case of the 22 °Blg wort, it was observed that the use of ultrasonic treatment significantly (p < 0.05) intensified the utilisation of sugars by Thermosacc Dry yeast, with no statistically significant difference between the sonicated samples differing in the amplitude of the applied ultrasonic treatment (50% and 75%).
The results of sugar assimilation during the fermentation of wort at 24 °Blg confirmed that our plan to add this wort density to the tests was the correct one, even though it differed by only 2 °Blg from the 22 °Blg wort. From preliminary tests, we knew that somewhere between 22 °Blg and 24 °Blg is the limit beyond which there is a visible inhibitory effect of the wort density on the fermentation process. The process itself may require more time than the 72 h we assumed. The lowest level of glucose and fructose assimilation was observed for the control sample with TD yeast (glucose 58.05% ± 2.46; fructose 24.45% ± 0.42), and the best utilisation of glucose was observed for ER u75 (81.57%± 1.08) and fructose for TD u75 (72.58% ± 2.54). The effect of sonification is evident for this wort density; for both strains, a statistically significant increase in sugar utilisation (p < 0.05) was observed in the sonicated samples compared to the control samples (without sonication). In the case of TD yeast, a statistically significant (p < 0.05) increase in sugar utilisation was also observed depending on the amplitude of the generated ultrasound (66.91% ± 2.94 glucose and 37.37% ± 1.14 fructose for the TD u50 sample and 78.30% ± 2.51 glucose and 72.58% ± 2.54 for the TD u75 sample). The assimilation results we obtained are consistent with those obtained by Dziugan and co-authors [44], who, during the fermentation of mash from thick sugar beet juice by Ethanol Red, achieved a 96.5% reduction of sugars present in the medium over 96 h of wort conversion, containing 250 g/L of extract. Barbosa et al. [56] reported a reduction of up to 93% during the fermentation of wort containing 300 g/L of sugars. In the case of an increase in the initial density of the wort, the utilisation of sugars decreased, which we observed in our experiments. Yang et al. [48] observed an increase in glucose assimilation of up to 53% during a 36-h fermentation process when using ultrasound on the Saccharomyces cerevisiae SCZ40 strain.

3.2.2. The Influence of Ultrasound Treatment During Fermentation on Selected Acids and Glycerol Concentrations

The following table (Table 6) shows concentrations of succinic, acetic, and lactic acids and glycerol in worts after 72 h of fermentation.
Glycerol, lactic acid, acetic acid, and succinic acid are reported to be significant byproducts during alcoholic fermentation [57] and so were found in analysed samples Table 6). The observed concentration ranges of these acids correspond to the data presented in the literature [58,59,60,61]. Analysis of the results of the content of selected organic acids and glycerol after fermentation of molasses wort with a density of 18–24 °Blg showed that with an increase in the initial density of the wort, a statistically significant (p < 0.05) increase in lactic acid concentration was observed for most samples of corresponding samples fermented by the yeast in question, using the same sonication conditions. The concentration of this acid for 18 °Blg, 22 °Blg, and 24 °Blg wort was, respectively, for ER yeast without sonication, 2.03 ± 0.08 g/L, 3.03 ± 0.03 g/L, and 3.56 ± 0.13 g/L. Similarly, for the sample fermented by ER yeast, ultrasonicated at 50% amplitude, the following increase was observed with increasing wort density: 2.12 ± 0.06 g/L, 2.75 ± 0.10 g/L, and 3.46 ± 0.12 g/L. A similar trend was observed for samples fermented by the TD strain and ultrasonicated at an amplitude of 75%. Such clear trends could not be observed in the case of the other acids and glycerol. Organic acids can originate from the raw material (beet molasses) or can be formed during the fermentation process by yeast. Additionally, contaminating microflora potentially present in the molasses can grow after dilution, competing with the yeast. It should be emphasised that organic acids such as acetic and lactic acid in concentrations above 10 g/L (acetic acid) and above 45 g/L (lactic acid) manifest an inhibiting effect on Saccharomyces cerevisiae yeast [59]. Glycerol, a byproduct of fermentation [58,60,61], was present in the wort after fermentation in concentrations from 5.06 ± 0.10 g/L to 10.29 ± 0.29 g/L, with the lowest values observed after fermentation of thick wort 24 °Blg, which probably resulted from the low fermentation progress, as evidenced by the results of lower assimilation of available sugars and low ethanol formation yields discussed later in this article. Lino et al. [58] reported that after fermenting sugar wort with the Ethanol Red strain, the glycerol concentration ranged from 5.5 to 7.9 g/L, depending on the experimental option. Yang et al. [60] obtained 2.25 g/L glycerol after 72 h of fermentation of wort containing 50 g/L of sugars, fermented with Saccharomyces cerevisiae. Pielech-Przybylska et al. [61] reported glycerol concentrations ranging from 3 to 4.2 g/L after 72 h of fermentation of rye mash using the Ethanol Red strain. Yang et al. [62] observed reduced secretion of organic acids by yeast under ultrasonic treatment when describing the fermentation of wort containing 25% dextrose using the S. cerevisiae CICC1048 strain.

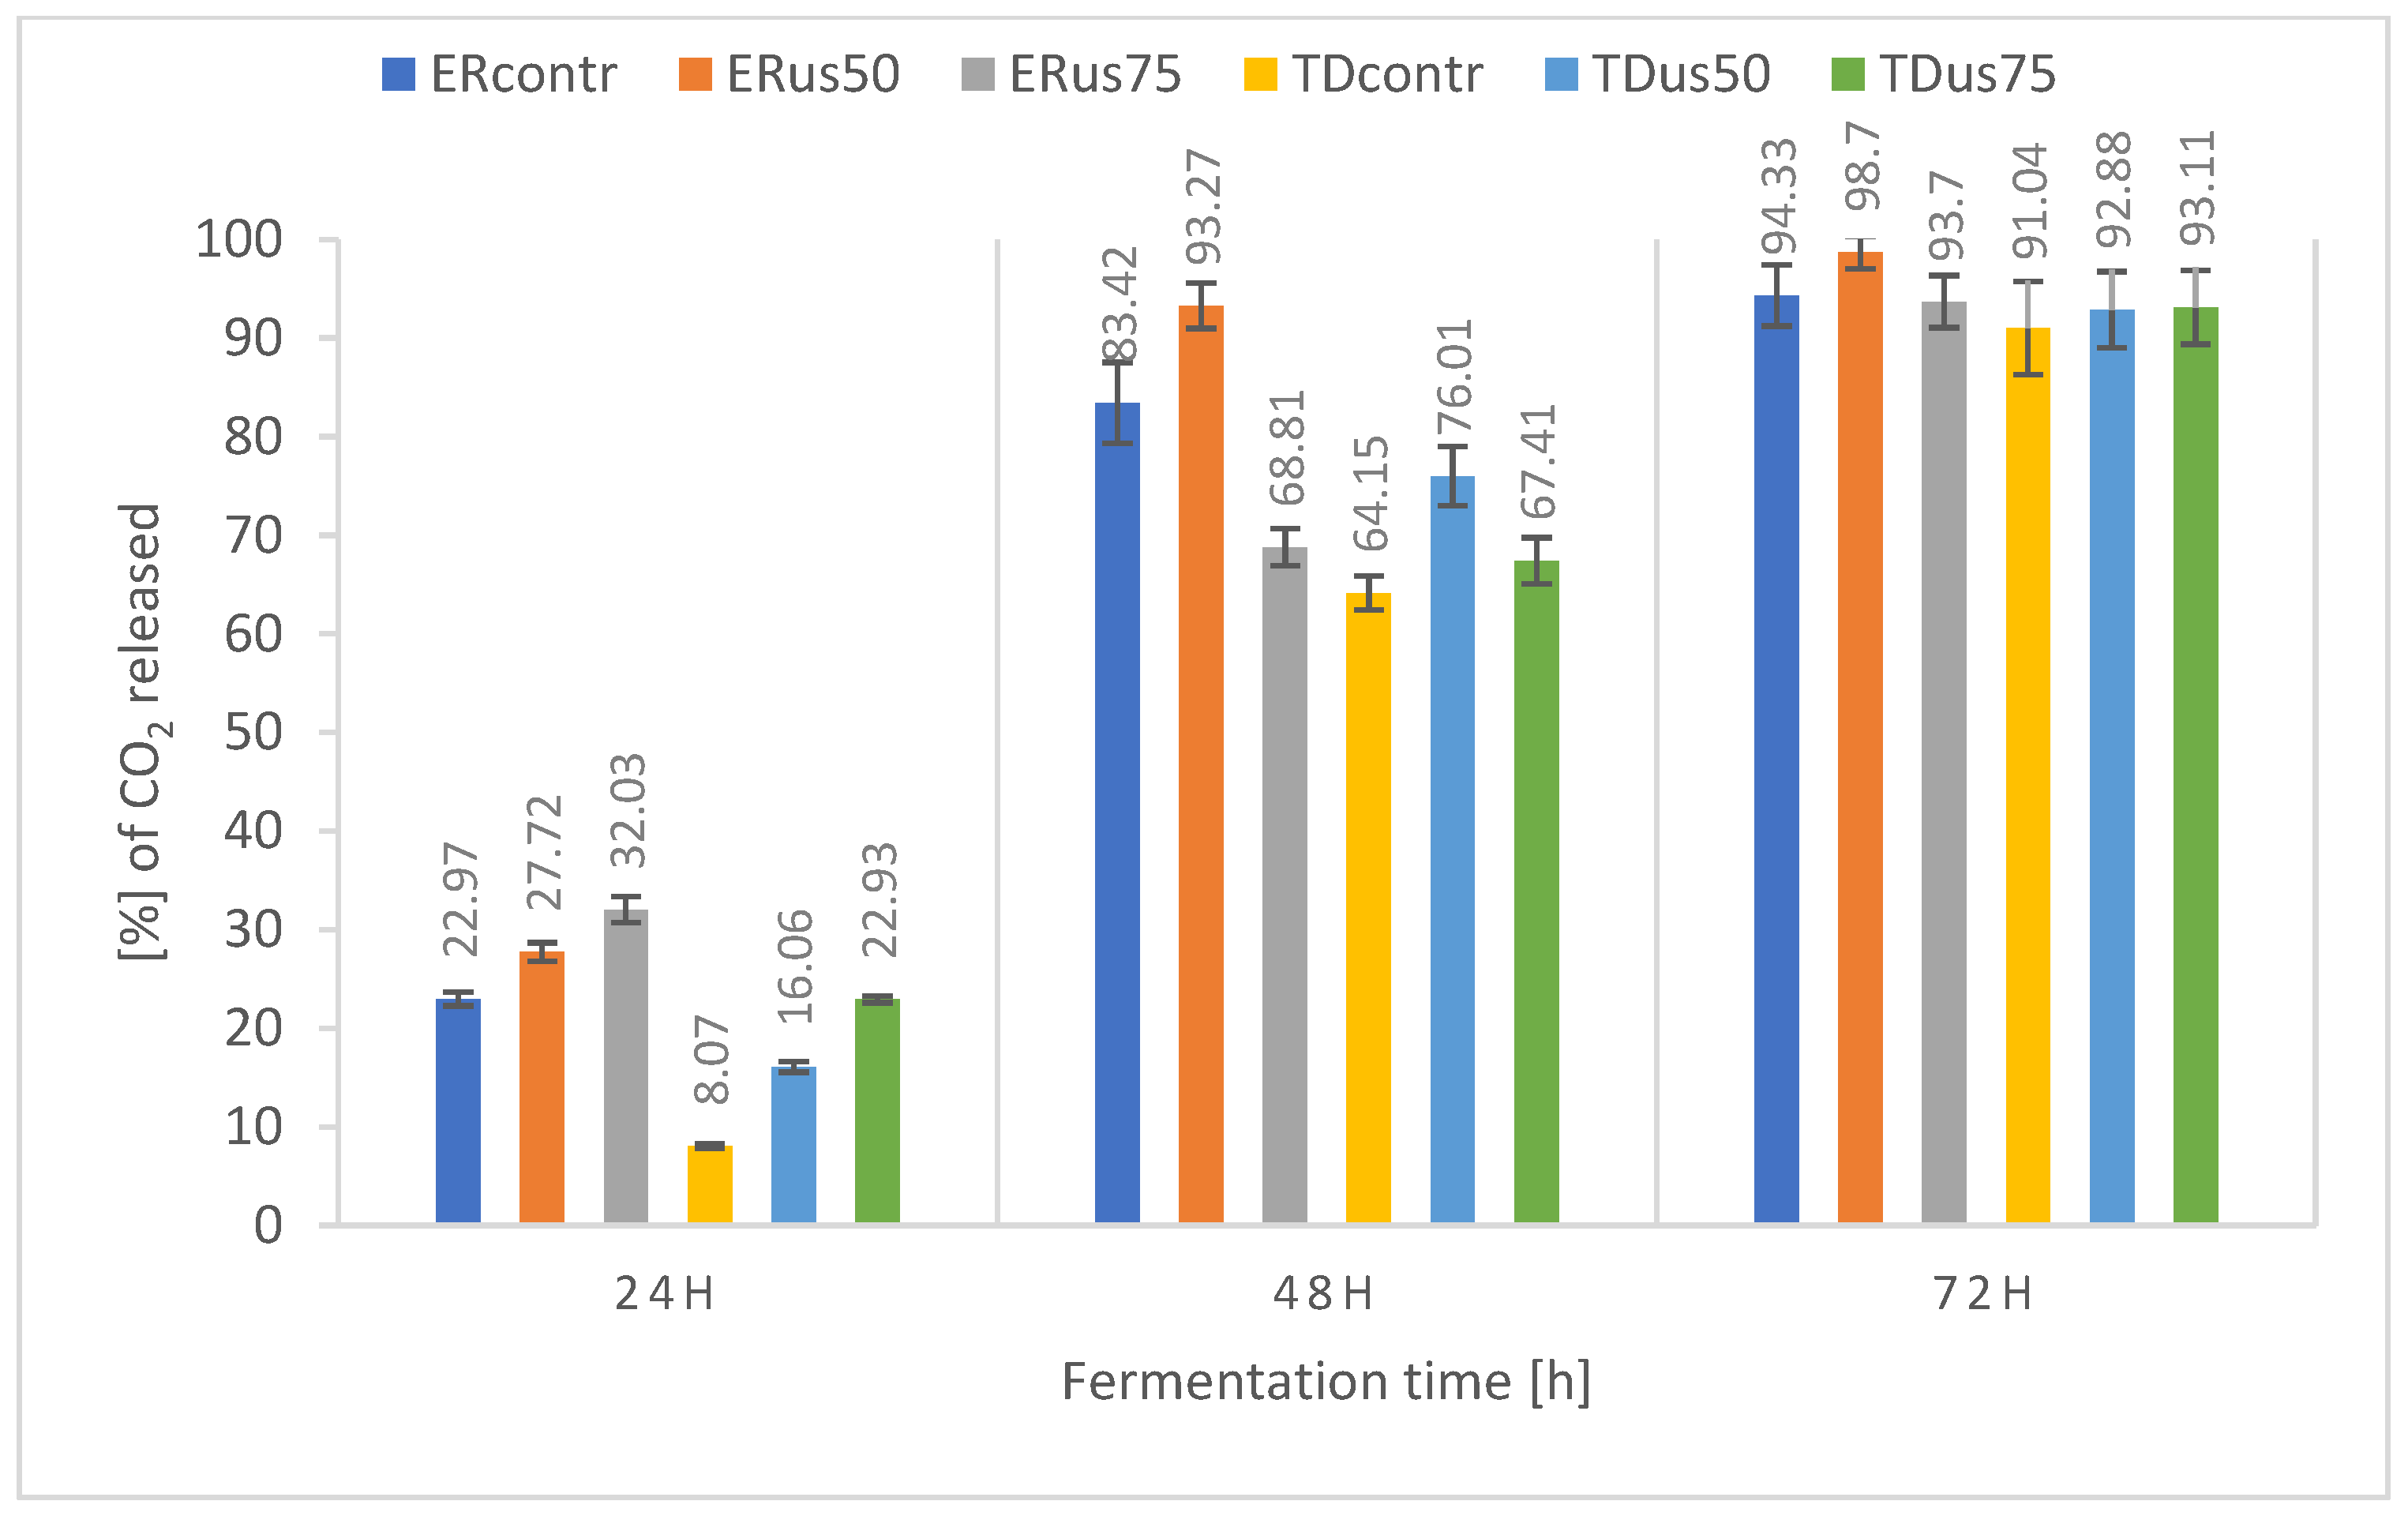
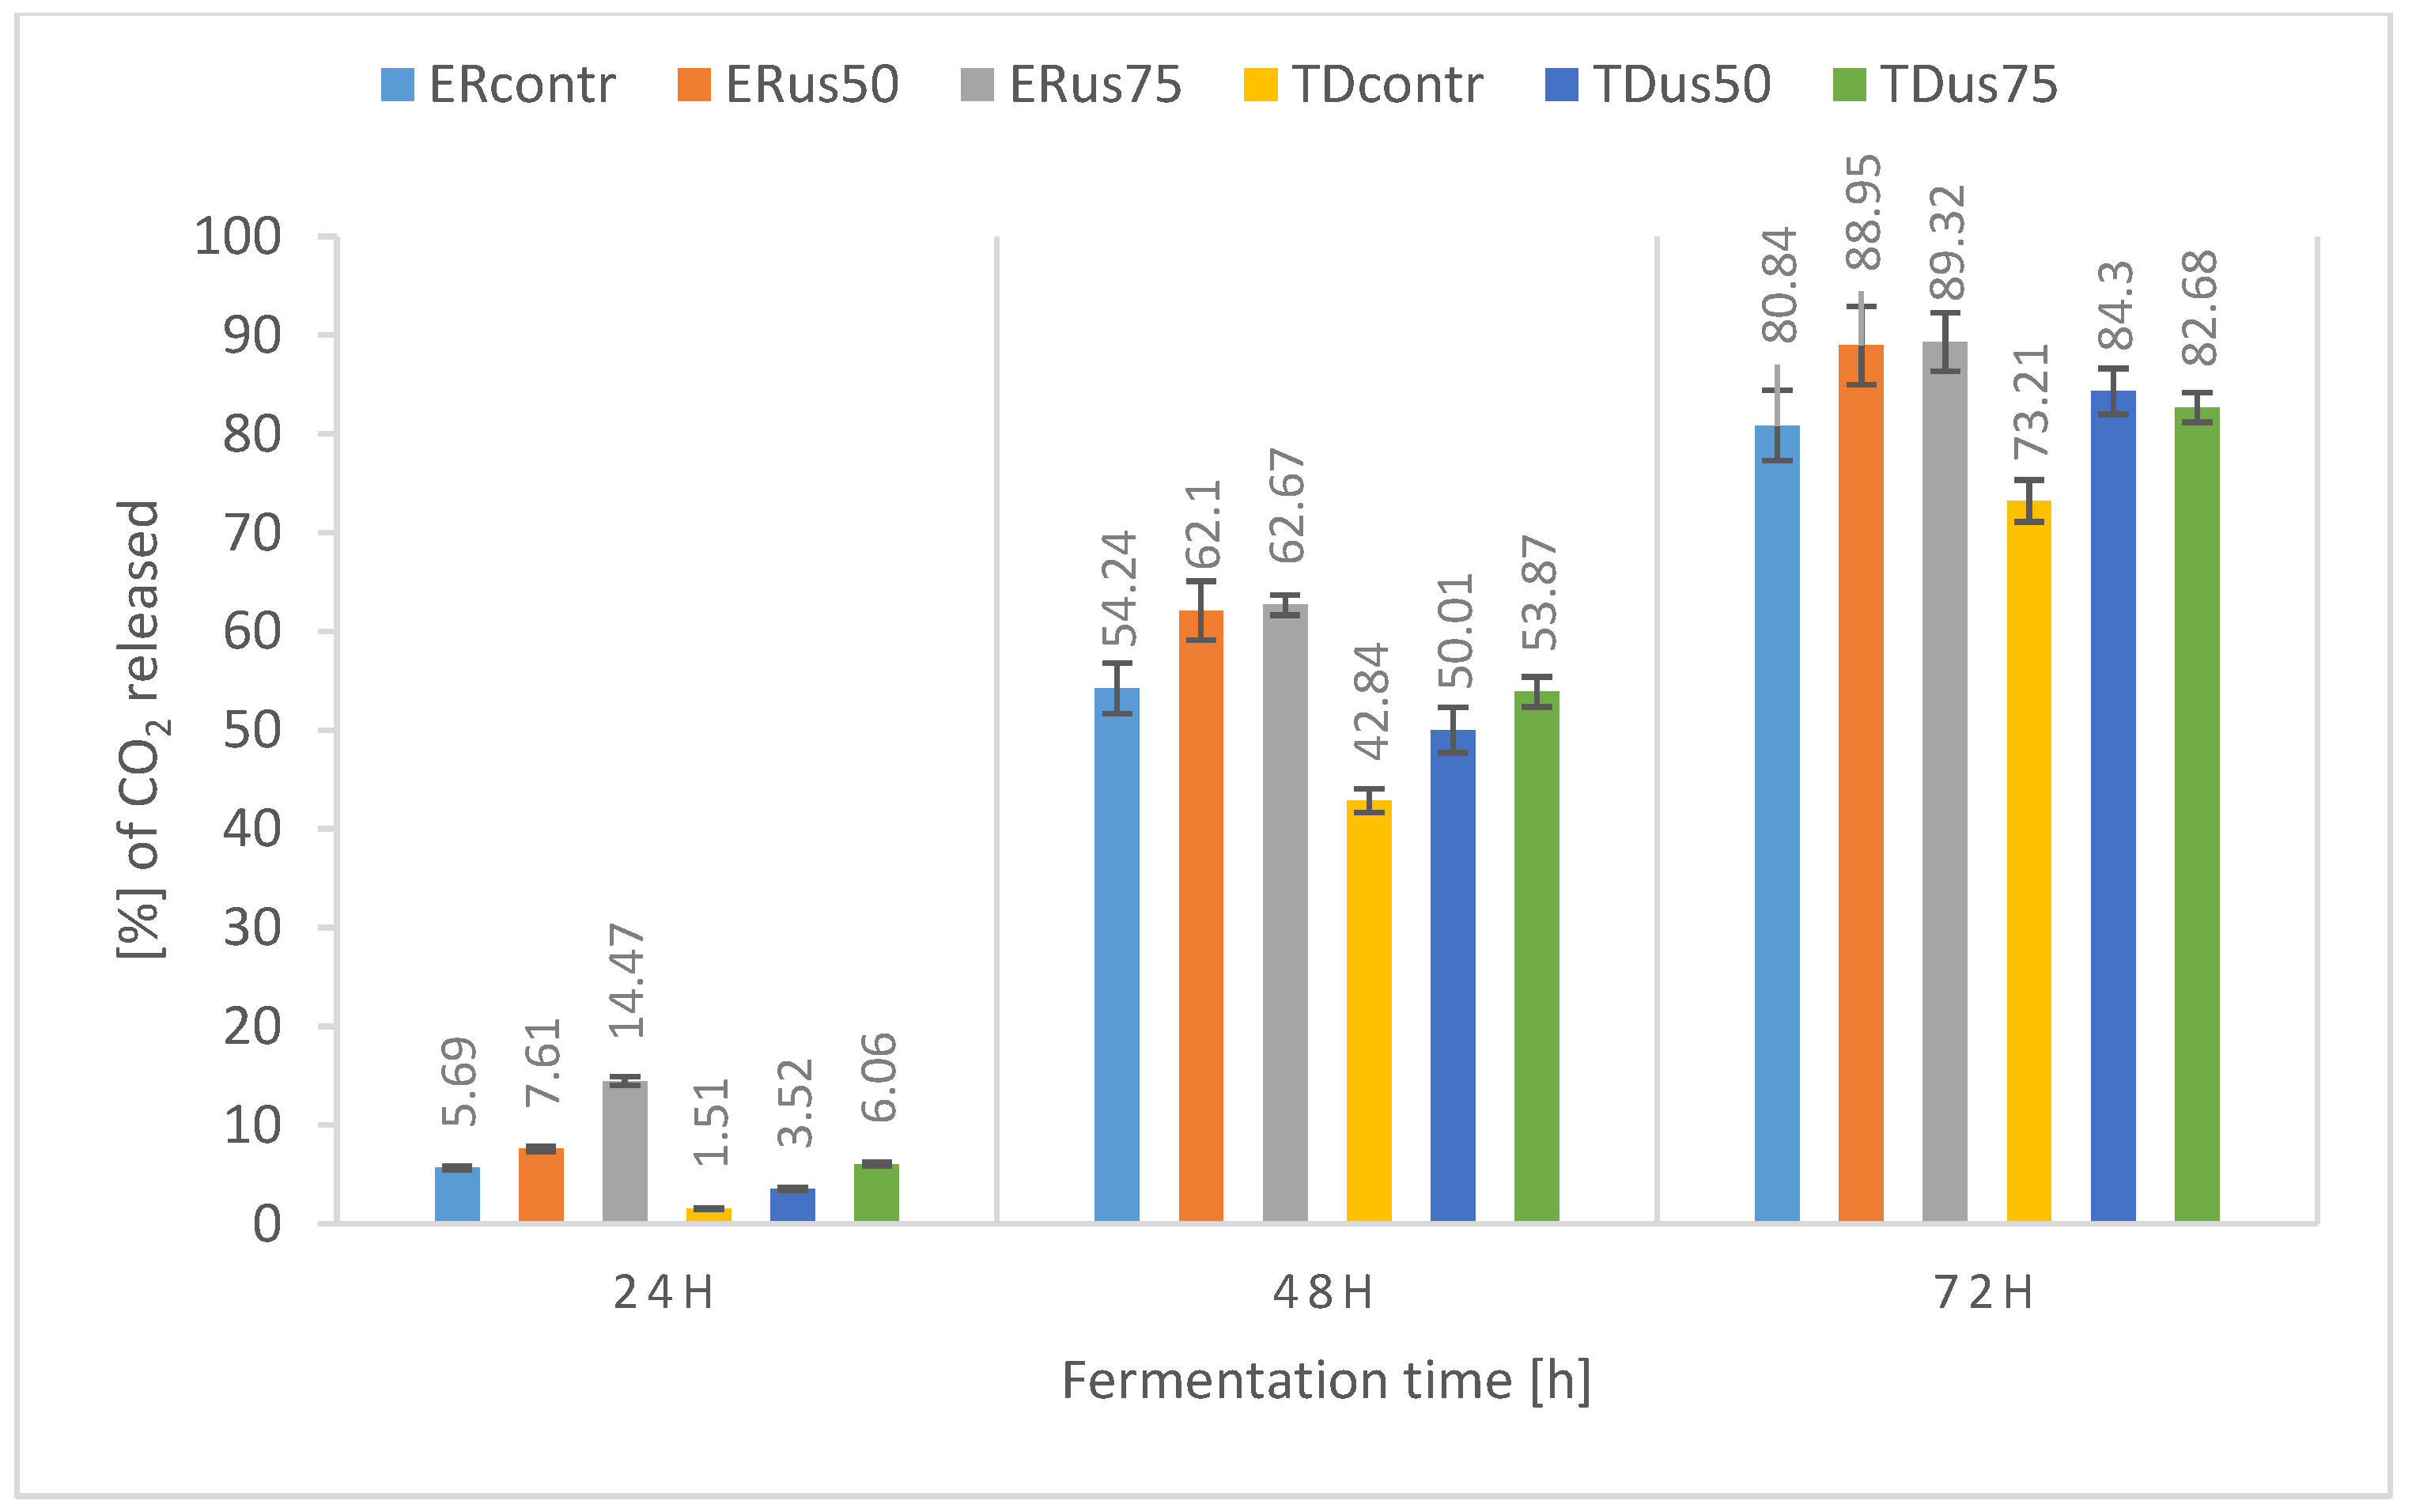
3.2.3. Influence of Ultrasound Treatment on Fermentation Dynamics

One of the main objectives of this research was to check whether the planned microwave treatment of the fermented wort would affect the dynamics of fermentation. The following graphs (Figure 1, Figure 2 and Figure 3) show the percentage weight loss of the fermented samples. One hundred percent is the assumed mass of CO2 that would be produced according to the stoichiometry of the fermentation reaction of the sugars present in the medium before fermentation. When discussing the results of mass losses, we assumed that due to the fact that the fermentation flasks were secured with stoppers equipped with glycerine-filled tubes, the loss of mass associated with the evaporation of water from the worts could be disregarded.
The results of the fermentation dynamics of wort using two tested strains and different levels of ultrasonic treatment during fermentation provided extremely interesting material for observation and discussion. The above diagrams (Figure 1, Figure 2 and Figure 3) summarise the fermentation dynamics of molasses wort with an initial density of 18, 22, and 24 °Blg fermented by Ethanol Red or Thermosac Dry yeast. During fermentation, the samples were subjected to 24 kHz ultrasound or not. The results show the percentage of weight loss in the samples. The mass value of CO2 that would be released according to the fermentation equation with complete fermentation of the sugars available in the wort of a given density was taken as 100% loss. The graph for the 18 °Blg (Figure 1) wort shows that after 72 h, 91–99% of the sample was fermented, depending on the strain used and the ultrasound treatment method. The sample fermented by ER yeast using ultrasound treatment at 50% amplitude throughout the process stands out. The values for this sample were significantly higher than for the ER control sample. A similar trend was observed for the TD yeast-fermented sample supported by analogous ultrasonic treatment, showing that the TD strain, compared to ER yeast, exhibited a much slower fermentation dynamic; however, at the end of 72 h of fermentation, the fermentation with these yeasts, regardless of the ultrasonic treatment method, also reached values above 91%. The percentage weight loss of the samples corresponds to the appropriate high results of sugar utilisation shown earlier for the wort of 18 °Blg. The results for the first 48 h of fermentation of all samples indicate that ultrasonic treatment positively affected the fermentation dynamics of the samples. Increasing the ultrasound intensity from an amplitude of 50 to 75% of the maximum value improved the fermentation dynamics of the samples.
In the case of wort with an initial density of 22 °Blg (Figure 2), the positive effect of ultrasonic treatment is visible in the dynamics graph for both strains, including the final weight loss after 72 h of fermentation, with the maximum final values achieved for the ERus75 and TDus75 samples being 74.49% and 42.63% of theoretical fermentation, respectively. These results indicate that for the 22 °Blg wort, the assumed fermentation time (72 h) was too short to achieve complete fermentation, which is confirmed by the data on the utilisation of sugars (in particular fructose) presented earlier. A similar trend, i.e., delays between the assimilation of sugars and the production of ethanol and carbon dioxide from them, is reported by Hoang Nguyen Trans et al. [63] during the fermentation of lignocellulosic hydrolysate by S. cerevisiae yeast. Other researchers have also presented similar data [64,65,66].
The results of the fermentation dynamics of the sample with a density of 24 °Blg (Figure 3) show, similarly to the previously discussed results of sugar assimilation, that 72 h was too short a time for the sugars in the wort to ferment, and the initial density of the wort itself significantly delayed the fermentation of the samples. The loss of wort mass after the first 24 h of the process, regardless of the processing method and the strain used, did not exceed 6.38%. However, an apparent positive effect of ultrasonic treatment on the loss of sample weight was observed. After 72 h of the process, the difference in the weight loss of the ultrasonicated sample with an amplitude of 75% and the control sample was about 20% for the Ethanol Red strain and about 10% for Thermosac Dry yeast. Dziugan et al. [44] described thick sugar beet juice fermentation with fermentation dynamics similar to those we presented. As in our case, during the fermentation of thick wort in the first 24 h, the yeast adapted its metabolism to the thick wort without causing significant sample weight loss.

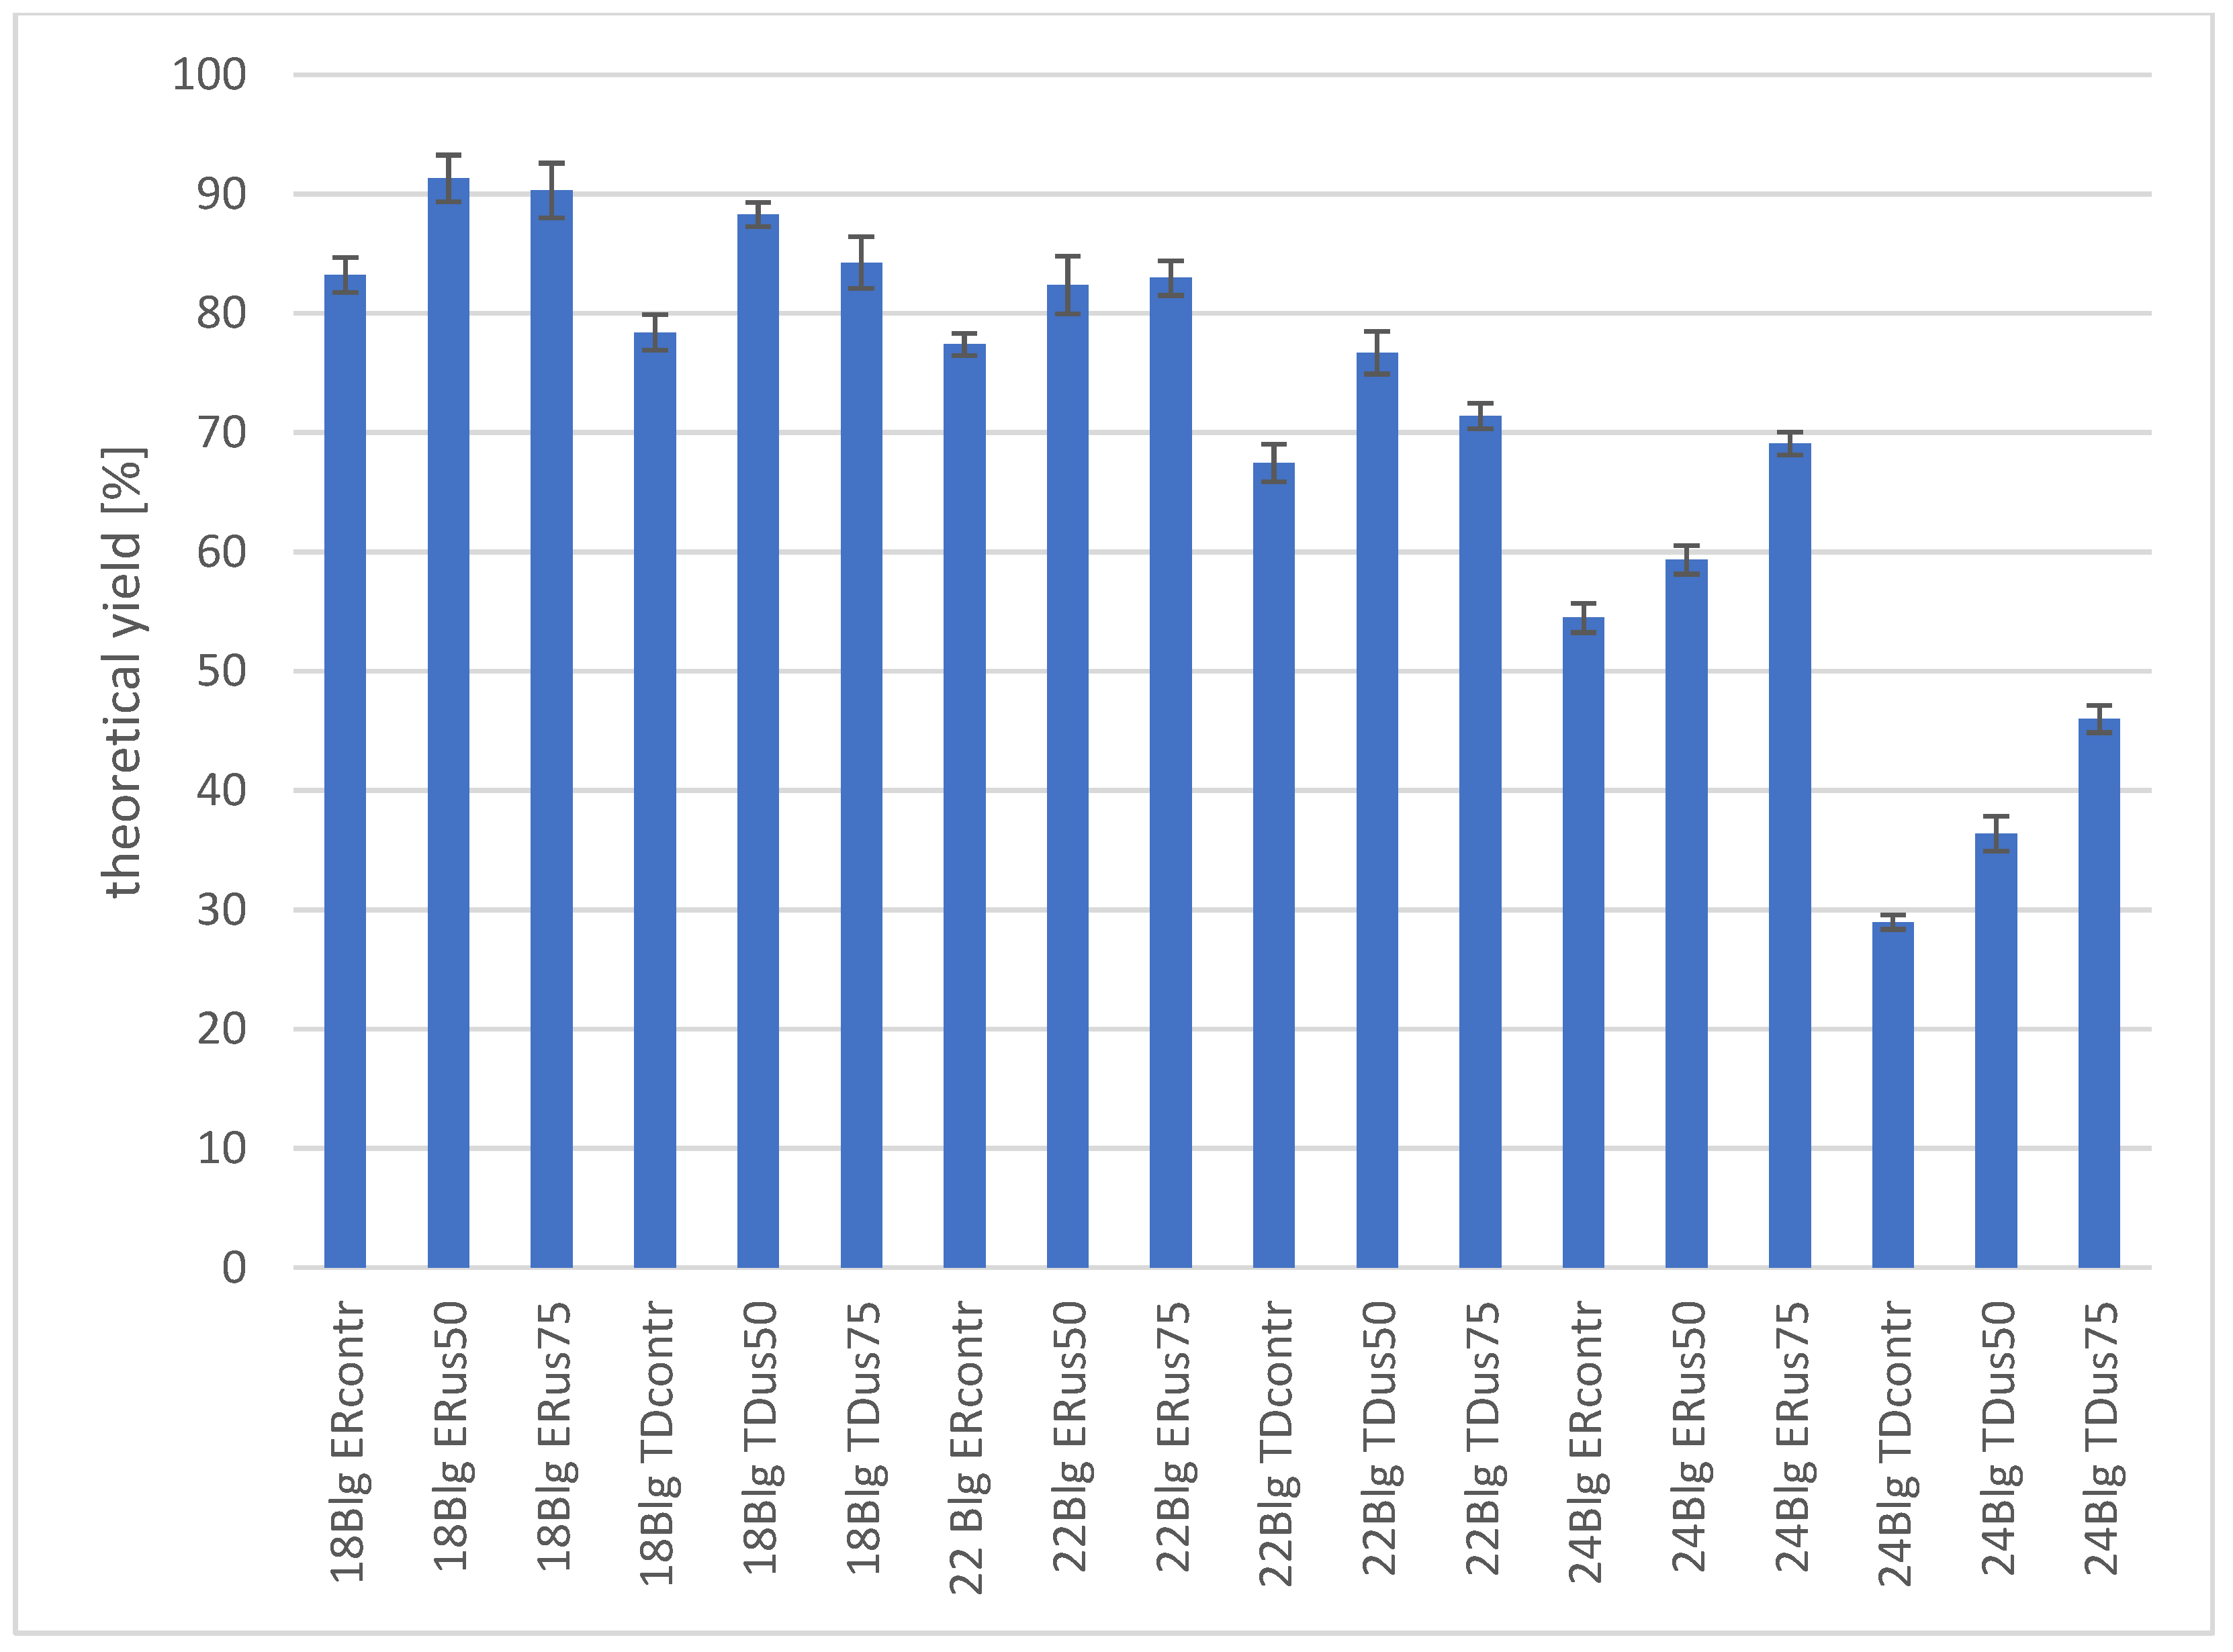
3.2.4. The Influence of Ultrasound Treatment on Ethanol Formation in Molasses Wort

The main application goal of research on alcoholic fermentation, which the results presented in this study are a part of, is to maximise the efficiency of ethanol production from sugars contained in various raw materials. Also, the ethanol production process is expected to be as short as possible for economic reasons. The following table (Table 7) shows the final ethanol concentrations obtained after 72 h of fermentation. A 3-day fermentation is a typical time in Polish distilleries; hence, we adopted it in our experiments. Since the final ethanol concentration alone does not reflect the efficiency of the ethanol conversion process, the values of this second parameter obtained in individual experiments are summarised in the figure below (Figure 4).
When preparing the manuscript, we decided that the notable results we obtained show the impact of ultrasonic treatment on the most crucial indicator of the economic efficiency of the ethanologenesis process—the concentration and the resulting ethanol yield. Both of these summaries are presented below. For the 18 °Blg wort, the final ethyl alcohol concentrations were in the range of 51.82 ± 0.91 g/L–56.85 ± 1.22 g/L for ER yeast and 48.81 ± 0.93 g/L–54.97 ± 0.63 g/L for TD yeast (Table 7). The results also show that sonification caused a statistically significant increase in the final ethanol concentration. However, intensifying the treatment by increasing the ultrasound amplitude did not translate into an increase in the final ethanol concentration. A similar trend was observed for wort with an initial density of 22 °Blg, with ethanol concentrations predictably (due to the higher sugar content) higher than those obtained for 18 °Blg wort (Table 7). However, it must be emphasised that to assess the proportionality of this increase, it was necessary to compare the results expressed in the percentage ethanol yield graph we presented. The slight increase in wort density from 22 to 24 °Blg translated into a marked decrease in the final ethanol concentration. The maximum values of this parameter after 72 h of fermentation were 56.15 ± 0.77 g/L for the ER us75 sample and only 37.38 ± 0.92 g/L for the TDus75 sample (Table 7). This trend is even more visible as a decrease in the efficiency of the ethanologenesis process, as is shown in the graph (Figure 4). The total ethanol yield in the 24 °Blg wort did not exceed 70% for the ER us75 sample and was only about 45% for the TD us75 sample, which is particularly evident when compared to the yield results observed for the 18 °Blg wort. A comparison of the fermentation performance of worts with different densities shows that the assumed fermentation time of 72 h was too short for samples with a density higher than 18 °Blg. Especially in the case of 24 °Blg wort, the inhibitory effect of the osmotic pressure of high-density wort was noticeable. These results confirm the industrial practice of many distillers who ferment wort with a density not exceeding 20 °Blg for 3 days of fermentation. The extension of the fermentation time necessary to ferment wort with a higher density takes time and volume of available fermentation vats, which, in effect, does not translate into a commensurate increase in the time of the dynamic process, all the more so because extending the fermentation time also exposes the process to losses resulting from the remarkable development of microflora that infects and competes with distiller’s yeast for sugars. It can be assumed that a particular solution here may be the use of batch fermentation technology, which involves dividing the dosing of the sugar raw material pool into two or more portions, which allows for maintaining osmotic pressure conditions that are tolerable for the yeast, which, however, is ultimately limited by the formation of ethanol and its inhibitory effect on yeast cells. Increasing the wort density from 18 to 22 °Blg resulted in a noticeable decrease in ethanol yield of at least a few per cent. Especially in the case of wort with the highest density, a beneficial effect of ultrasonic treatment was observed. This was evident in the increase in the intensity of treatment achieved by increasing the amplitude of the generated ultrasound from 50 to 75%, although the final values of this efficiency did not exceed 70%.
The amplitude of the ultrasound has a direct impact on the power (and impact energy) of the sound wave. An increase in amplitude increases the energy of the sound wave, while the frequency has no direct impact on the power. The results we obtained—i.e., improved fermentation with increased amplitude—were as expected. However, it is important to remember that by increasing the amplitude and duration of the sonic shock on the cells, the limit of the desired, gentle impact on the cell (mixing, facilitating mass exchange between the cell and the environment, and removing deposits from the cell surface) may be overstepped and lead to temporary or irreversible damage to the cytoplasmic membrane, the cell wall, and the structural elements of the cell, as well as to enzyme structures (leading to their denaturation).
A comparison of the literature data on alcoholic fermentation by S. cerevisiae, particularly by the Ethanol Red and Thermosacc Dry strains, shows that our results for the non-sonicated control samples do not differ significantly from these data. Mohd et al. [65] obtained about 26 g/L of ethanol after fermentation by an unspecified Saccharomyces cerevisiae strain of sago mash containing about 50 g/L of glucose. Majovic et al. [66] obtained 75 to 95 g/L ethanol from the fermentation of corn hydrolysate containing 150–200 g/L glucose. Vućarović et al. [67] obtained 84.6 g/L ethanol from 200 g/L sugars and 109.5 g/L ethanol from an initial 250 g/L sugars in the wort after 168 h of fermentation by the S. cerevisiae strain DTN during the production of ethanol from sugar beets. Dziugan and colleagues [44] reported a theoretical ethanol yield of 94.9% after 96 h of fermentation of thick sugar beet juice (250 g/L extract) with Ethanol Red yeast. Kartini and Diokhikah [68] recorded an ethanol yield of up to 11.34 g/L during the fermentation of sugar cane molasses wort containing initially about 100 g/L of sugars. In their study, Osmolak et al. [69] obtained about 30 g/L of ethanol after 72 h of fermentation of sugar beet molasses wort, with a residual sugar content of less than 7 g/L. Lino et al. [58] reported that during the fermentation of sugar wort by the Ethanol Red strain and others also belonging to S. cerevisiae, they observed, depending on the experimental option, 78.3 to 90% of the theoretical yield of ethanol formation. Barbosa et al. [56] obtained about 150 g/L of ethanol from a wort containing 300 g/L during cane molasses fermentation. Vućarović et al. [70] reported a 93% conversion of starch to ethanol using the Thermosacc Dry strain for the fermentation of wheat starch mashes. Beigbader et al. [55] fermented two types of beet molasses wort using the Thermosacc Dry strain. They obtained from the wort containing initially 125 g/L sugars between 25 and 55 g/L ethanol, and from the wort 225 g/L sugars between 50 and 90 g/L ethanol with 120 h of fermentation. Yang and colleagues [60] reported that using a wild-type S. cerevisiae strain, fermented wort containing 50 g/L of sugars at the start was converted to around 19 g/L of ethanol. The 5–10% increase in ethanol yield observed in our tests between the control sample and the sonicated sample with an amplitude of 50% is consistent with the trends described by others. When reviewing the literature, however, it must be emphasised that previous authors estimate the effect of ultrasound differently. This is probably also due to the different processing sequences, ultrasound strengths, media, and strains utilised. He et al. [47] report that during 50 h of fermentation of wort containing 250 g/L of sugars by the S. cerevisiae 1048 strain, they observed an increase of up to 30.7% in the yield of ethanol produced under the influence of ultrasound at a frequency of 28 kHz. The authors also observed a significant increase in the activity of enzymes crucial for ethanol production, such as hexokinase, pyruvate kinase and phosphofructokinase, and an increase in the intracellular concentration of calcium ions in the cells treated with ultrasound. An increase in cytoplasmic membrane permeability was also observed. Yang et al. [48] observed an increase in biomass concentration of about 7% and an increase in glutathione concentration of more than 15% when ultrasound was applied to the Saccharomyces cerevisiae SCZ40 strain. Dai et al. [71] observed a similar increase in biomass concentration and cytoplasmic membrane permeability. Still, they did not observe any changes in the yeast’s tolerance to ethanol present in the medium. Sulaiman et al. [30] reported an increase in ethanol yield of around 350% when treating the lactose medium (50 g/L lactose) fermented by the strain Kluyveromyces marxianus ATCC 46537 with ultrasounds. Subhedar and Gogate [72], describing their research on the fermentation of newspaper hydrolysate by S. cerevisiae SS328 yeast, reported a 180% increase in ethanol yield under ultrasonic treatment. Hao et al. [49] observed that sonification reduced the time needed for full fermentation from 6 to 4 days during rice wine fermentation. They also observed an increase in biomass of over 31% and in ethanol of 26.5%. Yang et al. [62] observed an increase of more than 34% in ethanol yield by S. cerevisiae CICC1048 when fermenting a wort containing 25% dextrose under ultrasonic treatment. What may help explain the mechanism of the effect of sonication on yield is that the authors described that they observed changes in the coding of the alcohol synthetase gene [62]. Also, Shaheen et al. support this finding by mentioning a 31% increase in ethanol consumption [73]. A literature review also provided us with one report that was sceptical of the effectiveness of ultrasound. Huzezo et al. [74] claimed that during their research on the effect of fermentation on yeast metabolism, they observed a negative effect of ultrasound on the assimilation of sugars and ethanol. This report, in comparison with all the aforementioned ones, may suggest that it is crucial to choose the right sequence of ultrasonic treatment to improve fermentation parameters, as too strong ultrasonic treatment can cause lethal changes in the yeast cell population.
Although in the study described here we limited the fermentation time to 72 h (as expected by distillers), we plan to extend the fermentation time in our future work assessing the effect of ultrasound on fermentation, which may allow us to observe interesting trends in the formation of ethanol and by-products.

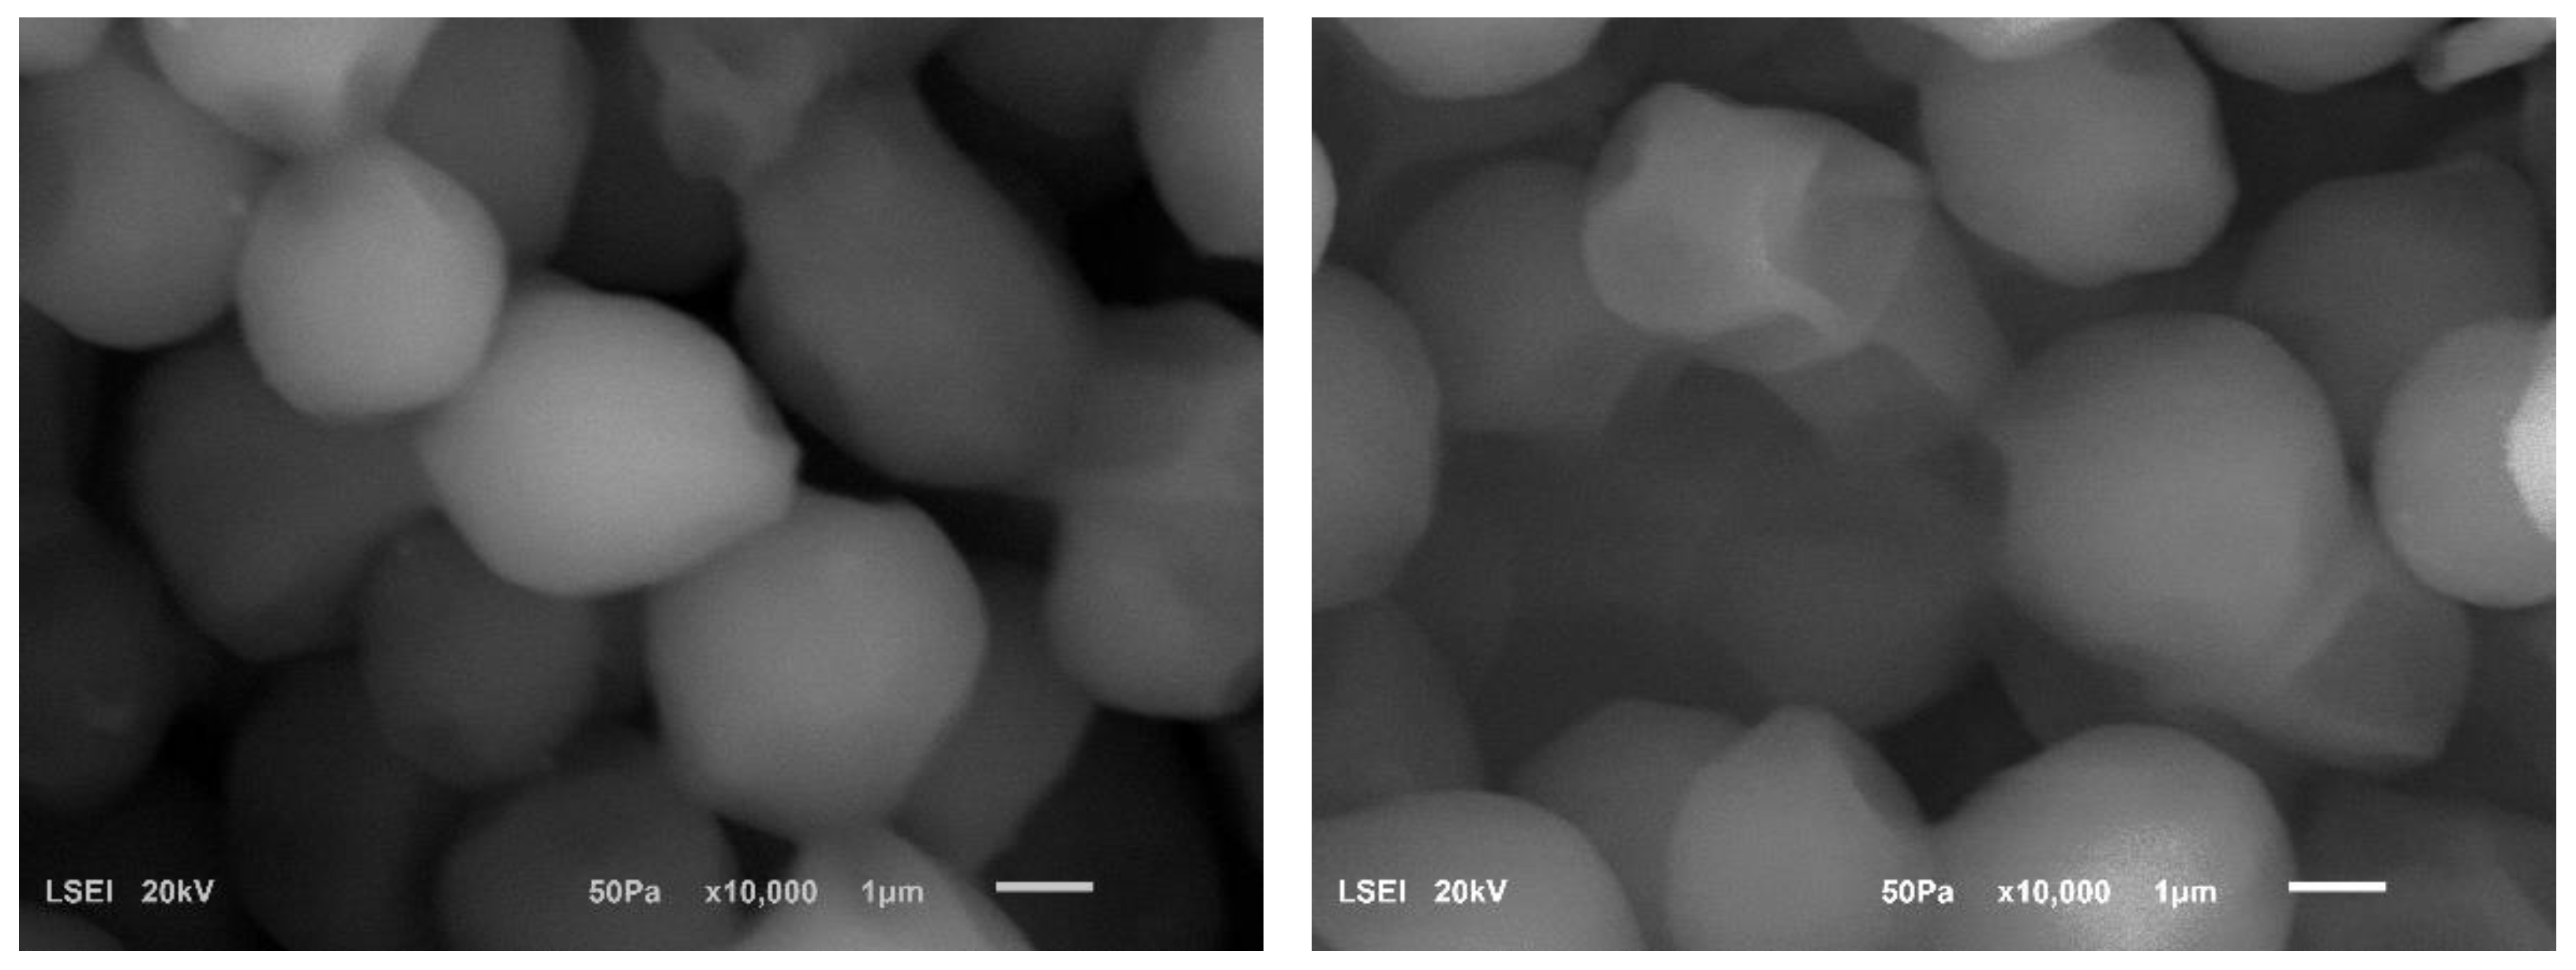
3.3. Scanning Electron Microscopy of Ultrasound-Treated Distillers Yeast

During our research, we decided to supplement the analysis with photos of the cells using SEM technology. The aim was to determine whether it would be possible to observe changes in the appearance of the cells caused by microwave treatment. Below, we have compiled SEM images of yeast cells subjected to and not subjected to sonification (Figure 5).
Although a more advanced method of cell preparation and coating with precious metals would have been necessary to obtain photographs for a more in-depth analysis of the appearance of the population and sonicated and non-sonicated cells, we were able to observe specific differences in the appearance of the population and cells subjected to sonification compared to non-sonicated cells. The populations of sonicated cells tended to form clusters, and a higher proportion of cells with wall depressions was observed among them. The 24-h interval between sonification treatments was chosen on the assumption that the ultrasound treatment would inactivate sublethal cells. In contrast, strong and healthy cells would survive with a low degree of local damage to the cell walls or membranes—to a degree that would allow them to repair themselves. We hoped that the yeast cell walls would be cleaned of the natural dyes and proteins present in the molasses through the use of ultrasound. This should enhance the exchange of nutrients and metabolites with the environment, thereby improving cell performance. The changes in cell appearance that we observed are confirmed in other scientific articles. He et al. [47] observed dents and folding of the Saccharomyces cerevisiae 1048 yeast cell wall subjected to intensive ultrasound treatment during fermentation. Similarly, Hao et al. [49] observed similar changes when sonicating fermenting rice wine. In future studies on ultrasound-assisted fermentation, we plan to use more extensive SEM studies to enable much more advanced analysis of the results obtained and to assess the effect of ultrasound on yeast cell structures. We also plan to combine these studies with an evaluation of metabolic activity and cell survival.

4. Summary and Conclusions

This research study comprised an analysis of molasses worts inoculated with two yeast strains and exposed to ultrasound treatment of various amplitudes. The study examined whether ultrasound facilitates the fermentation process of molasses wort with a density greater than 18 °Blg. Another objective was to determine whether alterations in the amplitude of ultrasound would affect the fermentation process.
Based on the examination made, the following conclusions were reached:
  • In the case of thick wort (22 and 24 °Blg), a positive effect of sonification on fermentation was observed. Therefore, it seems advisable to conduct further research to determine the optimal combination of exposure time, frequency, and, above all, ultrasound amplitude for fermentation.
  • Ultrasonic wort treatment with a density greater than 18 °Blg improves the final ethanol yield by 5 to 20%, depending on the strain used.
  • The higher the density of the wort, the more pronounced the positive effect of ultrasound on the dynamics and yield of fermentation.
  • Ultrasound causes visible indentations in the cell walls of Saccharomyces cerevisiae yeast and stimulates the cells to clump together.
From a scientific and technological point of view, it seems advisable to expand further research on the use of ultrasound during molasses wort fermentation. It will be interesting to examine the impact of extended, ultrasonically assisted thick wort fermentation on ethanol yield, byproduct formation, cell survival, and metabolic and physiological changes caused by ultrasounds. Even a 1–2 percent improvement in ethanol production efficiency or fermentation acceleration, under industrial conditions, can be worth millions of dollars globally.

Author Contributions

Conceptualization, A.M.P. and A.K.; methodology, A.M.P. and U.D.-K.; software, J.D.; validation, U.D.-K. and J.D.; formal analysis, A.M.P.; investigation, A.M.P., B.J. and A.K.; resources, A.M.P.; data curation, U.D.-K.; writing—original draft preparation, A.K. and A.M.P.; writing—review and editing, A.M.P.; visualization, A.M.P.; supervision, J.D. All authors have read and agreed to the published version of the manuscript.

Funding

This research received no external funding.

Institutional Review Board Statement

Not applicable.

Informed Consent Statement

Not applicable.

Data Availability Statement

The raw data supporting the conclusions of this article will be made available by the authors on request.

Conflicts of Interest

The authors declare no conflicts of interest.

References

  1. Rajarajan, G.; Irshad, A.; Raghunath, B.V.; Mahesh Kumar, G.; Punnagaiarasi, A. Utilization of Cheese Industry Whey for Biofuel–Ethanol Production. In Integrated Waste Management in India. Environmental Science and Engineering; Prashanthi, M., Sundaram, R., Eds.; Springer International Publishing: Cham, Switzerland, 2016; pp. 59–64. ISBN 978-3-319-27226-9. [Google Scholar]
  2. World Ethanol Production to Rebound in 2021. Available online: https://informaconnect.com/world-ethanol-production-to-rebound-in-2021/ (accessed on 11 February 2025).
  3. Cibis, E.; Krzywonos, M.; Miśkiewicz, T. Etanol w Świecie—Kierunki Użytkowania, Surowce i Produkty Uboczne. Przemysl Chem. 2006, 85, 1263–1267. [Google Scholar]
  4. Rendleman, C.; Shapouri, H. New Technologies in Ethanol Production; Agricultural Economic Reports 308483; United States Department of Agriculture, Economic Research Service: Washington, DC, USA, 2007. [CrossRef]
  5. Galbe, M.; Sassner, P.; Wingren, A.; Zacchi, G. Process Engineering Economics of Bioethanol Production. In Biofuels. Advances in Biochemical Engineering/Biotechnology; Olsson, L., Ed.; Springer: Berlin/Heidelberg, Germany, 2007; Volume 108, pp. 303–327. ISBN 978-3-540-73650-9. [Google Scholar]
  6. Ceaser, R.; Montané, D.; Constantí, M.; Medina, F. Current Progress on Lignocellulosic Bioethanol Including a Technological and Economical Perspective. Environ. Dev. Sustain. 2024. [Google Scholar] [CrossRef]
  7. Duque, A.; Álvarez, C.; Doménech, P.; Manzanares, P.; Moreno, A.D. Advanced Bioethanol Production: From Novel Raw Materials to Integrated Biorefineries. Processes 2021, 9, 206. [Google Scholar] [CrossRef]
  8. Chandel, A.K.; Kapoor, R.K.; Narasu, M.L.; Viswadevan, V.; Kumaran, S.G.S.; Rudravaram, R.; Rao, L.V.; Tripathi, K.K.; Lal, B.; Kuhad, R.C. Economic Evaluation and Environmental Benefits of Biofuel: An Indian Perspective. Int. J. Glob. Energy Issues 2007, 28, 357–381. [Google Scholar] [CrossRef]
  9. Rosales-Calderon, O.; Arantes, V. A Review on Commercial-Scale High-Value Products That Can Be Produced alongside Cellulosic Ethanol. Biotechnol. Biofuels 2019, 12, 240. [Google Scholar] [CrossRef] [PubMed]
  10. Bio Ethanol Production—Raw Materials. Available online: https://www.engineeringtoolbox.com/ethanol-bio-fuel-d_1357.html (accessed on 11 February 2025).
  11. Cardona, C.A.; Sanchez, O.J.; Gutierrez, L.F. Process Synthesis for Fuel Ethanol Production; CRC Press: Boca Raton, FL, USA, 2009; ISBN 978-0-429-13056-4. [Google Scholar]
  12. Roehr, M. (Ed.) The Biotechnology of Ethanol: Classical and FutureApplications; Wiley-VCH: Weinheim, Germany, 2001; ISBN 3-527-30199-2-PMC. Available online: https://pmc.ncbi.nlm.nih.gov/articles/PMC6236454/ (accessed on 11 February 2025).
  13. Boulton, C.; Quain, D. Brewing Yeast and Fermentation; Wiley-Blackwell: Hoboken, NJ, USA, 2006; p. 468. [Google Scholar]
  14. Claassen, P.A.M.; Van Lier, J.B.; Lopez Contreras, A.M.; Van Niel, E.W.J.; Sijtsma, L.; Stams, A.J.M.; De Vries, S.S.; Weusthuis, R.A. Utilisation of Biomass for the Supply of Energy Carriers. Appl. Microbiol. Biotechnol. 1999, 52, 741–755. [Google Scholar] [CrossRef]
  15. Mousdale, D.M. Biofuels: Biotechnology, Chemistry, and Sustainable Development; CRC Press: Boca Raton, FL, USA, 2008; ISBN 978-0-429-13756-3. [Google Scholar]
  16. Walker, G.M.; Stewart, G.G. Saccharomyces cerevisiae in the Production of Fermented Beverages. Beverages 2016, 2, 30. [Google Scholar] [CrossRef]
  17. Walker, G.M. Metals in Yeast Fermentation Processes. Adv. Appl. Microbiol. 2004, 54, 197–229. [Google Scholar] [CrossRef]
  18. Soccol, C.R.; Pandey, A.; Larroche, C. (Eds.) Fermentation Processes Engineering in the Food Industry; CRC Press: Boca Raton, FL, USA, 2013; ISBN 978-0-429-11200-3. [Google Scholar]
  19. Busturia, A.; Lagunas, R. Catabolite Inactivation of the Glucose Transport System in Saccharomyces cerevisiae. J. Gen. Microbiol. 1986, 132, 379–385. [Google Scholar] [CrossRef]
  20. Fermentation Assisted by Pulsed Electric Field and Ultrasound: A Review. Available online: https://www.mdpi.com/2311-5637/4/1/1 (accessed on 11 February 2025).
  21. Wang, Z.; Huang, J.; Ma, S.; Wang, X.; Sun, B.; Wang, F.; Li, L.; Bao, Q. Novel Heating Technologies to Improve Fermentation Efficiency and Quality in Wheat Products: A Short Review. Grain Oil Sci. Technol. 2021, 4, 81–87. [Google Scholar] [CrossRef]
  22. Metaxas, A. Microwave Heating. Power Eng. J. 1991, 5, 237–247. [Google Scholar] [CrossRef]
  23. Kapcsándi, V.; Neményi, M.; Lakatos, E. Effect of Microwave Treatment of the Grape Must Fermentation Process. 2013. Available online: http://real.mtak.hu/16643/2/FoodScienceConference2013.pdf (accessed on 10 January 2025).
  24. Melikoglu, M. Solid-State Fermentation of Wheat Pieces by Aspergillus Oryzae: Effects of Microwave Pretreatment on Enzyme Production in a Biorefinery. Int. J. Green Energy 2012, 9, 529–539. [Google Scholar] [CrossRef]
  25. Nowicka, A.; Zieliński, M.; Dębowski, M.; Dudek, M.R. Wykorzystanie Promieniowania Mikrofalowego do Wspomagania Procesu Fermentacji Alkoholowej Biomasy. Ecol. Eng. Environ. Technol. 2017, 18, 109–116. [Google Scholar] [CrossRef]
  26. Cho, H.Y.; Yousef, A.E.; Sastry, S.K. Growth Kinetics of Lactobacillus Acidophilus under Ohmic Heating. Biotechnol. Bioeng. 1996, 49, 334–340. [Google Scholar] [CrossRef]
  27. Lebovka, N. Enhanced Extraction from Solid Foods and Biosuspensions by Pulsed Electrical Energy. Food Eng. Rev. 2010, 2, 95–108. [Google Scholar]
  28. Lebovka, N.; Vorobiev, E. Techniques to Detect Electroporation in Food Tissues. In Handbook of Electroporation; Springer International Publishing: New York, NY, USA, 2017. [Google Scholar]
  29. Koubaa, M.; Roselló-Soto, E.; Šic Žlabur, J.; Režek Jambrak, A.; Brnčić, M.; Grimi, N.; Boussetta, N.; Barba, F.J. Current and New Insights in the Sustainable and Green Recovery of Nutritionally Valuable Compounds from Stevia Rebaudiana Bertoni. J. Agric. Food Chem. 2015, 63, 6835–6846. [Google Scholar] [CrossRef] [PubMed]
  30. Sulaiman, A.Z.; Ajit, A.; Yunus, R.; Chisti, Y. Ultrasound-Assisted Fermentation Enhances Bioethanol Productivity. Biochem. Eng. J. 2011, 54, 141–150. [Google Scholar] [CrossRef]
  31. Hauff, P.; Reinhardt, M.; Foster, S. Ultrasound Basics. In Handbook of Experimental Pharmacology; Springer: Berlin/Heidelberg, Germany, 2008; pp. 91–107. [Google Scholar] [CrossRef]
  32. Ojha, K.S.; Mason, T.J.; O’Donnell, C.P.; Kerry, J.P.; Tiwari, B.K. Ultrasound Technology for Food Fermentation Applications. Ultrason. Sonochem. 2017, 34, 410–417. [Google Scholar] [CrossRef]
  33. Chemat, F.; Zill-e-Huma; Khan, M.K. Applications of Ultrasound in Food Technology: Processing, Preservation and Extraction. Ultrason. Sonochem. 2011, 18, 813–835. [Google Scholar] [CrossRef]
  34. Tsukamoto, I.; Yim, B.; Stavarache, C.E.; Furuta, M.; Hashiba, K.; Maeda, Y. Inactivation of Saccharomyces cerevisiae by Ultrasonic Irradiation. Ultrason. Sonochem. 2004, 11, 61–65. [Google Scholar] [CrossRef]
  35. Wood, B.E.; Aldrich, H.C.; Ingram, L.O. Ultrasound Stimulates Ethanol Production during the Simultaneous Saccharification and Fermentation of Mixed Waste Office Paper. Biotechnol. Prog. 1997, 13, 232–237. [Google Scholar] [CrossRef] [PubMed]
  36. Chuanyun, D.; Bochu, W.; Chuanren, D.; Sakanishi, A. Low Ultrasonic Stimulates Fermentation of Riboflavin Producing Strain Ecemothecium Ashbyii. Colloids Surf. B Biointerfaces 2003, 30, 37–41. [Google Scholar] [CrossRef]
  37. Matsuura, K.; Hirotsune, M.; Nunokawa, Y.; Satoh, M.; Honda, K. Acceleration of Cell Growth and Ester Formation by Ultrasonic Wave Irradiation. J. Ferment. Bioeng. 1994, 77, 36–40. [Google Scholar] [CrossRef]
  38. Schläfer, O.; Sievers, M.; Klotzbücher, H.; Onyeche, T.I. Improvement of Biological Activity by Low Energy Ultrasound Assisted Bioreactors. Ultrasonics 2000, 38, 711–716. [Google Scholar] [CrossRef] [PubMed]
  39. Chisti, Y.; Moo-Young, M. Disruption of Microbial Cells for Intracellular Products. Enzyme Microb. Technol. 1986, 8, 194–204. [Google Scholar] [CrossRef]
  40. Lanchun, S.; Bochu, W.; Zhiming, L.; Chuanren, D.; Chuanyun, D.; Sakanishi, A. The Research into the Influence of Low-Intensity Ultrasonic on the Growth of S. Cerevisiaes. Colloids Surf. B Biointerfaces 2003, 30, 43–49. [Google Scholar] [CrossRef]
  41. Michel, F.C., Jr.; Grulke, E.A.; Reddy, C.A. A Kinetic Model for the Fungal Pellet Lifecycle. AIChE J. 1992, 38, 1449–1460. [Google Scholar] [CrossRef]
  42. Stewart, G.G.; Hill, A.E.; Russell, I. 125th Anniversary Review: Developments in Brewing and Distilling Yeast Strains: Developments in Brewing and Distilling Yeast Strains. J. Inst. Brew. 2013, 119, 202–220. [Google Scholar] [CrossRef]
  43. Pátková, J.; Šmogrovičová, D.; Dömény, Z.; Bafrncová, P. Very High Gravity Wort Fermentation by Immobilised Yeast. Biotechnol. Lett. 2000, 22, 1173–1177. [Google Scholar] [CrossRef]
  44. Dziugan, P.; Balcerek, M.; Pielech-Przybylska, K.; Patelski, P. Evaluation of the Fermentation of High Gravity Thick Sugar Beet Juice Worts for Efficient Bioethanol Production. Biotechnol. Biofuels 2013, 6, 158. [Google Scholar] [CrossRef]
  45. Walker, G.; Hill, A. Saccharomyces cerevisiae in the Production of Whisk(e)y. Beverages 2016, 2, 38. [Google Scholar] [CrossRef]
  46. Arshad, M.; Hussain, T.; Iqbal, M.; Abbas, M. Enhanced Ethanol Production at Commercial Scale from Molasses Using High Gravity Technology by Mutant S. Cerevisiae. Braz. J. Microbiol. 2017, 48, 403–409. [Google Scholar] [CrossRef] [PubMed]
  47. He, R.; Ren, W.; Xiang, J.; Dabbour, M.; Kumah Mintah, B.; Li, Y.; Ma, H. Fermentation of Saccharomyces cerevisiae in a 7.5 L Ultrasound-Enhanced Fermenter: Effect of Sonication Conditions on Ethanol Production, Intracellular Ca2+ Concentration and Key Regulating Enzyme Activity in Glycolysis. Ultrason. Sonochem. 2021, 76, 105624. [Google Scholar] [CrossRef] [PubMed]
  48. Yang, Y.; Xiang, J.; Zhang, Z.; Umego, E.C.; Huang, G.; He, R.; Ma, H. Stimulation of in Situ Low Intensity Ultrasound on Batch Fermentation of to Enhance the GSH Yield. J. Food Process Eng. 2020, 43, e13489. [Google Scholar] [CrossRef]
  49. Hao, J.; Xu, H.; Yan, P.; Yang, M.; Mintah, B.K.; Dai, C.; Zhang, R.; Ma, H.; He, R. Application of Fixed-Frequency Ultrasound in the Cultivation of Saccharomyces cerevisiae for Rice Wine Fermentation. J. Sci. Food Agric. 2024, 104, 6417–6430. [Google Scholar] [CrossRef]
  50. Available online: https://leaf-lesaffre.com/wp-content/uploads/2022/07/er_en_th_v3.pdf (accessed on 10 January 2025).
  51. Available online: http://www.lallemandbds.com/wp-content/uploads/2012/12/2013_LBDS_Data-Sheet_Thermosacc-Dry_10080_Data_Rev.00.01.01.2013.pdf (accessed on 10 January 2025).
  52. Da Silva Fernandes, F.; De Souza, É.S.; Carneiro, L.M.; Alves Silva, J.P.; De Souza, J.V.B.; Da Silva Batista, J. Current Ethanol Production Requirements for the Yeast Saccharomyces cerevisiae. Int. J. Microbiol. 2022, 2022, 7878830. [Google Scholar] [CrossRef]
  53. Cagnin, L.; Gronchi, N.; Basaglia, M.; Favaro, L.; Casella, S. Selection of Superior Yeast Strains for the Fermentation of Lignocellulosic Steam-Exploded Residues. Front. Microbiol. 2021, 12, 756032. [Google Scholar] [CrossRef]
  54. Pielech-Przybylska, K.; Balcerek, M.; Klebeko, M.; Dziekońska-Kubczak, U.; Hebdzyński, M. Ethanolic Fermentation of Rye Mashes: Factors Influencing the Formation of Aldehydes and Process Efficiency. Biomolecules 2022, 12, 1085. [Google Scholar] [CrossRef]
  55. Beigbeder, J.-B.; De Medeiros Dantas, J.M.; Lavoie, J.-M. Optimization of Yeast, Sugar and Nutrient Concentrations for High Ethanol Production Rate Using Industrial Sugar Beet Molasses and Response Surface Methodology. Fermentation 2021, 7, 86. [Google Scholar] [CrossRef]
  56. Barbosa, H.S.; Silveira, E.D.A.; Miranda, M.; Ernandes, J.R. Efficient Very-High-Gravity Fermentation of Sugarcane Molasses by Industrial Yeast Strains: Bioethanol or Very-High-Gravity Fermentation. J. Inst. Brew. 2016, 122, 329–333. [Google Scholar] [CrossRef]
  57. A New Model of Alcoholic Fermentation Under a Byproduct Inhibitory Effect|ACS Omega. Available online: https://pubs.acs.org/doi/10.1021/acsomega.0c04025 (accessed on 19 February 2025).
  58. Lino, F.S.D.O.; Basso, T.O.; Sommer, M.O.A. A Synthetic Medium to Simulate Sugarcane Molasses. Biotechnol. Biofuels 2018, 11, 221. [Google Scholar] [CrossRef] [PubMed]
  59. Thomas, K.C.; Hynes, S.H.; Ingledew, W.M. Influence of Medium Buffering Capacity on Inhibition of Saccharomyces cerevisiae Growth by Acetic and Lactic Acids. Appl. Environ. Microbiol. 2002, 68, 1616–1623. [Google Scholar] [CrossRef]
  60. Yang, P.; Jiang, S.; Lu, S.; Jiang, S.; Jiang, S.; Deng, Y.; Lu, J.; Wang, H.; Zhou, Y. Ethanol Yield Improvement in Saccharomyces cerevisiae GPD2 Delta FPS1 Delta ADH2 Delta DLD3 Delta Mutant and Molecular Mechanism Exploration Based on the Metabolic Flux and Transcriptomics Approaches. Microb. Cell Factories 2022, 21, 160. [Google Scholar] [CrossRef]
  61. Pielech-Przybylska, K.; Balcerek, M.; Ciepielowski, G.; Pacholczyk-Sienicka, B.; Albrecht, Ł.; Dziekońska-Kubczak, U.; Bonikowski, R.; Patelski, P. Effect of Co-Inoculation with Saccharomyces cerevisiae and Lactic Acid Bacteria on the Content of Propan-2-Ol, Acetaldehyde and Weak Acids in Fermented Distillery Mashes. Int. J. Mol. Sci. 2019, 20, 1659. [Google Scholar] [CrossRef]
  62. Yang, Y.; Ren, W.; Xu, H.; Cheng, L.; Dapaah, M.F.; He, R.; Ma, H. Incorporating Transcriptomic-Metabolomic Analysis Reveal the Effect of Ultrasound on Ethanol Production in Saccharomyces cerevisiae. Ultrason. Sonochem. 2021, 79, 105791. [Google Scholar] [CrossRef] [PubMed]
  63. Hoang Nguyen Tran, P.; Ko, J.K.; Gong, G.; Um, Y.; Lee, S.-M. Improved Simultaneous Co-Fermentation of Glucose and Xylose by Saccharomyces cerevisiae for Efficient Lignocellulosic Biorefinery. Biotechnol. Biofuels 2020, 13, 12. [Google Scholar] [CrossRef]
  64. Gao, Y.; Xu, J.; Yuan, Z.; Zhang, Y.; Liang, C.; Liu, Y. Ethanol Production from High Solids Loading of Alkali-Pretreated Sugarcane Bagasse with an SSF Process. BioResources 2014, 9, 3466–3479. [Google Scholar] [CrossRef]
  65. Mohd, H.; Kamarudin, N.; Nadir, M.; Mel, M.; Ismail, A.; Karim, M.I.A. Comparison of Sago and Sweet Sorghum for Ethanol Production Using Saccharomyces cerevisiae. In Proceedings of the Malaysian International Conference on Trends in Bioprocess Engineering (MICOTriBE), Langkawi, Malaysia, 3–7 July 2012. [Google Scholar]
  66. Mojovic, L.; Rakin, M.; Vukasinovic, M.; Nikolic, S.; Pejin, J.; Pejin, D. Production of Bioethanol by Simultaneous Saccharification and Fermentation of Corn Meal by Immobilized Yeast. Chem. Eng. Trans. 2010, 21, 1333–1338. [Google Scholar] [CrossRef]
  67. Vučurović, V.M.; Puškaš, V.S.; Miljić, U.D. Bioethanol Production from Sugar Beet Molasses and Thick Juice by Free and Immobilised Saccharomyces cerevisiae. J. Inst. Brew. 2019, 125, 134–142. [Google Scholar] [CrossRef]
  68. Kartini, A.M.; Dhokhikah, Y. Bioethanol Production from Sugarcane Molasses with Simultaneous Saccharification and Fermentation (SSF) Method Using Saccaromyces Cerevisiae-Pichia Stipitis Consortium. IOP Conf. Ser. Earth Environ. Sci. 2018, 207, 012061. [Google Scholar] [CrossRef]
  69. Osmolak, K.; Mikulski, D.; Kłosowski, G. Efficient Production of Fuel Ethanol via the Simultaneous Use of Distillery Stillage Biomass and Beet Molasses. Energies 2025, 18, 312. [Google Scholar] [CrossRef]
  70. Vučurović, V.; Katanski, A.; Vučurović, D.; Bajić, B.; Dodić, S. Simultaneous Saccharification and Fermentation of Wheat Starch for Bioethanol Production. Fermentation 2025, 11, 80. [Google Scholar] [CrossRef]
  71. Dai, C.; Xiong, F.; He, R.; Zhang, W.; Ma, H. Effects of Low-Intensity Ultrasound on the Growth, Cell Membrane Permeability and Ethanol Tolerance of Saccharomyces cerevisiae. Ultrason. Sonochem. 2017, 36, 191–197. [Google Scholar] [CrossRef] [PubMed]
  72. Subhedar, P.B.; Gogate, P.R. Ultrasound-Assisted Bioethanol Production from Waste Newspaper. Ultrason. Sonochem. 2015, 27, 37–45. [Google Scholar] [CrossRef]
  73. Shaheen, M.; Choi, M.; Ang, W.; Zhao, Y.; Xing, J.; Yang, R.; Xing, J.; Zhang, J.; Chen, J. Application of Low-Intensity Pulsed Ultrasound to Increase Bio-Ethanol Production. Renew. Energy 2013, 57, 462–468. [Google Scholar] [CrossRef]
  74. Huezo, L.; Shah, A.; Michel, F., Jr. Effects of Ultrasound on Fermentation of Glucose to Ethanol by Saccharomyces cerevisiae. Fermentation 2019, 5, 16. [Google Scholar] [CrossRef]
Figure 1. Percentage release of carbon dioxide during fermentation of 18 °Blg wort depending on ultrasound treatment and yeast strain.
Applsci 15 03811 g001
Figure 2. Percentage release of carbon dioxide during fermentation of 22 °Blg wort depending on ultrasound treatment and yeast strain.
Applsci 15 03811 g002
Figure 3. Percentage release of carbon dioxide during fermentation of 24 °Blg wort depending on ultrasound treatment and yeast strain.
Applsci 15 03811 g003
Figure 4. Fermentation yield of wort of different densities fermented by two distiller yeast strains, depending on sample sonification.
Applsci 15 03811 g004
Figure 5. SEM images of cells. Ethanol Red strain subjected (left) and not subjected (right) to sonification (24 kHz; cycle 0.5; 50% amplitude; 5 min every 24 h) after 72 h of fermentation of molasses wort 18 °Blg.
Applsci 15 03811 g005
Table 1. Ethanol yield from different raw materials [8,10].
Raw MaterialTheoretical Ethanol Yield [L/100 kg]
Corn grain400
Sugarcane juice70
Sugarcane molasses205
Cassava roots180
Sweet potato160
Table 2. Fermentation options during experiments.
Wort Extract [°Blg]Yeast StrainUltrasound Treatment
18Ethanol Red
or
Thermosacc Dry
no sonification
2224 kHz; 0.5 pulse, 50% amplitude
2424 kHz; 0.5 pulse, 75% amplitude
Table 3. Sample abbreviations.
ER contrEthanol Red yeast, no sonification
ER u50Ethanol Red yeast, sonification at 50% amplitude
ER u75Ethanol Red yeast, sonification at 75% amplitude
TD contrThermosacc Dry yeast, no sonification
TD u50Thermosacc Dry yeast, sonification at 50% amplitude
TD u75Thermosacc Dry yeast, sonification at 75% amplitude
Table 4. Initial wort analysis.
CompoundGlucoseFructoseSuccinic AcidLactic AcidAcetic Acid
extractg/L
18 °Blg61.08 ± 0.8760.67 ± 2.641.04 ± 0.023.45 ± 0.141.41 ± 0.04
22 °Blg76.98 ± 3.0978.85 ± 3.511.75 ± 0.074.23 ± 0.161.81 ± 0.08
24 °Blg79.80 ± 3.7079.14 ± 2.841.82 ± 0.024.46 ± 0.131.83 ± 0.04
Table 5. Glucose and fructose utilisation after 72 h of fermentation of 18, 22, and 24 °Blg worts.
Extract18 °Blg22 °Blg24 °Blg
GlucoseFructoseGlucoseFructoseGlucoseFructose
% of Utilised
ER contr99.56 ± 3.1793.75 ± 2.4398.27 ± 1.2381.49 ± 0.5767.42 ± 2.5127.04 ± 0.65
ER u5099.36 ± 3.1592.67 ± 2.6998.60 ± 4.0287.33 ± 3.7181.13 ± 3.1741.03 ± 0.98
ER u7599.05 ± 3.2594.89 ± 1.9998.82 ± 3.3583.89 ± 2.0681.57 ± 1.0847.89 ± 1.64
TD contr98.33 ± 3.0786.79 ± 4.2396.68 ± 2.7070.03 ± 1.4558.05 ± 2.4624.45 ± 0.42
TD u5099.97 ± 3.3292.40 ± 2.6496.98 ± 4.4976.06 ± 2.6466.91 ± 2.9437.37 ± 1.14
TD u7598.95 ± 3.3693.96 ± 1.9897.02 ± 2.4973.67 ± 3.6078.30 ± 2.5172.58 ± 2.54
Table 6. Selected acids and glycerol after 72 h of fermentation of 18, 22, and 24 °Blg worts.
g/L SucA LacA AceA GlycOH
18 °Blg
ER contr 1.56 ± 0.08 2.03 ± 0.08 1.87 ± 0.04 7.92 ± 0.21
ER u50 1.76 ± 0.04 2.12 ± 0.06 2.10 ± 0.08 8.74 ± 0.26
ER u75 1.59 ± 0.05 2.25 ± 0.04 1.98 ± 0.11 8.51 ± 0.21
TD contr 1.60 ± 0.03 2.10 ± 0.06 1.96 ± 0.06 7.83 ± 0.16
TD u50 1.62 ± 0.06 2.00 ± 0.06 1.92 ± 0.07 8.17 ± 0.08
TD u75 1.56 ± 0.05 1.86 ± 0.06 1.59 ± 0.04 6.96 ± 0.09
22 °Blg
ER contr 1.92 ± 0.04 3.03 ± 0.03 2.51 ± 0.08 9.80 ± 0.46
ER u50 1.94 ± 0.05 2.75 ± 0.10 2.52 ± 0.05 10.29 ± 0.29
ER u75 2.05 ± 0.07 3.01 ± 0.06 2.54 ± 0.09 10.17 ± 0.29
TD contr 1.67 ± 0.08 2.89 ± 0.08 2.33 ± 0.08 9.27 ± 0.35
TD u50 1.61 ± 0.06 2.71 ± 0.11 2.47 ± 0.04 9.76 ± 0.20
TD u75 1.52 ± 0.04 2.71 ± 0.07 2.16 ± 0.07 8.52 ± 0.14
24 °Blg
ER contr 1.46 ± 0.05 3.56 ± 0.13 2.62 ± 0.09 8.36 ± 0.21
ER u50 1.59 ± 0.05 3.46 ± 0.12 2.56 ± 0.06 8.44 ± 0.20
ER u75 1.52 ± 0.07 3.19 ± 0.15 2.31 ± 0.05 8.19 ± 0.23
TD contr 1.26 ± 0.06 3.30 ± 0.12 2.04 ± 0.07 5.06 ± 0.10
TD u50 1.35 ± 0.05 3.60 ± 0.06 2.25 ± 0.08 5.74 ± 0.19
TD u75 1.21 ± 0.04 3.53 ± 0.10 2.02 ± 0.09 5.37 ± 0.14
Table 7. Final ethanol concentration after 3 days of fermentation of wort of different densities by two strains of distiller’s yeast, depending on the sample’s sonification.
Initial Extract18 °Blg22 °Blg24 °Blg
g/L
ER contr51.82 ± 0.9161.67 ± 0.7444.28 ± 1.00
ER u5056.85 ± 1.2265.64 ± 1.9248.23 ± 0.98
ER u7556.22 ± 1.4366.11 ± 1.1656.15 ± 0.77
TD contr48.81 ± 0.9353.76 ± 1.2623.54 ± 0.49
TD u5054.97 ± 0.6361.12 ± 1.4229.57 ± 1.20
TD u7552.45 ± 1.3556.89 ± 0.8537.38 ± 0.92
Disclaimer/Publisher’s Note: The statements, opinions and data contained in all publications are solely those of the individual author(s) and contributor(s) and not of MDPI and/or the editor(s). MDPI and/or the editor(s) disclaim responsibility for any injury to people or property resulting from any ideas, methods, instructions or products referred to in the content.

