Article

Electro-Optic Fabry-Perot Etalon for Frequency Stabilization in in Single-Longitudinal Mode Nd:YVO4 Laser

by
Xiaojie Chen
1,2,
Renpeng Yan
1,2,
Zelong Liu
1,2,
Yugang Jiang
3,
Rongwei Fan
1 and
Xudong Li
1,2,*
1
National Key Laboratory of Laser Spatial Information, Harbin Institute of Technology, Harbin 150001, China
2
Zhengzhou Research Institute, Harbin Institute of Technology, Zhengzhou 450000, China
3
Tianjin Key Laboratory of Optical Thin Film, Tianjin Jinhang Technical Physics Institute, Tianjin 300308, China
*
Author to whom correspondence should be addressed.
Appl. Sci. 2025, 15(7), 3813; https://doi.org/10.3390/app15073813
Submission received: 5 March 2025 / Revised: 27 March 2025 / Accepted: 28 March 2025 / Published: 31 March 2025

Abstract

:
Single-longitudinal mode lasers are widely used as light sources in coherent lidars due to their narrow linewidth and long coherence length. However, we observed spontaneous frequency drift in a single-longitudinal mode laser, accompanied by the oscillation of a second mode, which could compromise the laser’s performance. In this study, we recorded the frequency drift and the resulting power fluctuations. By analyzing the centroid positions of the laser spot, we confirmed that the drift originated from changes in the optical path length. To address this issue, we designed an electro-optic Fabry–Perot etalon. When a 400 V voltage was applied, the laser returned to single-longitudinal mode operation within 15 s. The electro-optic etalon induced an optical path variation of 0.05 μm. This work provides new insights into the application of electro-optic crystals for stabilizing laser frequencies.

1. Introduction

Coherent detection is an effective method for its exceptional resolution, measurement accuracy, and signal-to-noise ratio [1]. It is widely used in various fields, including atmospheric optics, hyperfine wind structure detection, spacecraft pose measurement, and moving object identification [2,3,4,5]. Lidars employing coherent detection rely on single-longitudinal mode (SLM) laser sources, which offer narrow linewidth and long coherence length, to enhance their detection range and resolution [6]. However, in a previous experiment, we observed that the frequency of the oscillating longitudinal mode in an SLM laser could drift spontaneously. This drift, likely caused by changes in the optical path length, can undermine the laser’s performance. To address this issue, electro-optic (EO) crystals have been proposed as a solution. The refractive index of an EO crystal can be adjusted by applying an electric field, allowing for precise control of the optical path length and longitudinal mode spacing in a laser. This process, known as EO frequency modulation, has proven effective in stabilizing laser frequencies.
In recent years, EO frequency modulation has been extensively studied for its ability to achieve rapid and precise frequency tuning in solid-state lasers. Schulz and Henion demonstrated a frequency-modulated Nd:YAG laser using an LiTaO₃ electro-optic phase modulator, achieving a tuning range of 12 GHz with a sensitivity of 12 MHz/V and a frequency shift of 1.2 GHz in 0.6 ns [7]. Freitag et al. developed a diode-pumped Nd:YAG ring laser with an integrated electro-optic modulator, achieving a tuning coefficient of 0.75 MHz/V, a tuning range of 3 GHz, and an output power of 440 mW [8]. Guo et al. reported a tunable single-frequency Nd:YLF laser at 526.5 nm using an LiTaO3-based Fabry–Perot etalon, achieving a tuning range of 12 GHz and a sensitivity of 12 MHz/V [9]. Xu et al. demonstrated a linearly frequency-modulated Nd:YVO4 laser using RbTiOPO4 (RTP) crystals, achieving a tuning speed of 2.40 THz/s, a tuning range of 6 GHz, and a frequency deviation of less than 60 MHz during linear modulation [10]. Further advancements include a 14 GHz broadband frequency-tuned Nd:YVO4 laser using an RTP etalon and piezoelectric transducer (PZT), enabling continuous tuning without mode hops and achieving terahertz-per-second tuning speeds [11].
Recent developments in EO spectral tuning have further expanded the capabilities of tunable lasers. Various EO tuning methods have been explored, leveraging the Pockels effect in materials like LiNbO3 (LN) and KH2PO4 (KDP). For instance, broadband tuning over 17.2 GHz with a response time of 10 ns has been demonstrated in a diode-pumped Nd:YVO4 laser using LN crystals for coarse and fine tuning [12]. Similarly, LN-based microdisk lasers have achieved ultranarrow linewidths of 322 Hz with a tuning efficiency of 50 pm/100 V [13]. Additionally, LN-based grating-assisted directional couplers have shown high EO tuning efficiencies of up to 1.736 nm/V [14]. In another study, a Yb:GdCOB laser was tuned from 1024 to 1034 nm using a KDP-based Lyot filter, achieving a maximum output power of 3.21 W [15]. These advancements highlight the potential of EO tuning for applications requiring fast, precise, and broadband wavelength control in compact laser systems. Moreover, a nonperiodically poled LiNbO3 (NPPLN) device was optimized for EO spectral tuning in a multi-wavelength optical parametric oscillator, achieving tuning rates of ~0.5 nm/(kV/mm) for dual signals at 1540 and 1550 nm [16].
Building on these advancements, this study focuses on the application of EO crystals to stabilize the frequency of SLM lasers. We constructed a Nd:YVO4 laser and achieved SLM oscillation by incorporating K9-glass Fabry–Perot (FP) etalons with different reflectivities into the oscillator. During operation, we observed frequency drift in the oscillating longitudinal mode, accompanied by fluctuations in output power. We qualitatively analyzed these phenomena and attributed them to changes in the optical path length. This hypothesis was verified by detecting the centroid position of the output laser spot. To address the issue, we replaced the K9-glass etalons with an FP etalon made of LT crystal. This modification successfully corrected the frequency drift and suppressed multiple-longitudinal mode (MLM) operation. Our findings provide valuable insights into the use of EO crystals for stabilizing SLM lasers, offering a promising approach for improving laser performance in precision applications.

2. Methodology for Frequency Correction and Design for EO FP Etalon

2.1. Principle of EO Frequency Modulation

The refractive index of EO crystals can vary with the applied electric field intensity. This property of EO crystals is called EO effect. The EO effect can be divided into linear and quadratic EO effects. EO frequency modulation in this paper used the linear EO effect.
The linear EO effect of an EO crystal can be expressed by the Formula (1), where m = 1,2, …,6, and k = 1,2,3. n m 0 are the crystal’s refractive indexes without any electric field. γ m k are the components of the linear EO coefficient tensor. E k is the applied electric-field intensity.
Δ 1 n 2 m = 1 n 2 m 1 n 2 m 0 = γ m k E k 1 / n 2 m 0 = 1 / n m 0 2   m = 1 , 2 , 3     0   m = 4 , 5 , 6
We computed the refractive-index change Δ 1 / n 2 m of an EO crystal in Formula (1) according to the crystal’s refractive-index ellipsoid equation. Formulas (2) and (3) are an EO crystal’s refractive-index ellipsoid equation before and after an electric field is applied to the crystal.
x 2 n 1 0 2 + y 2 n 2 0 2 + z 2 n 3 0 2 = 1
1 n 1 0 2 + γ 1 k E k x 2 + 1 n 2 0 2 + γ 2 k E k y 2 + 1 n 3 0 2 + γ 3 k E k z 2 + 2 γ 4 k E k y z + 2 γ 5 k E k x z + 2 γ 6 k E k x y = 1
Those two Formulas (2) and (3) are in the principal-axis coordinate system. According to Formula (2), the principal axes of the refractive-index ellipsoid with no electric field are in the directions of coordinate axes. n m = 1 , 2 , 3 0 are the EO crystal’s refractive indexes along the ellipsoid’s principal axes with no electric field.
In Formula (3), k takes on the value 1, 2, or 3. The value means that the electric field E k follows one coordinate axis to calculate the refractive-index variation quickly. After the electric field is applied to the EO crystal, if γ 4 k , 5 k , 6 k are all equal to zero, the ellipsoid’s three principal axes still follow the coordinate axes. In this case, Formula (3) can be transformed into
x 2 n 1 2 + y 2 n 2 2 + z 2 n 3 2 = 1 1 n m 2 m = 1 , 2 , 3 = 1 n m 0 2 + γ m k E k ,
where n m = 1 , 2 , 3 are the EO crystal’s refractive indexes along the x , y , and z axes in an electric field of E k .
With Taylor expansion on the second equation in Formula (4), n m = 1 , 2 , 3 can be written as Formula (5).
n m = 1 , 2 , 3 = n m 0 1 2 n m 0 3 γ m k E k
Based on the Formula (5), the EO crystal’s refractive index change is
Δ n m = 1 , 2 , 3 = n m n m 0 = 1 2 n m 0 3 γ m k E k   .
Finally, when we give the EO crystal an external electric field E k , the frequency variation of the oscillating longitudinal mode is as the Formula (7) describes. In this formula, L is the laser’s optical oscillator length, l is the physical length of the EO crystal, ν 0 is the original frequency of the oscillating longitudinal mode, and N is this mode’s order number.
Δ ν = N c 2 L + l Δ n m = 1 , 2 , 3 c 2 L ν 0 l 2 L n m 0 3 γ m k E k ,   m = 1 , 2 , 3

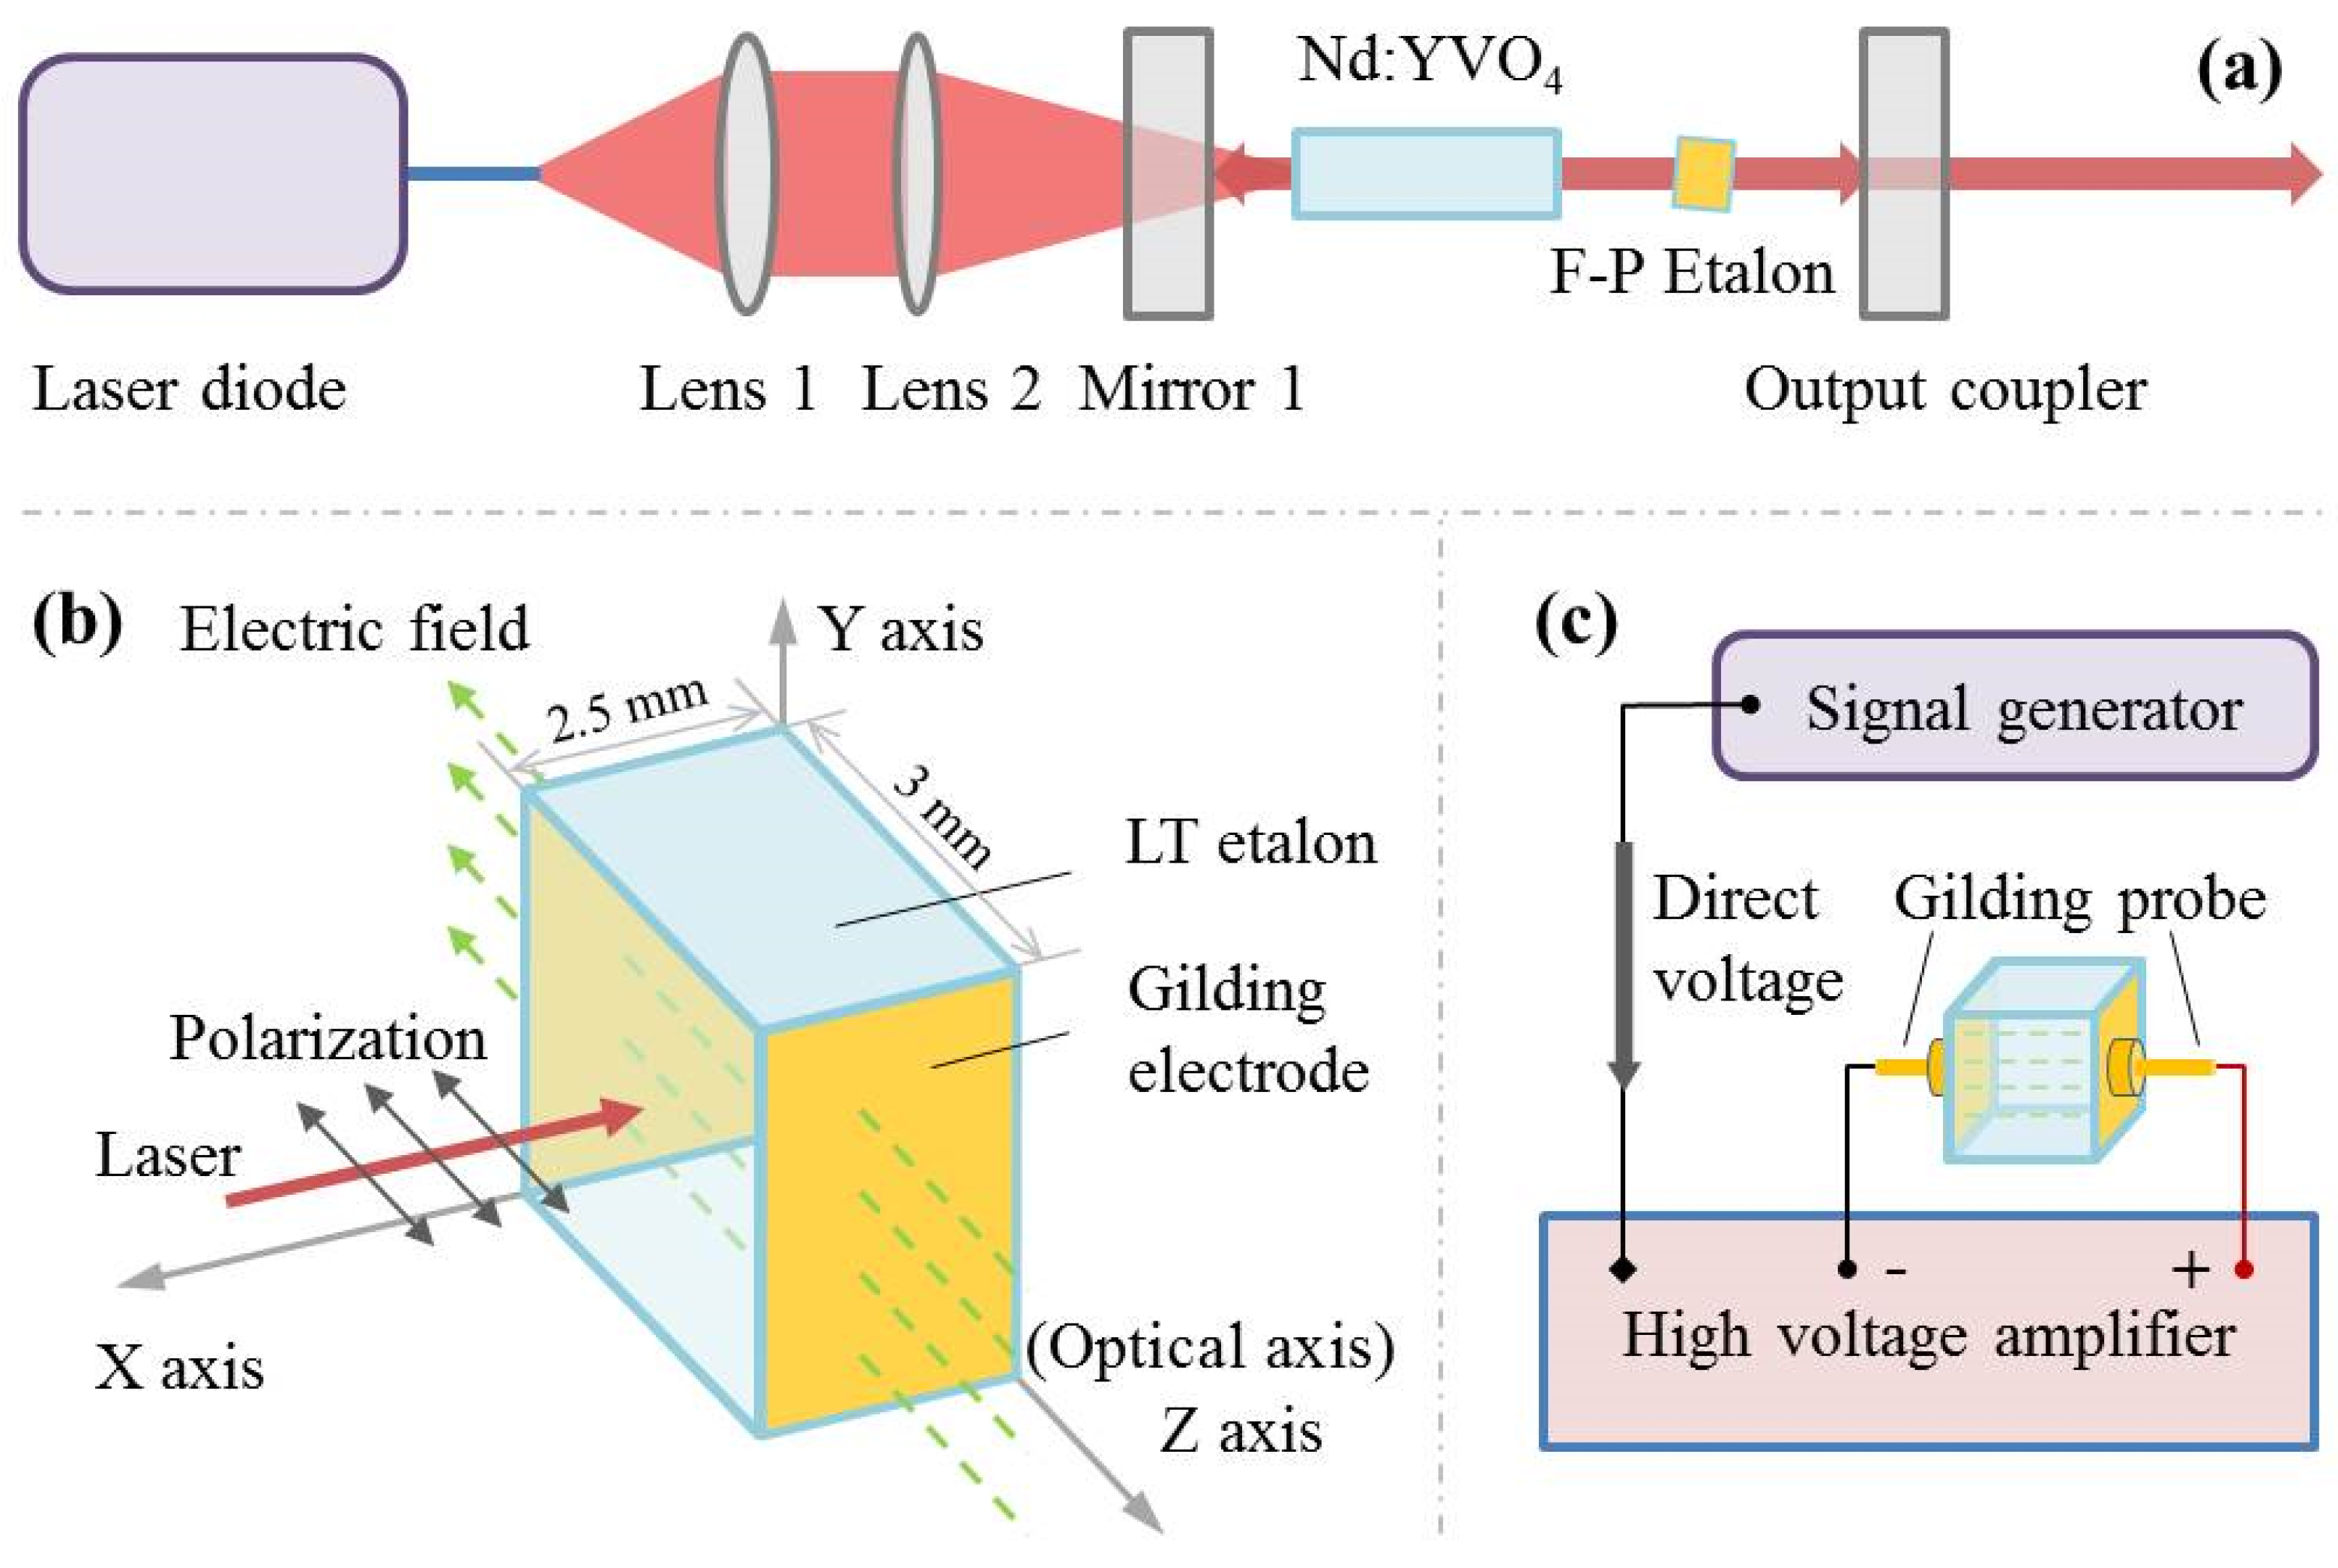
2.2. Design for the EO Crystal Used in This Study

EO crystals of different crystal classes have different linear EO coefficient tensors. According to Formula (3), at least one column of the linear EO coefficient tensor γ meets the condition that γ 4 k , 5 k , 6 k all equal zeros. This condition can preclude the principal axes of the refractive index ellipsoid from deviating from coordinate axes. The deviation will make it challenging to compute the crystal’s refractive index change. On the other hand, only crystals without a center of symmetry possess the linear EO effect. Therefore, only crystals of several crystal classes can be involved in EO frequency modulation, including C2v-mm2, C3v-3m, C4v-4mm, etc.
We chose LT crystal in this experiment. The LT crystal belongs to the C3v-3m crystal class. The Formula (8) is the LT crystal’s linear EO coefficient tensor.
γ = 0 γ 22 γ 13 0 γ 22 γ 13 0 0 γ 33 0 γ 51 0 γ 51 0 0 γ 22 0 0
The tensor components γ 43 , 53 , 63 are equal to zeros, fulfilling the abovementioned condition. As a result, this crystal requires an electric field along the z-axis ( E 3 ) in EO frequency modulation.
LT crystal is uniaxial, and its optic axis is also along the z-axis. Its refractive indexes without any electric field applied to it are n 1 0 = n 2 0 = n o and n 3 0 = n e . n o and n e are the LT crystal’s refractive indexes for laser with polarization perpendicular to and parallel to the crystal’s optic axis (z-axis), respectively. According to Formula (7), when we provide an electric field E 3 for an LT crystal, the crystal’s refractive index change is explicitly expressed as Formula (9).
Δ n 1 = 1 2 n o 3 γ 13 E 3 Δ n 2 = 1 2 n o 3 γ 13 E 3 Δ n 3 = 1 2 n e 3 γ 33 E 3
For the LT crystal, n e 3 γ 33 is higher than n o 3 γ 13 , so we chose the laser with polarization on the z-axis. With the LT crystal, the frequency differentiation of the oscillating longitudinal mode from the EO frequency modulation is
Δ ν = ν 0 l 2 L n e 3 γ 33 E 3 = ν 0 n e 3 γ 33 l U 2 L d ,
where U is the voltage applied on the LT crystal and d is the distance between electrodes for voltage application.
When the EO crystal is used as an EO etalon, the voltage applied to the EO crystal will also change the position of the etalon’s transmission peaks. The shift value of one peak’s central frequency is as Formula (11) presents. ν 1 is the central frequency of the EO etalon’s transmission peak.
Δ ν E = ν 1 n e 2 γ 33 U 2 d

3. Experimental Schemes for a SLM Laser and Its Frequency Correction

We constructed an all-solid-state Nd:YVO4 SLM laser. The laser’s experimental scheme is shown in Figure 1a. The laser included a pumping system, an optical oscillator, a gain medium, and an SLM-selection element.
The laser’s pumping system comprised a pump source, a coupling fiber, and a pair of convex lenses. The pump source is an 808 nm laser diode (P4-050-0808.3-0.5-A-R01-S0119, nLIGHT) with the highest pump power of 50 W. The pump light was coupled into a fiber with a numerical aperture of 0.22 and a diameter of 400 μm. Two convex lenses collimated and expanded the pumping beam from the fiber. The focal lengths of these two convex lenses are 30 mm (Lens 1) and 60 mm (Lens 2). The distance between the two lenses was 220 mm. The fiber pigtail stood near Lens 1’s focus. The pump spot at the focus of Lens 2 was 0.76 mm in diameter.
The laser had a plane oscillator. The oscillator’s first cavity mirror (Mirror 1) was coated with an 808 nm antireflection (AR) and 1064 nm high-reflectivity (HR) film. The oscillator’s output coupler was coated with an 808 nm antireflection (AR) and 1064 nm 90%-reflectivity film. Both mirrors were 12.7 mm in diameter. The optical length of the laser’s oscillator was 61 mm, and the laser’s frequency separation between two consecutive longitudinal modes was 2.46 GHz.
The gain medium of the SLM laser was a 10 × 3 × 3 mm3 Nd:YVO4 crystal, with 8 mm doped of 0.3 at% Nd3+ and 2 mm undoped. The crystal’s end faces were coated with 1064 nm and 808 nm antireflection coatings. This crystal was wrapped in Indium foil and mounted in a copper heat sink. A thermoelectric cooler (TEC) controlled the heat sink’s temperature to 25 °C.
Three FP etalons were inserted into the laser oscillator separately as the SLM-selection element. Two FP etalons were made of K9 glass, 2.5 mm in thickness and 12 mm in diameter. The reflectivity of these two FP etalons at 1064 nm wavelength was 4% and 80%.
The third FP etalon was made of an LT crystal. Details about the LT etalon are presented in Figure 1b. The LT crystal’s EO coefficient γ33 is 30.4 pm/V. The LT crystal was 2.5 × 3 × 3 mm3, 2.5 mm in lightpath direction. Its reflectivity was also 4%. The two sides of the LT etalon were plated with gold electrodes (painted in yellow in Figure 1b). Those two sides were perpendicular to the z-axis, and the distance between the two gold electrodes was 3 mm. The electric field applied on the LT etalon was in the direction of the z-axis. The laser’s polarization was also in the direction of the z-axis. Figure 1c represents the voltage application on the LT etalon. A signal generator provided a direct-voltage signal. A high-voltage amplifier amplified the voltage signal. The amplified voltage was then loaded onto the LT etalon through gold-plated probes.

4. Experimental Results and Discussion

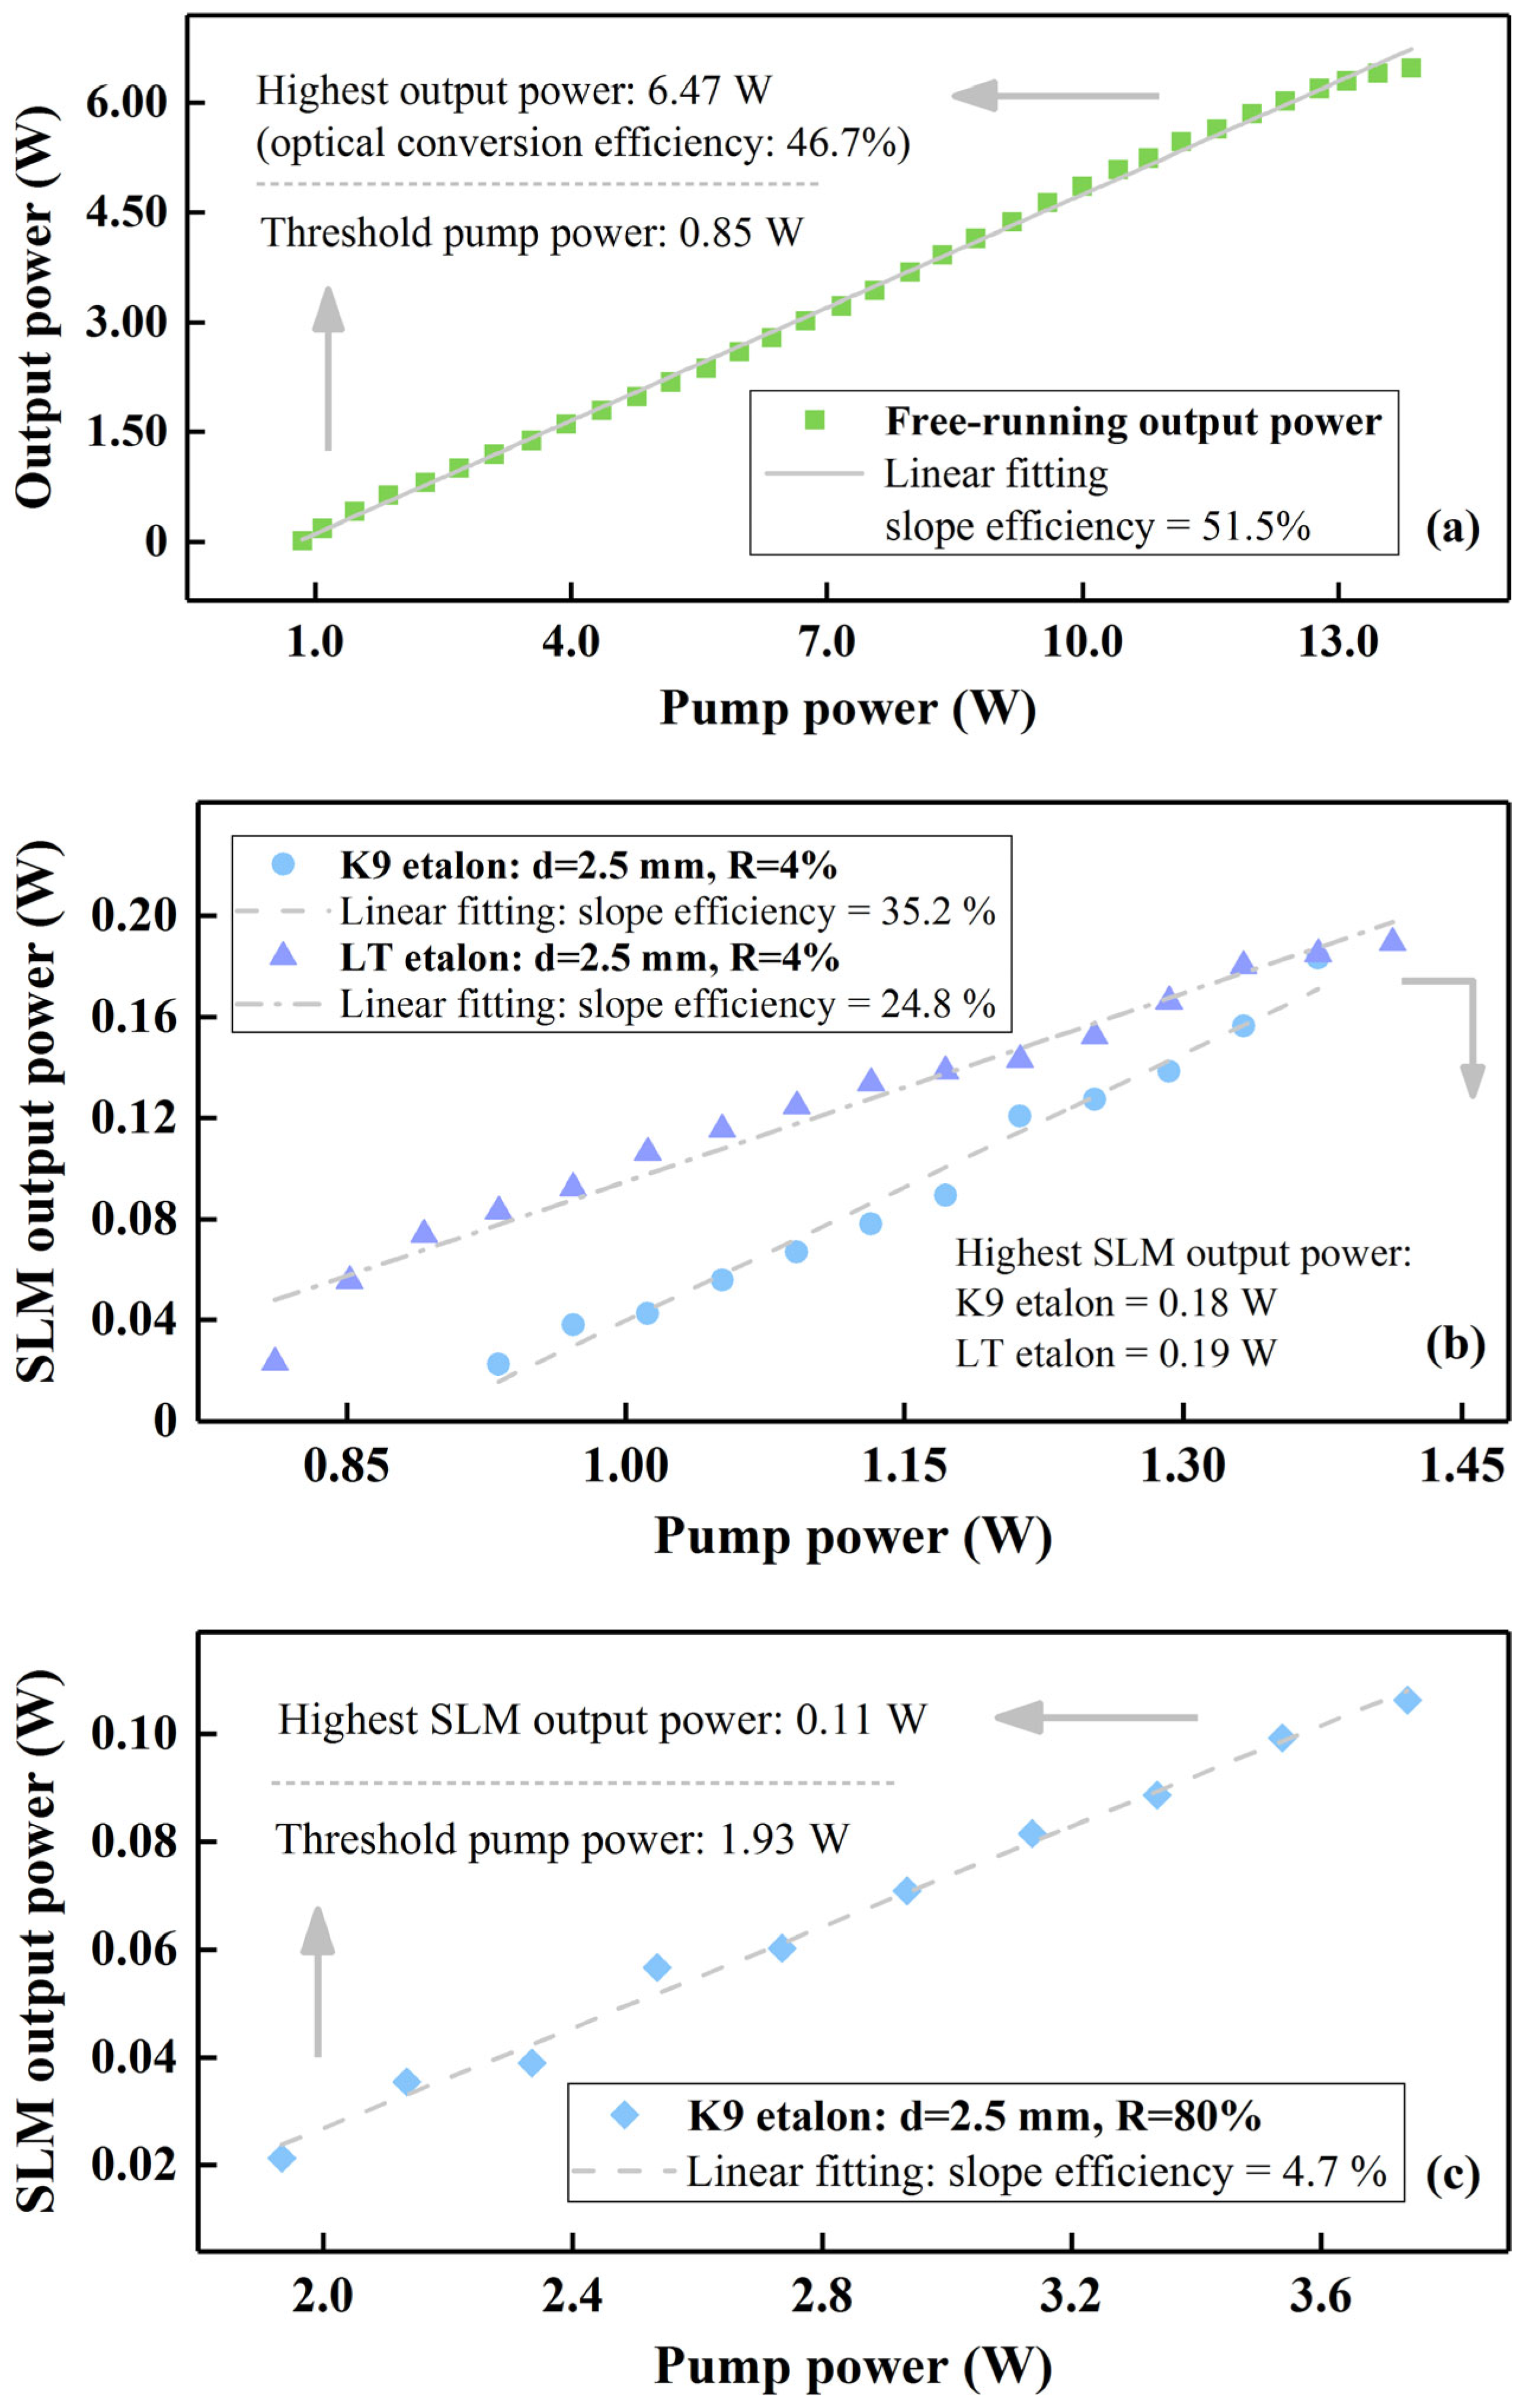
4.1. Output Power of the SLM Nd:YVO4 Laser

Figure 2 provides the output-power results of the all-solid-state Nd:YVO4 laser at free-running and SLM oscillation. One power meter (PM400, THORLABS) measured all power in this experiment.
The conversion efficiency from pump light to free-running laser was 46.7%. The gray line in Figure 2a is the linear fitting of the free-running output power. The laser’s slope efficiency at free-running oscillation was 51.5%, equivalent to the gradient of the fitting line.
Figure 2b gives the SLM output power of the Nd:YVO4 laser after a 4%-reflectivity FP etalon was inserted into the oscillator. Circles and triangles in Figure 2b signify the SLM laser output with FP etalons made of K9 glass and LT crystal, respectively. The threshold pump power for SLM oscillation was 0.93 W (K9 etalon) and 0.81 W (LT etalon). The threshold value of the pump power with a 4%-reflectivity LT etalon was lower than that at free-running operation. This decline was because the frequency of the first-oscillating longitudinal mode changed after the LT etalon was put into the oscillator, and subsequently, the mode’s gain increased. The highest SLM output power from two FP etalons was at close levels, 0.18 W (K9 etalon) and 0.19 W (LT etalon).
The gray dash-dot and dotted lines in Figure 2b were the linear fittings of the SLM output power, respectively, from K9 glass and LT crystal etalons. Both slope efficiencies (35.2% with K9 etalon and 24.8% with LT etalon) were smaller than that in the free-running condition due to the insertion loss of two FP etalons [17,18,19]. The slope efficiency with LT etalon was not as high as that with K9 etalon because the LT crystal absorbed a 1064 nm laser [20].
In Figure 2c, the blue diamonds denote the SLM laser power when the K9-glass etalon of 80% reflectivity was placed in the laser’s oscillator. In this case, the laser’s threshold pump power rose to 1.93 W, more than twice that with the 4%-reflectivity K9 etalon. This increase also resulted from the insertion loss of the 80%-reflectivity FP etalon.
When the tilted angle of the 80%-reflectivity etalon was lower than 1°, the etalon, together with the first cavity mirror, constituted a second oscillator in the laser. The formation of the second oscillator made it difficult for us to achieve SLM operation in the laser. Different series of longitudinal modes from two oscillators oscillated simultaneously, and we could not inhibit the oscillation of the modes from the second oscillator. To avoid the occurrence of the second oscillator, we adjusted the angle of the 80%-reflectivity FP etalon to larger than 2°. Thus, the insertion loss induced by this FP etalon climbed.
Another consequence of the increasing insertion loss from the 80%-reflectivity etalon was a low slope efficiency (4.7%) for SLM laser power. This slope efficiency is from the linear fitting, displayed as a gray dotted line in Figure 2c.
The highest SLM laser output with the 80%-reflectivity K9-glass FP etalon was 0.11 W. This power value was lower than that with the 4%-reflectivity FP etalons, as the second longitudinal mode oscillated earlier at a high pump power owing to the spatial hole burning.
We acknowledged the significant difference in power output between the free-running laser and the SLM laser with FP etalons shown in Figure 2. On the one hand, this difference was due to the insertion loss introduced by the FP etalons, which reduced the overall power of the laser. On the other hand, the single mode-selecting element had a limited capacity for longitudinal mode suppression. To simplify the laser structure, we employed only one mode-selecting component—an etalon. With the pumping power increasing, the laser transitioned to the multi-longitudinal mode operation. Consequently, the power disparity between free-running and SLM operation became prominent.

4.2. Output Power Fluctuation and Longitudinal Mode Shift of the SLM Laser

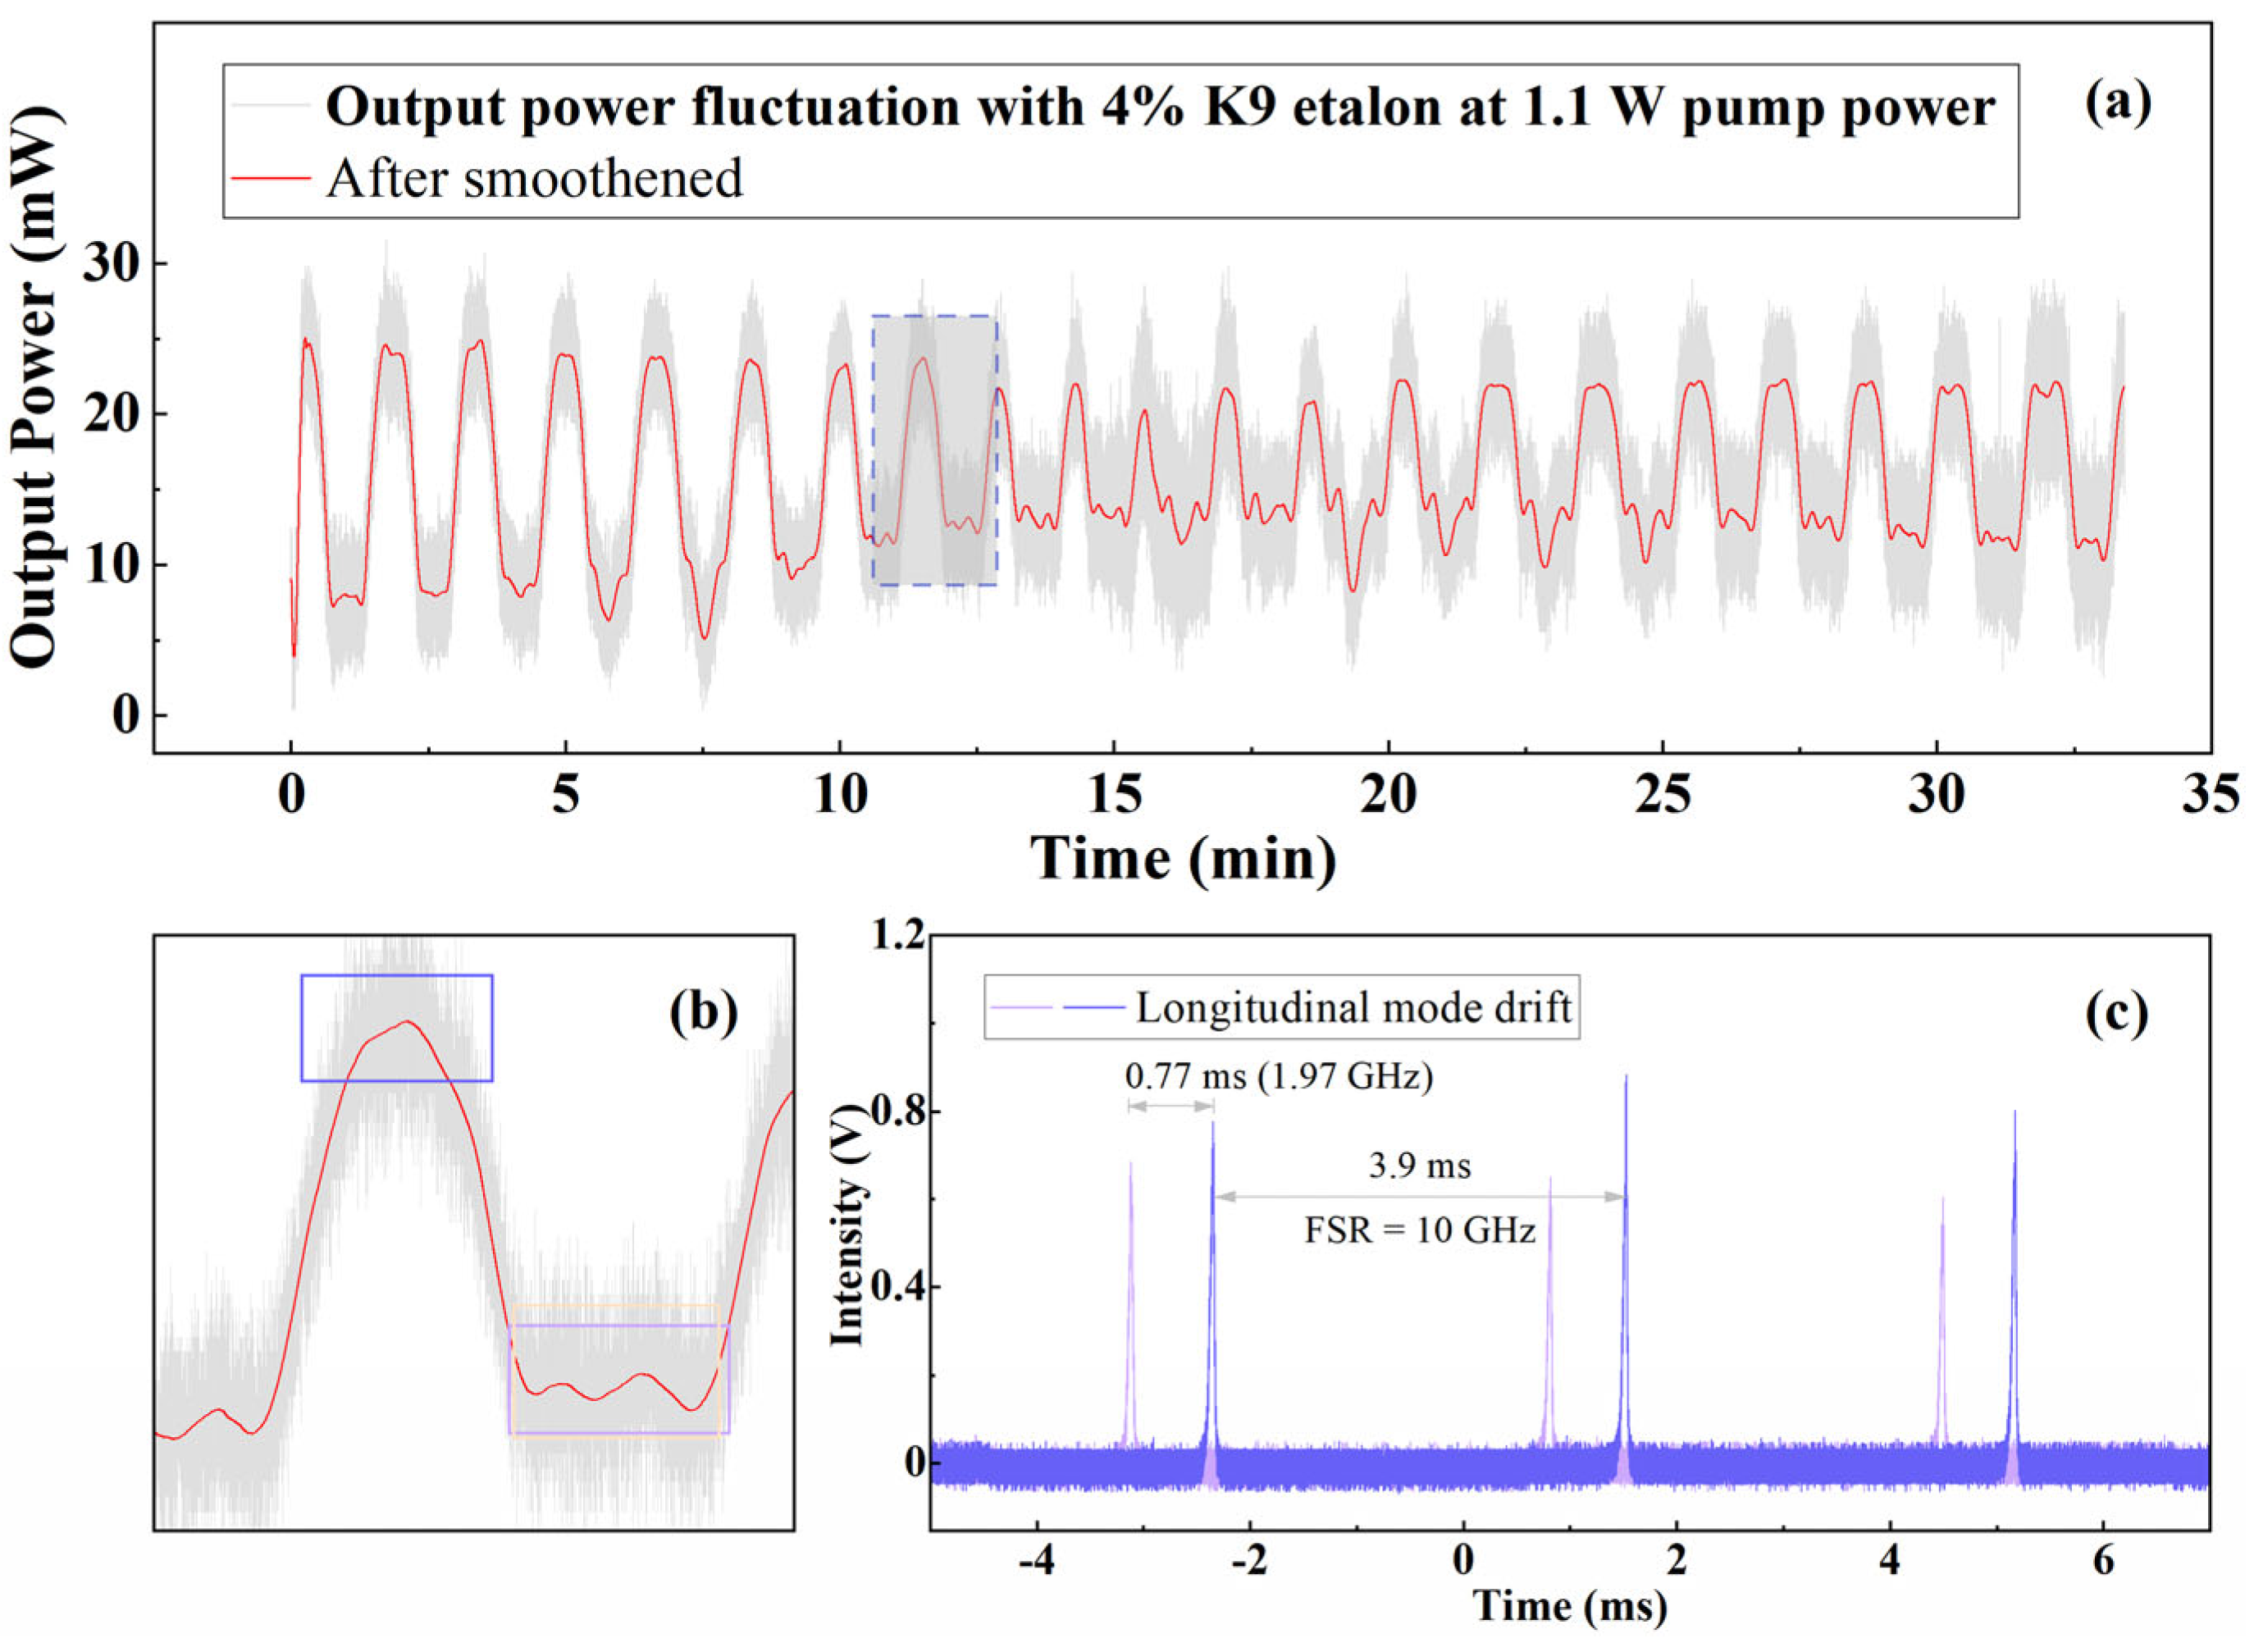
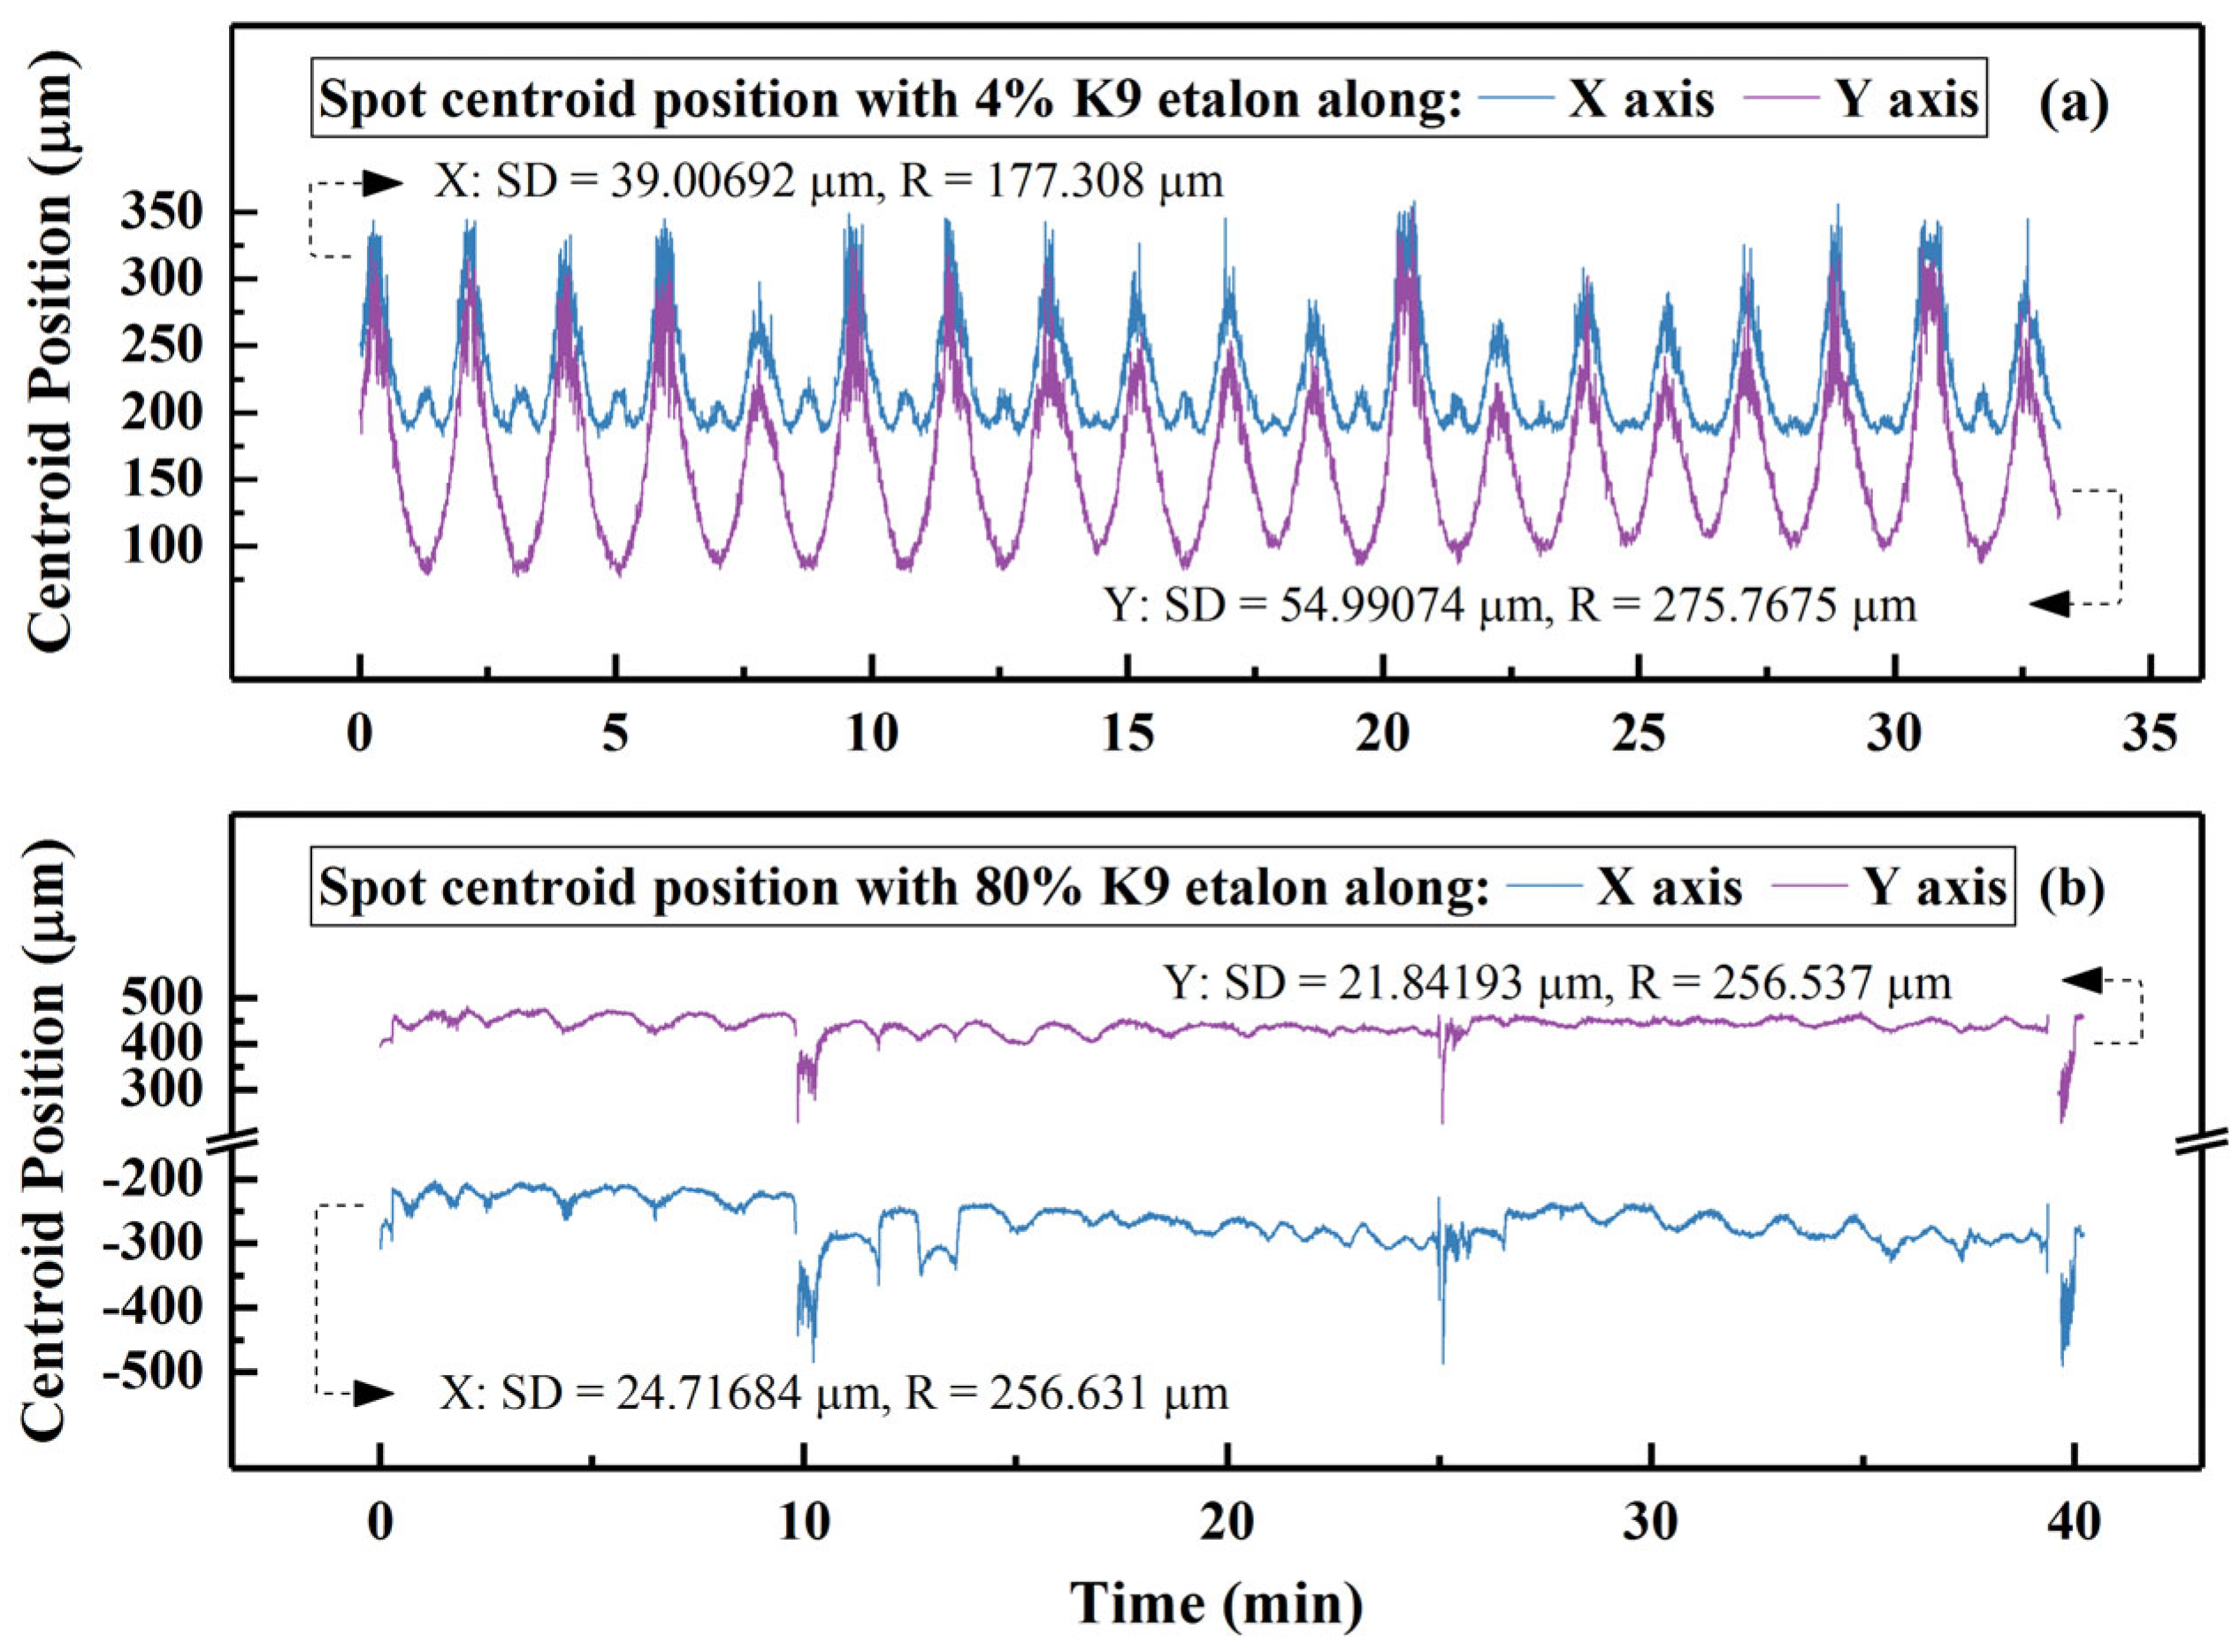
4.2.1. Results About Output Power Fluctuation and Longitudinal Mode Drift

In the process of SLM power measurement in Figure 2, we observed the longitudinal mode drift and the resulting output power fluctuation. Then, we recorded these two changes with the insertion of 4% and 80% reflectivity K9 etalons in the laser. The results in those two conditions are plotted in Figure 3.
In Figure 3a,d, gray lines represent the output power fluctuation, and, for clear reading, red lines are 2000 points Savitzky–Golay smooth of the output power. The output power fluctuation with 4% reflectivity K9-glass etalon was captured at the pump power of 1.1 W. From Figure 3a, this fluctuation had quasi-periodicity, and its period was about 1.5 min. Figure 3b was the partially enlarged drawing of Figure 3a in one period. The laser was at SLM operation at the peak and valley of Figure 3b (covered by purple and pink frames, respectively). Nevertheless, the oscillating longitudinal modes at two moments were not the same longitudinal mode, as depicted in Figure 3c. Those two longitudinal modes oscillated simultaneously during the intervals between peak and valley values in Figure 3b. We adopted a Fabry–Perot interferometer to measure the waveform of longitudinal modes. The free spectral range (FSR) of the Fabry–Perot interferometer was 10 GHz, and the corresponding measurement time was 3.9 ms. As the measured time difference between the two longitudinal modes Figure 3c was 0.77 ms, the calculated frequency difference was 1.97 GHz.
The power fluctuation with 80% reflectivity etalon was different. For nearly 40 min of measurement in Figure 3d, the output power dropped drastically at three moments. We captured an apparent longitudinal-mode drift in 10–25 min, as displayed in Figure 3e. A mode-hop occurred after the oscillating longitudinal mode continuously drifted 0.66 GHz. The frequency separation between the two longitudinal modes was 2.05 GHz.

4.2.2. Qualitative Analysis of Output Power Fluctuation and Longitudinal Mode Drift

In measuring the Nd:YVO4 laser’s SLM output power, we observed the spontaneous drift of the oscillating longitudinal-mode frequency. We argued that the immediate cause of longitudinal mode drift was the change in the optical path length.
That optical path length variation changed the frequency spacing between adjacent longitudinal modes. The frequency and consequent gain of these longitudinal modes changed accordingly. The mode gain was also subjected to the modulation from the FP etalons. All the longitudinal modes passing through the transmission peaks might oscillate if their gain exceeds the threshold value. A 2.5-mm thick FP etalon had a 38-GHz FSR, so the Nd:YVO4’s gain bandwidth covered at least seven transmission peaks of the etalon. In Figure 3c,e, the frequency differences between the longitudinal modes were lower than the laser’s longitudinal mode spacing. This meant that the ever-oscillating longitudinal modes were not adjacent and inter-FSR. On the other hand, longitudinal mode drift and FP etalon modulation contributed to the output power fluctuation in Figure 3a,d.
The optical path-length change mainly ensued from the heat deposited in the Nd:YVO4 crystal [21,22]. The heat came from quantum defect as well as various losses of pump light and oscillating laser, such as absorption loss and scattering loss. That heat failed to be conducted to the heat sink around the Nd:YVO4 crystal, forming a refractive index gradient in the crystal. In this way, the optical path length changed. For the 1064 nm laser in the paper, the frequency of the oscillating longitudinal mode will change by 6 GHz when the optical path length changes by 1 μm.

4.2.3. Experimental Verification About Optical Path-Length Change and Heat Deposition

To verify our notion of optical path-length change and heat deposition, we first gauged the centroid position changes of the output beam spot along the x- and y-axes at the laser’s free-running operation by a beam profiler (BP209-VIS/M, THORLABS). The centroid was the geometrical center of a beam spot.
Specifically, we recorded the centroid positions of the output laser spot in the x- and y-axes directions with the pump current 1.8, 2.0, 2.2, 2.4, and 2.6 A. The spot centroid positions along two axes were measured at the same time. We also calculated the standard deviation (SD) and range (R) at every pump current. R was the difference between maximum and minimum values, written in gray in Figure 4a,b.
Figure 4a,b show that the output-laser spot centroid positions along the x- and y-axes have the same trends. Firstly, with the pump current increasing, the centroid of the laser spot gradually moves away. The movement distance on the x-axis (200 μm) is about twice that on the y-axis. The centroid position movements corresponded to 0.82 μm optical path-length variation. The pump power’s growth led to more deposition of waste heat in the Nd:YVO4 crystal and consequent variation in optical path length.
Secondly, the periodicity of the centroid position, regardless of it being parallel to the x- or y-axis, becomes apparent after the pump current reaches 2.2 A. Every period is around two minutes. The period pertained to the TEC’s cooling efficiency and the Nd:YVO4’s thermal conductivity.
Furthermore, the R and SD of the 1.8A pump current exceed those of other pump currents, owing to mode competition near the threshold pump power. At every pump current, the y-axis’s range is more extensive than that of the x-axis. This is because the imperfect heat-sink structure impaired heat dissipation for the crystal in the y-axis.
On the other hand, as the current increased, the variation in the centroid position reduced generally. This trend existed throughout the entire process of the current increase, and we selected several currents to demonstrate this trend.
Figure 5 provides spot centroid-position changes after the insertion of K9 FP etalons into the oscillator of the Nd:YVO4 laser. The centroid-position results with 4% (Figure 5a) and 80%-reflectivity (Figure 5b) were recorded at 1.83 A and 2.40 A pump currents. Blue and purple lines signify the output spot’s centroid positions in the x-axis and y-axis directions, respectively. We worked out the SD and R of those parameters in Figure 5a,b.
As demonstrated in Figure 5a, after the K9 FP etalon with 4% reflectivity was inserted into the laser, the x-axis and y-axis centroids of the output laser spot still moved periodically. The periods of those two centroids approximate that of the output power with the insertion of the same FP etalon. In Figure 5b, the spot centroid with the 80%-reflectivity etalon had a trend similar to that of the output power with the same etalon.
Compared with the cases without any FP etalon, the range and the standard deviation of spot centroid position with FP etalons are higher. This rise shows that after the etalon was placed into the laser, the etalon’s refraction to the laser and modulation on the longitudinal mode gain aggravated the optical path change.

4.2.4. LT Etalon’s Compensation for Optical Path-Length Change

To maintain the laser’s SLM operation, we replaced the K9 etalon with an LT etalon. A 160V voltage was applied to the LT etalon to generate SLM oscillation at the beginning. The light green and orange waveforms in Figure 6a are the oscillating modes before and after longitudinal mode drift, respectively. This drift of about 0.19 GHz happened and a second longitudinal mode oscillated during the first 25 s in Figure 6b. In this interval, the laser spot’s centroid positions along the x- and y-axes move down slightly, as Figure 6b records. In the next 15 s, we changed the voltage on LT etalon to −240 V. The bottle green line in Figure 6b demonstrates that the SLM oscillation returned while another 0.06 GHz drift developed relative to MLM operation.
According to Formula (10), a voltage difference of 400 V could bring about a 0.05 μm change in the laser’s optical path and a 0.23 GHz frequency shift for one longitudinal mode. From Formula (11), the same voltage also caused about 2.6 GHz movement of the LT etalon’s transmission peaks. The movement also contributed to the SLM operation in the last 15 s in Figure 6b. On the other hand, the duration of the SLM oscillation was shorter than that of the K9 etalon with the same reflectivity, due to the absorption of the LT crystal to the laser.

5. Conclusions

In this study, we researched the reason for the frequency drift of the oscillating longitudinal mode in an SLM laser. An LT etalon was designed to achieve original SLM oscillation and correct the frequency drift. The 400 V voltage applied to the LT etalon in 15 s restored the laser to SLM oscillation. Nevertheless, we supplied the voltage based on the longitudinal mode waveforms. In the next research, a frequency-feedback system will be developed to compensate for the mode’s frequency drift. The system will monitor the frequency of the oscillating longitudinal mode in real time and apply a more accurate voltage to the LT etalon. We hope that the study could provide a reference for researchers on applying EO crystals in the frequency stabilization of SLM lasers.

Author Contributions

Validation, X.C.; data curation, Z.L.; writing—original draft preparation, X.C.; writing—review and editing, R.Y.; visualization, Z.L.; supervision, Y.J. and R.F.; project administration, X.L.; funding acquisition, Y.J., R.F. and X.L. All authors have read and agreed to the published version of the manuscript.

Funding

National Natural Science Foundation of China (62375066, 62192774, 62305085), Natural Science Foundation of Tianjin, China (22JCZDJC00080, 22JCYBJC00520).

Institutional Review Board Statement

Not applicable.

Informed Consent Statement

Not applicable.

Data Availability Statement

The raw data supporting the conclusions of this article will be made available by the authors on request.

Conflicts of Interest

The authors declare no conflict of interest.

References

  1. Wu, Q.; Zhang, B.; Wang, H.; Peng, J. On the Communication Performance of Airborne Distributed Coherent Radar. Appl. Sci. 2022, 12, 6351. [Google Scholar] [CrossRef]
  2. Wei, T.W.; Xia, H.Y.; Wu, K.N.; Yang, Y.J.; Liu, Q.; Ding, W.D. Dark/bright band of a melting layer detected by coherent Doppler lidar and micro rain radar. Opt. Express 2022, 30, 3654–3663. [Google Scholar] [CrossRef]
  3. Liang, C.; Wang, C.; Xue, X.H.; Dou, X.K.; Chen, T.D. Meter-scale and sub-second-resolution coherent Doppler wind LIDAR and hyperfine wind observation. Opt. Lett. 2022, 47, 3179–3182. [Google Scholar] [CrossRef]
  4. Zhang, Y.; Han, Y.; Yu, R.N.; Yang, Z.; Wang, Z.J.; Zhang, J.L. Pose Measurement and Motion Estimation of Space On-Orbit CubeSats Based on Micro-Doppler Effect Using Laser Coherent Radar. Appl. Sci. 2022, 12, 4021. [Google Scholar] [CrossRef]
  5. Ding, Y.C.; Wu, B.; Shen, Y.H. Acousto-optic frequency shifted comb laser-based micro-Doppler detection for moving target identification. J. Opt. Soc. Am. A-Opt. Image Sci. Vis. 2021, 38, 844–854. [Google Scholar] [CrossRef]
  6. Ramachandra Kurup, A.; Rozban, D.; Abramovich, A.; Yitzhaky, Y.; Kopeika, N. Millimeter-Wave Imaging with Range-Resolved 3D Depth Extraction Using Glow Discharge Detection and Frequency-Modulated Continuous Wave Radar. Appl. Sci. 2025, 15, 2248. [Google Scholar] [CrossRef]
  7. Schulz, P.A.; Henion, S.R. Frequency-modulated Nd-YAG Laser. Opt. Lett. 1991, 16, 578–580. [Google Scholar] [CrossRef]
  8. Freitag, I.; Kropke, I.; Tunnerman, A.; Welling, H. Electrooptically fast tunable miniature diode pumped Nd:YAG ring laser. Opt. Commun. 1993, 101, 371–376. [Google Scholar] [CrossRef]
  9. Guo, X.M.; Wang, X.Y.; Li, Y.M.; Zhang, K.S. Quantum noise limited tunable single-frequency Nd:YLF/LBO laser at 526:5 nm. Appl. Opt. 2009, 48, 6475–6478. [Google Scholar] [CrossRef]
  10. Xu, X.R.; Li, X.D.; Yan, R.P.; Ma, Y.F.; Dong, Z.W.; Fan, R.W.; Chen, D.Y. 2.4 THz/s continuously linearly frequencymodulated Nd: YVO4 laser. Opt. Express 2017, 25, 23199–23206. [Google Scholar] [CrossRef]
  11. Xu, X.; Fan, R.; Li, X.; Ma, Y.; Yan, R.; Wang, X.; Chen, Z.; Zhou, Z.; Chen, D. 14  GHz broadband and continuously frequency-tuned Nd:YVO4 laser with an RTP etalon. Appl. Opt. 2018, 57, 2287–2291. [Google Scholar] [CrossRef]
  12. Zheng, Y.; Lu, H.; Li, Y.; Zhang, K.; Peng, K. Broadband and rapid tuning of an all-solid-state single-frequency Nd:YVO4 laser. Appl. Phys. B-Lasers Opt. 2008, 90, 485–488. [Google Scholar] [CrossRef]
  13. Lin, J.; Farajollahi, S.; Fang, Z.; Yao, N.; Gao, R.; Guan, J.; Deng, L.; Lu, T.; Wang, M.; Zhang, H.; et al. Electro-optic tuning of a single-frequency ultranarrow linewidth microdisk laser. Adv. Photonics 2022, 4, 036001. [Google Scholar] [CrossRef]
  14. Li, J.H.; Chen, K.X. Electro-optic tunable grating-assisted optical waveguide directional coupler in lithium niobate. Appl. Phys. B 2023, 129, 39. [Google Scholar] [CrossRef]
  15. Xiong, J.; Deng, C.; Fu, X. Tunable continuous-wave Yb: GdCOB laser with an electro-optic crystal. Laser Phys. 2023, 33, 055003. [Google Scholar] [CrossRef]
  16. Deng, L.-M.; Lin, S.-S.; Pham, T.-D.; Chen, Y.-H. Optimized domain-engineered lithium niobate for electro-optic spectral tuning in a multi-wavelength optical parametric oscillator. Opt. Commun. 2025, 574, 131129. [Google Scholar] [CrossRef]
  17. Yang, H.; Jin, P.; Su, J.; Xu, X.; Xu, J.; Lu, H. Realization of a continuous-wave single-frequency tunable Nd:CYA laser. Chin. Opt. Lett. 2022, 20, 031403. [Google Scholar] [CrossRef]
  18. Jin, P.; Xie, Y.; Cao, X.; Su, J.; Lu, H.; Peng, K. Modulation-Noise-Free Continuously Tunable Single-Frequency CW Ti:Sapphire Laser With Intracavity-Locked Birefringent Etalon. IEEE J. Quantum Electron. 2022, 58, 1700106. [Google Scholar] [CrossRef]
  19. Jin, P.; Cui, Y.; Su, J.; Lu, H.; Peng, K. Continuously tunable CW single-frequency Nd:YAP/LBO laser with dual-wavelength output. Chin. Opt. Lett. 2023, 21, 021403. [Google Scholar] [CrossRef]
  20. Wang, C.; Li, Z.; Riemensberger, J.; Lihachev, G.; Churaev, M.; Kao, W.; Ji, X.; Zhang, J.; Blesin, T.; Davydova, A.; et al. Lithium tantalate photonic integrated circuits for volume manufacturing. Nature 2024, 629, 784–790. [Google Scholar] [CrossRef]
  21. Qiao, S.; He, Y.; Sun, H.; Patimisco, P.; Sampaolo, A.; Spagnolo, V.; Ma, Y. Ultra-highly sensitive dual gases detection based on photoacoustic spectroscopy by exploiting a long-wave, high-power, wide-tunable, single-longitudinal-mode solid-state laser. Light Sci. Appl. 2024, 13, 100. [Google Scholar] [CrossRef] [PubMed]
  22. Chen, C.; Gao, C.; Wang, Q. Injection-seeded 10 kHz repetition rate Er:YAG solid-state laser with single-frequency pulse energy more than 1 mJ. Opt. Express 2022, 30, 16044–16052. [Google Scholar] [CrossRef] [PubMed]
Figure 1. The experimental schemes include (a) all-solid-state Nd:YVO4 SLM laser, (b) details of LT etalon, and (c) voltage application for LT etalon.
Applsci 15 03813 g001
Figure 2. The output-power results of the all-solid-state Nd:YVO4 laser at (a) free-running and (b,c) SLM oscillation.
Applsci 15 03813 g002
Figure 3. The laser’s output power fluctuation and longitudinal mode shift with (ac) 4% and (d,e) 80% K9 etalon.
Applsci 15 03813 g003aApplsci 15 03813 g003b
Figure 4. The centroid position changes of the output beam spot along the (a) x- and (b) y-axes at the laser’s free-running operation, including standard deviation (right y-axis) and range (gray words) at every pump current.
Applsci 15 03813 g004
Figure 5. The laser’s spot centroid positions after the insertion of 4% (a) and 80% (b) K9 FP etalons: SD, standard deviation; R, range.
Applsci 15 03813 g005
Figure 6. LT etalon’s (a) suppression on the second longitudinal mode and (b) compensation for optical path−length change with a 400 V voltage difference.
Applsci 15 03813 g006
Disclaimer/Publisher’s Note: The statements, opinions and data contained in all publications are solely those of the individual author(s) and contributor(s) and not of MDPI and/or the editor(s). MDPI and/or the editor(s) disclaim responsibility for any injury to people or property resulting from any ideas, methods, instructions or products referred to in the content.

