Article

Assessment of Energy Use and Photovoltaic Energy Potential in Saudi Arabian Governmental Schools

by
Radwan A. Almasri
1,*,
Ahmad Eid
2,
A. F. Almarshoud
2 and
F. H. Almotairy
3
1
Department of Mechanical Engineering, College of Engineering, Qassim University, Buriadah 51452, Saudi Arabia
2
Department of Electrical Engineering, College of Engineering, Qassim University, Buriadah 51452, Saudi Arabia
3
National Grid Company, Buraydah 51452, Saudi Arabia
*
Author to whom correspondence should be addressed.
Appl. Sci. 2025, 15(7), 3809; https://doi.org/10.3390/app15073809
Submission received: 16 December 2024 / Revised: 27 February 2025 / Accepted: 5 March 2025 / Published: 31 March 2025
(This article belongs to the Section Energy Science and Technology)

Abstract

:
Adopting photovoltaic (PV) systems in government schools across Saudi Arabia presents an opportunity to reduce energy costs and contribute to the country’s RE goals. In this paper, the energy consumption and energy consumption indicators of 3 schools in Qassim region (the central region of the Kingdom of Saudi Arabia) were determined. The integration of PV systems into the buildings of these schools was also studied to achieve zero energy and zero bills along the system’s life cycle. The analysis considered the effects of temperature and other factors on PV system output and a projected 1% annual increase in school load. Energy use intensity ranged from 22 to 48 kWh per square meter, while per capita energy use varied between 337 and 630 kWh. Values for end-use of electricity of 80%, 11%, and 9% were obtained for air conditioning, lighting, and others, respectively. The results note that the zero-energy scenario’s technical, economic, and environmental indicators are appropriate. The indicators in the zero-billing case were similar to the energy-zero scenario except for the payback period, which was longer and, in some cases, not economically feasible. The results show that economic evaluation must be revisited by reviewing the tariff value for selling surplus energy to the distribution network. The study also recommends scaling this model to other educational institutions, contributing to sustainable energy transitions in Saudi Arabia.

1. Introduction

The global shift toward renewable energy (RE) has intensified, with solar energy emerging as one of the most viable options for sustainable energy production. In countries with abundant sunlight, such as Saudi Arabia, photovoltaic (PV) systems hold great potential to contribute significantly to energy demands. The Kingdom’s Vision 2030 outlines ambitious goals for reducing reliance on fossil fuels and increasing the adoption of RE. A key area of interest is deploying solar PV systems in public institutions, including schools, which can serve as a model for sustainable energy consumption.
Government schools in the Kingdom of Saudi Arabia (KSA) are ideal candidates for PV integration due to their widespread presence and predictable energy usage patterns. Implementing PV systems in these institutions addresses the growing energy needs. It aligns with national goals of reducing carbon emissions, spreading awareness among students about the importance of benefiting from this resource, and enhancing energy security. However, while the environmental benefits of PV systems are evident, achieving “zero-bill” status—where schools generate enough electricity to offset their entire energy costs—requires a detailed techno-economic analysis.
Building energy efficiency is especially important for the education sector in the Arabian Gulf region because of the region’s high school-to-population ratio and harsh temperature, which require high energy consumption for ventilation and cooling. Even though various ways exist to improve indoor environmental quality, more energy is likely needed. Here comes the importance of using renewable sources, especially solar energy, for this purpose.
In 2023, 32,175,224 people lived in the KSA, 6.71 million pupils were enrolled in schools, and there were 31,412 school buildings. There are 24,075 government and 7337 private schools [1,2]. Saudi Arabia is seeing a steady rise in population, and immigration has accelerated. Article 30 of the fundamental law of governance, which states that “The State shall provide public education and shall be committed to combating illiteracy”, emphasizes the importance of education as a priority in the KSA [3]. In school buildings in Arar City, KSA, Alfaraidy and Sulieman [4] reported that the annual energy use intensity (EUI) ranged from 20.4 kWh/m2 to 38.8 kWh/m2 per year, and the yearly use for each person was between 122.5 and 233.0 kWh/capita. The Ministry of Education standardized school designs across the country, notwithstanding regional differences in climate. Unfortunately, most model school buildings are unsuitable for the distinct weather patterns in Saudi Arabia’s many locations, according to Alwetaishi and Balabel [5]. The prototype school building’s designers failed to recognize the importance of including environmental design concepts in their plans in the KSA. According to Abanomi [6], they only used conventional systems to improve the indoor environment and did not consider integrating RE systems.
To attain zero-energy and zero-bill status, the main objective of this study is to perform a thorough techno-economic-environmental analysis of installing on-grid PV systems in Saudi Arabian government schools. The research considers several variables, including the potential for solar energy, system design, installation and maintenance costs, financial incentives, economic viability, and environmental impacts. By examining these variables, the research offers a road map for the effective implementation of PV systems in educational institutions, emphasizing the possible advantages, difficulties, and prospects for financial savings for the education sector and the whole economy. The paper discusses the following main contribution points:
  • The PV rooftop integrations to three school buildings in the Qassim area with actual measurements and readings.
  • PV degradation and the expected increase in annual demand are considered in the current analysis.
  • Two zero-energy and zero-utility techniques along the system’s life cycle are analyzed and compared.
  • This analysis calculates and considers key indicators, such as EUI and CPC.

2. Literature Review
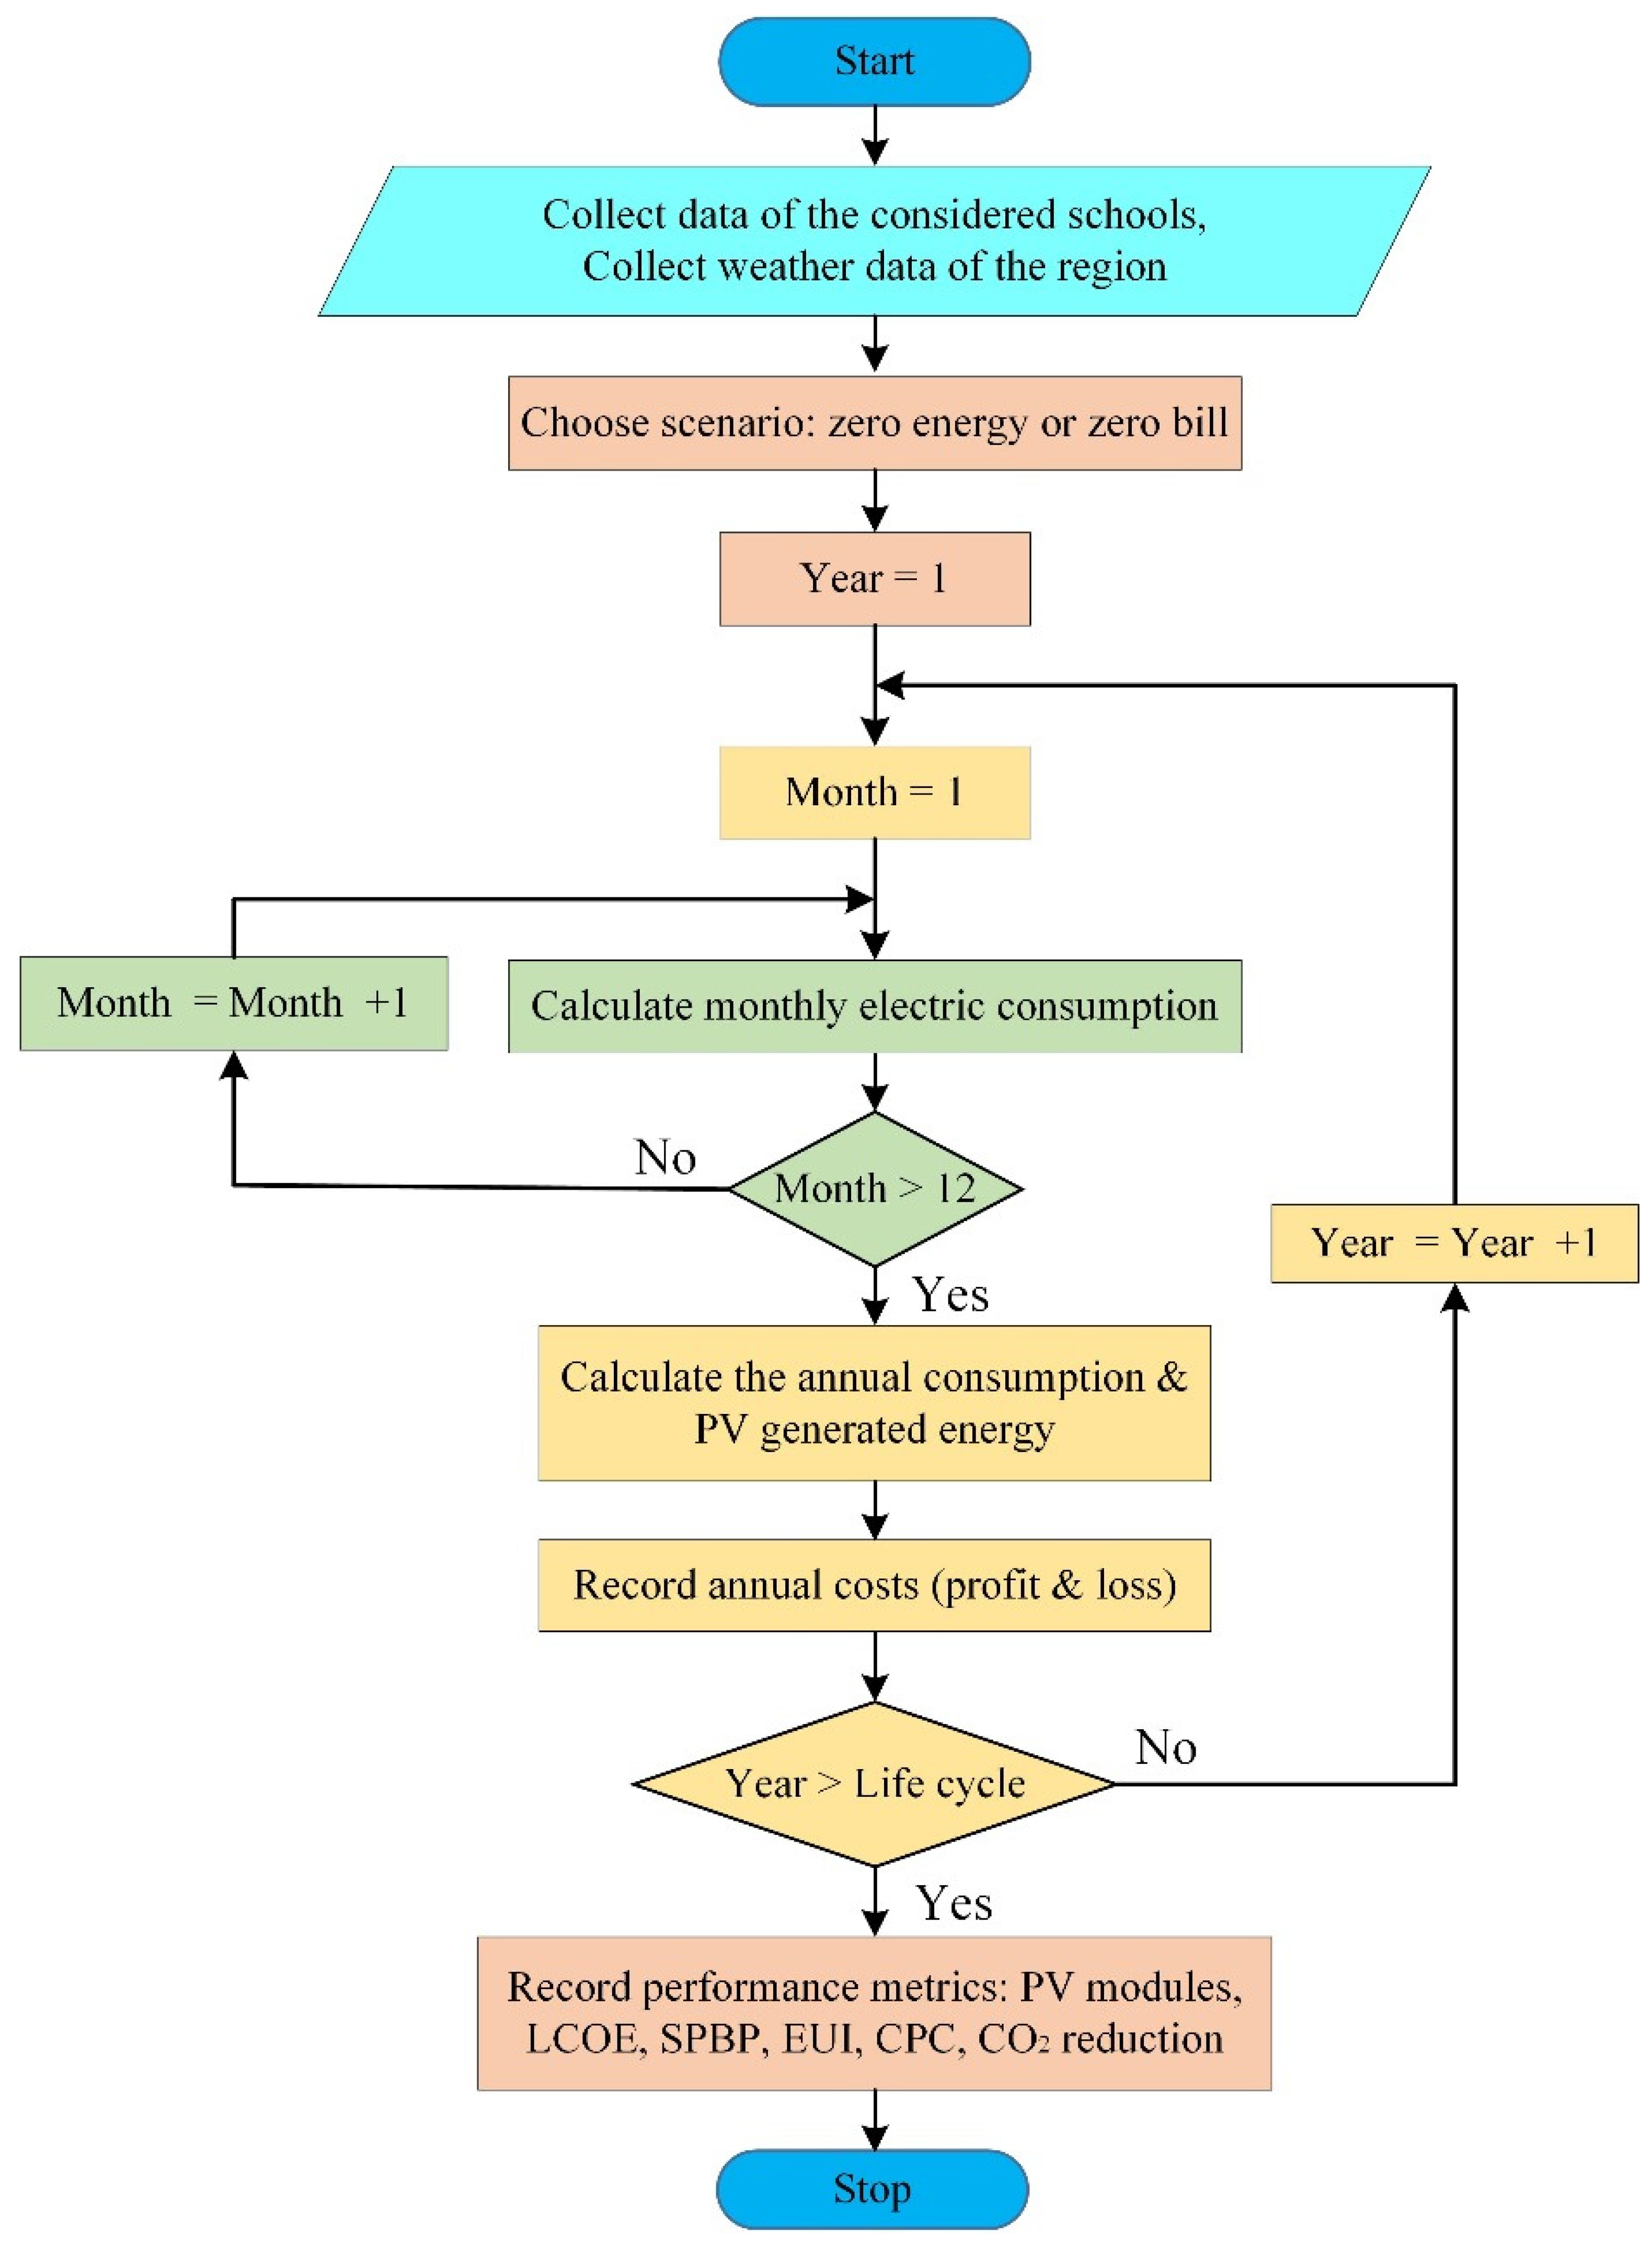
School buildings often consume electricity unwisely in hot regions. This problem can be solved by rationalizing consumption or securing the necessary energy by integrating solar energy with school buildings and facilities. Energy consumption, rationalization of energy consumption, and RE, especially solar energy, in educational buildings have been studied in the scientific literature. Dias Pereira et al. [7] conducted a literature analysis comparing the published school energy use statistics. The authors reported that the total annual EUI ranged between 10 kWh/m2 in Italy and 278 kWh/m2 in Japan. The authors also presented the electrical yearly EUI ranged between 7 kWh/m2 in Germany and 66 kWh/m2 in Northern Ireland. The thermal EUI was 42 kWh/m2 in Germany and 210 kWh/m2 in Sweden. Lizana et al. [8] reported that the annual EUI for heating and cooling ranged between 15.27 kWh/m2 and 34.82 kWh/m2 for school buildings with passive energy performance in Spain. Ahamad et al. [9] calculated the annual EUI for schools in a typical tropical Malaysian climate for four years, which ranged between 12 kWh/m2/year and 23 kWh/m2/year. Basarir et al. [10] evaluated the retrofit possibilities and building envelope design standards for a school structure about 60 years old. As a result, it was found that the most efficient retrofit technique—both in terms of cost and energy efficiency—was employed most frequently in Turkey throughout the heating season. According to this study, there will be a financial advantage in eight years. The authors claim that implementing a retrofit would reduce the building’s yearly fuel expenses by about one-third. Ali and Hashlamun [11] researched in Jordan to develop retrofitting strategies for school buildings without insulation. According to the findings, implementing these ideas can result in notable energy savings of up to 54% with a comparatively simple payback period (SPBP) of 5.5 years, proving their potential as an energy-efficient retrofitting solution for Jordanian school buildings.
Al-Tamimi et al. [12] used DesignBuilder software to evaluate the energy-saving strategies currently in place while ensuring appropriate interior comfort in Saudi Arabian public schools. The authors claim that applying suitable building envelope design strategies for already existing schools can result in substantial savings of 30% and 19%, respectively, on cooling and total electricity usage. However, according to Alaidroos et al. [13], energy-efficient building retrofitting—improving a building’s energy efficiency—is the most frequently used method for increasing building efficiency. Saeed [14] evaluated the efficacy of using thermal insulation and hollow blocks to reduce energy usage in two typical school buildings in Riyadh, KSA. According to Saeed, the external envelope’s improved U-value was primarily responsible for a 51% decrease in energy use. The author also recommended utilizing an evaporative cooler instead of air conditioning (AC) window units because they consume roughly 75% less electricity while offering the same cooling efficiency. Due to poor thermal insulation in the building envelope in the KSA, AC systems consume a significant amount of electricity [15,16]. As a result, there is considerable potential for optimizing energy usage and ensuring thermal comfort in school buildings, which will depend on factors such as their typology and occupancy patterns [17]. Al-Tamimi [18] reported that these outcomes are most likely the consequence of user behavior, structure, and weather. Using DesignBuilder software, Aloshan and Aldali [19] assessed and refined facade retrofitting techniques to increase energy efficiency and evaluate the financial performance of different scenarios in Saudi school buildings. The study finds retrofitting techniques that lower lighting electricity usage by 49%, cooling loads by up to 17%, and yearly energy expenses by 18% through an optimization process.
There has been a recent surge in the publication of research on grid-connected PV systems. At José Olaya Hualhuas State School in Peru, Charles et al. [20] described and assessed off-grid and on-grid PV systems using the PVsyst 7.2 software. The authors hope this will favor the institution’s financial future and significantly influence the next generation of energy-conscious individuals. They promise a minimum lifespan of ten years, sufficient to observe the returns on investment. Haffaf et al. [21] examined load management and solar PV systems of a suggested ten kWp PV system installed on a school roof in M’sila, Algeria. Using pvPlanner software, simulations were run to assess the performance of four different PV module technologies. According to the findings, amorphous silicon technology outperforms other options in this field. Demand-side management is considered an efficient means of integrating and promoting solar energy since it reduces energy usage.
An investigation of the economic feasibility and performance of a ten kWp grid-connected solar PV system constructed at Maungaraki School in Wellington, New Zealand, was given by Emmanuel et al. [22]. According to the authors, the annual performance ratio (PR) was 78%. Furthermore, according to the economic evaluation, the levelized cost of energy (LCOE) for this system at 4%, 6%, and 8% discount rates was NZD 0.121, 0.141, and 0.162 per kWh, respectively, with a PBP of 6.4 years. Overall, there was a 32% decrease in the total yearly electricity use from the grid.
In Daegu Metropolitan City, South Korea, Kim et al. [23] assessed the performance, natural state of operation, and cost-effectiveness of the two similar PV systems in the Osan Building of Kiemyung University and Dongho Elementary School. Due to a discrepancy in the array elevation angle between the two systems and other factors, the average yearly power production of the Osan Building system was 40,094 kWh. In contrast, that of the Dongho Elementary School system was 25,848 kWh. The Osan Building system demonstrated greater economic efficiency with an LCOE of $0.531/kWh for the Osan Building and $0.824/kWh for Dongho Elementary School. Abdillah et al. [24] suggested using the HOMER program to design PV systems for the Indonesian INTIS Balikpapan Elementary School building. The proposed PV solutions fall into off-grid, on-grid, and hybrid PV systems. As determined by the results, the off-grid system’s operational cost was $0.160 per kWh, which was 2.8 times more than the price the State Electricity Company charged. The operating cost of the hybrid system was $0.086/kWh, whereas the operating cost of the on-grid system was $0.032/kWh of electricity.
Bilir and Yildirim [25] used DesignBuilder software to study roof PV systems for a two-story detached school building in İzmir, Turkey, with 36 and 53 kWP capacities. The data revealed a PBP of 7.6 to 7.9 years. Bakri et al. [26] contrasted a 223.5 kWP PV system with a diesel-generating set for energy sustainability at the Yaba College of Technology in Nigeria. The results showed that choosing a PV system as a sustainable alternative to the grid for electricity generation was the preferred course of action. According to the results, neither the diesel generator nor the solar PV system could be operated independently. Still, after 15 years, the PVpower alternative offers significant cost savings over the long-term care contract.
Allouhi et al. [27] investigated the economic and environmental assessment and performance analysis of two kWp grid-connected PV systems at the High School of Technology of Meknes, Morocco. The authors found the system’s potential to reduce CO2 emissions by approximately 5.01 tonnes annually. Its PBP ranged from 11.10 to 12.69 years, and it was discovered to have an LCOE of $0.073–0.082/kWh. Ibrik and Hashaika [28] reviewed the performance of the grid-connected 7.68 kW PV systems installed on three Palestinian schools’ roofs. Based on the performance of PV systems, the average PR was 78%, and each system’s average yearly energy production was 10.930 MWh. These systems have a PBP of less than five years, an internal rate of return (IRR) of about twenty percent, and an LCOE of about $0.100/kWh. Husain and Jawad [29] used HOMER to evaluate the possibility of utilizing school roof PV systems to meet Palestine’s electricity demands. Based on calculations, Al-Dahriya Secondary’s rooftop could support a 57.16 kWP PV system. The school’s yearly electricity use is 4237 kWh, while this system will generate 92,866 kWh, with a PBP of 4.38 years. Furthermore, this technique will yield 5.12% of the yearly Palestinian consumption when implemented in the 3074 schools in Palestine.
Al-Otaibi et al. [30] stated that Sawda and Azda Schools in Kuwait had two PV roof systems. The PV system installed capacity for Sawda was 21.60 kWp, while for Azda, it was 85.05 kWp. Weekly schedules for automated cleaning systems were installed. Sawda School consumed 494.9 MWh of energy, whereas Azda School used 1058 MWh. For Azda, the PV system produced 136.5 MWh of total energy; Sawda produced 35.2 MWh between January and December 2014. Maintaining optimal performance and minimizing soiling on the PV system’s surface required weekly cleaning. Hajiah et al. [31] evaluated the power produced by 100 kWp grid-connected PV systems in Kuwait for the cities of Mutla and Al-Wafra. The authors reported that Mutla and Al-Wafra have annual yield factors of 1861 kWh/kWp and 1922.7 kWh/kWp, respectively. However, both systems generate an LCOE of roughly $0.1/kWh. In addition, both sites have a simple payback period (SPBP) of approximately 15 years.
Kazem and Khatib [32] used MATLAB software to investigate a 3.08 kWP grid-connected PV system on the Sohar University campus in Sohar, Oman. According to the results, the system’s yearly yield factor is 1696.6 kWh/kWp. In the meantime, the LCOE was $0.158/kWh, and the capacity factor of the suggested system was 19.46%.
Alfaraidy and Sulieman [4] investigated energy usage, the viability of employing grid-connected PV systems, and the economics of their use in school buildings in Arar City, KSA. The study found that using PV energy is financially viable. The results showed that the SPBP of the 150 system was 8.26 years. However, further government incentives are also required for widespread penetration. Alfaoyzan and Almasri [33] investigated the usage of PV solar energy at Sulaiman Al-Rajhi University in the KSA. Two PV solar system installation possibilities were considered: one that would secure the university for nearly no energy bills and the other that would cover every structure on campus. The first scenario generates around 113% of the load necessary to attain a nearly zero-bill campus, while the second generates about 24%. The authors say the LCOE varies between $0.026 and 0.028/kWh. Using HOMER software, Tazay [34] examines the viability of grid-connected hybrid RE system concepts for four Saudi Arabian educational institutions. Based on the data, integrating a 62 kW PV array with a grid is the best alternative. This option has a low LCOE of $0.0688/kWh, and sell-back energy accounts for 9.16% of Al Baha University’s total energy consumption. The systems’ LCOEs for Jeddah, Tabuk, and Sattam were $0.0702, 0.0753, and 0.0714, respectively. Baseer et al. [35] used the HOMER program to study the possible use of hybrid energy systems, including PV/wind/diesel with and without battery, for three compounds in Jubail Industrial City, Kingdom of Saudi Arabia. Three complexes weighing 685, 463, and 270 kW at their peak were assessed. Compounds 1, 2, and 3 were shown to have low LCOEs of $0.183, 0.224, and 0.244/kWh, respectively, for their hybrid energy systems. Because of the present pricing and the system used in Saudi Arabia, the net present value and IRR for PV systems are inappropriate, and the LCOE of PV systems is $0.024/kWh. The SPBP is 5.14 years if the electricity generated by PV systems is fed into the grid at a rate of $0.084/kWh, equivalent to the grid tariff for the government or mosque, as reported by Al-Anazi and Almasri [36].
Table 1 shows application data regarding location, type, capacity, SPBP, and LCOE for mostly grid-connected PV projects. The focus was mainly on projects installed in the Gulf region. The results show that the capacity of the systems ranged between 3.08 and 5300 kW, the SPBP between 3.7 and 18.6 years, and the LCOE between 0.022 and $0.244/kWh. This indicator variation can be attributed to the study’s date, the system’s type and capacity, the price and type of conventional energy adopted, and the kind of support and facilities granted. As a result of the discrepancy in indicators found in the reference study in the Gulf region, it became clear that this topic needs a new study that considers the current conditions.
This study evaluates the energy consumption in existing government school buildings and, technically, economically, and environmentally, assesses the possibility of integrating PV systems in these buildings and their associated facilities.

3. Methodology

This study evaluates the energy consumption in existing government school buildings. It considered three schools in Buraidah City in the Qassim region: Anas bin Malik Primary School (school 1), Buraidah Secondary School (school 2), and Prince Abdulelah Secondary School (school 3). The electrical energy consumption in these schools was estimated based on actual electricity consumption readings, and then the integration of PV systems with buildings was studied. An environmental study was also conducted to determine whether PV systems were applied to the KSA’s government schools. Figure 1 shows the flow chart diagram of the research methodology.

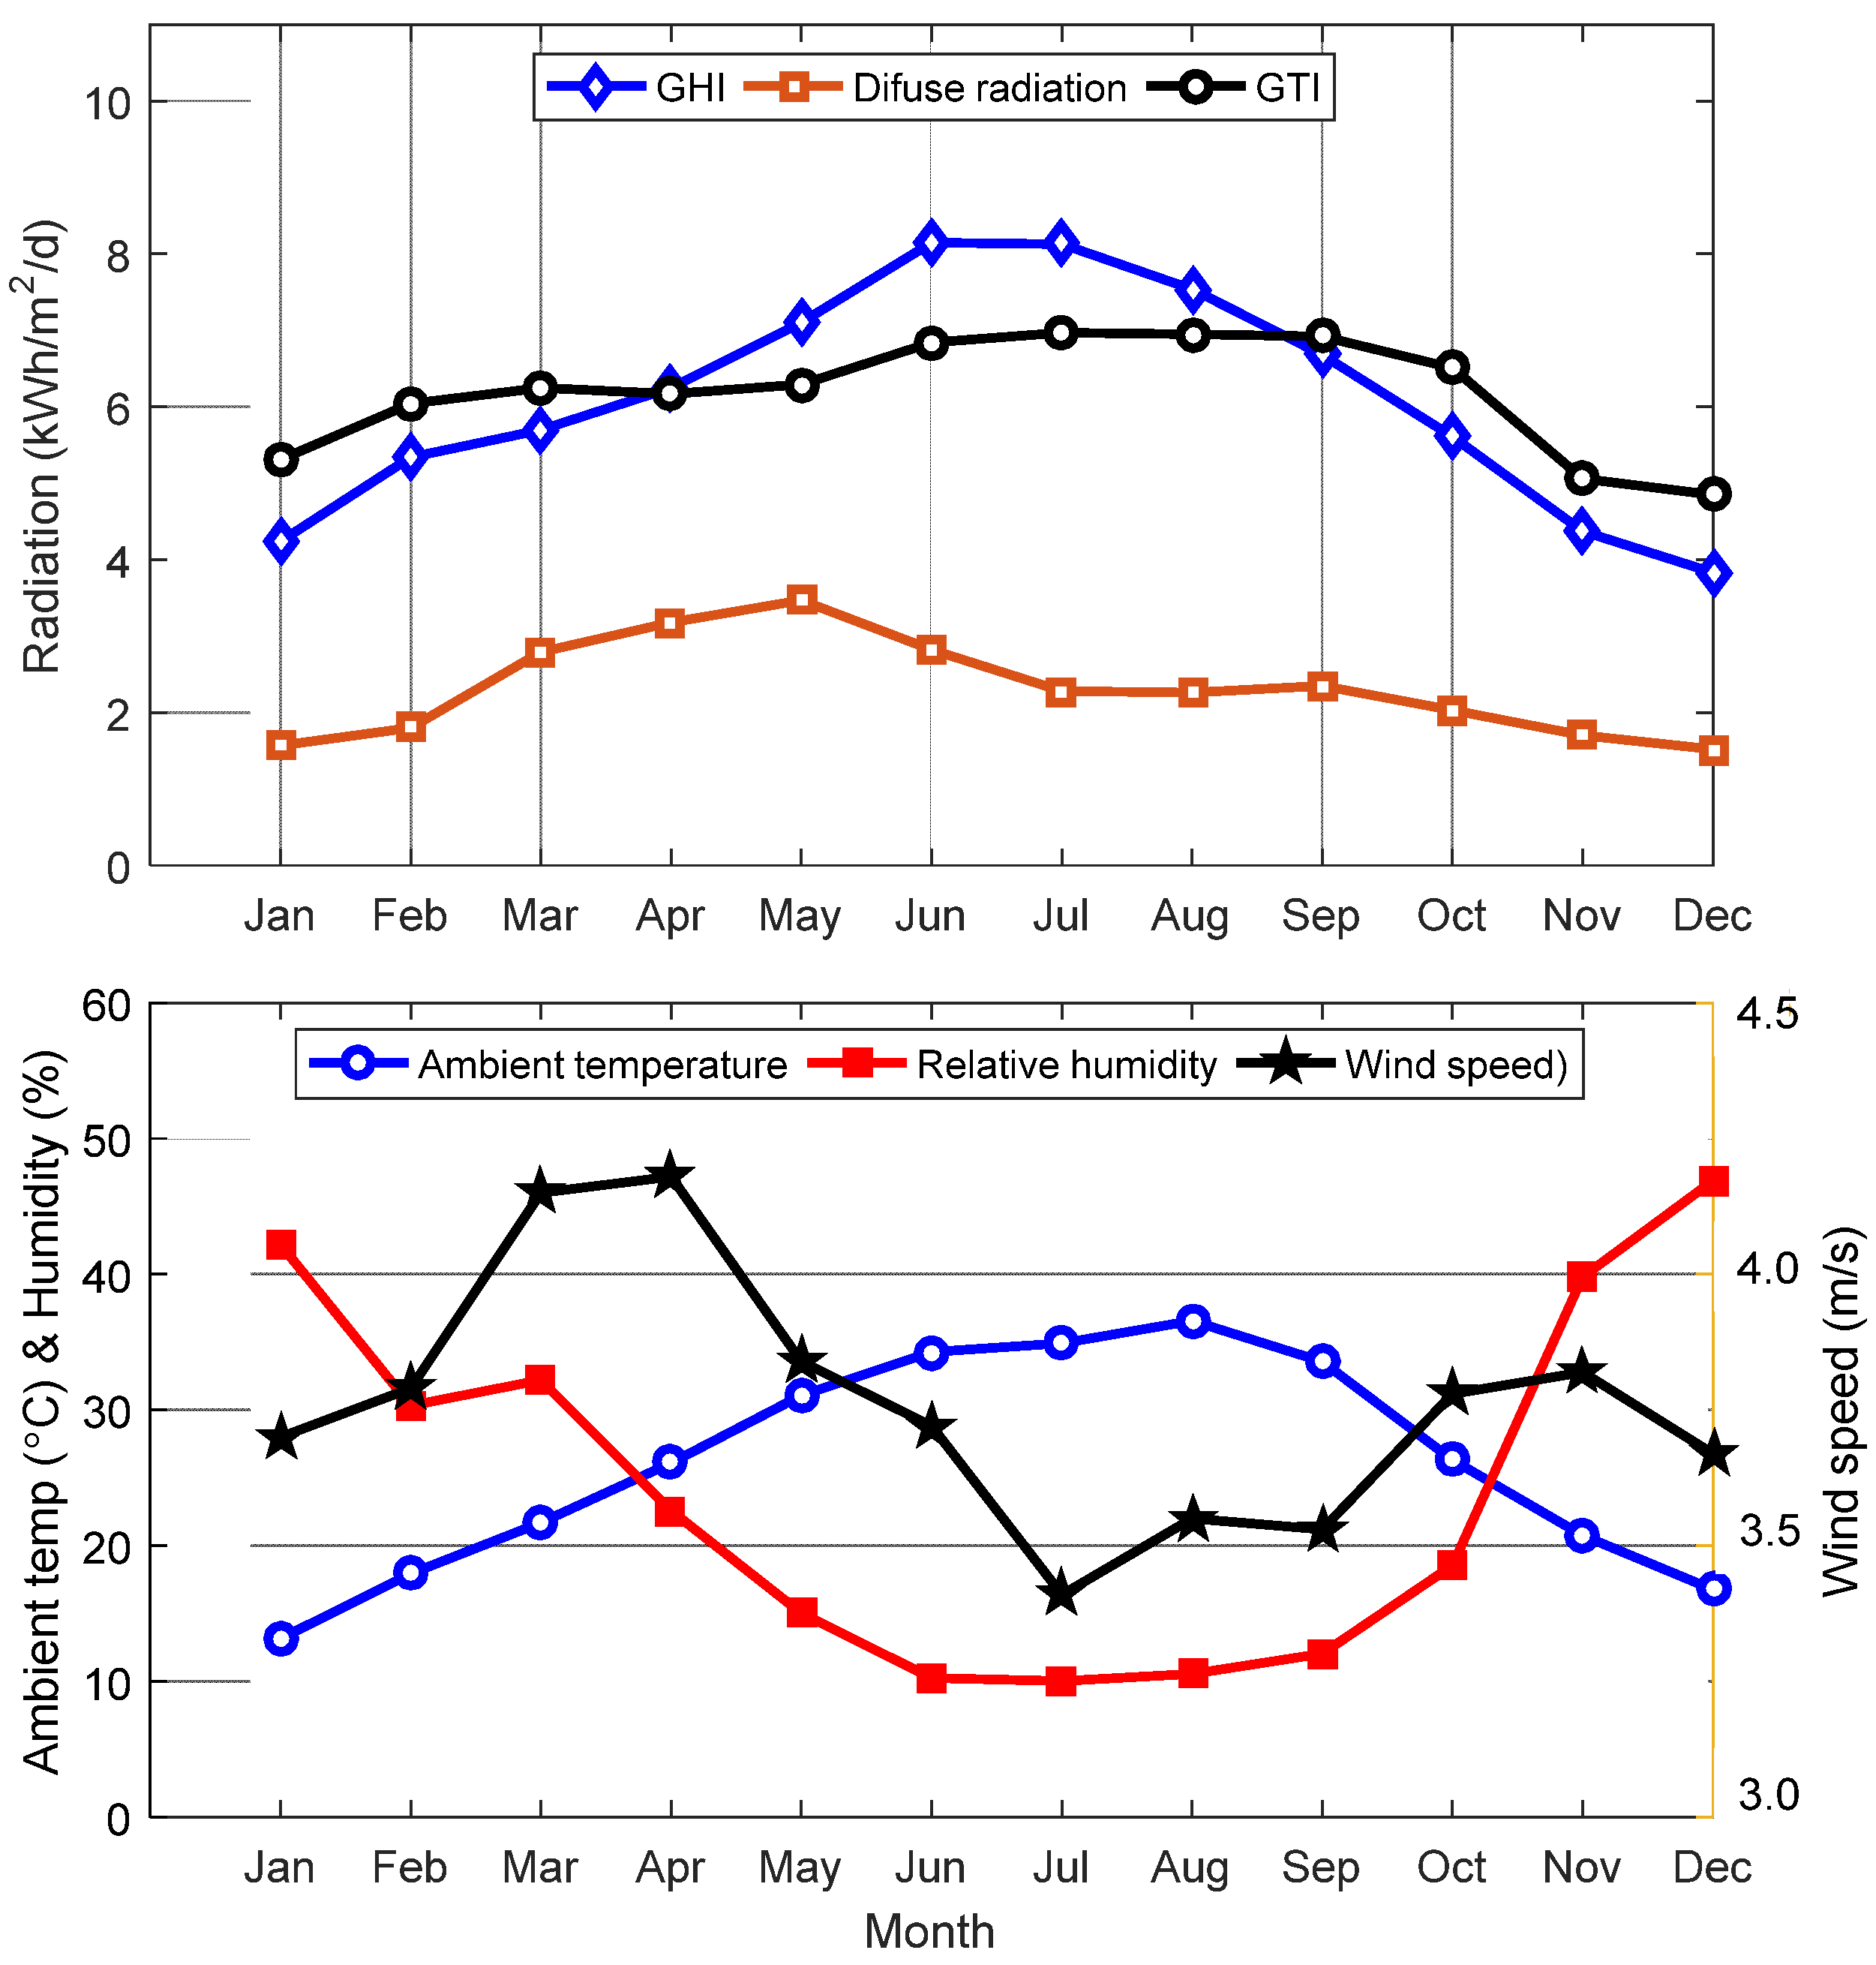
3.1. Meteorological Conditions

The climate in the KSA is hot and dry. The Qassim region is classified as climate zone 1 by the Saudi Building Energy Conservation Code 602 [42]. Together with King Abdullah City for Atomic and Renewable Energy, the data were gathered from the climate stations that had been established. The average monthly temperature in July rises to 38 °C, as seen in Figure 2. Additionally, it is observed that the summer mean relative humidity is lower than the winter value. It is acknowledged that the wind speed is nearly consistent all year long. The figure shows that solar radiation on a horizontal surface is high in summer and relatively low in winter. In contrast, diffuse radiation and GTI are the irradiance incident on a tilted plane at an angle equal to the city latitude, almost constant throughout the year. This information helps us better understand how electricity is used.

3.2. Energy Consumption and Indicators

This section explains the consumption and indicator computations. The annual electrical energy consumption (kWh/year), E, was computed using measurements and Equation (1) for all devices except air conditioners. The air conditioner’s electricity consumption was determined by subtracting the appliance’s consumption from the total consumption based on the bill.
E = C × T × O × OL
where C (W) is the capacity of each item, T (h/year) is the total yearly operation time, O is the degree of ownership (item), and OL is the operating level (%).
The EUI per floor area was calculated using this equation:
EUI = E/A
where E represents the total electricity consumed per year (kWh/year) and A is the floor area for all floors (m2).
The CPC per person was calculated using this equation:
CPC = E/P
where P is the number of students and staff in each school.

3.3. Technical and Economic Analysis of PV Systems

A PV module (HiKu6 Mono PERC, CS6 W-550MS) from the Canadian Solar Company was selected for this study based on several factors, including performance, warranty, and local market availability. This paper used the same method of evaluating PV systems technically and financially as Almotairy and Almarshoud [44]. Note that the load increase, the change in the tariff of the electricity produced by the PV system, net zero energy, and net zero bills were considered in this study. This study has limitations regarding climate, building design, and user behavior. As previously explained, the area under study is dominated by hot climate conditions, and in terms of behavior, there is limited interest in rationalizing energy consumption. Also, in terms of building design, there has been no previous interest in thermal insulation of buildings and improving energy efficiency. This makes it essential to study the impact of these factors.

3.4. Environmental Analysis of PV Systems

One advantage of PV technology is reducing greenhouse gas (GHG) emissions. The annual rate of GHG emissions savings can be calculated using this formula:
GHG emissions = EF × EP
where EF is the emissions factor (kg of CO2 per kWh), and EP is the electricity produced from PV systems (kWh). In 2021, according to Abdulkareem and Ellaboudy [45], the CO2 emissions density in electricity production in the KSA was 0.569 kg CO2 per kWh.

4. Results and Discussions

4.1. Electricity Consumption and Indicators

Equation (1) calculates the monthly electricity consumption of three schools in Buraidah City in the Qassim region: school 1, school 2, and school 3. Table 2 shows that the maximum electric energy consumption is in August and September due to air conditioning, while consumption is low in the summer months due to the summer vacation and in some months due to not using AC. Electrical energy consumption indicators were calculated per unit area and person using Equations (2) and (3). Table 3 shows the annual energy consumption and EUI per unit area and person CPC in the schools under study. Values 22–48 and 337–630 were obtained for EUI and CPC, respectively. It is noted that the EUI in these schools is consistent with what was published by Alfaraidy and Sulieman [4]. In contrast, these values are considered low compared to those published in university buildings, as shown in Alfaoyzan and Almasri [37] and Ghenai and Bettayeb [46]. Schools’ low electricity consumption indicators can be mitigated by the summer vacation, limited daily working hours, and fewer devices used than university buildings.

4.2. End-Use Electricity Consumption

Most educational institutions use electricity in all hot areas. Climate significantly influences how much electricity is used; places with hot weather require more energy to cool. Using a base temperature of 20 °C for heating and 24 °C for cooling, and based on the 2019–2023 five-year average, cooling degree days (CDD) and heating degree days (HDD) were calculated [47]. Table 4 shows CDD, HDD, and the average percentage of electricity used in educational buildings in the KSA and UAE. It is noted from the results that there is agreement between the results of previous studies and the results of the current study. Values for end-use of electricity of 80%, 11%, and 9% were obtained for AC, lighting, and others, respectively. The author suggested studying evaporative coolers instead of conventional AC units in school buildings in the central area of KSA.

4.3. PV Systems Analysis

PV systems were studied considering the tariff generated from the systems, $0.0133 (≈SAR 0.05) per kWh, and the tariff of importing from the grid, $0.0931 (≈SAR 0.36) per kWh. The cost of the PV system components in 2023 was determined by obtaining quotes from local market sources. The average values of these quotes were used for economic calculations, and the result was $824.8 (≈SAR 3101.4) per kWP. It is also assumed that the generated energy is consumed when needed, and the excess is exported to the grid. Several scenarios were studied: nearly zero-energy balance, zero bills at the end of the project life after 25 years, and increasing the price of exported electricity to the grid.

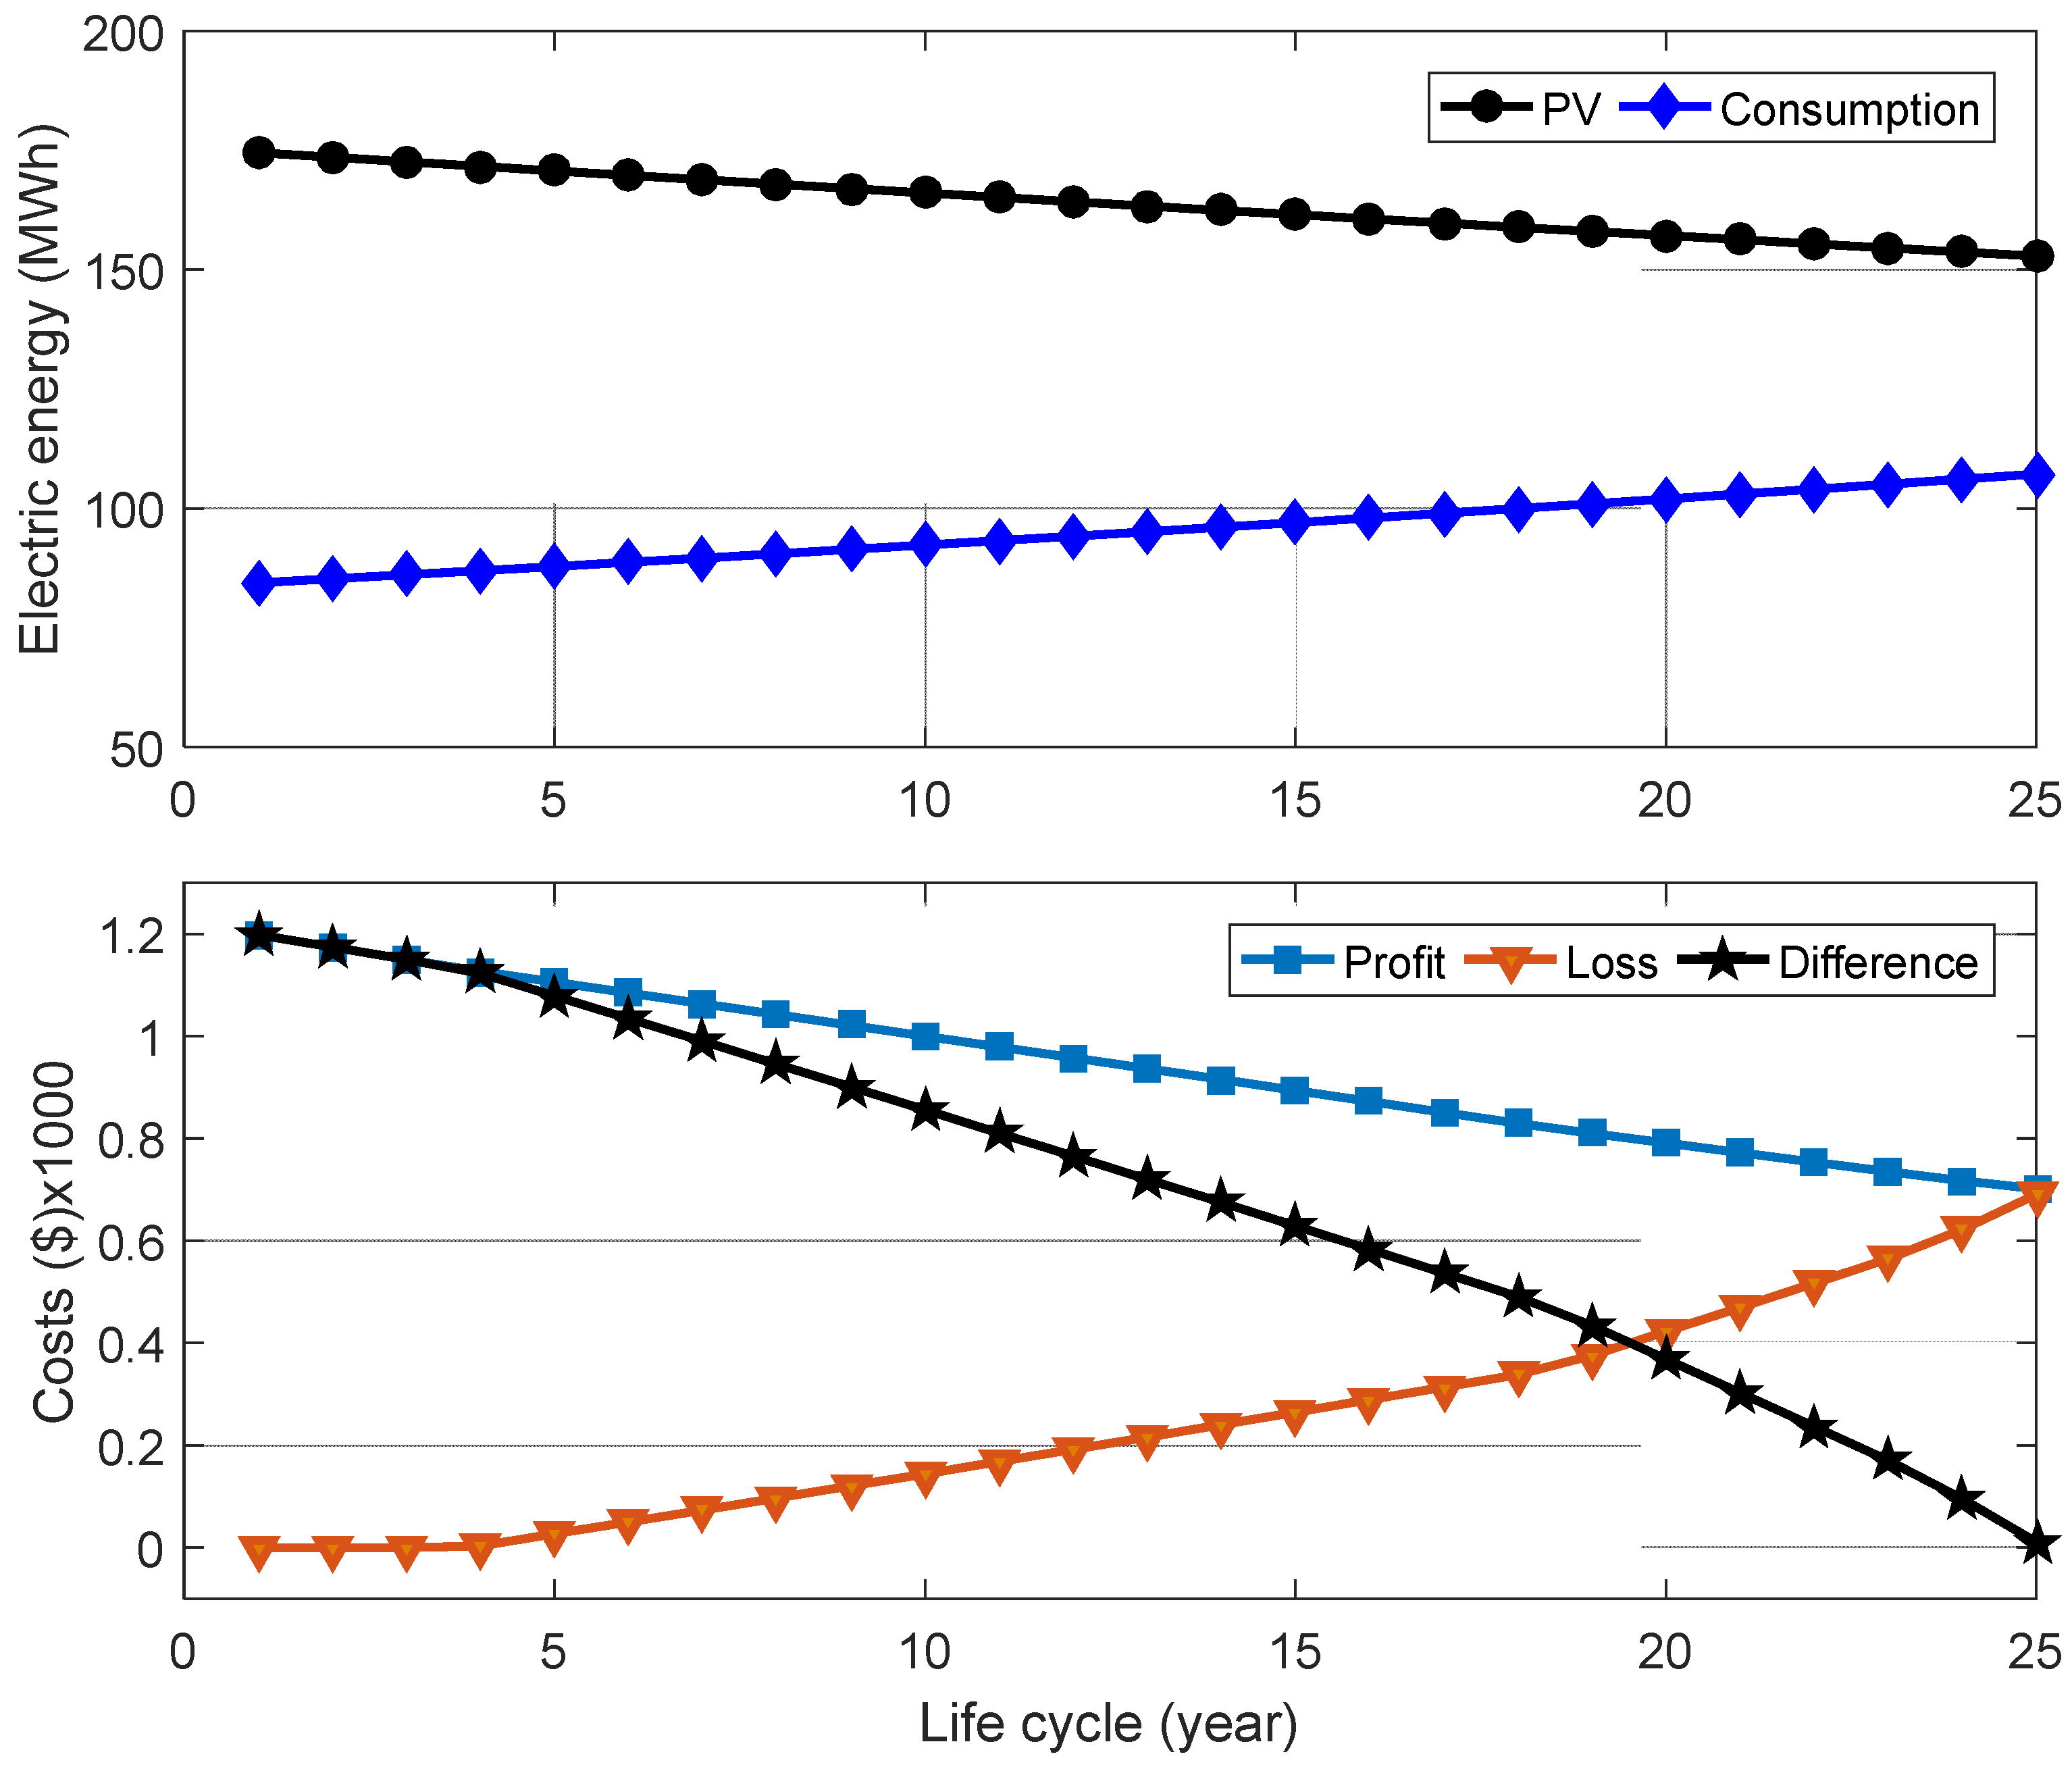
4.3.1. Zero-Energy Balance Scenario

Table 5 shows the technical and economic information for the three systems in the case of the required load in the first year. It is noted from the values that the available surface is sufficient to install the PV system to secure the required load and that the roof occupancy rate was 33% (school 1), 48% (school 2), and 77% (school 3). The nominal PV system capacity for schools was 63.8, 205.7, and 122.1 kW, respectively. As shown in the economic indicators, these resulted in an SPBP of about seven and a half years if the undiscounted condition was considered and less than 12 years if the discounted condition was considered. An LCOE ranging between 0.0229 and $0.0252 per kWh was obtained. As a result of comparing the current results with the results presented in Table 1, it can be found that the output values are often slightly higher in terms of SPBP and close to LCOE. The difference may be due to the price of the energy unit when determining these indicators: weather conditions, the system’s cost, capacity, lifespan, and economic conditions such as loans, etc. The capacity factor is more than 22%, whereas the school’s yearly yield is between 1950 and 1994 kWh/kWP. The three PV systems have a PR between 86.81 and 88.84%. These generally reasonable indicators encourage the usage of these three PV systems. The systems under investigation have similar performance indicators because they all use the same PV module and have the same meteorological data. They have different energy demands, which impact the size of the PV system but have no bearing on any of the performance indicators. These results are consistent with those published under the same climatic conditions as Ibrik and Hashaika [28], Hajiah et al. [31], and Kazem and Khatib [32].
Figure 3 demonstrates the electric energy produced by the PV system, taking into account the influence of the degradation coefficient on the output energy over the life of the PV system, the increase in temperature, and the required load, assuming an increase in the load at an average rate of 1% per year. Figure 3 shows that the three PV systems can achieve nearly zero-energy buildings for the required loads in the last year of the application’s life, while the system produces more annual energy than the load in previous years. Excess electric energy produced decreases as the system ages.

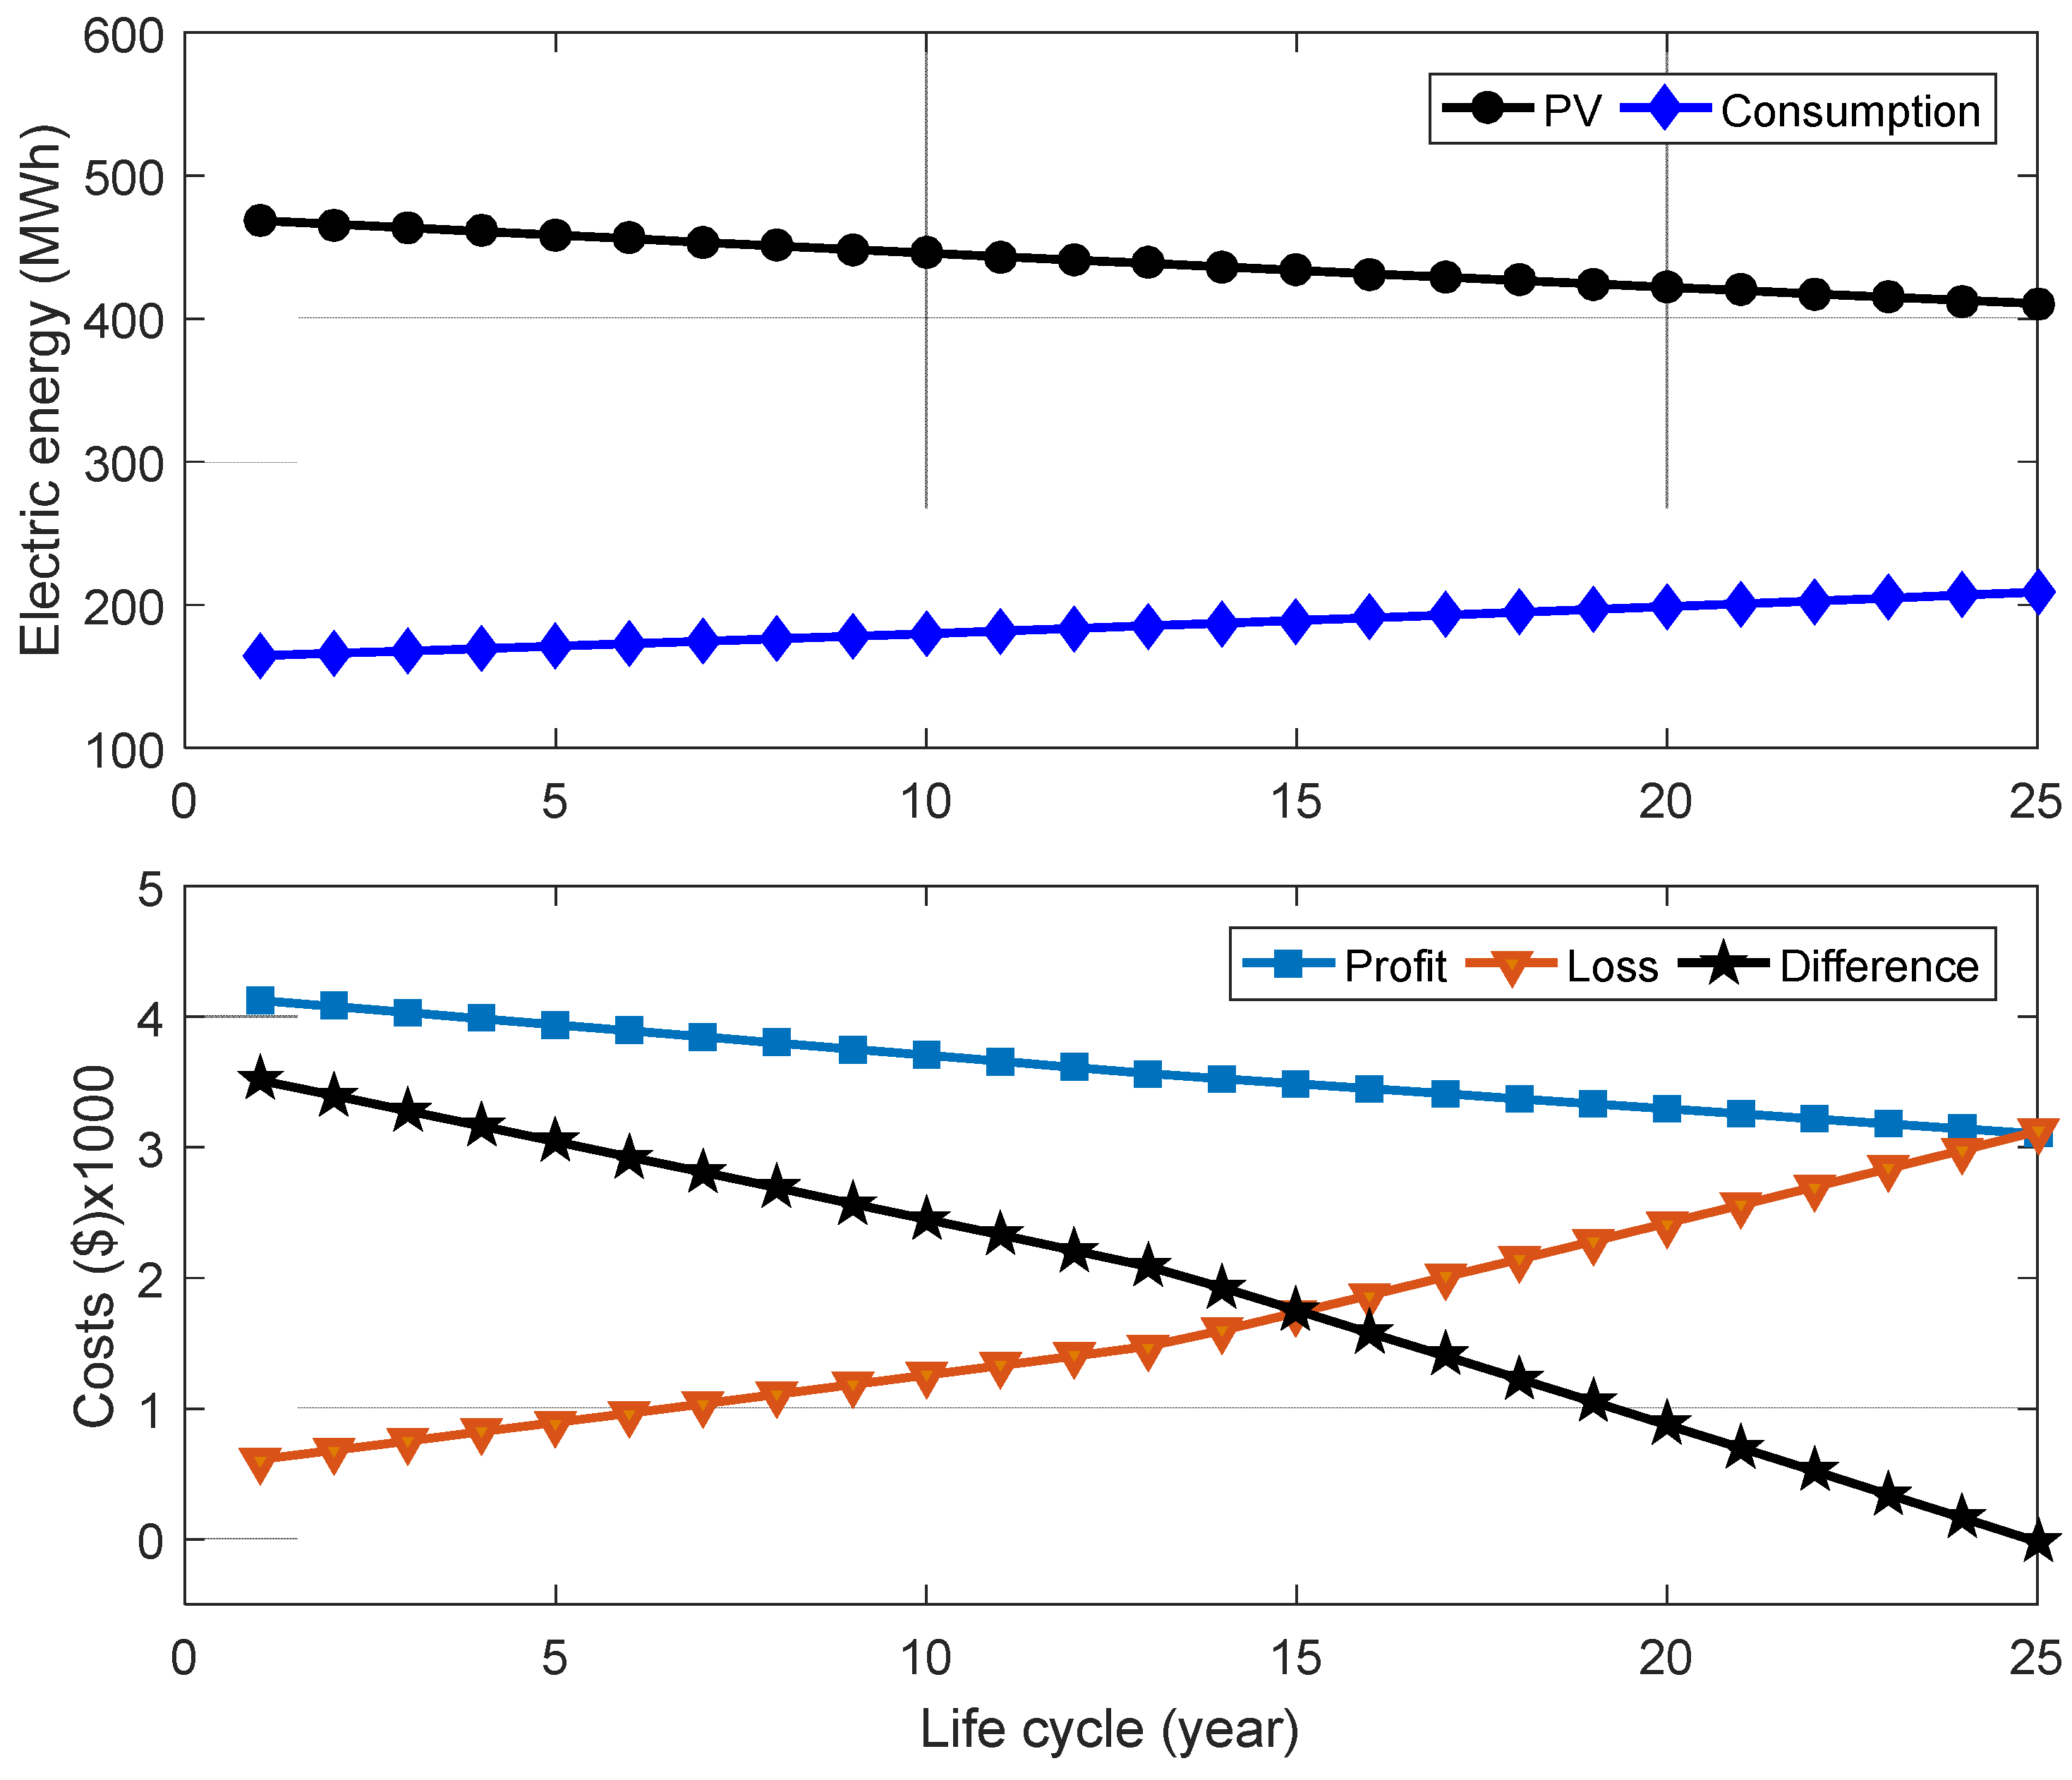
4.3.2. Zero-Bill Scenario

Based on the findings for the zero-energy scenario, it can be concluded that a grid-connected PV system is especially beneficial for government schools; in general, using it helps reduce the service provider’s peak demand and supply surplus energy to the grid. These systems achieved nearly zero bills for schools 1 and 2 for the lifespan of the grid-connected PV system by using the roof only. However, school 3 did not reach the study target due to high consumption and a lack of suitable space on the roof, but it can be used on the roof of the car park to increase the number of PV modules. As shown in the economic indicators, these resulted in a SPBP between 10.58 and 13.64 years if the undiscounted condition was considered and between 20.24 and 39.14 years if the discounted condition was considered. This indicator shows that the systems are not economically feasible, even though the LCOE ranging between $0.0194 and 0.0223 per kWh was obtained, as shown in Table 6.
To achieve the nearly zero-bill scenario, Figure 4, Figure 5 and Figure 6 show the electricity consumption curve and the electricity produced by the PV systems with the economic indicators of the three schools throughout the systems’ lifetime. It is seen that the three systems exhibit comparable trend behavior. Given that electricity must occasionally be drawn from the grid, the figures show that the systems generate more than is required each year to offset the price differential between electricity generated and exported to the grid and electricity imported from the grid. As the load increases and the effect of the degradation factor of PV modules increases over time, the gap between the amount of energy generated by the PV system and the amount of consumed energy narrows. According to Figure 4 and Figure 5, the loss is constrained during the first five years of the system’s existence, which limits the gap between the price of power and its benefits. After that, the loss rises, and the economic return falls until the bills are almost zero.

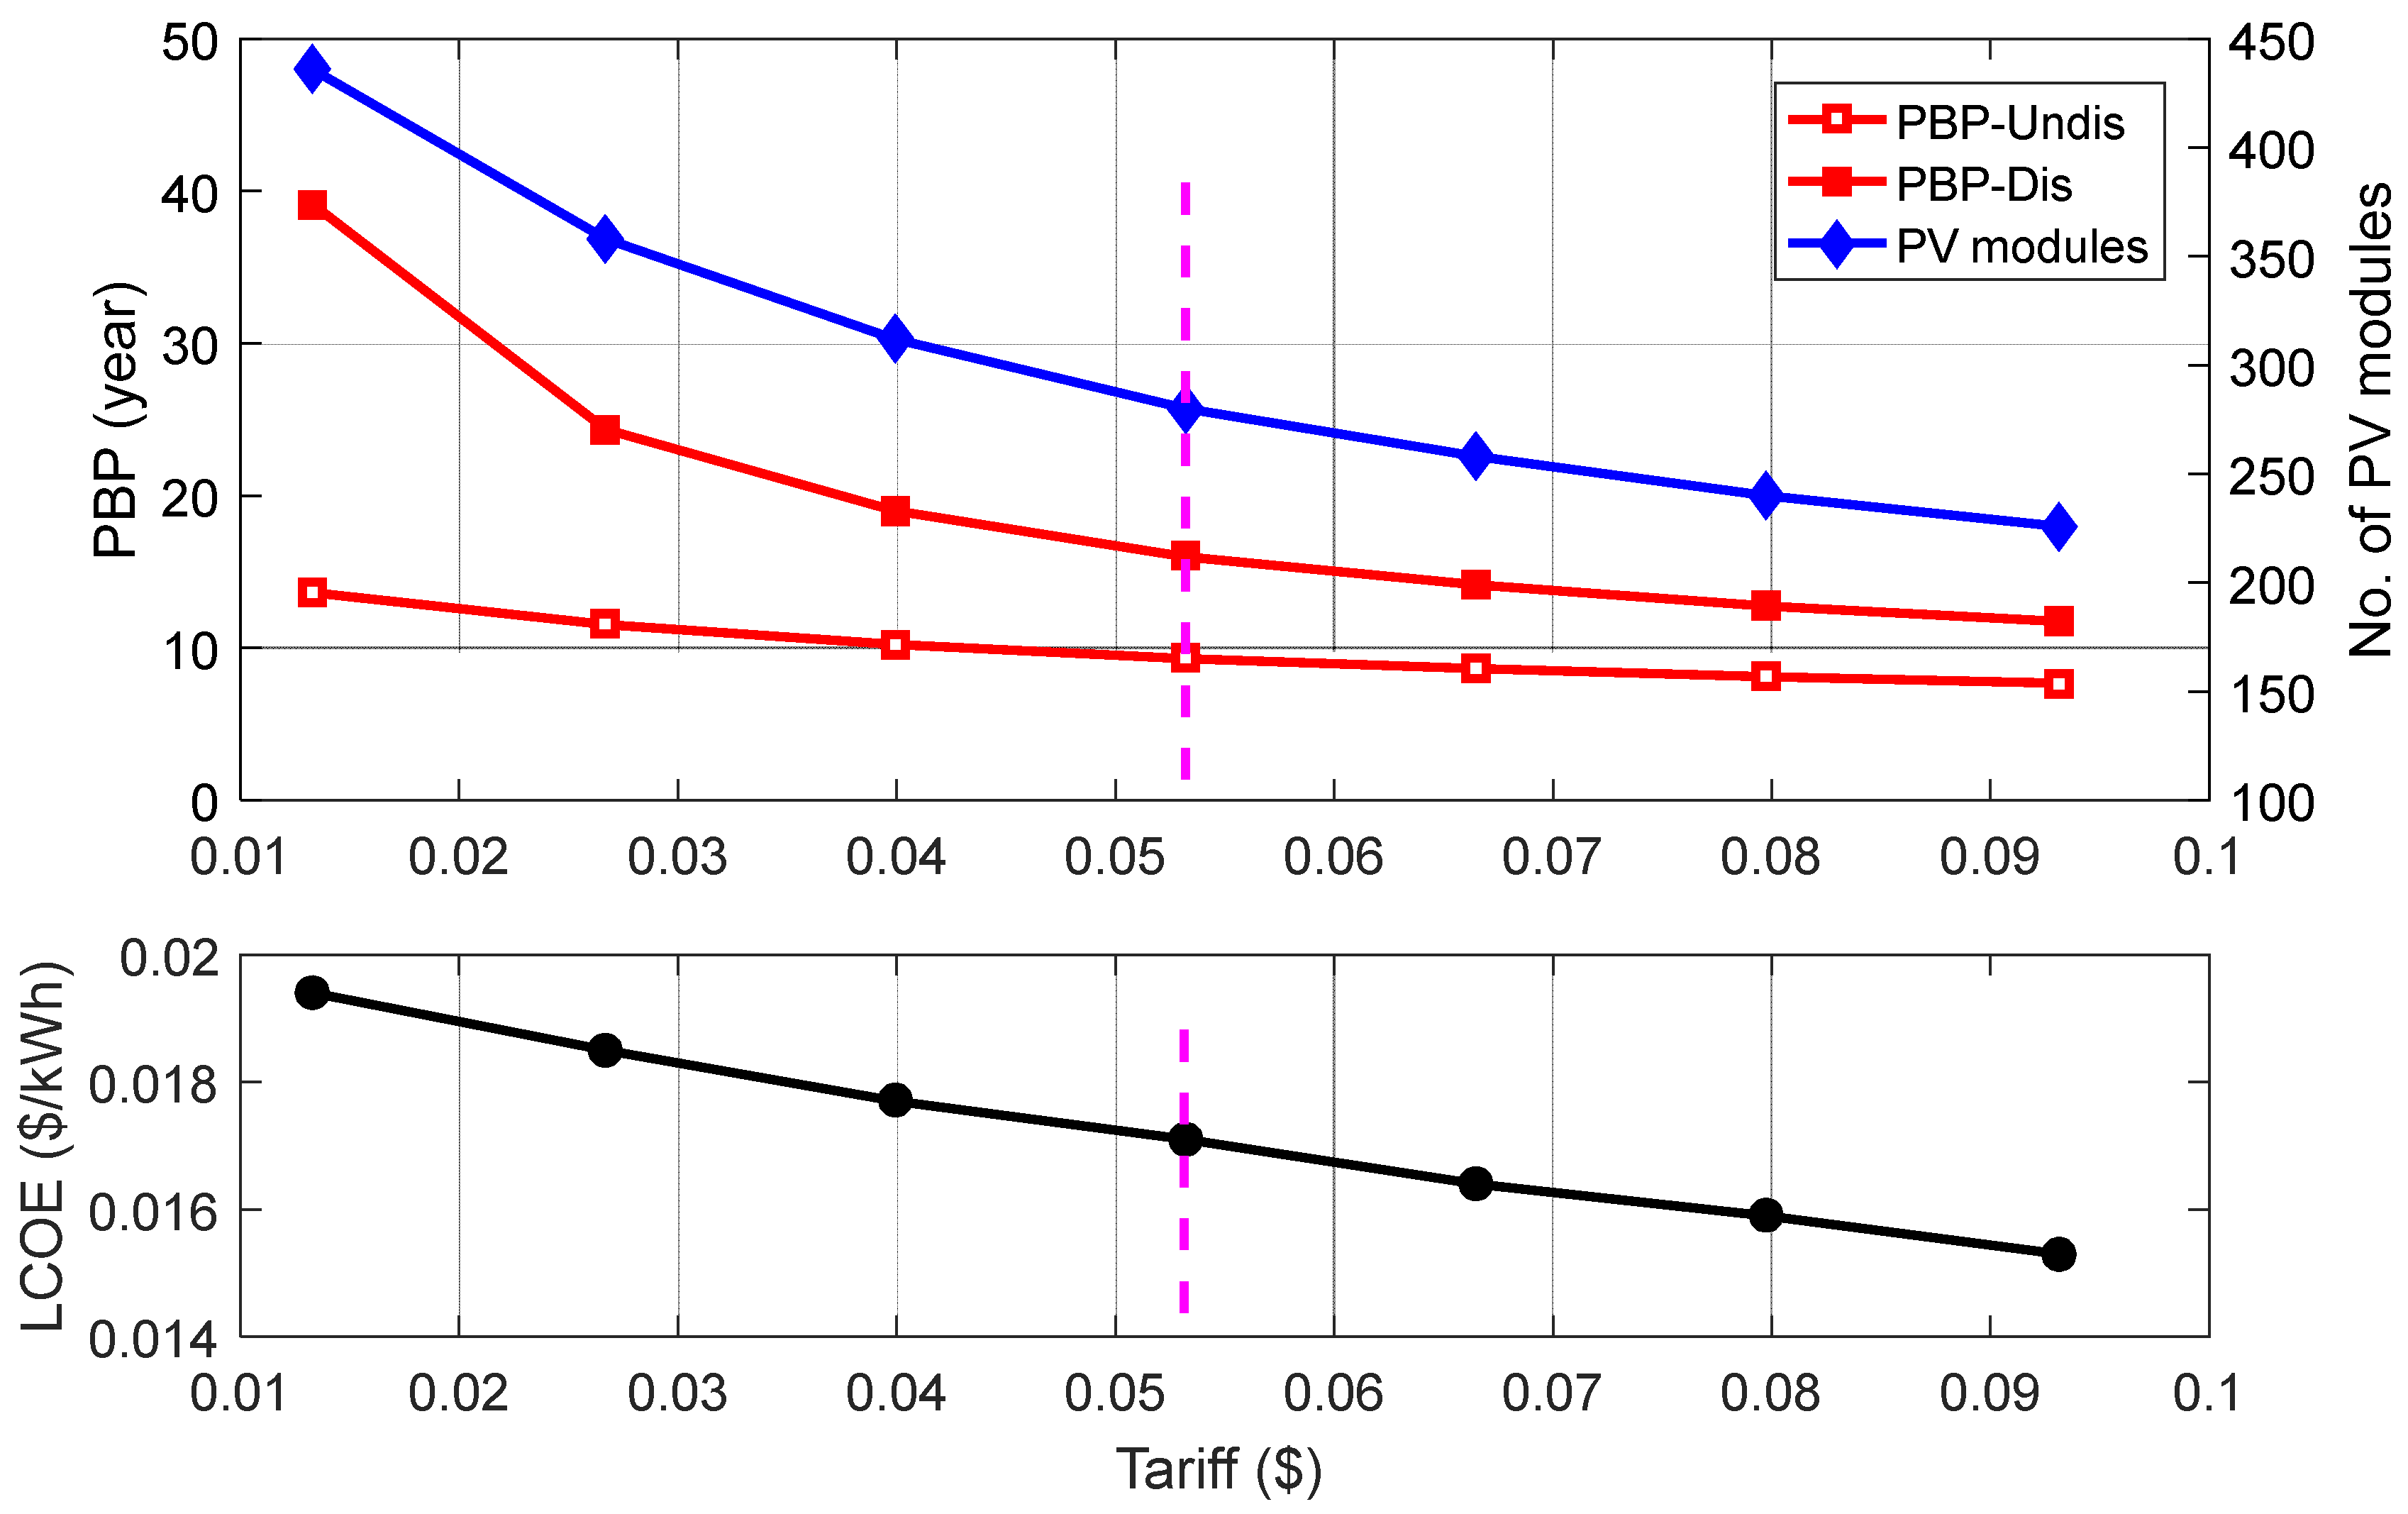
4.3.3. Tariff Sensitivity Analysis

After, it became clear that the tariff of the electricity produced by the system and exported to the grid is a significant obstacle to integrating solar energy with school buildings. In this paragraph, the change in the tariff of the electricity exported to the grid was studied in relation to the feasibility of the systems. The price was changed from the current approved price of $0.0133 (≈SAR 0.05) per kWh to the cost of retrieving electricity from the public grid for the government sector, $0.0931 (≈SAR 0.36) per kWh to obtain a zero bill along the system’s life. The increase in the tariff led to a decrease in the number of PV modules required, the system capacity, and the SPBP for all systems. The SPBP became acceptable at $0.0532 (≈SAR 0.20 SAR) per kWh, which ranged between 8.52 and 15.98 years for undiscounted and discounted conditions, see Figure 7. The right of the dotted line represents the economically feasible region in the figures for the studied PV systems. The LCOE decreased for school 2 from $0.0124 to 0.0184, and for school 3 decreased from $0.0153 to 0.0194 per kWh. The price of electricity in the United States ranges between $0.11 and 0.30 per kWh in 2023, although it is usually less than $0.15 per kWh. The price of a unit of electricity produced from PV systems is between $0.06 and 0.08 per kWh [48]. Thus, it is often about half the price of a unit of energy imported from the grid. Therefore, it is proposed that the price of a unit of energy produced from the PV system for the government sector be raised to 50% of the price of imported electricity for these systems to be economically feasible in the KSA. Das et al. [49] used metaheuristic optimization techniques for a radio transmitter station in India to optimally design a PV system with energy storage. Gaabour et al. [50] summarized the most essential optimization works related to the design of hybrid PV–wind systems.

4.4. Environmental Benefits of PV Systems

One advantage of PV technology is reducing GHG emissions. The annual rate of GHG emissions savings can be calculated using Formula (4). In 2021, the CO2 emissions density in electricity production in the KSA was 0.569 kgCO2 per kWh. Table 7 shows the number of cells installed in each system in the two scenarios: zero energy and zero bills at the end of the system’s life. In addition to the installed module’s number, the energy produced and the CO2 that can be saved are also included. It is noted that a high amount of CO2 can be saved in the three schools during the life of the systems.
Suppose the electricity generated from PV systems and CO2 saved are obtained by multiplying the number of public schools, 24,075, [1], by the median characteristic value for each school. Table 8 shows the average electricity generated and CO2 saved from installing PV systems on each school’s roof and the Kingdom’s in two scenarios.

5. Conclusions and Recommendations

This study investigated the energy consumption and feasibility of installing grid-connected PV systems in Saudi Arabian government schools to achieve zero energy and zero costs after the system’s life cycle. Three schools in Buraidah City were selected for the inquiry. An optimization process was then conducted to ensure each system could fulfill the yearly zero-energy and bill criteria at the end of the 25 years of the PV system’s life cycle. The impact of temperature and other variables on the PV systems’ production were considered, as was the assumption of the 1% annual load of the schools’ increase. According to the study, values for EUI and CPC ranged from 22 to 48 and 337 to 630, respectively. The corresponding end-use electricity values for air conditioning, lighting, and others were 80%, 11%, and 9%. The capacity factor was more than 22%, the schools’ yearly yield was between 1950 and 1994 kWh/kWP, and the PR was between 86.81 and 88.84% under the energy-zero scenario. Under the energy-zero scenario, the SPBP was about seven and a half years if the undiscounted condition was considered and less than 12 years if the discounted condition was considered. An LCOE ranging between $0.0229 and 0.0252 per kWh was obtained. The indicators in the zero-billing case were similar to the energy-zero scenario except for the SPBP, which was longer and, in some cases, not economically feasible. Lowering import duties and eliminating or lowering value-added taxes can reduce the initial cost of PV systems to improve competitiveness through government support.
Moreover, the results show that economic evaluation must be revisited by reviewing the tariff value for selling surplus energy to the distribution network. Reducing the energy bill paid annually will be reflected in the education ministry’s annual budget. Deploying grid-connected PV systems in schools may be considered as small distributed generation units, which will benefit the utility grid. From a financial point of view, deploying grid-connected PV systems in schools will delay significant investments in building new power plants, upgrading substations, or building new transmission lines. From an environmental standpoint, installing grid-connected PV systems in schools will significantly reduce greenhouse gas emissions, particularly carbon dioxide. Although the KSA has enormous potential for solar energy sources, the solar energy market for small systems loses government support through subsidies and incentives. These systems are more cost-effective than other systems and will significantly help expand sustainable solar energy in the country. Evaporative coolers should be studied as an alternative to conventional AC units in school buildings, especially in the central area of the KSA. It is proposed that the Ministry of Education and Energy agree to implement a national project in which PV systems will be installed on school roofs.

Author Contributions

Conceptualization, R.A.A., A.E. and A.F.A.; methodology, A.E., A.F.A. and F.H.A.; software, A.E. and A.F.A.; formal analysis, R.A.A., A.F.A. and A.E.; investigation, A.F.A. and R.A.A.; data curation, F.H.A.; writing—original draft preparation, R.A.A., A.F.A. and A.E.; writing—review and editing, A.F.A. and F.H.A.; visualization, A.E. and R.A.A.; project administration, R.A.A. and A.F.A.; funding acquisition, R.A.A. All authors have read and agreed to the published version of the manuscript.

Funding

This research received no external funding.

Institutional Review Board Statement

Not applicable.

Informed Consent Statement

Not applicable.

Data Availability Statement

The raw data supporting the conclusions of this article will be made available by the authors on request.

Acknowledgments

The researchers would like to thank the Deanship of Graduate Studies and Scientific Research at Qassim University for financial support (QU-APC-2025) and K.A.CARE for their cooperation and provision of climate data.

Conflicts of Interest

Author F. H. Almotairy was employed by the company National Grid Company. The remaining authors declare that the research was conducted in the absence of any commercial or financial relationships that could be construed as a potential conflict of interest.

Abbreviations

ACair conditioning
CDDcooling-degree days
CPCconsumption per capita
DGdiesel-generating
EFemissions factor
EUIenergy use intensity
GHGgreenhouse gas
HDDheating-degree days
KSAKingdom of Saudi Arabia
LCOElevelized cost of energy
PRperformance ratio
PVphotovoltaic
RErenewable energy
SARSaudi riyal
SPBPpayback period

References

  1. Education Statistics and Decision Support Center. 2023. Available online: https://departments.moe.gov.sa/Statistics/Educationstatistics/Pages/GEStats.aspx (accessed on 11 November 2024).
  2. Information and Statistics. 2022. Available online: https://moe.gov.sa/ar/pages/default.aspx (accessed on 5 October 2024).
  3. Basic Law of Governance, Article 30; Bureau of Experts at the Council of Ministers Official Translation Department: Riyadh, Saudi Arabia, 1992; p. 14. Available online: https://laws.boe.gov.sa/Files/Download/?attId=ed4842e1-9543-40b9-973b-ada200d4ed10 (accessed on 5 October 2024).
  4. Alfaraidy, F.A.; Sulieman, H.A. The Economics of Using Solar Energy: School Buildings in Saudi Arabia as a Case Study. ARO-Sci. J. Koya Univ. 2019, 7, 13–18. [Google Scholar] [CrossRef]
  5. Alwetaishi, M.; Balabel, A. Numerical study of micro-climatically responsive school building design in Saudi Arabia. J. King Saud Univ.-Eng. Sci. 2019, 31, 224–233. [Google Scholar] [CrossRef]
  6. Abanomi, W.M. Environmental Design of Prototype School Buildings in Hot, Arid Regions with Special Reference to Riyadh, Saudi Arabia. Ph.D. Dissertation, Cardiff University, Cardiff, UK, 2005. [Google Scholar]
  7. Dias Pereira, L.; Raimondo, D.; Corgnati, S.P.; da Silva, M.G. Energy consumption in schools—A review paper. Renew. Sustain. Energy Rev. 2014, 40, 911–922. [Google Scholar] [CrossRef]
  8. Lizana, J.; Serrano-Jimenez, A.; Ortiz, C.; Becerra, J.A.; Chacartegui, R. Energy assessment method towards low-carbon energy schools. Energy 2018, 159, 310–326. [Google Scholar] [CrossRef]
  9. Ahamad, A.H.; Abidin, N.I.; Zakaria, R.; Aminudin, E.; Khan, J.S.; Sahamir, S.R.; Azman, S.; Redzuan, A.A.; Lau, S.E.N.; Yusoff, M.F.M. School Building Energy Assessment Using Lean Energy Management Strategies. Front. Built Environ. 2022, 7, 679579. [Google Scholar] [CrossRef]
  10. Basarir, B.; Diri, B.S.; Diri, C.J.R. Energy efficient retrofit methods at the building envelopes of the school buildings. In Proceedings of the Retrofit Conference, Manchester, UK, 24–26 January 2012; pp. 1–13. [Google Scholar]
  11. Ali, H.; Hashlamun, R. Envelope retrofitting strategies for public school buildings in Jordan. J. Build. Eng. 2019, 25, 100819. [Google Scholar]
  12. Al-Tamimi, N.; Qahtan, A.; Alotaibi, B.S.; Abuhussain, M.A. Innovative retrofitting approaches for energy saving in Saudi public schools. Indoor Built Environ. 2024, 33, 1260–1279. [Google Scholar] [CrossRef]
  13. Alaidroos, A.; Almaimani, A.; Krarti, M.; Qurnfulah, E.; Tiwari, A. Influence of building envelope characteristics on the effectiveness of PMV-based controls for schools located in Saudi Arabia. Indoor Built Environ. 2022, 31, 2411–2429. [Google Scholar] [CrossRef]
  14. Saeed, S.A.R. Energy conservation strategies for school buildings in Riyadh. Int. J. Ambient. Energy 1997, 18, 43–52. [Google Scholar]
  15. Al-Tamimi, N. An Optimum Thermal Insulation Type and Thickness for Residential Buildings in Three Different Climatic Regions of Saudi Arabia. Civ. Eng. Archit. 2021, 9, 317–327. [Google Scholar] [CrossRef]
  16. Alwetaishi, M.; Al-Khatri, H.; Benjeddou, O.; Shamseldin, A.; Alsehli, M.; Alghamdi, S.; Shrahily, R. An investigation of shading devices in a hot region: A case study in a school building. Ain Shams Eng. J. 2021, 12, 3229–3239. [Google Scholar] [CrossRef]
  17. Zomorodian, Z.S.; Nasrollahi, F. Architectural Design Optimization of School Buildings for Reduction of Energy Demand in Hot & Dry Climates of Iran. Int. J. Archit. Eng. Urban Plan. 2013, 23, 41–50. [Google Scholar]
  18. Al-Tamimi, N. Building Envelope Retrofitting Strategies for Energy-Efficient Office Buildings in Saudi Arabia. Buildings 2022, 12, 1900. [Google Scholar] [CrossRef]
  19. Aloshan, M.; Aldali, K. Empirical study of facade retrofits for optimizing energy efficiency and cooling in school buildings in Saudi Arabia. Energy Rep. 2024, 12, 4105–4128. [Google Scholar]
  20. Charles, J.; Huayra-Armas, A.L.; Atao-Rivas, Y.; Quispe-López, C.; Michael, M.; Justiniano-Medina, A. Towards a Sustainable Campus: Design and Evaluation of a Photovoltaic System for a Secondary School. In Proceedings of the 8th International Conference on Industrial, Mechanical, Electrical and Chemical Engineering (ICIMECE 2023), Lombok, Nusa Tenggara Barat, Indonesia, 30–31 October 2023. [Google Scholar]
  21. Haffaf, A.; Lakdja, F.; Meziane, R.; Abdeslam, D. Promotion and effective integration of school rooftop PV system based load management activities: A case study. Int. J. Sustain. Dev. Plan. 2020, 15, 501–511. [Google Scholar] [CrossRef]
  22. Emmanuel, M.; Akinyele, D.; Rayudu, R. Techno-economic analysis of a 10 kWp utility interactive photovoltaic system at Maungaraki school, Wellington, New Zealand. Energy 2017, 120, 573–583. [Google Scholar]
  23. Kim, J.-Y.; Jeon, G.-Y.; Hong, W.-H. The performance and economical analysis of grid-connected photovoltaic systems in Daegu, Korea. Appl. Energy 2009, 86, 265–272. [Google Scholar] [CrossRef]
  24. Abdillah, M.; Satria, F.M.; Pertiwi, N.I.; Setiadi, H. Design of photovoltaic system for public school building. Indones. J. Electr. Eng. Comput. Sci. 2023, 29, 56–65. [Google Scholar] [CrossRef]
  25. Bilir, L.; Yildirim, N. Photovoltaic system assessment for a school building. Int. J. Hydrog. Energy 2017, 42, 17856–17868. [Google Scholar] [CrossRef]
  26. Bakri, J.A.; Badmus, I.; Hammed, S.O. Comparative Assessment of Solar Photovoltaic System and Diesel Generating Set for Energy Sustainability in Engineering Buildings of Yaba College of Technology. Eur. J. Energy Res. 2022, 2, 10–16. [Google Scholar]
  27. Allouhi, A.; Saadani, R.; Kousksou, T.; Saidur, R.; Jamil, A.; Rahmoune, M. Grid-connected PV systems installed on institutional buildings: Technology comparison, energy analysis and economic performance. Energy Build. 2016, 130, 188–201. [Google Scholar] [CrossRef]
  28. Ibrik, I.; Hashaika, F. Techno-Economic Impact of Grid-Connected Rooftop Solar PV System for Schools in Palestine: A Case Study of Three Schools. Int. J. Energy Econ. Policy 2019, 9, 291–300. [Google Scholar]
  29. Husain, A.; Jawad, S. Solar Photovoltaic Systems on Public Schools Buildings: A Case Study in Palestine. Am. J. Electr. Power Energy Syst. 2021, 10, 1–5. [Google Scholar]
  30. Al-Otaibi, A.; Al-Qattan, A.; Fairouz, F.; Al-Mulla, A. Performance evaluation of photovoltaic systems on Kuwaiti schools’ rooftop. Energy Convers. Manag. 2015, 95, 110–119. [Google Scholar]
  31. Hajiah, A.E.; Khatib, T.; Sopian, K.; Sebzali, M. Performance of grid-connected photovoltaic system in two sites in kuwait. Int. J. Photoenergy 2012, 2012, 1–7. [Google Scholar] [CrossRef]
  32. Kazem, H.A.; Khatib, T. Techno-economical assessment of grid connected photovoltaic power systems productivity in Sohar, Oman. Sustain. Energy Technol. Assess. 2013, 3, 61–65. [Google Scholar]
  33. Alfaoyzan, F.A.; Almasri, R.A. Utilizing solar photovoltaic systems in educational facilities to achieve a zero bill campus: The Sulaiman Al-Rajhi University case. Energy Explor. Exploit. 2023, 41, 1415–1438. [Google Scholar]
  34. Tazay, A. Techno-Economic Feasibility Analysis of a Hybrid Renewable Energy Supply Options for University Buildings in Saudi Arabia. Open Eng. 2021, 11, 39–55. [Google Scholar]
  35. Baseer, M.A.; Alqahtani, A.; Rehman, S. Techno-economic design and evaluation of hybrid energy systems for residential communities: Case study of Jubail industrial city. J. Clean. Prod. 2019, 237, 117806. [Google Scholar]
  36. Al-Anazi, M.A.; Almasri, R.A. Evaluation of potential capabilities of energy savings and utilization of solar energy in mosques in Hail city, Kingdom of Saudi Arabia. Energy Explor. Exploit. 2023, 41, 1051–1084. [Google Scholar] [CrossRef]
  37. Alfaoyzan, F.A.; Almasri, R.A. Benchmarking of Energy Consumption in Higher Education Buildings in Saudi Arabia to Be Sustainable: Sulaiman Al-Rajhi University Case. Energies 2023, 16, 1204. [Google Scholar] [CrossRef]
  38. Al-Fouzan, A.A.; Almasri, R.A. A Sustainable Solution for Urban Transport Using Photovoltaic Electric Vehicle Charging Stations: A Case Study of the City of Hail in Saudi Arabia. Appl. Sci. 2024, 14, 5422. [Google Scholar] [CrossRef]
  39. Almasri, R.A.; Al-Anazi, M.A.; Almarshoud, A.; Alshitawi, M.S.; Abu-Hamdeh, N.H. Investigating energy efficiency and solar energy in Saudi mosques to achieve zero energy or zero bill. Alex. Eng. J. 2023, 68, 263–280. [Google Scholar] [CrossRef]
  40. AlKassem, A.; Draou, A.; Alamri, A.; Alharbi, H. Design Analysis of an Optimal Microgrid System for the Integration of Renewable Energy Sources at a University Campus. Sustainability 2022, 14, 4175. [Google Scholar] [CrossRef]
  41. Almarshoud, A.F. Technical and Economic Performance of 1MW Grid-connected PV system in Saudi Arabia. Int. J. Eng. Res. Appl. 2017, 7, 9–17. [Google Scholar] [CrossRef]
  42. Saudi Building Energy Conservation Code-Residential SBC 602; Saudi Building Code National Committee: Riyadh, Saudi Arabia, 2018; p. 64. Available online: https://www.sbc.gov.sa/En/BuildingCode/Pages/SBC_602E.aspx (accessed on 26 February 2025).
  43. Almasri, R.A.; Akram, R.; Almarshoud, A.; Omar, H.M.; Alshitawi, M.S.; Esmaeil, K.K. Evaluation of the total exergy and energy consumptions in residential sector in Qassim Region, Saudi Arabia. Alex. Eng. J. 2022, 62, 455–473. [Google Scholar] [CrossRef]
  44. Almotairy, F.H.; Almarshoud, A.F. Achieving zero-bill for the grid-connected PV systems in Saudi Arabia governmental schools: A techno-economic analysis. Future Energy 2024, 3, 14–23. [Google Scholar] [CrossRef]
  45. Abdulkareem, A.; Ellaboudy, A. Saudi Arabia News Brief and Action Alert, Saudi Electricity Company. 2023. Available online: https://www.climatescorecard.org/2023/01/saudi-electricity-company/ (accessed on 28 October 2024).
  46. Ghenai, C.; Bettayeb, M. Modelling and performance analysis of a stand-alone hybrid solar PV/Fuel Cell/Diesel Generator power system for university building. Energy 2019, 171, 180–189. [Google Scholar] [CrossRef]
  47. Degree Days Calculated Accurately for Locations Worldwide. 2024. Available online: https://www.degreedays.net/ (accessed on 18 October 2024).
  48. Solar Panel Cost. 2023. Available online: https://www.solar.com/learn/solar-panel-cost/ (accessed on 9 November 2024).
  49. Das, M.; Singh, M.N.K.; Biswas, A. Techno-economic optimization of an off-grid hybrid renewable energy system using metaheuristic optimization approaches—Case of a radio transmitter station in India. Energy Convers. Manag. 2019, 185, 339–352. [Google Scholar] [CrossRef]
  50. Gaabour, A.; Metatla, A.; Kelaiaia, R.; Bourennani, F.; Kerboua, A. Recent bibliography on the optimization of multi-source energy systems. Arch. Comput. Methods Eng. 2019, 26, 809–830. [Google Scholar] [CrossRef]
Figure 1. Flow chart of the research methodology.
Applsci 15 03809 g001
Figure 2. Qassim region’s average monthly weather data are derived from one-minute interval recordings [43]; GTI is the irradiance incident on a tilted plane at an angle equal to the city latitude.
Applsci 15 03809 g002
Figure 3. Generated electricity from PV and consumed energy along the project life cycle for zero-energy scenario for the three schools.
Applsci 15 03809 g003
Figure 4. Energy and costs along the project life cycle for school 1.
Applsci 15 03809 g004
Figure 5. Energy and costs along the project life cycle for school 2.
Applsci 15 03809 g005
Figure 6. Energy and costs along the project life cycle for school 3.
Applsci 15 03809 g006
Figure 7. Technical and economic parameters of the investigated schools for zero bill with variable PV tariff for school 3.
Applsci 15 03809 g007
Table 1. System capacity, SPBP, and LCOE of PV systems.
Application and LocationSystem, Capacity (kWP)SPBP (Years)LCOE ($/kWh)References, Date
Mutla and Al-Wafra, KuwaitGrid-connected PV systems, 100.015.000.100Hajiah et al. [31], 2012
Sohar University campus in Sohar, OmanGrid-connected PV systems, 3.08-0.158Kazem and Khatib [32], 2013
At Sulaiman Al-Rajhi University, KSAGrid-connected PV systems, 1200.0 and 5300.08.10–10.000.026–0.028Alfaoyzan and Almasri [33,37], 2023
Colleges in KSAHybrid RE system, 62.017.000.0688–0.0753Tazay [34], 2021
Jubail Industrial City, KSAOn-off-grid-connected PV/wind/DG, 685.0, 463.0, and 270.0-0.183–0.244Baseer et al. [35], 2019
Electric vehicle charging stations in Hail City, KSAGrid-connected PV systems, 1047.3511.690.022Al-fouzan and Almasri [38], 2024
Mosques in Qassim region, KSAGrid-connected PV systems, 12.0 and 17.03.70–4.10-Almasri et al. [39], 2023
Mosques in Hail City, KSAGrid-connected PV systems, 18.0 and 72.05.140.024Al-Anazi and Almasri [36], 2023
School in Arar City, KSAGrid-connected PV systems, 150.08.26-Alfaraidy and Sulieman [4], 2019
Islamic University of Madinah, KSAPV system, 1500.018.600.051AlKassem et al. [40], 2022
Power plant in Qassim region, KSAGrid-connected PV systems, 1000.013.700.036Almarshoud [41], 2017
Table 2. Monthly electric energy consumption of the investigated schools.
MonthSchool 1 (kWh/Month)School 2 (kWh/Month)School 3 (kWh/Month)
1606917,0469359
2575810,2897157
3498014,2812753
4664017,8132753
5425430,25223,672
6466918,2746056
7435864506606
812,13954,36134,682
914,83657,12648,445
1010,99884467707
11581020,5773303
12389122,34312,111
Table 3. Annual electrical energy consumption indicators.
Annual Electrical Energy Consumption (kWh)EUI
(kWh/m2)
CPC
(kWh/Capita)
School 1 84,40222630
School 2 277,25937417
School 3 164,60348337
Table 4. Summary of the electricity usage.
CDD (°C-Day) HDDAC (%)Light
(%)
Other
(%)
Reference—Date
School buildings in Qassim, KSA197258880119Present case
School buildings in Arar City, KSA241939071920Alfaraidy and Sulieman [4]—2019
Supervision Building, University of Sharjah, UAE239144721018Ghenai and Bettayeb [46]—2019
Sulaiman Al-Rajhi University in Qassim, KSA197258879714Alfaoyzan and Almasri [37]—2023
Table 5. Available roof area, maximum number of PV modules, installed modules number, and economic parameters of the investigated schools for zero energy.
ParameterSchool 1School 2School 3
Annual load (kWh/year)84,402277,259164,603
Available roof area (m2)164635321391
Maximum number of PV modules on the roof351782290
Installed modules number116374222
PV Peak power (kW)63.8205.7122.1
SPBP (year)Undiscounted7.697.567.56
Discounted11.7511.4611.46
LCOE ($/kWh)0.02290.02520.0249
Annual yield factor (kWh/kWP)195019941994
Capacity factor (%)22.2622.3322.33
Performance ratio (%)86.8188.8488.84
Table 6. Technical and economic parameters of the investigated schools for zero bill.
ParameterSchool 1School 2School 3
Load (kWh/year)84,402277,259164,603
Maximum number of PV modules on the roof351782290
Installed modules number166622436
PV Peak power (kW)91.3342.1239.8
SPBP (year)Undiscounted10.5811.8513.64
Discounted20.2425.9339.14
LCOE ($/kWh)0.02230.01840.0194
Table 7. The sum of PV-generated electricity and reduction of CO2 during the 25 years with zero-energy scenario and zero-bill scenario.
Zero-Energy ScenarioZero-Bill Scenario
Installed Modules NumberPV-Generated Electricity (MWh)Reduction of CO2 (Tonne)Installed Modules NumberPV-Generated Electricity (MWh)Reduction of CO2 (Tonne)
School 11162855.11624.51664085.72324.8
School 23749411.55355.162215,652.38906.1
School 32225586.53178.743610,971.76242.9
Total71217,853.110,158.4122430,709.717,473.8
Average per school2385951.03386.140810,236.65824.6
Table 8. In two scenarios, the average electricity generated and CO2 saved from installing PV systems on each school’s roof and the KSA’s.
Zero-Energy ScenarioZero-Bill Scenario
PV-Generated Electricity (MWh)Reduction of CO2 (Tonne)PV-Generated Electricity (MWh)Reduction of CO2 (Tonne)
Average per school5951.03386.110,236.65824.6
Total in KSA143,270,32581,520,358246,446,145140,227,245
Disclaimer/Publisher’s Note: The statements, opinions and data contained in all publications are solely those of the individual author(s) and contributor(s) and not of MDPI and/or the editor(s). MDPI and/or the editor(s) disclaim responsibility for any injury to people or property resulting from any ideas, methods, instructions or products referred to in the content.

