1. Introduction
Fatigue cracking constitutes one of the predominant forms of deterioration observed in flexible pavements [
1]. Fatigue cracking in asphalt pavements, also known as alligator cracking, is a form of structural failure caused by repeated traffic loading on pavements that are inadequately designed, constructed with poor-quality materials, or have deteriorated over time [
2,
3].
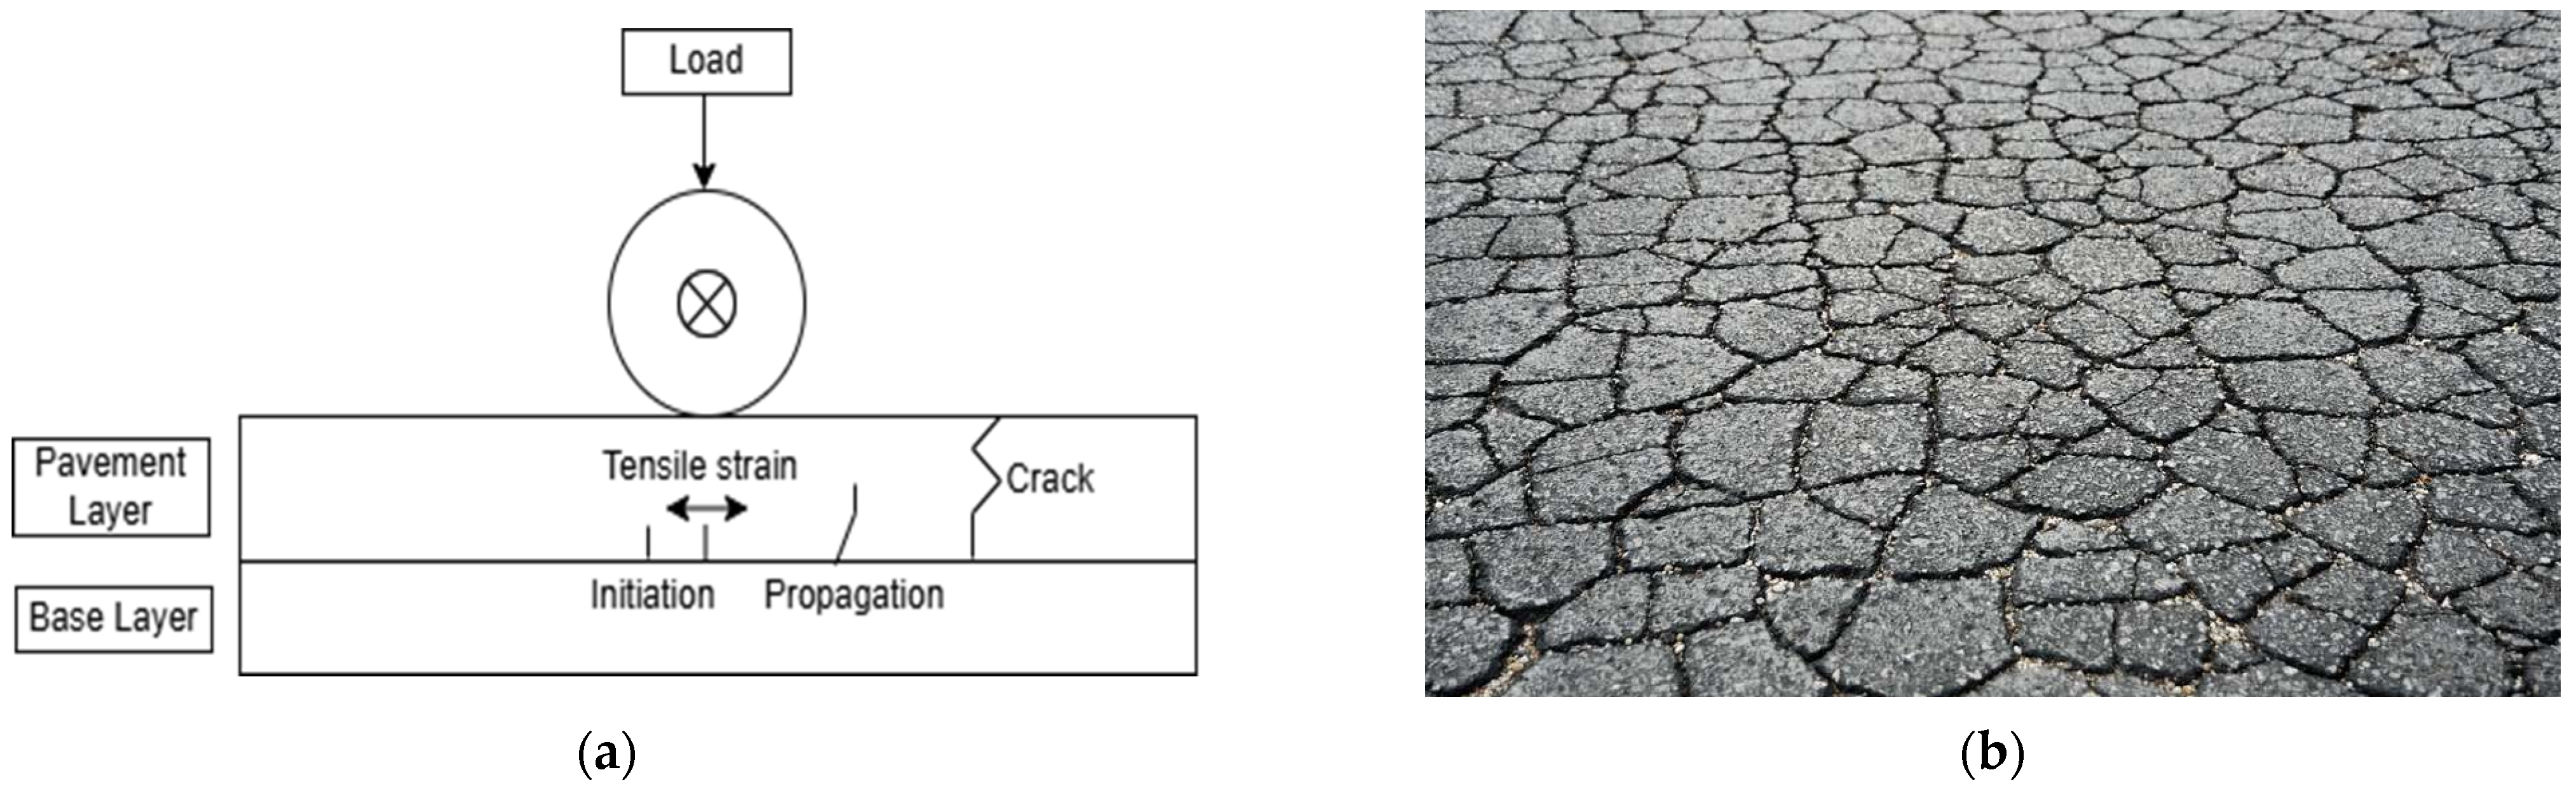
Figure 1a illustrates the mechanism of fatigue cracking in asphalt pavement layers, and
Figure 1b exhibits a distinct interconnected pattern, making it easier to visualize and understand its impact on pavement integrity. This type of distress starts at the bottom of the asphalt layer, gradually appearing on the surface as interconnected cracks that resemble alligator skin. Major contributors to fatigue cracking include overloading, aging of the asphalt binder, and moisture infiltration, which weakens the pavement structure [
4]. Effective mitigation involves early detection through regular inspections, timely preventive maintenance like crack sealing, and more robust repairs such as overlays or full-depth replacements.
To assess the load-bearing capacity of pavements, the Falling Weight Deflectometer (FWD) is an extensively utilized instrument. This device operates on a non-destructive evaluation principle, employing a mass that is released onto a load plate situated upon the pavement surface to emulate the loading scenarios characteristic of a dynamic wheel load. Its ability to accurately quantify pavement deflections and replicate vehicular loading conditions establishes it as an essential apparatus for appraising the structural robustness of pavements and predicting their prospective performance [
5]. Additionally, improving pavement design to handle actual traffic loads and enhancing drainage can help prevent the occurrence of fatigue cracking, extending the pavement’s lifespan and improving road safety. Sensors measure the resulting pavement deflection at various distances from the load plate, forming a deflection basin. The analysis of these data allows engineers to estimate the modulus of elasticity, bearing capacity, and stiffness of the pavement layers. This information is crucial for assessing pavement conditions, aiding in maintenance planning, validating design assumptions, and guiding future research. The FWD test plays a key role in ensuring efficient resource allocation for pavement maintenance and improving pavement design and performance.
In recent years, models of Artificial Intelligence (AI) have acquired significant recognition within the domain of pavement engineering due to their ability to analyze large datasets, identify patterns, and improve decision-making processes. At the network level, AI empowers transportation authorities to optimize maintenance schedules, allocate resources with precision, and forecast long-term trends in pavement performance. These insights help in developing proactive maintenance strategies, reducing costs, and extending pavement life. At the project level, models driven by AI augment the precision of pavement condition evaluations, thereby facilitating effective rehabilitation planning. High-accuracy predictions guarantee timely and economically viable interventions, thereby enhancing pavement resilience and the overall sustainability of infrastructure. The integration of AI with traditional engineering methods bridges gaps in predictive modeling, enabling more data-driven and informed decision-making for pavement management. In this study, the Normalized Comprehensive Area Ratio (CAr’), a parameter introduced by Loganathan et al. [
6] to characterize the structural integrity of the asphalt pavement is used alongside other crucial pavement, traffic, and environmental factors to model fatigue cracking in an asphalt pavement using an Artificial Neural Network (ANN). This approach aims to enhance fatigue crack prediction accuracy, supporting better decision-making in pavement maintenance and rehabilitation planning. While many other models to predict fatigue cracking have been formulated, this novel study tries to incorporate FWD data along with other relevant factors for a more comprehensive model.
Figure 1.
(
a) Fatigue crack development process in asphalt pavements. (
b) Fatigue (alligator) crack in asphalt pavement [
7].
Figure 1.
(
a) Fatigue crack development process in asphalt pavements. (
b) Fatigue (alligator) crack in asphalt pavement [
7].
2. Literature Review
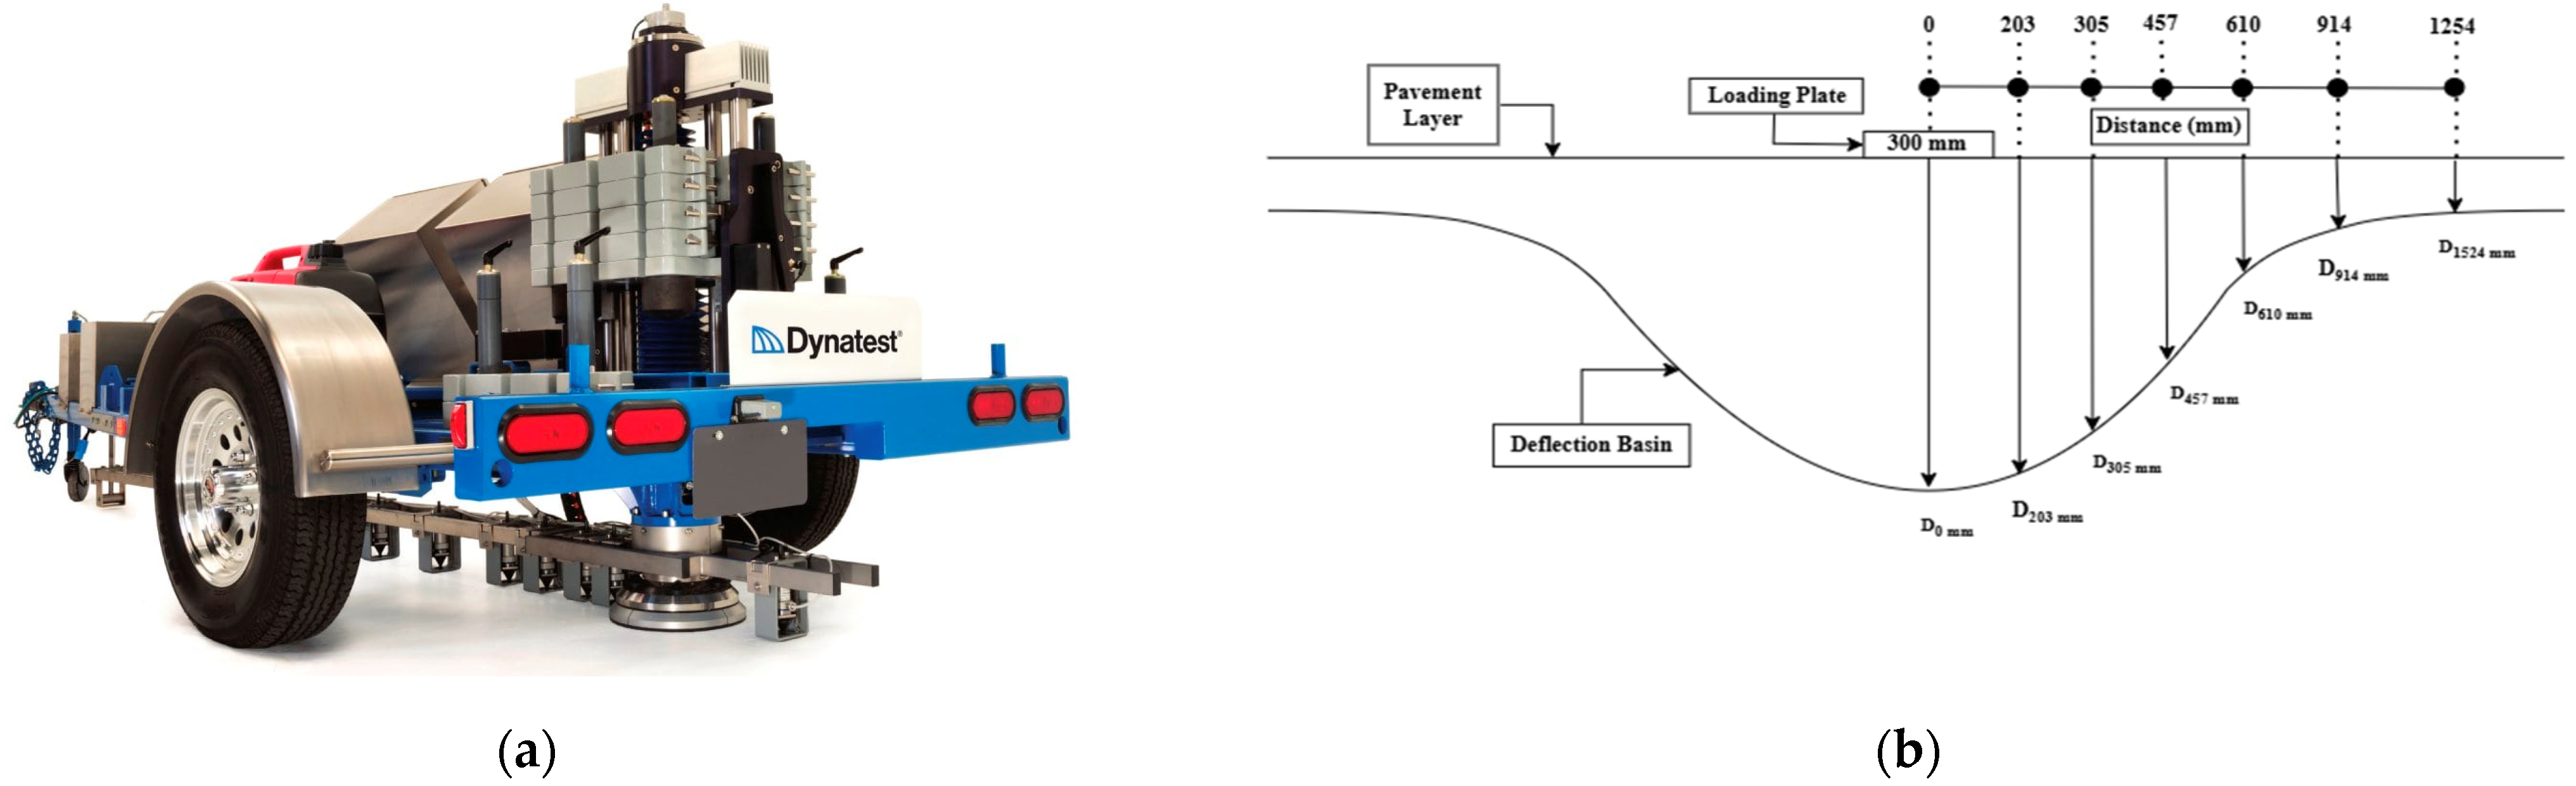
The FWD is a specialized device used to assess pavement deflection similar to that caused by a fast-moving truck. It operates by dropping a weight that transmits a load pulse through a 300 mm diameter circular load plate, momentarily deforming the pavement into a dish-like shape known as a deflection basin [
8]. The system consists of a deflectometer, a system processor, and a computer for data collection and analysis, as shown in
Figure 2. This deformation allows for the estimation of pavement stiffness through computational methods, considering the thickness and stiffness of individual pavement layers. The FWD is equipped with primary measurement devices including a load cell, which measures the force applied to the pavement, and deflection sensors, typically geophones, that record the shape of the deflection basin. The Long-Term Pavement Performance (LTPP) Program’s FWDs utilize nine deflection sensors positioned at fixed distances from the load plate [
8]. Researchers have always tried to utilize the valuable insight that FWD data provide about the structural integrity of the pavement [
9,
10]. The primary objective of collecting and analyzing FWD data lies in its application toward assessing the “pavement performance” of existing roadways. These data enable the study of pavement performance indicators, such as asphalt concrete (AC) fatigue and rutting, under expected traffic loads. This is achieved by conducting a layered elastic analysis, which utilizes the layer moduli derived from the FWD measurements as critical inputs [
11]. Gedafa et al. used the center deflection value from FDW data to predict the Remaining Service Life (RSL) of the pavement [
12]. Through a comprehensive examination of the FWD data, a research initiative undertaken by [
13], sought to develop a robust methodology for evaluating the structural integrity of road pavements, designed with the purpose of facilitating seamless incorporation into databases overseen by transportation agencies. Saleh et al. [
14] introduced the area ratio and the normalized area ratio as better indicators of the structural capacity of asphalt concrete than deflection parameters. The Structural Adequacy Index, abbreviated as SAI, was an original measure conceived by Haas et al. [
15], which emerged from a unique deflection reading gathered via the Benkelman beam evaluation. Considering that this metric is predicated on a single deflection value, even minor discrepancies in measurement could adversely affect its validity. The back-calculation method of utilizing FWD data requires layer thickness information, which might not be readily available, so, deflection basin parameters from the FWD data were utilized to infer the structural condition of the pavement [
16].
A study by Rabbi and Mishra [
18] aimed to develop an efficient method for assessing the structural condition of pavements at the network level using FWD data, specifically designed for easy integration into transportation agency databases. The method utilized deflection and area ratio parameters to evaluate pavement capacity and health, facilitating the numerical ranking of pavement conditions.
Figure 2b illustrates the deflection basin formed during Falling Weight Deflectometer (FWD) testing in which pavement surface deflections are measured at various distances from the loading plate. These deflection values help assess the pavement stiffness and structural integrity. This approach simplifies the assessment process compared to the traditional, more complex back-calculation method. The newly developed parameter, Normalized Comprehensive Area Ratio (CAr’), demonstrates a strong correlation (R2 = 0.96) with pavement fatigue failure predictions, aiding in more informed decision-making for maintenance and rehabilitation strategies within Project Management Systems (PMSs). The (CAr’) is calculated as shown in Equation (1).
where D
0 is the center deflection, D1524 is the deflection at offset 1524 mm from the load, and D
i is the deflection at offset i (mm) from the load.
In order to evaluate how various traffic, environmental, and pavement factors affect the pavement performance, Bhandari et al. [
19] utilized data from the LTPP database and applied various statistical methods. The age of the pavement, base type, cumulative traffic intensity, HMA thickness, temperature, and precipitation were identified as the most critical variables influencing pavement performance. Wang et al., in their study, conducted a survival analysis of asphalt pavements utilizing the LTPP database, and it was found that layer thickness, traffic level, precipitation, and freeze–thaw cycles are the main factors influencing fatigue cracking [
20]. Haider et al. [
21] identified the base type to be a more influential factor in alligator cracking than the HMA thickness. This study also identified climatic conditions to have a significant say in fatigue cracking in a pavement. Pavements with a low thickness are more prone to bottom-up fatigue cracking [
22]. Hatoum et al. [
23] conducted a survival analysis of asphalt pavements and studied the effects of pavement thickness and number of axles, among other variables. Their study demonstrated a clear relationship between increased pavement thickness and improved fatigue service life and the effect of an increase in overweight axles to the equivalent AADTT.
Among the environmental factors affecting asphalt pavement, temperature factors are found to be more significant than other factors like precipitation, wind speed, percent sunshine, and groundwater level [
24]. In a study conducted, a robust relationship between as-constructed air voids and fatigue cracking could not be established [
25].
Artificial Neural Networks (ANNs) are becoming more prevalent in the modeling of pavement characteristics because of their ability to process complex and non-linear relationships among input variables and outputs. This capability renders ANNs particularly effective for predicting, analyzing, and optimizing various facets of pavement performance. Recognizing the value of ANNs in scientific research, scholars globally across all scientific disciplines have adopted ANNs as a key modeling tool. Pavement engineers and researchers are no exception and have significantly benefited from incorporating ANNs into their research and studies. Numerous other researchers have utilized ANN to characterize the nonlinear and complex relationship between various pavement parameters for modeling fatigue cracking in asphalt pavements [
26,
27].
5. Data Collection and Processing
For this research, the data were gathered from the LTPP Info pave database. The primary dataset utilized for the analysis includes the FWD data and the Comprehensive Area Ratio (CAr’), which is derived using FWD deflection data obtained from the LTPP database. It is derived from deflections measured at various sensor locations relative to the center of the FWD load plate, providing a comprehensive evaluation of pavement response. This parameter helps to quantify the pavement’s structural integrity by analyzing deflection patterns under applied loads. Additional parameters chosen for this study are Thickness (T) in inches, mean Asphalt Content (AC) in the AC layer (% by weight), air void (AV) average calculated air voids in the AC layer (%), Cumulative Traffic Load expressed as KESAL (passing of 1000 standard axle of 18 kips), and Annual Average Temperature (TEMP) in °C. These parameters were selected to comprehensively cover various factors that influence pavement distress, encompassing traffic characteristics, climatic conditions, and specific pavement properties. The variables in this study are selected based on the standards established by the Long-Term Pavement Performance (LTPP) program to ensure precision and uniformity:
Pavement Thickness: Defined as the thickness of the asphalt or bituminous layers, measured from core samples obtained at designated test sections. The base and subgrade layers are deliberately excluded.
Asphalt Content: Refers to the proportion of asphalt binder by weight within the asphalt mixture. This is determined through extraction tests conducted on samples retrieved from the LTPP database.
Air Voids: Represents the percentage of void spaces within the densified asphalt mixture. This is calculated based on the difference between the theoretical maximum specific gravity and the bulk specific gravity of the mixture, which is crucial for assessing compaction quality and long-term performance.
Cumulative Traffic Load: Expressed in thousands of Equivalent Single Axle Loads (KESALs), this metric quantifies the total accumulated traffic load over a given period. It is derived from traffic monitoring data collected at each test location and is essential for evaluating pavement degradation and functionality.
Annual Average Temperature: Represents the mean temperature over a calendar year at the test site, utilizing data from the extensive climate records maintained by the LTPP program.
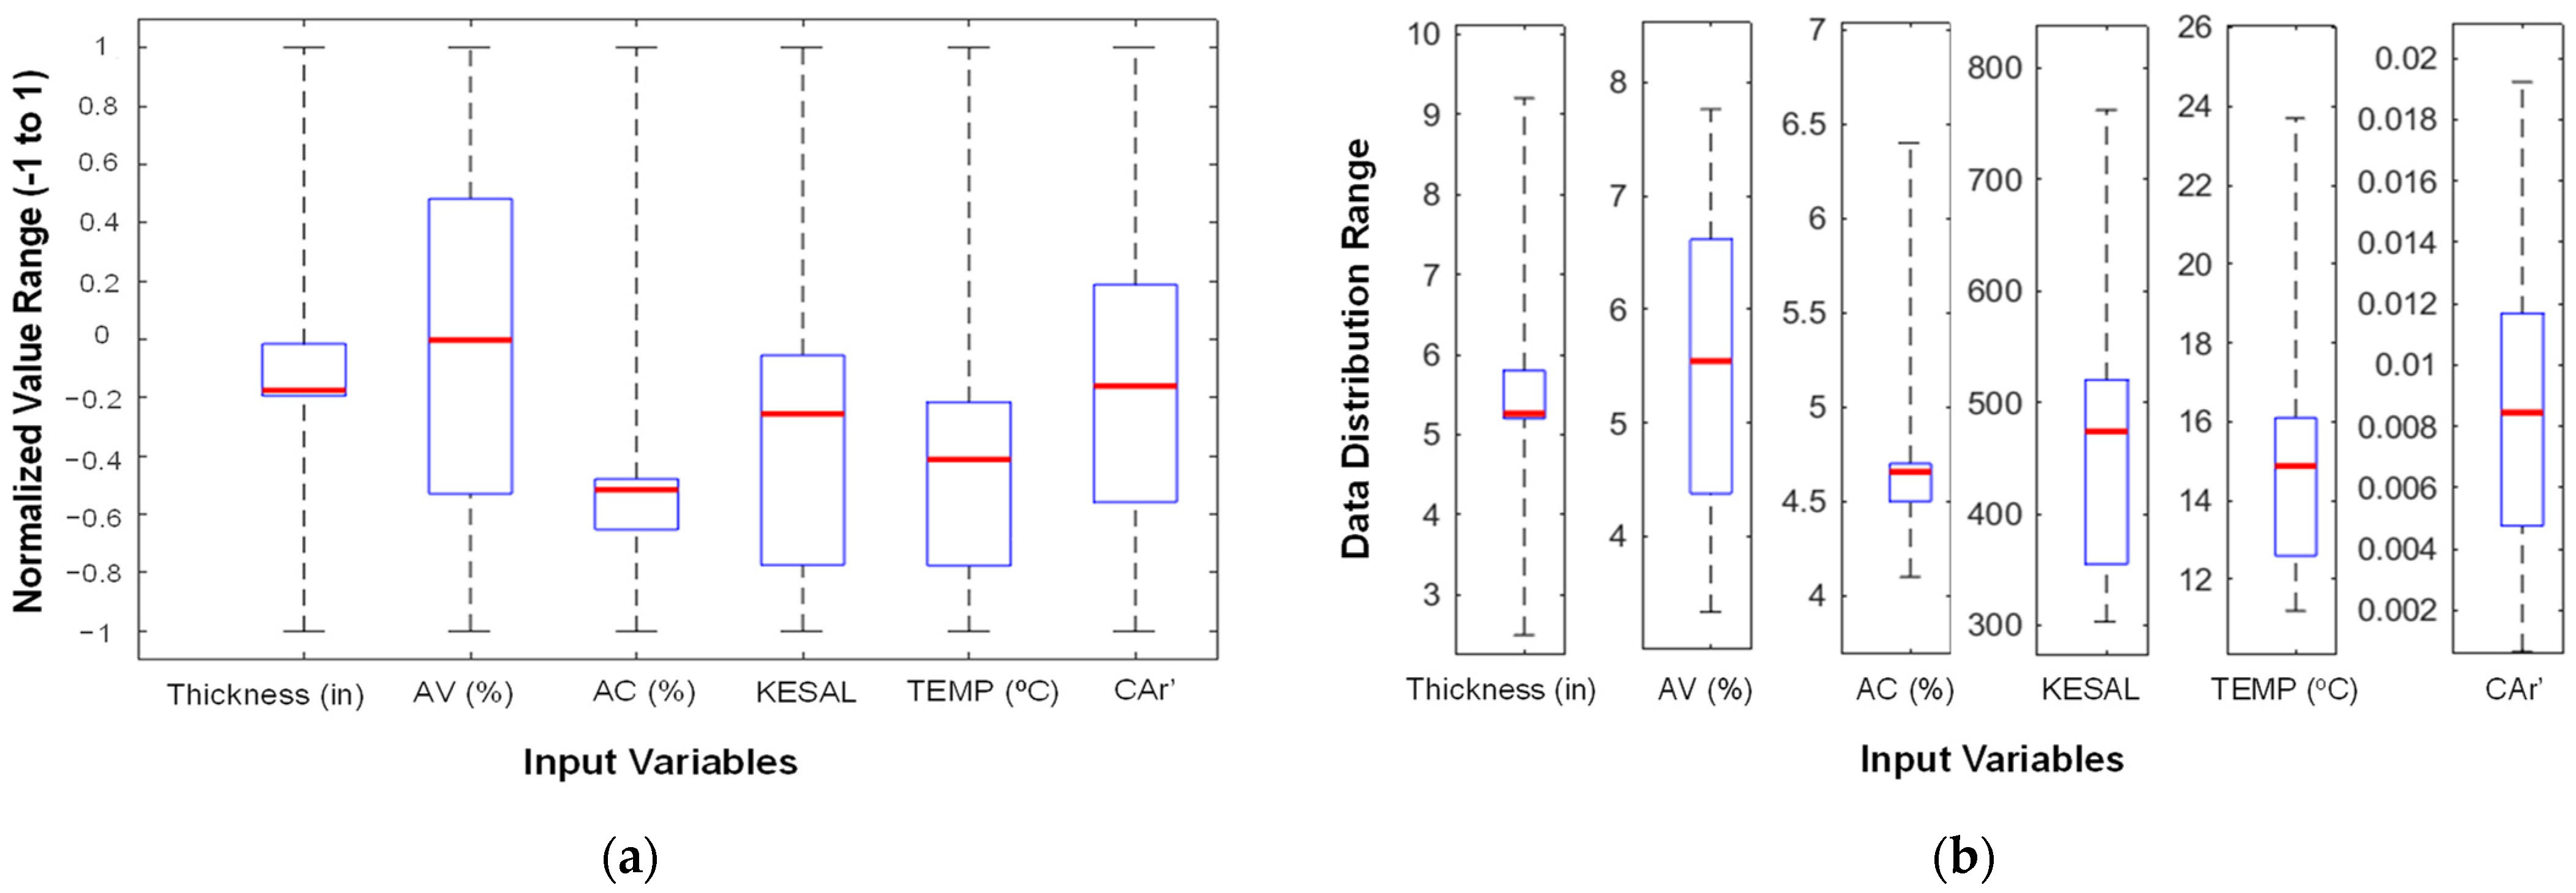
Figure 3 illustrates the distribution of input variables employed in the predictive model via box plots, thereby offering insights into their variability and statistical properties.
Figure 3a delineates the normalized input variables, wherein values are scaled within the range of −1 to 1, thereby ensuring uniformity in model training and mitigating the risk of variables with larger magnitudes overshadowing the learning process. This normalization process augments comparability among diverse variables, including pavement thickness, air voids, asphalt content, cumulative traffic load (KESAL), temperature, and CAr’.
Figure 3b displays the distribution of the raw data for the variables mentioned earlier before normalization, which reflects their inherent ranges. The box plots convey critical statistical indicators, such as median, interquartile range, and potential outliers, which facilitate the evaluation of the dataset’s spread and variability. This visualization is paramount for comprehending the distribution of input parameters, identifying data imbalances, and ensuring the model’s robustness in forecasting fatigue cracking.
The selection of these inputs was informed by an extensive review of the literature focusing on fatigue cracking in asphalt pavements. A total of 311 datapoints were collected from the LTPP database, representing a wide range of climatic zones. The dataset includes data from seven U.S. states—Texas, Arizona, New Jersey, Kansas, Oklahoma, Florida, and Arkansas—highlighting diverse climatic zones essential for asphalt pavement analysis. These states encompass all four primary climatic zones pertinent to pavement performance: Wet Freeze, Wet No-Freeze, Dry Freeze, and Dry No-Freeze. For example, New Jersey and parts of Kansas are categorized under the Wet Freeze zone due to their cold winters and substantial precipitation. Texas and Florida, characterized by high humidity and rainfall without freezing temperatures, exemplify the Wet No-Freeze zone. The Dry Freeze zone is represented by certain areas in Kansas, while Arizona primarily illustrates the Dry No-Freeze zone due to its arid climate. This varied selection of states guarantees that the dataset reflects the diverse climatic conditions throughout the U.S., providing a robust basis for examining the influence of different climates on asphalt pavement performance. This dataset includes information from 19 LTPP sections across 7 states in the United States. The geographic distribution of the LTPP sections analyzed in this study is depicted in
Figure 4, providing a visual overview of the areas covered in this analysis. This broad sampling helps ensure that the findings are applicable across diverse environmental conditions and traffic patterns.
The model’s design features an architecture with six different inputs feeding into the input layer, followed by a hidden layer that contains two neurons and culminates with an output variable tasked with predicting the area affected by fatigue cracking. In the Long-Term Pavement Performance (LTPP) database, fatigue cracking is classified into three categories, reflecting varying levels of distress [
28]. The total area of cracking is computed by summing the areas corresponding to all three levels of distress.
To assess the relationship between the inputs and the predicted output, a linear regression analysis was conducted, resulting in an R
2 value of 0.583. This coefficient of determination is relatively substantial for a multiple linear regression model, suggesting a moderate level of explanatory power regarding how well the input variables predict the output variable. However, it is acknowledged that the accuracy of the predictions could be enhanced by employing an ANN. ANNs are adept at capturing complex nonlinear relationships that linear regression might miss. The statistical relationship between the input variables and the output, as revealed through multiple linear regression, is detailed in
Table 1.
Figure 5 presents the multiple linear regression analysis between measured and predicted fatigue cracking. The multiple linear regression model articulated in Equation (2), alongside an R
2 value of 0.583, denotes a moderate degree of correlation, suggesting the model captures the trend but with some variability. This setup provides a foundational understanding that suggests potential improvements in predictive accuracy with the use of more advanced modeling techniques like ANNs.
FCA = Fatigue Cracking Area (m2);
TH = Thickness of HMA layer (in);
AV = Air Void (%);
AC = Asphalt Content (%);
KE = Cumulative ESAL (kESAL);
TEMP = Average Annual Temperature (°C);
CAR = Normalized Comprehensive Area Ratio (CAr’).
The Pearson correlation heatmap (
Figure 6) shows the relationships between pavement parameters and fatigue cracking. Fatigue crack correlates positively with thickness (0.37) and air void (0.33), while CA’r (−0.33) and temperature (−0.28) show negative correlations. The strongest negative correlation is between CA’r and air void (−0.56). These insights highlight key factors influencing fatigue cracking, aiding in pavement design optimization.
6. Artificial Neural Network Model Development
Artificial Neural Networks (ANNs) are fundamentally grounded in the architecture of biological neural systems and have gained significant traction across diverse disciplines [
29]. The intricate associations between inputs and outputs can be effectively modeled through nonlinear statistical techniques known as ANNs. A standard ANN features three unique layers: the input layer, one or more intermediate hidden layers, and the output layer. To facilitate the processes of learning and prediction, each neuron employs activation functions and weighted connections to systematically analyze inputs [
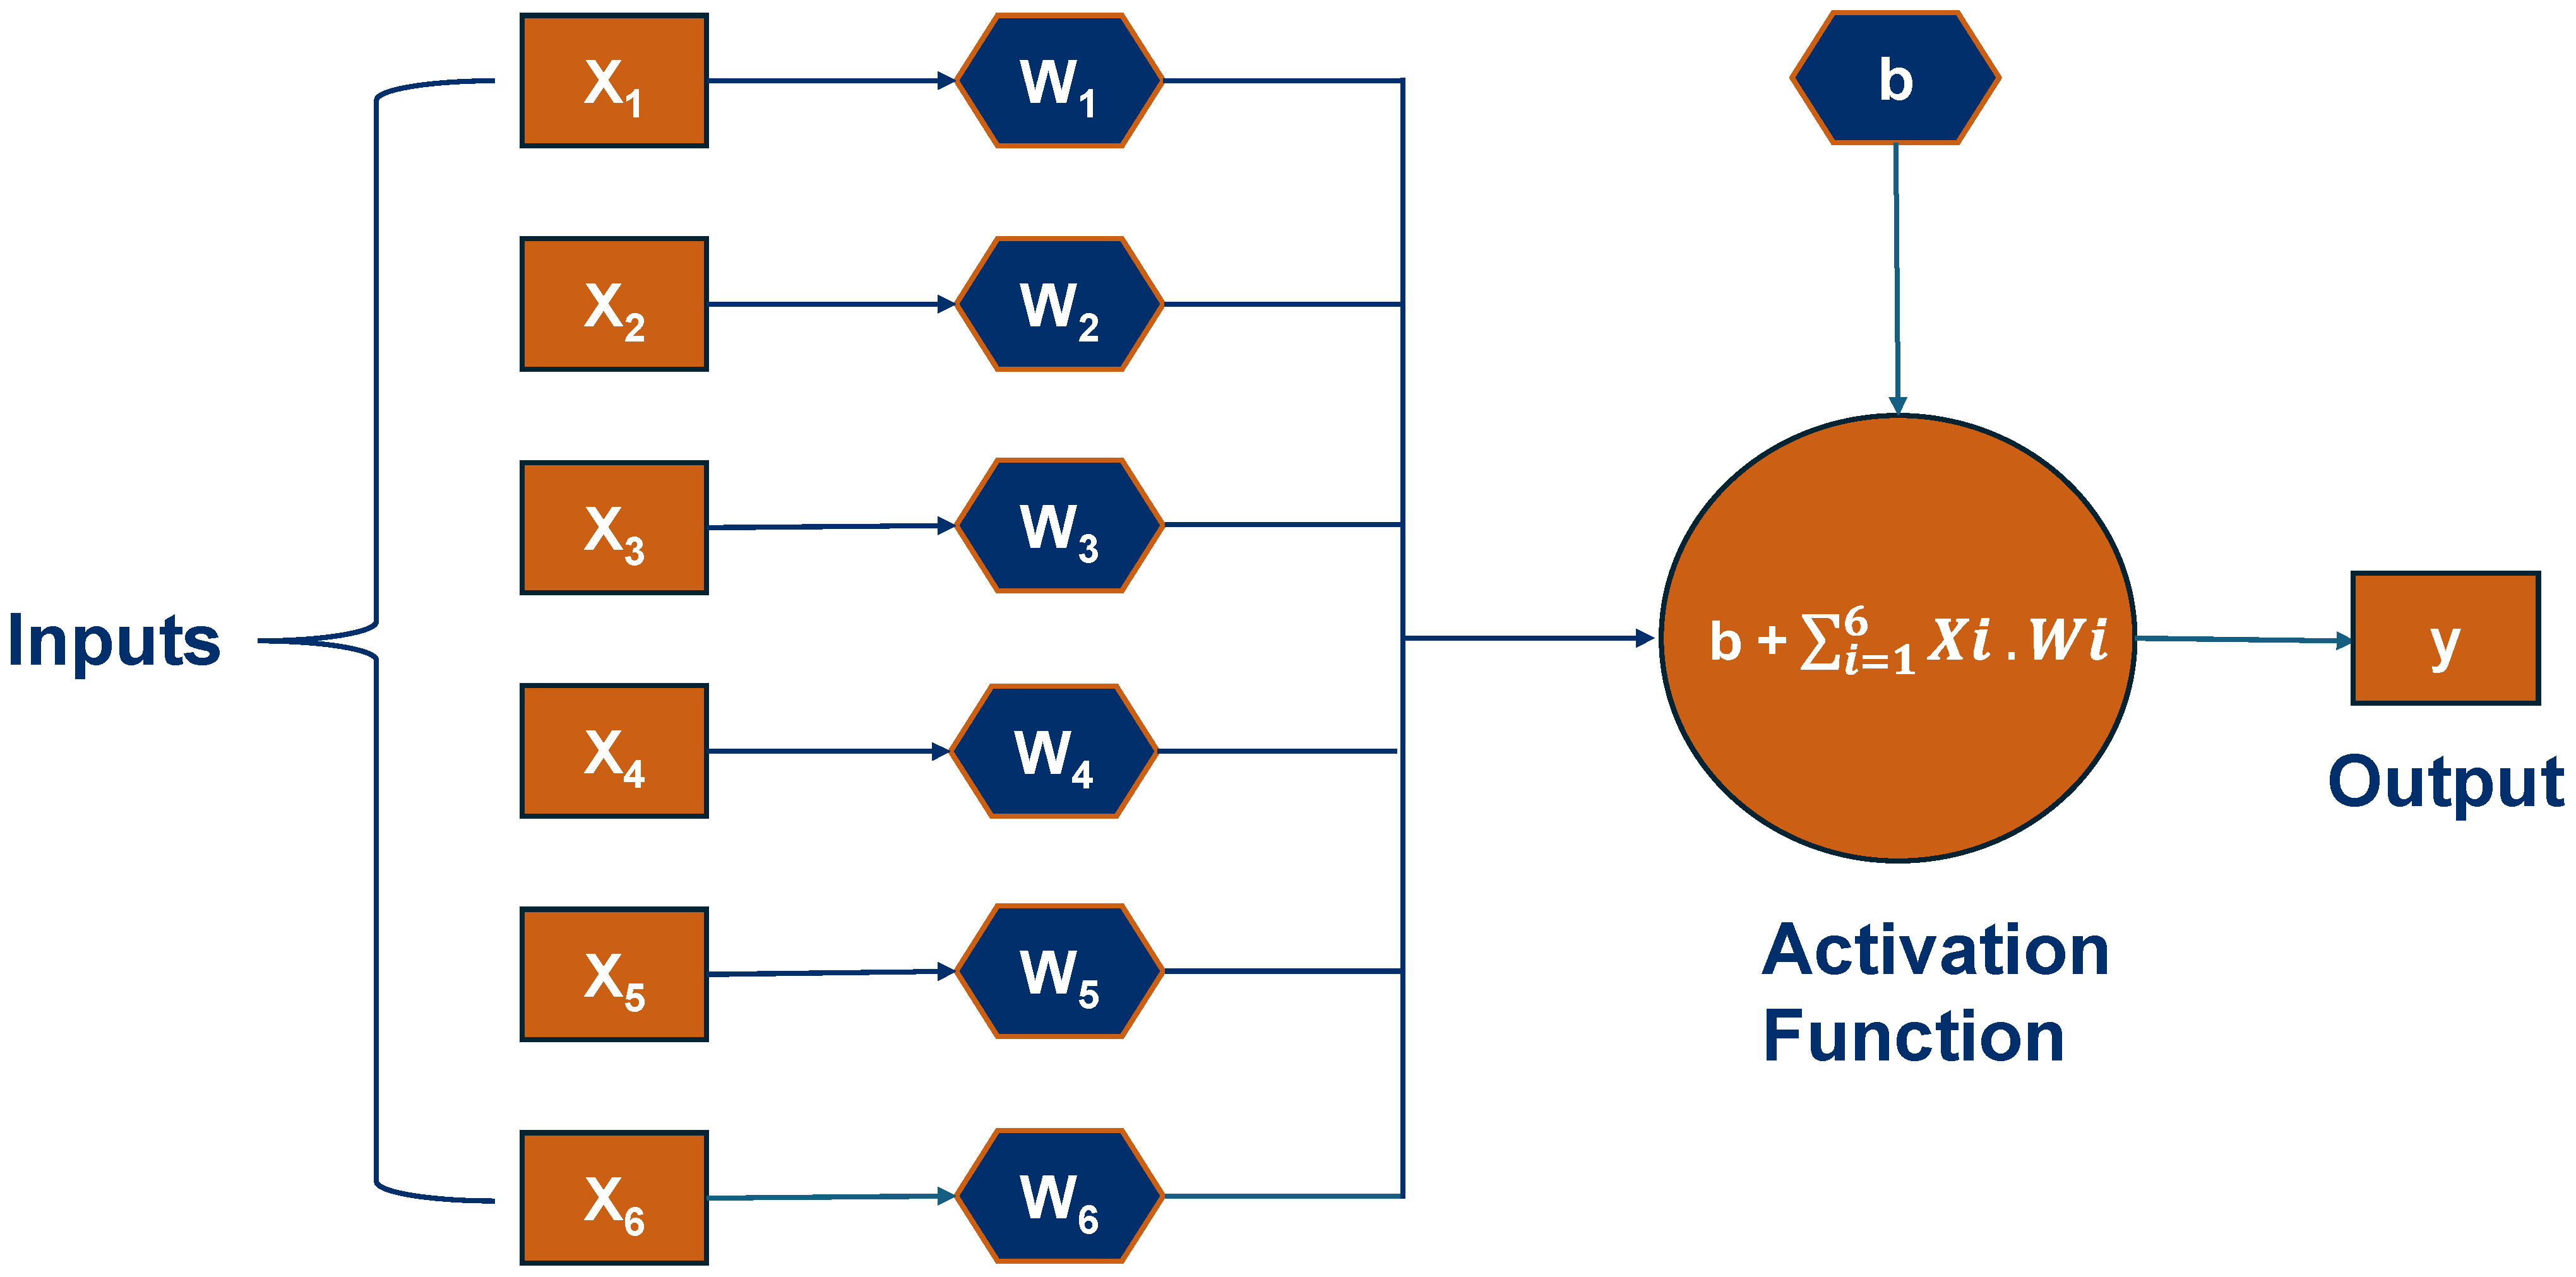
30].
The input layer processes normalized raw data within the range of [−1, 1] to enhance training stability and convergence. Normalization facilitates the equitable treatment of inputs, mitigating the impact of magnitude discrepancies on model efficacy [
31]. Each input variable is linked to hidden layer neurons via weighted connections and biases. These weights and biases constitute parameters acquired by the network throughout the training phase. The outputs from the hidden layer are transmitted to the output layer for further processing with weights and biases. The final output is derived from these weighted inputs. The output layer may employ distinct activation functions based on the task, including linear activation for regression and sigmoid or softmax for classification. The framework of an ANN model is shown in
Figure 7.
This study’s MATLAB 2024a implementation employed an ANN model of one hidden layer with two neurons to predict the fatigue cracking area of asphalt pavements. The ANN architecture illustrated in (
Figure 8) is employed for forecasting fatigue cracking in asphalt pavement, incorporating a comprehensive range of parameters across structural, climatic, and traffic-related factors.
After confirming the correlation of the input variables with the output variables, the 311 datapoints were used in the formulation of the prediction model for fatigue cracking in an asphalt pavement. The main objective of this study is to develop a prediction model that is simplified but still has a reasonably high R
2 value so that the predicted output represents the required output with high accuracy. The 311 datapoints were normalized first and fed into the input layer. The hidden layer performs computations using weighted inputs and transfer functions. The complexity of the model often depends on the number of hidden layers and the number of neurons in each layer. In our case, there was one hidden layer and two neurons. Of the 311 datapoints, 70% (217) datapoints were selected as training set, whereas the other 15% (47) were used for testing and the remaining 15% (47) were used for validation of the model. The Levenberg–Marquardt (LM) training algorithm is used for the formulation of the ANN model. The LM optimization method combines elements from both the Gauss–Newton algorithm and the method of gradient descent. It is particularly effective for solving least-squares problems, which are common in nonlinear curve fitting and data fitting applications. It is noteworthy that Artificial Neural Networks (ANNs) and other Machine Learning algorithms are frequently regarded as “black box” methodologies due to their lack of transparency in demonstrating the influence of individual input variables on outcomes. In contrast to conventional models that offer explicit equations and defined relationships, ANNs discern patterns from data in a manner that often eludes straightforward interpretation. Although this characteristic enhances their efficacy in intricate predictions such as fatigue cracking, it implies that engineers may lack clarity regarding the rationale behind the model’s outputs [
32,
33,
34]. To mitigate this issue, sensitivity analysis and explainability methodologies can elucidate the most impactful factors, enhancing the transparency and practicality of the model’s decisions in real-world contexts. This method is highly appreciated in the fields of machine learning, statistics, and engineering for its efficiency in dealing with complex models that are nonlinear in their parameters. The learning process involves iteratively adjusting the weights of connections in the network to minimize the prediction error.
7. Result and Equation Extraction from Model
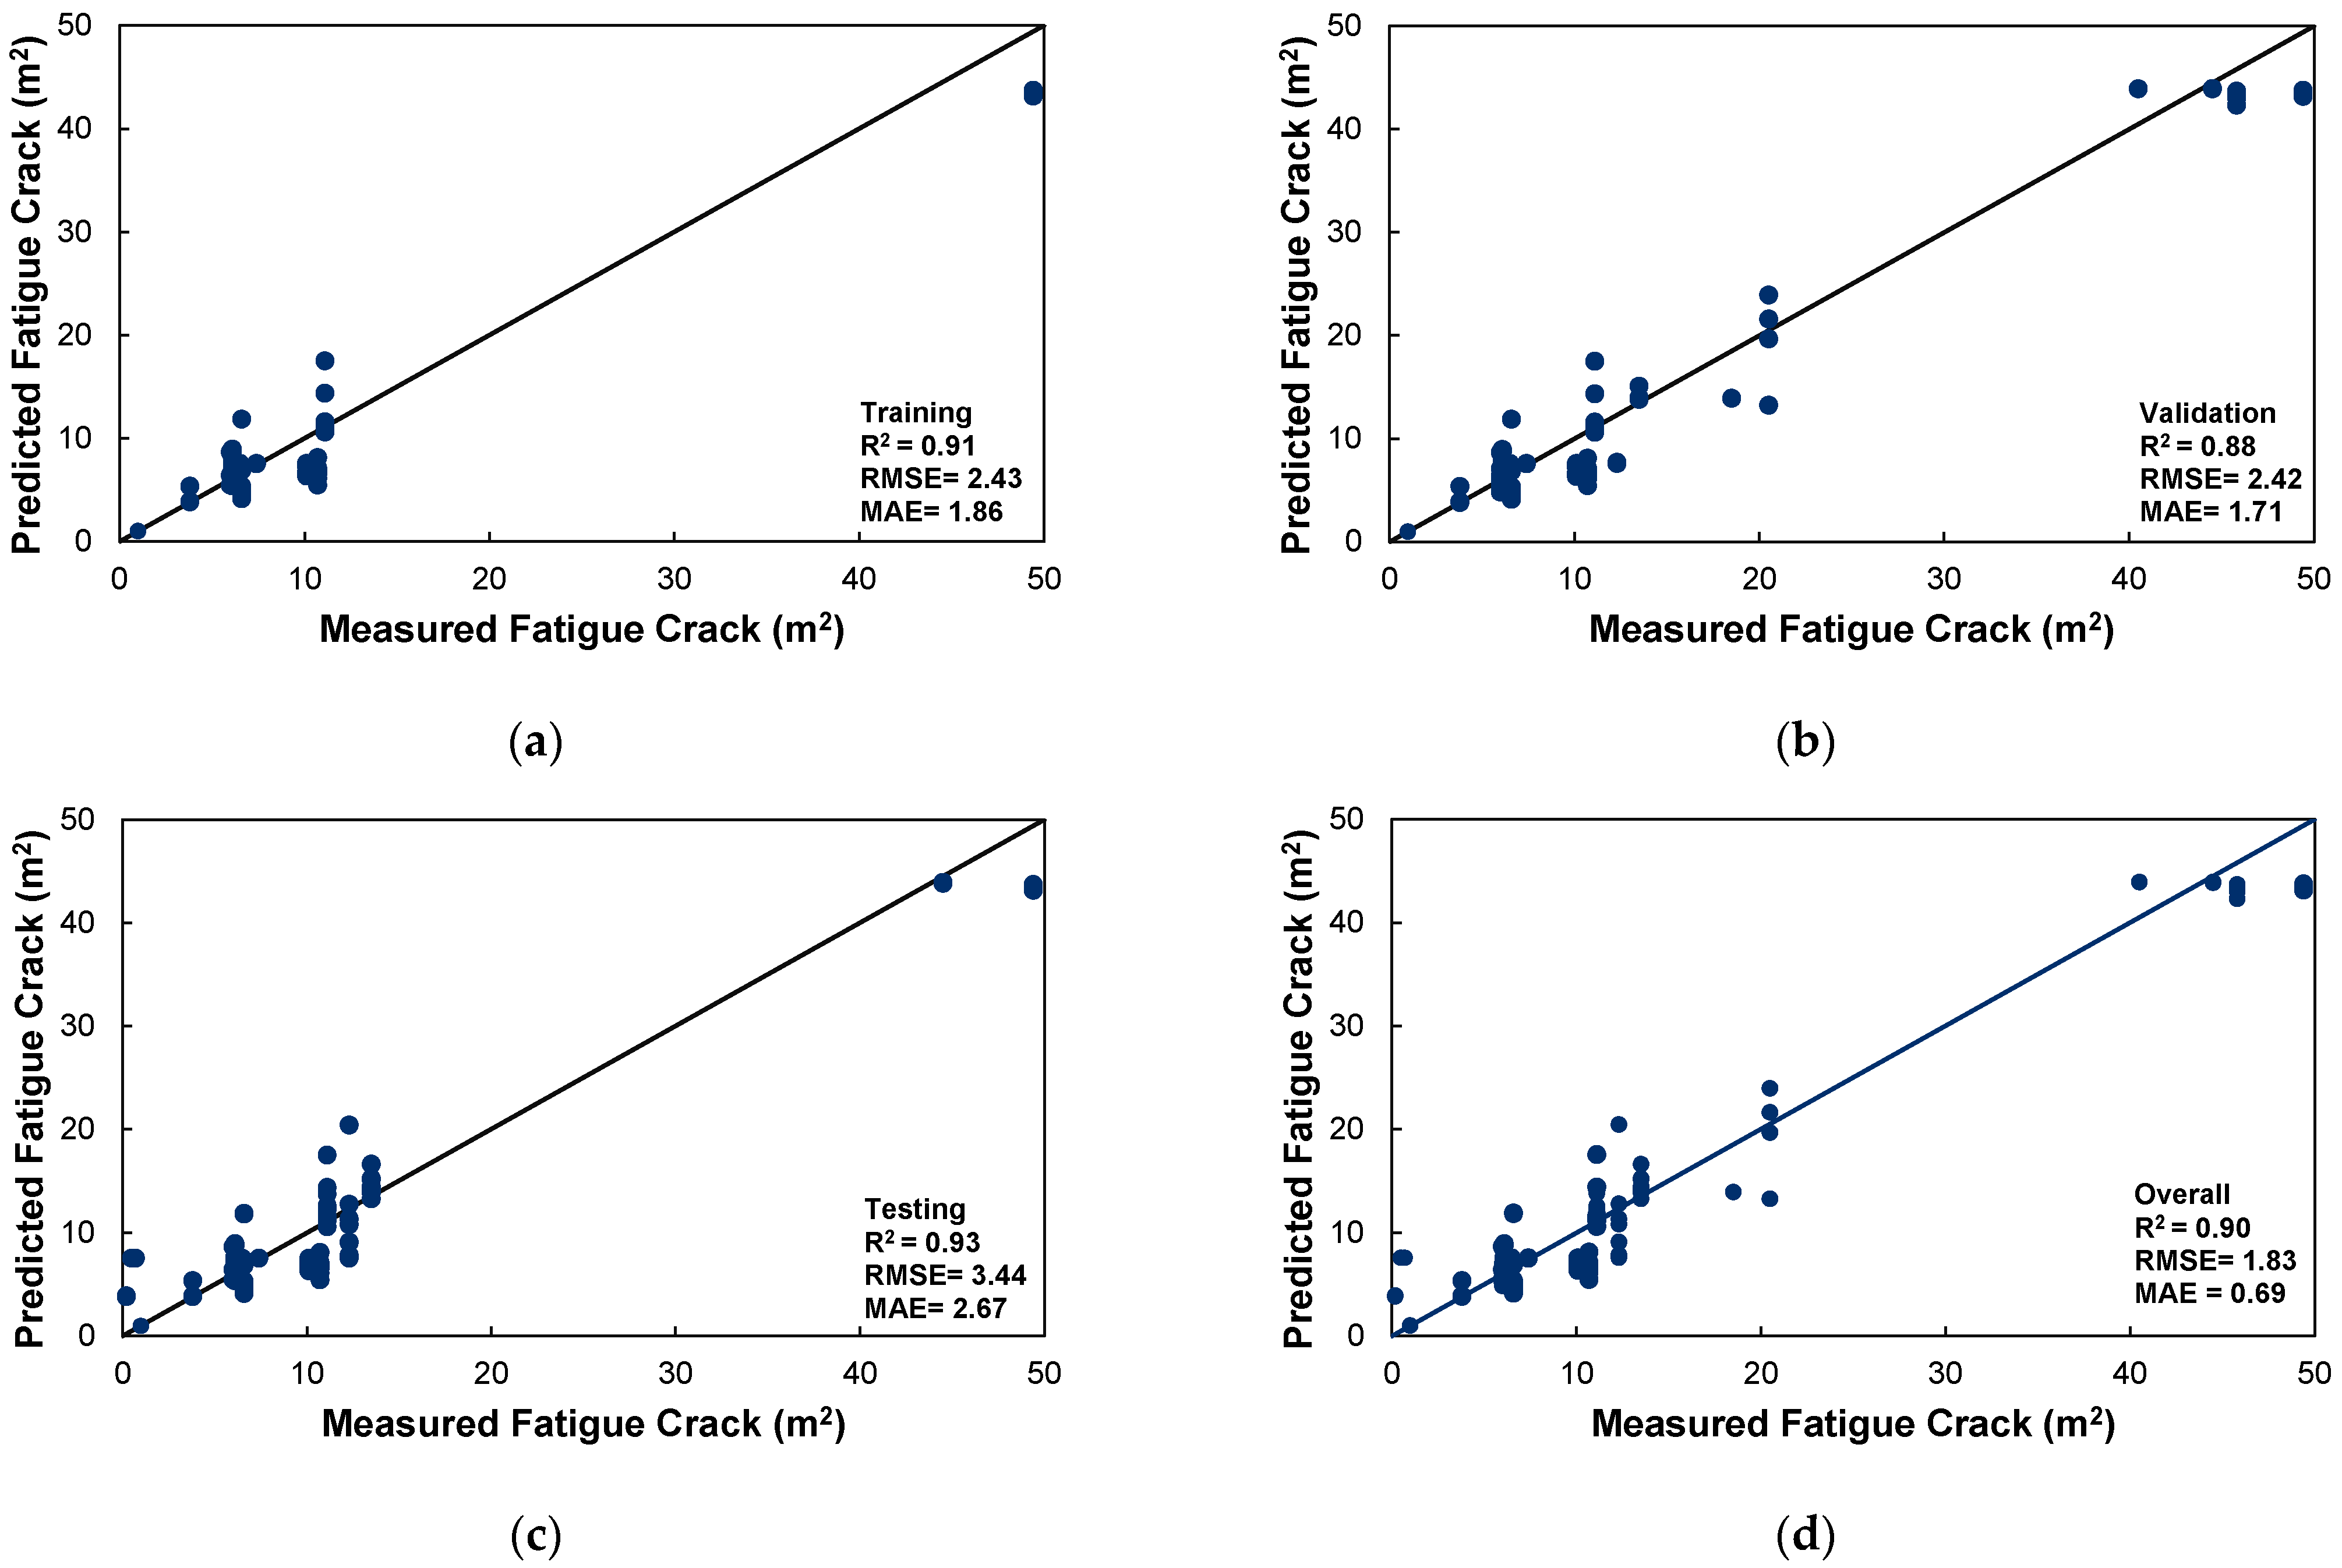
The performance of the developed neural network model for fatigue crack area prediction was evaluated using training, validation, and testing datasets, as illustrated in
Figure 9. The scatter plots compare the predicted fatigue crack area (m
2) with the measured fatigue crack area (m
2), assessing the model’s predictive accuracy.
In
Figure 9a, the training dataset exhibits a robust correlation (R
2 = 0.91), accompanied by relatively minimal errors (RMSE = 2.43 m
2, MAE = 1.86 m
2), suggesting that the model proficiently comprehends the underlying data patterns.
Figure 9b delineates the testing dataset, which attains the highest correlation (R
2 = 0.93), albeit with a marginal increase in RMSE (3.44 m
2) and MAE (2.67 m
2), implying a degree of variability in the predictions.
Figure 9c portrays the results from the validation dataset, wherein the model sustains significant predictive accuracy with R
2 = 0.88, an RMSE of 2.42 m
2, and an MAE of 1.71 m
2. Finally,
Figure 9d amalgamates all the datasets, producing an overall R
2 = 0.90, an RMSE of 1.83 m
2, and an MAE of 0.89 m
2, thereby affirming the model’s dependability and capacity for generalization.
As mentioned earlier, this study also aims to develop an equation from the ANN model that can estimate the Fatigue Cracking Area in the pavement without needing to run the full model. In Equation (3), the hyperbolic tangent (tanh) activation function plays a key role in shaping predictions. The tanh function helps the model capture complex relationships between different pavement factors, making it more adaptable to real-world conditions. Since tanh scales value between −1 and 1, it ensures that the input variables contribute in a balanced way, preventing extreme values from dominating the prediction. This also helps stabilize the learning process and improves the model’s overall accuracy. By using tanh in this equation, the model effectively captures nonlinear patterns in pavement behavior, leading to more accurate and reliable fatigue cracking predictions. The equation below represents the predictive model.
Here
FCA = Fatigue Cracking Area (m2);
TH = Thickness of HMA layer (in);
AV = Air Void (%);
AC = Asphalt Content (%);
KE = Cumulative ESAL (KESAL);
TEMP = Average Annual Temperature (°C);
CAR = Normalized Comprehensive Area Ratio (CAr’).
The input weight matrix (W
ih), input bias matrix (b
ih), output weight matrix (W’
ho), and output bias matrix (b
ho) that govern the ANN model are shown below in Equations (4)–(7):
8. Sensitivity Analysis
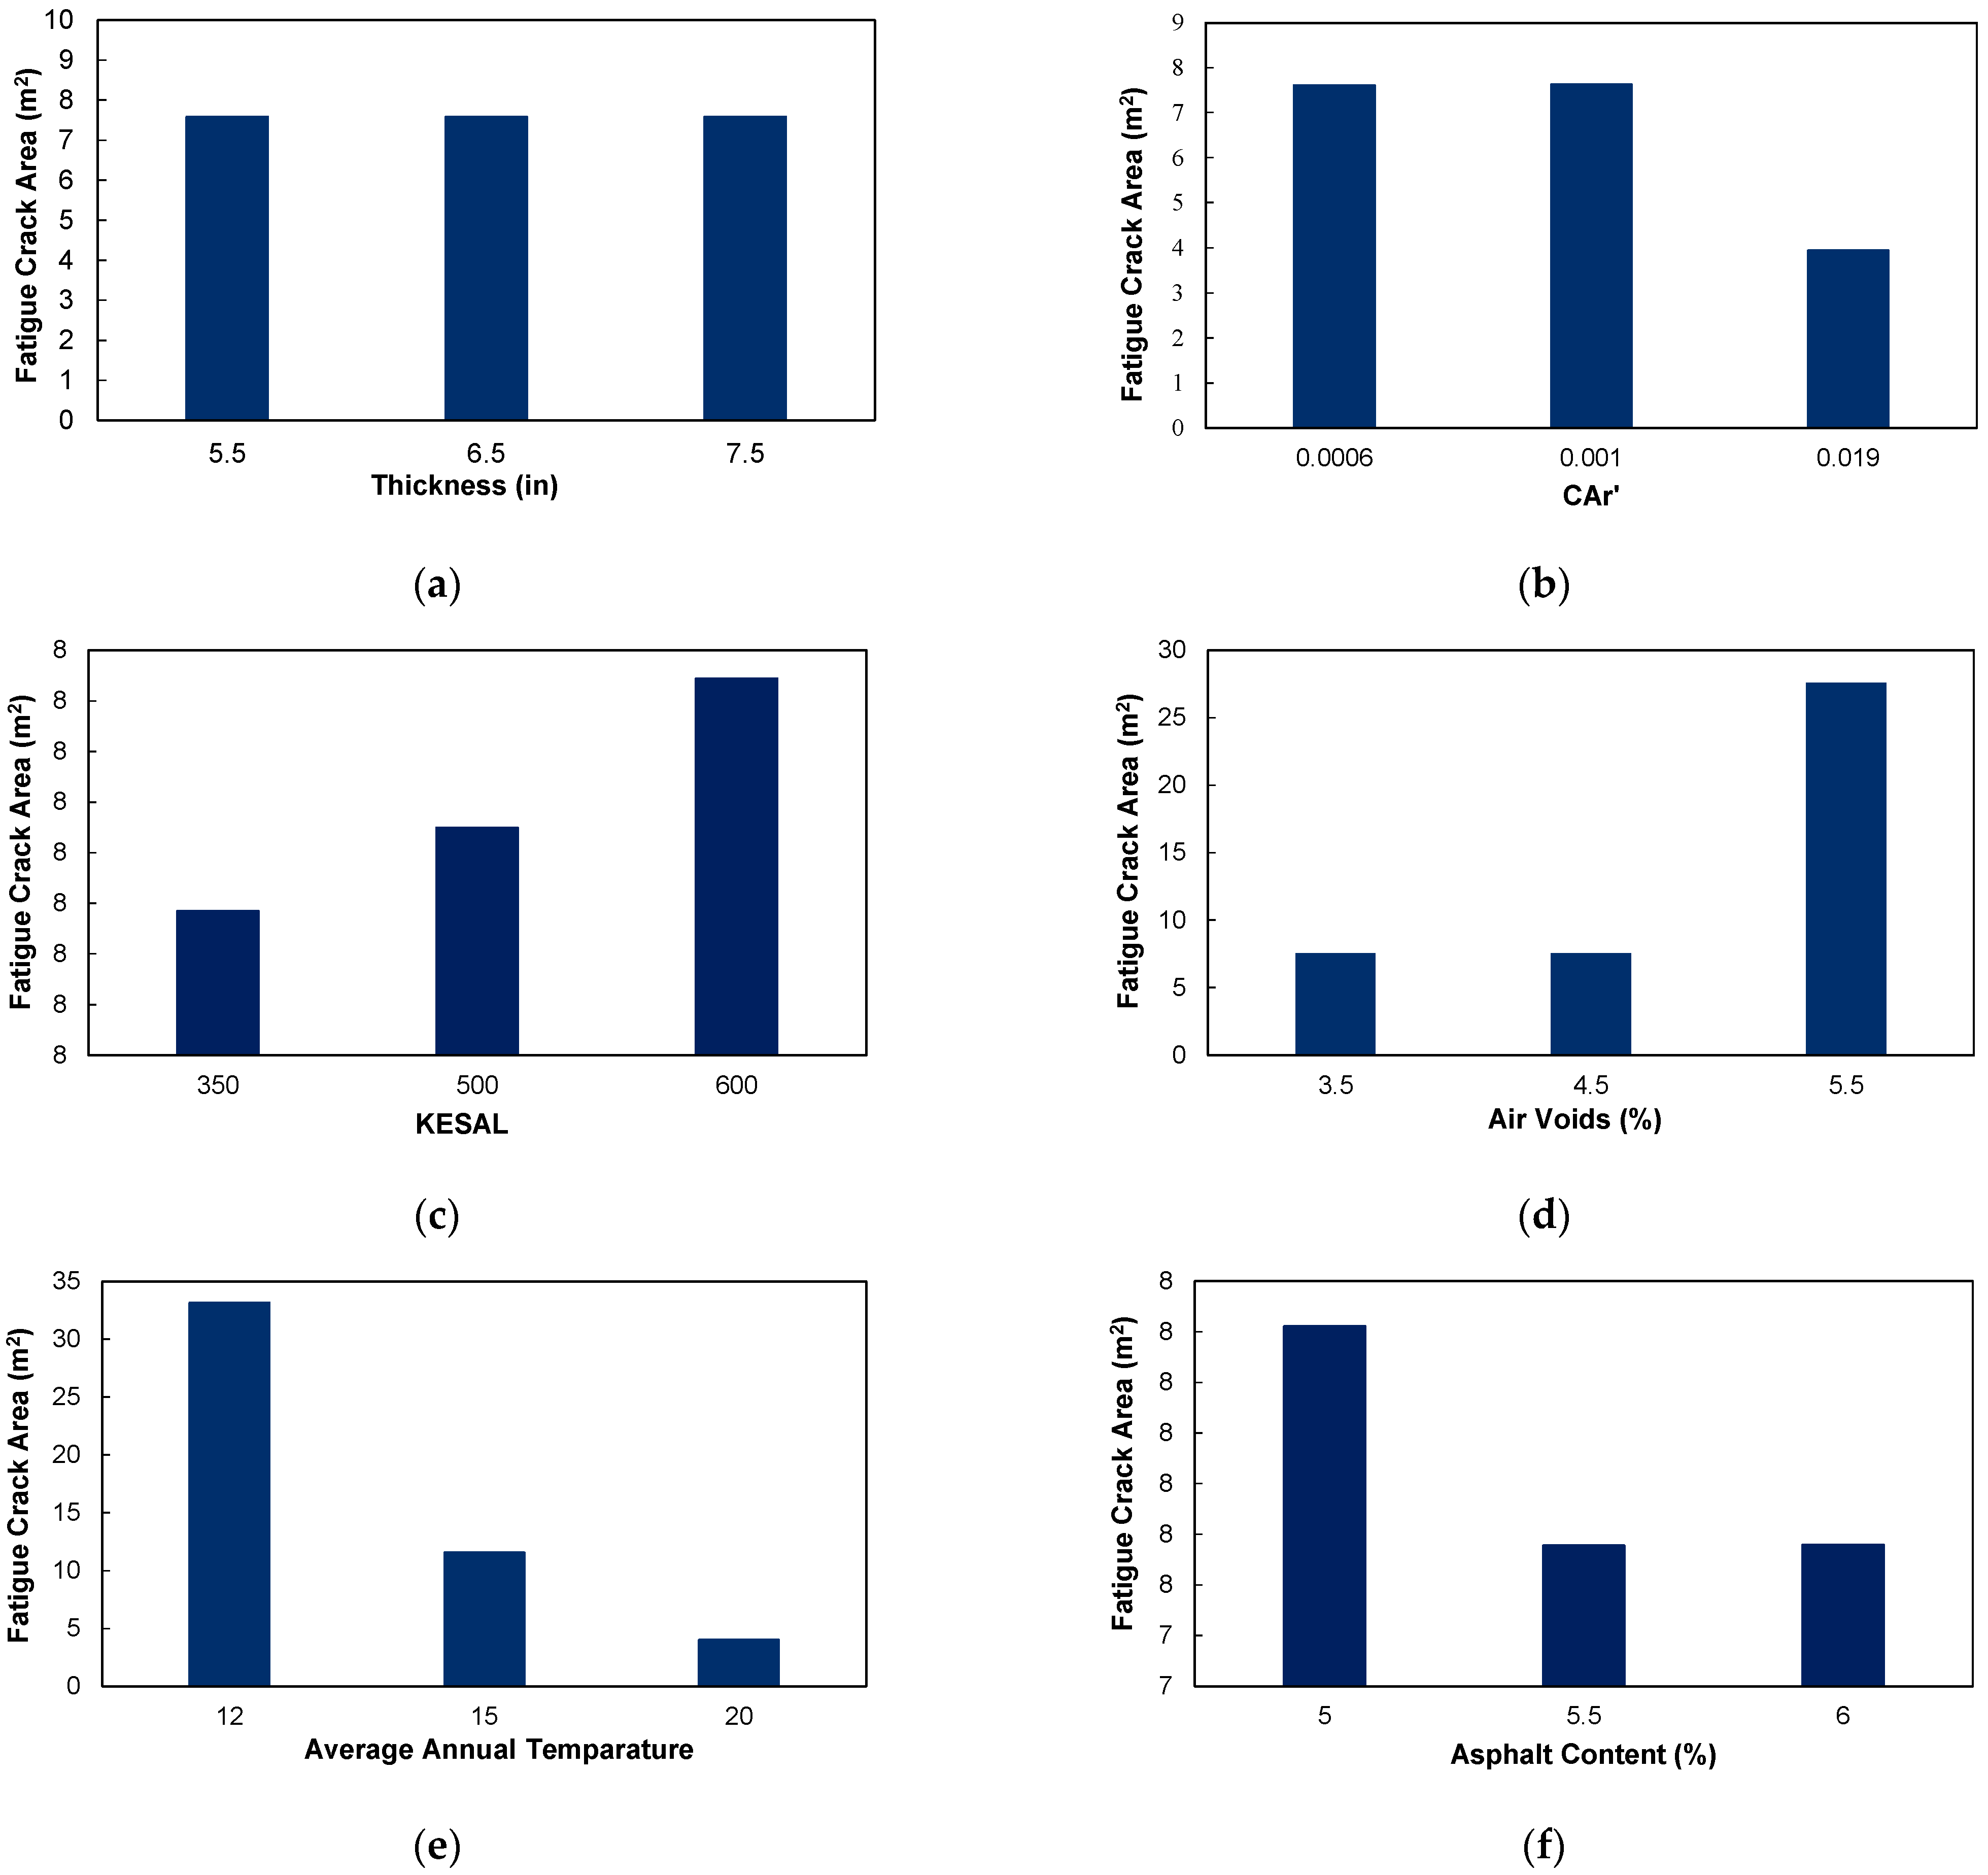
Sensitivity analysis is a technique used to determine how different values of an independent variable affect a particular dependent variable under a given set of assumptions. While keeping all the other input variables constant, only a single input variable was changed, and the variation in the output was studied to reveal the trend that arises. The variation in the Fatigue Cracking Area with the different inputs is shown in
Figure 10.
As can be seen from
Figure 10, variation in pavement thickness seems to have a seemingly minimal effect on fatigue crack areas contrary to the literature claiming that thinner pavements are more susceptible to this kind of distress. It is also evident that air voids and KESAL have a positive relationship with fatigue cracking in an asphalt pavement, meaning an increase in the input variable results in an increase in the output variable. On the contrary, asphalt content, average annual temperature, and CAr’ have a negative relationship with fatigue cracking. This is in line with the available literature and corroborates the relationship between the high value of CAr’ and a good quality of pavement.
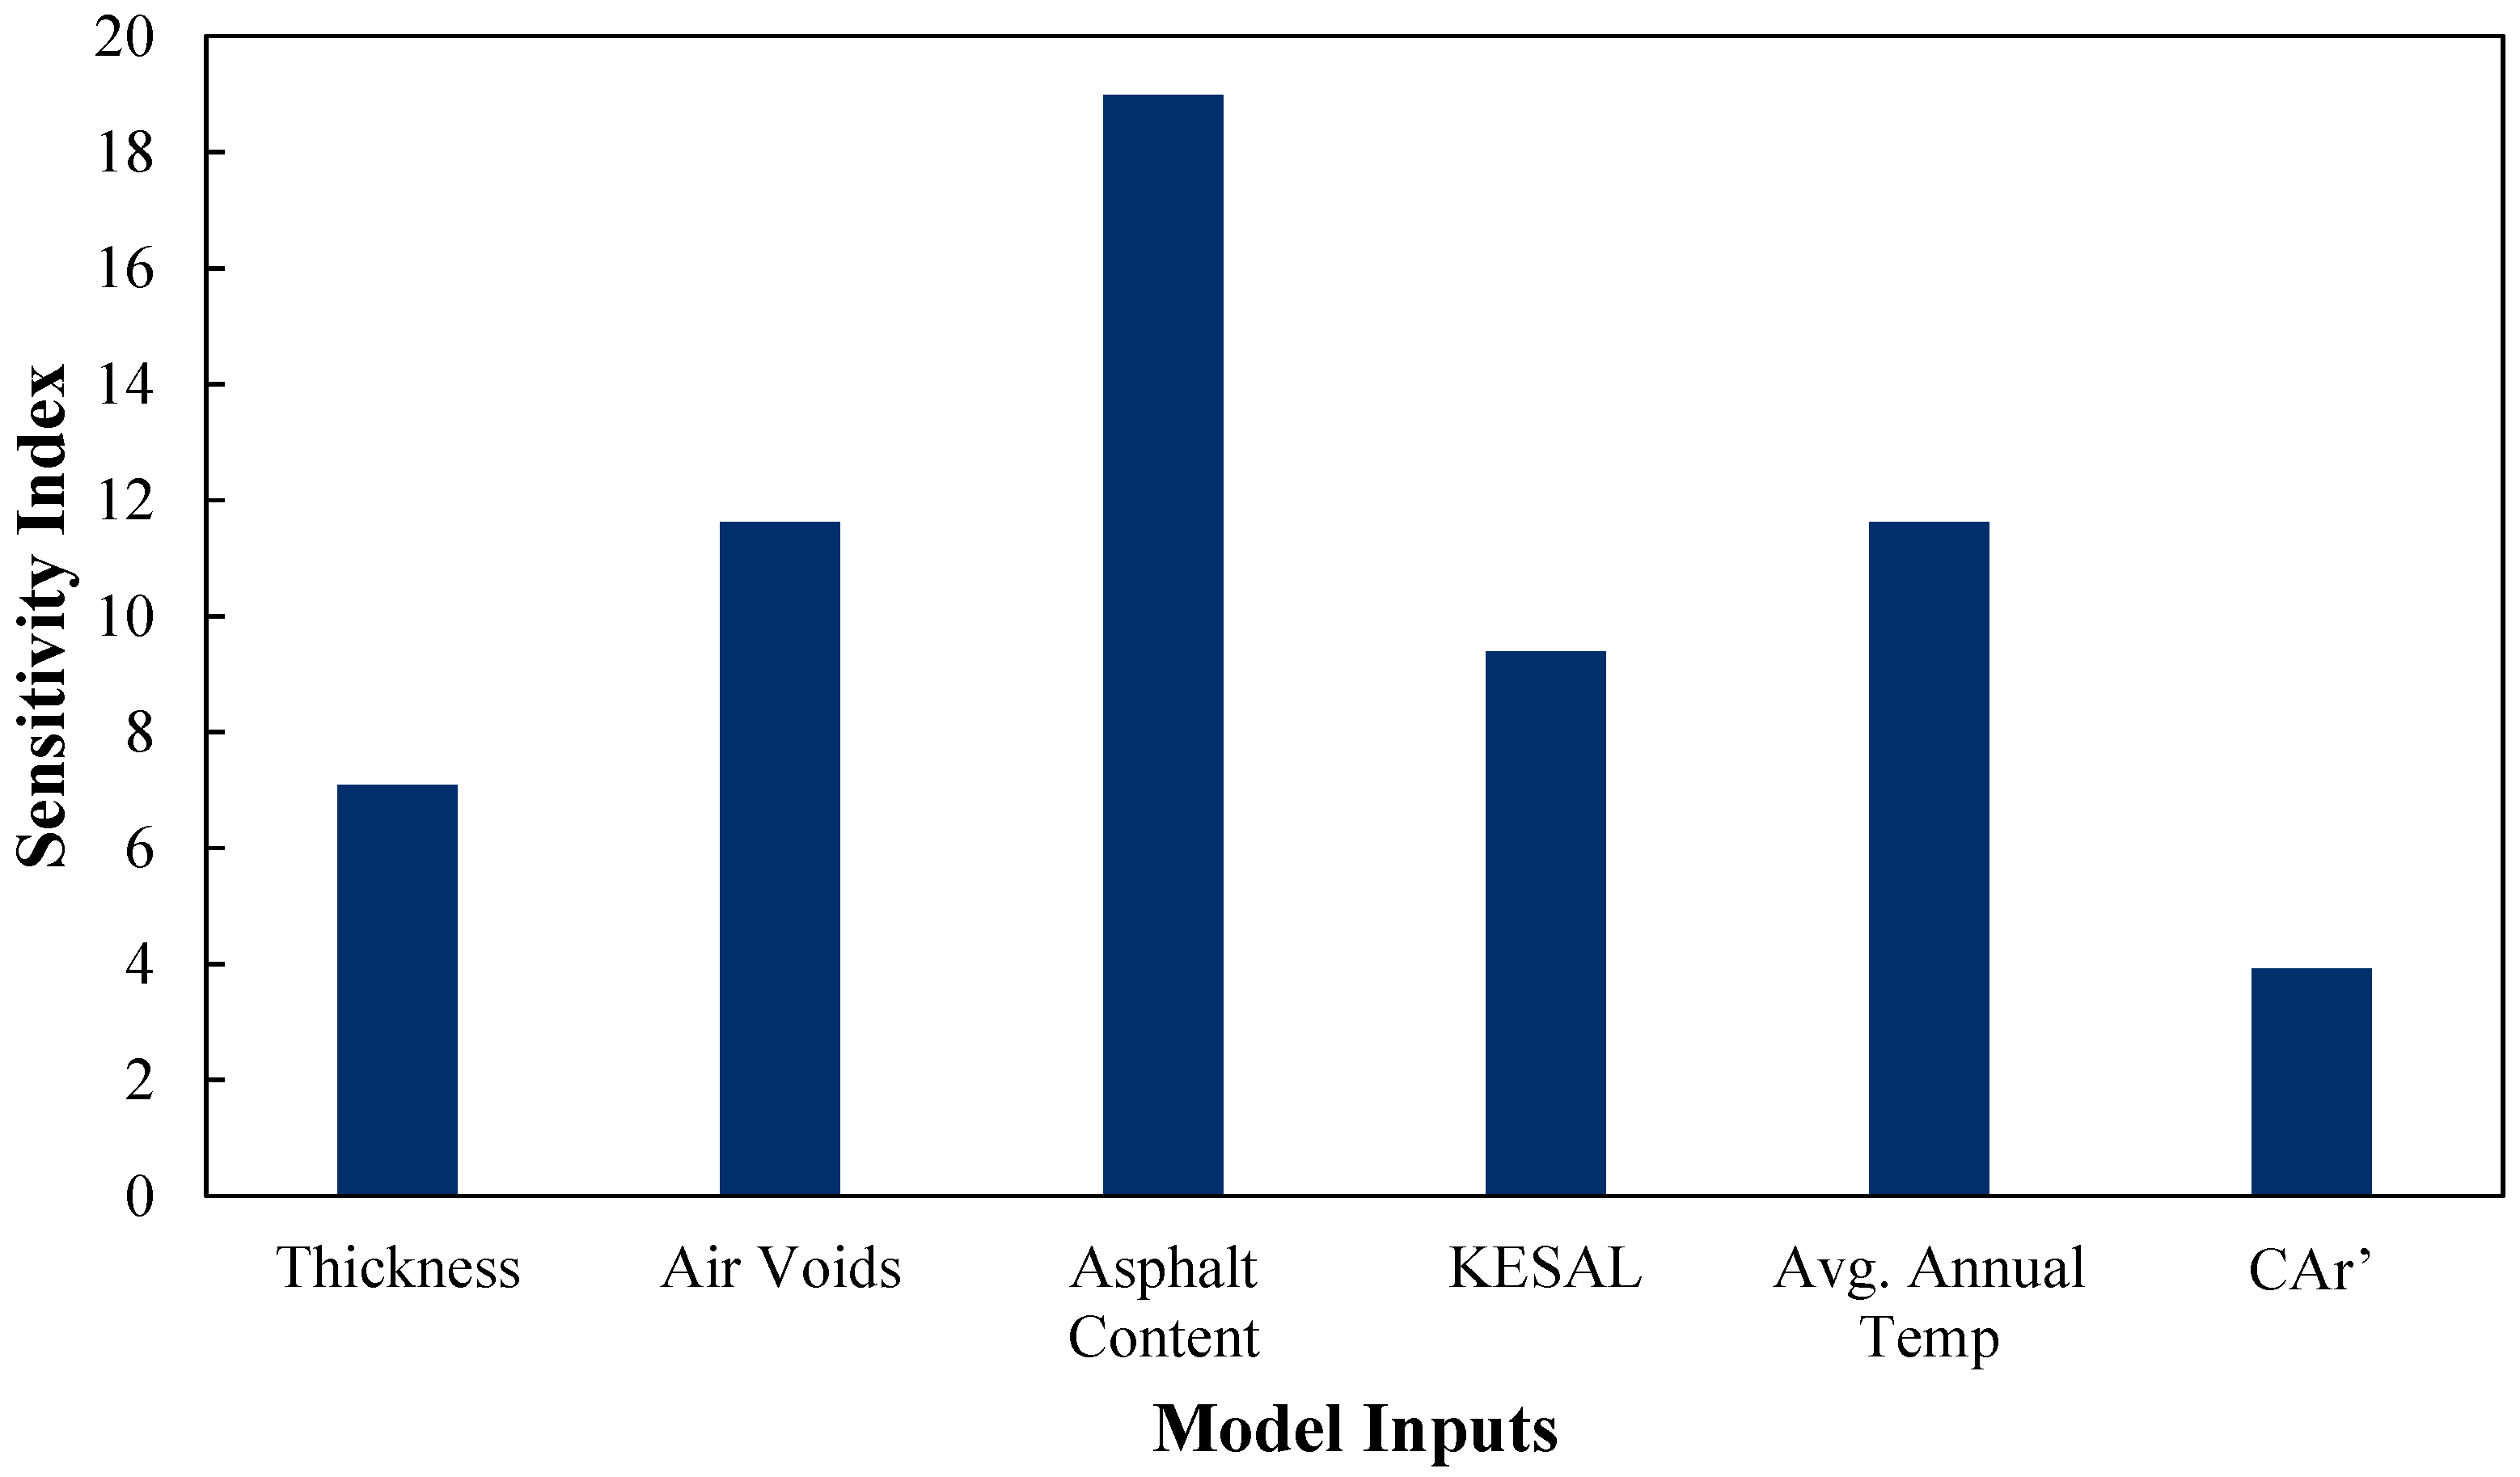
In this study, in order to gauge the significance of each individual input and to see inputs that are most influential to the output, the sensitivity index of each input variable is calculated. Sensitivity index is shown in its mathematical form in Equation (8):
where
S = sensitivity index;
O2 and O1 = maximum and minimum ANN output;
I2 and I1 = maximum and minimum input variables;
Iave = average of input variables;
Oave = average of ANN output.
In
Figure 11, the SI chart illustrates the degree to which each factor influences the model’s output. Notably, asphalt content is the most impactful parameter with the highest sensitivity index of close to 8, indicating significant changes in the model’s output in response to even minor variations in asphalt content. On the other hand, CAr’ shows minimal impact, with an index around 2, suggesting it has the least influence on the model. Other parameters like Thickness, Air Voids, KESAL, and average annual temperature also vary in their sensitivity, with indices ranging from about 3 to 5. This visualization aids in identifying which factors are crucial for the model’s performance, guiding targeted adjustments and prioritization in the modeling process.
9. Discussion
The present study demonstrates originality by developing a prediction model for fatigue cracking in asphalt pavements using Artificial Neural Networks (ANNs) combined with pavement parameters derived from Falling Weight Deflectometer (FWD) measurements, including the CAr’ parameter, pavement thickness, cumulative traffic load, and climatic factors. The model, trained on 311 datapoints collected from 19 Long-Term Pavement Performance (LTPP) sections across seven states in the United States, achieved a robust predictive accuracy (R
2 = 0.90). By directly integrating ANN modeling techniques with real-world field-measured data, this approach facilitates proactive pavement management and offers simplified equations suitable for practical engineering applications. In comparison, Sankararaman et al. [
35] focused primarily on Bayesian frameworks emphasizing uncertainty quantification rather than practical predictive tools for fatigue cracking. Meanwhile, Yang et al. [
4] explored fatigue cracking through controlled laboratory experiments, focusing explicitly on the influence of aging and moisture damage through dynamic modulus and fatigue tests, without integrating ANN-based predictive models or field-measured FWD parameters. Although this study model shows strong predictive capabilities, further improvements in robustness could be achieved by expanding the dataset to include additional LTPP sections from more diverse climatic regions, as previous research indicates significant variability in fatigue cracking behavior under different environmental and traffic conditions. This expanded dataset would enhance the model’s generalization and predictive reliability, thus increasing its practical relevance and effectiveness for pavement professionals.
Additionally, this study utilized FWD data from a single drop height, whereas the existing research suggests that considering multiple drop heights can provide a more comprehensive understanding of pavement deflection behavior. Future studies should incorporate FWD data from various drop heights to create a more versatile and adaptive predictive model. Comparing this approach to previous fatigue cracking models, researchers have found that including multi-depth deflection measurements enhances model accuracy by capturing the pavement response more effectively under varying stress conditions.
Furthermore, while this study identified asphalt content as the most influential factor in fatigue cracking predictions consistent with prior research, some studies highlight the impact of moisture susceptibility, binder aging, and traffic loading as equally or more significant under certain conditions [
4,
36]. Opposing viewpoints argue that environmental factors, such as freeze–thaw cycles and drainage efficiency, can play a dominant role in long-term pavement durability. This underscores the need for further investigations to identify additional key variables that influence fatigue cracking across different pavement structures and climatic zones. Future models should integrate these additional influential parameters to enhance predictive accuracy. The sensitivity analysis of the AC thickness showed very minimal influence in the fatigue crack area in contrast with the available literature, this may be remedied in future studies by including more diverse datasets.
A promising direction for future research is the integration of advanced technologies such as image processing and real-time sensor data acquisition. By aligning image processing algorithms with the existing database, pavement condition assessments can be automated and improved in real time. Recent advancements in computer vision and deep learning have demonstrated the feasibility of detecting fatigue cracks using camera and sensor modules. Implementing these techniques would enable the remote monitoring of pavement conditions, allowing maintenance agencies to receive real-time fatigue crack predictions wirelessly [
37]. This approach aligns with recent trends in smart infrastructure management, in which AI-driven predictive maintenance is increasingly being explored to optimize roadway performance and reduce lifecycle costs.
10. Conclusions
This study highlights the advanced application of the FWD data in conjunction with ANNs to enhance the predictive accuracy of fatigue cracking in asphalt pavements. The FWD data, crucial for this analysis, provide detailed insights into the structural integrity of pavements by measuring pavement deflections under simulated traffic loads. These data form the basis for calculating the CAr’, which alongside other factors, serves as a critical input to the ANN model. The model performance was validated through the R2 value of 0.90. Furthermore, this paper validates the use of FWD data in the form of CAr’ in conjunction with other pavement parameters as important factors in predicting fatigue cracking.
This study meticulously applies sensitivity analysis to ascertain the influence of each input variable on the model’s output, which is vital for prioritizing maintenance and design adjustments. The sensitivity indices from the analysis demonstrate that, apart from asphalt content, factors like air voids and average annual temperature also significantly impact the model’s predictions, albeit to a lesser extent. This nuanced understanding allows engineers to address the most impactful factors and adjust pavement design specifications more precisely to mitigate fatigue cracking.
Furthermore, this paper discusses the potential of ANNs in overcoming the limitations of traditional linear models. ANNs excel in handling nonlinear relationships and complex interactions between multiple variables, making them especially suitable for modeling dynamic systems like pavement conditions under varying traffic and environmental conditions. The predictive model developed through this research is intended not only to identify current pavement conditions but also to forecast future deterioration, allowing for proactive pavement management. This predictive capability is crucial for optimizing maintenance schedules, extending pavement life, and reducing repair costs.
Lastly, this study aims to simplify the complex ANN model into a more user-friendly equation that practitioners can easily employ without needing extensive computational resources. This effort to democratize advanced modeling techniques speaks to the practical implications of the research, aiming to make sophisticated analytical tools accessible for widespread use in pavement management and planning. This aspect of this study underscores its relevance to real-world applications, providing a bridge between high-level research and everyday engineering practices. Despite the promising results, this study has several challenges and limitations. The applicability of the model is similarly constrained by variances in geography and climate, given that it was formulated utilizing data extracted from particular locales, thus necessitating additional investigation for more extensive adaptation.


