1. Introduction
Global energy demand is rising due to population growth, urbanization, and technological progress [
1,
2]. This rise creates significant sustainability and economic development challenges, affecting how policymakers, industries, and local communities handle the delicate balance between energy supply and affordability [
3]. In response, many are turning to cleaner technologies and supportive policies. Renewable energy systems (RESs) are beneficial because they protect the environment and strengthen local economies, particularly in rural areas where power shortages often occur during peak demand [
4]. Investing in these systems can address the world’s increasing energy needs while promoting a healthier planet and more resilient economies. One promising solution is using hybrid energy systems (HESs), which combine renewable sources to boost reliability and efficiency [
5].
Wind and solar stand out among the various HES options due to their availability and falling costs [
6,
7]. They have gained considerable attention for improving grid stability and meeting long-term sustainability goals. However, wind and solar power depend on changing weather, making them less reliable [
8,
9]. To ensure a stable power supply, energy storage systems (ESSs), such as batteries, pumped hydro, and backup systems like generators, must be integrated [
10,
11]. These components help mitigate fluctuations and maintain reliable service during low wind or sunlight. They also underscore the crucial role of HESs in modern energy planning [
12].
HES are now being introduced even where main grid connections exist [
13,
14,
15]. Combining the grid’s reliability with the low operating costs of renewables, these hybrid setups can reduce dependence on traditional power sources and lower energy expenses. They also cut greenhouse gas emissions, promote energy independence, and build resilience against price changes or grid disturbances. As a result, using HESs has become a practical way to achieve both economic efficiency and sustainable energy use, ensuring that growing energy demands are met without harming the environment or communities [
16,
17].
One example of such challenges can be seen in Aras de los Olmos, Valencia, Spain, where frequent power outages and disruptions occur despite an existing grid connection [
18]. This indicates that being linked to the main grid does not always guarantee reliable electricity, particularly in areas with aging infrastructure or specific local constraints. Additional measures are required to ensure a stable and high-quality power supply. These measures include backup systems, on-site renewable generation, and advanced energy management. By integrating these strategies, communities like Aras de los Olmos can significantly reduce power outages. Additionally, they can strengthen their energy resilience. This will ultimately improve the overall quality of service for residents and businesses.
The region’s focus on livestock production generates a large amount of animal waste, making it an excellent source of feedstock for biogas generator (BG) systems [
19]. By converting this waste into a renewable energy resource, BG technology lowers greenhouse gas emissions, reduces pollution, and creates a steady power supply. However, it is essential to recognize that biogas production can produce methane emissions if leakage occurs, significantly contributing to greenhouse gas effects due to methane’s high global warming potential. Thus, effective control measures and careful system design are essential.
Biogas energy production systems can work independently or connect to the main grid, boosting energy reliability and sustainability. Turning a local byproduct into a helpful resource supports a circular economy and lessens dependence on traditional fuels. As a result, BG stands out as an appealing, cost-effective, and environmentally friendly option for areas like Aras de los Olmos [
20].
This study focuses on optimizing HESs to fulfill the unique requirements of Aras de los Olmos, which are cost reduction and increased reliability. To pursue these goals, two scenarios are explored: one emphasizes an economical setup using the grid as the main power source, while the other focuses on enhancing reliability by partially replacing grid power with a BG when needed. Comparing these configurations will show how blending grid and BG solutions can provide a stable supply at lower costs, offering a practical and efficient energy approach. All analyses were conducted using HOMER Pro 3.16.2 (Hybrid Optimization of Multiple Energy Resources) software developed by the U.S. National Renewable Energy Laboratory (NREL) [
21].
HOMER is a widely recognized and extensively used software tool for designing and analyzing HESs. For example, ref. [
22] used HOMER to create a cost-effective, eco-friendly HES, including photovoltaic (PV) panels, wind turbines (WTs), and battery energy storage (BES) for an isolated island. It reduced greenhouse gas emissions, lowered energy costs, and enhanced reliability, with frequency stability analysis confirming its ability to handle fluctuating demand and supply. Similarly, ref. [
23] integrated advanced storage technologies, such as supercapacitors and redox-flow batteries, into an off-grid solar wind system. This demonstrates that these technologies significantly enhance reliability, reduce energy losses, and minimize emissions, ensuring a stable and efficient solution for off-grid applications.
The software has gained popularity among researchers and engineers worldwide for its ability to simulate and compare configurations under realistic conditions. In [
24], HOMER is used to assess the feasibility and cost-effectiveness of solar home systems under real-world environmental and financial conditions, identifying an optimal design that enhances reliability and reduces dependence on conventional energy sources. This underscores HOMER’s effectiveness in optimizing residential renewable solutions.
In addition to offering detailed insights into both technical and economic performance [
25,
26], HOMER’s user-friendly interface makes it accessible for those new to energy planning and seasoned professionals [
27,
28]. As a result, it has been employed in numerous projects—ranging from off-grid rural electrification [
29,
30] to grid-connected microgrids [
31,
32]—to identify cost-effective, reliable, and environmentally sustainable solutions [
33,
34].
Previous optimization studies have widely addressed RESs, employing various optimization algorithms to minimize operational costs and emissions and enhance system reliability [
35,
36,
37,
38]. For example, ref. [
39] introduced a modified energy management strategy for PV/diesel hybrid systems, incorporating the Artificial Protozoa Optimizer to reduce diesel consumption. Their results demonstrated that optimizing renewable energy sources significantly reduces costs and enhances sustainability. Similarly, ref. [
40] optimistically optimizes electric vehicle charging stations in radial power systems, integrating distributed generation and vehicle-to-grid technologies. Their study highlights how optimized integration can reduce costs, limit emissions, and improve grid reliability. Ref. [
41] investigated sustainability issues in condition-based maintenance and residual life prediction in energy systems. Their study explores how integrating renewable energy sources with predictive maintenance strategies can reduce costs, improve reliability, and extend system lifespan. The research highlights that significant operational cost reductions and emission minimization can be achieved by optimizing maintenance schedules and using data-driven energy management. Despite numerous studies, limited attention has been given to hybrid system optimization tailored explicitly for rural areas with abundant livestock biomass resources, simultaneously addressing economic and environmental goals. Thus, this study bridges this gap by focusing on the optimal integration of biogas generators, solar PV, and battery storage, evaluating trade-offs between cost, emissions, and reliability, specifically in semi-remote rural settings.
Furthermore, its emissions analysis helps decision-makers choose solutions that align with environmental goals. As in [
42], hydrogen integration in HESs significantly cuts carbon emissions compared to fossil-based setups. Similarly, HOMER’s simulations highlight hydrogen’s potential to reduce reliance on DG and other high-polluting fuels. Also, ref. [
43] demonstrates how using solar and wind energy to power desalination plants can cut carbon dioxide emissions by up to 80%, highlighting the advantages of renewable-driven processes in addressing water scarcity without harming the climate. In both studies, HOMER’s optimization capabilities reveal practical, eco-friendly pathways for transitioning to cleaner energy solutions and emphasize the importance of supportive policies in facilitating large-scale adoption.
These features have established HOMER as a trusted tool, guiding policy and research decisions and paving the way for innovative, sustainable energy projects. In the context of the present study, addressing both economic constraints and reliability demands is crucial. This work aims to bridge the gap between current limitations and a forward-looking energy future by examining the existing power infrastructure and considering new, more sustainable options. HOMER’s ability to optimize multiple energy sources, model local conditions, and evaluate cost and performance trade-offs makes it especially well-suited for developing a feasible, efficient energy solution that aligns with the region’s needs.
Recent advances in RES optimization have emphasized the importance of robust control strategies and efficient system integration methods [
44,
45]. These methodologies provide valuable insights into improving the reliability and cost-effectiveness of hybrid systems similar to the proposed configuration. In this context, evaluating the control aspect of the system is particularly crucial, as effective control strategies directly influence operational efficiency, system stability, and the ability to adapt to varying demand and resource conditions. Therefore, a thorough analysis of control mechanisms is essential for the successful implementation and long-term performance of hybrid renewable systems.
Spain’s current energy policy landscape, particularly the Integrated National Energy and Climate Plan (PNIEC 2021–2030), strongly supports expanding renewable energy sources, energy efficiency, and energy sector decarbonization. Key regulatory developments, such as Real Decreto 244/2019 promoting self-consumption and decentralized renewable generation, have created favorable conditions for deploying RESs in rural and semi-remote regions. These policies incentivize renewable integration and provide economic mechanisms—such as feed-in tariffs and targeted subsidies—that enhance the financial viability and practical feasibility of hybrid solutions combining photovoltaic, biomass, and storage technologies. Thus, the development and optimization of HESs, as presented in this study, align closely with national energy goals and benefit from the existing supportive regulatory framework.
This study contributes to the existing literature in several important ways. Firstly, it addresses a critical gap by optimizing a hybrid renewable energy system tailored for semi-remote rural areas experiencing frequent power outages despite grid availability. Although hybrid microgrid configurations have been explored in various contexts, few studies investigate locally sourced livestock waste as a primary dispatchable fuel alongside PV systems to enhance reliability in practice. Secondly, the work explicitly integrates economic analysis, environmental sustainability considerations—including critical management of methane emissions—and reliability improvements into a comprehensive optimization framework, systematically evaluating their trade-offs rather than treating them separately. Thirdly, by critically examining the environmental sustainability of biomass integration, the study explicitly emphasizes the importance of effective methane emission management practices, a factor frequently overlooked in the existing literature. Finally, the structured and replicable methodology developed here can guide policymakers and rural communities globally, facilitating sustainable, site-specific energy planning and offering practical, scalable insights for rural energy transition.
This paper is organized as follows:
Section 2 introduces the study site, highlighting its energy challenges and opportunities while proposing solutions that shape the methodology. It then defines the key input variables, such as meteorological data and load demand, reviews the HOMER components used in the analysis, and assesses the economic parameters relevant to addressing the problem.
Section 3 offers a detailed evaluation of the simulation results, including comparative cost, reliability, and environmental performance studies.
Section 4 then discusses the impact of changes, variable sensitivity, and method limitations. Finally,
Section 5 concludes the paper with key findings and implications.
2. Materials and Methods
The methodology developed in this study systematically addresses the unique challenges of the chosen site by describing its geographic conditions, defining the research problem, and outlining potential solutions that guide the analysis. It then characterizes the site’s key inputs, forming the basis for a thorough technical assessment of each proposed component and the economic equations governing the simulation. HOMER plays a central role in this process, using its optimization engine, comprehensive component libraries, and sensitivity analysis tools to model, compare, and verify the performance and economic feasibility of the proposed configurations. This integrated approach provides a robust foundation for subsequent analysis, ensuring thorough technical, financial, and environmental evaluation.
2.1. Site Description and Energy Challenges
The site under study in this research is Aras de los Olmos, a small, rural municipality in Serranos County of the Province of Valencia, within Spain’s Valencian Community. As illustrated in
Figure 1, it lies in the northwestern part of the province, surrounded by a predominantly mountainous landscape. Covering roughly 76 square kilometers, the municipality has a close-knit population of around 350 to 400 residents.
This combination of rugged terrain, modest demographic size, and a typical Mediterranean climate makes Aras de los Olmos an intriguing case for studies on rural development and renewable energy integration. Local livestock activities generate animal waste that can serve as a valuable feedstock for biomass production, making this technology a logical option for enhancing energy resilience in the region alongside other potential renewable energy sources.
However, as Aras de los Olmos is located at the end of a power distribution line, it frequently experiences voltage drops, reduced power quality, and frequent outages, especially during peak demand periods or adverse weather conditions. These interruptions negatively affect residents, disrupt essential public services, and constrain economic activities, particularly in sectors reliant on continuous electricity, such as agriculture, small businesses, and tourism. Moreover, grid dependency increases the community’s vulnerability to external disruptions and fluctuating energy prices. Consequently, there is a clear need to identify reliable, economically viable, and locally sustainable energy solutions that mitigate these issues, enhance energy security, and support long-term economic and environmental goals.
2.2. Proposed Solutions and Scenarios
This study addresses the energy challenges faced by the rural community of Aras de los Olmos. It evaluates two distinct energy management scenarios through comprehensive technical, economic, and environmental assessments. The following scenarios are proposed considering the specific energy supply constraints and frequent power outages at the end of the power distribution line.
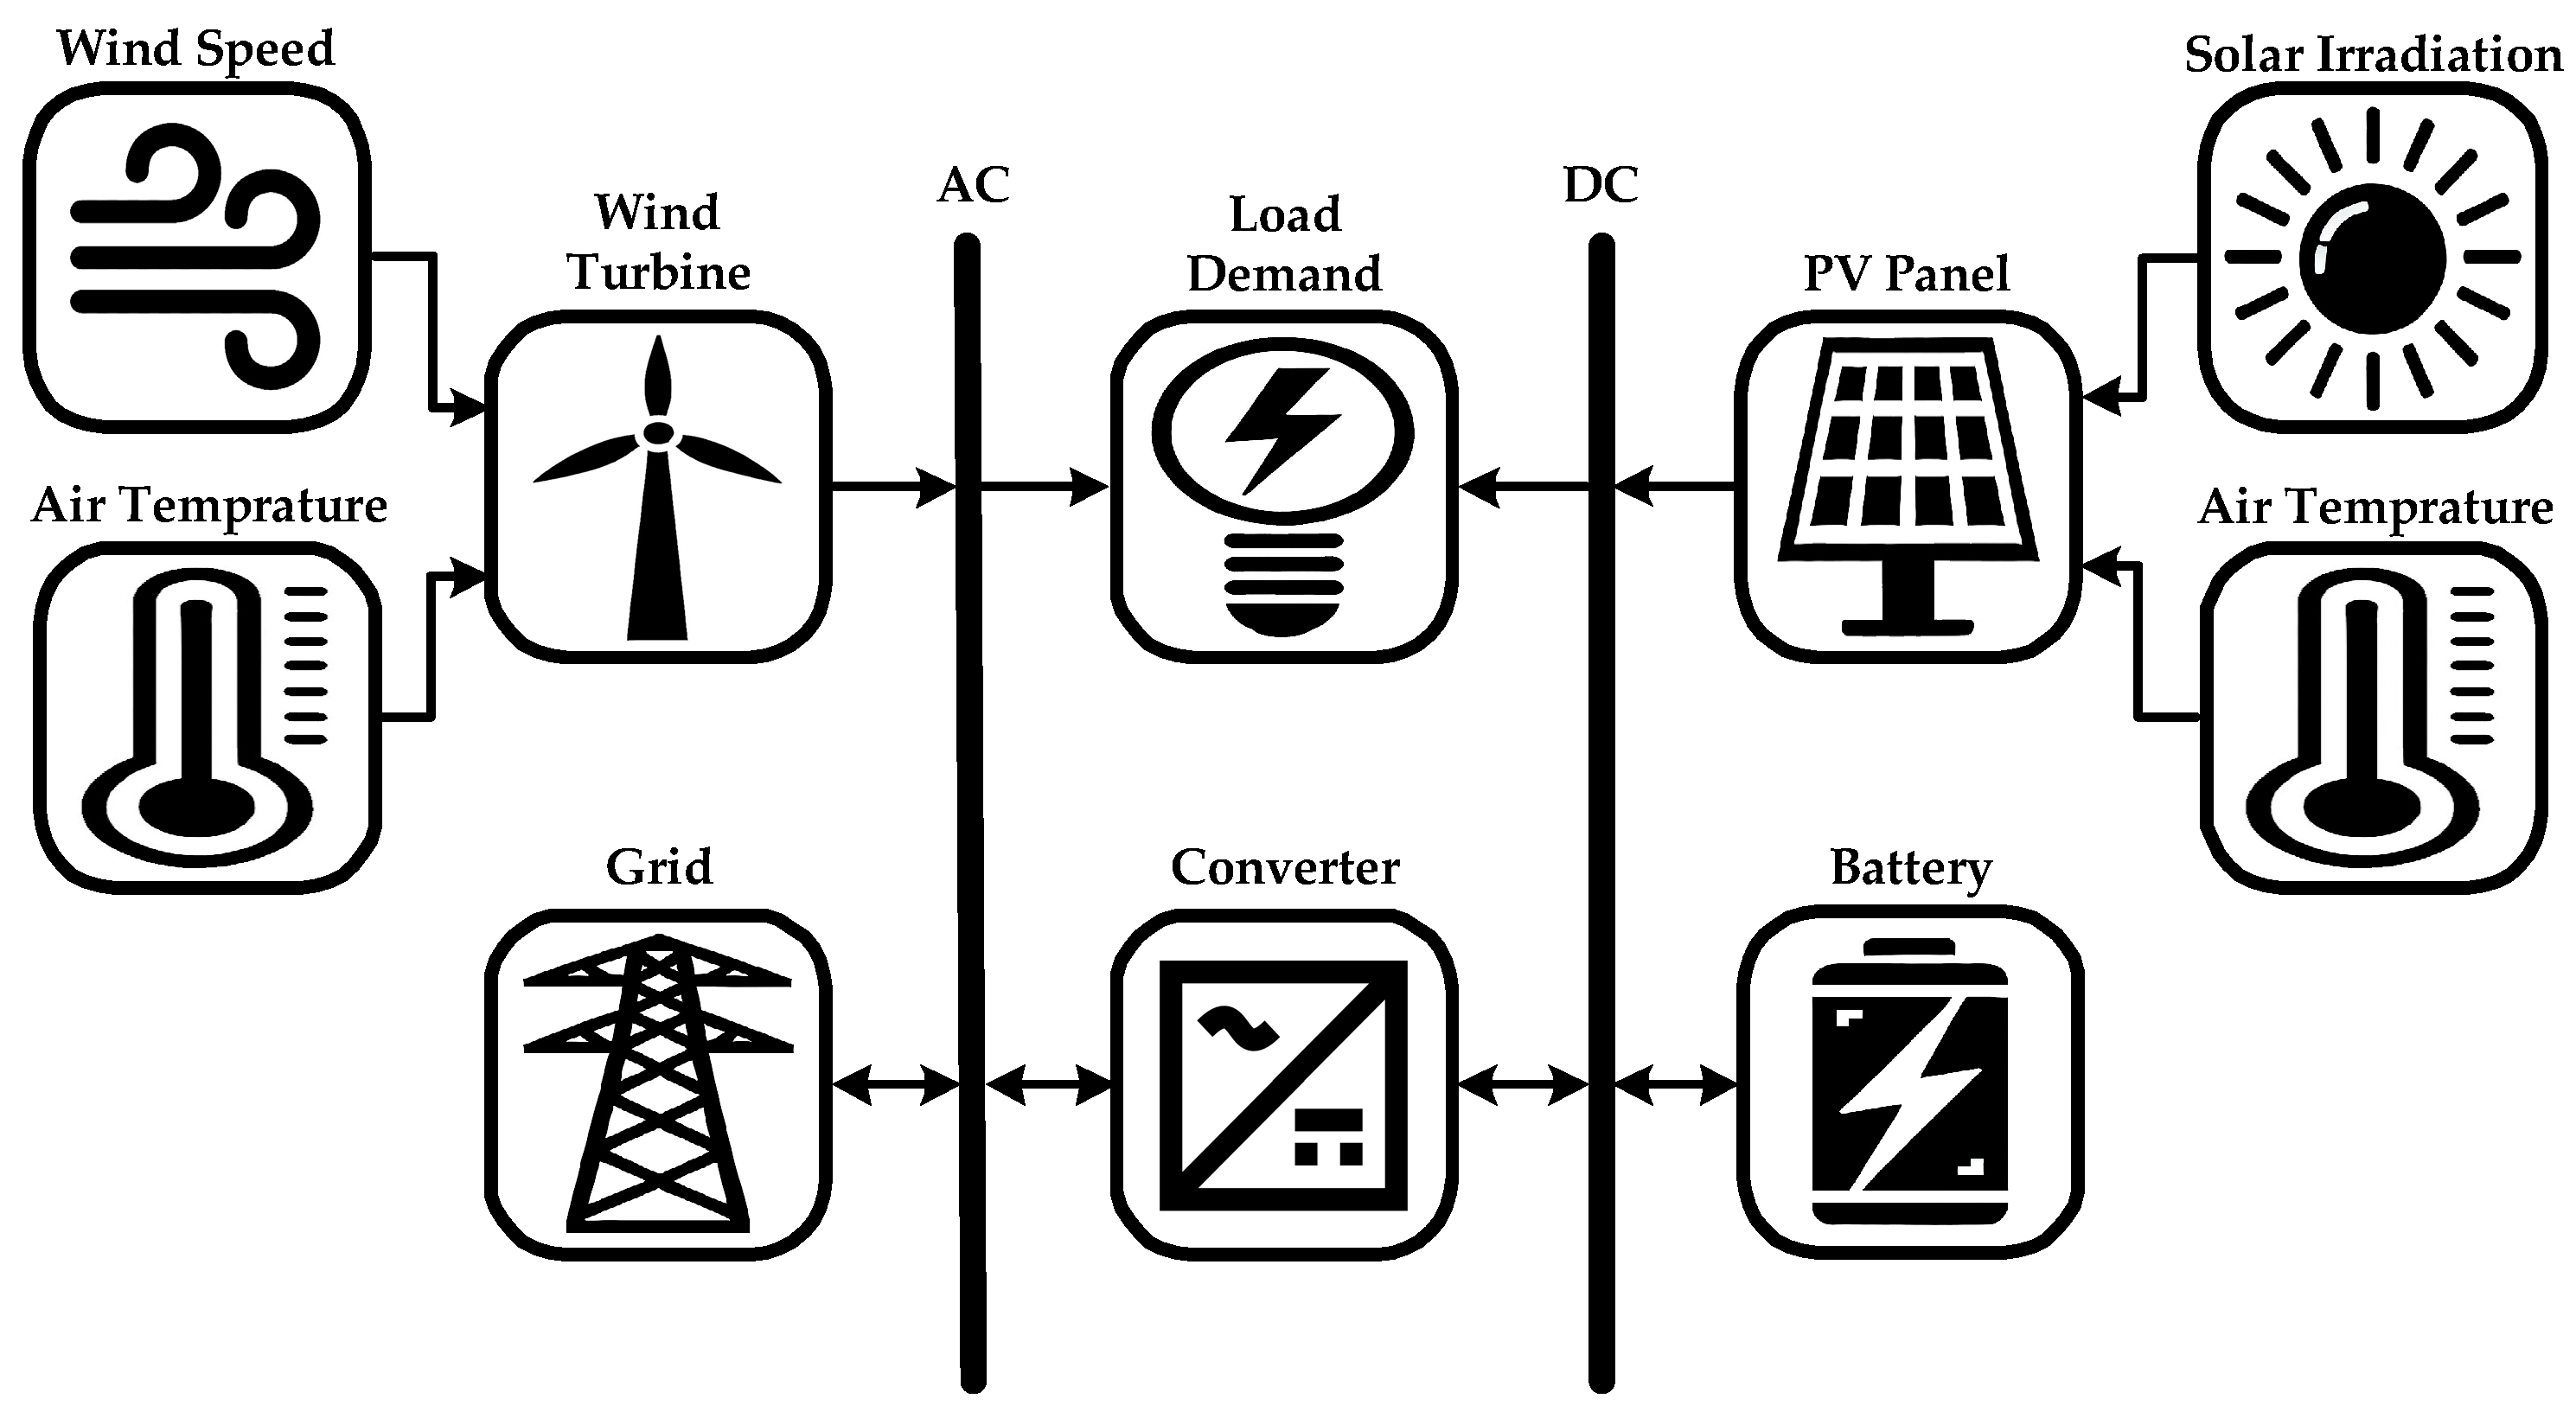
In the first scenario, as shown in
Figure 2, the existing connection to the main grid is maintained while strategically integrating RESs to reduce reliance on grid electricity and operational costs.
In the second scenario, as shown in
Figure 3, a BG fueled by locally sourced biomass resources is introduced to substantially reduce dependence on the main grid, thus enhancing system resilience and reliability in recurring outages.
The detailed description of the input data, technical modeling of components, and economic formulations used in these configurations are presented systematically in the following subsections.
2.3. Input Data
This section outlines the key input parameters that underpin the energy analysis and simulation framework. This approach combines comprehensive meteorological data with detailed load demand records. The meteorological datasets, obtained from NASA’s Prediction of Worldwide Energy Resource database as monthly averages, are interpolated within HOMER to produce hourly estimates for precise simulations. Meanwhile, the load demand data were gathered from local distribution meters throughout Aras de los Olmos, subsequently quality-controlled, and aggregated into hourly, daily, and monthly profiles to ensure a realistic representation of consumption behavior.
Additionally, specific inputs, including the biomass feedstock derived from regional livestock waste, are included to assess the biogas reactor’s performance and model its contribution to renewable energy generation. All datasets undergo careful preprocessing and synchronization to support reliable energy generation, storage, and system efficiency simulations. The following sections delve deeper into each input parameter and illustrate how these data collectively inform the system’s design and optimization.
2.3.1. Air Temperature
The temperature resource data provide ambient air temperatures, with an annual average of 12.85 °C. The highest temperatures are observed in the summer months, such as July (23.38 °C) and August (23.15 °C), while the lowest temperatures occur in the winter months, such as January (3.85 °C) and February (5.14 °C). This seasonal variation is crucial for understanding its impact on the performance of energy systems, particularly renewable energy technologies.
2.3.2. Solar Irradiance
The solar resource data used in this analysis provide global horizontal irradiance (GHI) along with the clearness index. The clearness index is the ratio of the measured solar radiation at the Earth’s surface to the extraterrestrial solar radiation under clear-sky conditions, indicating atmospheric clarity and cloud cover. The annual average radiation is 4.43 kWh/m2/day, indicating a good potential for solar energy utilization. The clearness index varies throughout the year, with higher values in summer when daily radiation peaks at approximately 7 kWh/m2/day. Conversely, lower values are observed during winter, with daily radiation dropping to as low as 2 kWh/m2/day. This variability reflects seasonal changes and highlights the importance of storage or complementary energy systems to ensure consistent energy availability.
2.3.3. Wind Speed
Accurate wind resource evaluation is crucial for determining the feasibility and performance of wind power systems in Aras de los Olmos. This study obtained wind data at a reference height of 50 m above ground level.
The baseline data indicate an annual average wind speed of around 5.56 m/s, with higher velocities recorded in winter months—6.67 m/s in January and 6.57 m/s in December—and lower speeds in summer, reaching 4.38 m/s in July and 4.29 m/s in August. This seasonal fluctuation underscores the potential need for complementary energy sources during low-wind periods.
However, it was subsequently adjusted within the HOMER to reflect local conditions, including the site altitude of 936 m above sea level and an anemometer height of 10 m.
The site sits at a relatively high altitude and experiences notable topographical influences. Consequently, this study applies a logarithmic wind speed profile, as shown in Equation (1). This approach more accurately captures the terrain’s characteristics and ensures reliable velocity estimates at the chosen anemometer height
, where wind speed
is extrapolated from a reference height
[
46].
where
is the surface roughness length (set to 0.01 m in this case, indicating rough pasture-like terrain in the study site).
The corrected dataset more accurately represents on-site wind conditions. This accuracy is crucial for reliably estimating turbine performance, calculating capacity factors, and ensuring robust wind power integration into the region’s energy mix.
2.3.4. Load Demand
Detailed load characteristics are critical for designing an efficient and reliable HES tailored to the specific energy demands of the site. HOMER relies on random or synthetic load generation, using monthly average data to produce hourly values over an entire year, which can deviate from real consumption patterns.
However, in this study, hourly load data were directly measured on-site for the entire year, ensuring a more precise representation of demand and eliminating uncertainties introduced by randomly generated profiles.
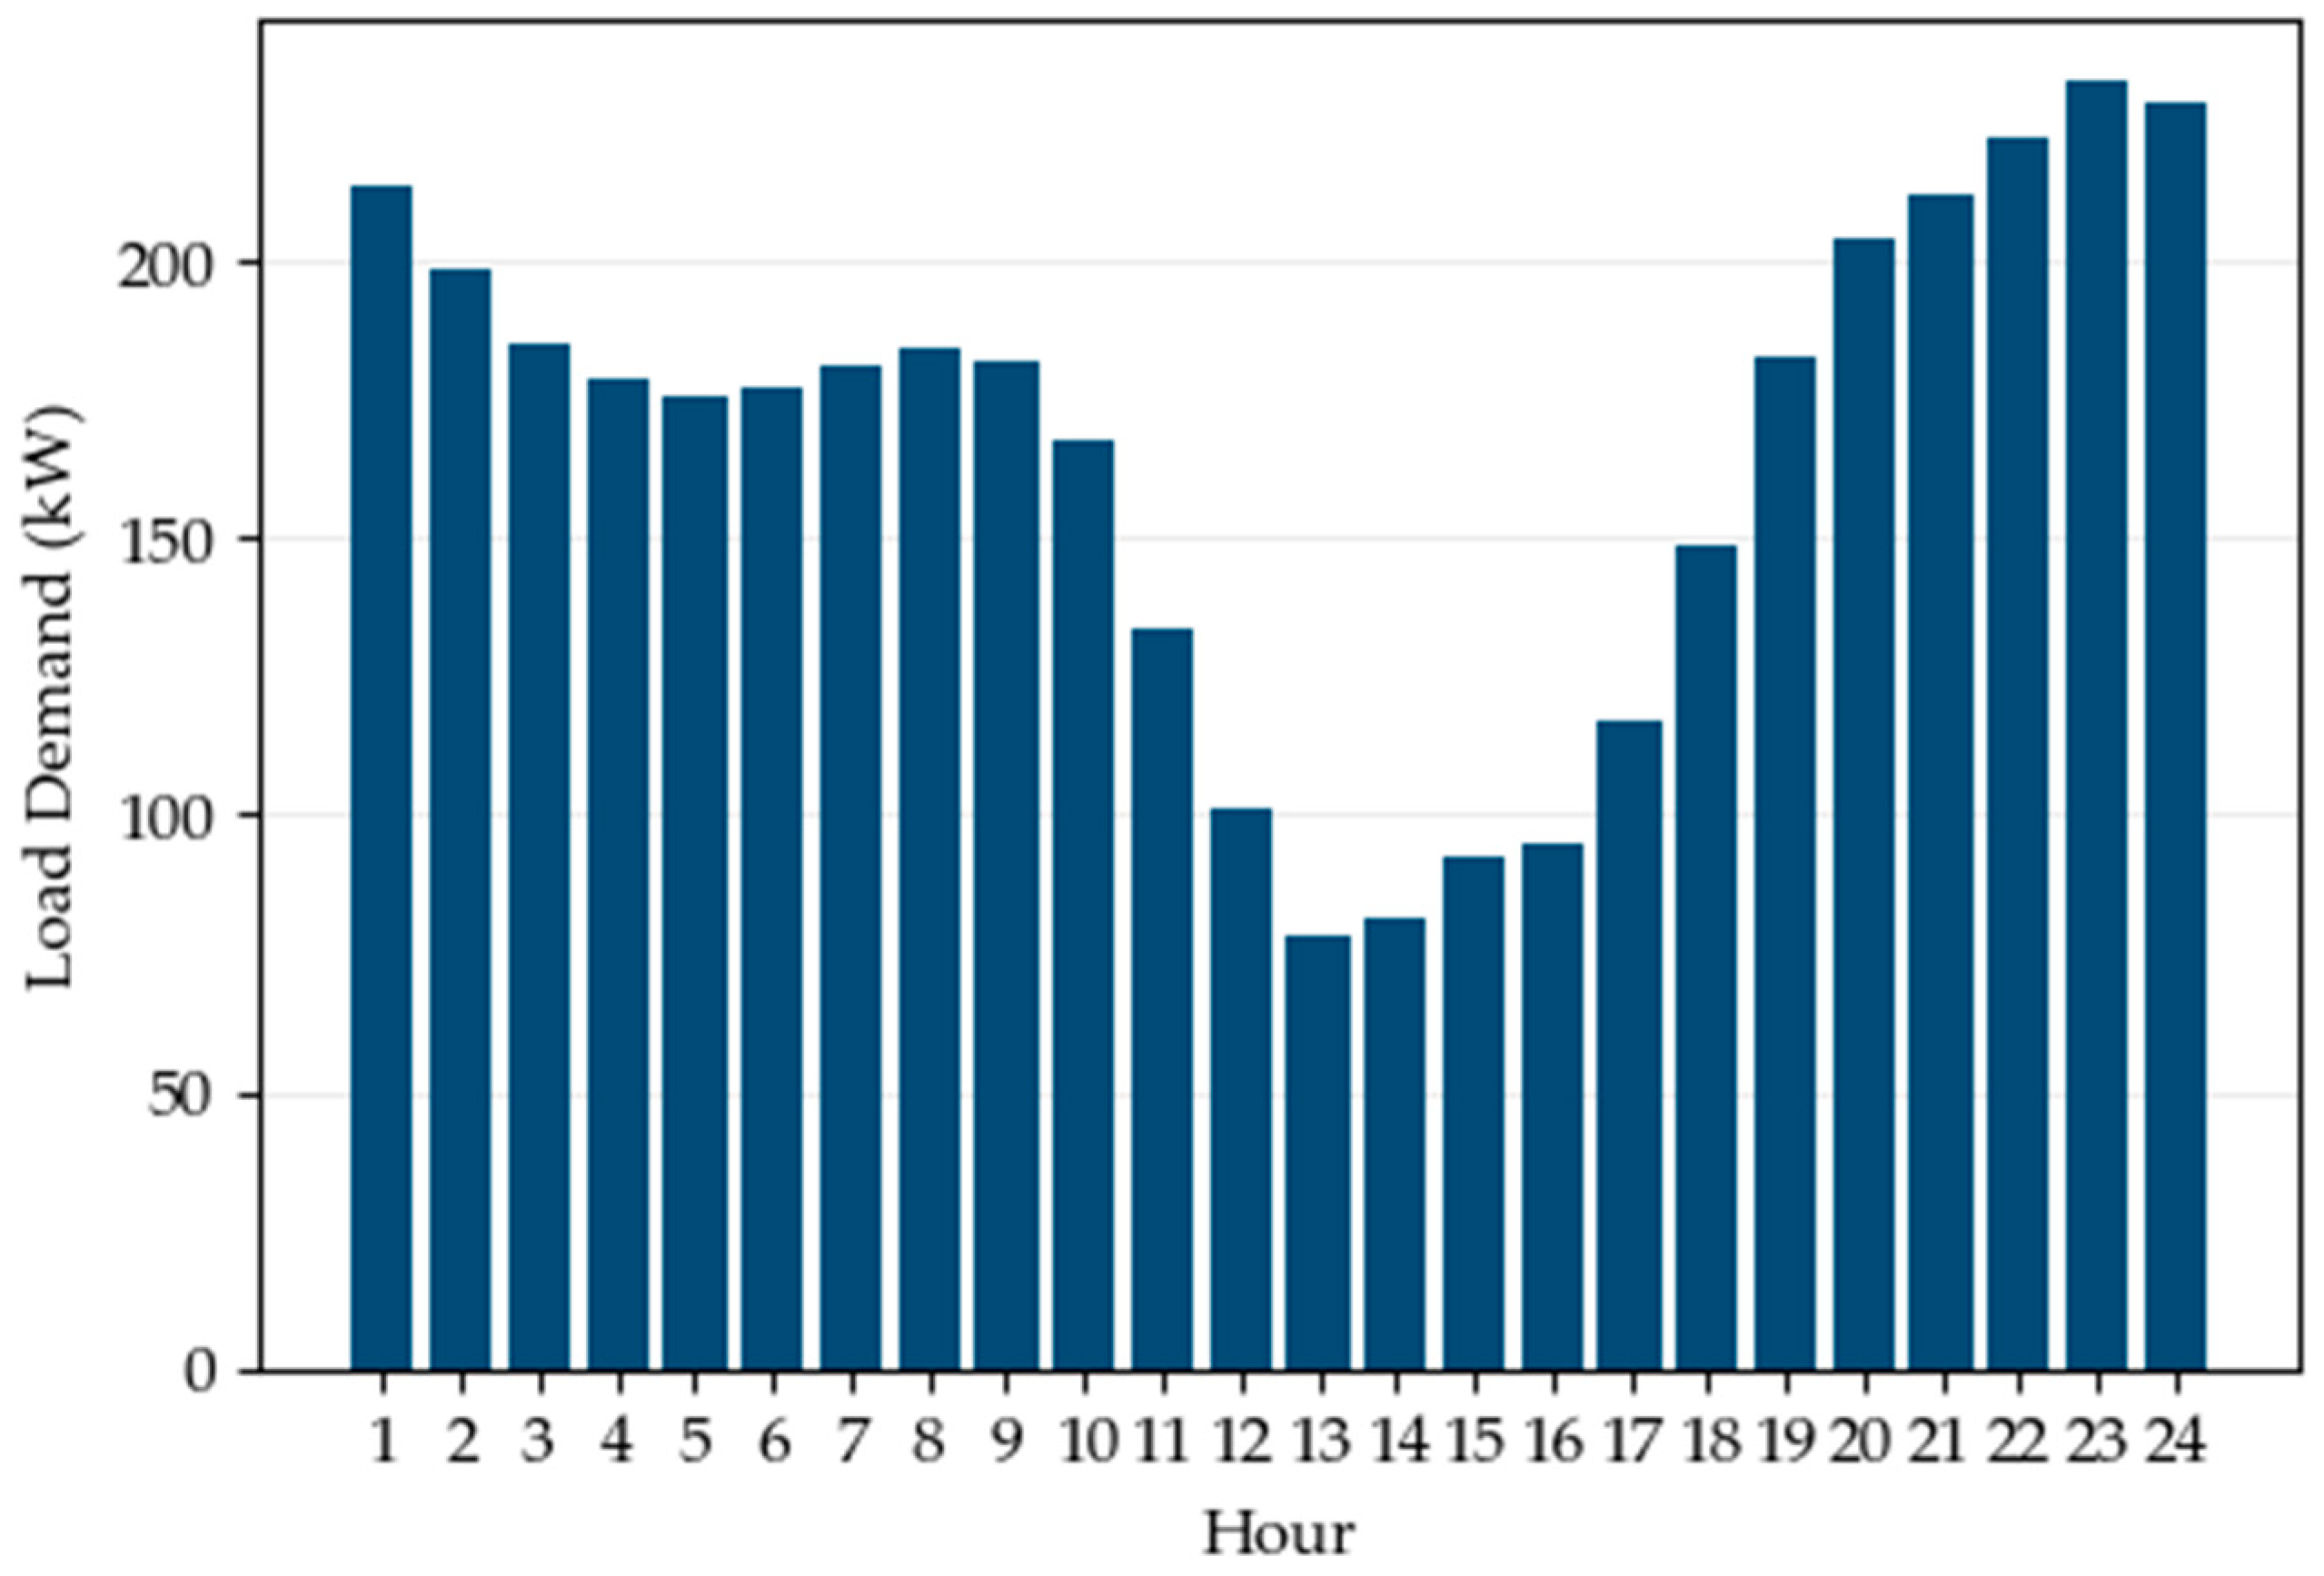
The studied load profile represents the total electricity demand for the semi-remote community of Aras de los Olmos, Spain, including residential homes, small businesses, local public facilities, street lighting, and communal infrastructure. The load is entirely AC, with an average daily demand of 3516.1 kWh/day and an average power of 146.51 kW. The load factor is 0.32, calculated as the ratio of the average load to the peak load, indicating moderate variability. All data were obtained through direct measurements at main distribution points, ensuring accuracy and reliability.
During a typical day in January, as shown in
Figure 4, the load begins at 213.516 kW at midnight, gradually decreases to its lowest values around midday, and then steadily rises again, reaching 232 kW late at night. This daily pattern highlights higher energy demand during the evening and nighttime compared to daytime.
The load exhibits seasonal variations, as shown in
Figure 5, with the peak demand occurring in August, reflecting increased energy consumption during summer. Lower energy requirements are observed during the winter months. Variability in load distribution for each month is evident from the seasonal profile, indicating changing demand patterns throughout the year.
As is shown in
Figure 6, the yearly heatmap illustrates the hourly and seasonal variability of the load. Peak loads, reaching up to 453.41 kW, are more prominent during summer evenings, especially in August, while lower loads dominate the winter months and daytime hours. The figure clearly illustrates daily and seasonal variability, providing evidential support for renewable energy and storage system sizing, optimization scenarios, and reliability analysis presented in this study.
2.3.5. Biomass
The biomass resource for this analysis is modeled with a steady monthly availability of 27.07 tons/day, derived from locally available livestock waste and agricultural residues in Aras de los Olmos. Estimates are based on actual agricultural production statistics and standardized residue generation factors, ensuring accuracy and practical relevance [
20]. This biomass has an average cost of 38.65 USD/ton (covering base price, transportation, and handling), a lower heating value (LHV) of 28 MJ/kg, and a carbon content of 60%. Its gasification ratio is 0.70 kg/kg, reflecting efficient biomass conversion into biogas. Collectively, these parameters highlight the feasibility of harnessing local biomass for sustainable and cost-effective energy generation [
20].
2.4. System Components
The microgrid comprises several key components, including PV panels, WT, a BG, BES, and a converter for managing energy flow between AC and DC buses, all operating in the presence of a main grid connection.
2.4.1. Photovoltaic (PV) Panel
HOMER determines the PV array’s real-time output using Equation (2), which accounts for the array’s rated capacity under Standard Test Conditions (STCs), the incident solar irradiation relative to STCs, a derating factor (e.g., for dust or wiring losses), and the influence of temperature on PV performance [
47].
where
is the actual PV power (kW),
is the rated PV power at STC (kW),
is the PV derating factor,
the GHI on the array (kW/m
2),
is the solar radiation at STC (1 kW/m
2),
is the temperature power coefficient (%/°C),
is the actual PV cell temperature (°C), and
is the cell temperature under STC (25 °C).
Using these variables, HOMER simulates PV performance hour by hour. The software then iterates through different possible system configurations—adjusting PV capacity and other parameters—to find an optimal design. By factoring in real-time irradiance, temperature, and efficiency losses, HOMER provides a more accurate representation of the PV array’s performance over an entire year, enabling better sizing and economic decision-making.
The system modeled in this analysis is a generic flat plate PV system with a rated capacity of 1 kW. The panel operates with a temperature coefficient of −0.5%/°C and is designed for a typical operating temperature of 47 °C. Its efficiency is 13%, representing a standard commercially available PV module. The derating factor is 80%, accounting for potential losses such as dust, shading, and wiring inefficiencies. The ground reflectance is set to 20%, and the system uses a fixed configuration with no tracking. The panel slope is set to the default value of 39.92° based on the site location’s geographical condition, and the azimuth is aligned at 0° south for optimal solar exposure.
2.4.2. Wind Turbine (WT)
When designing a WT system, HOMER uses local wind data, which are adjusted to the turbine’s hub height, as explained previously. It then applies to the manufacturer’s power curve. A generic equation sometimes used for illustrative purposes is shown in Equation (3) [
48].
where
is the cut-in wind speed (m/s),
is the rated wind speed (m/s),
is the cut-out wind speed (m/s), and
, the rated turbine power (kW) is calculated using Equation (4).
where
ρ is the air density (kg/m
3),
is the blade swept area (m
2), and
is the power coefficient.
If HOMER accounts for varying air density (due to changes in temperature, pressure, or altitude), the turbine output may be adjusted accordingly. A basic relationship is presented in Equation (5).
where
is the air pressure (Pa),
is the air temperature (K), and
is the specific gas constant for air (≈287 J/(kg.K)).
Then, an approximate scaling formula might be Equation (6).
where
is the reference air density under standard conditions (about 1.225 kg/m
3).
The system considered in this analysis is a generic 10 kW WT, which makes it suitable for small-scale applications or as a complementary renewable energy source within a hybrid system with a hub height of 24 m. The turbine is connected to the AC bus, ensuring compatible grid-tied and hybrid configurations.
The turbine starts generating power at a cut-in speed of around 4 m/s, with output increasing steadily until reaching its rated capacity of 10 kW at approximately 10–12 m/s. Beyond this, the output stabilizes to protect the turbine, and it continues operating until the cut-out speed of 24 m/s, at which point it shuts down to avoid damage.
2.4.3. Biogas Generator (BG)
A BG converts methane-rich gas from organic materials like agricultural waste, animal manure, or sewage into electricity. This process relies on the anaerobic digestion of biomass to generate biogas, combusted in an engine or turbine. The biomass conversion efficiency and operational parameters (e.g., methane yield, carbon-to-nitrogen ratio, hydraulic retention time) are based on established methodologies described extensively in previous research [
19,
20,
46]. By harnessing waste products as fuel, BG helps reduce greenhouse gas emissions and provides a renewable energy source for both on-grid and off-grid applications.
The electric power output
of a BG can be approximated by Equation (7).
where
is the electrical efficiency of the generator,
is the mass flow rate of biogas (kg/h), and
is the lower heating value of the biogas (kJ/kg).
Equation (7) states that the generator’s electric output is the product of the biogas energy input (flow rate × heating value) times the generator’s electrical efficiency.
Like DG or natural gas gensets, HOMER often uses a simplified two-parameter fuel curve to account for variations in generator efficiency at partial load, as shown in Equation (8).
where
is the volumetric flow of biogas at the current output (m
3/h),
is the rated (maximum) generator power (kW),
is the actual electrical output (kW),
is the intercept coefficient or the no-load fuel consumption coefficient (m
3/kW.h), and
is the slope or incremental fuel consumption coefficient (m
3/kW.h).
In this model, represents the baseline fuel consumption when the generator runs but produces little or no power (idle losses). In contrast, captures the additional fuel needed as output increases.
Once HOMER calculates the required electrical output at each time step, it determines the fuel flow using the two-parameter model. Then, it converts volumetric flow to mass flow (if needed) using biogas density. Finally, it checks consistency with the energy equation to ensure .
Using these formulas and iterative simulations, HOMER helps users optimize BG size and operation schedule within an overall energy system.
The BG used in this analysis is a generic genset with a reference capacity of 200 kW [
19], designed to enhance system reliability and sustainability. It operates with a minimum load ratio of 40% and has a lifetime of 20,000 h, ensuring long-term durability.
Fuel consumption follows a linear curve, with an intercept coefficient of 0.1 kg/h per kW rated capacity and a slope of 2.0 kg/h per kW output.
The BG’s efficiency is minimal at lower loads (near-zero output) because the engine must overcome internal losses and baseline fuel consumption. As the generator’s electrical output rises, efficiency increases steadily, reflecting more effective fuel utilization under heavier loads. Near its rated capacity (around 200 kW), the generator reaches its peak efficiency—about 30–35%. This curve reflects the typical behavior of many engines, which achieve their highest efficiency when operating near their rated load.
Emission levels are minimal, with 2 g of carbon monoxide and 1.25 g of nitrogen oxides per kg of fuel. At the same time, no unburned hydrocarbons or particulate matter are produced, highlighting its environmentally friendly operation.
The generator operates on an optimized schedule. When solar irradiation is unavailable from 6 p.m. to 6 a.m., the generator must operate at its nominal capacity to meet critical energy demands. During the day’s remaining hours, the generator operates based on optimal planning and system conditions, ensuring efficient fuel use and minimal emissions. Also, maintenance on the generator is possible during this interval.
This dynamic operation complements other renewable sources, such as solar and wind, effectively utilizing resources and maintaining energy reliability.
2.4.4. Main Grid
The grid system in this analysis is configured with a simple rate structure aligned with the pricing schemes of Spanish retail electricity providers. The cost of purchasing electricity from the grid is set at 0.19 USD/kWh, while the sellback price for excess electricity exported to the grid is 0.062 USD/kWh. Net metering is applied, with net purchases calculated on an annual basis. This setup ensures compatibility with the HES, allowing the grid to act as both a backup source and an outlet for surplus energy, thereby enhancing the economic efficiency of the overall system.
2.4.5. Battery Energy Storage (BES)
In HOMER simulations, BES systems serve as an energy buffer, storing excess generation and supplying power when demand exceeds production. HOMER models each battery’s capacity, state of charge (SOC), charge/discharge efficiencies, and lifetime constraints, ensuring system dispatch decisions and economic calculations reflect real-world BES performance. This approach accurately assesses reliability, cost, and feasibility in a microgrid or HES.
HOMER tracks the SOC of BES on an hourly or sub-hourly basis. SOC is typically expressed as a fraction (0 to 1) or a percentage (0 to 100%), as defined in Equation (9).
During each time step
(often 1 h), the BES can charge, discharge, or idle. SOC’s simplified one-hour step model can be written as shown in Equation (10).
where
and
are the state of charges at the current and next time step (fraction 0–1),
is the charging power in the current step (kW),
is the discharging power in the current step (kW),
is the charging efficiency,
is the discharging efficiency, and
is the usable BES capacity (kWh).
HOMER enforces minimum and maximum SOC limits to prevent over-discharge or overcharge, as shown in Equation (11).
Many BES specifications use depth of discharge (DOD) to limit how much capacity can be used regularly. If the BES’s minimum state of charge is
then
is defined as Equation (12).
For example, if a BES must always retain at least 20% SOC, the maximum DOD is 80%. HOMER ensures the SOC of the BES never goes below .
The overall roundtrip efficiency is defined as shown in Equation (13), indicating the fraction of energy retained after a full charge-discharge cycle relative to what was put in.
HOMER may apply separate efficiencies for charging () and discharging () or use a single roundtrip efficiency parameter.
BES systems also have maximum charge and discharge power limits, which may depend on the BES’s rated current or nominal capacity. HOMER ensures Equation (14).
These limits can be expressed via maximum charge and discharge currents as Equation (15), restricting how quickly the BES may be charged or discharged.
Another way to specify these limits is by using maximum charge and discharge rates relative to BES capacity, often termed C-rate. For example, a 1 C rate means the BES can be fully charged or discharged in one hour, whereas a 0.5 C rate would take roughly two hours.
HOMER applies these constraints to prevent excessive current flows, safeguard BES lifetime, and ensure reliable operation within the modeled microgrid. However, in some models, these limits vary with the BES’s SOC or other parameters (temperature, health, etc.).
Besides the simple BES modeling, HOMER can use the Kinetic Battery Model (KiBaM). In the KiBaM, total BES capacity is split into available, A, and bound, B, portions, with a rate constant
dictating how quickly energy transfers from the bound to the available portion. The capacity ratio, c, determines the fraction of total capacity that starts in the available tank. A simplified form of KiBaM’s differential equations is presented in Equation (16).
where
is the available capacity at time
,
is the bond capacity at time
,
is the nominal total capacity,
is the rate constant (
),
is the capacity ratio (0 to 1), and
is the BES current at time
(positive for discharge, negative for charge).
In a discrete-time implementation, HOMER numerically integrates these equations at each step. The result is that at high discharge rates, the available portion can deplete quickly, lowering effective capacity. As time passes, some energy from flows into , replenishing it (provided the load is not too high).
SOC in KiBaM is often interpreted as after factoring out any inefficiencies or unusable reserves.
HOMER can estimate BES lifetime or replacement intervals by tracking both cycle life and calendar age. In some cases, it uses cycle-counting techniques that relate the DOD and total cycles to eventual failure, while others rely on a strictly time-based approach over a certain number of years. Another method is a hybrid strategy, which replaces the BES when it reaches a specific time limit, or a defined total energy throughput refers to the total amount of energy discharged over the BES’s lifetime. These considerations primarily affect cost calculations and system economics rather than the hour-by-hour state of charge equations.
By iterating across all time steps for an entire year (or multiple years, if needed), HOMER finds an optimal BES size and operating strategy under the specified load, generation profiles, and economic parameters.
The BES model, including its technical parameters and performance characteristics, is based on established methodologies described in the recent literature [
47].
The BES utilized in this analysis is a generic 1 kWh lead-acid BES with a nominal voltage of 12 V, which leads to a maximum capacity of 83.4 Ah. The configuration includes a string size of 4 batteries, providing a total voltage of 48 V. It features a roundtrip efficiency of 80% and a capacity ratio of 0.403. The BES’s maximum charge and discharge currents are 16.7 A and 24.3 A, respectively, with a maximum charge rate of 1 A/Ah, implying the BES can be fully charged or discharged in about 1 h at the mentioned currents. It has a throughput of 800 kWh, ensuring consistent energy storage and discharge capabilities over its lifespan.
The initial state of charge or is set at 50%, with a minimum allowable state of charge of 20%. This BES plays a crucial role in stabilizing the HES by storing excess energy and supplying it during peak demand or grid outages.
2.4.6. Converter
In HOMER, a converter facilitates the bidirectional energy flow by inverting DC power to AC or rectifying AC power to DC. Its performance is defined by efficiency and rated capacity, determining the maximum power it can handle while accounting for conversion losses. When acting as an inverter, the output power is given by Equation (17).
where
is the inverter efficiency. Conversely, in rectifier mode, the relationship is given by Equation (18).
where
is the rectifier efficiency. Rated capacity defines the maximum power the converter can process in either direction, ensuring compatibility and flexibility in energy management.
The system analyzed here includes a generic 1 kW inverter/rectifier with 95% efficiency for both modes. It operates in parallel with an AC generator and seamlessly integrates renewable energy sources, storage systems, and the grid, optimizing the overall performance of the hybrid system.
2.5. Economic Parameters
HOMER enables users to assess system feasibility by simulating multiple configurations while incorporating economic considerations. HOMER evaluates various financial criteria in this analysis, accounting for all associated costs and revenues. Additionally, it integrates key constraints such as grid tariffs, fuel price fluctuations, and financing options to ensure a comprehensive economic assessment.
The most crucial parameter in HOMER economic modeling is the real discount rate (
). It represents the actual cost of capital, adjusted for inflation, allowing for more accurate comparisons of future cash flows in today’s terms. The real discount rate is calculated using Equation (19).
where
is the nominal discount rate, representing the market interest rate, including the effects of inflation. It accounts for investment risks, borrowing costs, and expected returns. Meanwhile,
is the expected inflation rate, indicating the projected increase in price levels over time.
In this study, the nominal discount rate is 8.00%, while the expected inflation rate is 4.00%. Using Equation (19), the real discount rate is calculated as 3.85%, which adjusts for inflation and represents the true purchasing power of future costs and revenues. In financial analysis, a lower real discount rate enhances the attractiveness of long-term investments, as it preserves the value of future cash flows when accounting for inflation.
Another key economic parameter is the project lifetime (), which defines the total years the system is expected to operate before decommissioning. It is essential in economic analysis, directly impacting cost calculations, financial viability, and long-term investment decisions. In this study, the project lifetime is set at 20 years.
When assessing the financial feasibility of an energy project, several key economic indicators are considered. One such metric is the net present cost (NPC), which represents the system’s total lifetime cost, discounted to present value. It accounts for all capital, operation and maintenance (O&M), replacement, and fuel costs while deducting any revenue or salvage value, as defined in Equation (20).
where
is the net cash flow (cost or revenue) in year
. A lower NPC indicates a more cost-effective system.
Another essential economic metric is the levelized cost of energy (LCOE), which represents the cost per unit of energy (1 kWh) produced over the system’s lifetime, as shown in Equation (21). It is widely used to compare different energy generation technologies in terms of cost-effectiveness.
where
is the total energy generated over the project lifetime (kWh or MWh). A lower LCOE means the system generates energy at a lower cost.
Similarly, the return on investment (ROI) quantifies a project’s profitability as a percentage of the initial investment, as defined in Equation (22).
where net profit is the difference between total revenue and total cost, and initial investment refers to the capital cost incurred at the start of the project. A higher ROI signifies a more profitable and financially viable investment.
Likewise, the internal rate of return (IRR) is the discount rate at which the net present value (NPV) equals zero, as shown in Equation (23). It indicates the project’s expected return rate and is a key measure of investment viability.
where
is cash flow in year
. A higher IRR means the project is financially attractive. If IRR > discount rate, the project is considered profitable.
Finally, the payback period represents the time required to recover the initial investment through cumulative net cash flows, as defined in Equation (24). It is a crucial metric for assessing the risk and financial viability of the project.
where the initial investment represents the total upfront capital cost, and annual net savings are calculated as the annual revenue minus the annual O&M costs.
In this study, the currency for all economic calculations is the USD. These parameters establish the framework for assessing the financial viability and cost-effectiveness of the HES. All economic parameters and simulation components are detailed in
Table 1.
The economic equations used in this study are taken directly from the HOMER user manual and follow established literature [
21,
46]. Likewise, the parameters in
Table 1 are drawn from the generic examples provided by HOMER. These cost parameters reflect typical market conditions and current practices, ensuring consistency with the recognized standards and data sources outlined in the official HOMER documentation.
Specific modeling assumptions, constraints, and parameters were clearly defined within HOMER to ensure reproducibility and transparency. Economic inputs included a nominal discount rate of 8%, an inflation rate of 4%, and detailed component cost assumptions—covering capital, replacement, and operation and maintenance costs—as presented in
Table 1.
Technically, PV panels were assumed to degrade in efficiency at 0.5% per year, wind turbine availability was set at 97%, and battery storage systems were operated within a state-of-charge range from 20% to 100%. The BG was modeled with a specified minimum loading ratio and an availability factor. Operational limitations such as caps on grid sales and purchases and minimum renewable energy fraction targets were explicitly incorporated. Furthermore, biomass availability was constrained based on seasonal patterns of agricultural residue generation. Reliability and performance were evaluated using predefined metrics, including capacity factors, minimum renewable penetration levels, and the maximum allowable fraction of unmet load, ensuring that all key performance indicators were thoroughly documented.
2.6. Design Process
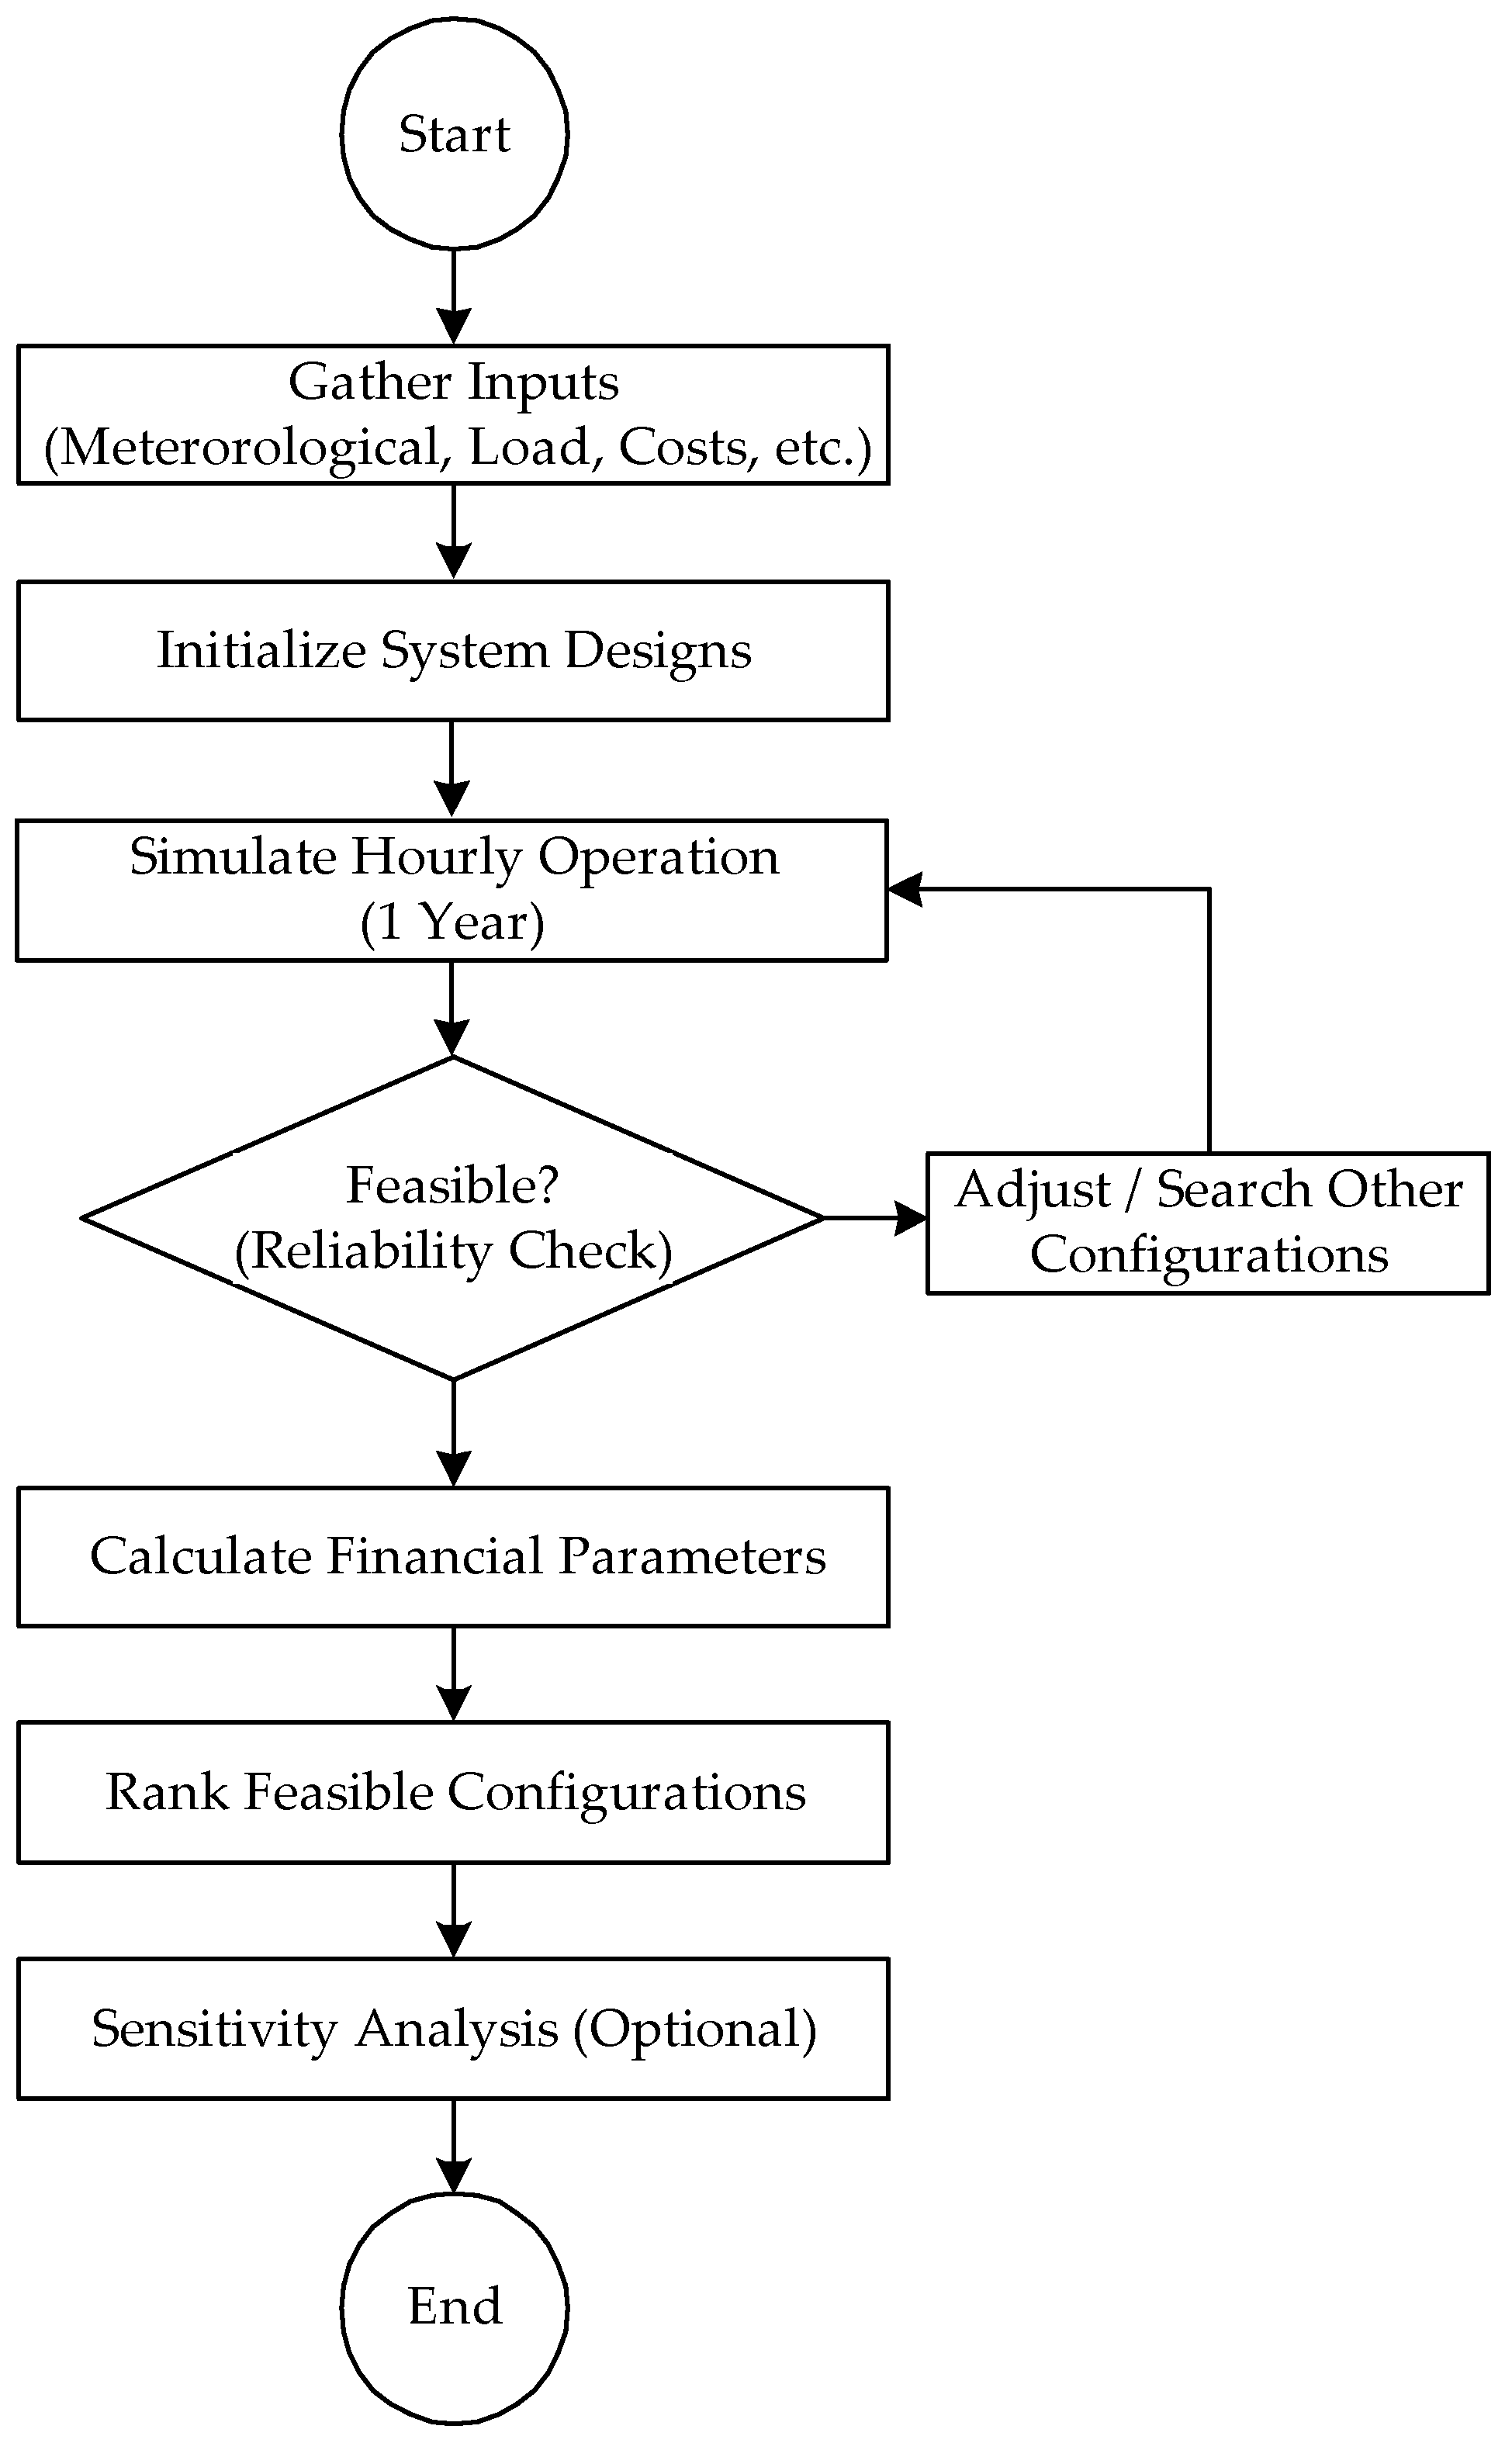
The design process in HOMER follows a systematic approach to evaluate and optimize energy system configurations, as illustrated in
Figure 7.
The process begins with data collection, where key inputs such as meteorological data, energy demand, and cost parameters are gathered to inform initial system designs. HOMER then simulates the system’s hourly operation over one year, analyzing its performance under realistic conditions. A feasibility check ensures the system meets reliability criteria; if not, adjustments are made, and alternative configurations are explored. Once a feasible system is identified, HOMER calculates economic indicators such as NPC, LCOE, and ROI, ranking the feasible configurations based on their economic and technical performance. Finally, an optional sensitivity analysis evaluates the impact of uncertainties in input parameters, ensuring a robust design. The process concludes with selecting the optimal system configuration and balancing cost, reliability, and sustainability.
3. Results
In this section, the results of both scenarios are presented, followed by an analysis of the findings to evaluate their implications and performance. The results obtained from the optimized hybrid scenarios demonstrate a significant impact on rural energy planning. Scenario I provides a cost-effective transition toward renewables, reducing operational costs without compromising reliability. Scenario II substantially enhances energy autonomy and resilience, significantly lowering dependency on grid power and reducing emissions. These outcomes indicate that integrating locally sourced biomass alongside PV offers considerable socio-economic and environmental benefits, improving energy security, stability, and local economic resilience. Thus, these scenarios provide actionable insights for policymakers and stakeholders seeking sustainable and reliable energy solutions for rural communities.
Before exploring the outcomes in greater depth, it is essential to understand how HOMER decides when each component (e.g., a generator or battery) should produce or store electricity. In HOMER, power dispatch refers to how the software decides when each component (such as a generator or battery) should produce or store electricity. Common strategies include Cycle Charging (CC) and Load Following (LF). In CC, the generator runs near its rated capacity whenever it is on, providing enough power for the load and charging the battery with surplus energy. This approach often leverages higher generator efficiency by operating it near optimum load points. Conversely, in LF, the generator meets immediate demand without intentionally overproducing to charge the battery. This can reduce unnecessary fuel consumption but may run the generator at less efficient partial loads if the system’s demand fluctuates. By comparing these dispatch strategies in HOMER, designers can evaluate trade-offs in fuel usage, operational costs, and overall system performance.
3.1. Scenario I: Economic Optimization
After analyzing various configurations using HOMER software, the most optimal configurations have been identified to achieve the most cost-effective operation under the existing conditions. These configurations are summarized in
Table 2.
Table 2 demonstrates that integrating renewable energy technologies often yields greater economic efficiency than relying exclusively on the main grid. For example, Configuration No. 1 (the Proposed System), which includes 147 kW of PV, exhibits an NPC of USD 3.27 M—USD 90,000 lower than the Base Case (USD 3.36 M), which uses only the grid. Its LCOE of 0.182 USD/kWh also betters the 0.190 USD/kWh of the Base Case, underscoring the cost-effectiveness of introducing renewables. The Proposed System requires a higher initial investment (USD 396,148) than the Base Case (USD 0). However, it benefits from reduced annual O&M expenses of USD 208,764. This reduction results in annual savings of USD 35,078 compared to the Base Case. These savings reflect lower reliance on grid power and efficient deployment of on-site generation.
Although WTs appear in some configurations (e.g., No. 2 and No. 4), their geographical constraints yield only modest gains in renewable fraction (up to about 15.8%) compared to PV-dominated systems. Similarly, BES can further reduce grid dependency, yet they remain costly due to high upfront expenses and shorter lifespans. Even so, hybrid systems that combine PV, WTs, and/or limited BES often balance overall costs and raise renewable penetration to about 15–16%, lowering emissions relative to a 0% renewable scenario.
Regarding environmental impact, each increment in renewable fraction directly reduces the reliance on conventional power sources, suggesting lower greenhouse gas emissions than the fully grid-based alternative. This trade-off involves higher initial capital requirements for equipment like PV modules and BES systems, which is offset by long-term economic and environmental benefits in most configurations. Ultimately, the data confirm that partial renewable adoption—especially via PV—can achieve cost savings, improve sustainability, and lower annual operating costs while maintaining feasible overall economics.
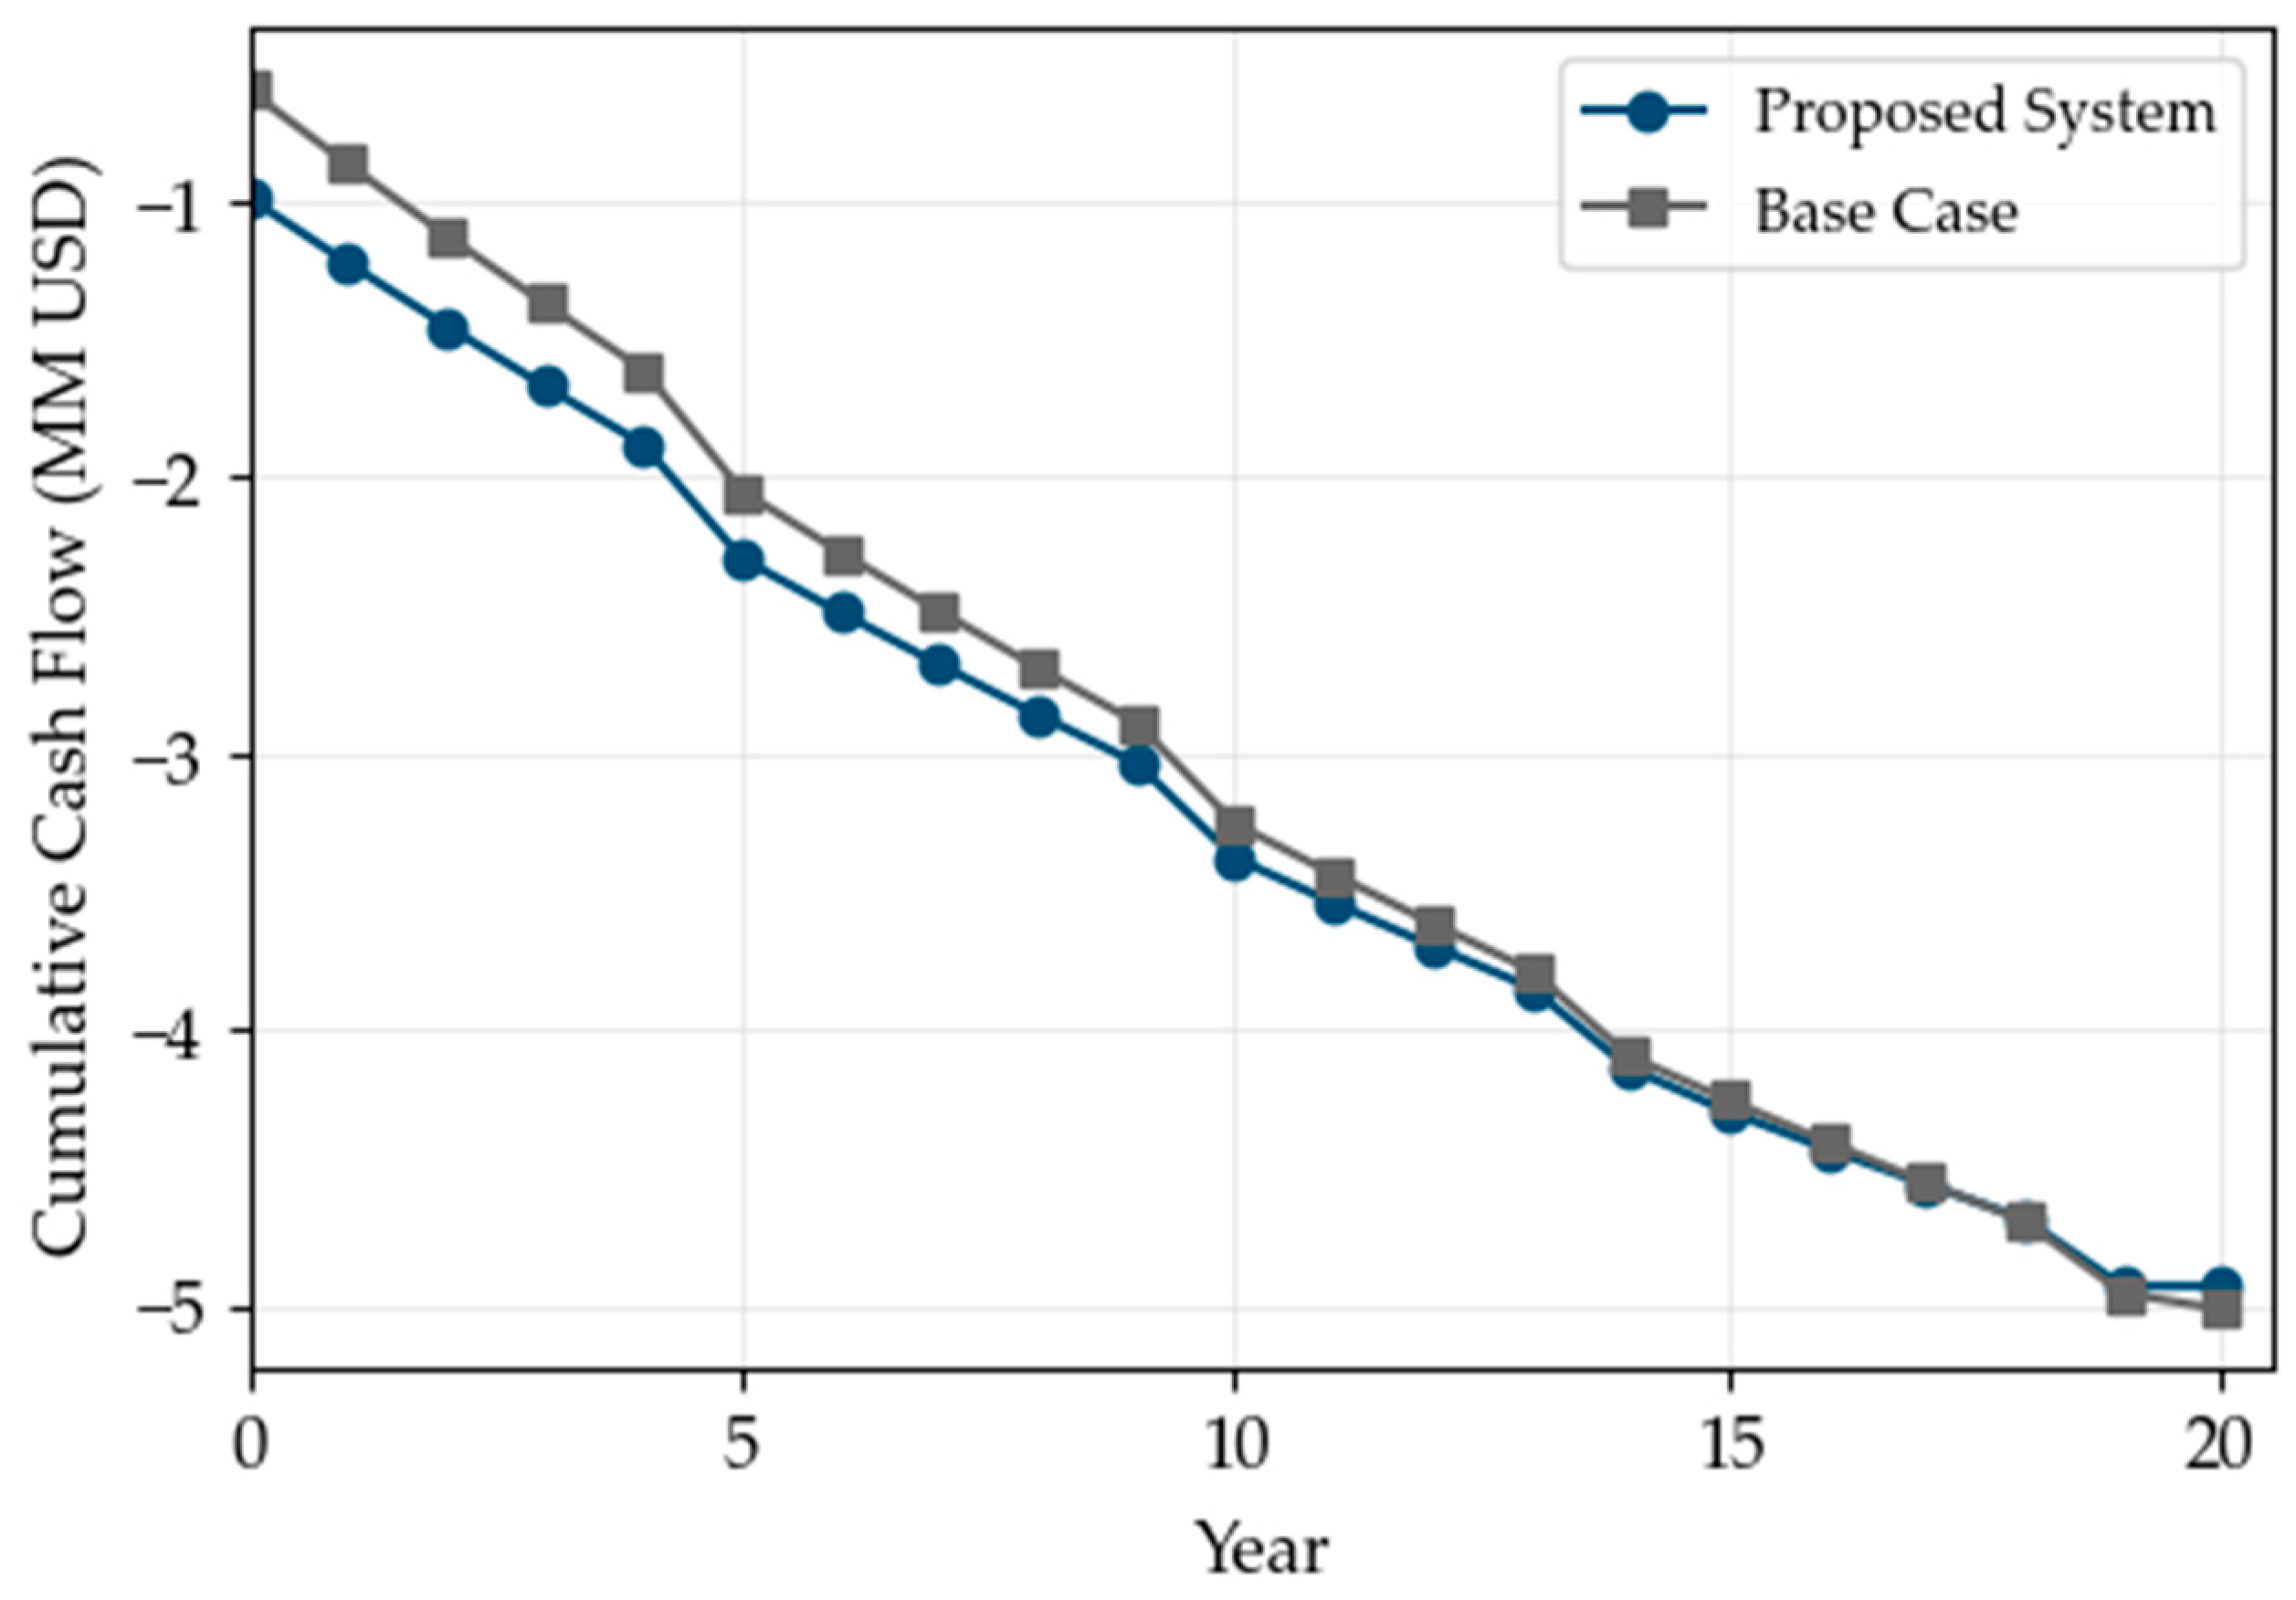
Figure 8 shows the cumulative discounted cash flow over the 20-year project lifetime for the Base Case and the Proposed System. Although the Proposed System’s simple payback period is around 12 years, its discounted payback extends to 17.31 years—reflecting the time value of money and thus providing a more accurate measure of how quickly the initial costs are recovered. Despite this longer discounted payback, the Proposed System’s cash flow curve remains higher (i.e., less negative) than that of the Base Case towards the end of the timeline. By the end of the project, this translates into a net advantage of about USD 90,000 for the Proposed System.
Key economic indicators for the Proposed System emphasize its financial viability. With an IRR of 6.0%—exceeding the real discount rate of 3.85%—the project demonstrates profitability over its lifespan. The 4.2% ROI similarly reflects a net gain relative to the total investment, and although modest, it confirms the project’s economic feasibility.
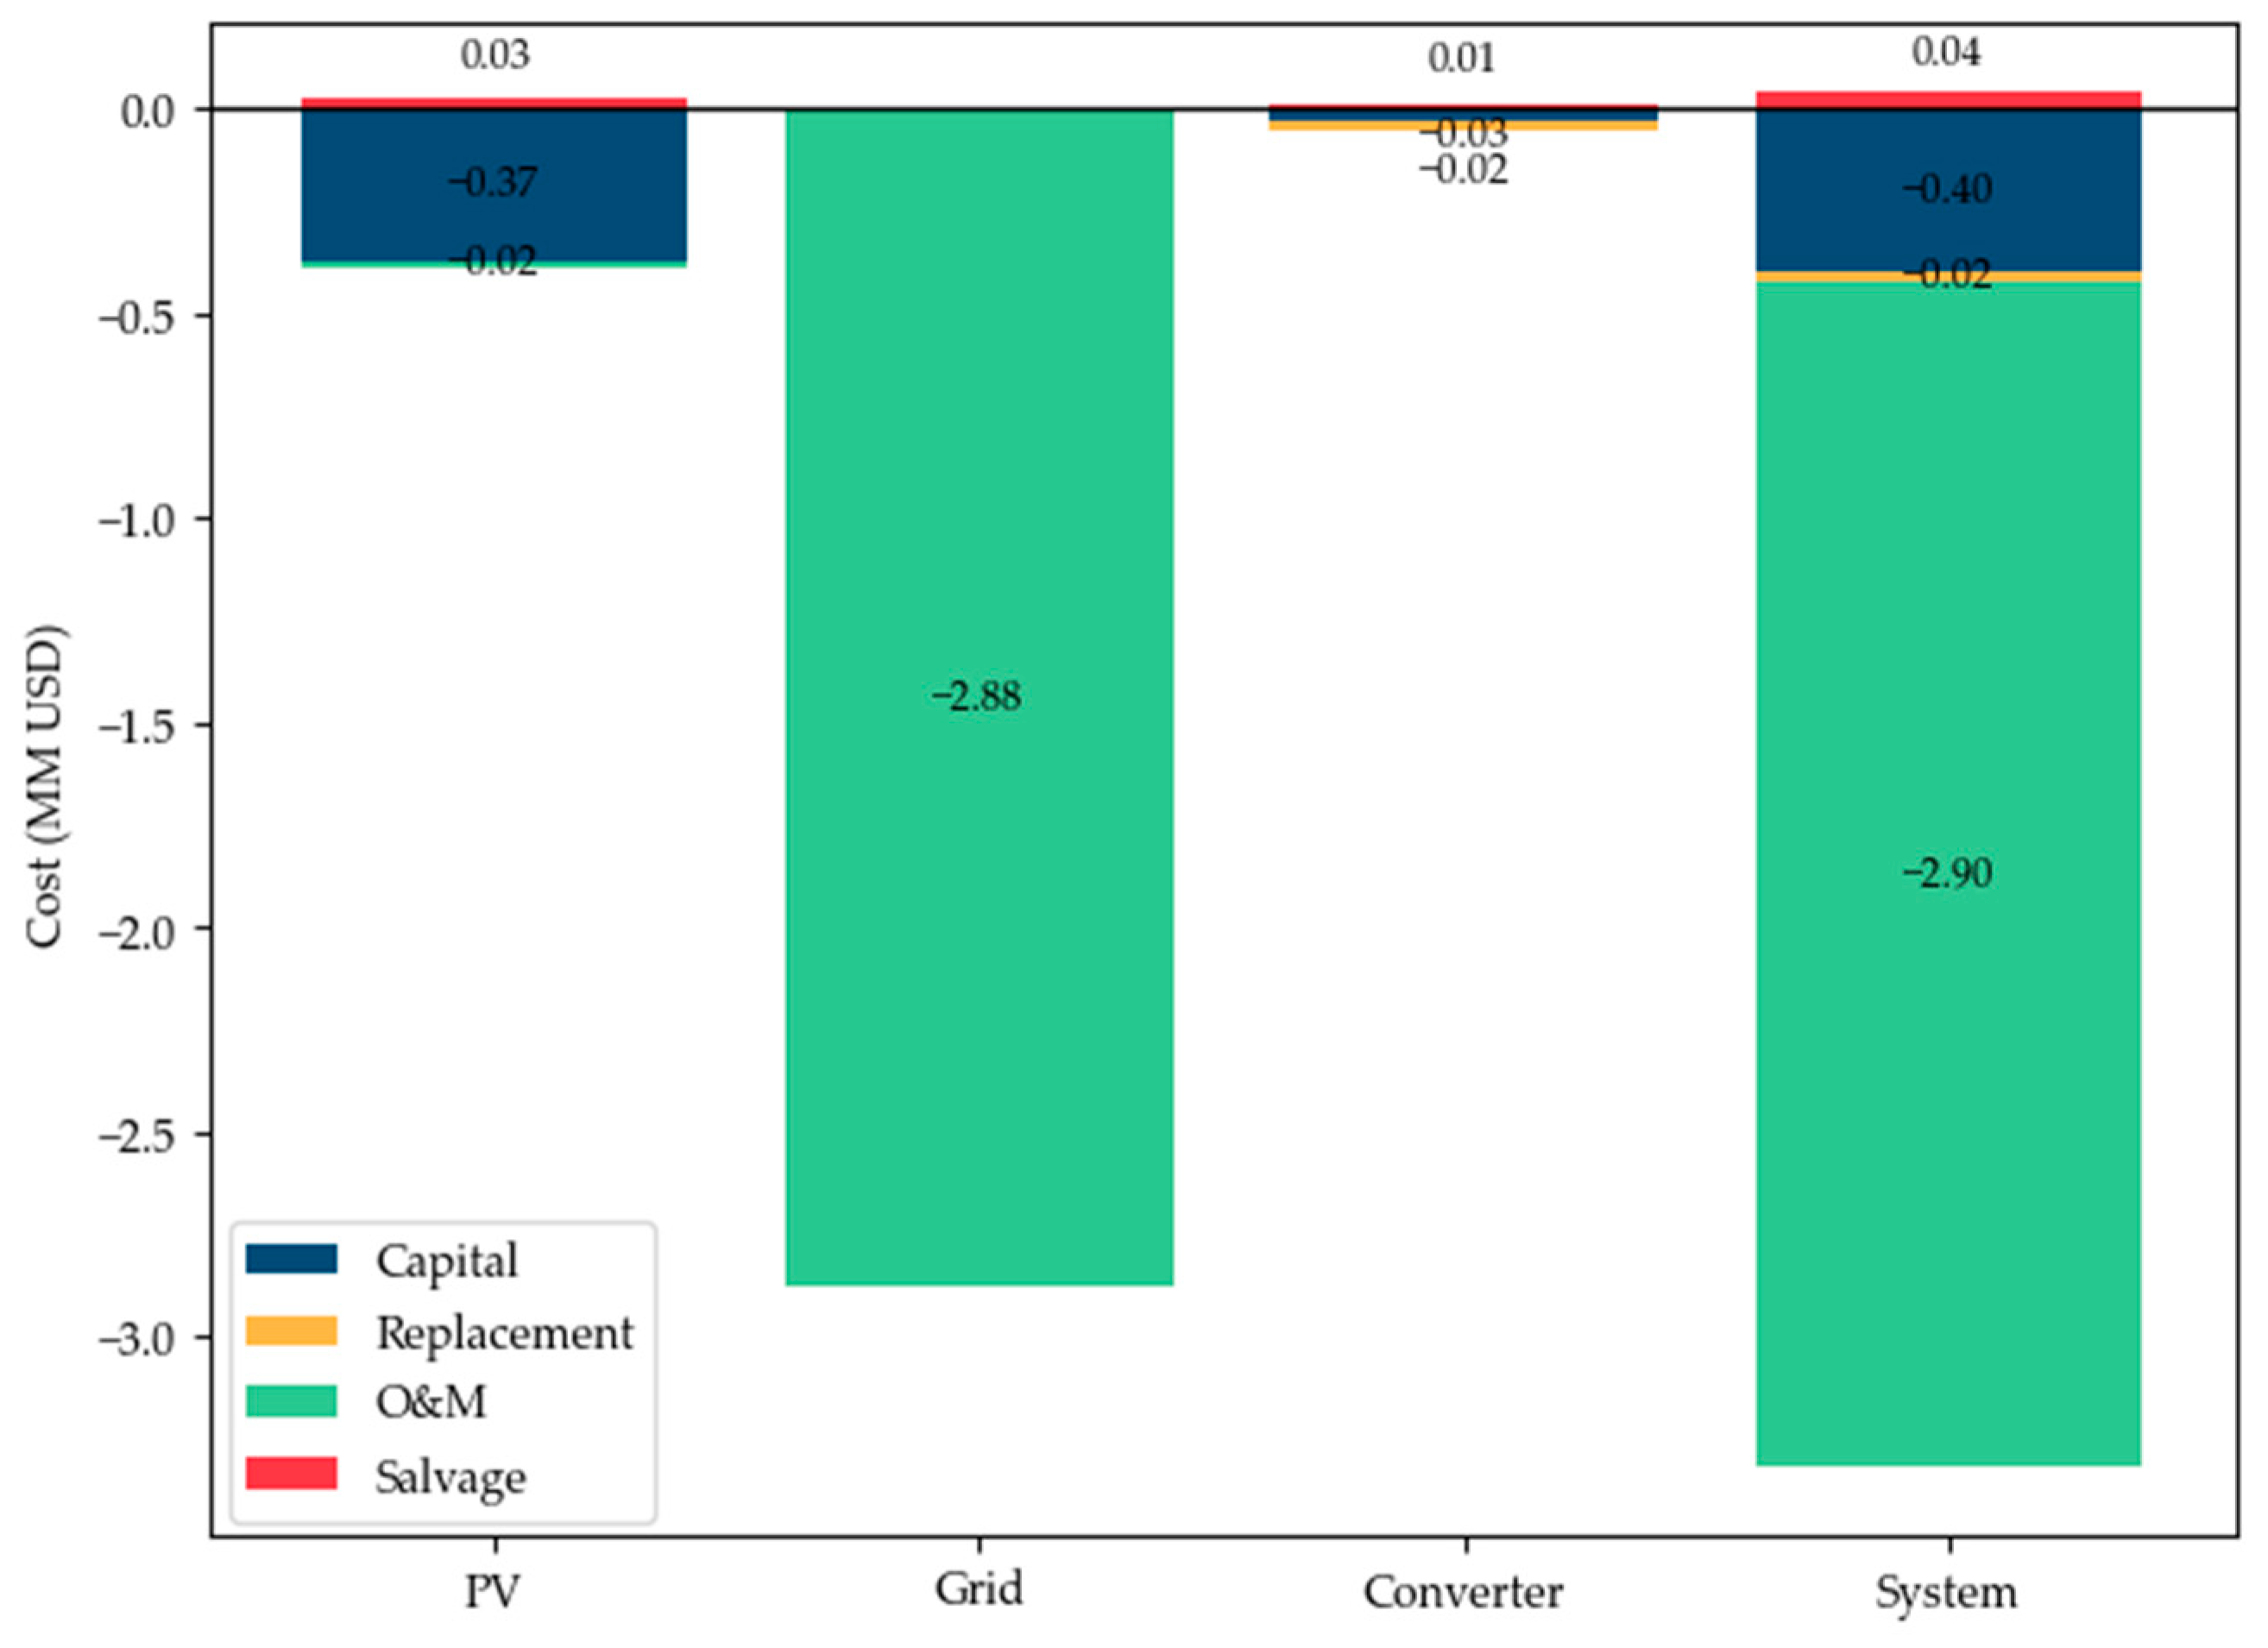
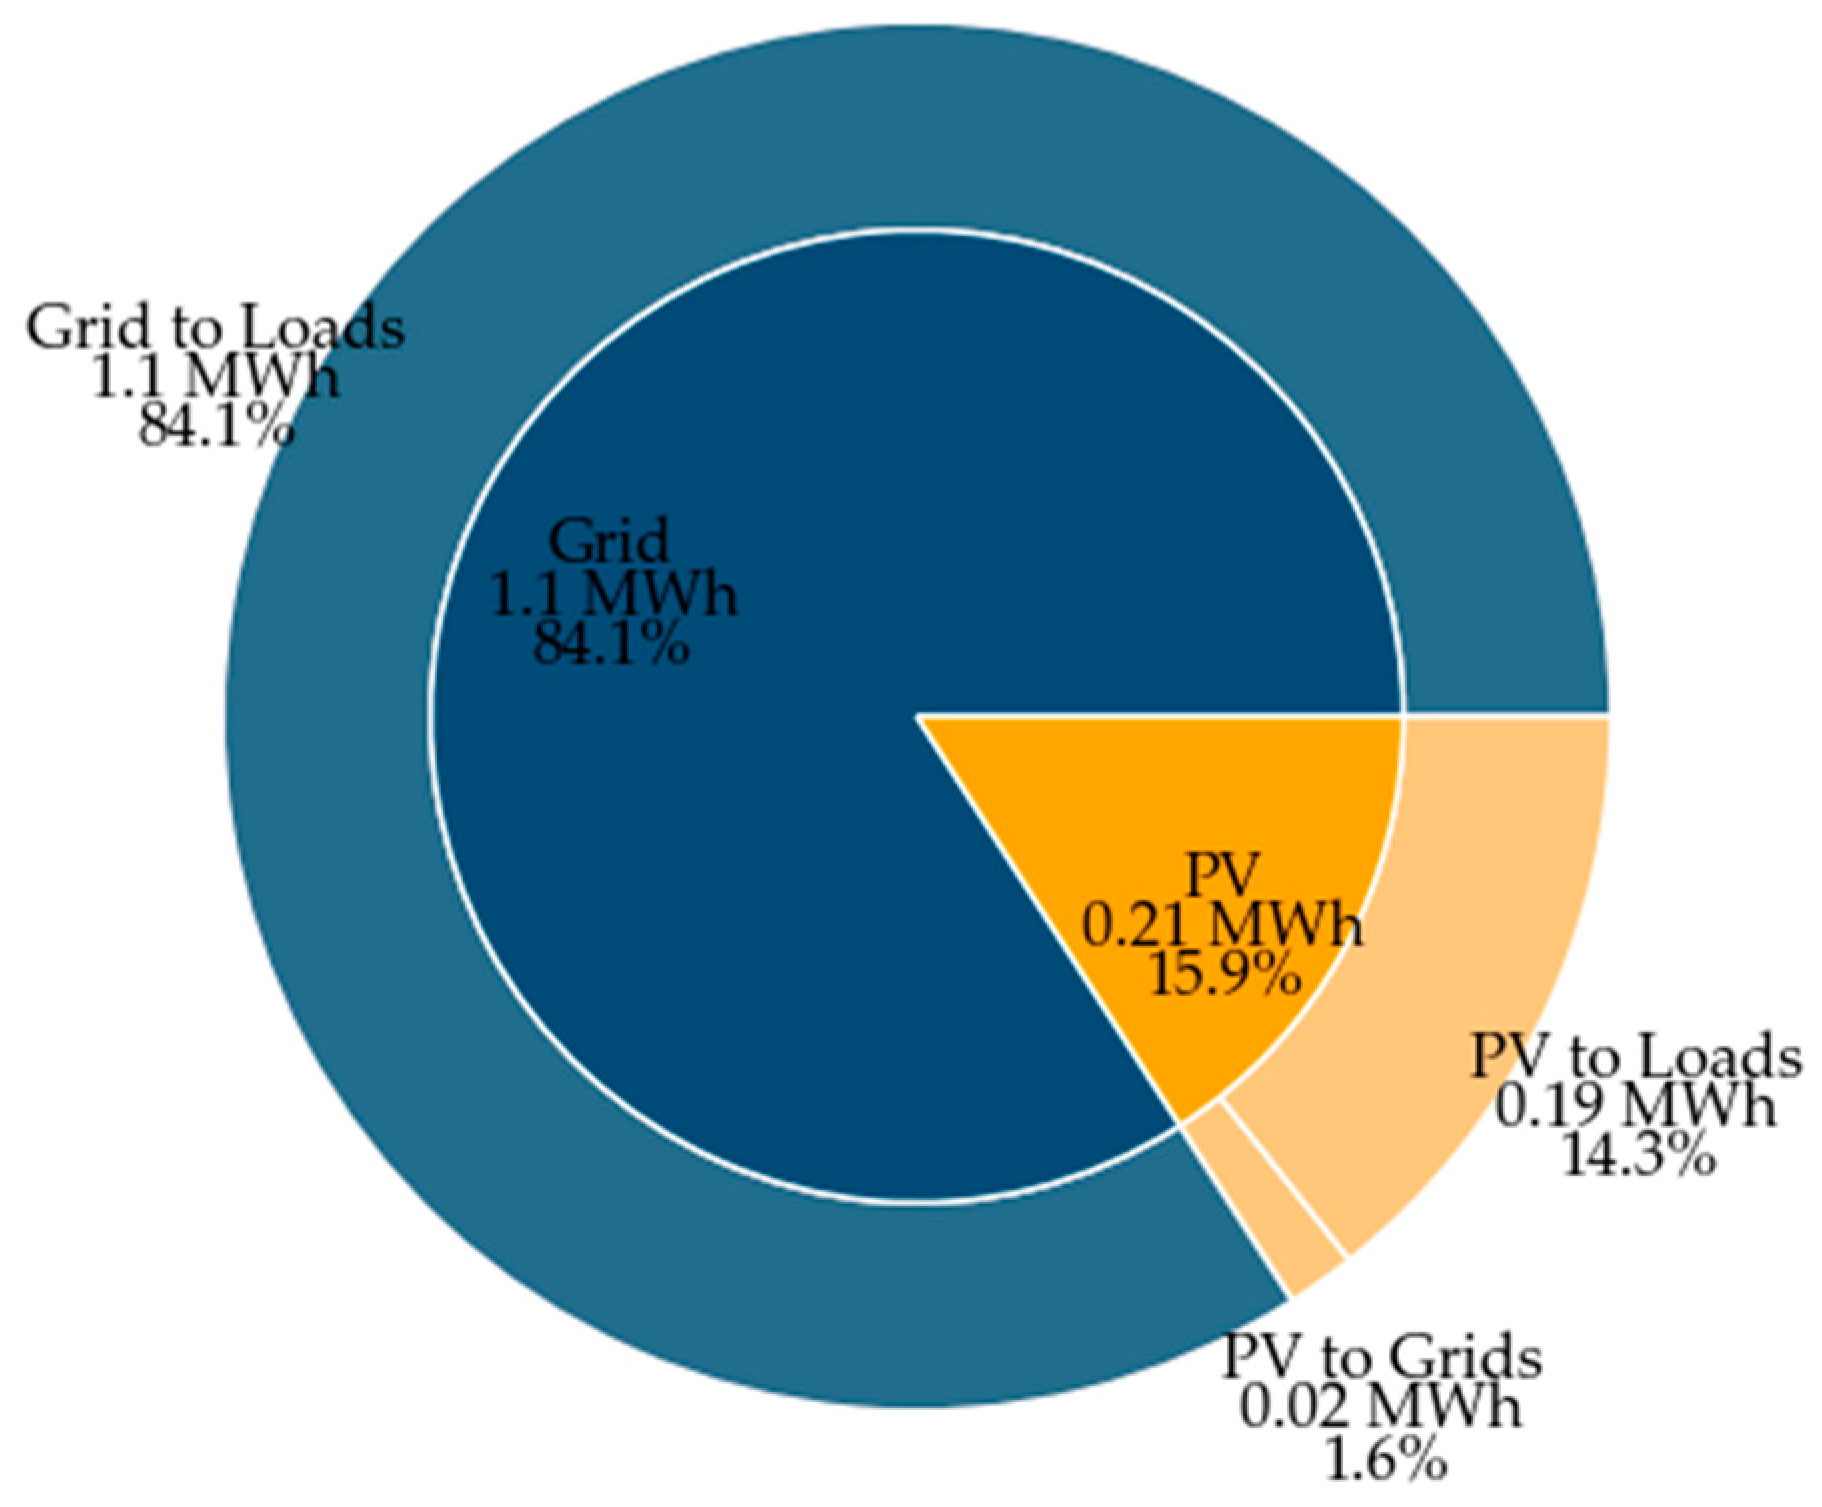
As shown in
Figure 9, the grid constitutes the largest share of Scenario I’s Proposed System costs—around 88%—primarily due to operational expenses. PV accounts for 11% of the total, reflecting a substantial yet smaller capital investment, and the converter makes up only 1%. Although PV has a relatively low-cost share, it significantly reduces reliance on the grid by offsetting considerable electricity purchases. PV generation over the system’s lifetime helps minimize operational costs. It also mitigates fuel price volatility. Thus, even an 11% cost contribution from PV can yield meaningful long-term savings. These savings become significant compared to complete dependence on grid power. Moreover, the ability of HOMER to optimize PV capacity based on the site’s GHI data and a detailed cost model ensures that PV investments are appropriately sized, contributing to the observed cost distribution and reinforcing PV’s role in reducing operational expenses.
Figure 10 shows that the grid provides most of the energy year-round for the Proposed System, accounting for 84.1% of the total energy supply directly consumed by the loads. In contrast, PV production contributes 15.9% of total generation, and only 1.6%—as expected from surplus generation—is sold back to the grid, with the rest used entirely to meet the load. This large grid share stems from varying solar availability, load fluctuations, and the system’s design to ensure reliable power during periods of low irradiance or peak demand. Meanwhile, limited surplus and possibly minimal incentives (e.g., net metering or feed-in tariffs) contribute to a small fraction of PV exports. This distribution highlights the grid’s critical role in maintaining stability and underscores the importance of balancing renewable integration with dependable conventional energy sources.
3.2. Scenario II: Economic Optimization
Next, the results of the second scenario, which involves the implementation of a BG, are presented in
Table 3. This approach leverages the availability of livestock waste in the region to enhance energy production. BG offers economic benefits and aims to increase the microgrid’s independence from the main grid. By reducing reliance on the grid, this configuration addresses frequent outages and power interruptions, thereby improving reliability and ensuring a more stable energy supply.
Like Scenario I, integrating renewable energy equipment in Scenario II improves system performance. It reduces long-term costs, with PV panels dominating WTs and BES systems. A noteworthy example is Configuration No. 1 (the Proposed System), which combines 144 kW of PV, a 200 kW BG unit, and the main grid. This setup achieves an NPC of USD 4.93 M, slightly lower than the USD 5.01 M of the Base Case (Configuration No. 5). The Base Case relies on no PV, no WT, and a 200 kW BG alongside the main grid. Although the Proposed System’s initial capital cost is higher (USD 988,787 vs. USD 600,000), it significantly cuts O&M expenses—286,188 USD/year instead of 320,444 USD/year—and yields a lower LCOE of 0.274 USD/kWh compared to 0.283 USD/kWh in the Base Case. Despite the greater upfront investment, these savings highlight the economic advantages of adopting PV.
Regarding renewable energy fraction, the Proposed System (Configuration No. 1) achieves 71.1%, substantially higher than the 57.5% in the Base Case. Other configurations, like No. 4, push the renewable fraction up to 78.5%, albeit with a slightly higher NPC of USD 5.01 M—reflecting a trade-off between maximizing renewables and minimizing costs. As with Scenario I, WTs and BES systems play secondary roles due to geographical limitations and higher capital costs. Nonetheless, each increment in renewable penetration contributes to a lower environmental impact by reducing reliance on conventional energy, underscoring the potential for hybrid systems to balance economic viability with sustainability goals.
Figure 11 illustrates the cumulative discounted cash flow over 20 years for the Base Case and the Proposed System. Both systems exhibit a steady decline in cash flow due to operating and maintenance costs; however, the Proposed System consistently performs better, showing less negative cash flow throughout the period. This demonstrates the long-term economic advantage of integrating renewable energy technologies. The gap between the two systems widens over time, highlighting the cost-saving benefits of the Proposed System in reducing reliance on the grid and optimizing operational expenses. By year 20, the cumulative savings of the Proposed System over the Base Case become substantial, emphasizing its financial feasibility and sustainability. The system has a discounted payback period of 17.44 years, meaning the initial capital investment is recovered within this timeframe, leaving more than two years of net financial benefit over the system’s 20-year lifetime.
Key economic metrics for the Proposed System demonstrate its robust financial viability. The 6.0% IRR represents the rate of return over the system’s lifetime—a modest but acceptable value for renewable energy projects. The ROI is 4.2%, reflecting the net benefit of the project relative to its total investment, which, while modest, confirms its economic feasibility. These metrics highlight the system’s long-term economic viability, like Scenario I.
As shown in
Figure 12, in Scenario II, the BG dominates the total project cost, accounting for 72.6%, reflecting its significant role in the system. The grid contributes 19.6%, a notable reduction from Scenario I, while PV maintains a smaller yet consistent share of 7.0%. The converter represents 0.7% of the total, underscoring its minimal contribution. This cost distribution highlights the system’s reliance on BG as the primary energy source, complemented by the grid and PV to ensure reliability and renewable integration. Moreover, HOMER’s capacity optimization for the BG—considering fuel costs, operational constraints, and site-specific conditions—drives its dominant cost share, while targeted PV usage helps offset grid dependence and mitigate long-term operational expenses.
Figure 13 illustrates the cumulative cash flow of the project, categorized by equipment, over the analysis period for better economic insight. As observed, BG consistently accounts for the largest share of costs across all years, reflecting its dominant role in the system’s financial structure. Following BG, grid electricity purchases represent the second most significant expense, highlighting the system’s reliance on external power sources. Other components, including PV and the converter, contribute comparatively smaller portions only during the initial investment phase and occasional replacement years.
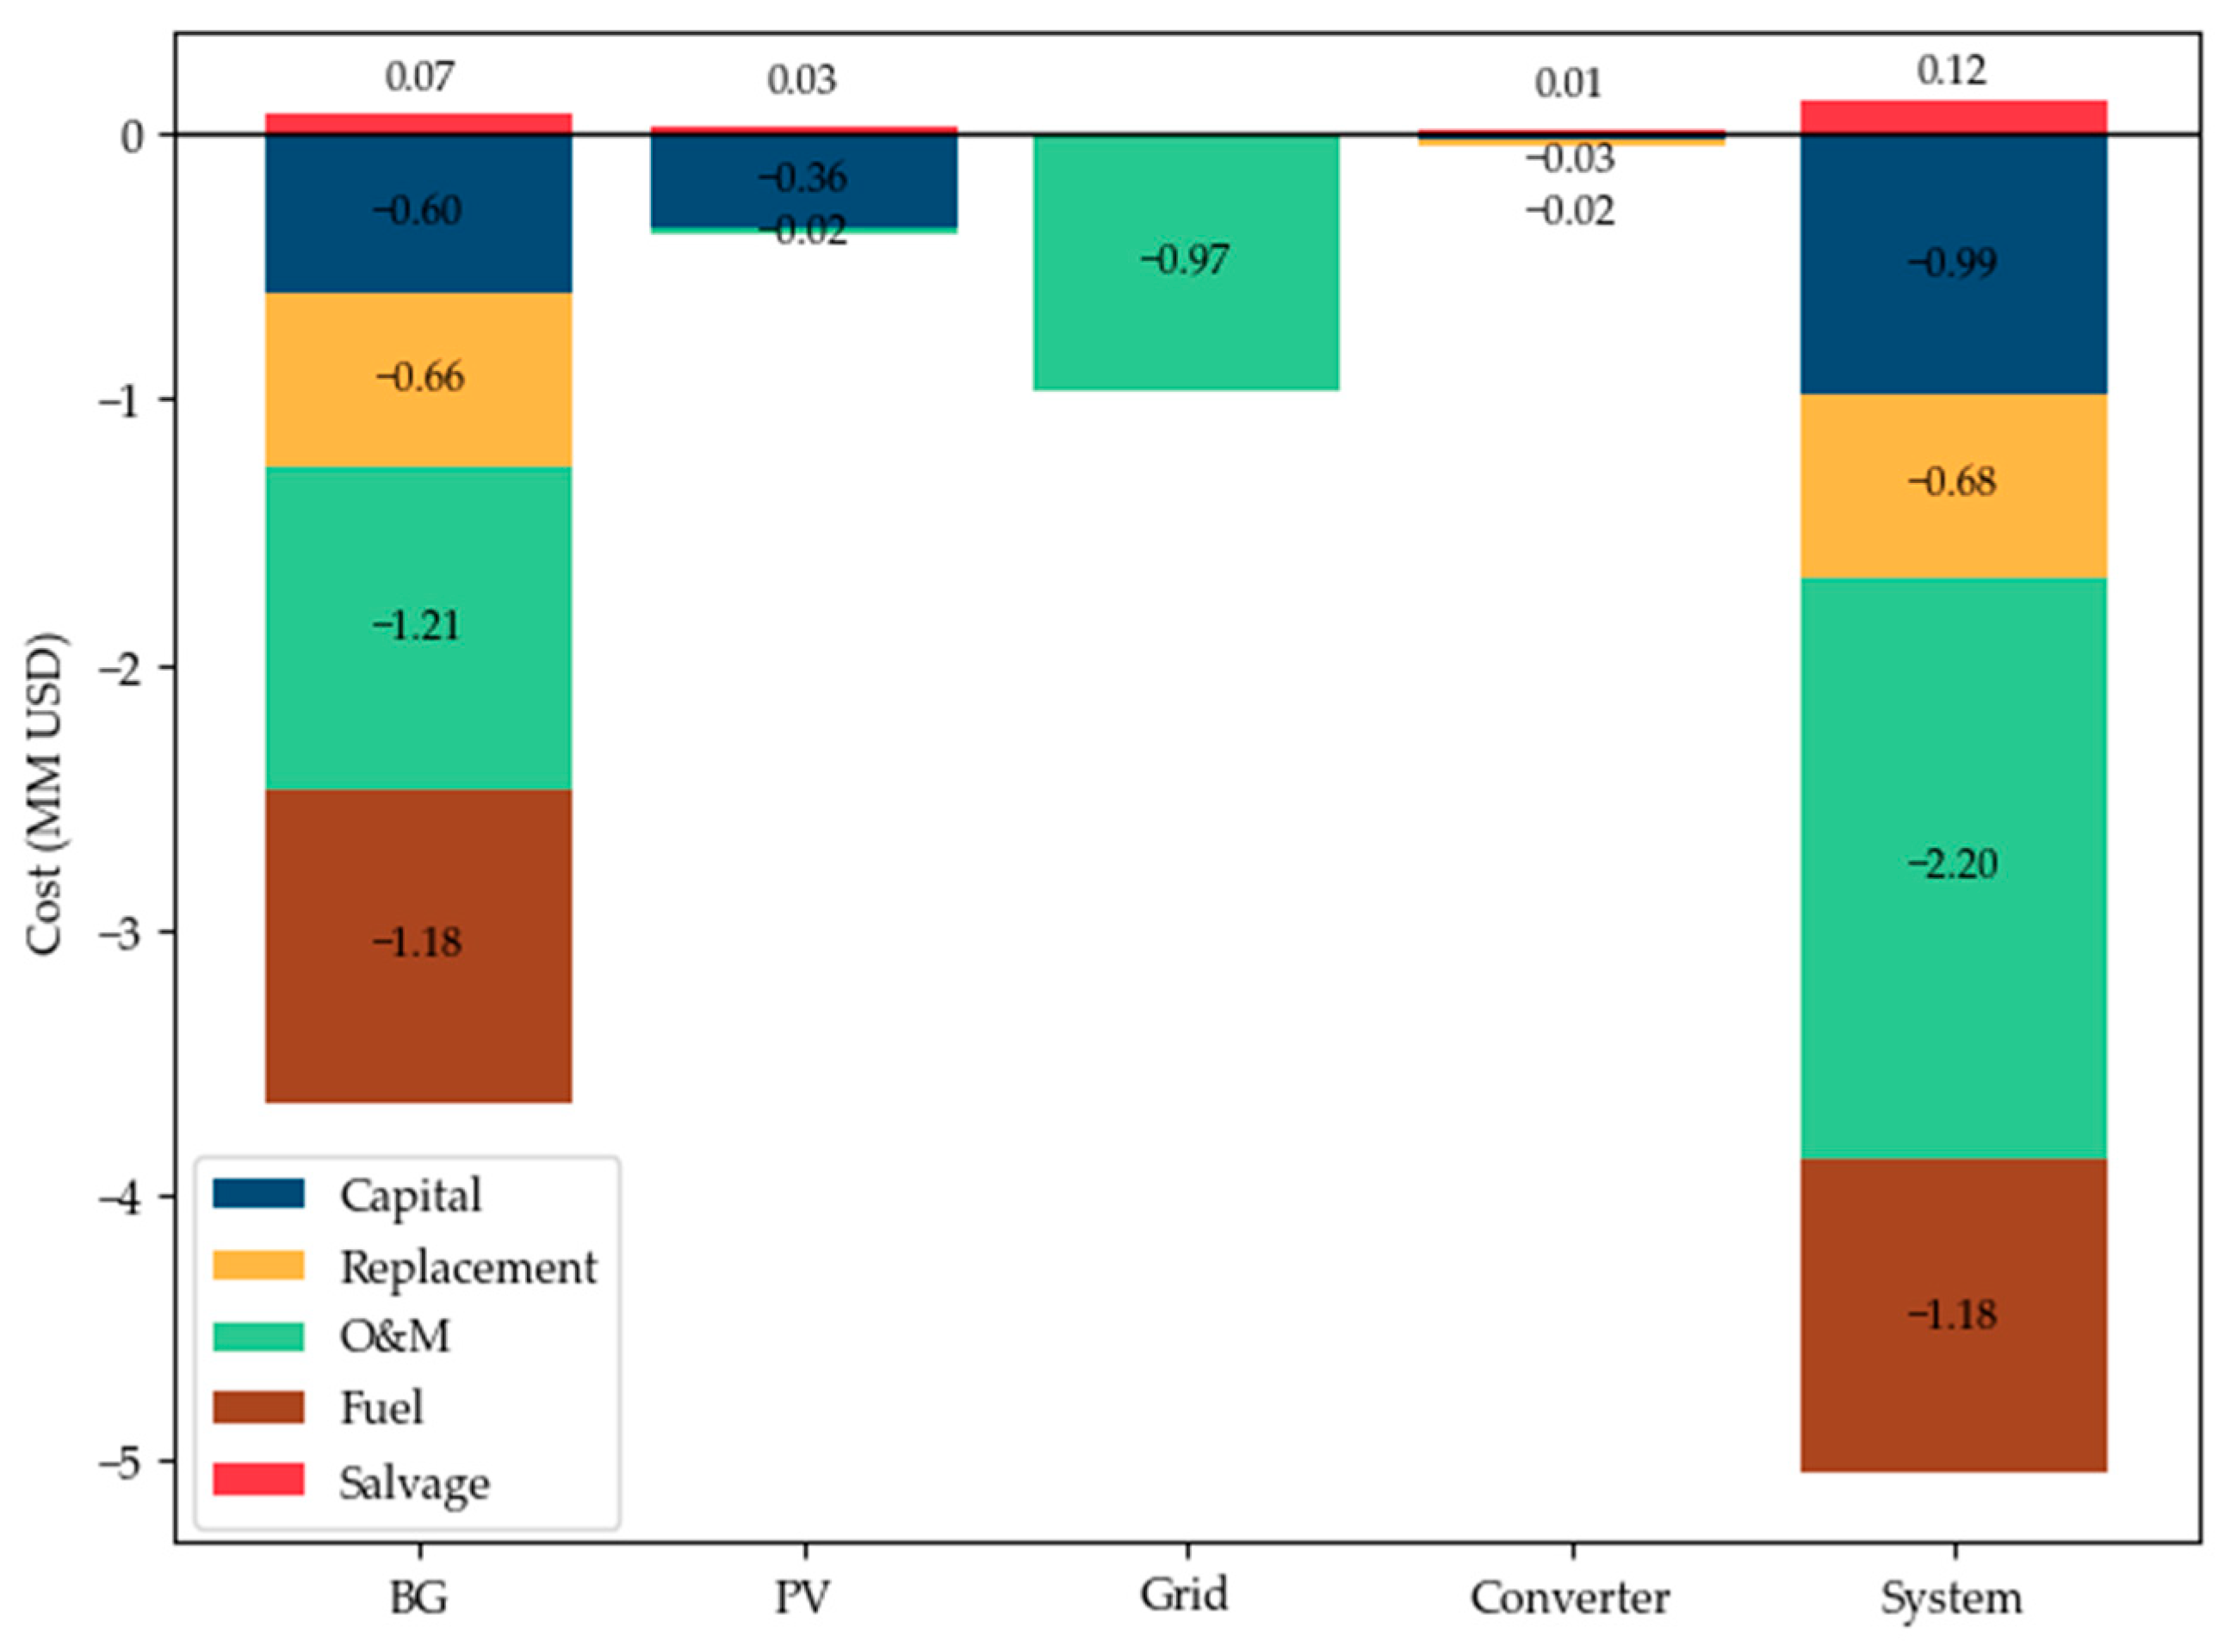
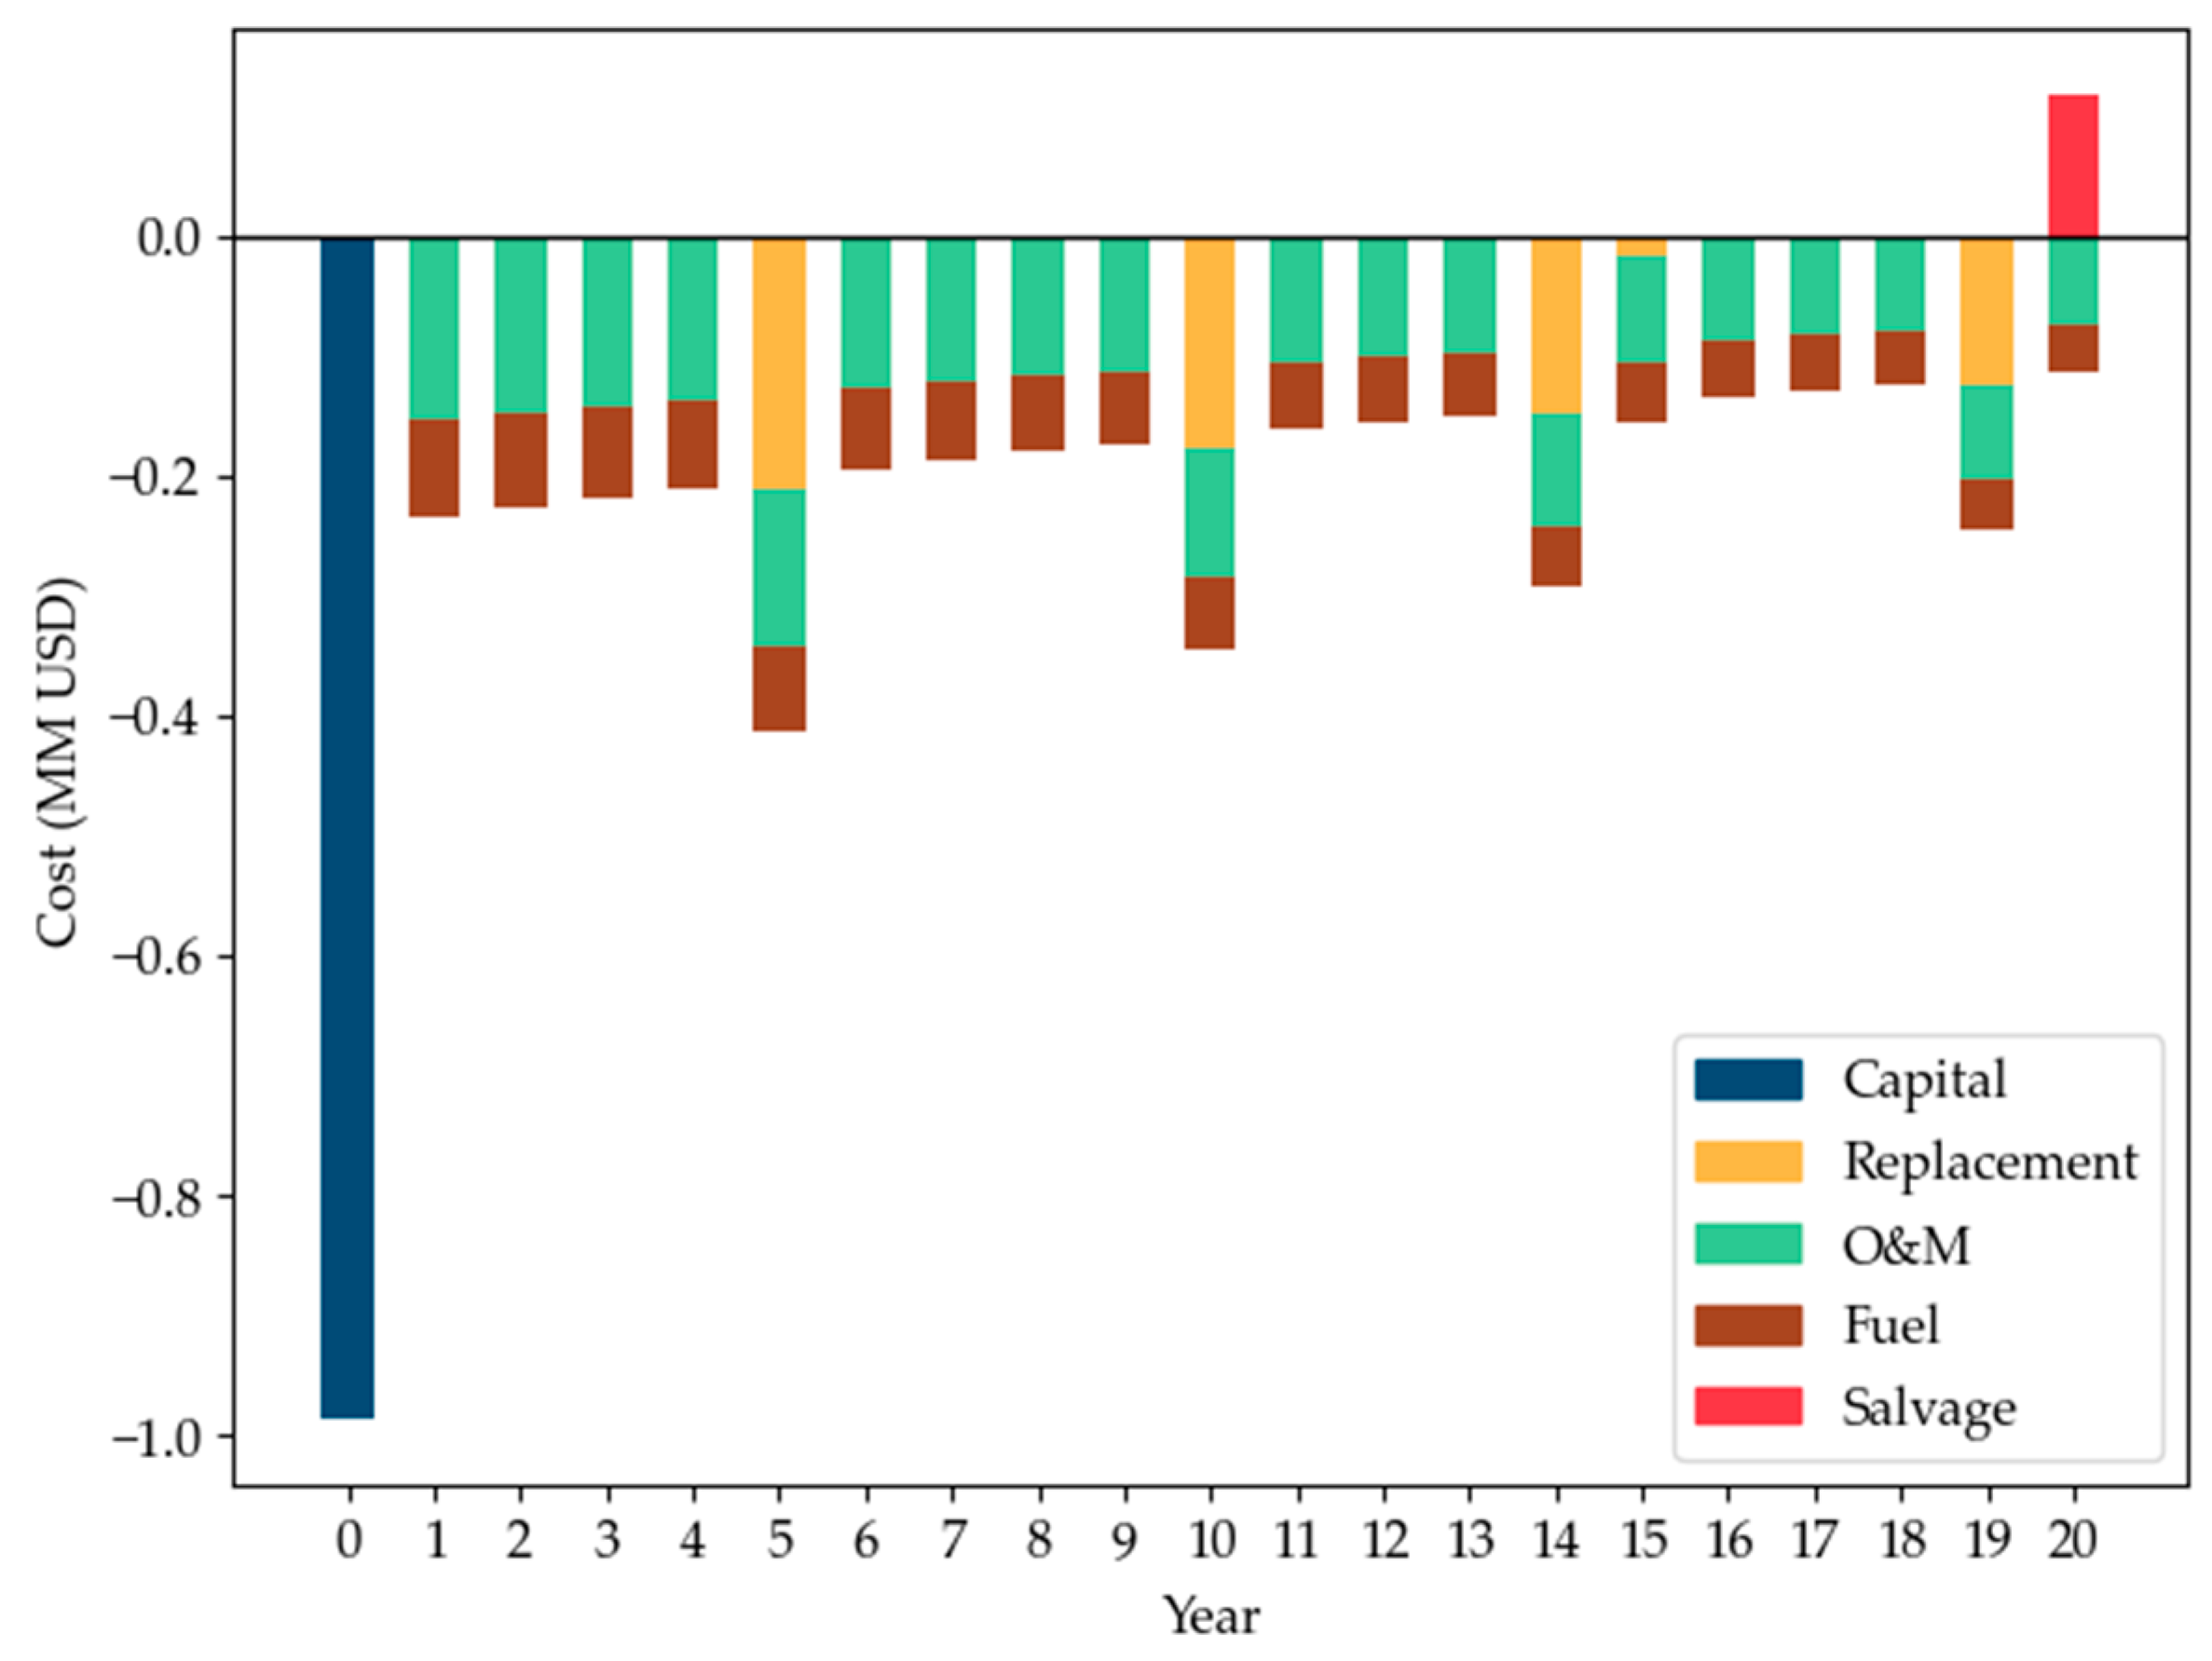
If the discounted cash flow based on the cost type is analyzed as presented in
Figure 14, it becomes evident that the project initially incurs a high capital investment. Over the operational years, O&M costs for the BG remain significant due to its relatively high operating hours, alongside grid electricity expenses, which also contribute notably. Additionally, fuel costs for biomass consumption in BG become increasingly visible throughout the project’s lifetime. Furthermore, the chart shows that the BG system requires replacement four times during the analysis period, marking key investment points. The converter was also replaced once, but its cost was relatively minor compared to other expenditures.
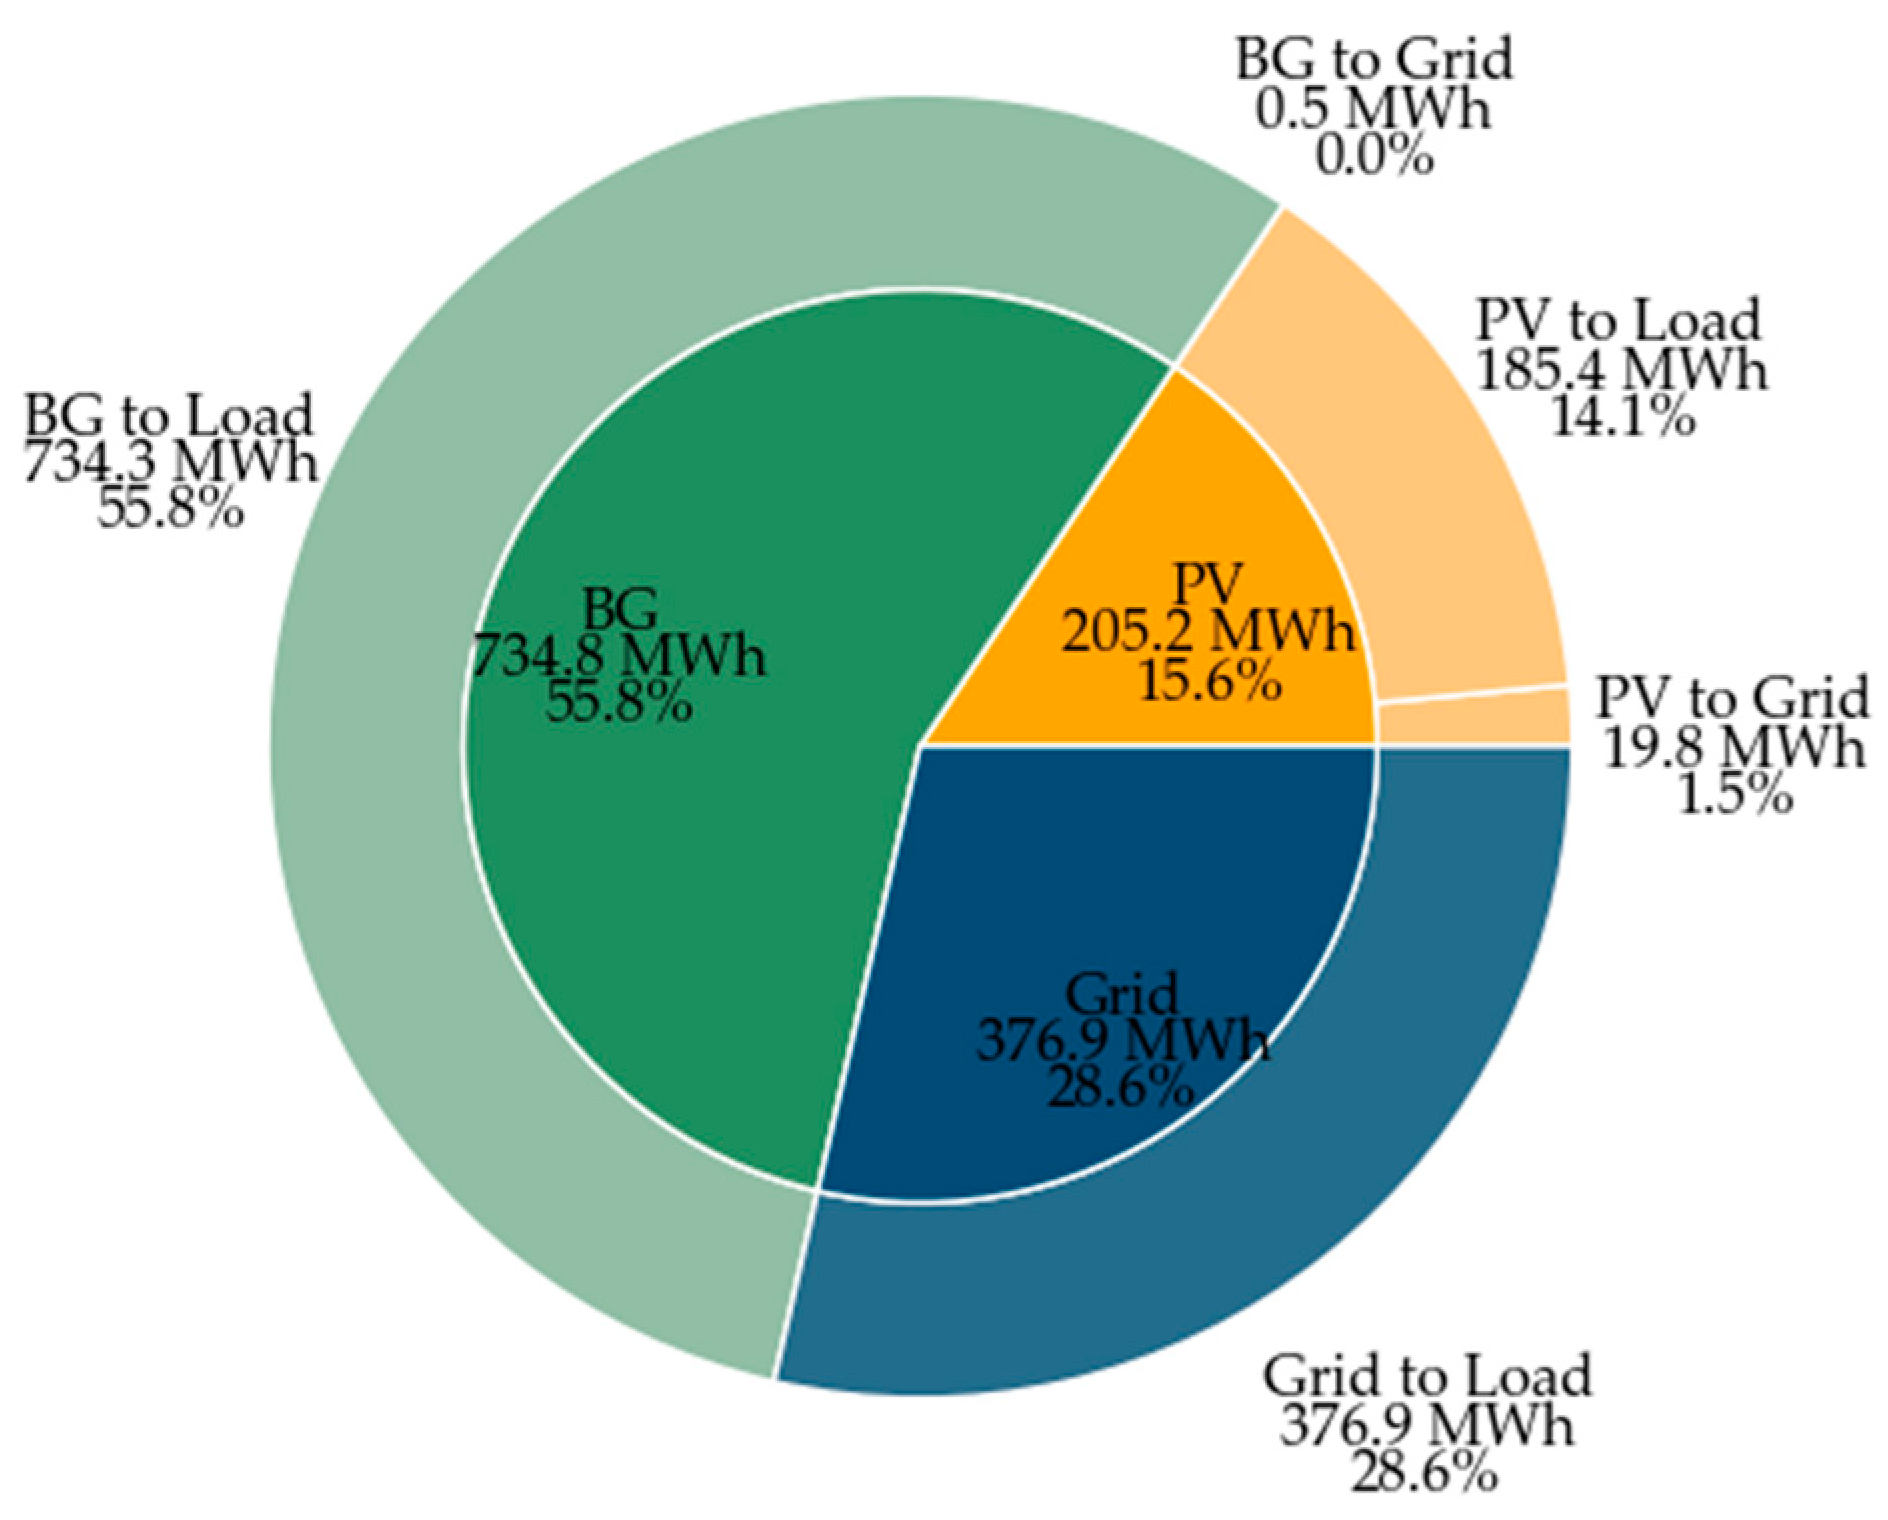
Figure 15 illustrates the distribution of energy supply and consumption for Scenario II. The inner ring shows BG supplying 734.8 MWh (55.8%), PV providing 205.2 MWh (15.6%), and the grid contributing 376.9 MWh (28.6%). The outer ring further breaks down how this energy is utilized: BG primarily supplies the load (734.3 MWh, 55.8%), with only a negligible export of 0.5 MWh to the grid. PV energy is mainly consumed on-site (185.4 MWh, 14.1%), while 19.8 MWh (1.5%) is sold back to the grid. By contrast, grid electricity is used for local demand (376.9 MWh, 28.6%) without exports.
This breakdown reveals the dominance of BG in meeting the system’s energy needs, ensuring reliability and continuous operation. At the same time, PV exhibits significant self-consumption, limiting the surplus sold to the grid. The grid plays an essential complementary role, covering nearly one-third of the total energy supply and balancing the system’s demand—mainly during insufficient BG or PV output.
The annual analysis of Scenario II highlights a consistent and strategic energy management approach that leverages local biomass and solar resources. The biomass input remains relatively steady—up to 400 kg/h—ensuring uninterrupted BG generation. Over the analyzed period, 2225 tons of feedstock were consumed, averaging 6.09 tons/day or about 0.254 tons/h, maintaining reliable biogas production throughout the year. BG generation typically decreases at midday when solar generation is at its peak, while BG output increases (up to 200 kW) during morning, evening, and nighttime. This approach ensures continuous power availability without unnecessary excess generation during peak solar periods. Meanwhile, PV generation reaches its maximum output (up to 125 kW) at midday, especially in summer, effectively meeting daytime loads.
Excess PV generation usually occurs around midday in summer, allowing surplus electricity (up to 60 kW) to be sold back to the grid and generating marginal revenue. However, during nighttime and periods of low renewable availability, the system relies on purchased grid power, reaching up to 250 kW and indicating dependence on external sources under less favorable conditions. This coordinated operational strategy balances biogas and PV contributions alongside grid interactions, ensuring year-round cost-effectiveness, system reliability, and operational stability.
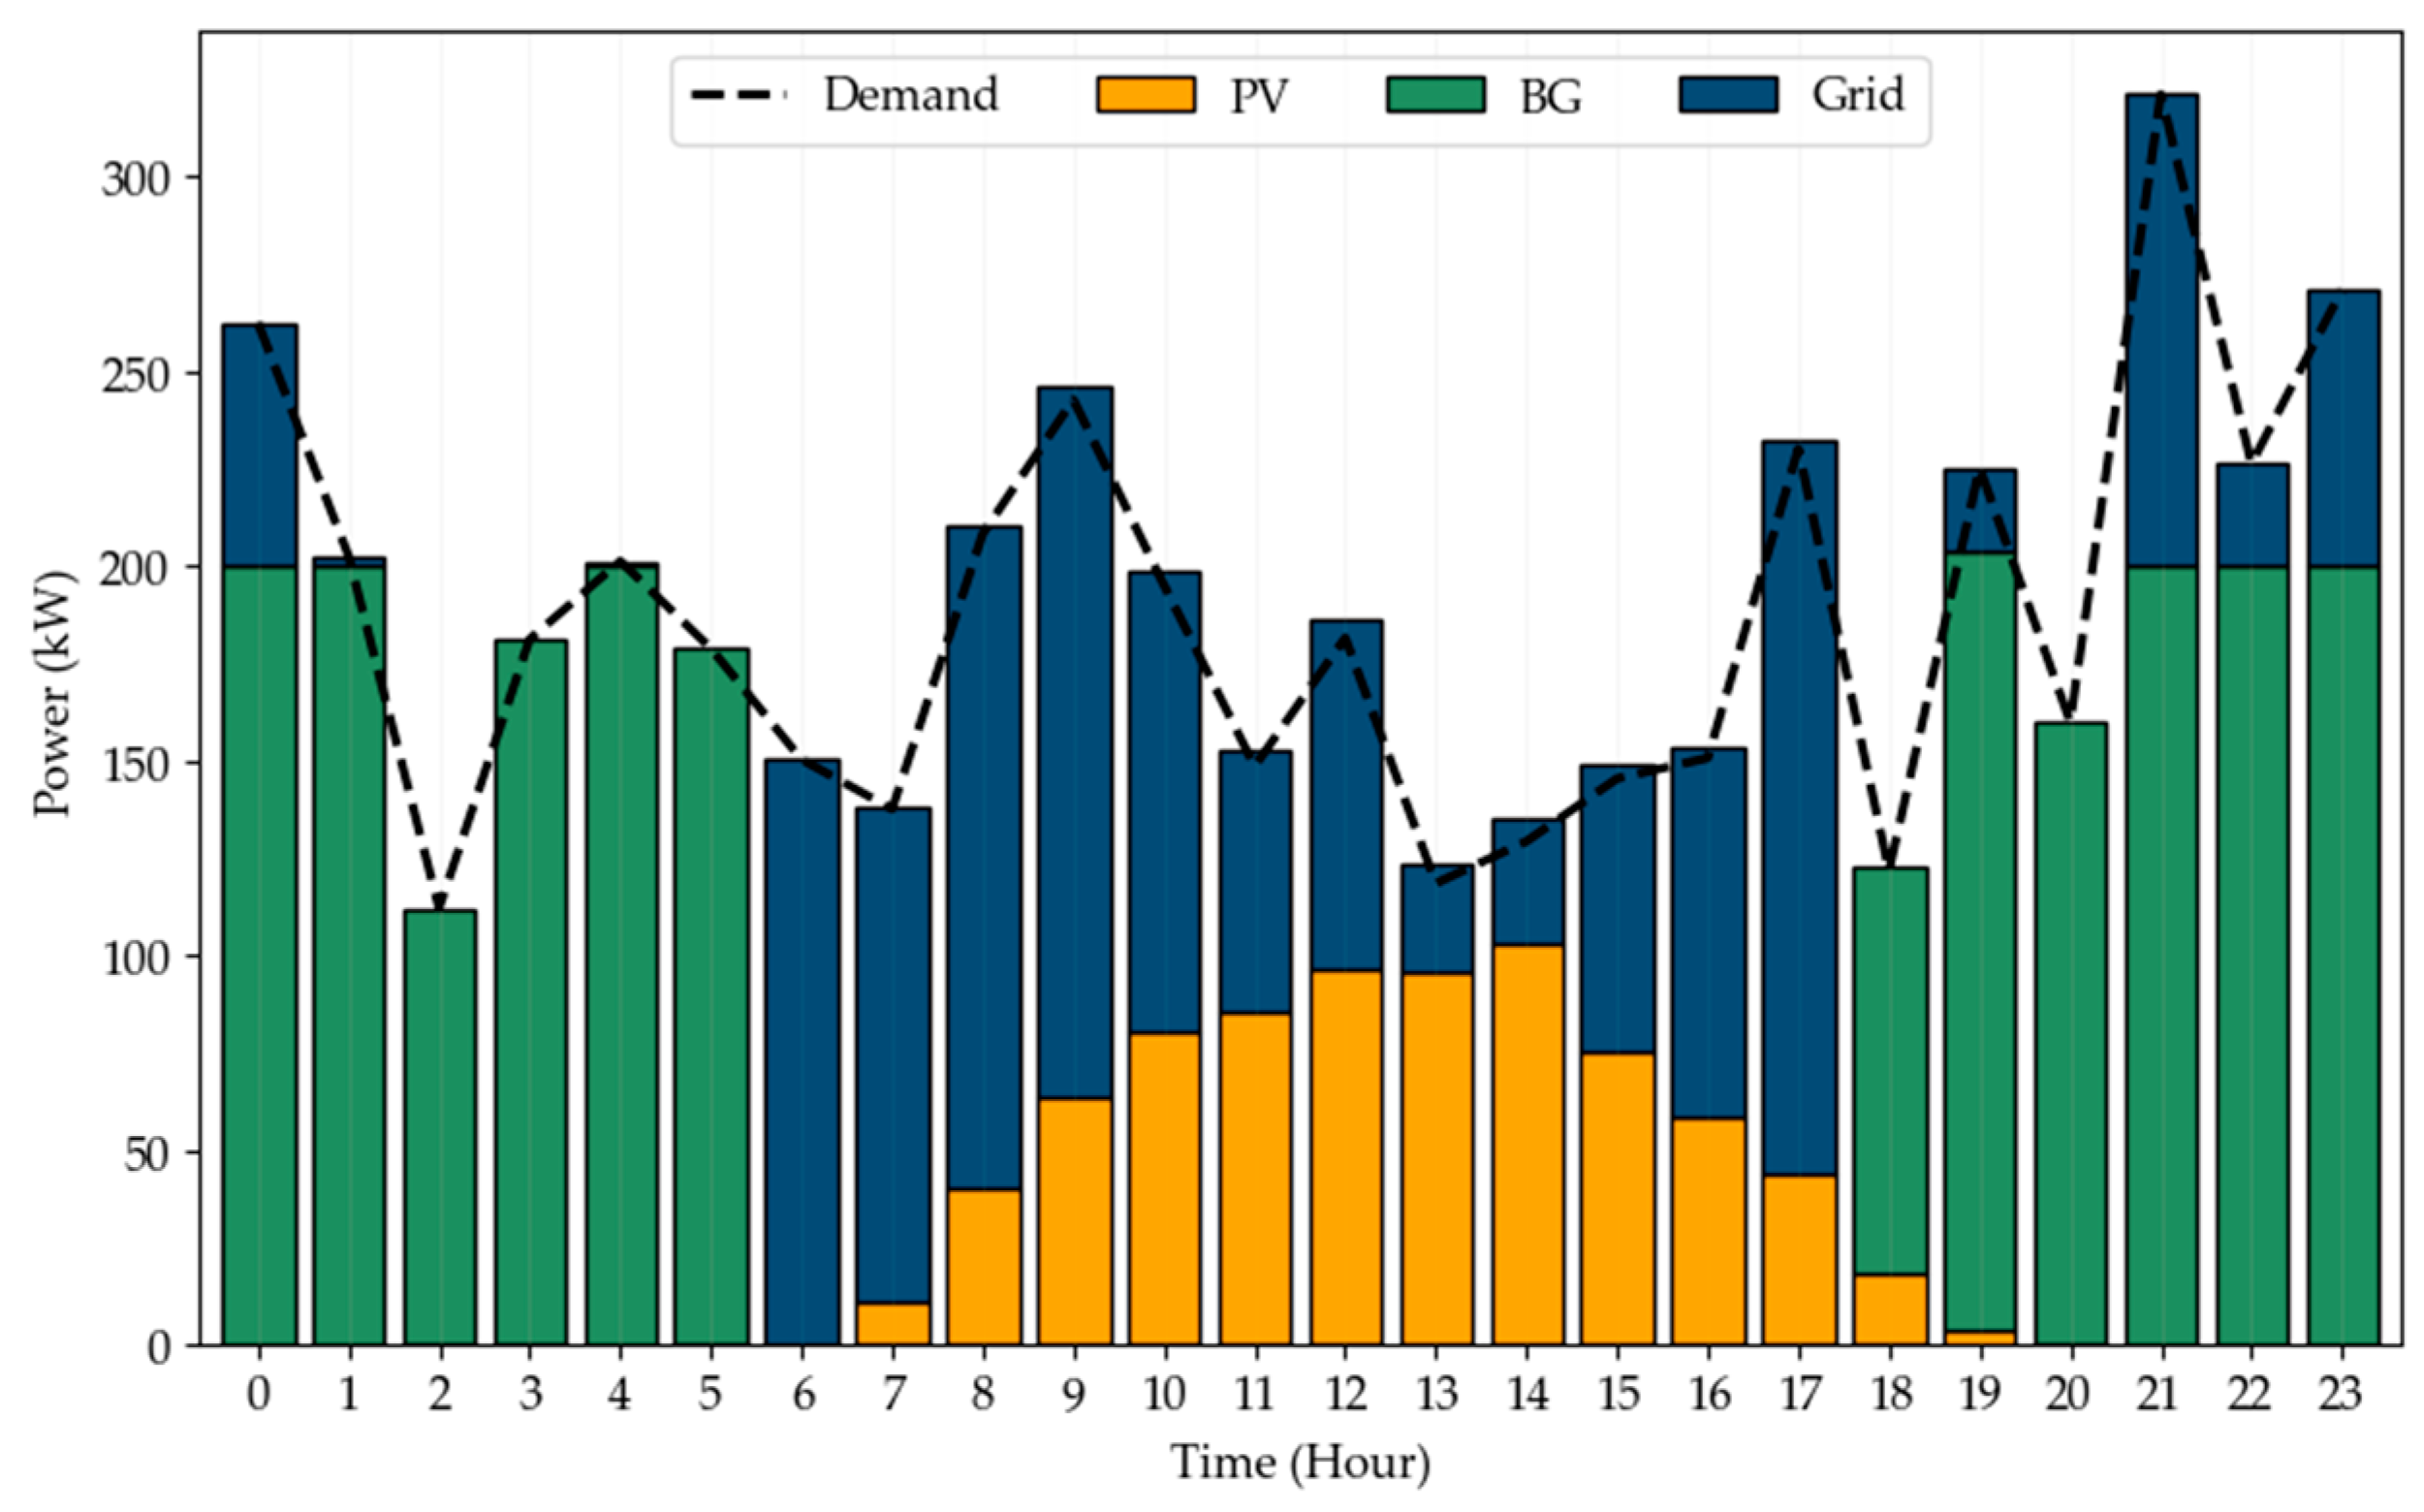
Figure 16 shows the power distribution of the Proposed System on August 15th in Scenario II, highlighting the contributions of BG, PV, and grid energy to meet the load demand. BG provides a consistent supply throughout the night, covering a substantial portion of the demand. PV output peaks during midday, reflecting the availability of sunlight, and it drops to zero at night. The grid supplements the system during high demand or low renewable generation periods, ensuring reliability. Occasionally, surplus energy, primarily from PV during midday, is sold back to the grid, although this did not occur on this day. This dynamic balance demonstrates the system’s ability to integrate renewable energy while maintaining reliability and economic efficiency.
Table 4 highlights the environmental benefits of the Proposed System by showcasing significant reductions in key emissions compared to the Base System. The most notable improvements are observed in sulfur dioxide and nitrogen oxides, major contributors to acid rain, smog formation, and respiratory illnesses. These reductions indicate a cleaner combustion process and a shift toward more efficient energy utilization. Additionally, the substantial decrease in carbon dioxide emissions demonstrates a lower reliance on fossil fuels, reinforcing the system’s contribution to mitigating climate change and reducing its carbon footprint.
While carbon monoxide levels remain nearly unchanged, the reductions in other pollutants highlight the Proposed System’s effectiveness in minimizing harmful environmental impacts. Beyond ecological benefits, these improvements enhance air quality, support regulatory compliance, and may lead to economic advantages such as reduced carbon taxation and improved public health outcomes. The system’s ability to lower emissions while maintaining energy efficiency underscores its role in fostering a more sustainable and cost-effective energy solution. It should be noted that achieving substantial greenhouse gas emission reductions through biogas utilization depends strongly on minimizing methane leakage and ensuring efficient combustion processes.
4. Discussion
This study set out to identify and analyze HES configurations capable of enhancing reliability and economic feasibility in a rural community with existing grid constraints. Technical and economic outcomes were evaluated by integrating PV, a BG fueled by livestock waste, and BES alongside the main grid. A special focus was on leveraging local resources—particularly biomass—to reduce greenhouse gas emissions, promote rural development, and strengthen energy independence.
Two primary scenarios were investigated. Scenario I involved a minimal capital investment strategy featuring PV and the main grid. This configuration achieved an NPC of approximately USD 3.27 M, yielding about USD 90,000 in cost savings compared to the baseline setup. PV contributed 16% of the total energy supply, reducing operational expenses while relying on the grid for peak loads and backup. In contrast, Scenario II introduced a biogas generator fueled by livestock waste, PV, and grid connectivity. Although its overall costs rose by USD 1.66 M, the BG supplied 55.8% of the total energy demand, reducing grid dependence to 28.6%—a 55.5% drop relative to Scenario I—and cutting key emissions by roughly 30%.
These results can be explained by the specific design choices and resource characteristics in each scenario. PV requires no ongoing fuel costs once installed, providing electricity at relatively stable long-term prices. Even modest PV capacity offsets grid consumption and lowers operational expenses, particularly when site-specific solar irradiance data and HOMER’s optimization algorithms are used to size the system effectively. Meanwhile, the BG utilizes locally available livestock waste, offering a steady fuel source that does not depend on seasonal variation. BG significantly reduces emissions and improves resilience by displacing a portion of the grid supply—often generated by fossil fuels. Although this approach demands higher capital and infrastructure costs, it provides greater energy independence, fewer power disruptions, and better long-term sustainability.
Grid connectivity remains essential to both scenarios, ensuring reliable backup during peak demand or low solar output periods. In Scenario II, the share of grid-supplied electricity drops to 28.6%. However, the grid still allows for surplus export—albeit limited by modest extra generation and low incentives—and prevents supply shortfalls should the BG or PV fail to meet sudden spikes in demand. The balanced interplay of renewable inputs (PV and BG), supported by the grid, ensures a robust and flexible power system that adapts to seasonal variations and load fluctuations. Scenario I proves more cost-effective through solar self-consumption. In contrast, Scenario II offers improved reliability and significantly lower emissions, reflecting the inevitable trade-off between economic feasibility and energy security.
Compared to the existing literature, LCOE ranging from 0.18 to 0.28 USD/kWh aligns with reported values for PV–grid hybrids in rural areas. Studies on biomass-based microgrids confirm similar trends of improved dispatchability, reduced reliance on external energy markets, and notable emissions cuts [
49,
50]. The roughly 30% decline in carbon dioxide, sulfur dioxide, and nitrogen oxides aligns with research [
51] showing a 25–40% drop when bioenergy displaces conventional fuel sources. While the overall NPC may vary due to factors like feedstock availability, policy incentives, and system scale, the overarching conclusion remains that hybrid renewable solutions consistently address cost, reliability, and environmental challenges, as demonstrated by multiple case studies.
It is important to note that the environmental impacts presented in this study consider only direct emissions from combustion processes. However, a comprehensive environmental evaluation of biomass utilization would require a full Life Cycle Assessment, including emissions associated with feedstock production, transport, conversion processes, and disposal or reuse of by-products. Although such a complete analysis was beyond this study’s scope, several previous studies [
52,
53,
54] provide detailed assessments of the life cycle emissions of biomass-based energy systems. Future research should integrate comprehensive environmental assessment approaches to obtain a more accurate and holistic understanding of biomass energy’s ecological sustainability.
The practical implications of these findings are considerable. Local governments and policymakers could use these insights to introduce supportive policies—such as feed-in tariffs or biomass incentives—that encourage renewable energy adoption and reduce grid vulnerabilities. Embracing local biomass and PV can lower operational costs at the community level. It also creates new job opportunities in feedstock supply and system maintenance. Furthermore, this approach fosters greater energy autonomy. Dispatchable biomass power adds flexibility and backup capacity to rural grids, protecting agriculture-dependent areas from the effects of grid outages or fossil fuel price volatility. Moreover, the modeling approach using HOMER is readily transferable to other rural and semi-remote contexts, facilitating the design of tailored hybrid microgrids that harness local resources, address site-specific conditions, and enable more sustainable regional development.
In addition to socioeconomic benefits, this study underscores hybrid systems’ environmental and social advantages. Scenario II’s biogas component reduces reliance on fossil fuels, lowering greenhouse gas emissions and mitigating air pollutants like sulfur dioxide and nitrogen oxides. Livestock waste is efficiently reused rather than left unmanaged, reducing methane emissions and promoting a circular economy. It should be noted that the environmental benefits of biogas depend critically on preventing methane leakage and managing emissions effectively. Cleaner air quality can improve public health outcomes, reducing respiratory illnesses and healthcare costs. Furthermore, involving local stakeholders in planning and operation promotes a sense of ownership, enhancing social acceptance and making it easier to implement and expand similar projects. Hybrid systems encourage responsible environmental stewardship and long-term sustainability by redefining resource flows and adding value to agricultural byproducts.
Despite these encouraging results, several limitations must be considered. The study relies on simplified demand profiles and average resource data, which might overlook short-term load fluctuations or seasonal patterns. Technical assumptions regarding generator efficiency and battery degradation may not fully replicate real-world conditions. At the same time, external factors—such as fluctuating biomass prices, solar equipment costs, or policy shifts—can alter long-term economic viability. Moreover, the outcomes are site-specific: the availability of livestock waste, geographical conditions, and regulatory environments all influence feasibility. Expanding or replicating this design in other locations will require additional feasibility assessments tailored to each site’s unique constraints.
The economic outcomes presented in this study depend significantly on assumptions made for critical variables such as discount rates and system component costs. Variations in the discount rate can markedly influence NPC and LCOE, potentially altering conclusions regarding scenario preferences. Similarly, fluctuations in component costs—particularly for PV modules, biogas generators, battery storage systems, and biomass feedstock—can affect the system’s overall economic attractiveness. Given these sensitivities, caution is required when interpreting and generalizing results based on single-value analyses. Future studies should incorporate detailed sensitivity or uncertainty analyses, such as Monte Carlo simulations, to capture these variabilities comprehensively and provide more robust decision-making guidance.
Future improvements could include exploring advanced storage solutions, such as lithium–iron–phosphate or flow batteries, to enhance load leveling, system flexibility, and thermal storage for combined heat and power (CHP) applications. Demand-side management strategies like load shifting and energy efficiency upgrades could reduce overall consumption and align demand with periods of high renewable generation. Integrating wind or micro-hydro resources could diversify the power mix if geographically viable. High-resolution monitoring and AI-driven forecasting would allow real-time generator dispatch and battery scheduling optimization. On the modeling side, sensitivity analyses and hybrid approaches that combine HOMER with other specialized tools (e.g., life-cycle assessment) would yield a fuller understanding of technical, economic, and environmental trade-offs. Additionally, expanding to a community or regional scale could facilitate resource-sharing networks, achieving higher economies of scale and stimulating local investment.
It is important to note that the present analysis assumes fixed economic parameters, such as discount rates, component costs, and biomass feedstock prices. Given that variations in these parameters may significantly impact economic feasibility and decision-making outcomes, future research is strongly recommended to perform sensitivity analyses or uncertainty modeling (e.g., using Monte Carlo simulations) to better quantify and manage these uncertainties, thereby enhancing the robustness and practical applicability of hybrid renewable energy system evaluations.
Ultimately, this study achieves its initial objective by demonstrating how the proposed HES can address cost concerns, enhance reliability, and reduce emissions in rural or semi-remote areas. Scenario I reveals a cost-effective pathway through PV self-consumption, whereas Scenario II provides stronger energy independence and environmental gains. These outcomes confirm that tailoring system architectures to local resources and conditions effectively bridges the gap between existing infrastructure limits and sustainable energy requirements. Hybrid microgrids can be scaled into powerful tools for addressing global energy challenges, reducing fossil fuel dependence, and promoting equitable socio-economic development by incorporating improvements in storage, demand-side management, and policy frameworks.
5. Conclusions
This study demonstrates the critical role that HESs can play in rural communities by simultaneously enhancing reliability, economic performance, and environmental sustainability. Focusing on the semi-remote area of Aras de los Olmos in Spain—where frequent power outages persist despite grid connectivity—this work evaluates two scenarios using HOMER software to integrate renewable energy sources, biogas generation, and grid energy.
In Scenario I, the system optimization prioritized minimizing costs through solar PV (providing 16% of total electricity) and the main grid (84.1%). By strategically adding PV, the overall NPC was reduced by approximately USD 90,000 compared to the existing setup without compromising reliability. Although the grid still dominated the supply, the partial shift toward renewables lowered operational expenses and curbed fossil fuel consumption.
In Scenario II, a biogas generator fueled by locally sourced livestock waste was introduced to reduce grid dependency and boost energy autonomy. This approach yielded 55.8% of total electricity from BG, cutting grid reliance to 28.6%—a 55.5% drop relative to Scenario I. Despite incurring an additional USD 1.66 million in total costs, the scenario delivered enhanced reliability, fewer power outages, and significant social and environmental co-benefits.
Additionally, Scenario II achieved substantial emissions reductions compared to its base system, with major pollutants decreasing by about 30%, signifying cleaner combustion and reduced fossil fuel reliance. While carbon monoxide remained largely unchanged, these improvements boost air quality, support regulatory compliance, and may yield economic benefits such as lower carbon taxation and enhanced public health outcomes. Nevertheless, realizing these environmental benefits relies heavily on appropriate system management practices, as unmanaged methane emissions from biogas systems can negate emission reduction advantages.
Despite these promising results, future studies could improve HESs by addressing several aspects. Advanced energy storage technologies, such as lithium-ion or redox flow batteries, and regionally suitable pumped hydro storage systems could significantly enhance system flexibility and seasonal reliability. Furthermore, a detailed analysis of demand-side management strategies, real-time energy management systems, and consideration of input data uncertainties would strengthen the proposed solutions’ robustness and economic feasibility. Additionally, conducting a life-cycle assessment could provide deeper insights into the environmental sustainability of the proposed configurations.
These findings underscore the importance of tailored hybrid solutions—leveraging local resources such as solar irradiance and biomass—to bridge the gap between existing infrastructure limitations and a sustainable, secure energy future. Rural communities can balance upfront investments in renewables with long-term operational savings. This approach significantly mitigates reliance on conventional energy sources. Additionally, it stabilizes the power supply and supports broader economic and environmental objectives. Ultimately, this study highlights that hybrid systems, supported by careful optimization and future methodological enhancements, represent a viable and scalable approach to addressing energy challenges in rural and semi-remote regions.


 ,
, 


