
Investigation of Seepage Behavior and Settlement Deformation Mechanisms in Loess Embankment Foundation Systems in Eastern Gansu Province

Abstract
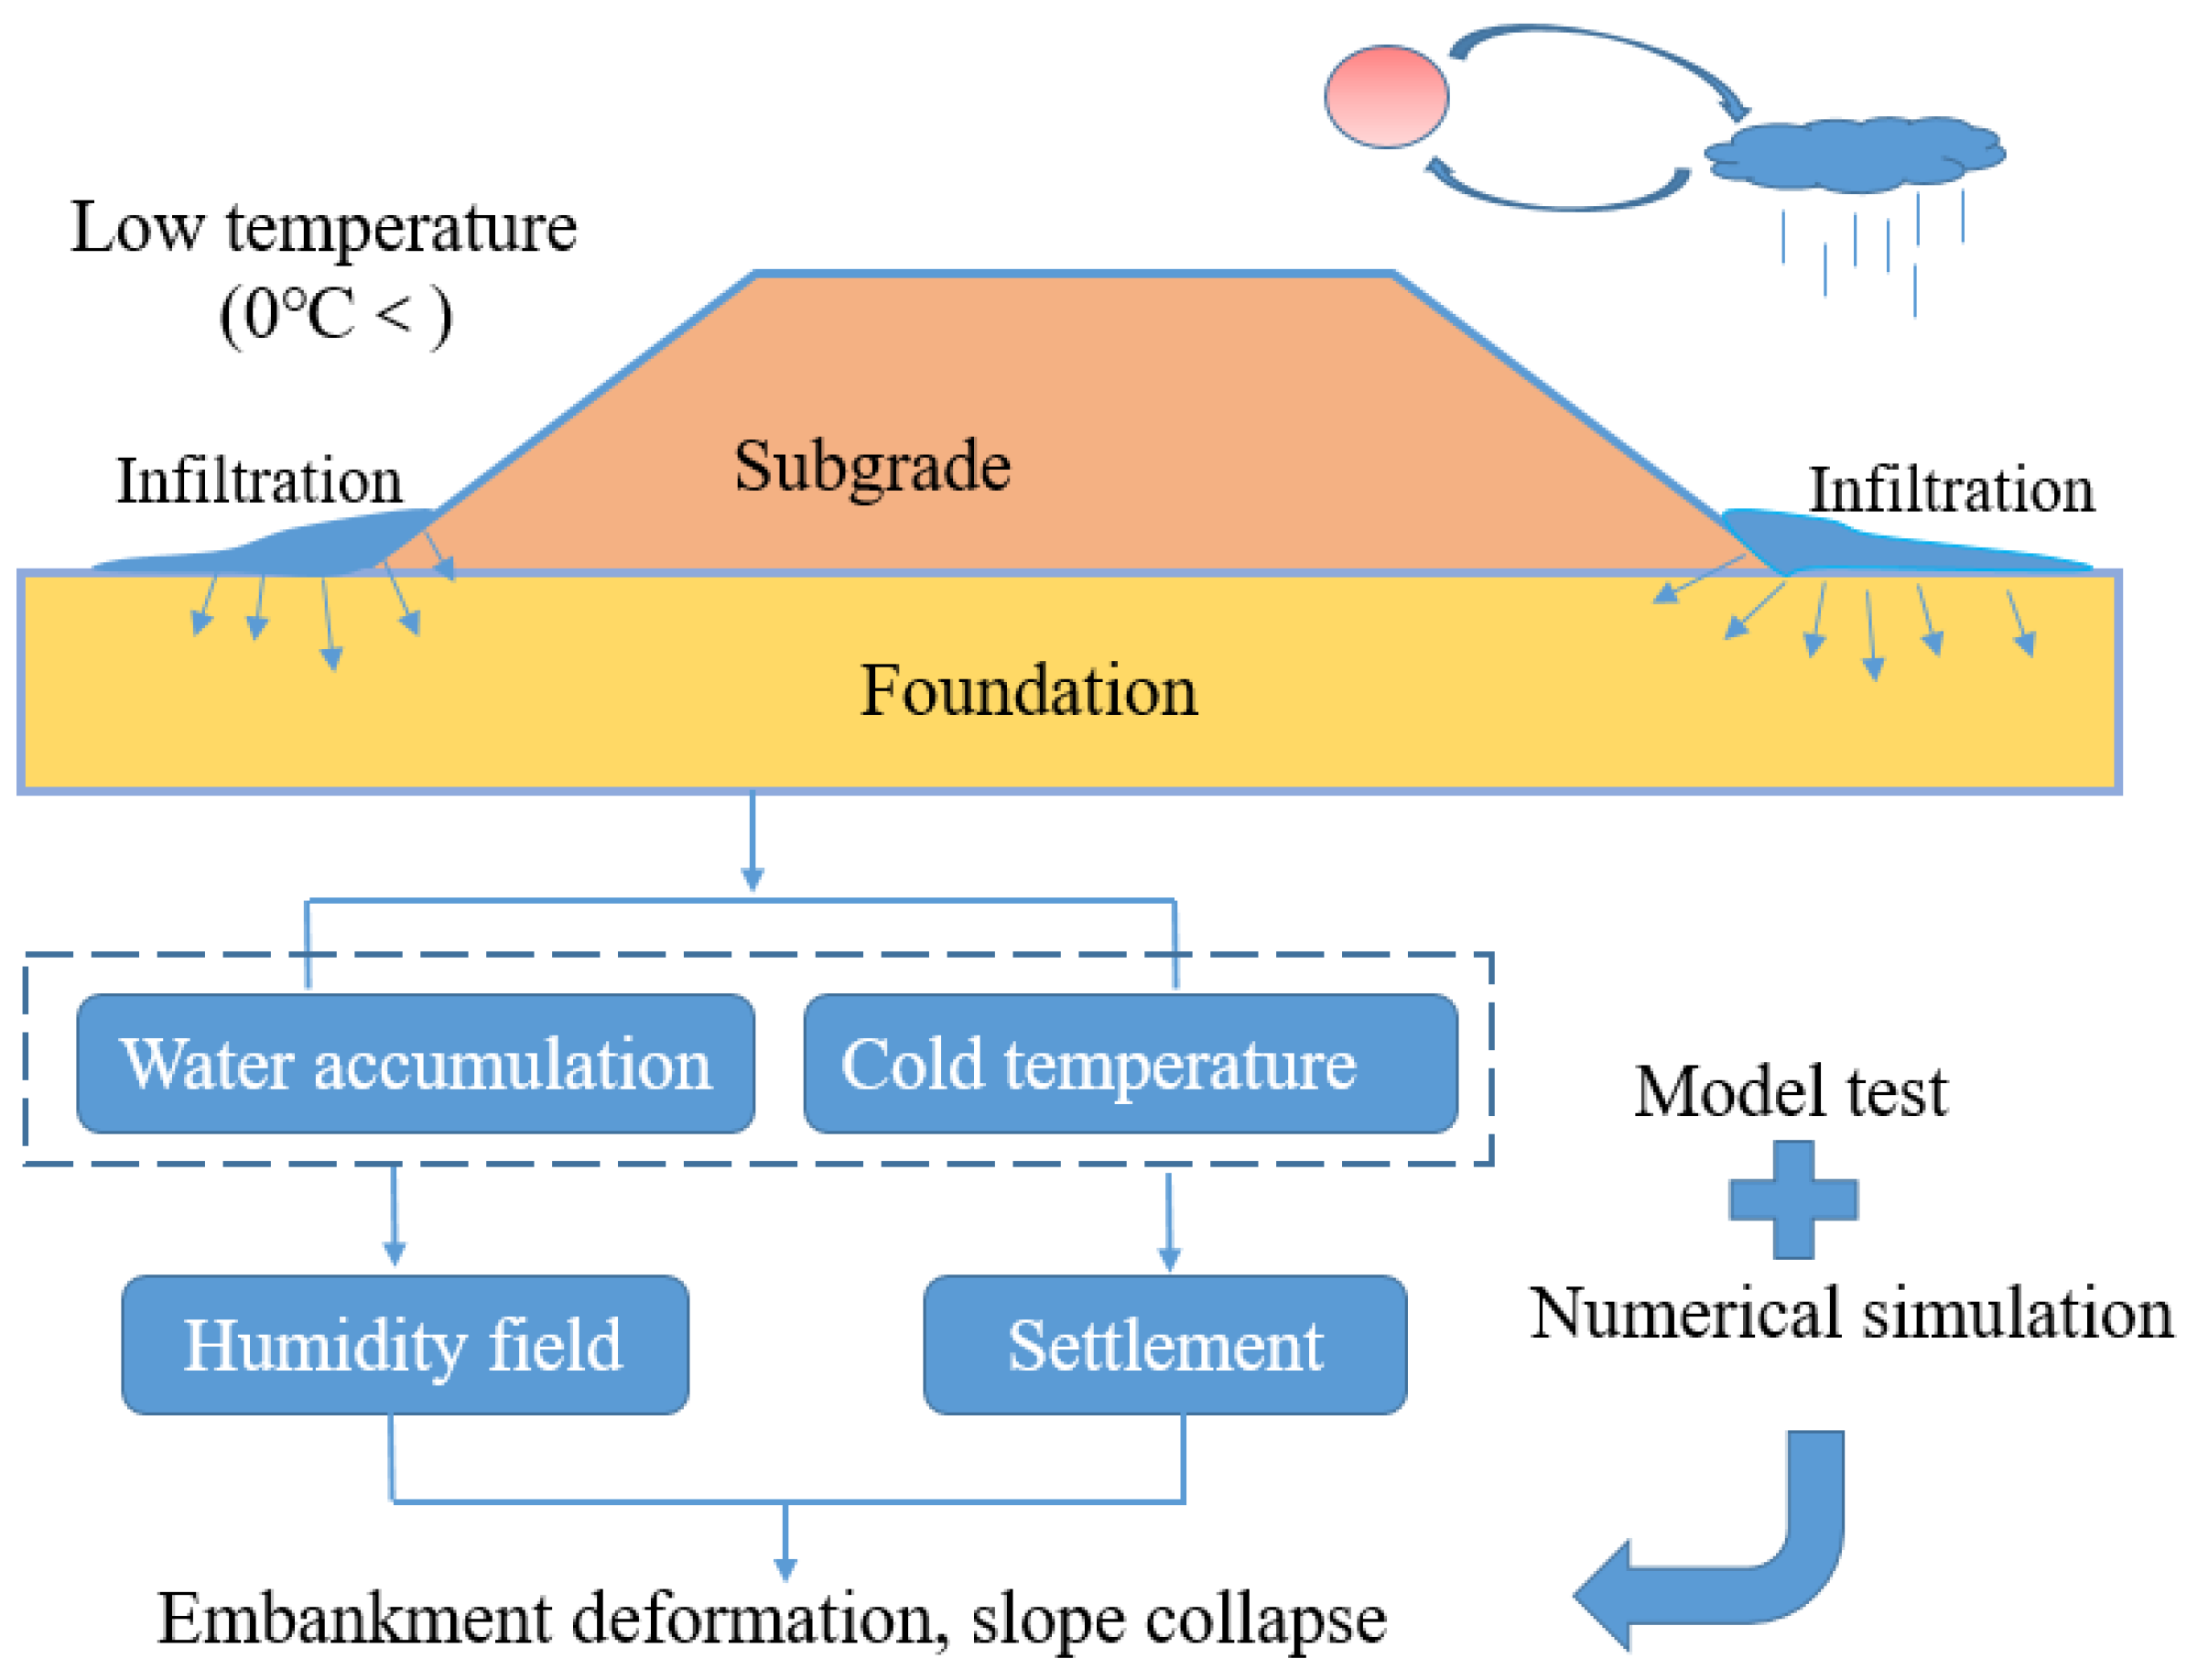
:1. Introduction
2. Test Design and Scheme
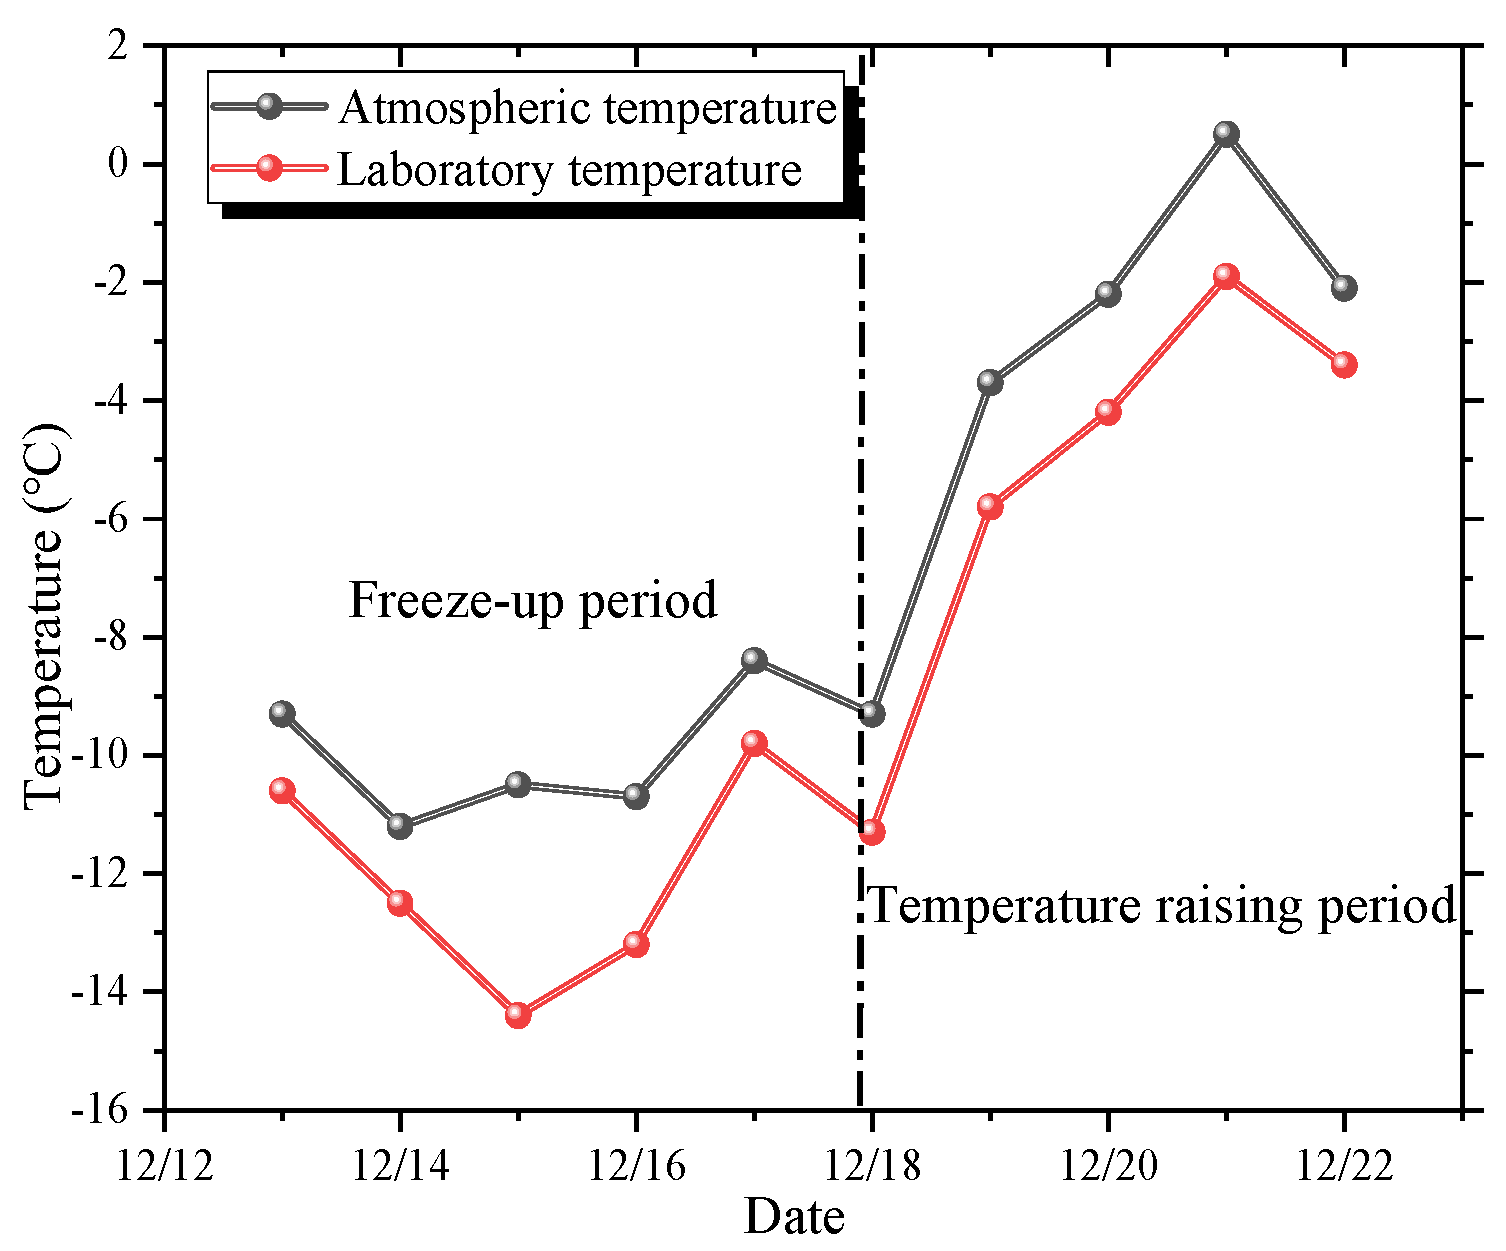
2.1. Supporting Conditions
2.2. Similarity Ratio
2.3. Test Equipment and Model Building
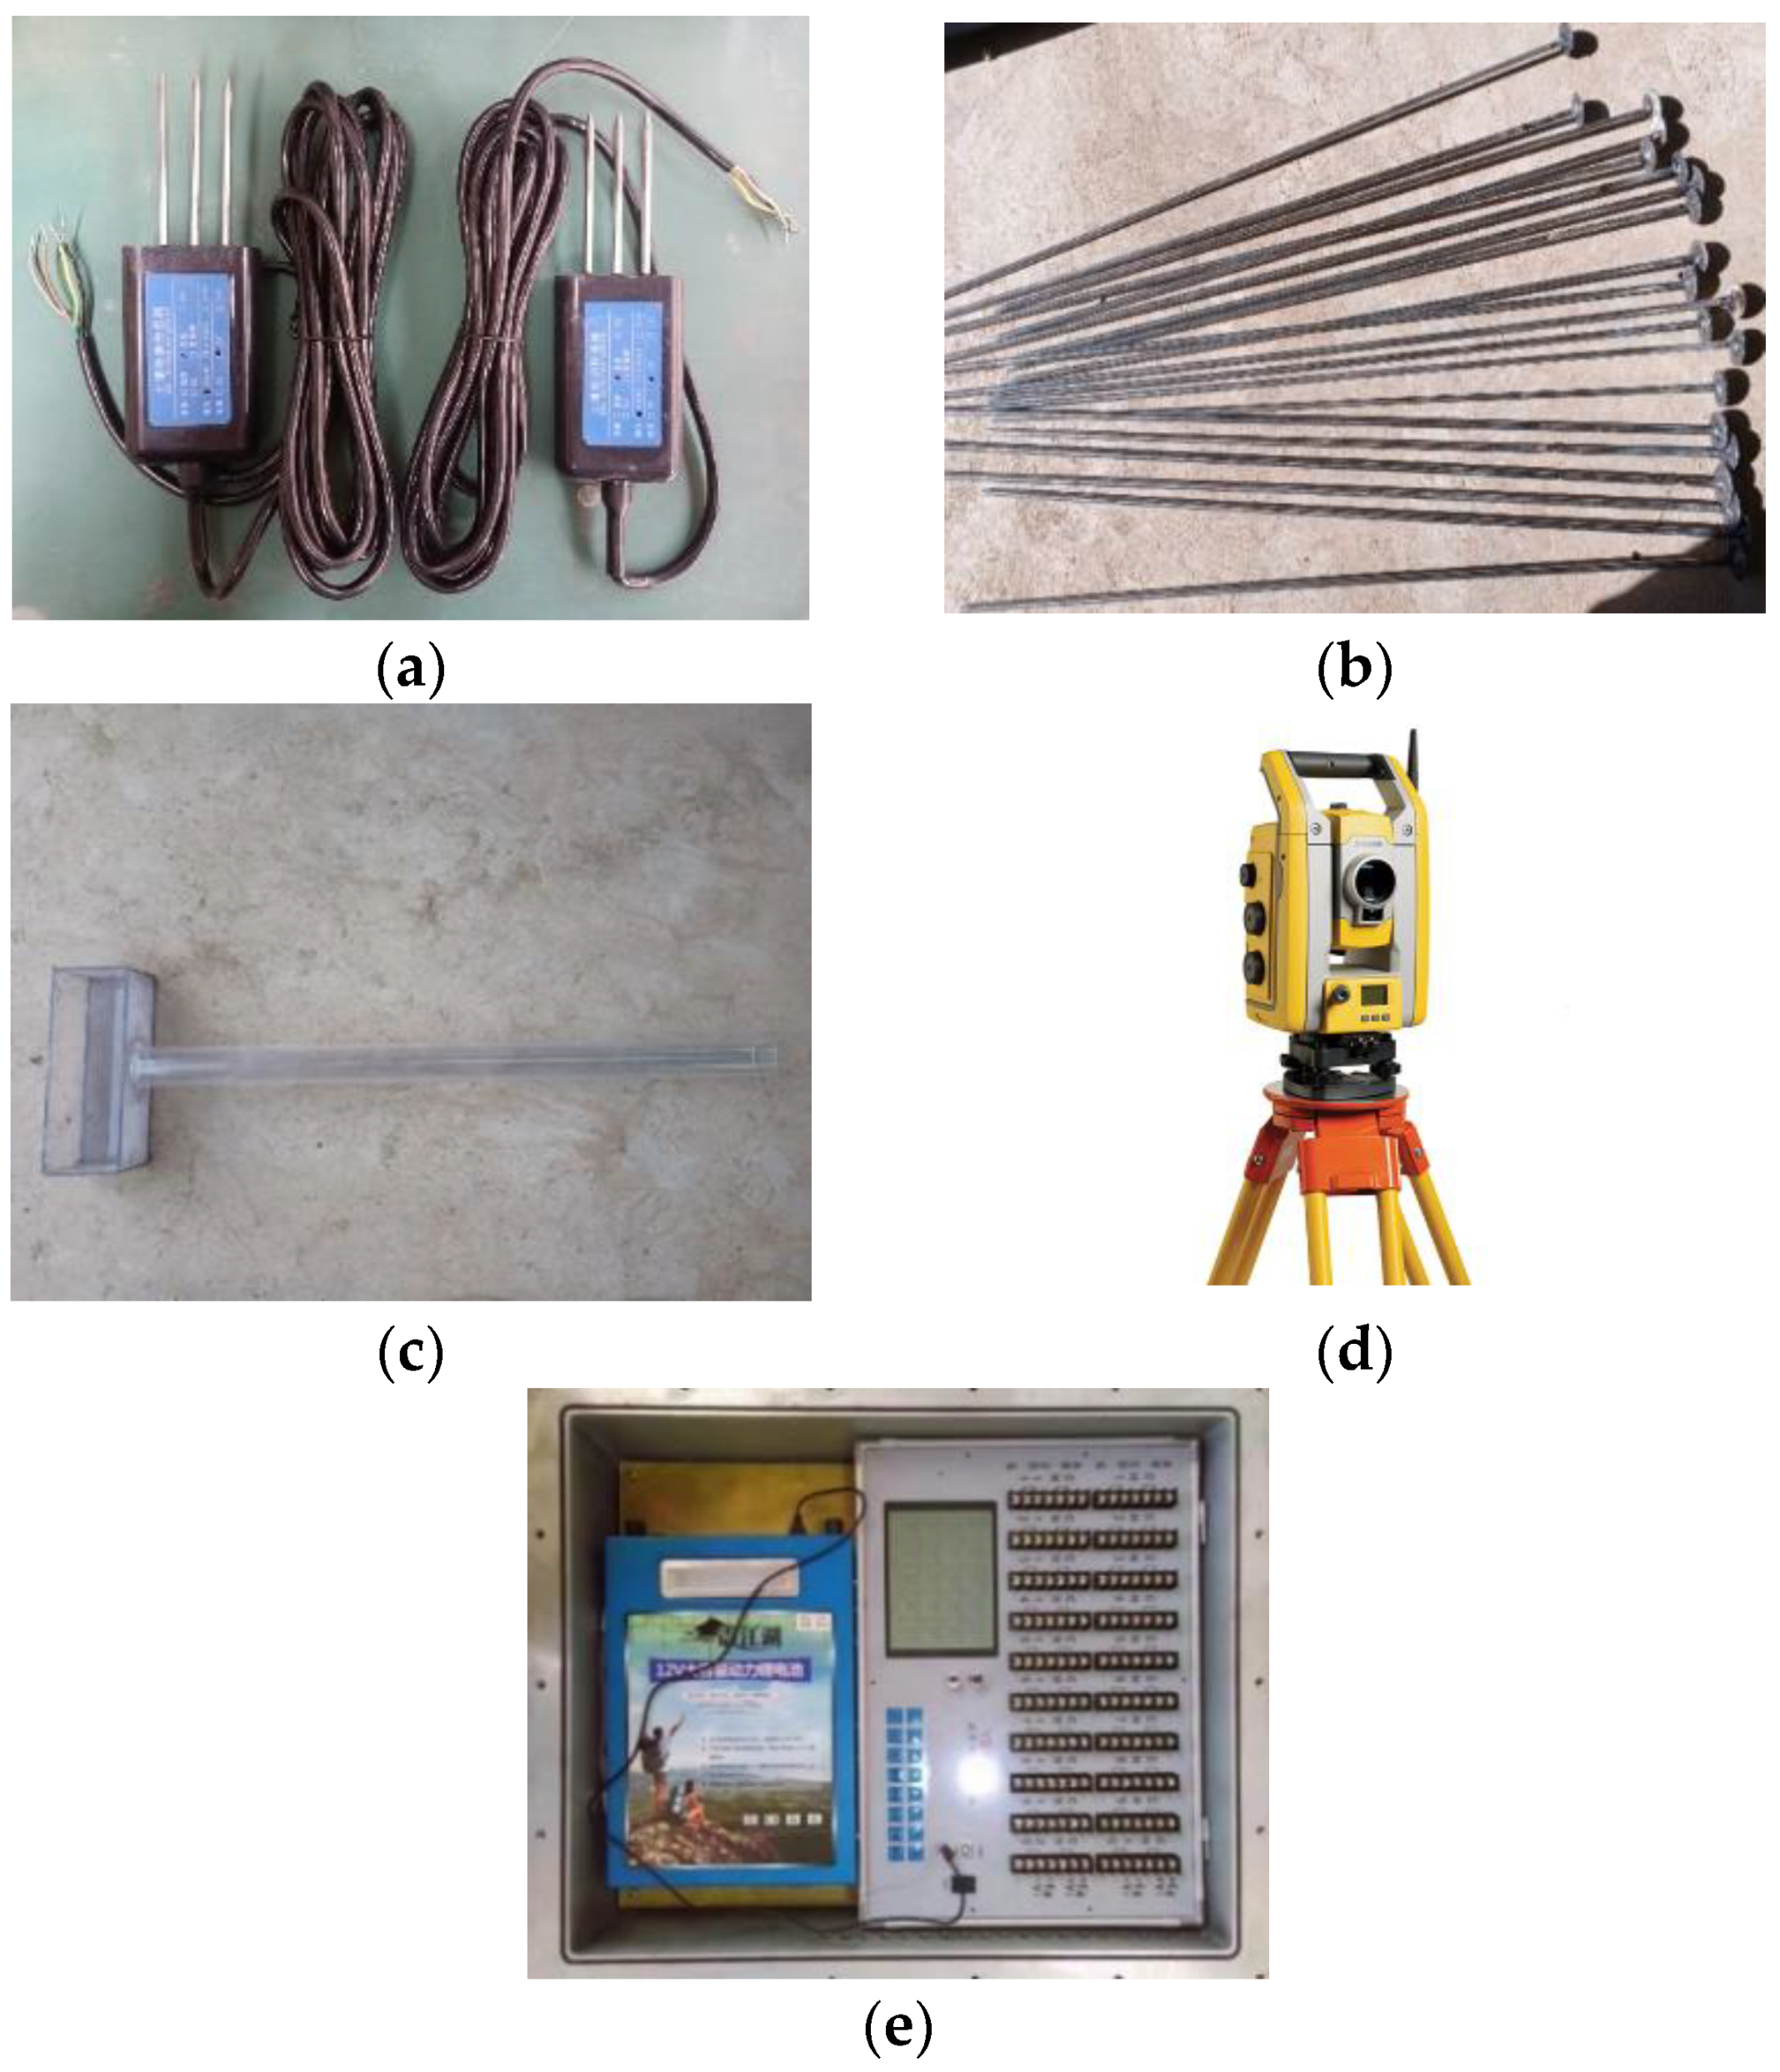
2.3.1. Test Equipment
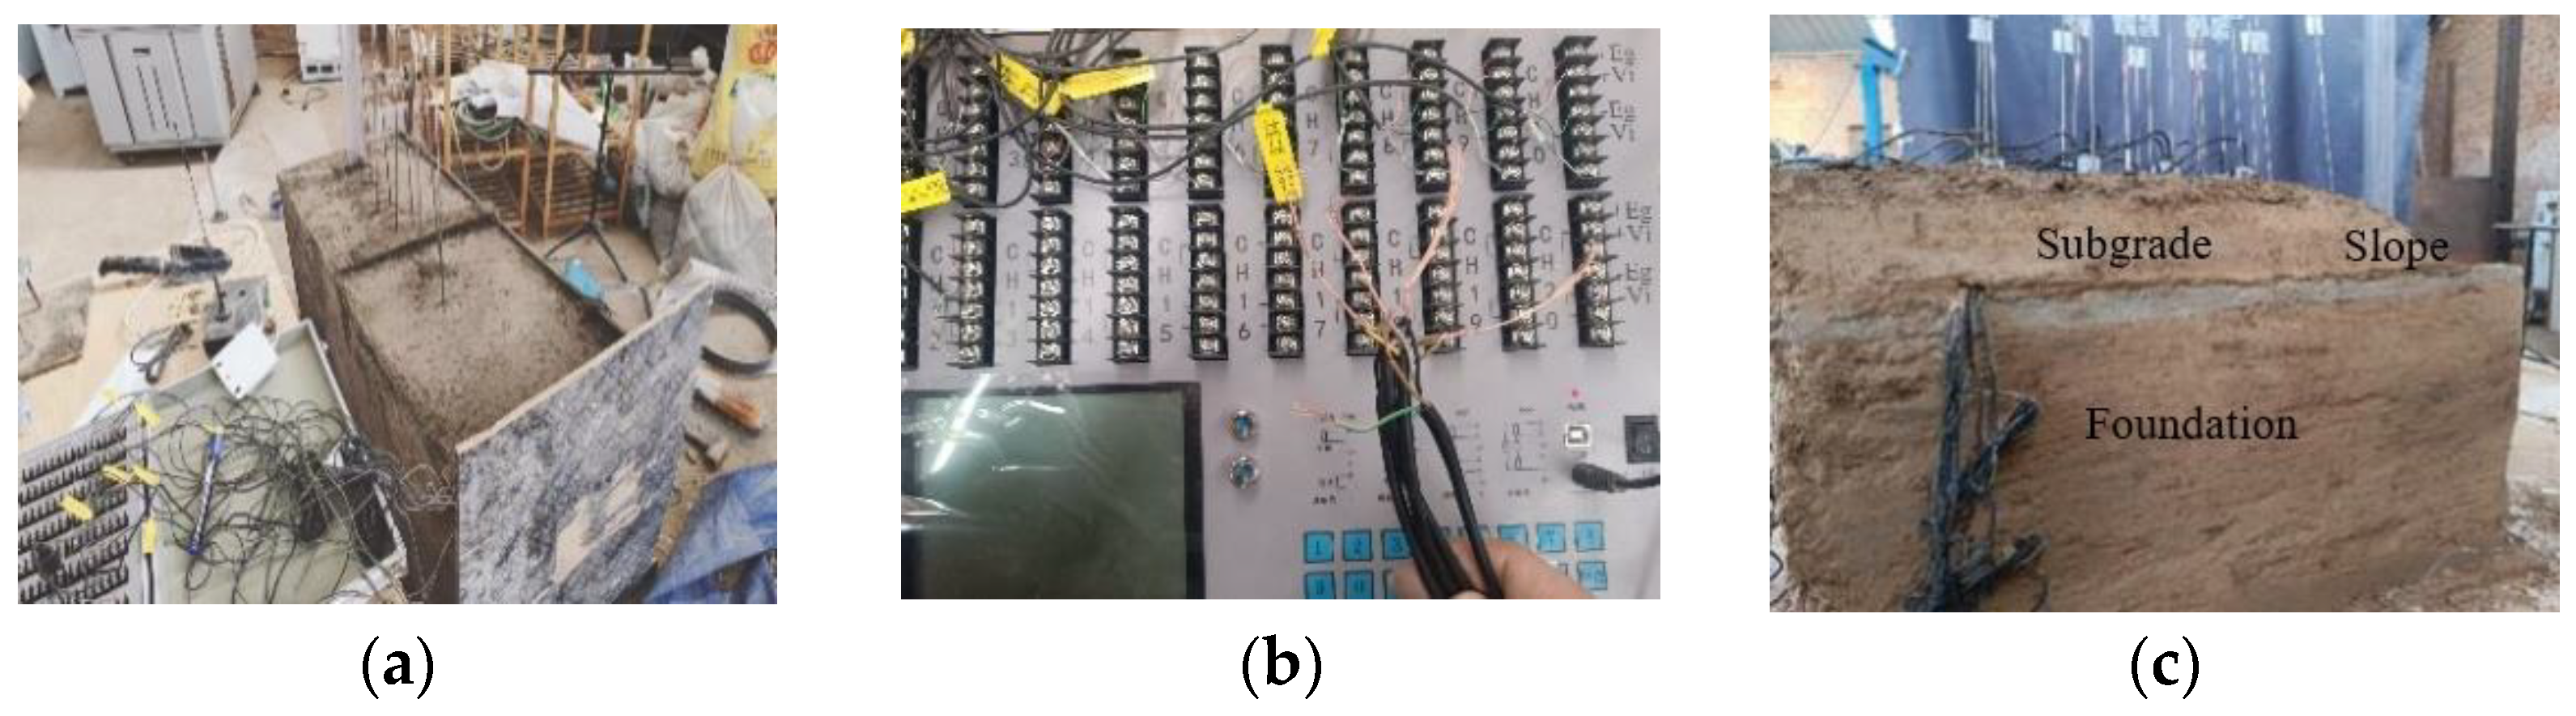
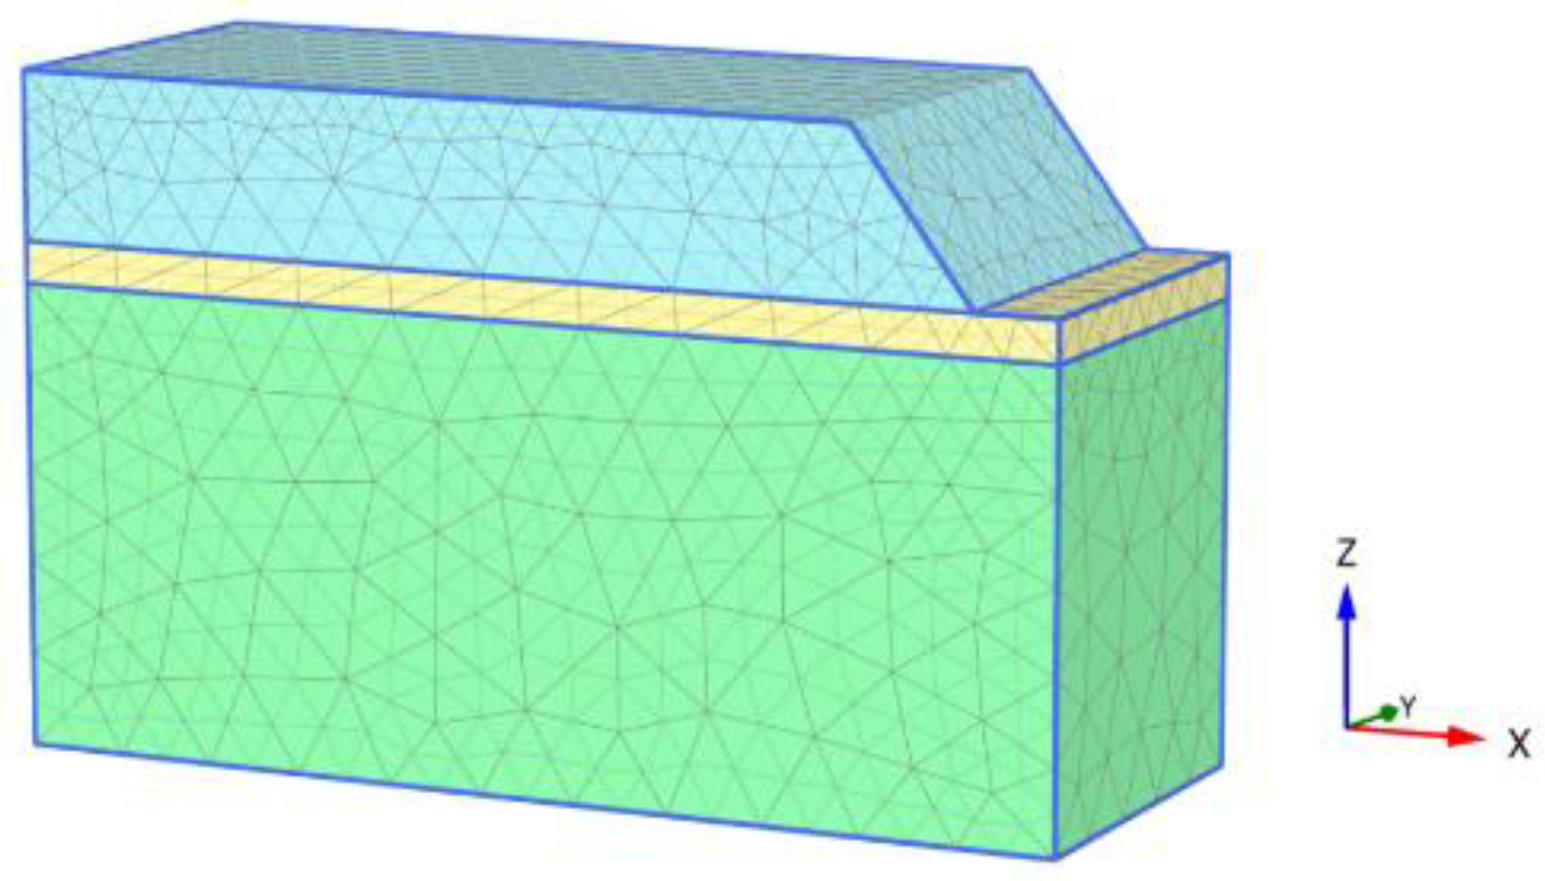
2.3.2. Model Construction and Sensor Layout
3. Results and Analysis
3.1. Analysis of the Influence of Water Injection on Settlement and Moisture Content
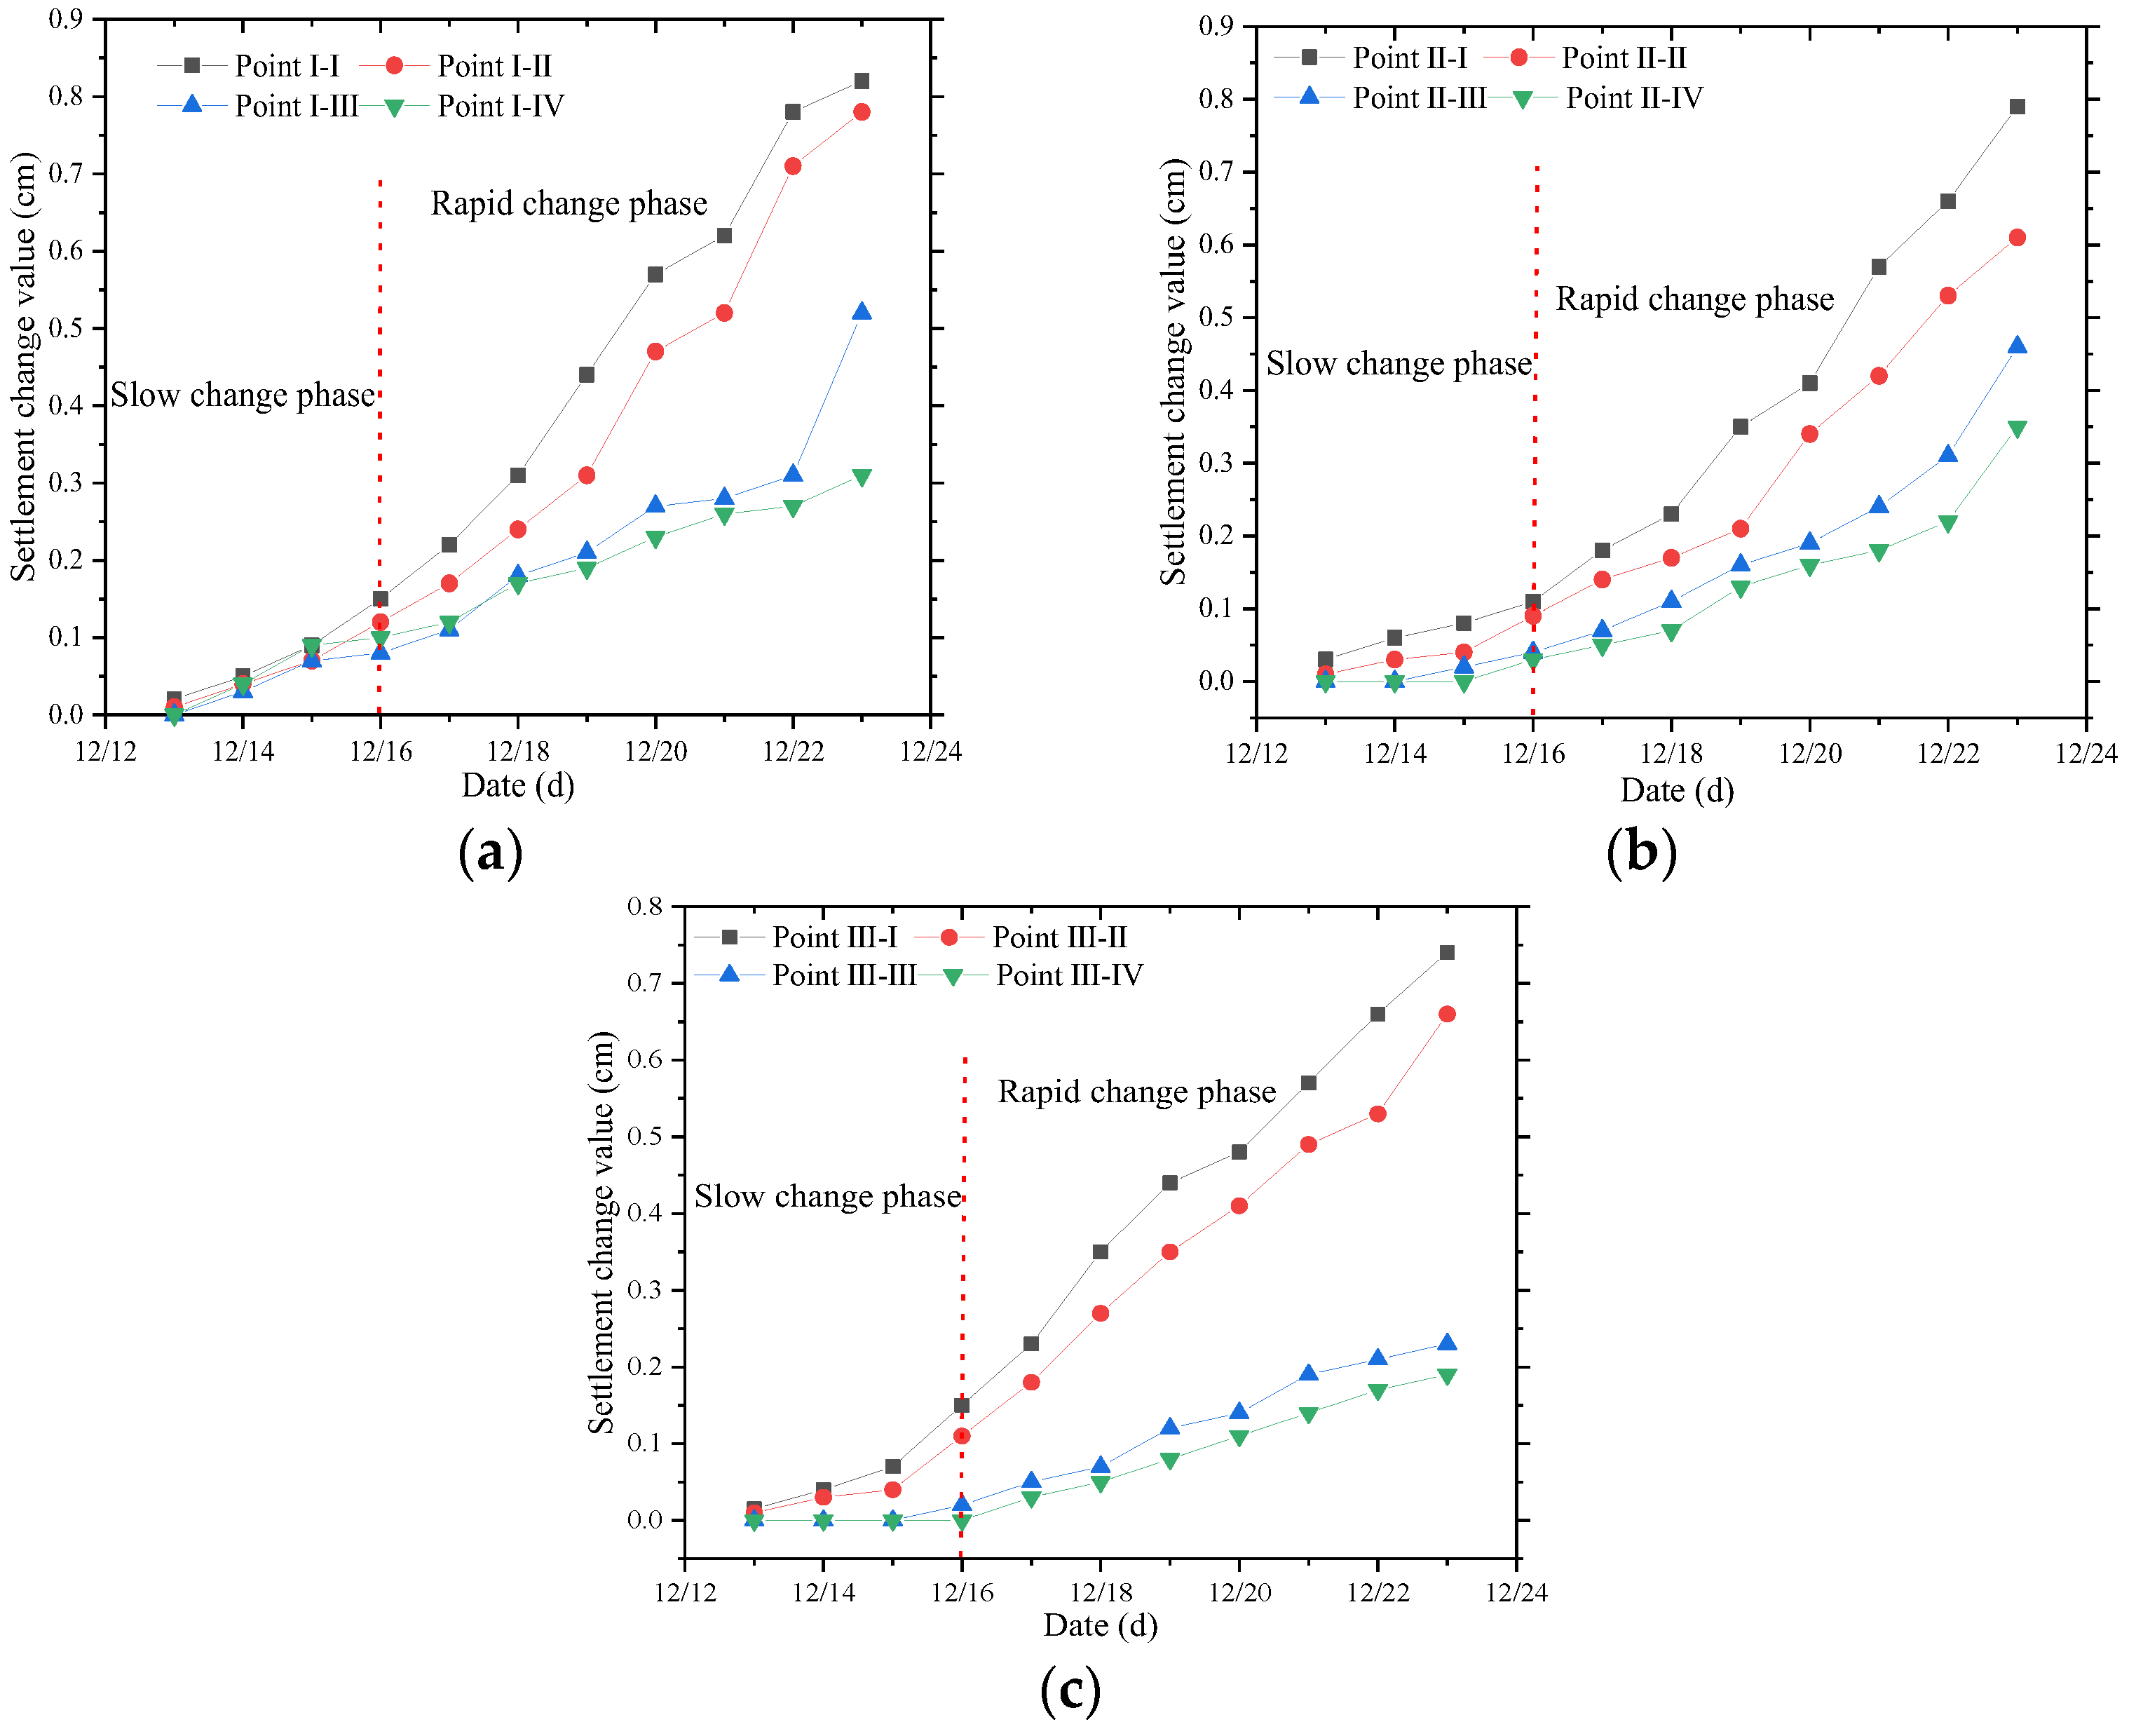
3.2. Settlement Changes with Time
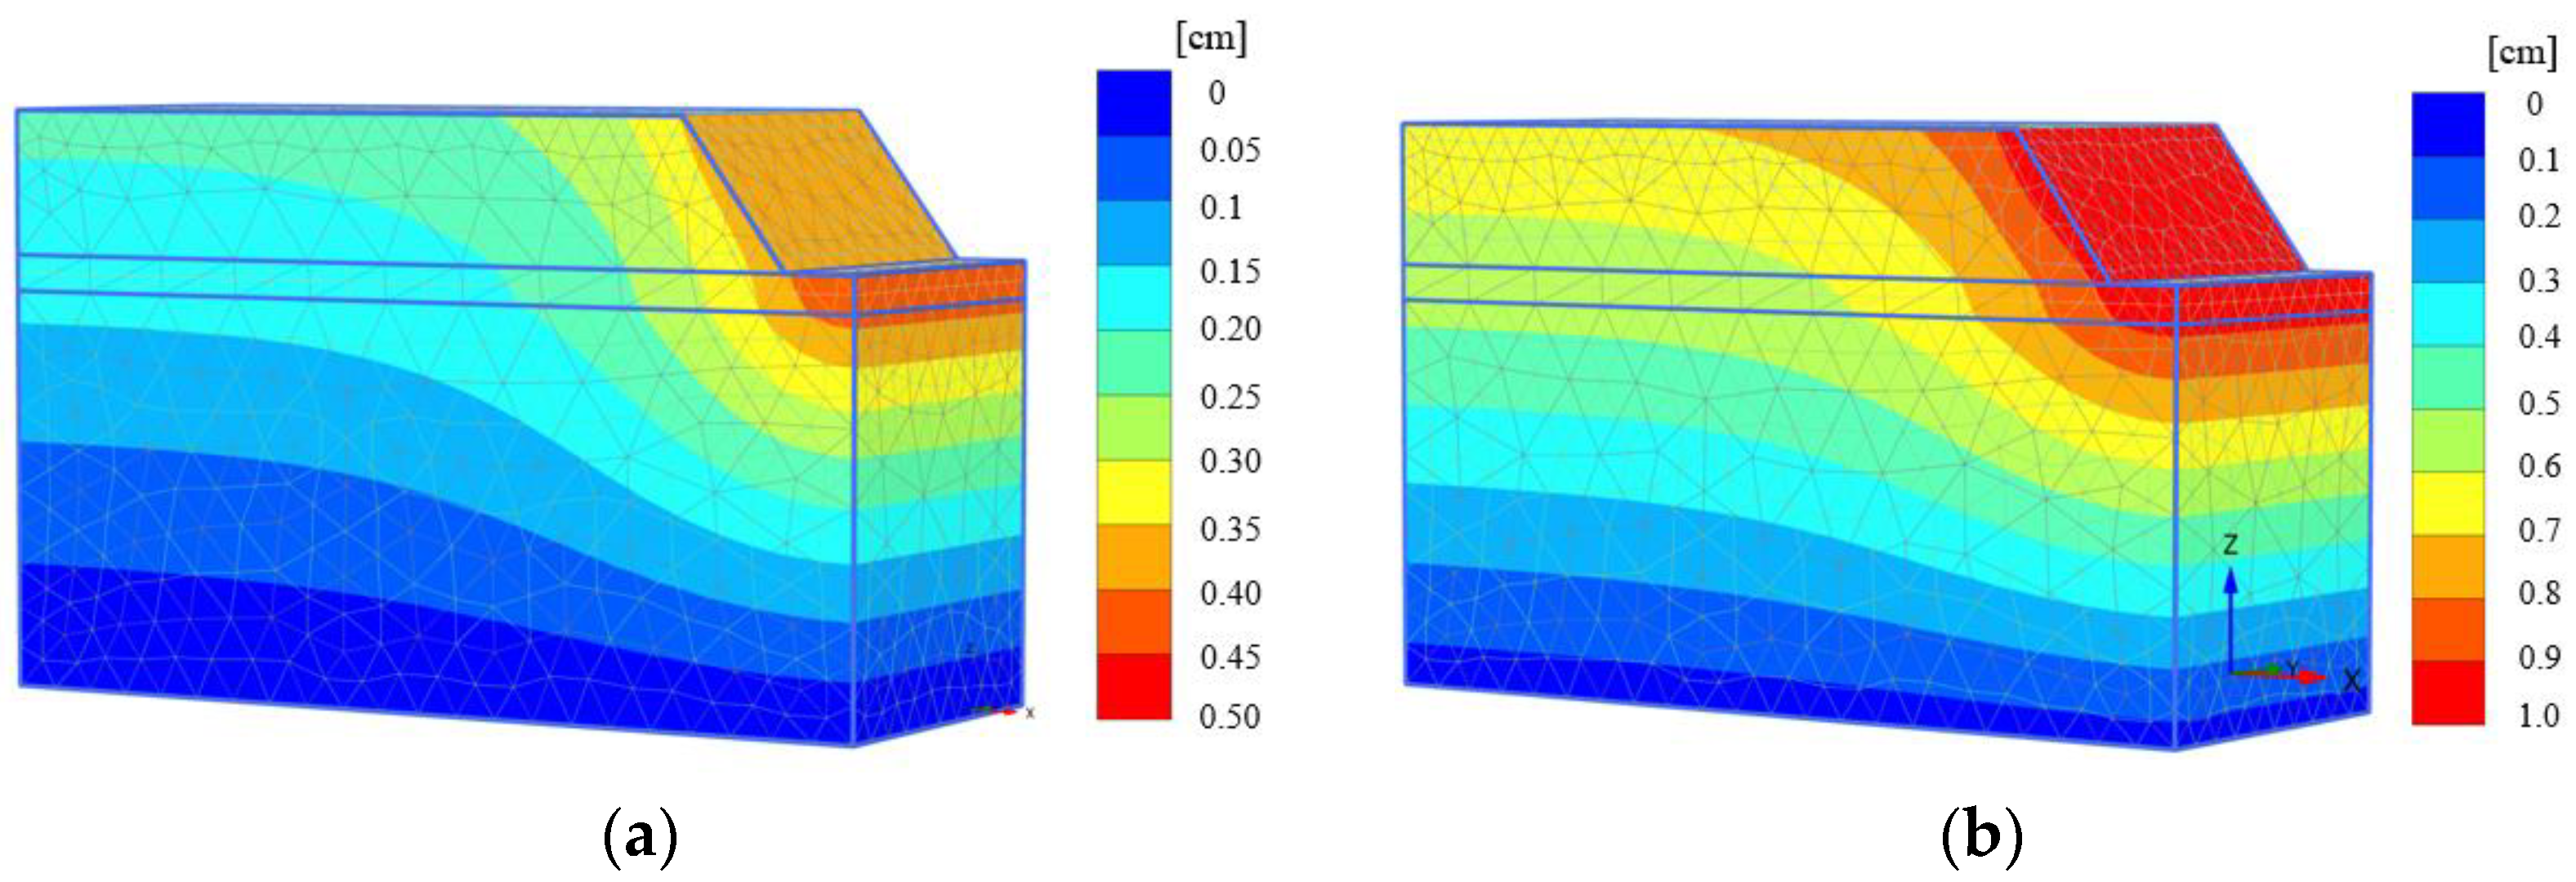
3.3. Finite Element Settlement Simulation Based on Plaxis
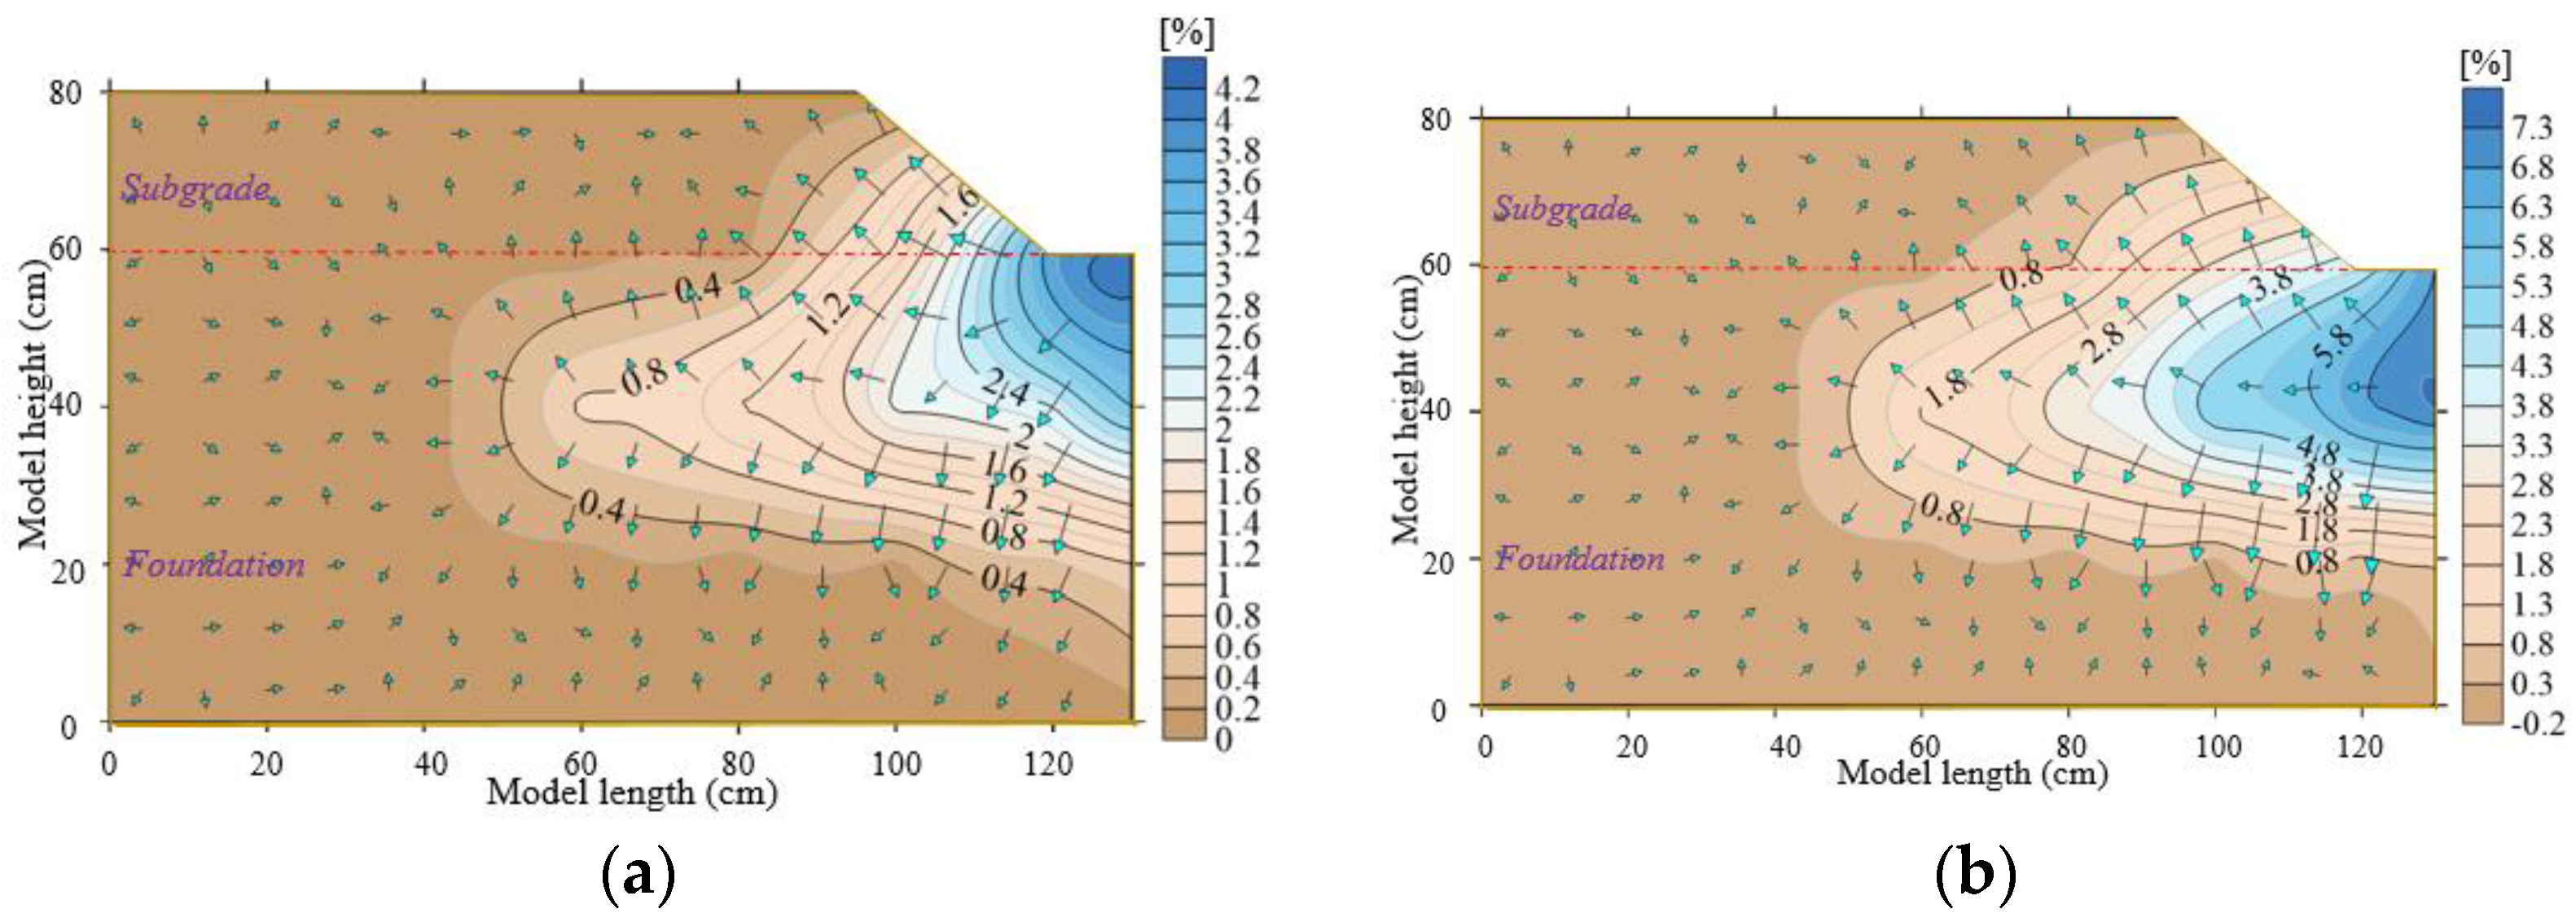
3.4. Change of Section Moisture Content
3.5. Relationship Between Moisture Content and Settlement Deformation
4. Conclusions
- (1)
- The greatest changes in moisture content and settlement occur at a depth of 20 cm. Within the same layer, the settlement and moisture content increase as the distance to the slope foot decreases. Due to the combined effects of water seepage and cold air, the settlement exhibits a clear lag. A settlement greater than 0.1 cm is considered effective. The settlement lag time near the slope foot is approximately 4 days (with a permeability of 8 L).
- (2)
- The settlement of the subgrade is primarily concentrated in the slope area due to the increased wetness at the foot of the slope, resulting in a “bending tipping failure”. Finite element simulations using Plaxis show that the settlement profile follows an inverted “S” shape.
- (3)
- A quadratic relationship exists between cumulative settlement deformation and the cumulative moisture content change at each monitoring point. The maximum settlement at each layer is approximately 0.8 cm, occurring near the slope foot.
- (4)
- The addition of a temperature sensor can be used to study the freezing depth of soil under cold conditions, as well as the relationship between temperature, moisture, and settlement and deformation.
- (5)
- The incorporation of a slope spraying device can be used to simulate the effects of atmospheric precipitation-induced slope infiltration.
Author Contributions
Funding
Institutional Review Board Statement
Informed Consent Statement
Data Availability Statement
Acknowledgments
Conflicts of Interest
References
- Zhao, M.; Chen, L.; Wu, H.; Guo, W.; Ye, C. Computer microscopic test study on the suitability of modified polyimide grease used to improve collapsible loess railway subgrade. Concurr. Comput. Pract. Exp. 2018, 30, e4900. [Google Scholar]
- Asadi, M.; Mallick, R.; Nazarian, S. Numerical modeling of post-flood water flow in pavement structures. Transp. Geotech. 2021, 27, 100468. [Google Scholar]
- Zhong, X.; Liang, Y.; Wang, Q.; Ma, J.; Liang, S.; Wang, Y.; Xu, X. Evaluation and analysis of the effect of lignin amelioration on loess collapsibility. J. Renew. Mater. 2022, 10, 3405. [Google Scholar]
- Showkat, R.; Mohammadi, H.; Babu, G.S. Effect of rainfall infiltration on the stability of compacted subgrades. Int. J. Geomech. 2022, 22, 04022104. [Google Scholar] [CrossRef]
- Remišová, E.; Decký, M.; Podolka, L.; Kováč, M.; Vondráčková, T.; Bartuška, L. Frost index from aspect of design of pavement construction in Slovakia. Procedia Earth Planet. Sci. 2015, 15, 3–10. [Google Scholar]
- Remišová, E.; Briliak, D. Investigation of the environmental degradation of asphalt pavement mixtures. In Proceedings of the 8th International Conference on Road and Rail Infrastructure, Cavtat, Croatia, 15–17 May 2024. [Google Scholar]
- Yao, Y.; Fan, J.; Li, J. A Review of Advanced Soil Moisture Monitoring Techniques for Slope Stability Assessment. Water 2025, 17, 390. [Google Scholar] [CrossRef]
- Tu, G.; Huang, R. Infiltration in two types of subgrades and the effects of rainfall time on the stability of slopes. Q. J. Eng. Geol. Hydrogeol. 2016, 49, 286–297. [Google Scholar]
- Zhou, X.; Zhang, Y.; Li, L.; Zhao, G.; Xu, S. Adhesive performance and impermeability mechanism of loess subgrade using caster oil based polyurethane reinforce. Constr. Build. Mater. 2023, 364, 130006. [Google Scholar]
- Zhao, X.; Zhao, L.; Yang, Q.; Wang, Z.; Cheng, A.; Mo, L.; Yan, J. Permeability and disintegration characteristics of composite improved phyllite soil by red clay and cement. Minerals 2022, 13, 32. [Google Scholar] [CrossRef]
- Ma, B.C.; Tian, W.P.; Li, J.C. Study on Causes and Preventive Measures for Flood Damage of Highway Subgrade along Rivers. Appl. Mech. Mater. 2012, 212, 748–751. [Google Scholar]
- Qiao, Y.; Zhang, S.; Wang, Y.; Dawson, A.; Wake, C.; Ma, T. Simulating floodwater movement in pavements for developing post-flooding time-depth-damage functions. Constr. Build. Mater. 2023, 396, 132408. [Google Scholar]
- Elshaer, M.; Ghayoomi, M.; Daniel, J.S. Impact of subsurface water on structural performance of inundated flexible pavements. Int. J. Pavement Eng. 2019, 20, 947–957. [Google Scholar] [CrossRef]
- Jiang, Y.; Yi, Y.; Tian, T.; Sha, H.; Fan, J.; Ji, X.; Xue, J. Water Infiltration and Water Stability of Compacted Loess Subgrades Based on Vibration Compaction. Arab. J. Sci. Eng. 2022, 47, 4987–5001. [Google Scholar]
- Liu, K.; Ye, W.; Sun, X.; Dang, F.; He, M.; Duan, Z.; Wang, Q. Revealing the mechanisms of water permeability enhancement of urban loess subgrades due to vibration application. Transp. Geotech. 2024, 48, 101346. [Google Scholar]
- Zhang, J.; Hu, H.; Peng, J.; Zhang, Y.; Zhang, A. Enhanced understanding of subgrade soil hydraulic characteristics: Effects of wetting–drying cycles and stress states on subgrade water migration. J. Hydrol. 2024, 635, 131165. [Google Scholar]
- Yue, J.; Zhang, H.; Zhang, Y.; Xu, S. Experimental investigation of influence of amide polymer on loess for subgrade. Sci. Rep. 2024, 14, 12229. [Google Scholar]
- Sim, M.L.; Ling, F.N.L.; Zaihasra, A.T. Analytical study on effect of groundwater table and rainfall infiltration on the stability and performance of Muar Trial Subgrade by using PLAXIS 2D. In Proceedings of the IOP Conference Series: Earth and Environmental Science, Bangkok, Thailand, 22–24 May 2019; IOP Publishing: Bristol, UK, 2024; Volume 1347, p. 012061. [Google Scholar]
- Liu, L.; Li, Z.; Cai, G.; Liu, X.; Yan, S. Humidity field characteristics in road subgrade constructed with recycled construction wastes. J. Clean. Prod. 2020, 259, 120977. [Google Scholar] [CrossRef]
- Liu, W.; Yu, W.; Fortier, R.; Chen, L.; Lu, Y.; Zhang, M.; Hu, D. Thermal effect of rainwater infiltration into a replicated road subgrade in a cold environmental chamber. Cold Reg. Sci. Technol. 2019, 159, 47–57. [Google Scholar]
- Tai, B.; Yue, Z.; Qi, S.; Wang, P. Experimental and numerical investigation on thermal-moisture-mechanical behaviors on a new anti-frost cutting bed of high-speed railway in deep seasonally frozen ground regions under extreme climate. Comput. Geotech. 2021, 136, 104251. [Google Scholar]
- Chen, S.L.; Dong, K.H.; Shi, J.J.; Yu, T.; Huang, J. Infiltration Time Effects of Compressibility of Cement Soil. Appl. Mech. Mater. 2013, 405, 10–14. [Google Scholar]
- Zhao, L.; Gray, D.M.; Toth, B. Influence of soil texture on snowmelt infiltration into frozen soils. Can. J. Soil. Sci. 2002, 82, 75–83. [Google Scholar] [CrossRef]
- Stuurop, J.C.; van der Zee, S.E.; French, H.K. The influence of soil texture and environmental conditions on frozen soil infiltration: A numerical investigation. Cold Reg. Sci. Technol. 2022, 194, 103456. [Google Scholar]
- Wen, P.; Wang, C.; Gao, X.; Chen, M.; Chai, Z. Effect of environmental factors on mechanical properties and damage characteristics of mine overburden used in subgrade. Int. J. Pavement Eng. 2023, 24, 2032698. [Google Scholar]
- Li, W.; Yu, L.; Tan, Y.; Wu, L.; Qian, J. Mechanical properties and impact behavior of frozen clay: Insights from static mechanical tests, fly-plate tests, and split-Hopkinson pressure bar analysis. Phys. Fluids 2024, 36, 057138. [Google Scholar]
- Peng, Y.; Yu, L.; Qian, J.; Li, W.; Zhang, T.; Zhou, L. Dynamic tensile behavior and crack propagation in coral aggregate seawater shotcrete: Experimental investigation and numerical simulation. Cem. Concr. Compos. 2025, 159, 106010. [Google Scholar]


| Soil Sample | Density ρ (g/cm3) | Dry Density ρd (g/cm3) | Natural Moisture Content ω (%) | Plastic Limit ωp (%) | Liquid Limit ωL (%) | Optimum Moisture Content ωop (%) | Maximum Dry Density ρdmax (g/cm3) |
|---|---|---|---|---|---|---|---|
| Loess | 1.77 | 1.69 | 9.5 | 9 | 25 | 11.2 | 1.882 |
| Type | Range (%) | Measurement Accuracy (%) | Response Time (s) | Operating Environment (°C) |
|---|---|---|---|---|
| RS485 | 100 | ±1 | <1 | −40~80 °C |
| Frequency (Hz) | Sensor | Number of Channels | Acquisition Interval (min) | Connection Mode |
|---|---|---|---|---|
| 10 | Pore water pressure gauge | 20 | 10 | Full bridge |
| Type | Layer | Thickness | Dry Density | Compactness | Moisture Content | Compaction Method | Height |
|---|---|---|---|---|---|---|---|
| Foundation | 1–20 | 3 cm | 1.69 g/cm3 | 90% | 11.2% | Rubber hammer compaction | 60 cm |
| Subgrade | 1–6 | 3 cm | 1.77 g/cm3 | 93% | 11.2% | 18 cm | |
| 7 | 2 cm | 1.77 g/cm3 | 11.2% | 2 cm |
| Type | Thickness (cm) | Effective Cohesion (kPa) | Effective Angle of Internal Friction (°) | Gravity (kN/m3) | Elastic Modulus E (MPa) | Poisson’s Ratio v | Saturated Permeability Coefficient (cm/s) | Permeability Coefficient (cm/s) |
|---|---|---|---|---|---|---|---|---|
| Foundation | 0–60 | 19.8 | 32.9 | 16.9 | 8 | 0.33 | 5.41 × 10⁻⁶ | 3.93 × 10⁻⁶ |
| Subgrade | 0–20 | 19.8 | 32.9 | 17.5 | 8 | 0.33 | 1.12 × 10⁻⁷ | 8.67 × 10⁻⁷ |
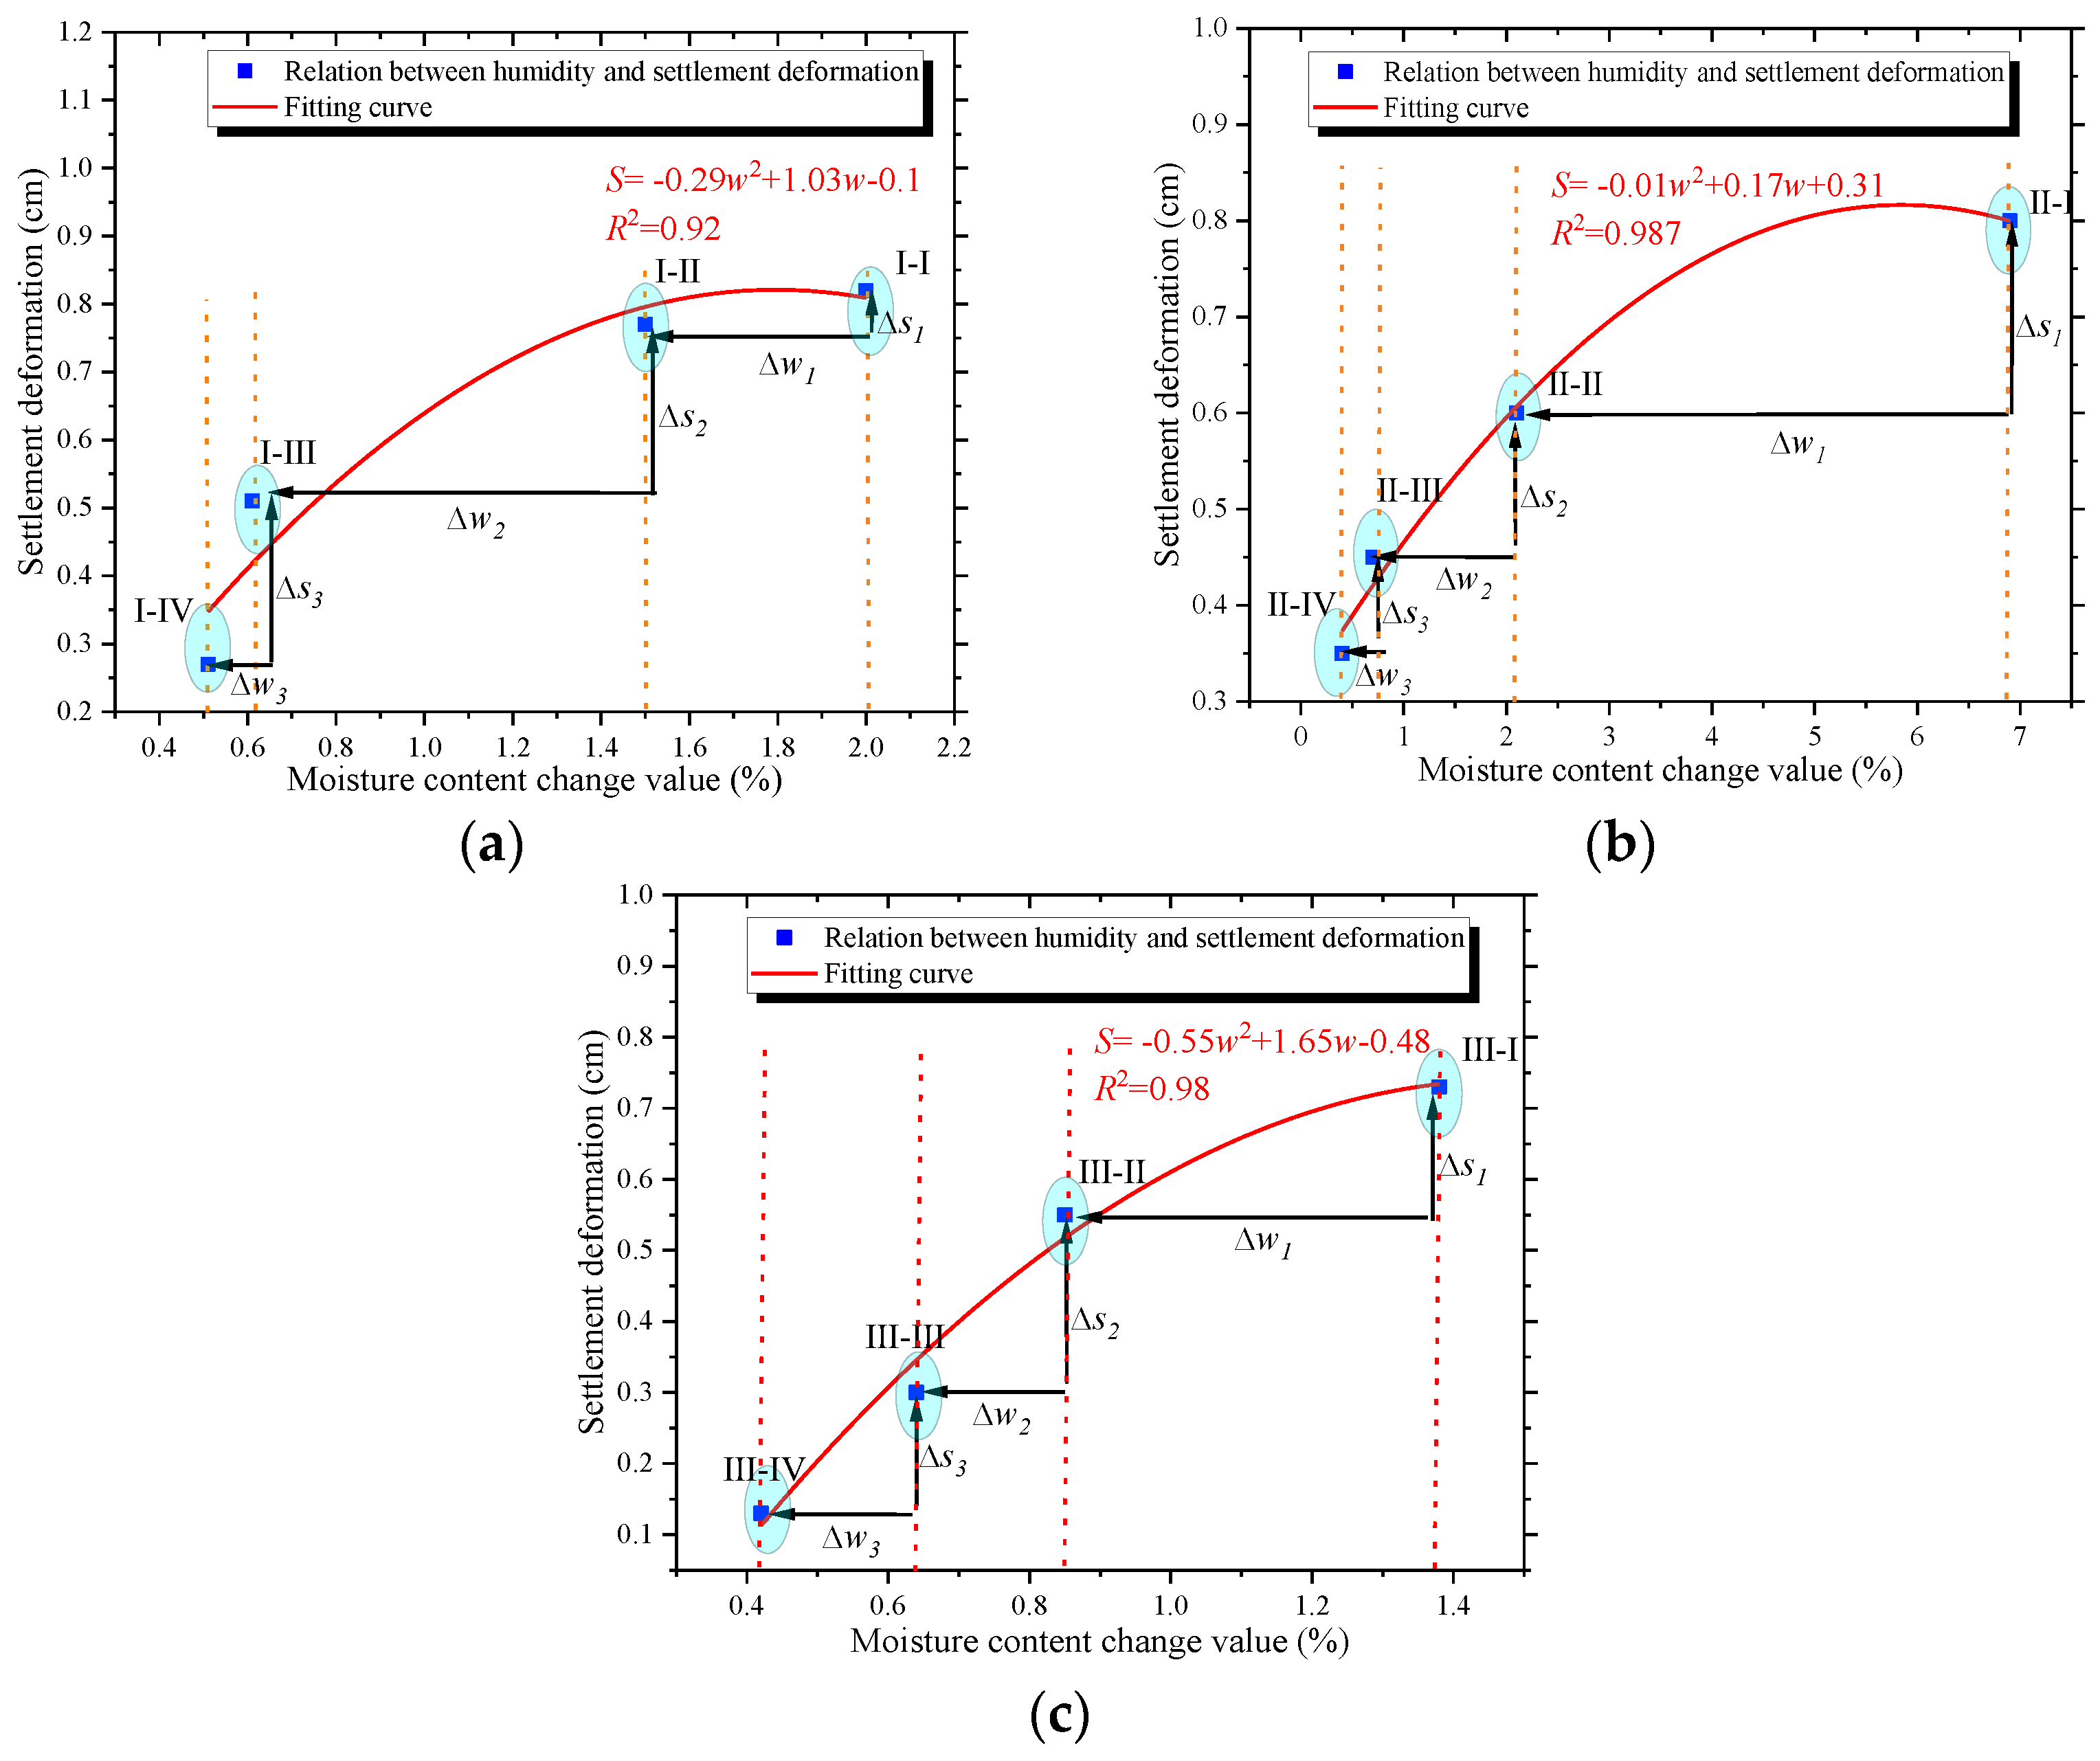
| Layer | Fitted Equation | Coefficient of Determination |
|---|---|---|
| At a depth of 40 cm in the foundation | S = −0.29w2 + 1.03w − 0.1 | R2 = 0.92 |
| At a depth of 20 cm in the foundation | S = −0.01w2 + 0.17w + 0.31 | R2 = 0.987 |
| Interface between the subgrade and foundation | S = −0.55w2 + 1.65w − 0.48 | R2 = 0.98 |
Disclaimer/Publisher’s Note: The statements, opinions and data contained in all publications are solely those of the individual author(s) and contributor(s) and not of MDPI and/or the editor(s). MDPI and/or the editor(s) disclaim responsibility for any injury to people or property resulting from any ideas, methods, instructions or products referred to in the content. |
© 2025 by the authors. Licensee MDPI, Basel, Switzerland. This article is an open access article distributed under the terms and conditions of the Creative Commons Attribution (CC BY) license (https://creativecommons.org/licenses/by/4.0/).
Share and Cite
Wang, W.; Li, W.; Zhang, P.; Liu, L. Investigation of Seepage Behavior and Settlement Deformation Mechanisms in Loess Embankment Foundation Systems in Eastern Gansu Province. Appl. Sci. 2025, 15, 3789. https://doi.org/10.3390/app15073789
Wang W, Li W, Zhang P, Liu L. Investigation of Seepage Behavior and Settlement Deformation Mechanisms in Loess Embankment Foundation Systems in Eastern Gansu Province. Applied Sciences. 2025; 15(7):3789. https://doi.org/10.3390/app15073789
Chicago/Turabian StyleWang, Wei, Wei Li, Pengxiang Zhang, and Lulu Liu. 2025. "Investigation of Seepage Behavior and Settlement Deformation Mechanisms in Loess Embankment Foundation Systems in Eastern Gansu Province" Applied Sciences 15, no. 7: 3789. https://doi.org/10.3390/app15073789
APA StyleWang, W., Li, W., Zhang, P., & Liu, L. (2025). Investigation of Seepage Behavior and Settlement Deformation Mechanisms in Loess Embankment Foundation Systems in Eastern Gansu Province. Applied Sciences, 15(7), 3789. https://doi.org/10.3390/app15073789