Article

Research on the Operation, Maintenance, and Parameters of Expressway Mechanical and Electrical Equipment Based on Markov Prediction

1
School of Transportation Engineering, Xinjiang University, Urumqi 830017, China
2
Xinjiang Key Laboratory of Green Construction and Maintenance of Transportation Infrastructure and Intelligent Traffic Control, Urumqi 830017, China
3
School of Business, Xinjiang University, Urumqi 830017, China
4
Xinjiang Jiaotou Engineering Technology Development Co., Ltd., Urumqi 830001, China
5
Xinjiang Transportation Investment (Group) Co., Ltd., Urumqi 830001, China
6
Engineering Technology and Transportation Industry in Arid Desert Areas, Urumqi 830001, China
*
Author to whom correspondence should be addressed.
Appl. Sci. 2025, 15(7), 3628; https://doi.org/10.3390/app15073628
Submission received: 1 February 2025 / Revised: 13 March 2025 / Accepted: 17 March 2025 / Published: 26 March 2025

Abstract

:
With the continuous progress of traffic technology and the continuous improvements in traffic infrastructure, the maintenance and management of highway mechanical and electrical equipment has become a key factor affecting highway operation efficiency. However, at present, most of the mechanical and electrical systems of expressways cannot monitor the equipment continuously in terms of operation and maintenance, and most of the equipment operation and maintenance stay only in the stage of equipment failure. In addition, there are many kinds of highway mechanical and electrical equipment, and there are significant differences in the levels of parameters, so the parameter levels of highway mechanical and electrical equipment cannot fully meet the operation requirements of the area. Therefore, based on the basic theory of the Markov chain and the concept of daily operation and maintenance, this paper constructs a multistate Markov fault prediction model considering maintenance. Based on the historical data, the model realizes the prediction of the equipment failure rate and the formulation of the optimal maintenance strategy for the equipment, taking video surveillance equipment as an example, and verifies the improvement in the value of the equipment under this strategy through the value engineering theory. Based on the prediction results, more reasonable technical parameters are customized for equipment with a high failure rate to improve the practicability and reliability of the mechanical and electrical equipment in the area.

1. Introduction

The operation process of the electromechanical systems of expressways is uninterrupted for 24 h, which plays an important role in the smooth operation of the national highway network, and the occurrence of all kinds of equipment failures in the electromechanical system will directly affect the actual operation efficiency of the expressway, which means the accurate calculation of the equipment failure rate. Developing reliability-centric maintenance and replacement strategies is important to ensure service reliability and security [1]. For this situation, various prediction models such as Bayesian prediction [2,3], the support vector machine model [4,5,6], and the logical regression model [7,8] have also developed rapidly and have been widely used in the field of engineering and technology. This kind of model can be used to calculate the probability of events according to some specific conditions, and the accuracy of the prediction results is more reliable. However, in the prediction of the fault types of mechanical and electrical equipment on expressways, there is still much room for improvement in the prediction and application of the above models. Limited by the operational environment of the mechanical and electrical equipment in the outfield of the highway, all kinds of environmental parameters and external stress conditions of the equipment during operation are multi-dimensional and dynamic, so it is difficult to monitor and record them in real time, which leads to the failure of the equipment. Its parameter changes are easy to miss. According to the current management strategy in most areas, maintenance operations are usually carried out only when errors are reported by the system or found manually after the failure of highway mechanical and electrical equipment. The lack of prior control has dramatically affected the reliability and remaining life of the equipment [9,10].
On this basis, some scholars have found that using the Markov process [11,12] to predict the failure rate can effectively avoid the problem that the early data are not applicable and the parameter records are missing when the equipment failure occurs. The prediction and analysis of equipment failure can be realized by constructing and analyzing the Markov fault model. Xinglong Wang [13] and other scholars established a Markov chain model by analyzing fault data and used this model to predict the occurrence frequency of different fault levels of ATCAS software in the next few months. Quan Yu [14] and others put forward a highway electromechanical equipment life prediction model based on the Markov chain, which provides a basis for expressway electromechanical equipment maintenance and renewal decision making. The new probabilistic modeling framework model for long-term fatigue reliability analysis of wind turbines proposed by Zhu D [15] makes innovative use of the Markov chain model and sub-simulation set and is an effective tool for the long-term fatigue reliability analysis of wind turbines and other structures. Qingzhu L. et al. [16] constructed a simplified reliability evaluation model of a complex security system based on the Markov state. The system reliability deviation between the simplified and complete models is less than 0.0021%, proving the simplified model’s effectiveness. Haghgoo O [17] proposed a ten-state extended Markov model of CVT (Continuously Variable Transmission) and proved by simulation that the compensating reactors in the second capacitance group and EMUs (Electric Multiple Units) subsystem play an important role in the performance of the CVT. Yang Yi [18] and others established a semi-Markov model (UPSM) of uncertain seepage to describe the physical characteristics of traffic accidents considering random and cognitive uncertainty. In summary, using Markov theory for related prediction and analysis can significantly improve the stability of equipment operation and maintenance from the external operation and maintenance.
However, in addition to the external operating environment, the parameter decay of the equipment itself will also affect its reliability. When electromechanical equipment is subjected to external stress or affected by the environment, its own performance parameters may be degraded, such as the reduction in coil detection accuracy, the decline in waterproof and dustproof grade, and so on. These changes may lead to weakening of the equipment’s function, shortening of its life, and even failure, thus increasing the risk of equipment failure and reducing the reliability and safety of electromechanical equipment. By studying the changes in parameters in the internal decay process of the equipment, the reliability of the equipment can be effectively analyzed. Then, the corresponding prevention and parameter optimization measures can be put forward to effectively reduce the equipment’s failure rate and improve the equipment’s reliability, prolong the service life of the equipment, reduce the maintenance cost, and improve the use efficiency and economic benefit. Xiaogang Zhang [19] and other scholars use equipment performance parameters such as equipment utilization, manufacturing capacity, and productivity to evaluate the reliability of flexible manufacturing cells. Chang Sun [20] uses a non-dominant sorting genetic algorithm (NSGA) and entropy weight-based optimal selection method (TOPSIS) to optimize the parameters, which provides a solution for soil temperature reduction and low-cost operation in cold and arid areas in the application of ground-source heat pumps. Li X Y [21], combining the data characteristics of the equipment accelerated decay experiment and considering the cognitive uncertainty, proposed a stochastic fuzzy accelerated decay model and its corresponding statistical analysis method. Li N [22] proposed a method to describe the equipment performance decay process by using the general expression based on the life and state correlation model, and the general expression of the stochastic process solved the probability density function.
This study creatively combines the external operation and maintenance strategy of highway mechanical and electrical equipment with the internal technical parameters of the equipment, formulates its operation and maintenance strategy from the point of view of equipment maintenance, and starts with the shortcomings of the operation and maintenance strategy to improve the parameter level of the equipment itself. Firstly, a multistate Markov model considering maintenance is constructed based on the basic theory of the Markov chain. Based on the fault performance in the historical operation and maintenance data of electromechanical equipment, the fault state of the equipment is classified, and the maintenance factors of the equipment’s operation and maintenance are taken into consideration. By predicting the future fault state of electromechanical equipment, the purpose of this model is to realize the differential operation and maintenance strategy based on the external information of the equipment. In addition, aiming at the typical equipment with high failure rates, this study customizes the technical parameters to adapt to the environment of the equipment from the inside in order to improve the reliability of the equipment. The equipment operation and maintenance and parameter research involved in the study comprehensively considers the external operation and maintenance environment and internal quality factors of the equipment, which can essentially enhance the use value of highway mechanical and electrical equipment. The specific research ideas are shown in Figure 1.

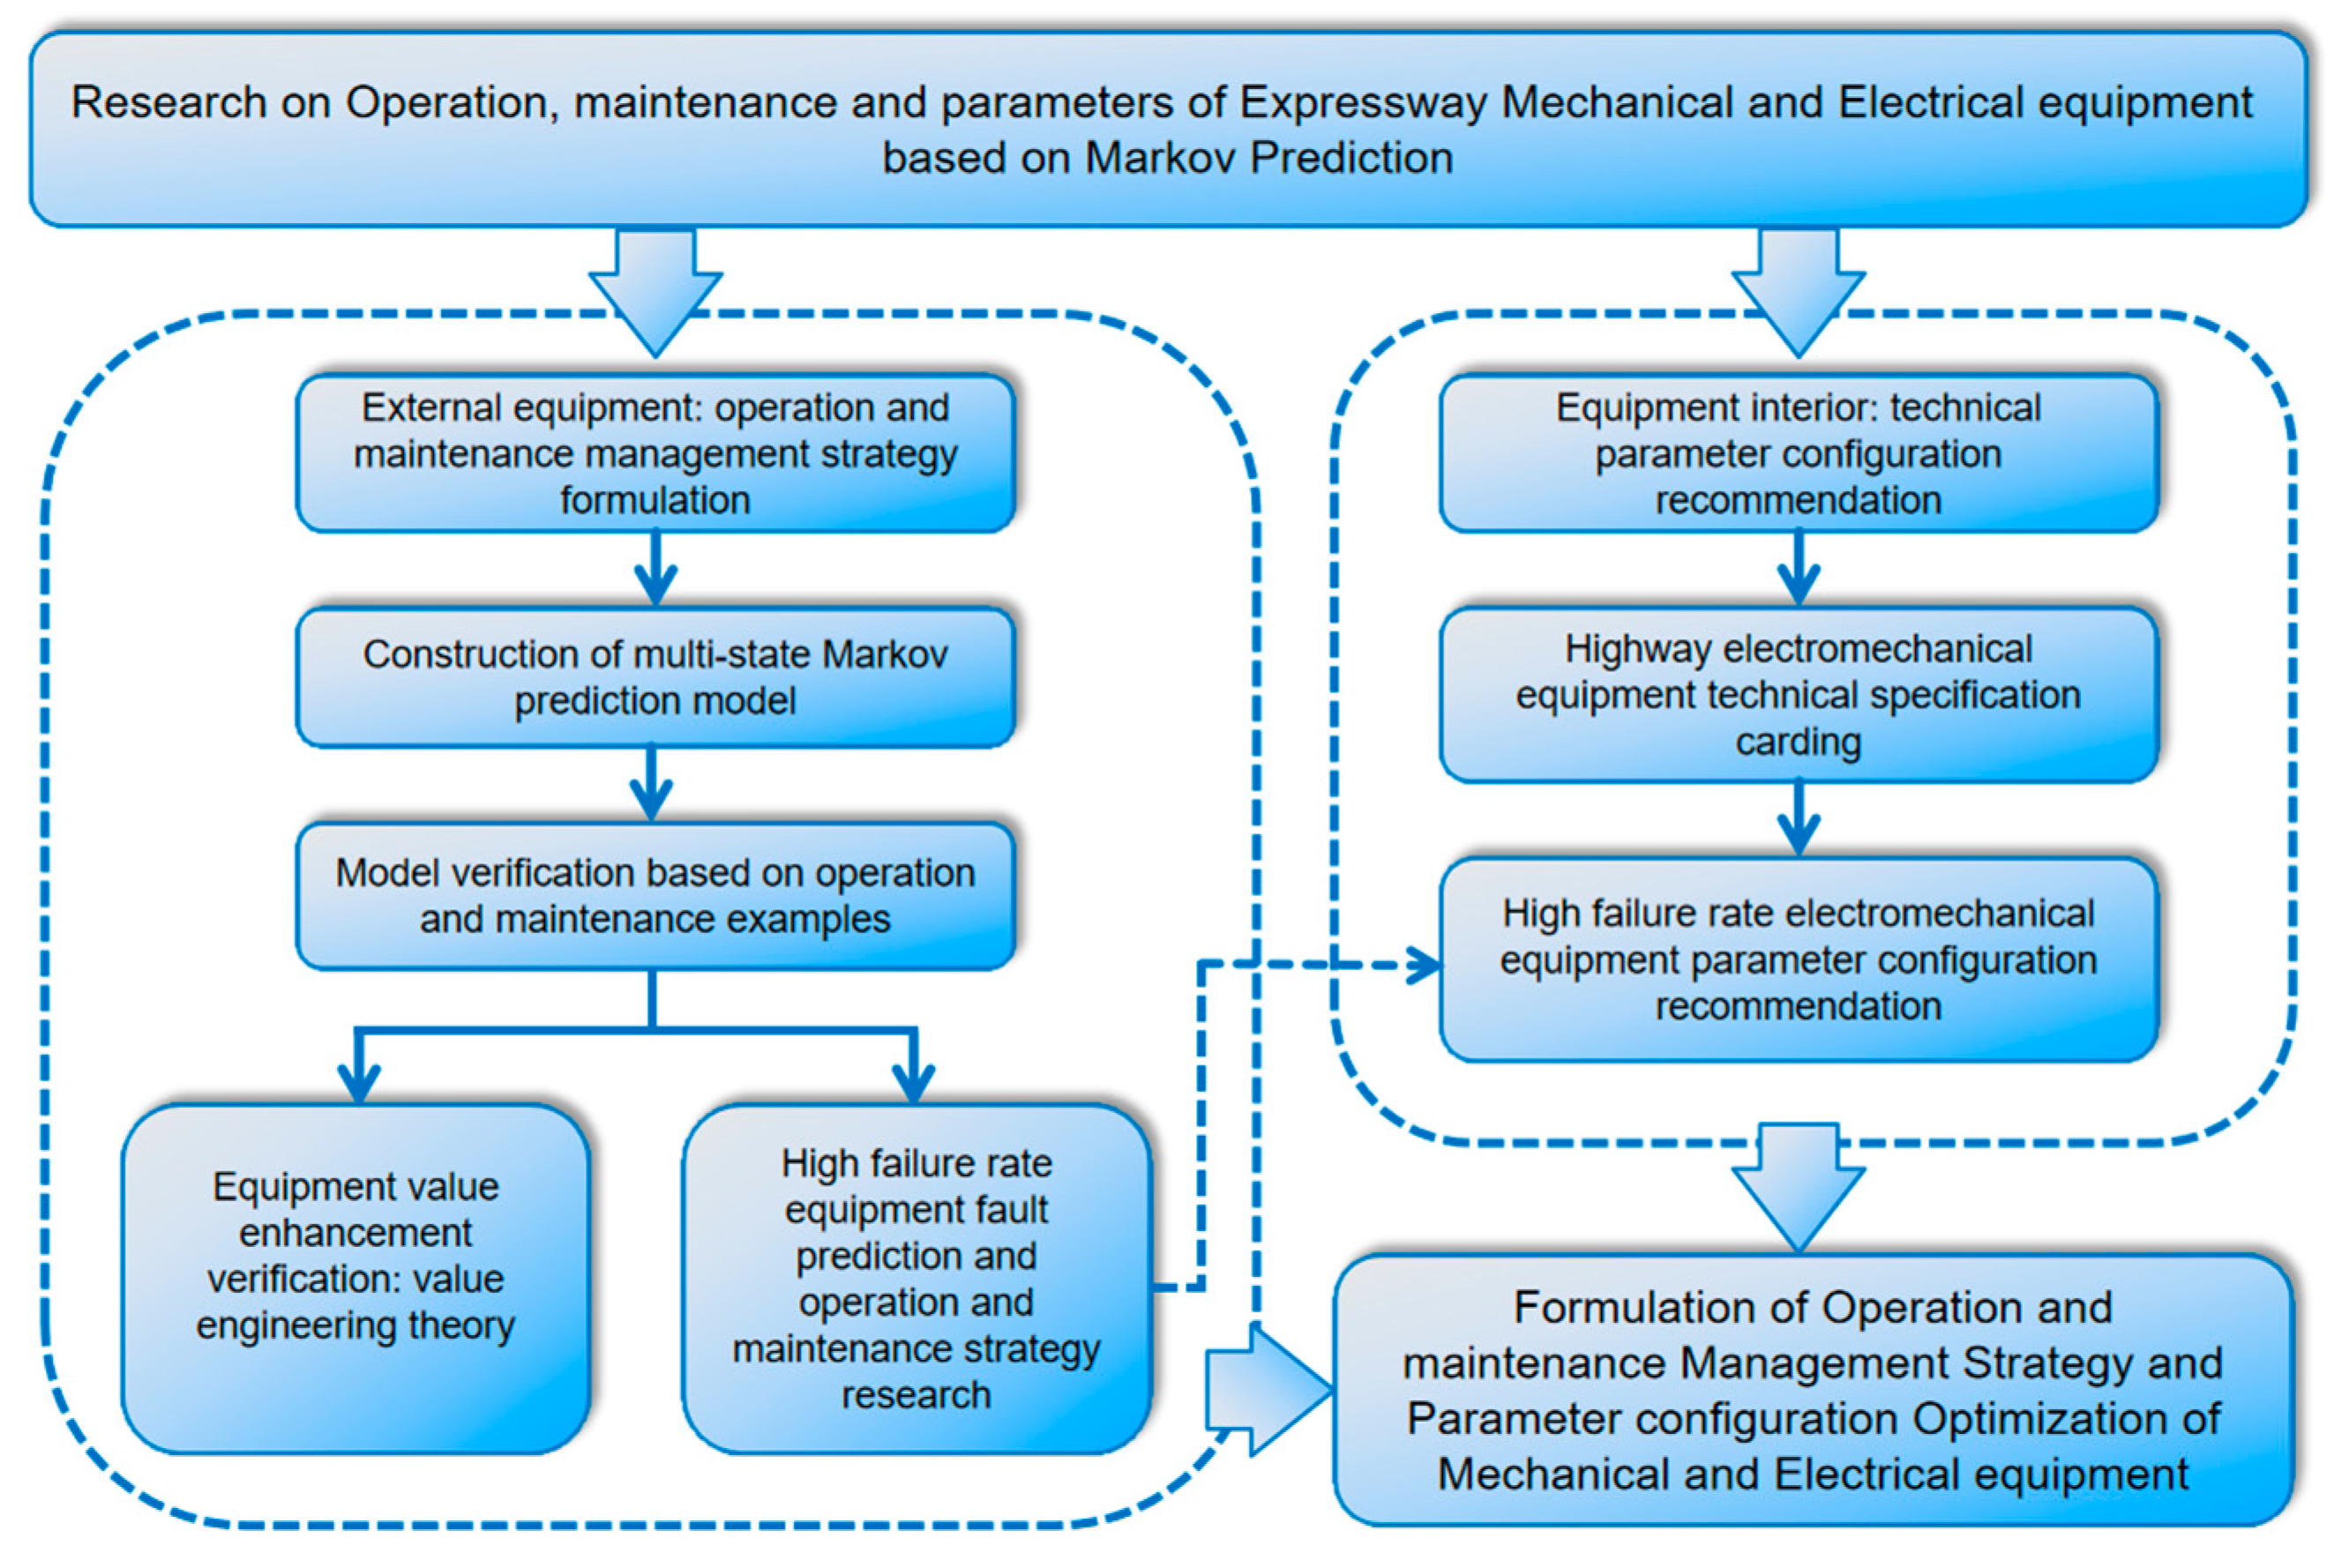
2. Research Methodology

2.1. Multistate Markov Chain Model

A Markov chain is a discrete event random process that has no memory. The future state depends only on the current state and can be predicted only by the current state. The Markov chain plays a vital role in many fields, such as industry, finance, social science, and communication. Its application value is significant, and it supports the development of various fields. This study first discusses the basic theory of the Markov chain. Then, a Markov fault prediction model of a multistate electromechanical system considering maintenance is constructed based on this theory.

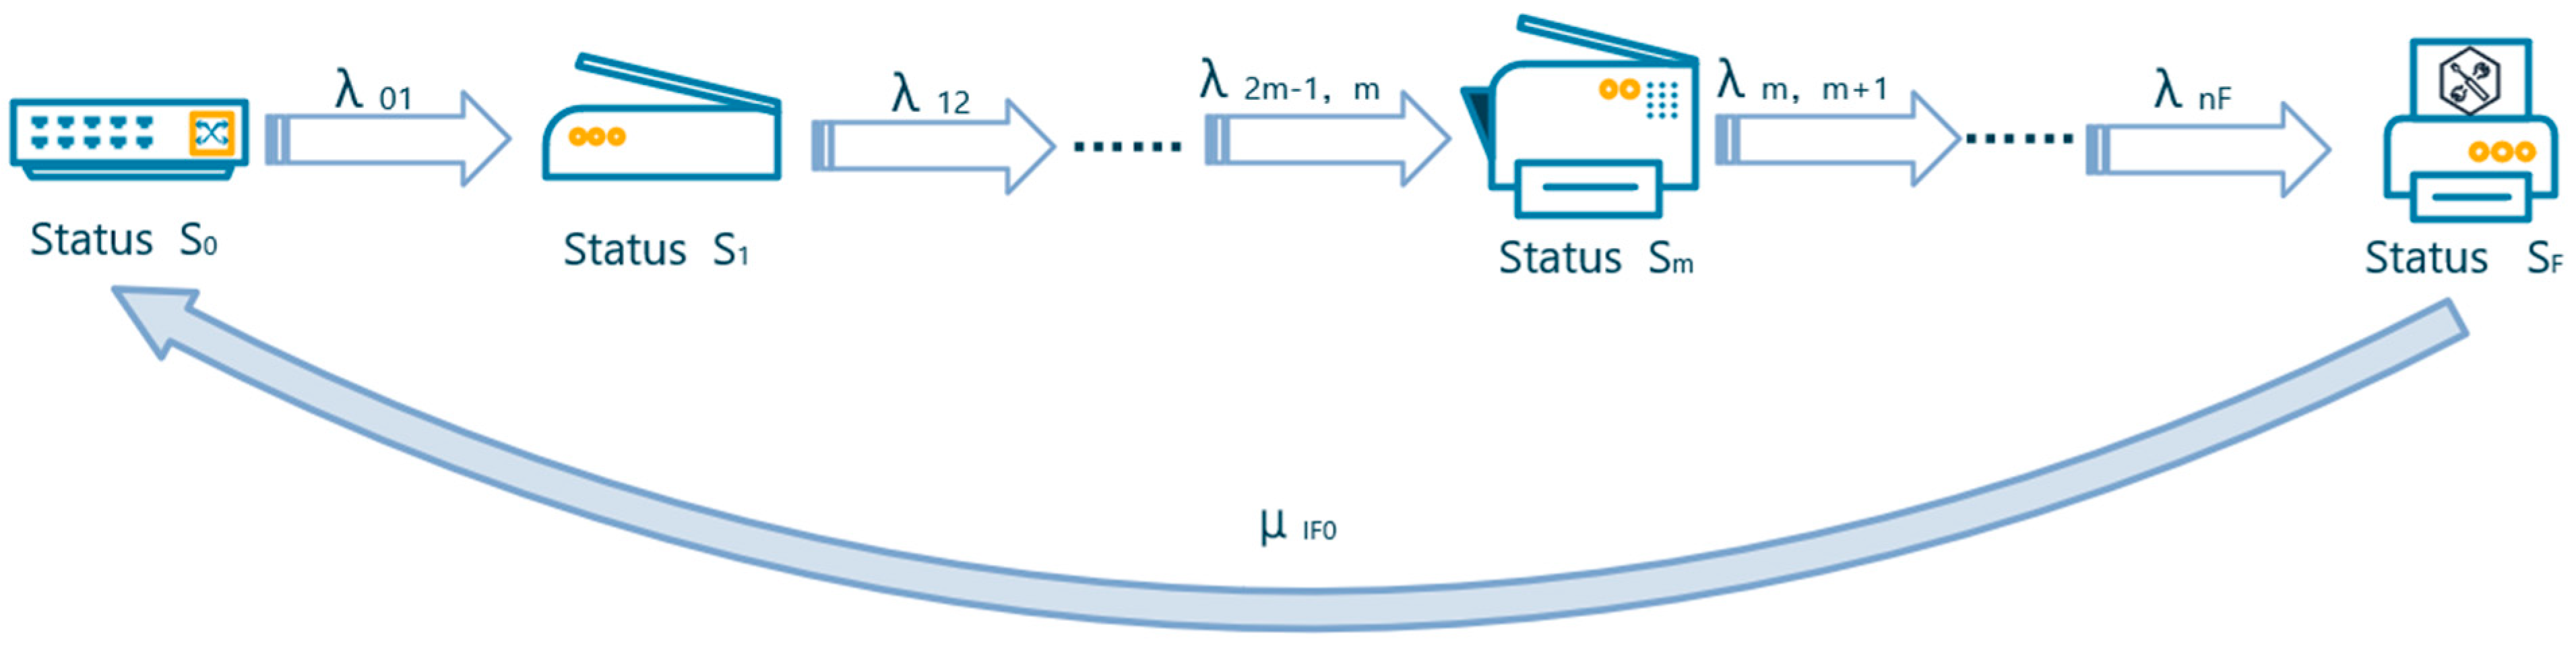
2.1.1. Conceptual Description of the Markov Chain

The discrete state space E = S 1 , S 2 , S 3 , and the random process X t / X t E , t > 0 on the discrete time parameters 0 t 1 < t 2 < t 3 < < t n exist at any time. From the definition of conditional probability, the state probability t n at different times can be obtained. The specific formula is expressed in Formula (1).
P X t n / X t 1 X t t 1 = S n X t 1 = S 1 X t t 1 = S n 1
If the random process is consistent with Formula (2), then the random process accords with the characteristic of no memory, and the random process is called a Markov chain.
P X t n / X t 1 X t t 1 = P X t 1 = X t n / X t t 1
Assuming that the stochastic process is a homogeneous Markov process (3), the state statistics of the Markov chain determine the conditional probability P i j Δ t , and P i j Δ t is the conditional probability of the transition from state S i to state S j in Δ t . The determination of conditional probability is one of the important links in the application of Markov chain theory.
P X t + Δ t = S j / X t = S i = P X Δ t = S j / X 0 = S i = P i j Δ t
For the state space composed of n states with the same time interval of t 1 , t 2 , t 3 , t n , the state transition probability can be expressed in the form of a matrix, as shown in Formula (4).
P = p ij = p 11 p 12 p 1 n p 21 p 22 p 2 n p n 1 p n 2 p nn , P i j 0 , j = 1 n P i j = 1 ;
Therefore, the state transition probability matrix P that meets the precision requirements can be obtained by collecting the state transition data between S m and S m + 1 . At the same time, whenever a set of data samples is added, the probability value of only one row of matrix P will change, and the number of rows corresponds to the state of the system at the time of t m . Theoretically, the statistical value of matrix P will gradually approach its real value when the number of samples tends to infinity.

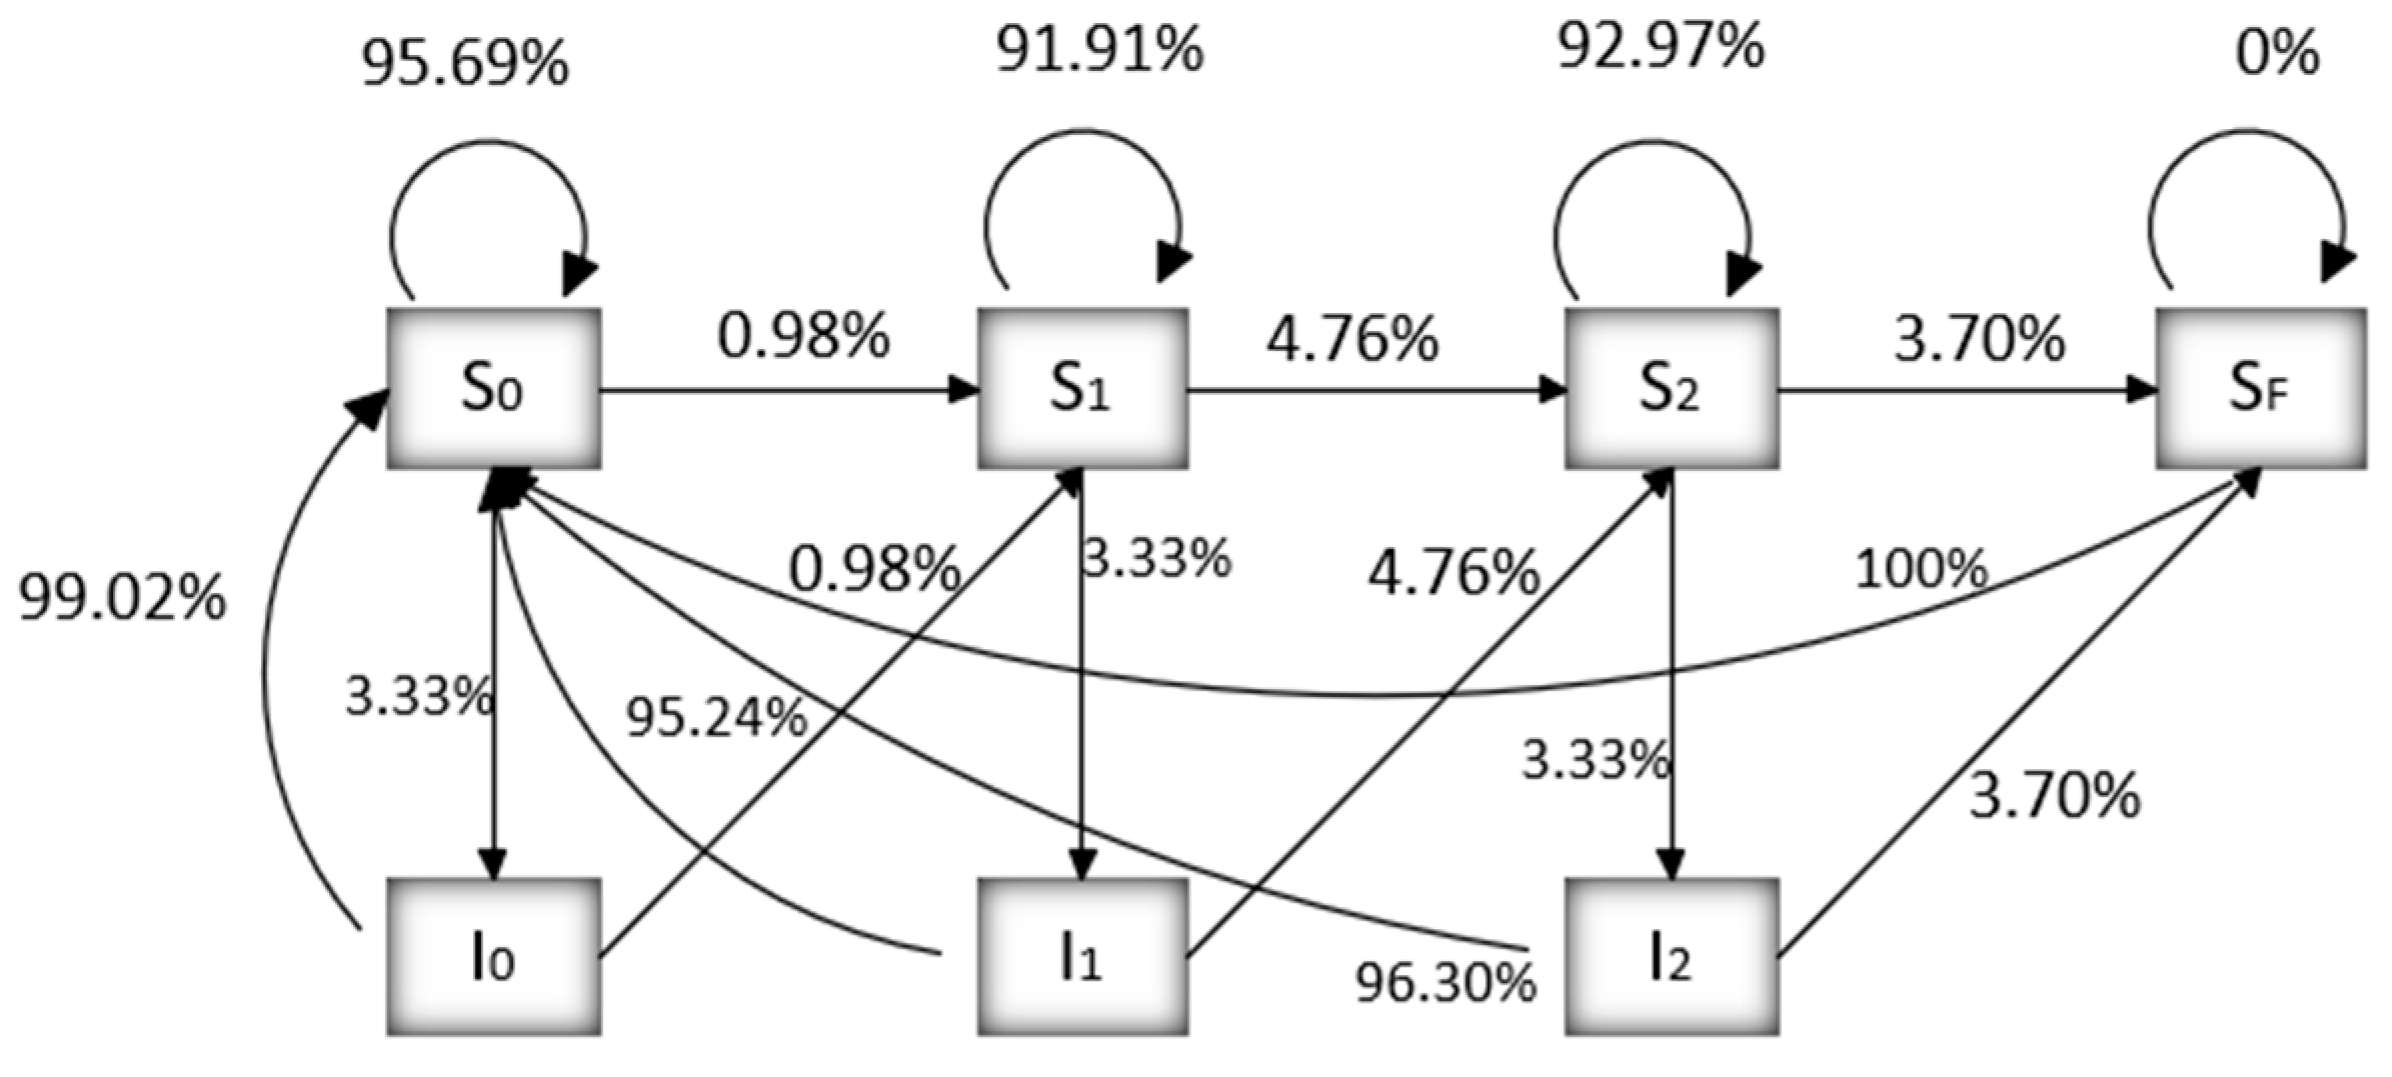
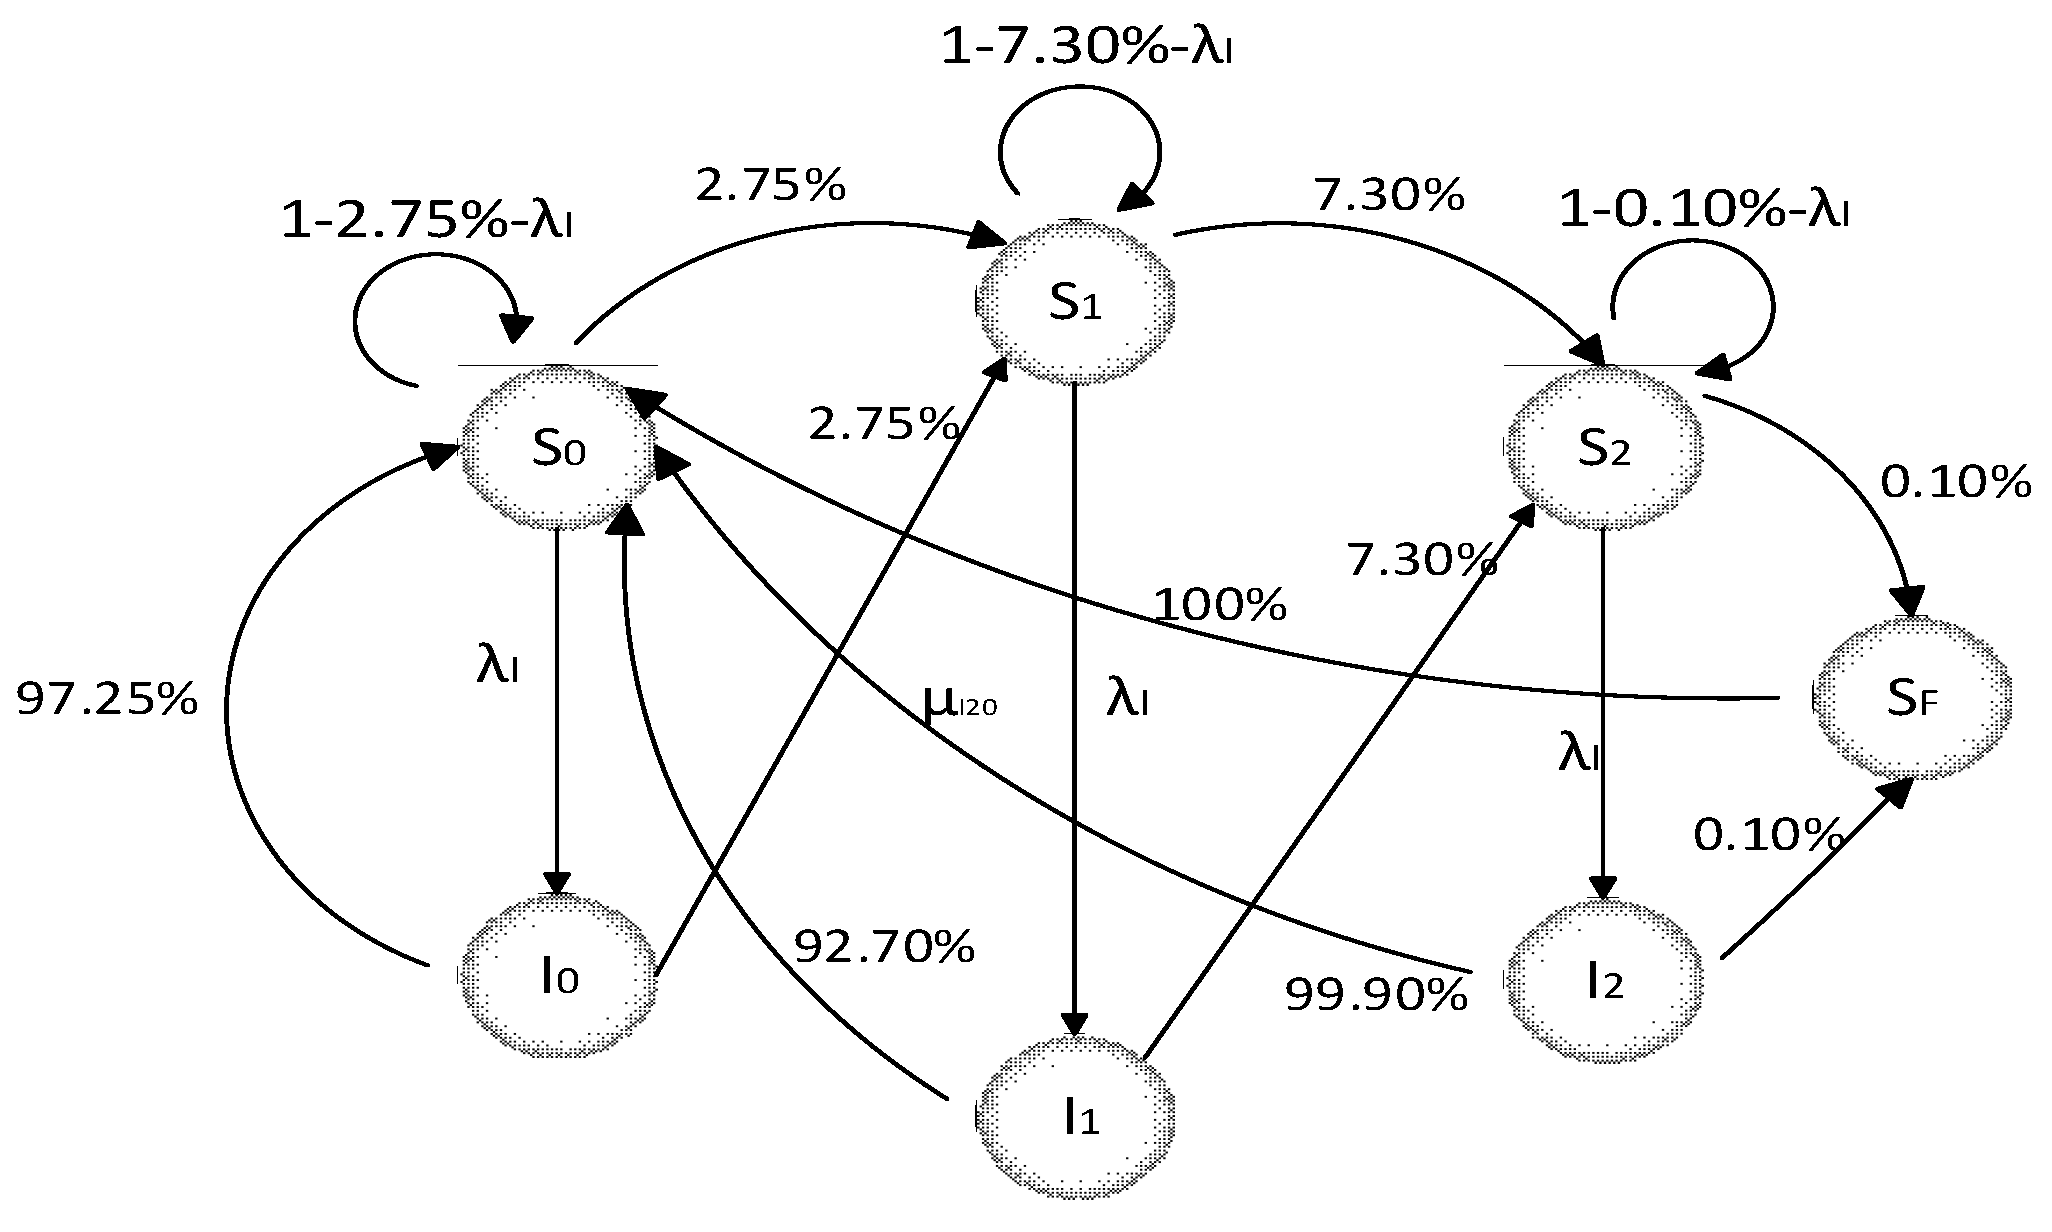
2.1.2. Multistate Markov Chain Model of Electromechanical Systems

The Markov chain, as a mathematical method, can play a role in equipment fault prediction and maintenance planning [23]. The key is to describe the transition between states and its corresponding probability [24]. In this study, the basic process of the Markov chain is applied to the field of highway mechanical and electrical equipment management, and the equipment state is divided into normal operation state, slight fault state, general fault state, and serious fault state. By considering the situation of daily maintenance and analyzing the transfer probability between equipment states, a Markov fault prediction model of multistate electromechanical systems, considering maintenance, is proposed. This model is used to analyze the probability of occurrence in various states of the electromechanical system in the future and to propose maintenance strategies.
In the fault prediction of the mechanical and electrical equipment of expressways in the outer field, the Markov model of regular operation and faults can be used to simulate the operation process of the highways’ mechanical and electrical equipment. This model is shown in Figure 2, where S 0 represents the normal running state of the equipment; S F represents the failure status of the equipment; and λ and μ represent the failure rate and repair completion rate of the equipment, respectively.
According to the abovementioned model, the fundamental failure rate of the electromechanical system can be calculated. However, the process of operation and maintenance of highway mechanical and electrical equipment is not limited to simple regular operation and fault state. It may include parts maintenance (such as minor failure), overall equipment replacement (such as severe failure), and other situations. This study extends the Markov chain model of two basic states to a multistate model, as shown in Figure 3, to better reflect the operation and maintenance status of highway mechanical and electrical equipment. In the absence of any maintenance policy, the equipment state will follow the Markov chain transfer from S 0 to S F until a severe failure occurs; that is, it enters the S F state. Measures such as maintenance and replacement are needed to restore the equipment to its intact state, S 0 .
In Figure 4, S 0 represents the normal state of electromechanical equipment, S 1 and S 2 represent the slight and general fault states of electromechanical equipment, and S F represents the serious fault state of highway electromechanical equipment, which requires the replacement of the main parts of the faulty equipment or the replacement of the entire equipment to restore the regular operation of the electromechanical system. I 0 , I 1 , and I 2 represent the equipment in the state of inspection. In addition, in the state classification of equipment faults, safety elements need to be put in the first place, and if equipment failures can affect highway traffic safety, then no matter what state the equipment is in, it should be regarded as a serious fault state, so as to warn the staff to deal with it immediately. Furthermore, λ 01 , λ 12 , λ 2 F , λ I , μ I 00 , μ I 10 , μ I 20 , and μ I F 0 are the state transfer rates of mechanical and electrical equipment. This study assumes that two kinds of maintenance methods are adopted, minor maintenance and deep maintenance. The process from I 1 to S 0 is the process of minor maintenance, and μ I 10 represents the completion rate of minor maintenance. The process from I 2 to S 0 is the process of deep maintenance, and μ I 20 represents the completion rate of deep maintenance.
Under the setting of this multistate Markov model, the state transfer process of highway mechanical and electrical equipment during operation can be described as follows: maintenance personnel regularly inspect the mechanical and electrical equipment according to the frequency of λ I . If the equipment is found to be as expected, it will not be overhauled. If the equipment is in the abnormal state S 1 , then slight maintenance measures will be taken to make the equipment return to the normal state. If the equipment is in the serious fault state S 2 , then deep maintenance measures will be taken to make the equipment return to the normal state. After considering the maintenance strategy, the time for the equipment to reach the serious fault state will be delayed, and the reliability of all electromechanical equipment will be improved to a certain extent.
P = 1 λ 01 + λ I λ 01 0 0 λ I 0 0 0 1 λ 12 + λ I λ 12 0 0 λ I 0 0 0 1 λ 2 F + λ I λ 2 F 0 0 λ I 0 0 0 1 μ F 0 0 0 0 μ I 00 λ 01 0 0 1 λ 01 + μ I 00 0 0 μ I 10 0 λ 12 0 0 1 λ 12 + μ I 10 0 μ I 20 0 0 λ 2 F 0 0 1 λ 2 F + μ I 20
Based on the state transition principle of the Markov chain model, the state transition probability matrix P can be obtained, as shown in Formula (5). The state probability of an electromechanical system is written as a column vector X = X 0 , X 1 , X 2 , X F , X I 0 , X I 1 , X I 2 . It is combined with the Markov state transition matrix, operation and maintenance records analysis, and failure rate data. The initial failure rate and transfer matrix are obtained by solving the MATLAB program, which can be used to determine the occurrence probability of each equipment state.

2.2. Value Engineering Theory

In this study, in order to verify the effectiveness of the operation and maintenance strategy in promoting the value of equipment, according to the value engineering theory [25,26] combined with the established optimal maintenance strategy, and comprehensively considering the cost factors such as time cost and human resources involved in maintenance operations, an accurate calculation is carried out, and the value coefficient of the equipment is obtained. In mechanical and electrical projects, the value of highway mechanical and electrical equipment is usually regarded as one of the important means to evaluate the performance-to-price ratio of mechanical and electrical equipment. Specifically, the value coefficient of the target is determined as the inverse relationship between function consumption and life cycle cost. This method can obtain an objective performance-to-price index to guide project decision making and cost control through the comprehensive analysis of the function consumption and operation and maintenance cost using the basic formula of value engineering (6):
V = F C
In the formula, v is value, meaning value coefficient; F is function, meaning function coefficient; C is cost, meaning cost coefficient.
The core feature of value engineering theory is to pursue the maximum function or economic benefit with as little cost as possible. As the function ratio to target cost, the value coefficient of mechanical and electrical equipment can effectively reflect its target value. Take the typical highway mechanical and electrical equipment on the market. The core criterion of its importance and value coefficient lies in whether it has high quality and low price characteristics. “High quality” mainly focuses on the functional attributes of the equipment, that is, whether it can meet the expected use needs and performance standards, while “low price” mainly focuses on the cost composition of the equipment, including its production costs, label costs, and other economic costs. Simultaneously, in the daily operation and maintenance of the mechanical and electrical system, we must pursue the lowest possible maintenance cost to ensure the system’s stable operation and improve overall economic and operational benefits.

3. Case-Based Model Validation

The research must first verify its effectiveness for the multistate Markov fault prediction model considering maintenance factors. This section will select the historical operation and maintenance data of the corresponding sections and make a holistic analysis of the running state of the expressway electromechanical system, which can be used to preliminarily determine that the application of the model can effectively improve the expected state probability of the overall operation of the electromechanical system.

3.1. Data Carding

This study predicts the overall fault condition of the electromechanical system based on the electromechanical operation and maintenance work order summary account of the Urumqi Expressway on Line G3003 in Xinjiang in October 2023, which shows the effectiveness of the multistate Markov chain model considering maintenance.
A total of 4289 mechanical and electrical equipment sets are present in the Urumqi Round City Expressway (East) and Xiaocaohu Urumqi Expressway (G30). By combing the data in the fault maintenance list of the abovementioned sections in October, 4289 valid fault operation and maintenance records are obtained, including 42 slight fault status S 1 data, 81 serious fault status S 2 data, and 8 equipment or parts status S F data. Maintenance record data are shown in Table 1.

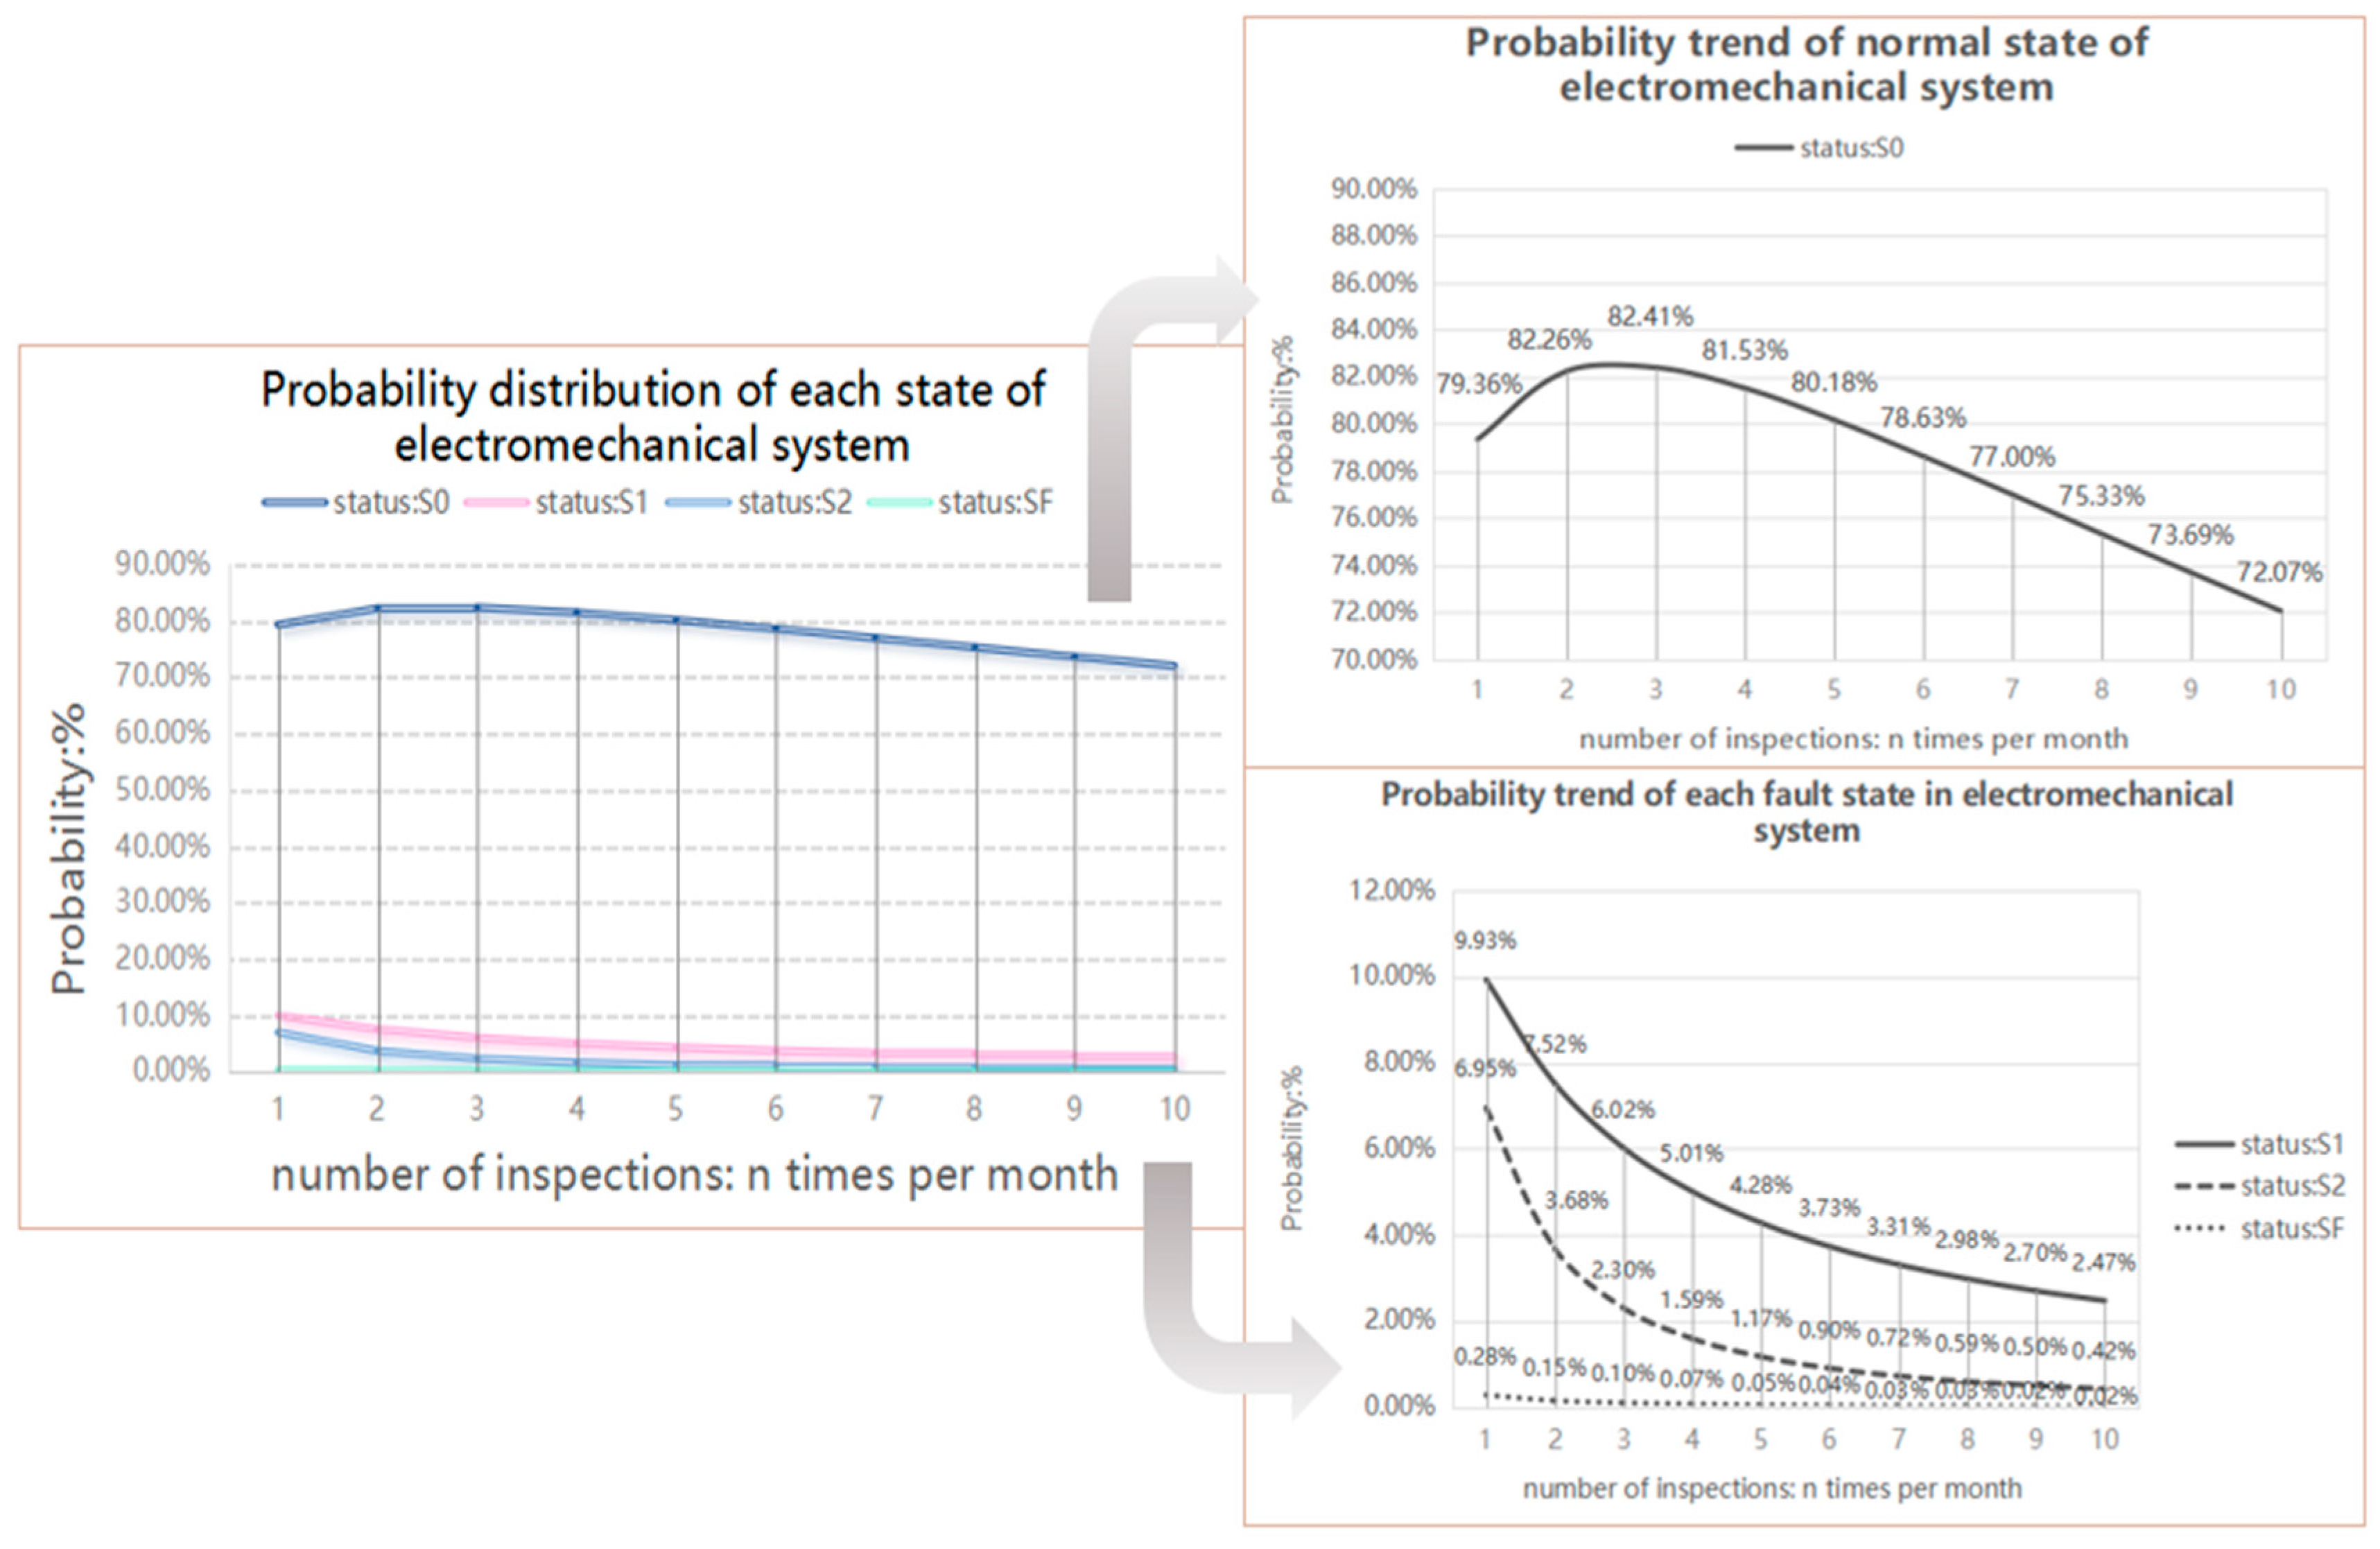
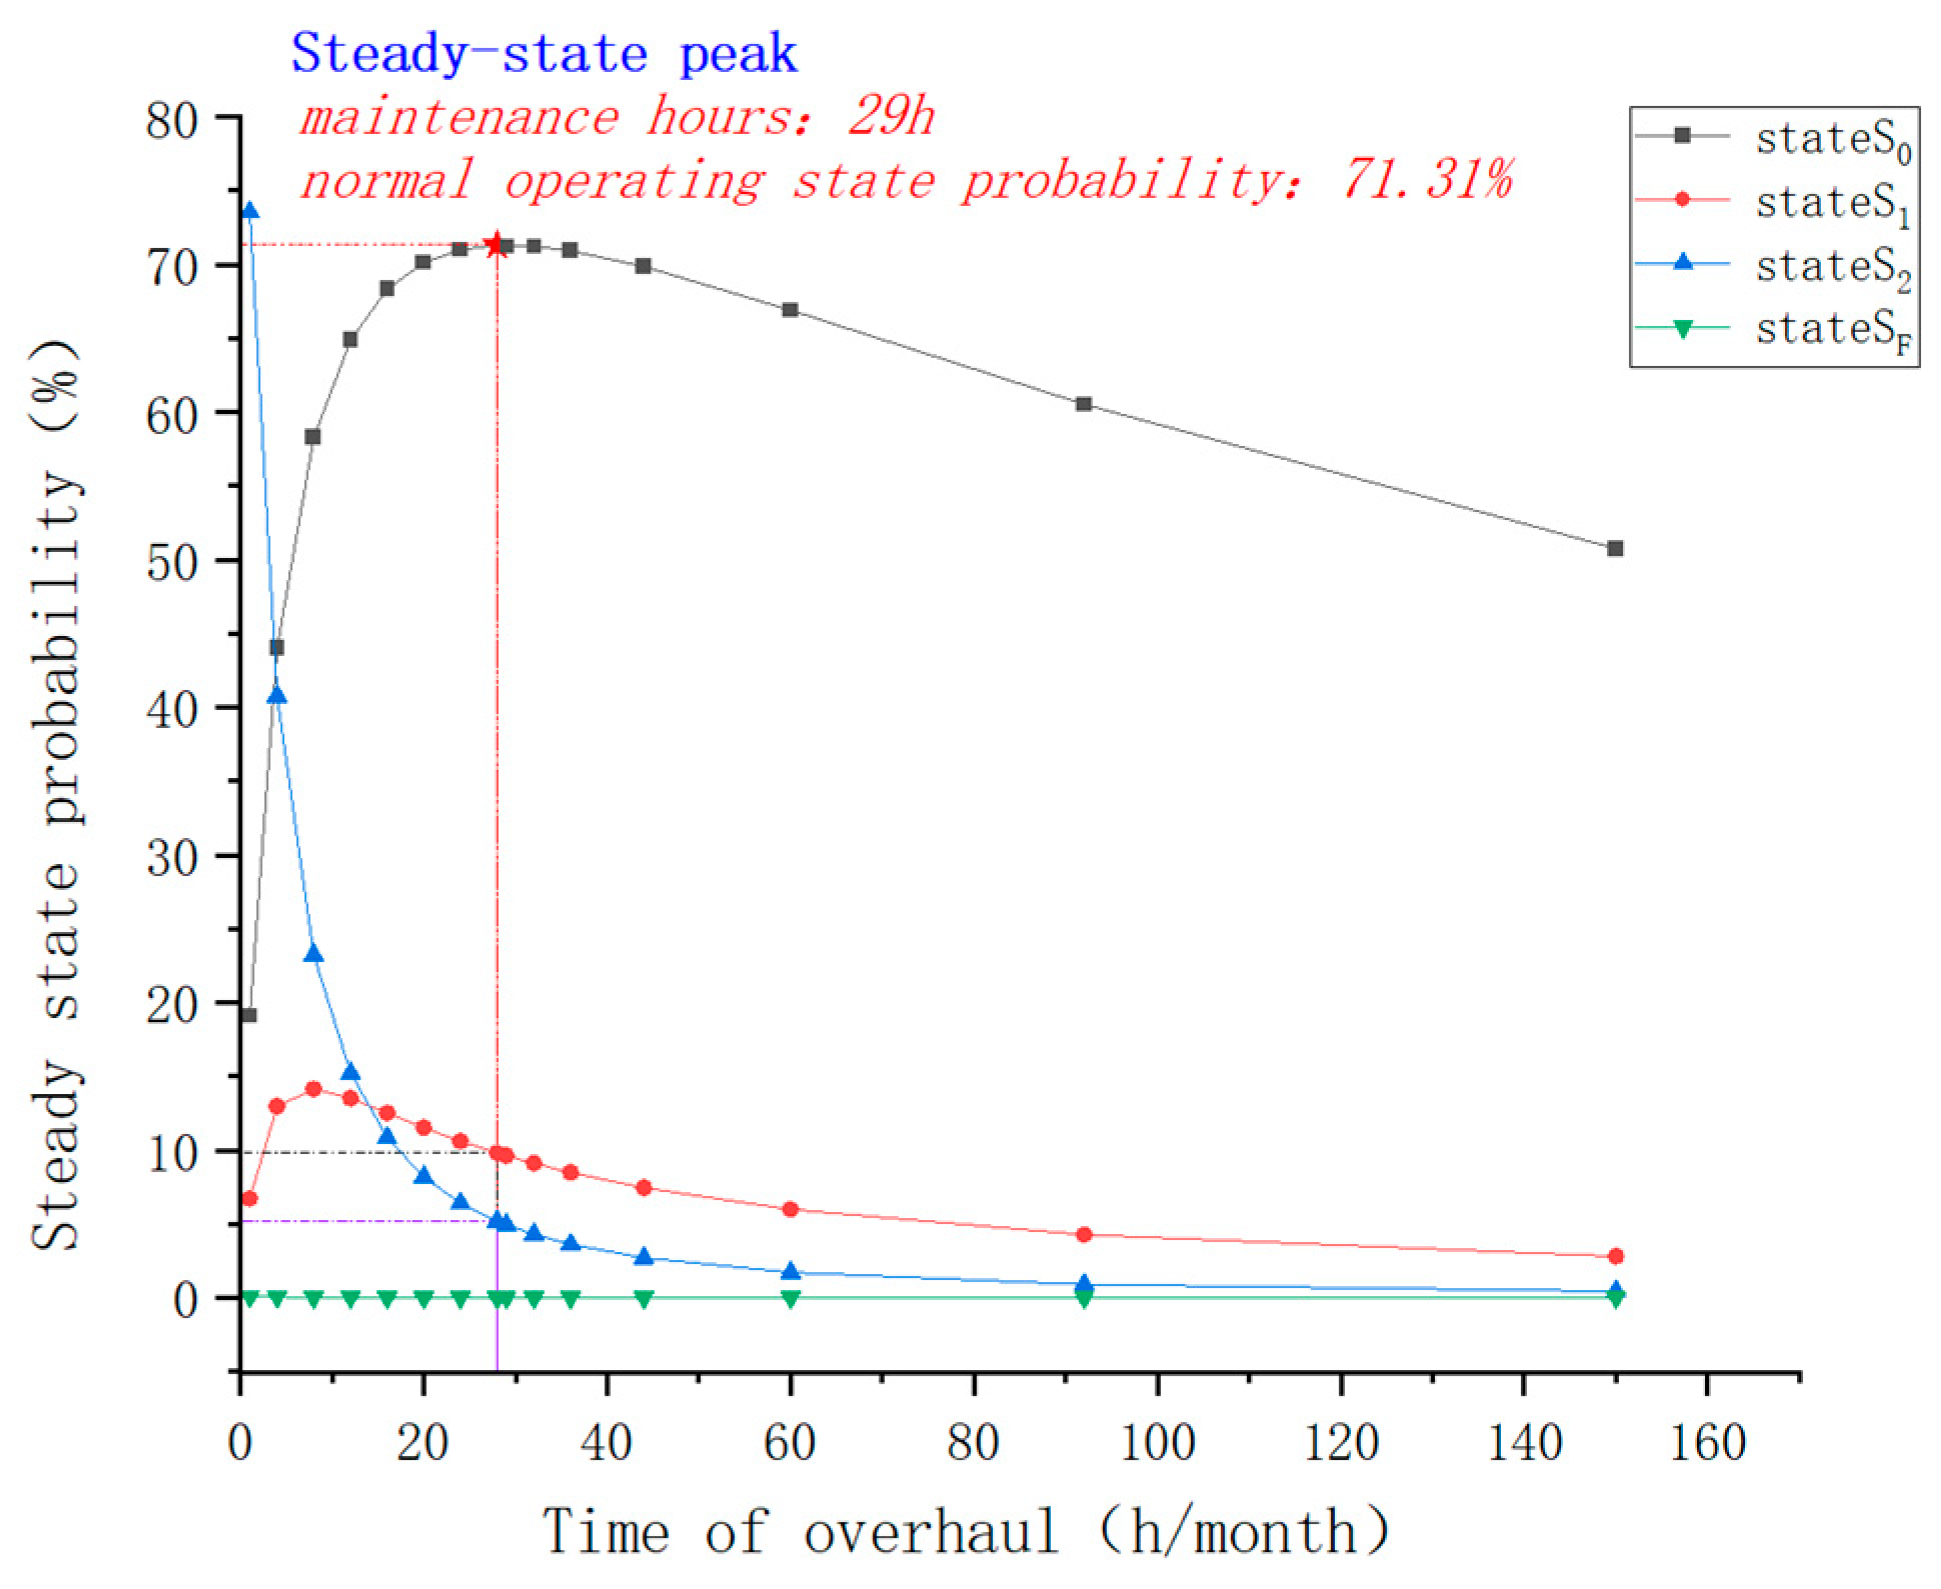
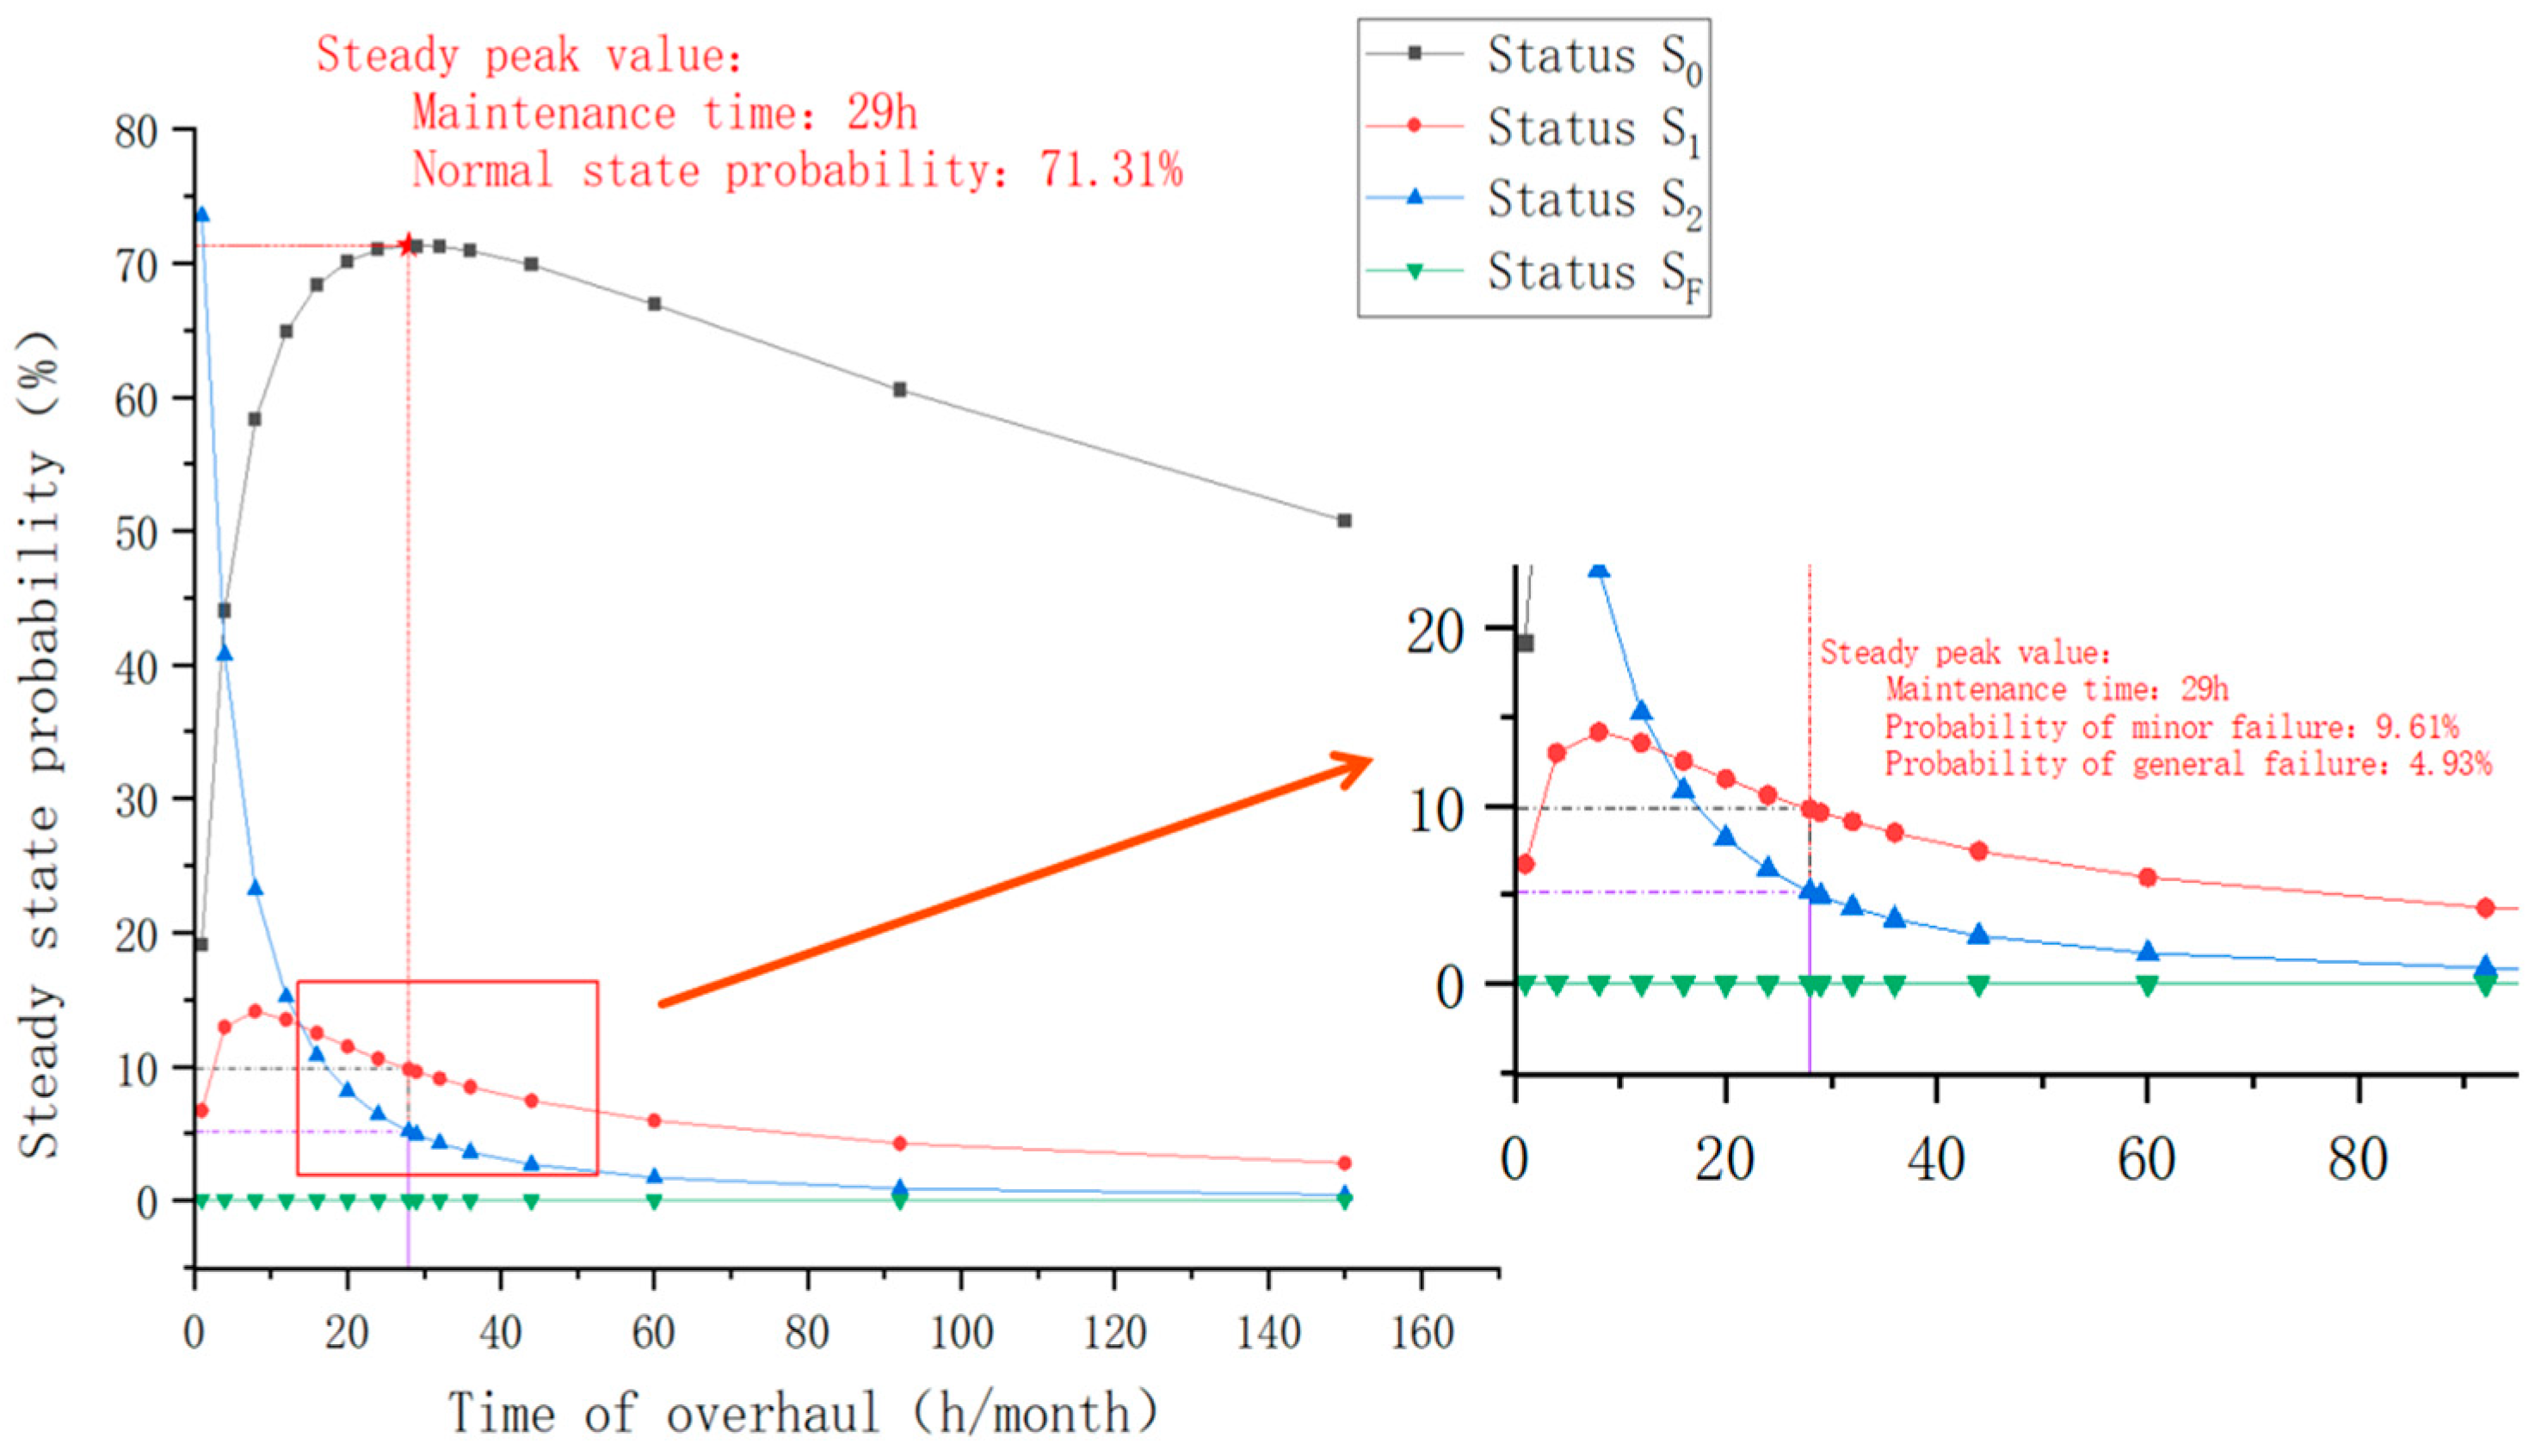
3.2. Running State Prediction

After combing the overall data of the two road sections, the data can be imported into the model to predict the state occurrence probability and formulate the overall operation and maintenance strategy.
By analyzing the number of times each degradation state occurs and the completion of manual operation and maintenance, and considering the maintenance code specific to the mechanical and electrical facilities industry, the initial state transfer probability of the electromechanical system can be calculated as λ 01 = 0.98 % , λ 12 = 4.76 % , λ 2 F = 3.70 % . The repair completion rates of minor fault state S 0 , general fault state S 2 , and serious fault state S F are 95.24%, 96.30%, and 100%, respectively.
First, the study calculates the situation when the maintenance strategy is not considered. In this case, the probability of I 0 , I 1 , and I 2 is 0, the total number of known devices is 4289, and the number of fault data is 131. Combined with the numbers of slight fault state, general fault state, and serious fault state in Table 1, the steady-state probability of each state of electromechanical system follows Equation (7):
X = 0.9695 , 0.0098 , 0.0189 , 0.0018 , 0 , 0 , 0
Combined with Figure 4 and Table 1, the state transition matrix P can be obtained, as shown in matrix (8).
P = 0.9902 0.0098 0 0 0 0 0 0 0.9524 0.0476 0 0 0 0 0 0 0.9630 0.0370 0 0 0 0 0 0 0 0 0 1 0.9902 0.0098 0 0 0 0 0 0.9524 0 0.0476 0 0 0 0 0.9630 0 0 0.0370 0 0 0
Taking Formula (7) as the initial state and iterating Formula (8) to the steady state with MATLAB R2022a, the steady-state probability calculation results of each state of the electromechanical system without considering overmaintenance strategy can be obtained, as shown in Equation (9).
Π = 0.6846 , 0.1049 , 0.1813 , 0.0070 , 0 , 0 , 0
Then, the situation considering the maintenance strategy is calculated. If the initial frequency of manual inspection in the maintenance strategy is set to 1/month (the working time of a working day is 8 h, and a month is calculated according to 30 working days) and analyzed, then the initial state transition matrix (10) of the electromechanical system can be obtained. The state transition model of the multistate Markov process considering maintenance is shown in Figure 5.
P = 0.9569 0.0153 0 0 0.0333 0 0 0 0.9191 0.0526 0 0 0.0333 0 0 0 0.9297 0.0555 0 0 0.0333 0 0 0 0 0 0 1 0.9847 0.0153 0 0 0 0 0 0.9474 0 0.0526 0 0 0 0 0.9445 0 0 0.0555 0 0 0
By extracting the state transition matrix of the electromechanical system and the probability initial values of each state into MATLAB R2022a to iteratively calculate to the steady state, the limit distribution of the Markov chain fault prediction model considering maintenance can be obtained, as shown in Equation (11):
Π = 0.7936 , 0.0993 , 0.0695 , 0.0028 , 0.0264 , 0.0033 , 0.0051
In the operation and maintenance process of the electromechanical system, regular manual inspection can help ensure the normal operation of the equipment, reduce maintenance costs, improve production efficiency, and increase the life of the equipment. Thus, this study gradually increases the frequency of manual inspection of the electromechanical system to formulate a better operation strategy. The aim is to ensure that all kinds of equipment for the electromechanical system can be kept better in the normal working state to improve the equipment’s reliability and the electromechanical system’s stability.
After the frequency adjustment and calculation of manual inspection, this study proposes to gradually increase the manual inspection frequency of the expressway electromechanical system from once a month to 10 times a month, and different frequencies are introduced into the multistate Markov model for testing. The stationary distribution of the electromechanical system’s corresponding multistate Markov fault state is summarized in Table 2, and the trend change in the corresponding state is shown in Figure 6.
Figure 6 shows that the probability of mild ( S 1 ), general ( S 2 ), and severe ( S F ) failure statuses gradually decreases with the increase in maintenance frequency and the rise in inspection time. The occurrence probability of a normal operation state ( S 0 ) does not maintain a steady upward trend when the inspection frequency is set to three times per month. The occurrence probability of the normal state ( S 0 ) reaches a peak of 82.41%, an increase of 13.95% compared with 68.46% of the expected state probability of the electromechanical system under manual intervention.
In summary, the equipment inspection requires a lot of human and material resources. If the maintenance frequency is too high, the inspection cost, including workforce, time, and maintenance costs, will increase, and the low inspection frequency may affect the system’s stability. By optimizing the inspection frequency and keeping it within an appropriate range, the cost can be reduced while ensuring the regular operation of the electromechanical system. Because of the three fault states of S 1 , S 2 , and S F , three times a month, that is, three working days a month, can be taken to conduct a comprehensive investigation of the electromechanical system. This scheme not only can effectively ensure the normal operation rate of the electromechanical system but also save a certain amount of resource investment and maximize benefits.

4. Formulation of an Operation and Maintenance Strategy for Equipment with a High Failure Rate

In the previous section, through the systematic prediction and analysis of the operation and maintenance data of highway mechanical and electrical equipment in two specific sections in Xinjiang, we preliminarily verified the effectiveness of the Markov chain’s basic theory in optimizing the electromechanical system’s maintenance strategy. However, given the significant heterogeneity of all kinds of equipment in highway electromechanical systems in terms of function, operating environment, and application scene, there is still much room for improvement in the overall fault prediction and analysis of expressway electromechanical equipment in the previous section. Therefore, in this section, the research focuses on the equipment with a high failure rate by predicting its failure probability and putting forward the corresponding operation and maintenance strategy to improve further the reliability of the equipment and prolong its service life.

4.1. Data Processing and Fault Prediction

There are 5196 sets of mechanical and electrical equipment in three sections of the Xinjiang expressway: Urumqi Round City Expressway (East), Xiaocaohu Urumqi Expressway (G30), and the Jingxin Expressway Dahuangshan–Urumqi Section Reconstruction and Expansion Project (G7). Combining the operation and maintenance data of the above sections in October 2023, 5196 effective fault operation and maintenance records are obtained. In this record, the equipment failure of the expressway electromechanical system is mainly shown in the related equipment of the toll collection system and is summarized in Table 3.
The operation and maintenance records show that video surveillance equipment, weighing equipment, automatic railing machines, and license plate recognition instruments have a higher failure rate in the two sections. Based on this, this section takes video surveillance as an example to explore its optimal external operation and maintenance strategy.

4.1.1. Data Carding and Preprocessing

In the three sections of Urumqi Round City Expressway (East) (G3003), Xiaocaohu Urumqi Expressway (G30), and the reconstruction and expansion project of Dahuangshan–Urumqi Section of Jingxin Expressway (G7), there are 5196 sets of expressway mechanical and electrical equipment. Among them are 981 pieces of video surveillance equipment, and the amount of fault recording data related to this kind of equipment is 29. In the above three road sections, the fault recording data are as high as 17.6%, which belongs to the equipment with high fault incidence.
Among these kinds of equipment’s fault records are 27 minor fault status records, 2 general fault status records, and 0 serious fault status records, of which 2 minor fault repair works have not been completed. In addition, if the equipment failure state is not transferred to a more serious state, the transfer rate is set to 0.1%, the corresponding maintenance state transfer rate is 0.1%, and the repair completion rate is 99.9%. In the case of severe failure, the repair completion rate is 100%, which indicates that the equipment is replaced or the core components are replaced to ensure that the equipment is completely repaired.
Based on the above data, the initial state transition probability of video surveillance equipment is λ 01 = 2.75 % , λ 12 = 7.40 % , λ 2 F = 0.10 % . The repair completion rate of the minor fault state S 1 is 92.59%, the general fault state S 2 is 99.90%, and the serious fault state S F is 100%.
As in Section 3.2, combined with the number of equipment items, the amount of fault data, and the state transfer rate in the selected section, the initial probability and transfer rate matrices of each state of the video surveillance equipment are shown in Equation (12) and matrix (13):
X = 0.8985 , 0.0275 , 0.0730 , 0.0010 , 0 , 0 , 0
P = 0.9725 0.0275 0 0 0 0 0 0 0.9270 0.0730 0 0 0 0 0 0 0.9990 0.0010 0 0 0 1 0 0 0 0 0 0 0.9725 0.0275 0 0 0 0 0 0.9270 0 0.0730 0 0 0 0 0.9990 0 0 0.001 0 0 0

4.1.2. Operation and Maintenance Strategy Formulation

Taking Formula (12) as the initial state, Formula (13) is calculated with MATLAB R2022a to calculate the steady-state probability of each failure state of the video surveillance equipment without considering the overmaintenance strategy, as shown in Equation (14):
Π = 0.0346 , 0.0130 , 0.9514 , 0.0010 , 0 , 0 , 0
It can be seen that without implementing the maintenance strategy, only 3.46% of the video surveillance equipment in these sections can remain in a normal state over time. In comparison, 95.14% of the video surveillance equipment without regular maintenance will begin to have problems such as unstable signals, occasional stutters, and inability to transmit pictures, which will significantly affect the regular operation of the mechanical and electrical system and bring great trouble to the monitoring personnel.
The corresponding time and resources must be invested when considering the maintenance situation. Subject to the standard working hours system, an individual staff member’s total statutory working hours are approximately 176 h in a natural month. Video surveillance equipment can maintain the most efficient and regular operation by strictly following the maintenance strategy. This study adopts a step-by-step method, taking one person-hour (1 h) as the time unit and gradually increasing the frequency of maintenance until the most ideal maintenance measures are found to improve the operation efficiency of the equipment. According to different fault types and state changes, the video surveillance equipment’s initial fault transfer rate can be obtained, from the normal to the fault state. As shown in Figure 7, the corresponding maintenance strategy solution matrix (15) is written as follows:
P = 1 λ 01 + λ I 0.0275 0 0 λ I 0 0 0 1 λ 12 + λ I 0.073 0 0 λ I 0 0 0 1 λ 2 F + λ I 0.001 0 0 λ I 1 0 0 1 μ F 0 0 0 0 0.9725 0.0275 0 0 1 λ 01 + μ I 00 0 0 0.927 0 0.0730 0 0 1 λ 12 + μ I 10 0 0.999 0 0 0.001 0 0 1 λ 2 F + μ I 20
The ratio of monthly maintenance hours to monthly legal working hours is set as the inspection frequency of the maintenance strategy. Among them, the daily legal working hours T l e g a l is calculated according to the “measures for the preparation of budgetary estimates for Highway Construction projects” (JTG3830-2018), and the number of monthly working days is 22. That is,
λ I = t T l e g a l
By substituting Formula (16) into the strategic maintenance matrix of the video surveillance equipment and solving its steady-state value, it can be concluded that when the monthly maintenance time is 29 person-hours, that is, when the maintenance frequency is 0.1648, the standard running state value of the long-term operation of the video surveillance equipment reaches the peak, which is 71.31%. The trend of each state of this kind of equipment changing with the maintenance time is shown in Figure 8.
The state transition matrix under the inspection policy is shown in Table 4.
The steady-state probability of each state under the maintenance strategy is as follows (Equation (17)):
Π = 0.7131 , 0.0961 , 0.0493 , 0.0010 , 0.1175 , 0.0158 , 0.0081
Figure 8 shows that, in theory, when implementing the strategy of 29 person-hours per month for video surveillance equipment, not only can the operation stability of the video surveillance equipment reach the highest level under long-term operation, but also the probability of general failure (state S 2 ) of this kind of equipment can be significantly reduced. By reducing in-depth maintenance measures, the maintenance cost of video surveillance equipment is significantly saved, thus saving the cost of operation and maintenance of this kind of equipment and increasing the value of the equipment.

4.2. Verification of Equipment Value Improvement

In the previous section, this study obtained the external optimal operation and maintenance strategy, taking video surveillance as an example. This section introduces the theory of value engineering to verify the effectiveness of the operation and maintenance strategy to enhance the value of video surveillance equipment. The study comprehensively considers the cost factors such as time and human resources in the maintenance operation. The value coefficient of 10 sets of video surveillance equipment in the 3 sections involved in the study is calculated to verify the improvement of the value of this kind of equipment according to the basic formula of value engineering, V = F C . The research still takes video surveillance equipment as an example. It sets the function coefficient and cost coefficient of the equipment according to the corresponding national standards of the area where the electromechanical equipment belongs and the norms of the transportation and machinery industry to calculate the improvement in the value coefficient of the equipment before and after the implementation of the optimal operation and maintenance strategy and verifies the effectiveness of the strategy.

4.2.1. Function Coefficient

According to the Highway Engineering Budget quota (JTGT 3832-2018), the quota for the toll plaza camera is CNY 17094.02, which is set as the functional value generated during the specified service life of this kind of equipment, that is, Fair 17094.02.

4.2.2. Cost Coefficient

Assuming that the everyday operation service life of each set of equipment is 3 years, according to the “Highway Engineering Estimation Index” (JTG/T3821-2018) and “Highway Engineering Budget Quota” (JTG/T3832-2018), the manual maintenance cost incurred during maintenance is calculated at 106.28/person-day; the material fees and machinery and shift costs incurred during maintenance are shown in Table 5, in which minor and sporadic materials and small construction machinery are not all listed and are included in “fees for other materials” and “fees for the use of small machines and tools”, respectively. During the inspection and repair of the cameras in the toll plaza, it is necessary to arrange trucks within 4 t and hydraulic lifts within 300 kg to operate. According to the Highway Construction Machinery shift fee quota (JTG/T3833-2018), the cost for each shift of trucks within 4 t is CNY 29.28 per shift for hydraulic lifts within 79.56300 kg. Based on this, it can be calculated that the total cost of each working day for horizontal and vertical transportation is CNY 8.3 when overhauling the video surveillance equipment in the toll square.
According to the “Budget preparation method for Highway Construction projects” (JTG3830-2018), the working hours per comprehensive working day are calculated according to 8 h. Based on this, the minor maintenance cost ( c 1 ), the general maintenance cost ( c 2 ), and the deep maintenance cost ( c 3 ) are 13.28, 15.71, and 21.24, respectively. The cost of staffing and tool materials generated by the inspection strategy is the average value of the three maintenance modes, c I = 16.74 .

4.2.3. Value Coefficient Calculation

Assuming that the occurrence probability of each state of the camera in the toll square reaches a stable state after 3 years of service, the annual cost of not implementing the maintenance strategy can be calculated as C n = 130,812.83 , and the annual maintenance cost of implementing the maintenance strategy as C S = 18,725.39 . Then, the value coefficient of video surveillance equipment without the maintenance strategy is V n = 0.4356 , and the value coefficient when implementing the maintenance strategy is V S = 3.0429 . It can be seen that the value coefficient V S after adopting the maintenance strategy is much higher than that without the maintenance strategy V n . This shows that the maintenance strategy proposed in this study can effectively control the wear and fatigue of key components, slow down the speed of performance degradation, and significantly improve the charging square camera after its scheduled service life expires; the value coefficient of continuing service in the electromechanical system and its overall maintenance cost is kept at a relatively low level.

5. Recommended Configuration of Parameters with a High Failure Rate

From the fault prediction analysis results of the video surveillance equipment (Figure 9), we can see that even if the appropriate maintenance strategy is adopted, the probability of slight failure of the video surveillance equipment in the steady state is still as high as 9.61%, and the probability of general failure is 4.93%. This also intuitively shows that the degree of performance protection by the external maintenance of the mechanical and electrical equipment is limited, and it cannot guarantee that the equipment is at a healthy level at all times. There are still some equipment failures due to the impact of the external environment and their aging. If the reliability of electromechanical equipment can be further improved, it is necessary to improve the level of technical parameters of the equipment from the inside to improve its essential performance. Based on the above situation, this section still takes video surveillance equipment (mainly cameras) as an example, combined with its minor faults and general failures, to recommend the configuration of parameters to achieve the goal of fundamentally improving the quality of the equipment.

5.1. Carding of Technical Specifications

Video surveillance equipment must monitor the vehicle’s driving situation and personnel’s activities in the square after payment and provide clear video images in an emergency. Various cameras and video surveillance equipment have different requirements regarding visual resolution, working angle, signal processing mode [27], and reliability according to their distribution position. This project mainly aims at the relevant parameters affecting all kinds of cameras and compiles some general technical specifications of cameras in Chinese national standards GB/T 36480 2018 and GB/T 15412-2017 to provide a basis for setting the technical parameters of different cameras (Table 6).

5.2. Recommendation of Parameter Configuration of Video Surveillance Equipment

The slight and general failure performance analysis and parameter recommendations of all kinds of cameras for video surveillance equipment in the operating environment are as follows.
Under high temperatures, the lens of the toll plaza camera may be deformed due to thermal expansion and contraction, which will accelerate the degradation process of the internal electronic components, lead to image distortion, and then reduce its imaging quality and stability. Therefore, this kind of camera should have good high-temperature resistance. In northern Xinjiang, the low temperature in winter has a significant impact on the equipment. If moisture is inside the camera shield, the icing phenomenon may damage the equipment. In addition, the electronic components inside the equipment may be unstable at low temperatures, resulting in a decline in the performance of the equipment and maybe even causing difficulties in starting or sudden shutdown. Based on this, it is recommended that the working temperature and humidity supported by the camera be between −40 °C and 70 °C, and there should be no condensation when the humidity is less than 95%. Windblown sand particles in Xinjiang may be attached to the surface of the HD camera lens, resulting in visual field obstruction, which will reduce the image’s resolution. At the same time, the wind sand may also cause wear and tear on the coating and lens, affecting its optical performance. Therefore, it is recommended that the protection level of the outdoor camera is not lower than that of IP66. According to the above general specifications for outdoor cameras, the main technical parameters of cameras in different locations can be obtained. The following recommended configurations for toll plaza cameras, surveillance head cameras, and surveillance HD cameras are shown in Table 7.
The above process reflects the strategies and steps for configuring technical parameters of video surveillance equipment, and this strategy can also be used to optimize the technical parameters of other equipment with high failure rates.

6. Conclusions

To manage expressway mechanical and electrical equipment, we should formulate the optimal external operation and maintenance strategy and improve the technical parameter level of the mechanical and electrical equipment inside the equipment. Based on the perspective of the operation and maintenance capability of electromechanical equipment, and integrating the historical operation and maintenance data, this study constructs a multistate electromechanical system Markov chain model considering maintenance, which aims to predict and analyze all kinds of fault types of the equipment. This study conducts an in-depth exploration of the equipment’s tail operation and maintenance strategy, and based on the predicted results, optimizes the electromechanical equipment parameters for the fault performance of the equipment. The conclusions of the study are as follows:
(1) Taking video surveillance as an example, the fault maintenance data of two road sections in Xinjiang, China, in October 2023 are used to predict all kinds of faults of the electromechanical system as a whole, and the effectiveness of the prediction model is verified. Secondly, taking video surveillance equipment as an example, the failure rate of video surveillance equipment in different states is predicted, and an optimal maintenance strategy with a monthly maintenance time of 29 h and a maintenance frequency of 0.1648 is proposed. The overall expected operation probability of the long-term operation of the video surveillance equipment is increased to 71.31%, and the value coefficient of the video surveillance equipment under this strategy is verified.
(2) Based on the high incidence of minor and general faults in the predicted results, combined with the national and industry norms corresponding to the equipment, the equipment is configured with technical parameters suitable for the region to which it belongs. Improving its reliability from within the equipment is required to achieve this.
This study creatively combines the equipment’s external operation and maintenance strategy with improving internal parameters. It takes video surveillance equipment as an example to explore the optimal operation and maintenance strategy and parameter configuration recommendation scheme for expressway mechanical and electrical equipment suitable for Xinjiang. The formed equipment operation and maintenance method can provide strong theoretical support and practical guidance for expressway mechanical and electrical equipment operation and maintenance method innovation and equipment selection in practical work. The current model constructed in this study only preliminarily classifies and analyzes the state of the equipment, but the state can be divided further; in the follow-up research, the study will include more states into the multistate Markov model of the current maintenance decision in order to achieve a finer division of the equipment state. At the same time, it is planned to optimize the relevant equipment parameters of the electromechanical system in order to promote the in-depth study of the operation and maintenance strategy of electromechanical equipment and provide clearer guidance for the optimization of electromechanical equipment parameters.

Author Contributions

Conceptualization, X.D.; Methodology, X.D. and G.S.; Software, G.S.; Formal analysis, G.S.; Data curation, X.D., G.S., W.T. and L.C.; Writing—original draft, X.D., G.S. and W.T.; Writing—review & editing, X.D., G.S. and L.C.; Project administration, X.D., W.T. and L.C. All authors have read and agreed to the published version of the manuscript.

Funding

This study is jointly funded by the Natural Science Foundation of Xinjiang Uygur Autonomous region (2024D01A53), Science and Technology Projects of Xinjiang Communications Investment Group Co., Ltd. (XJJTZKX-FWCG-202401-0044), Xinjiang Key R&D Program Projects (2022B03033-1), and the project of Tianchi in Xinjiang Uygur Autonomous Region.

Data Availability Statement

The data presented in this study are available on request from the corresponding author due to privacy.

Conflicts of Interest

The authors declare that they have no known competing financial interests or personal relation-ships that could have appeared to influence the work reported in this paper. Wei Tian is employee of Xinjiang Jiaotou Engineering Technology Development Co., Ltd. and Xinjiang Transportation Investment (Group) Co., Ltd. The authors declare that this study received funding from Xinjiang Communications Investment Group Co., Ltd. The funder had no role in the design of the study; in the collection, analysis, or interpretation of data, in the writing of the manuscript, or in the decision to publish the results.

References

  1. Kim, D.J.; Sur, J.M.; Cho, H.U. A long term expected risk estimation of maritime accidents through markov chain approach and probabilistic risk matrix. Asian J. Shipp. Logist. 2023, 39, 1–12. [Google Scholar] [CrossRef]
  2. Li, D.Q.; Zang, H.H.; Tang, X.S.; Rong, G. Efficient Bayesian updating for deformation prediction of high rock slopes induced by excavation with monitoring data. Eng. Geol. 2024, 342, 107772. [Google Scholar] [CrossRef]
  3. Jia, X.; Papadimitriou, C. Data features-based bayesian learning for time-domain model updating and robust predictions in structural dynamics. Mech. Syst. Signal Process. 2025, 224, 112197. [Google Scholar] [CrossRef]
  4. Zhu, H.; Hao, H.K.; Lu, C. Enhanced support vector machine-based moving regression strategy for response prediction and reliability estimation of complex structure. Aerosp. Sci. Technol. 2024, 155, 109634. [Google Scholar] [CrossRef]
  5. Wang, Q.; Chen, D.; Li, M.; Li, S.; Wang, F.; Yang, Z.; Zhang, W.; Chen, S.; Yao, D. A novel method for petroleum and natural gas resource potential evaluation and prediction by support vector machines (SVM). Appl. Energy 2023, 351, 121836. [Google Scholar] [CrossRef]
  6. Zhao, J.; Zhang, H.; Zou, H.; Pan, J.; Zeng, C.; Xiao, S.; Wang, J. Probability prediction method of transmission line icing fault based on adaptive relevance vector machine. Energy Rep. 2022, 8, 1568–1577. [Google Scholar] [CrossRef]
  7. Hocek, H.; Yay, S.; Yazir, D. Comprehensive analysis of ship detention probabilities using binary logistic regression method with machine learning. Ocean. Eng. 2025, 315, 119889. [Google Scholar] [CrossRef]
  8. Li, C.; Xiong, S.; Xiong, H.; Sun, X.; Qin, Y. Logistic model for pattern inference of subway passenger flows based on fare collection and vehicle location data. Appl. Math. Model. 2024, 130, 472–495. [Google Scholar] [CrossRef]
  9. Huang, W.; Shao, C.; Hu, B.; Li, W.; Sun, Y.; Xie, K.; Zio, E.; Li, W. A restoration-clustering-decomposition learning framework for aging-related failure rate estimation of distribution transformers. Reliab. Eng. Syst. Saf. 2023, 232, 109043. [Google Scholar]
  10. Fan, L.; Xu, X.; Ni, Y. Multi-failure mode reliability of monorail vehicle gear transmission system based on multi-index staged degradation. Appl. Math. Model. 2024, 136, 115602. [Google Scholar]
  11. Yuan, X.; Xu, M.; Hou, Z.; Chen, W.; Huang, Y.; Lv, J.; Xu, X.; Huang, L. Enhanced data-driven economic assessment of fuel cell electric buses utilizing an improved markov chain monte carlo approach. Int. J. Hydrogen Energy 2025, 102, 732–748. [Google Scholar]
  12. Artan, M.Ş.; Şahin, İ. A comparative analysis of train delay prediction models for markov chains. Transp. Res. Procedia 2025, 82, 822–835. [Google Scholar]
  13. Wang, X.; Liu, W. Research on air traffic control automatic system software reliability based on markov chain. Phys. Procedia 2012, 24, 1601–1606. [Google Scholar]
  14. Yu, Q.; Guo, Z.Z.; Liang, R. A prediction model of expressway electromechanical equipment life based on markov chain. J. Highw. Transp. Res. Dev. 2024, 35, 28–35. [Google Scholar]
  15. Zhu, D.; Ding, Z.; Huang, X.; Li, X. Probabilistic modeling for long-term fatigue reliability of wind turbines based on Markov model and subset simulation. Int. J. Fatigue 2023, 173, 107685. [Google Scholar]
  16. Liang, Q.; Yang, Y.; Zhang, H.; Peng, C.; Lu, J. Analysis of simplification in Markov state-based models for reliability assessment of complex safety systems. Reliab. Eng. Syst. Safety 2022, 221, 108373. [Google Scholar] [CrossRef]
  17. Haghgoo, O.; Damchi, Y. Reliability modelling of capacitor voltage transformer using proposed Markov model. Electr. Power Syst. Res. 2022, 202, 107573. [Google Scholar] [CrossRef]
  18. Yi, Y.; Siyu, H.; Haoran, C.; Meilin, W.; Linhan, G.; Xiao, C.; Liu, W. Belief reliability analysis of traffic network: An uncertain percolation Semi-Markov model. J. Frankl. Inst. 2023, 360, 12463–12479. [Google Scholar] [CrossRef]
  19. Zhang, X.; Li, Y.; Zhao, Z.; Zhang, J.; Zhang, W. Reliability assessment of multistate flexible manufacturing cells considering equipment failures. Comput. Ind. Eng. 2023, 185, 109625. [Google Scholar] [CrossRef]
  20. Sun, C.; Ju, X.; Hao, W.; Lu, Y. Research on multi-objective optimization of control strategies and equipment parameters for a combined heating system of geothermal and solar energy in cold and arid regions based on TRNSYS. Case Stud. Therm. Eng. 2023, 50, 103441. [Google Scholar] [CrossRef]
  21. Li, X.Y.; Wu, J.P.; Ma, H.G.; Li, X.; Kang, R. A random fuzzy accelerated degradation model and statistical analysis. IEEE Trans. Fuzzy Syst. 2017, 26, 1638–1650. [Google Scholar]
  22. Li, N.; Lei, Y.; Guo, L.; Yan, T.; Lin, J. Remaining useful life prediction based on a general expression of stochastic process models. Trans. Ind. Electron. 2017, 64, 5709–5718. [Google Scholar]
  23. Zarei, M.; Bagheri, M.; Dehghanian, P. Markov-chain-driven optimization of inspection-based maintenance, part I: Models and methods. Electr. Power Syst. Res. 2024, 228, 110049. [Google Scholar]
  24. Zarei, M.; Bagheri, M.; Dehghanian, P. Markov-chain-driven optimization of inspection-based maintenance, part II: Numerical analysis and practical insights. Electr. Power Syst. Res. 2024, 227, 109922. [Google Scholar]
  25. Yan, L. Application of value engineering to project construction cost control by the management engineers. J. Northeast. For. Univ. Chin. Ed. 2002, 30, 101–103. [Google Scholar]
  26. Mabrouka, S.; Younis, E. Application of value engineering technique in construction project. J. Eng. Appl. Sci. Technol. 2023, 5, 1–6. [Google Scholar] [CrossRef]
  27. Panic, S.; Petrović, V.; Drašković, S.; Kontrec, N.; Milojević, S. Performance analysis of hybrid fso/rf communication system with receive diversity in the presence of chi-square/gamma turbulence and rician fading. Bull. D. Serikbayev EKTU 2023, 4, 304–312. [Google Scholar]
Figure 1. Research technology roadmap.
Applsci 15 03628 g001
Figure 2. Markov chain model of two states of highway mechanical and electrical equipment.
Applsci 15 03628 g002
Figure 3. Multistate Markov chain model of electromechanical equipment.
Applsci 15 03628 g003
Figure 4. Multistate Markov chain model of electromechanical system considering the maintenance strategy.
Applsci 15 03628 g004
Figure 5. Diagram of the state transition probability model considering maintenance.
Applsci 15 03628 g005
Figure 6. Fault state prediction trend chart of electromechanical systems.
Applsci 15 03628 g006
Figure 7. Initial state transfer rate diagram of video surveillance equipment.
Applsci 15 03628 g007
Figure 8. Trend chart of the steady-state probability of video surveillance equipment.
Applsci 15 03628 g008
Figure 9. Probability change between the minor failure and general failure state of video surveillance equipment.
Applsci 15 03628 g009
Table 1. Maintenance record data.
StatusQuantity
Minor fault status: S 1 CompletedField maintenance3642
Remote processing4
Unfinished2
General failure status: S 2 Completed7881
Unfinished3
Serious failure status: S F 88
Table 2. State distribution corresponding to manual inspection ratings 1–10.
Number of Inspections: n Times per Month12345
State occurrence probabilityStatus: S 0 79.36%82.26%82.41%81.53%80.18%
Status: S 1 9.93%7.52%6.02%5.01%4.28%
Status: S 2 6.95%3.68%2.30%1.59%1.17%
Status: S F 0.28%0.15%0.10%0.07%0.05%
Number of inspections: n times per month678910
State occurrence probabilityStatus: S 0 78.63%77.00%75.33%73.69%72.07%
Status: S 1 3.73%3.31%2.98%2.70%2.47%
Status: S 2 0.90%0.72%0.59%0.50%0.42%
Status: S F 0.04%0.03%0.03%0.02%0.02%
Table 3. Overview of the main failures of the toll system.
Type of Fault EquipmentNumber of Fault RecordsProportion of QuantityFault Performance
Video surveillance equipment2917.6%The picture is not clear; identify fault, etc.
Automatic railing machine2012.1%Bar rise/fall fault; railing arm fracture; railing machine does not have power, etc.
Weighing equipment159.1%Axis identification error; weighing platform collapse; weighing platform overweight; no axis information, etc.
Table 4. Matrix table of optimal maintenance strategy.
Transfer Probability λ 01 λ 12 λ 2 F μ I 00 μ I 10 μ I 20 μ F 0
0.02750.0730.0010.97250.9270.9991
State S 0 S 1 S 2 S F I 0 I 1 I 2
S 0 0.80770.0275000.164800
S 1 00.76220.073000.16480
S 2 000.83420.001000.1648
S F 1000000
I 0 0.97250.027500000
I 1 0.92700.0730000
I 2 0.999000.001000
Table 5. Resource consumption and basic pricing table for installation and debugging of each set of video surveillance equipment.
Serial NumberNameUnitVideo Surveillance Equipment
Toll BoothToll IslandToll PlazaTunnelIndoor
12345
1Fees for laborWorking day3.84.893.63.6
2BoltsKg2.9
3Expansion boltsSet group4.110.210.28.28.2
4Other materialsCNY1.92.54.11.91.9
5Trucks less than 4 tShift group0.880.220.18
6Hydraulic lifts within 300 kgShift group0.16
7Small toolsCNY12.223.662.713.113.1
8Basic pricingCNY3535851529540522
Table 6. Technical specification for video surveillance equipment (camera) comparison table.
Related ParametersChinese National Standard: GB/T 36480~2018; GB/T 15412-2017
Total number of optically effective pixelsThe optical effective pixel should not be less than 90% of the nominal value specified in the product standard.
Visual resolution1. Products with a total number of nominal pixels less than 20 million pixels should not be less than 65% of the theoretical limit resolution;
2.Products with a total number of nominal pixels greater than or equal to 20 million pixels should not be less than 60% of the theoretical limit resolution.
Operating temperature range−10 °C~55 °C
Working humidity range30~85%
Geometric distortion1. For products with more than 2 million nominal total pixels, the absolute value of pillow or barrel geometric distortion around the captured image is less than 3%;
2. The difference between the absolute value and the nominal value of geometric distortion is less than 5%.
Reliability parameters1. After working continuously for 1000 h, the illuminance value of the lighting device should not be less than 90% of the initial illumination value;
2. The average time between failures (MTBF) of the head should not be less than 5000 h.
Head rotation angle1. If the product stipulates that the horizontal (or vertical) rotation angle of the head is less than 360°, then under the condition of GB/T 15412.5.5.1, first rotate the head left (upward) to the limit position in the horizontal (or vertical) direction, and take this position as the starting point, and then rotate the head in the opposite direction to the limit position, and take this position as the terminating end, and the rotation angle between the starting end and the ending end is the rotation angle range.
2. If the product stipulates that the horizontal (or re-straightening) rotation angle of the head is greater than 360°, then under the condition of GB/T 15412.5.5.1, take a rest position of the head as the starting point, and then rotate the head horizontally (or vertically). If the head rotates to 360°, it can still return to the beginning; that is, the rotation angle range of the head is 360°.
Table 7. Recommended configuration table for video surveillance equipment (camera) parameters.
Parameters related to external environmentAnti-corrosion and anti-impact(1) Toll plaza camera, surveillance head camera:
1. Corrosion resistance, impact resistance;
2. The column is treated by hot-dip galvanizing and then treated by plastic spray.
Temperature and humidity range(1) Toll Plaza camera:
1. Humidity less than 95% (no condensation);
2. Working temperature and humidity: −40 °C ~ 70 °C.
Waterproof and dustproof(1) Toll Square camera (gun camera):
1. It has the functions of dust prevention, fog prevention, and defrosting;
2. Protection level IP67;
(2) Monitoring head camera:
1. Protection level: IP67, dustproof, antifogging, defrosting;
2. Installation of integrated aluminum outdoor protective cover, die-cast aluminum plate, stainless steel hardware, spray protection, waterproof seal;
(3) Monitoring high-definition fixed cameras:
1. The protection level is not lower than that of IP66.
Sight distance(1) Charge plaza camera (gun camera), surveillance head camera:
1. Laser night vision distance: ≥500 m;
(2) Monitoring head camera:
1. The supplementary light distance is not less than 50 m.
Other performance parameters (1) Toll square camera (gun camera):
1. Horizontal 360° infinite rotation, no dead angle; automatic cruise can be set, horizontal scanning;
2. Camera requires effective pixels: ≥4 million pixels;
3. Minimum illuminance: color ≤0.0003 lx, black and white ≤0.0001 lx; signal-to-noise ratio: ≥50 dB; illuminance adaptation range: ≥120 dB;
4. Lens near focal length: ≤6 mm; far focal length: ≥208 mm;
5. Lens image resolution: ≥2560 × 1440;
6. The head supports horizontal hand control speed not less than 200/s and vertical hand control speed not less than 83°/s. The horizontal rotation range is 360° continuous rotation, the vertical rotation range is upward ≥40°, downward ≥90°, and the positioning accuracy of the head is 0.01°;
7. Mean time between failures (MTBF): ≥30,000 h;
(2) Monitoring head camera:
1. Effective pixels: ≥4 million pixels
2. Minimum illuminance: color ≤ 0.0003 lx, black and white ≤0.0001 lx; signal-to-noise ratio: ≥50 dB; illuminance adaptation range: ≥120 dB;
3. Near focal length: ≤6 mm; far focal length: ≥208 mm;
4. The angle of view of the lens is 59.8 (W) ~ 2.0 (T), the horizontal manual speed is not less than 200/s, and the vertical manual speed is not less than 83°/s. The horizontal rotation range is 360° continuous rotation, and the vertical rotation range is upward ≥40°and downward ≥90°.
Disclaimer/Publisher’s Note: The statements, opinions and data contained in all publications are solely those of the individual author(s) and contributor(s) and not of MDPI and/or the editor(s). MDPI and/or the editor(s) disclaim responsibility for any injury to people or property resulting from any ideas, methods, instructions or products referred to in the content.

