Abstract
The optimization of the manufacturing conditions in milling processes composes a crucial task for enhancing machining efficiency and extending the tool’s lifespan. This study presents an investigation of the cutting tool’s performance under varying machining parameters via the generation of an experimental dataset that was obtained through laboratory-controlled milling operations. Based on this dataset, artificial intelligence (AI) models, including artificial neural network (ANN), k-nearest neighbors (KNN), and support vector regression (SVR), were developed in order to predict the tool’s life as a function of the milling conditions. Additionally, finite element method (FEM) simulations were conducted to estimate tool wear and analyze the manufacturing process at a numerical level. In particular, FE models were utilized to compute the milling forces and the corresponding developed stress fields, as well as to assess the cutting tool’s performance based on certain machining variables. Furthermore, a comparative analysis between AI-driven forecasts and FEM simulations was performed to evaluate their effectiveness and reliability. The findings provide insights into the advantages and limitations of both methodologies, guiding the optimization of coated carbide tool performance. The outcomes of this study contribute to the advancement of predictive modeling in machining processes, offering a data-driven approach for improved tool wear assessment.
1. Introduction
Milling is one of the most widely applied machining processes in manufacturing, playing a pivotal role in shaping, finishing, and fabricating components across industries such as aerospace, automotive, furniture, and medical devices [1]. Moreover, machining composes a cornerstone of modern manufacturing, enabling the production of high-precision components with complex geometries [2]. As manufacturing technologies advance, milling continues to evolve with innovations like CNC machining, high-speed milling, and additive-subtractive hybrid processes, driving greater efficiency and capabilities. This subtractive manufacturing procedure involves the removal of material using rotating cutting tools to produce components with high accuracy and surface quality. It should be noted that the efficiency of the cutting tools in milling operations is among the most critical factors influencing the manufacturing performance, product quality, and operational costs [3]. In recent years, advancements in manufacturing technologies, coating materials, and computer-aided manufacturing (CAM) systems have expanded the capabilities of milling procedures via the development of high-performance cutting tools, which have enabled the machining of difficult-to-cut materials like titanium alloys, composites, and hardened steels [4]. Among the available tool materials, coated carbide tools have gained significant attention due to their superior hardness, wear resistance, and ability to withstand high temperatures [5]. These coatings are typically composed of materials such as titanium nitride (TiN), titanium aluminum nitride (TiAlN), aluminum chromium nitride (AlCrN), or chromium nitride (CrN) that provide additional protection against abrasive wear, adhesion, and thermal degradation [6].
Despite these advantages, the progressive wear of coated carbide tools remains a critical issue, affecting machining precision, surface finish, and the overall manufacturing costs [7]. In addition, the performance of coated carbide tools is influenced by a complex interplay of factors, including the cutting parameters, coating materials, and workpiece properties. Hereupon, a deep comprehension of the wear mechanisms of coated carbide tools is essential for improving machining efficiency, maximizing tool life, and reducing downtime due to frequent tool replacements [8]. In general, tool wear is related to several factors, including cutting speed, feed rate, depth of cut, workpiece material, tool material, coating, and cutting fluid, among others [7,8]. The interplay between these parameters determines the extent of wear mechanisms such as abrasion, adhesion, and diffusion, which directly impact tool life and machining performance [9]. To study these effects, experimental approaches have been commonly used, where milling tests are conducted under different conditions to evaluate tool wear behavior. However, experimental investigations alone can be time-consuming and expensive, necessitating the development of predictive models to estimate tool life based on machining conditions [10]. Therefore, in the past decades, numerical approaches have developed in order to inspect the machining procedure and assess the performance of the applied milling operation [11].
Traditionally, the finite element method (FEM) has been employed to simulate machining processes and predict tool wear through numerical modeling. Finite element analysis (FEA) is a powerful numerical simulation technique widely utilized in machining research to investigate the performance and wear behavior of carbide tools in milling processes [12]. Specifically, FEA enables the detailed study of stress distribution and thermal effects, as well as the tool-workpiece interactions under different machining conditions, providing critical insights into wear mechanisms such as abrasion, adhesion, and diffusion. By discretizing the tool and workpiece into smaller finite elements, the method allows researchers to simulate complex physical phenomena, including chip formation, heat generation, and material deformation [13]. Moreover, advanced material models and boundary conditions could also be incorporated in order to enhance the accuracy of simulations, allowing for realistic predictions of tool wear progression over time. Additionally, FEA facilitates the analysis of cutting forces, temperature gradients, and residual stresses, which are essential factors in determining tool longevity and machining efficiency. It is worth mentioning that even FEA is computationally intensive and requires precise material property data; it remains a valuable tool for optimizing milling operations, as it enables the prediction of tool performance under various machining conditions without the need for extensive experimental testing [14]. However, FEM simulations require extensive computational resources, precise material characterization, and accurate boundary conditions to achieve reliable predictions. As an alternative methodology, artificial intelligence (AI)-based approaches have emerged in the past years as effective tools for predictive analysis in machining operations.
In particular, AI algorithms have become increasingly valuable in manufacturing research, particularly in predicting the performance and wear behavior in machining procedures [15]. AI techniques, such as artificial neural network (ANN), deep learning (DL), k-nearest neighbors (KNN), and support vector regression (SVR), could utilize experimental datasets in order to develop predictive models capable of estimating tool life, wear rate, and manufacturing efficiency based on key process parameters. These algorithms analyze vast amounts of data, identifying complex relationships between input parameters and tool wear that may not be easily captured by traditional empirical models [16]. Unlike FEA, which requires extensive material characterization and computational resources, AI models can rapidly process new data and adapt to different milling conditions with minimal computational cost. These models offer fast and accurate predictions with significantly lower processing effort compared to FEM simulations. Furthermore, machine learning (ML)-based approaches could enable real-time monitoring and optimization of machining processes, allowing manufacturers to implement data-driven decision-making for improving tool longevity and efficiency [17]. On the other hand, AI models require a large amount of data in order to identify patterns and correlations between input features, where the quality, quantity, and relevance of the data directly impact the model’s performance.
The objective of the present research work is to investigate the performance of coated carbide tools in milling operations by combining experimental, numerical, and AI-based methodologies. An experimental dataset was created in a controlled laboratory environment to examine the effects of varying machining conditions on tool wear. Additionally, AI models were developed to predict tool life based on this dataset, while FEM simulations were utilized to estimate the tool wear through numerical analysis of the milling process, as well as to simulate the perpendicular impact test on the examined coated tools. Finally, a comparative evaluation of AI-driven predictions and FEM simulations was conducted to assess the advantages and limitations of the employed methodologies. The findings of this study could contribute to the optimization of milling procedures by providing a data-driven approach towards the enchantment of tool performance, the reduction of wear, and the improvement of the overall manufacturing efficiency. The rest of the present research paper is organized as follows: Firstly, Section 2 outlines the investigated coated cutting tool and the workpiece properties. Moreover, the experimental setup of the impact test and the milling operations are displayed within the chapter. Next, Section 3 presents the developed ML and FE models coupled with their outcomes. This is followed by an algorithm considering the optimization of the manufacturing parameters. Finally, Section 4 discusses the obtained results, as well as some prospects for future research.
2. Materials and Methods
2.1. Coated Cutting Tools and Workpiece
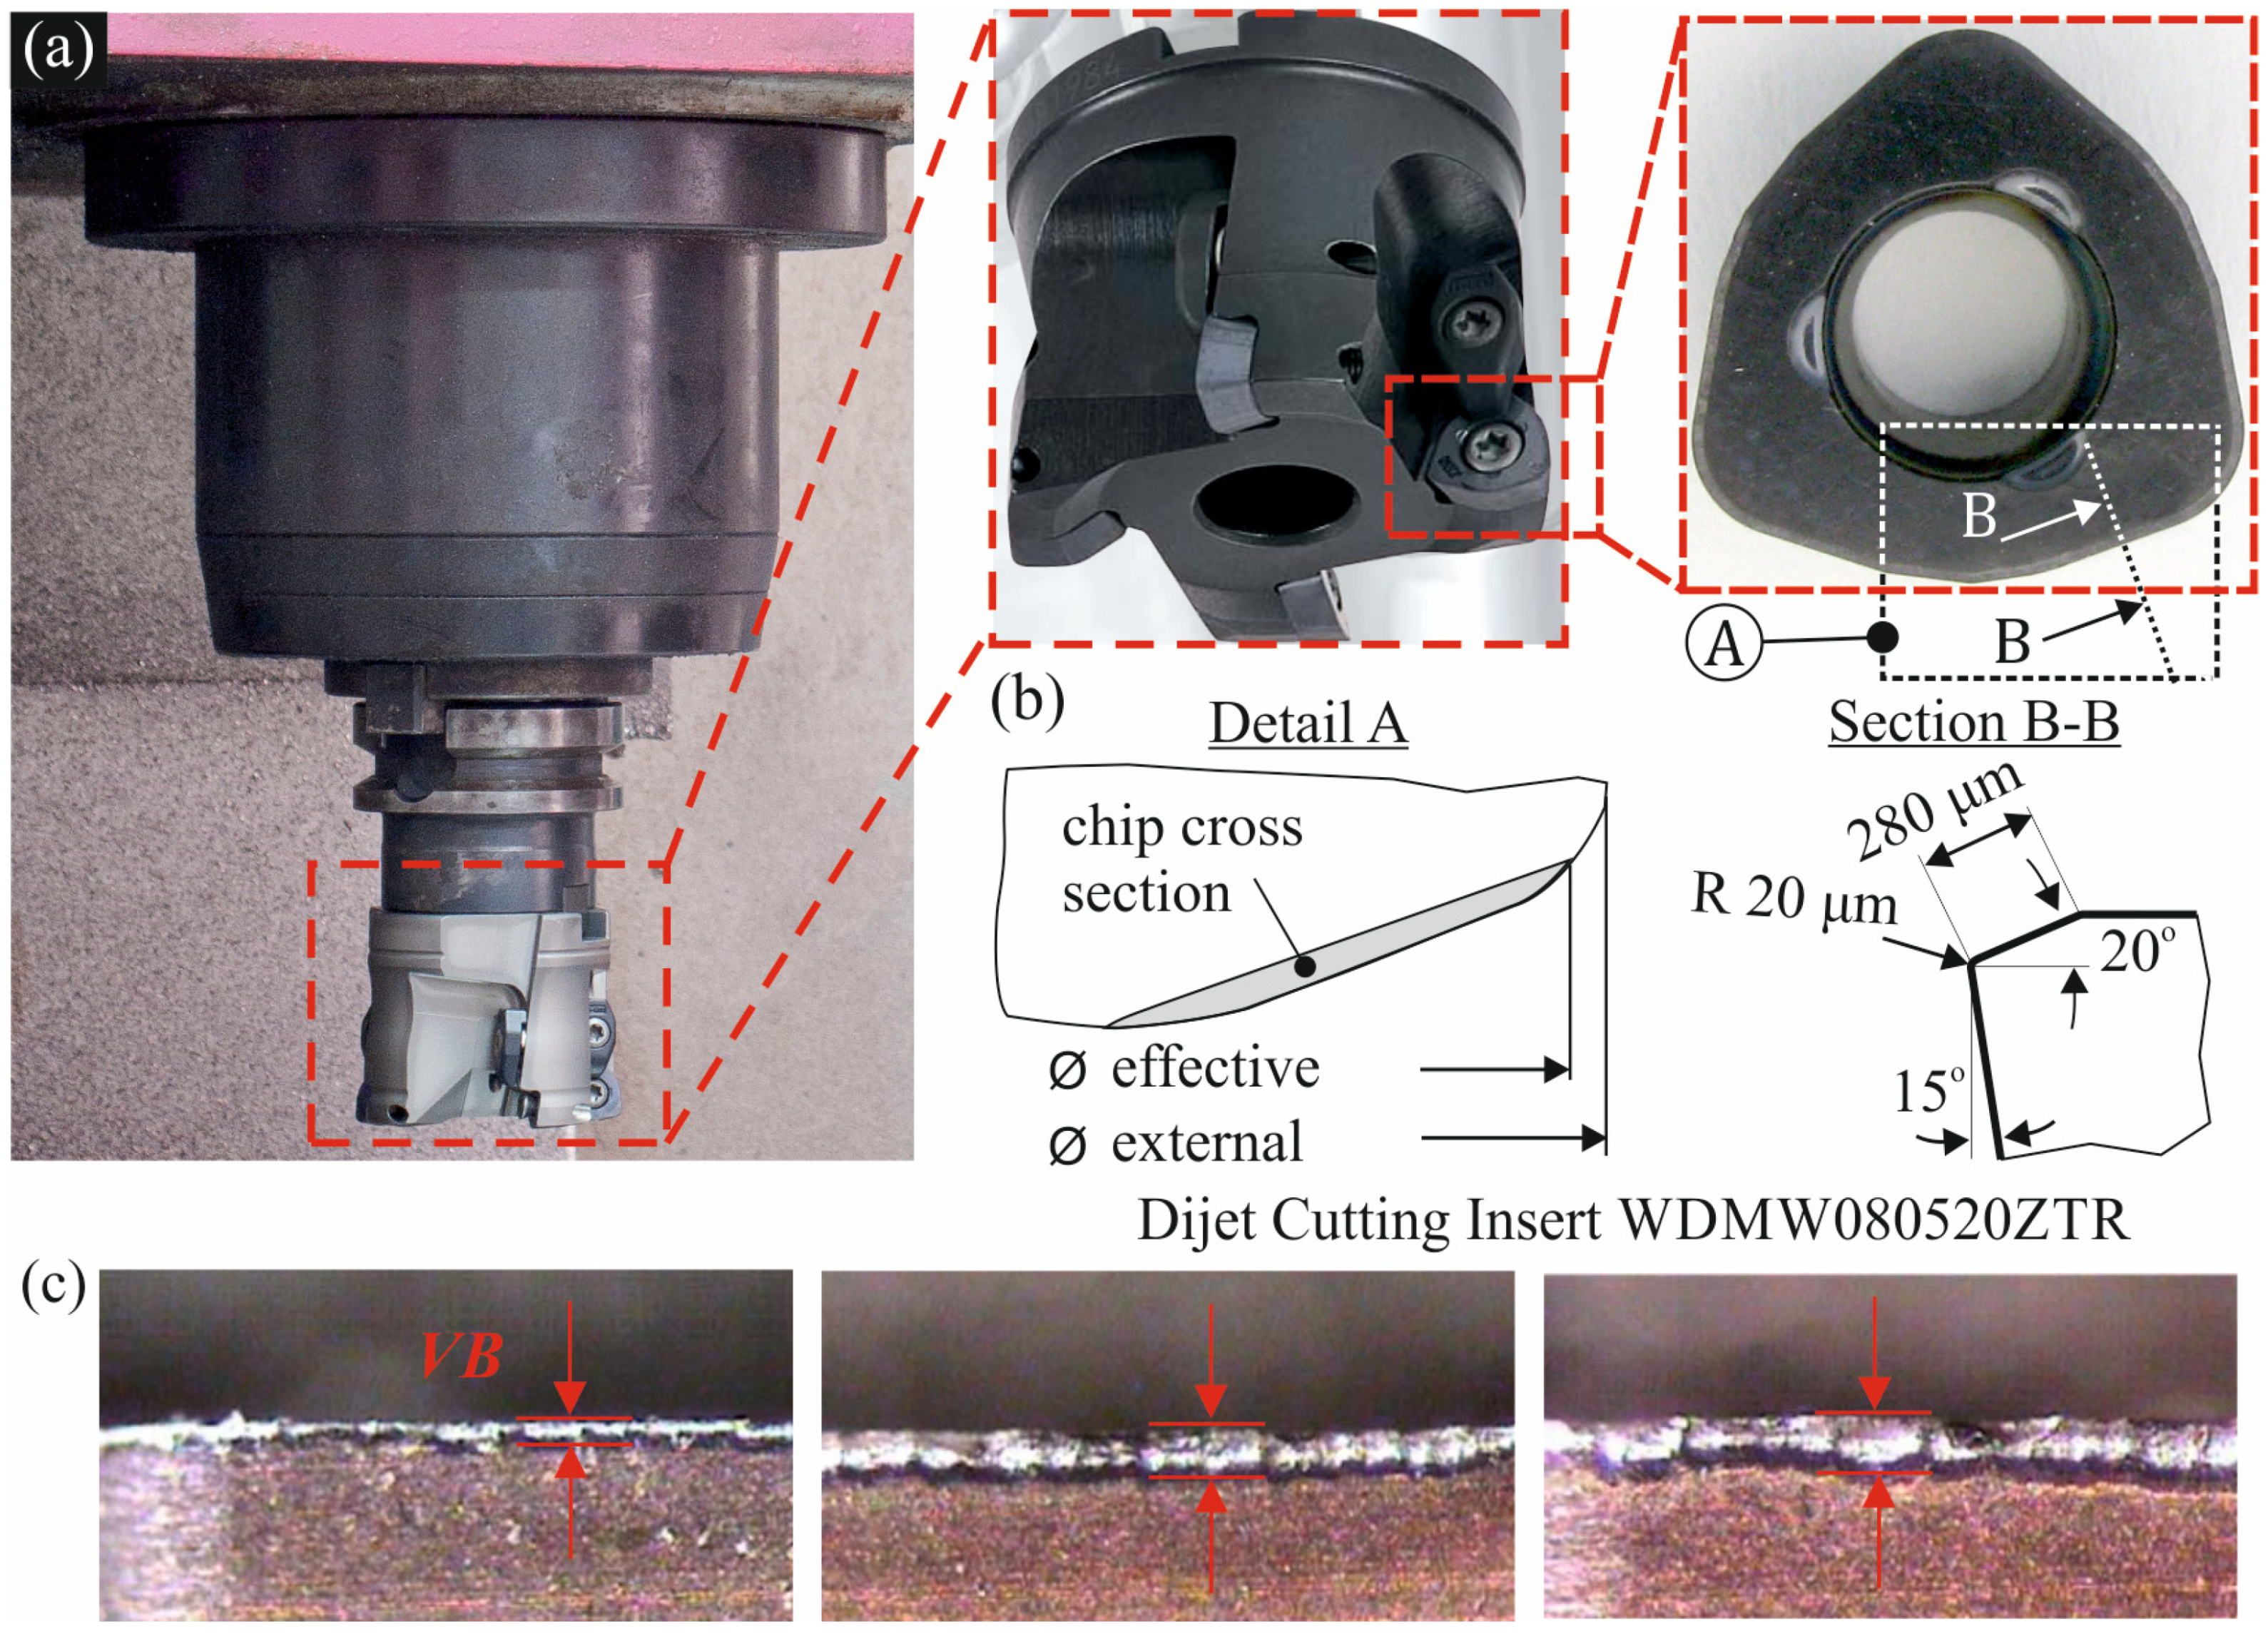
The machining investigations of the present study were conducted via a tool holder of 63 mm external diameter and cemented carbide inserts of HW-K05/K20 ISO specifications using the DIJET cutting insert WDMW080520ZTR, as displayed in Figure 1a. The geometrical characteristics of the tool holder and the cemented carbide inserts are illustrated in Figure 1b. The chamfer length on the inserts’ rake face measures approximately 280 μm, while the cutting-edge radius is 20 μm. Generally, chamfering on a carbide insert composes a critical design feature that enhances tool performance, durability, and machining quality in milling procedures [18]. In particular, chamfer geometries reinforce the cutting edge, making it less prone to chipping or breaking, especially during interrupted cuts or when machining hard materials. Furthermore, by strengthening the edge, the chamfer reduces wear and extends the lifespan of the insert, aiding in maintaining consistent performance over time, even under high-stress conditions. The flank wear VB was measured via an optical microscope, and typical results are exhibited in Figure 1c at various stages of the tool wear evolution.

Figure 1.
(a) Experimental setup; (b) Geometrical characteristics of the investigated milling cutter; (c) Characteristic tool wear evolution on the flank surface.
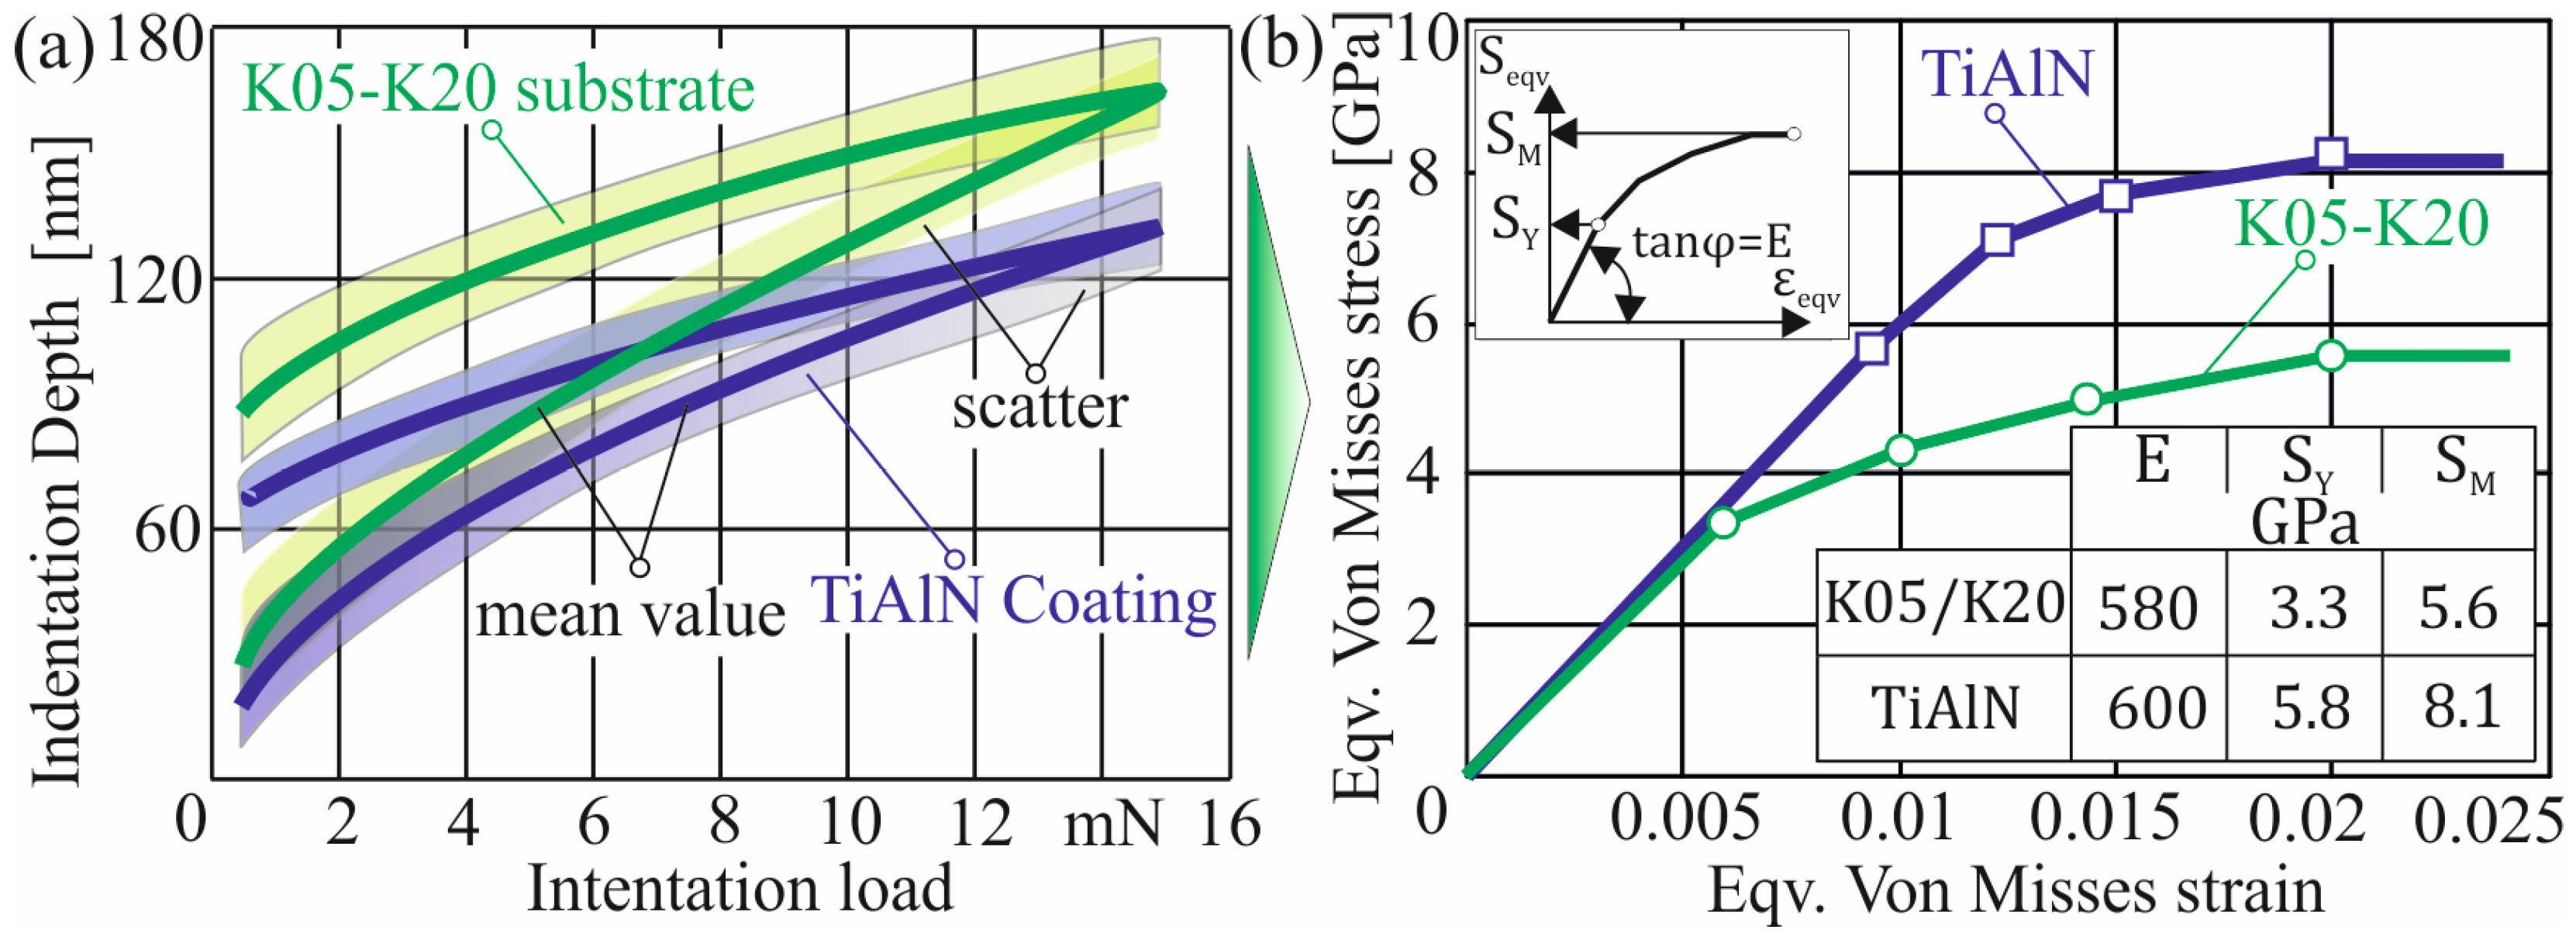
Regarding the mechanical properties of the coating and substrate, these were evaluated using an FEM-based analysis of the nanoindentation experimental process. The employed nanoindentation device was the Fischerscope H100 using a Vickers diamond pyramid. In order to minimize the impact of surface roughness on the indentation depth, 30 experiments per material investigation were conducted for stabilizing the moving average of the maximum indentation depth, as exhibited in Figure 2a. The estimation of the stress-strain curves of the investigated coating and its substrate was based on the ‘SSCUBONI’ (Stress–Strain CUrves Based on NanoIndentation) algorithm [19]. Particularly, the algorithm continuously simulates indenter penetration into the coating material and calculates the corresponding reaction force up to a maximum load of 15 mN as a function of penetration depth. Hereupon, the elastic modulus and stress-strain behavior of the material were determined by comparing the simulated force-depth relationship with the experimentally obtained indentation load-depth data. In addition, it should be noted that the plastic deformation of the coating was approximated using stepwise linear intervals in the stress-strain curve. The calculated stress-strain curves provided key material properties, including the elastic modulus (E), equivalent yield stress (SY), and rupture stress (SM), as documented in Figure 2b. These properties were subsequently incorporated into the FEM simulations presented in Section 3.2.

Figure 2.
(a) Nanoindentation analysis; (b) The corresponding material constitutive stress-strain laws of the examined coated insert and its substrate.
In the present work, a modified AISI P20 steel that is equivalent to DIN 1.2311 steel was employed as the workpiece material, which is a pre-hardened mold steel with very good polishing and texturing properties that is widely used in applications that require high toughness, good polishability, and wear resistance [20]. Its balanced mechanical properties make it a popular choice for mold-making and tooling applications [21]. Specifically, AISI P20 is commonly utilized for plastic injection mold bases, cavities, and cores due to its good machinability, fatigue strength, high hardness, and reliability. It is also suited for producing automotive parts, consumer goods, and general constructional parts. Moreover, it is exploited in low-pressure die casting for non-ferrous metals such as aluminum, zinc, and magnesium, where moderate wear resistance is required. Finally, AISI P20 can be used for tooling applications that require toughness and moderate wear resistance, including jigs, fixtures, and precision die holders. Table 1 documents the chemical composition and the strength properties of the employed workpiece material as provided by the supplier [20].

Table 1.
Mechanical properties and chemical composition of the AISI P20 Steel [20].
2.2. Perpendicular Impact Test
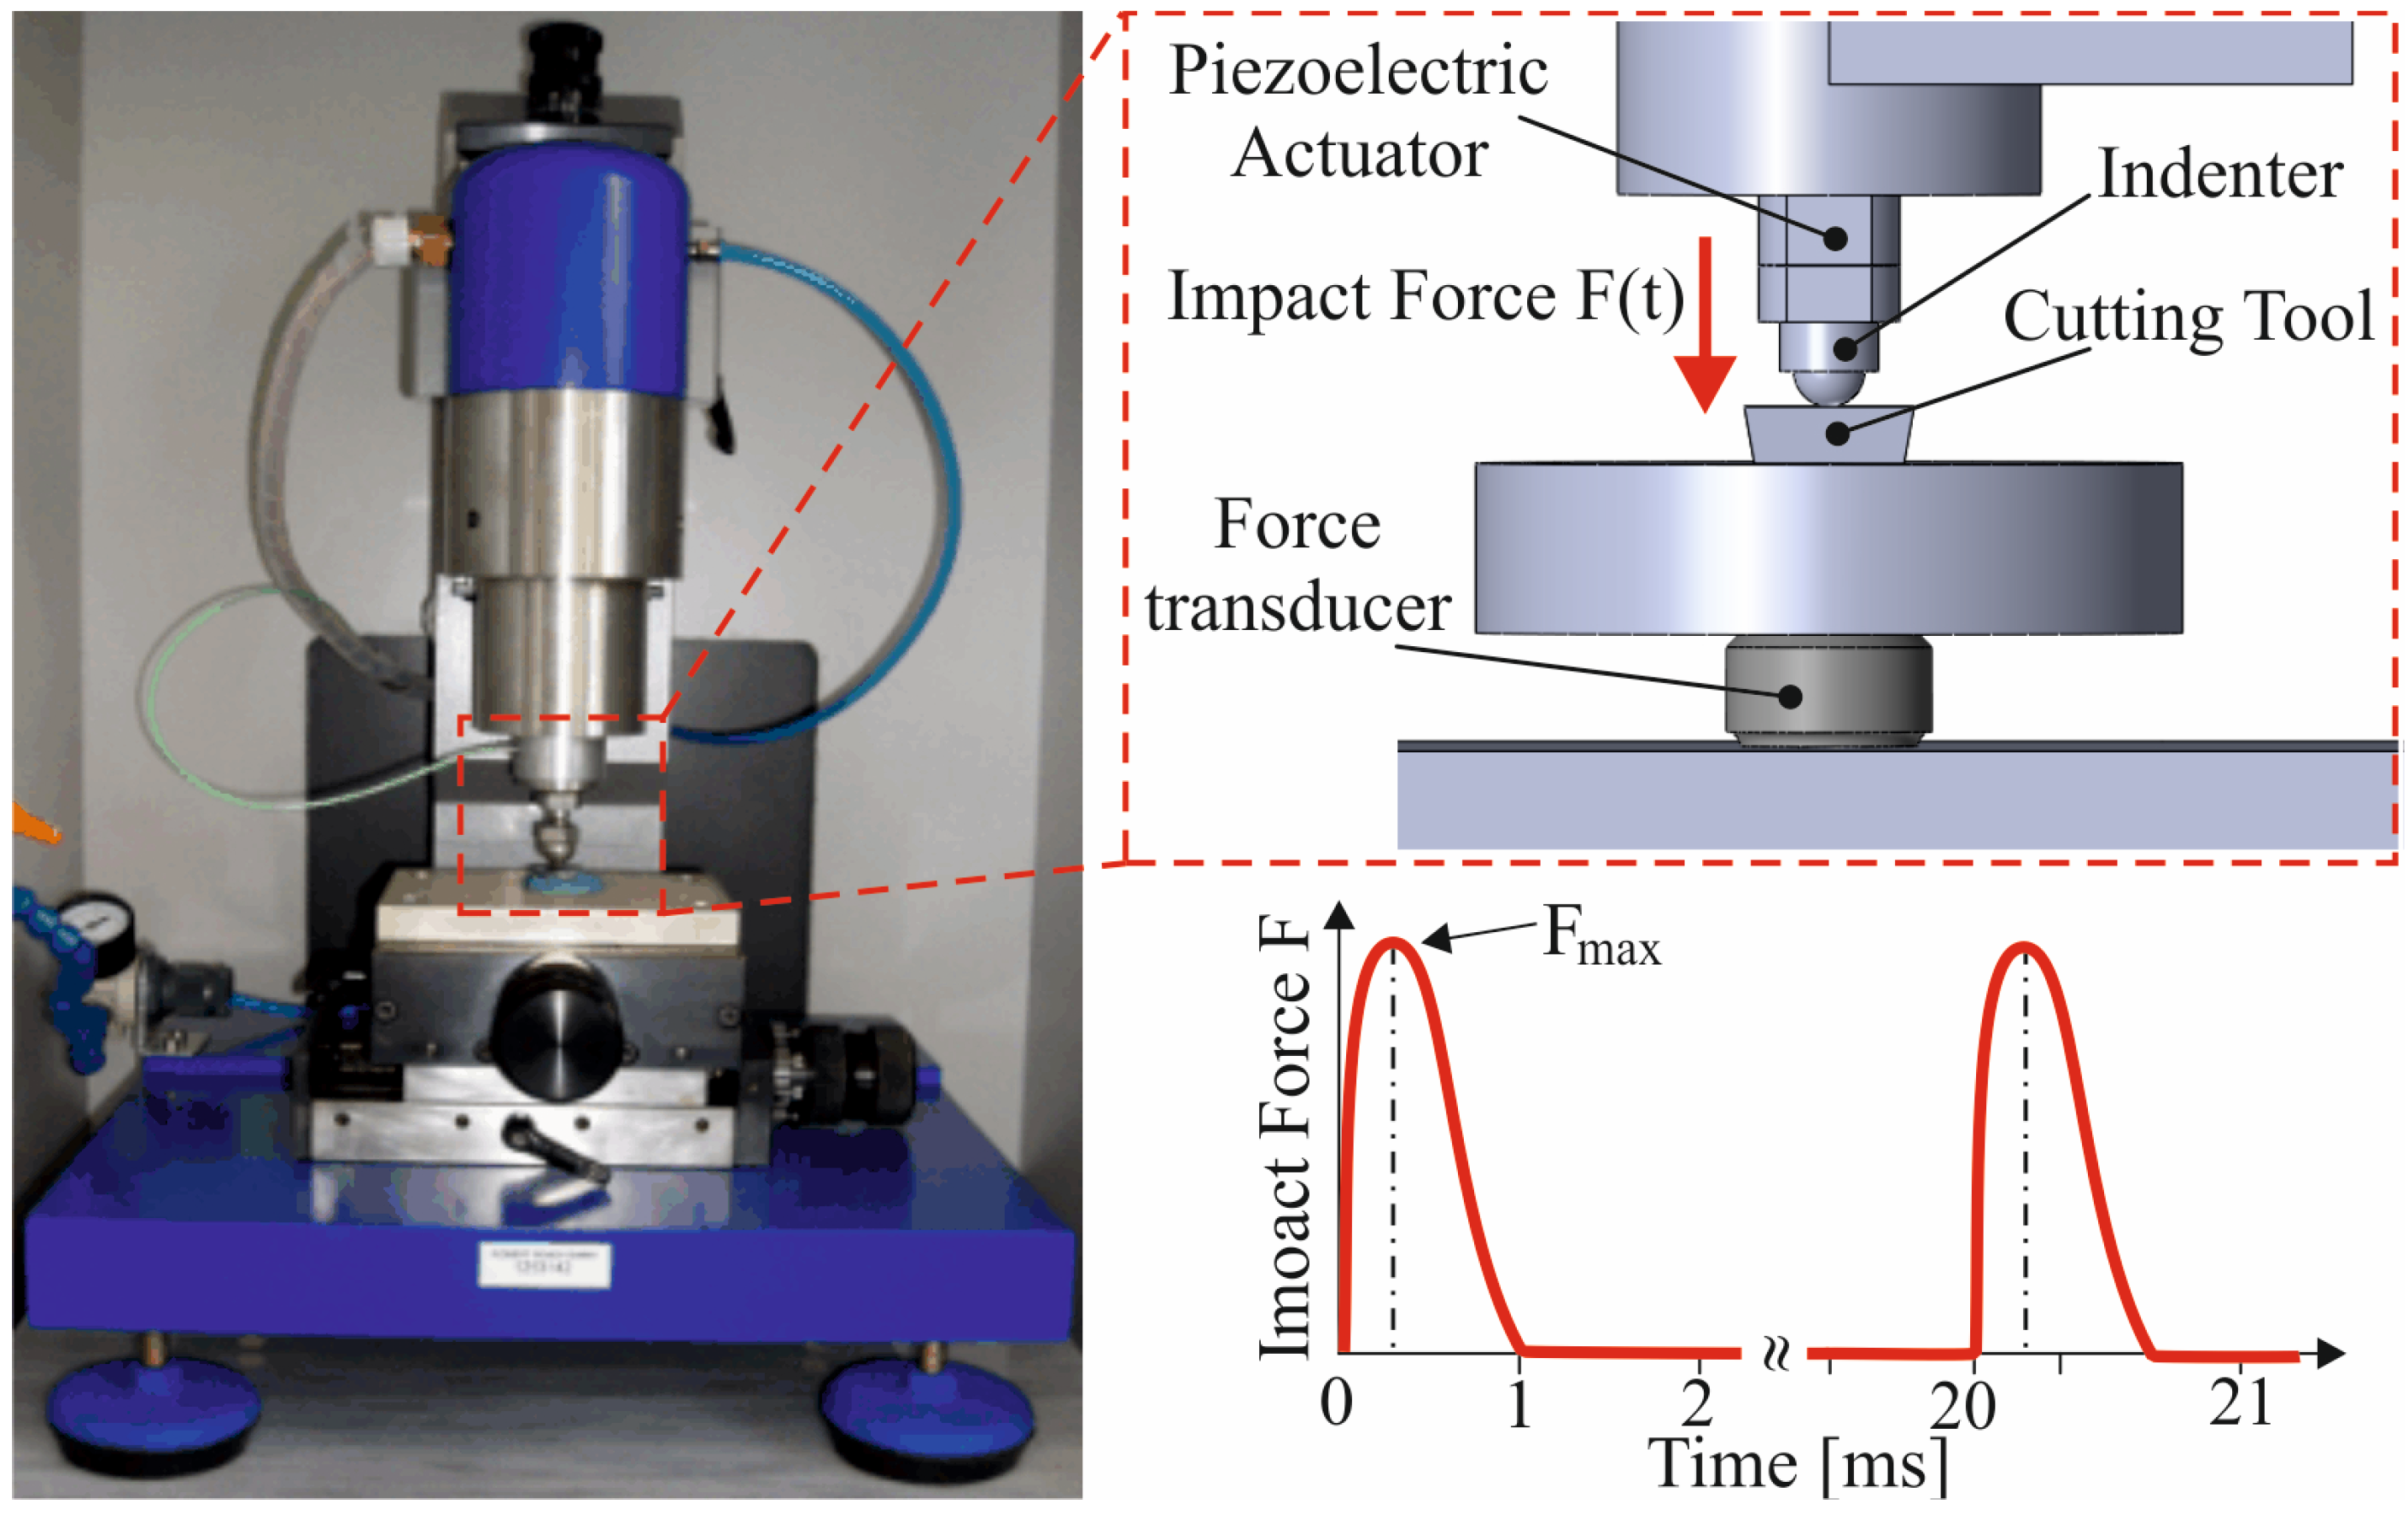
In general, perpendicular impact experiments on coated tools are conducted to evaluate their mechanical durability, adhesion strength, and resistance to dynamic loads, which are critical for manufacturing applications [22]. It is worth mentioning that in milling procedures, cutting tools experience intermittent cutting forces due to the cyclic engagement and disengagement with the workpiece. These impact forces can lead to micro-chipping, coating delamination, and premature tool failure. In particular, milling involves repeated mechanical shocks as the tool enters and exits the workpiece. Hence, perpendicular impact tests could replicate these conditions in a controlled environment to analyze how coatings withstand cyclic loading [23]. Moreover, the repeated impacts help assess the fatigue resistance of both the coating and substrate, so a material that could withstand multiple impact cycles without significant degradation is more suitable for milling applications. Therefore, by performing perpendicular impact tests, manufacturers can optimize coating selection, improve milling tool longevity, and enhance machining efficiency, ultimately leading to cost savings and better surface quality in industrial milling operations. Taking into account the above-mentioned, an impact tester was exploited in order to identify the maximum impact force that the investigated coated cutting insert can endure without failing [23]. As presented in Figure 3, the ceramic ball is repeatedly driven into the examined coating under an adjustable maximum force. Using a PID controller, the output voltage of a variable transformer is regulated via a DC motor in order to maintain consistent impact force peaks throughout the entire experiment, enabling that way the characterization of the coating’s fatigue endurance stress.
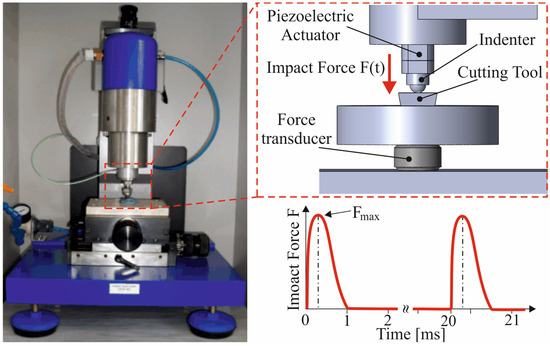
Figure 3.
The employed impact tester arrangement for the fatigue endurance investigation.
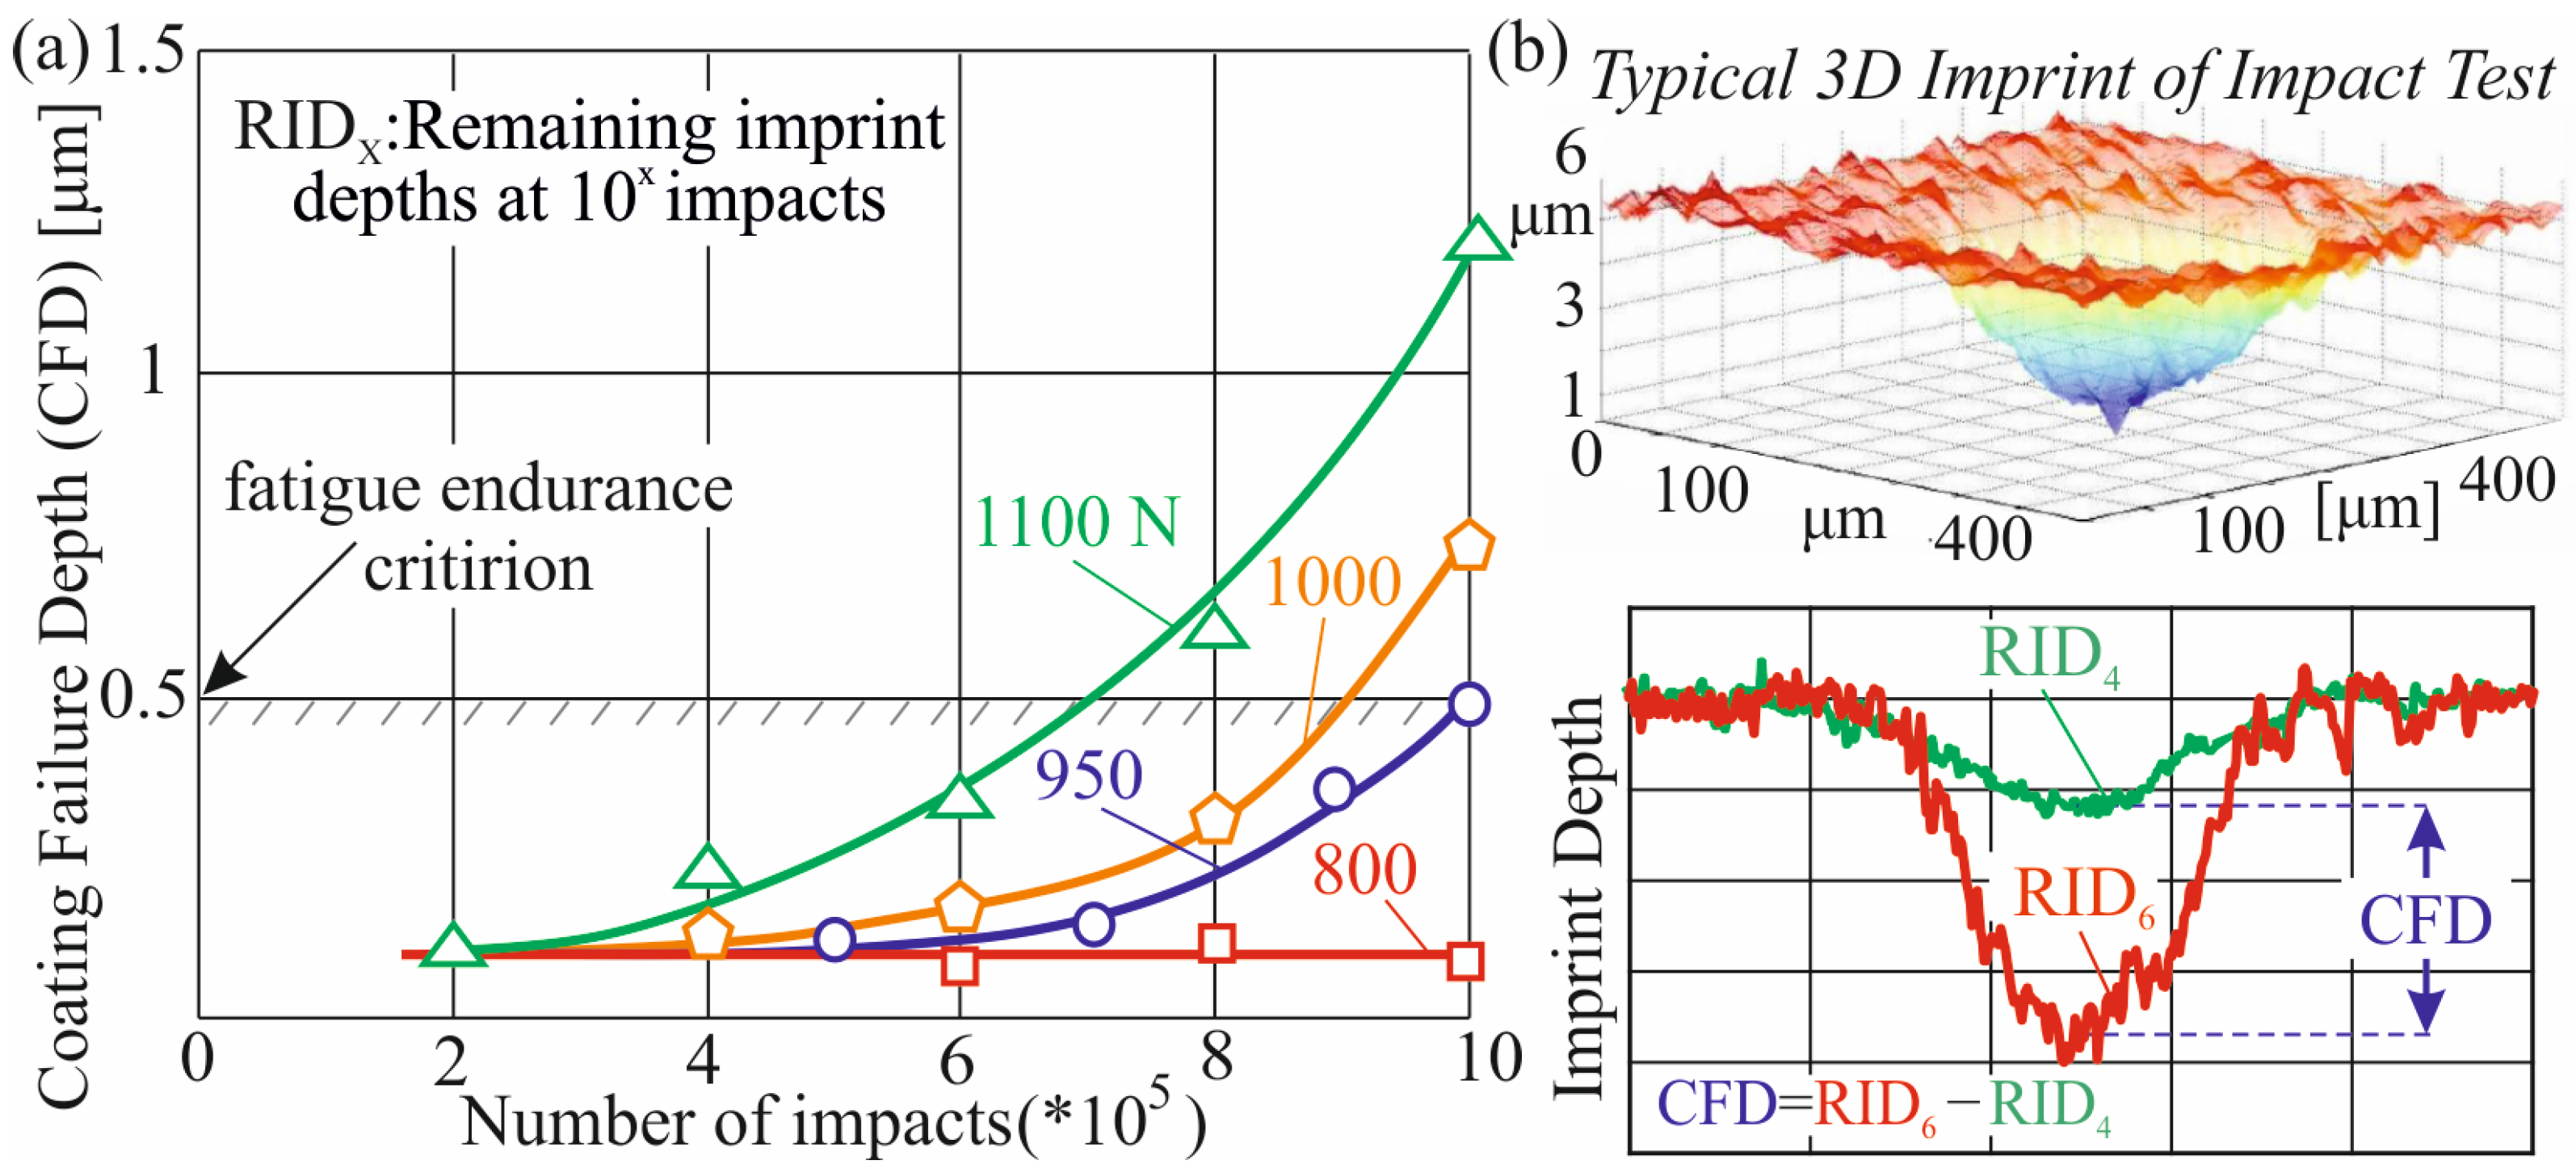
In order to quantify the fatigue endurance stress of the investigated coated carbide inserts, the imprint depths during the impact test were recorded across various load conditions. Specifically, the fatigue fracture behavior of the coating was examined after 106 impact cycles at different impact force amplitudes, as exhibited in Figure 4a. To determine the portion of the remaining imprint depth associated with plastic deformation in the substrate, impact tests were initially conducted for 104 cycles, a level at which no coating failure is expected [19]. The difference in imprint depths between 106 and 104 cycles represents the coating failure depth (CFD), a critical indicator of coating degradation, which was determined to be approximately 0.5 μm [19]. The bottom part of Figure 4b presents characteristic results regarding imprint depths at different impact cycles, while the upper part displays a typical 3D imprint derived from the perpendicular impact test. The imprint depth measurements were carried out via the μsurf confocal microscope of NanoFocus AG. It is evident from Figure 4a that at an impact load amplitude of 800 N, the imprint depths after 104 and 106 cycles are nearly identical, indicating that there is no significant coating damage due to the low CFD value. However, at a higher impact load of 950 N, the remaining imprint depth after 106 cycles exceeded that of 104 cycles, achieving a CFD equal to the criterion, suggesting the onset of micro-fatigue mechanisms that could lead to coating fracture and removal. Furthermore, it must be noted that as the impact force increased, coating wear accelerated, resulting in higher CFD values and more pronounced fatigue-induced failure.

Figure 4.
(a) Fatigue endurance determination based on coating failure depth; (b) a typical 3D imprint of the impact test and characteristic remaining imprint depths.
2.3. Milling Investigations
The milling process is a highly dynamic process characterized by intermittent cutting forces, cyclic thermal loads, and high mechanical stresses, leading to various wear mechanisms on coated carbide tools [6,7,8]. In particular, abrasive wear takes place in situations where hard particles from the workpiece material rub against the tool surface, causing gradual material removal that induces flank wear and an increase in cutting forces, eventually degrading tool performance. At lower cutting speeds, material adhesion occurs due to interaction between the tool coating and the workpiece that leads to localized coating detachment, exposing the carbide substrate to further wear. On the contrary, high cutting speeds instigate extreme temperatures, prompting chemical interactions between the coating and oxygen (oxidation) or between the coating and workpiece material (diffusion). Finally, mechanical overstressing and surpassing the fatigue strength primarily cause micro-chipping of the coating, particularly in the transitional cutting-edge region between the flank and the tool’s rake. Therefore, in the present study, several experiments were conducted with various values on critical machining conditions, such as feed rate, velocity, and radial depth, in order to capture various wear phenomena on the examined coated tools. Explicitly, four levels were considered for the feed rate and the radial depth of cut and three levels for the cutting speed, generating 48 combinations of the investigated parameters. The values for the feed rate were 0.1, 0.2, 0.3, and 0.4 (mm/rev); for the cutting speed, 100, 200, and 300 (m/min); and for the radial depth of cut, 1, 3, 13, and 20 (mm). The milling experiments were performed utilizing a three-axis numerically controlled milling center, and Table 2 exhibits all of the 48 cutting condition combinations along with the achieved tool’s life in each set. A flank wear width criterion equal to 0.15 mm was considered in the tests, resulting in an accumulative tool life T0.15, which was calculated with the aid of the following equation:
where V is the applied cutting speed, lcu composes the undeformed chip length, and NC0.15 corresponds to the number of cuts (NC) leading to a flank wear width equal to 0.15 mm.
Table 2.
The obtained experimental dataset for the coated tools’ life.
3. Results
3.1. Machine Learning Models
The integration of ML models in milling operations is revolutionizing the manufacturing industry, offering data-driven approaches to extend tool life, optimize performance, and reduce operational costs. By leveraging historical and real-time data collected from milling operations, ML algorithms were trained to identify patterns and relationships between the input parameters and the tool’s wear. ML techniques are particularly useful in creating regression models, which can predict the lifespan of the employed cutting insert as a continuous output, enabling manufacturers to optimize tool usage and reduce downtime. In particular, three learning-based models were developed within the present study that are capable of estimating the performance of the machining operation considering the values of crucial manufacturing parameters like feed rate (fz), velocity (Vc), and radial depth (ae). Taking into account the generated dataset presented in Table 2, various ML algorithms were employed to build regression models, namely SVR, KNN, and more advanced methods like ANN networks. These models are trained on the labeled dataset, where the target variable is the tool’s life and the input features are the milling conditions.
3.1.1. Artificial Neural Network
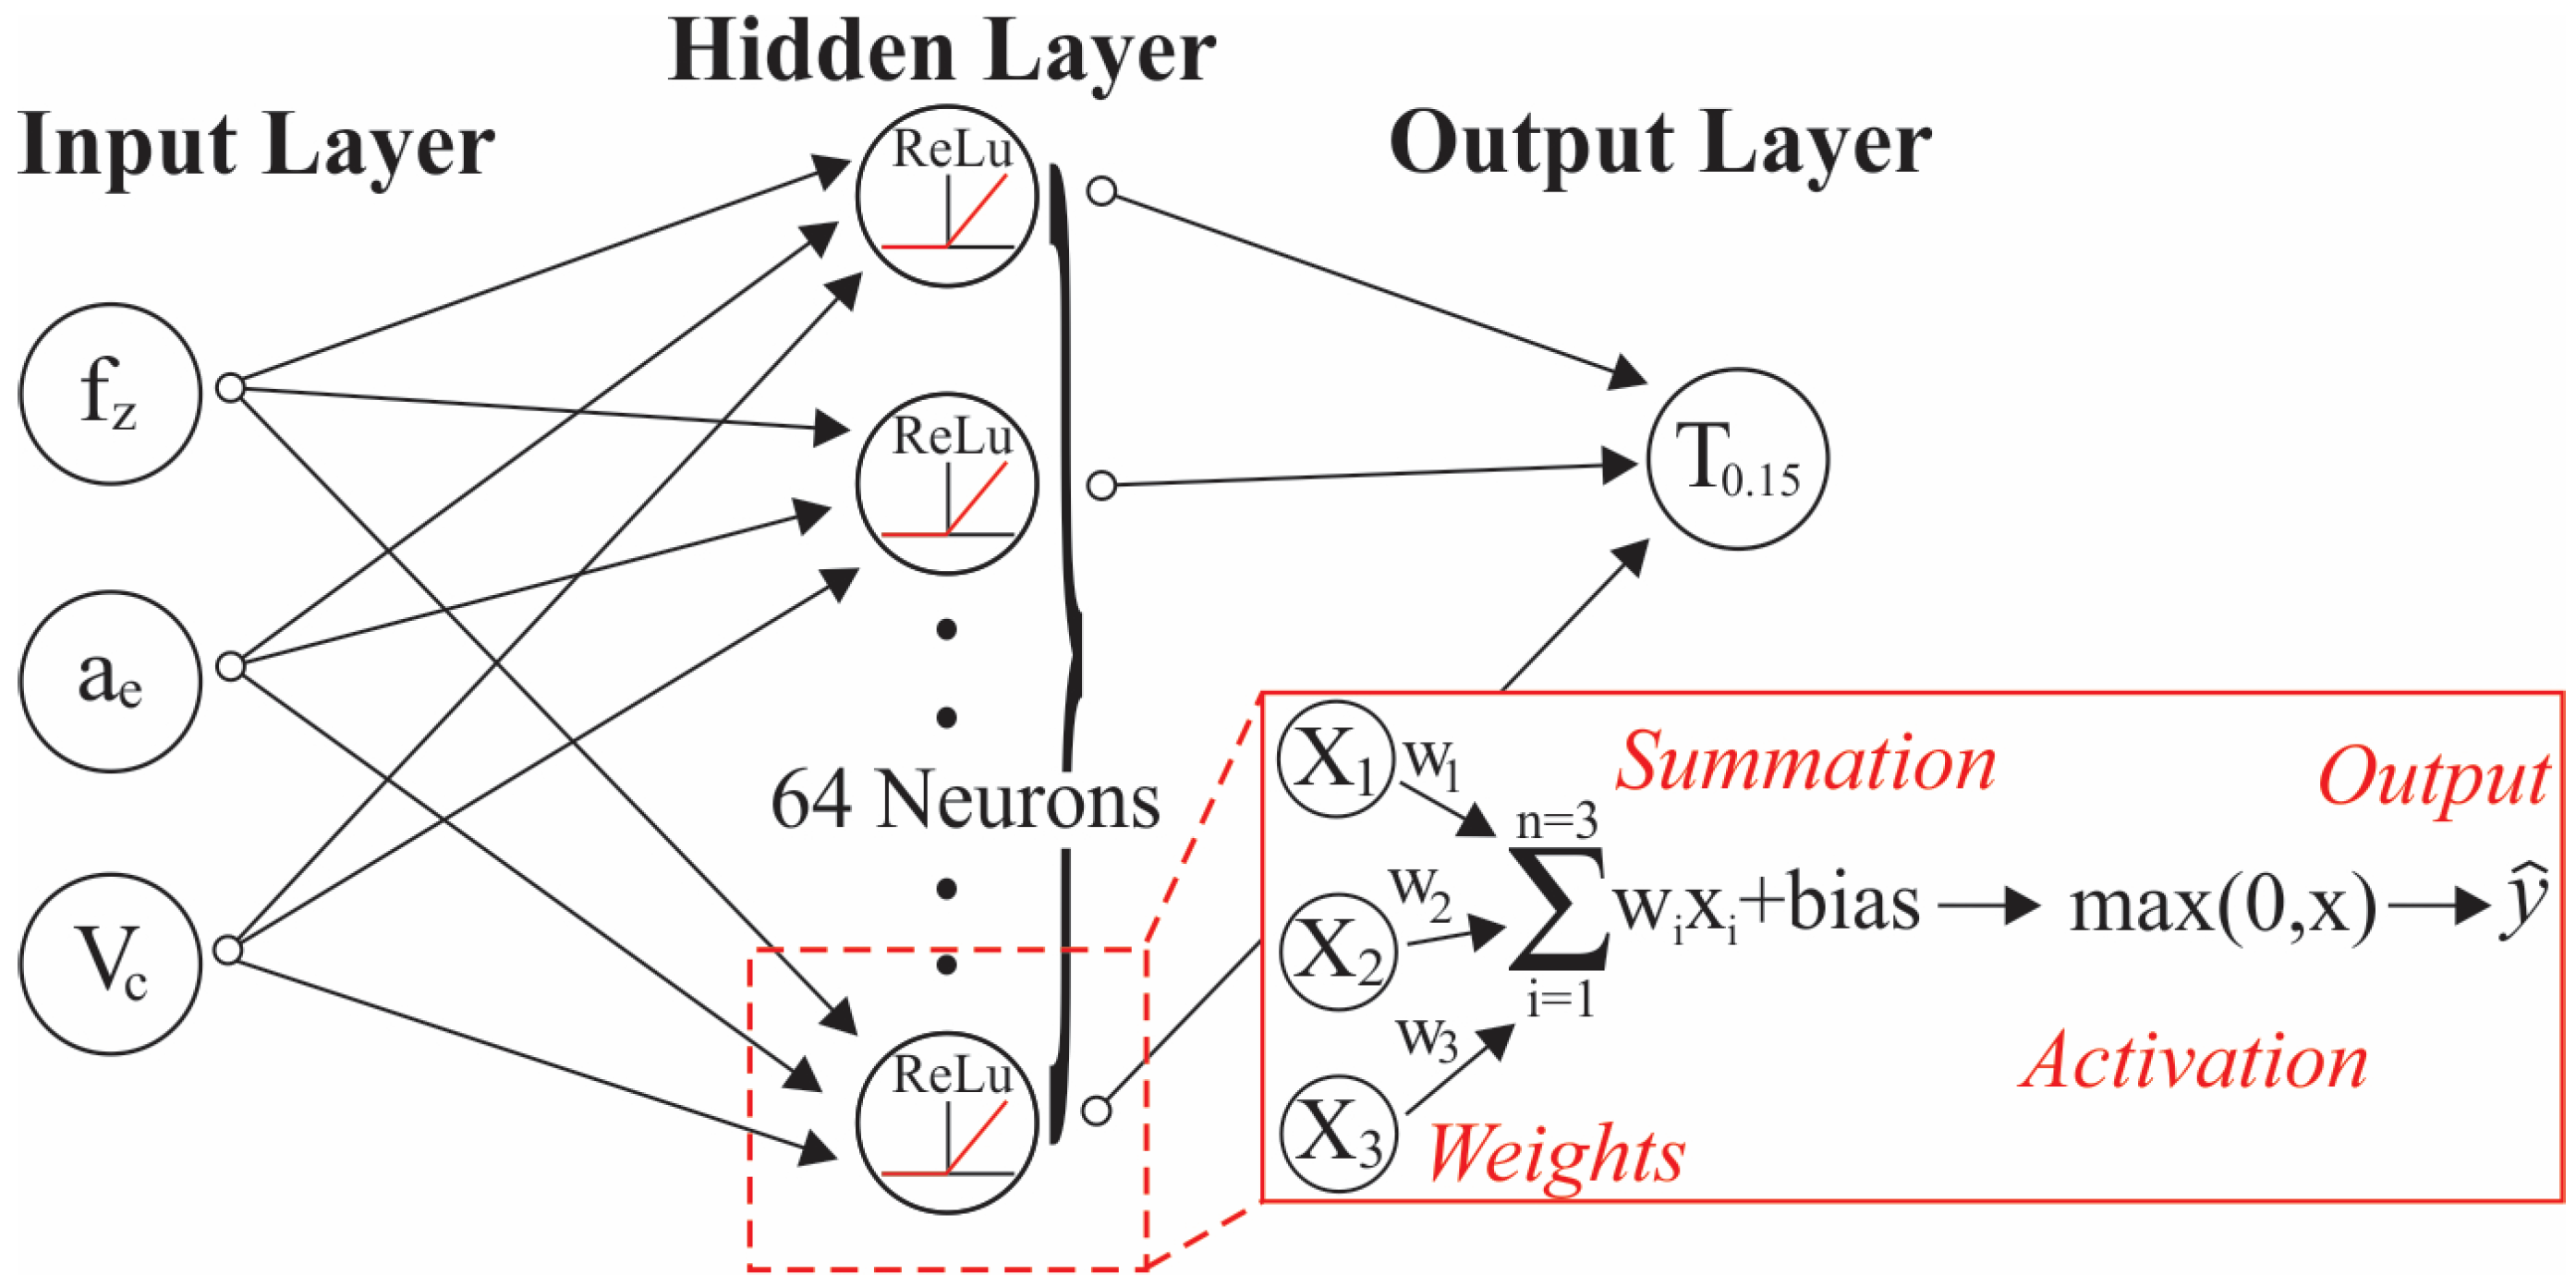
A regression-based AI model was developed using an ANN with PyTorch v2.6, where the model was designed to take three input features, pass them through a hidden layer with 64 neurons, and output a single continuous value as illustrated in Figure 5. The dataset was preprocessed using StandardScaler, which standardized the input features to have zero mean and unit variance before feeding them into the network. The ANN architecture consisted of an input layer with three neurons (representing fz, Vc, and ae), a hidden layer with 64 neurons that applied the ReLU (rectified linear unit) activation function, and a final output layer with a single neuron to produce the regression prediction that corresponds to the accumulative tool life of T0.15. The mean squared error loss (MSELoss) function was utilized to measure the difference between the predicted and actual values, ensuring the model minimized squared errors during training. The Adam optimizer was employed to update the model’s weights efficiently, balancing learning speed and convergence stability. Training was performed over 500 epochs, where the model iteratively adjusted its parameters using backpropagation. During each epoch, the optimizer refined the network weights based on the computed loss, gradually improving the accuracy of predictions. The final trained model was capable of capturing complex relationships within data, making it well-suited for regression tasks, as revealed in the next paragraph.
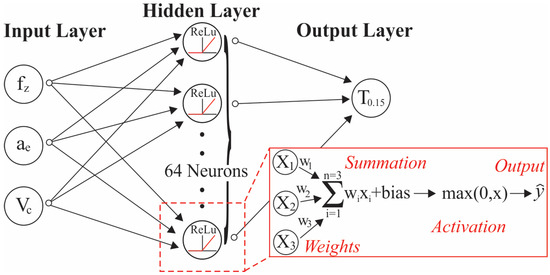
Figure 5.
Architecture of the developed artificial neural network.
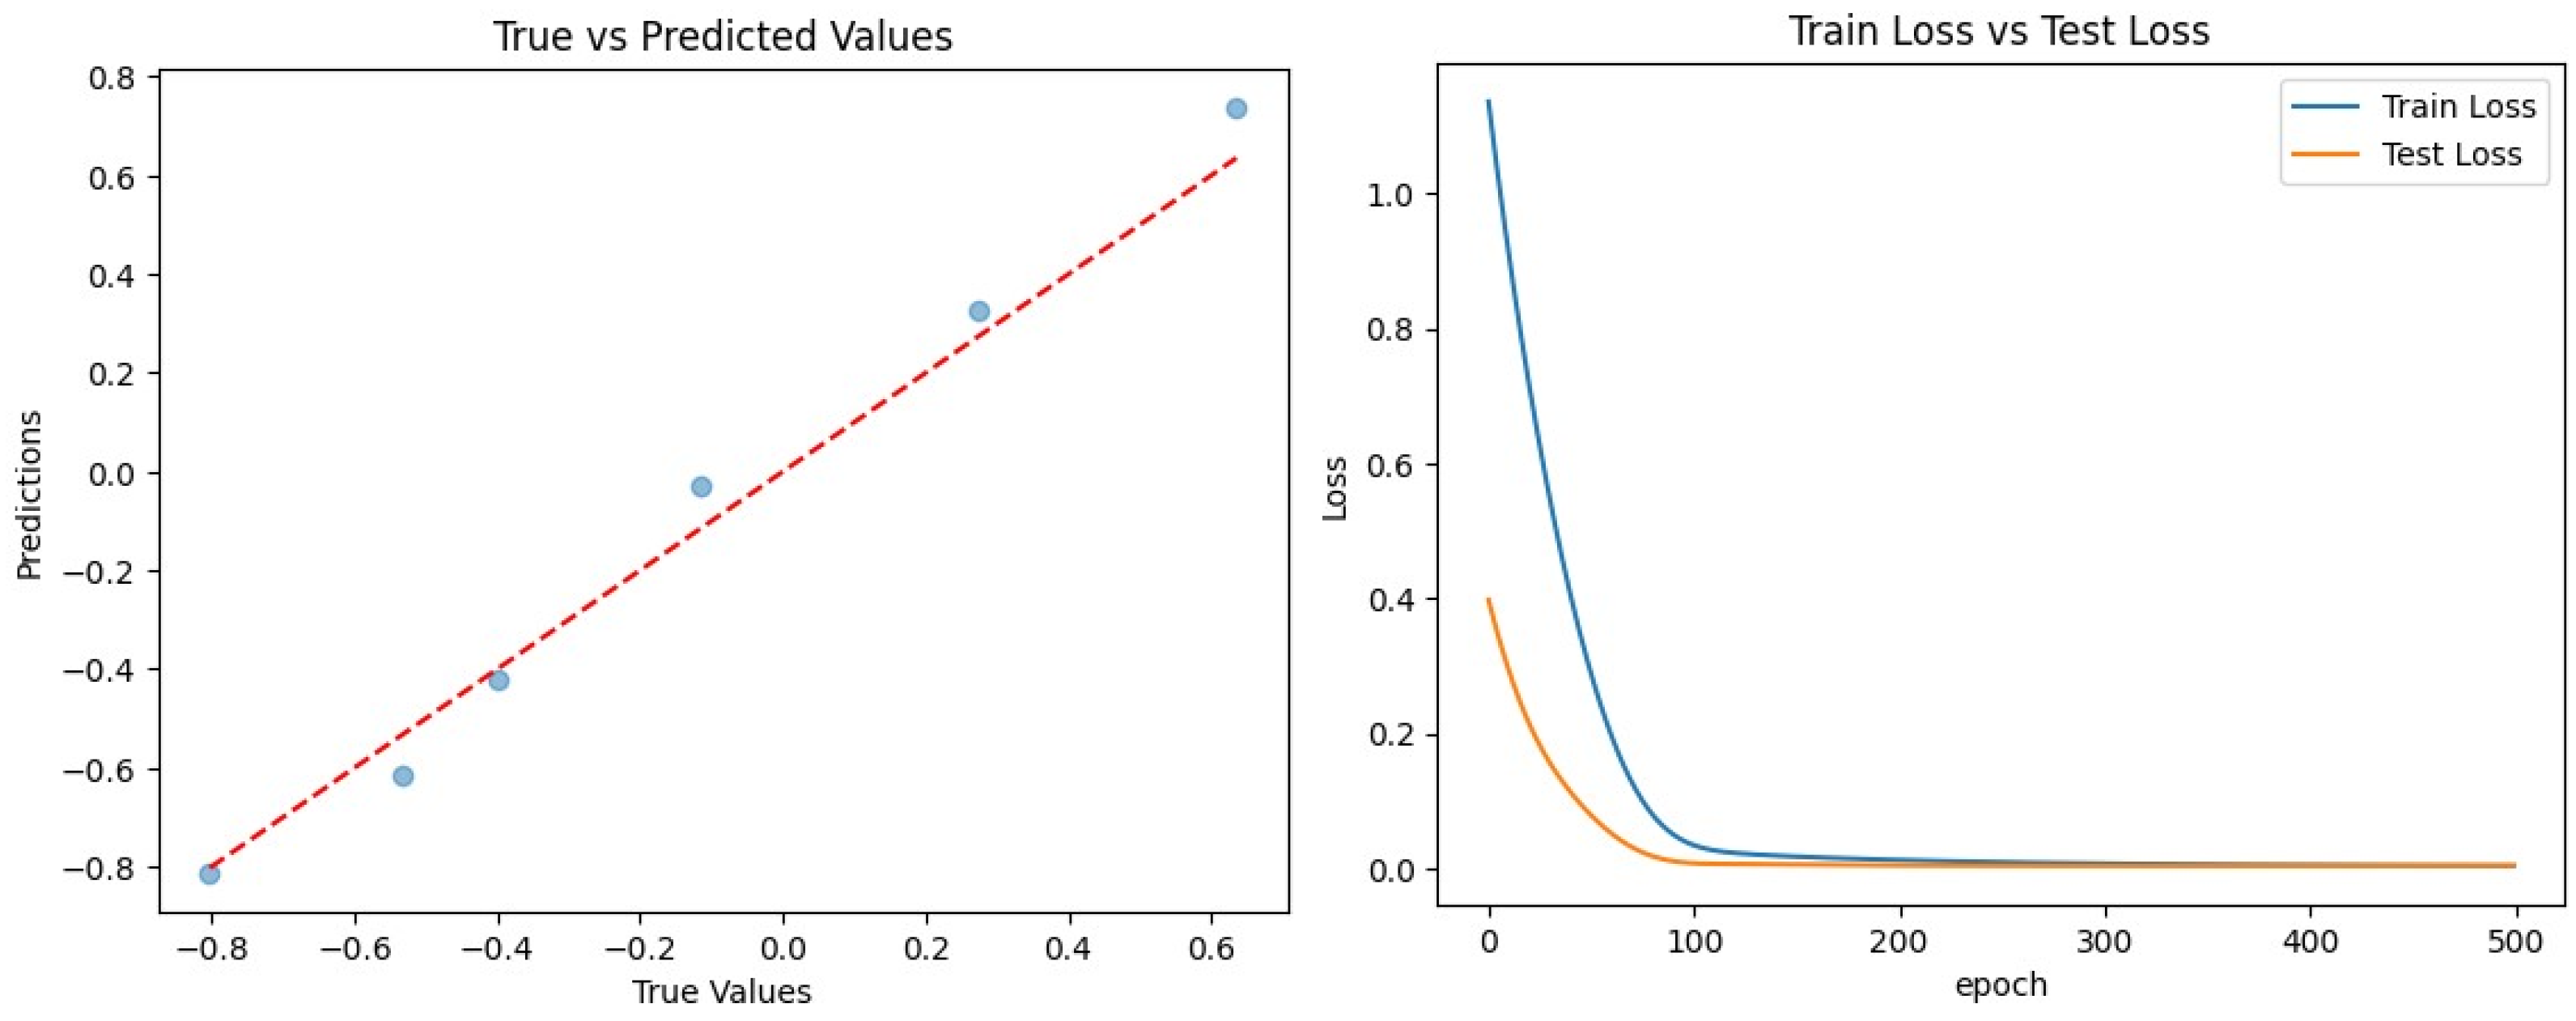
It must be noted that a test set was also considered in order to ensure that the developed AI models could perform efficiently not only on the data it was trained on but also on unseen conditions. Generally, the deployment of a test set in ML models composes a critical step in validating the robustness and generalization capability of the model, serving as a simulation of unseen data and providing an unbiased evaluation of the model’s performance. During the training phase, the model learns patterns and relationships from the training dataset, which consists of labeled examples. However, if the model is evaluated solely on this training data, there is a risk of overfitting, where the model memorizes the training data rather than learning to generalize from it. Overfitting leads to poor performance on new, unseen data, even if the model achieves high accuracy on the training set. Hereupon, a test set was also created that demonstrates the ability of the ML models to handle new inputs effectively. Regarding the efficiency of the ANN model, the left part of Figure 6 visually compares the actual target values with the model’s predicted outputs on the test set. Theoretically, a perfect model would produce a 45-degree diagonal line, meaning all predictions exactly match the true values, whereas in the case of the developed ANN, only small deviations are observed. Finally, the right part of Figure 6 tracks how the loss function evolves during the training phase, such as the training loss, which displays how well the ANN model fits the training data, while the test loss, which reflects generalization to unseen data.
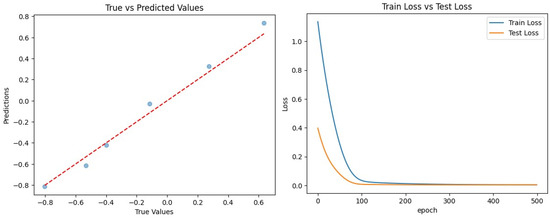
Figure 6.
Evaluation of the ANN model predicting the lifespan of a tool based on milling conditions.
3.1.2. Regression with KNN and SVR
Another two regression-based ML models were developed applying the KNN and SVR algorithms, with three input features (fz, Vc, ae) and a single continuous output value (T0.15), as in the case of the ANN. In particular, the KNN model operates by identifying the ‘k’ most similar data points (neighbors) in the training set and computing the output as a weighted or unweighted average of their values, allowing it to capture complex, non-linear relationships within the data. A small ‘k’ allowed the model to capture finer details but risked overfitting, whereas a larger ‘k’ smoothed predictions but could lead to underfitting. Unlike parametric models, KNN does not make explicit assumptions about the underlying data distribution but instead relies on distance metrics such as Euclidean distance to determine similarity between points, as displayed in Figure 7a. Considering the hyperparameters of the model: the number of neighbors was equal to fourteen, the algorithm used to compute the nearest neighbor was selected to be ‘kd_tree’, the employed weight function for the predictions was set to ‘distance’, the ‘leaf size’ passed to KDTree was equivalent to twenty, and the metric to use for distance computation was the ‘minkowski’.
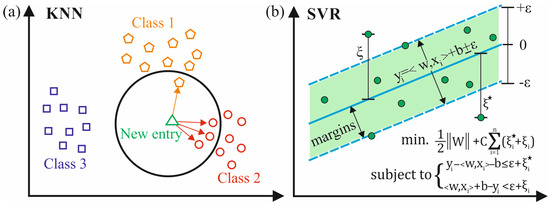
Figure 7.
Schematic representation of the (a) KNN and (b) SVR machine learning algorithms.
Regarding the SVR model, it extends the principles of support vector machines (SVM) to regression tasks, aiming to compute a function that best fits the data while maintaining a margin of tolerance around the true values. Unlike traditional regression models, SVR does not minimize the error directly but instead seeks to keep predictions within a specified threshold, known as the epsilon-insensitive tube, where deviations within epsilon are not penalized, as schematically illustrated in Figure 7b. Firstly, the input data were standardized to ensure proper distance measurements within the kernel function. During training, SVR identified a subset of the training samples, known as support vectors, which defined the regression function and contributed to predictions. By leveraging these support vectors and the non-linear mapping provided by the kernel, the SVR model effectively captured intricate patterns in the data, making it highly suitable for non-linear regression tasks where the relationship between inputs and outputs is relatively complex, as in the tool’s lifespan case. The main hyperparameters of the developed SVR model were the following: the kernel that was selected was ‘poly’, the degree of the polynomial kernel function was equivalent to three, the independent term in the kernel function ‘coef0’ = 1.68, and the ‘epsilon’ of the SVR model was equal to 0.1.
Table 3 presents the test set of the ML algorithms, which are additional milling experiments that were excluded from the training phase and instead used for validating the developed ML models. The table also illustrates the models’ performance in predicting the tool’s lifespan based on the applied values at certain milling conditions. To assess forecasting accuracy, three performance metrics were employed: mean squared error (MSE), mean absolute error (MAE), and the discrepancies between predicted and actual experimental values. These metrics were calculated using the following equations:
where N represents the total number of data points, while yₖ and ŷₖ denote the actual and predicted values, respectively.
Table 3.
Outcomes and metrics of the developed ML models on the test set.
Finally, it is worth mentioning that ML models typically require large datasets to generalize well. Nevertheless, when the underlying relationships in the data are not very complex, simpler ML models like regression could be effective even with small datasets [24]. These models possess fewer parameters and are less prone to overfitting, making them suitable for cases where the data exhibit clear, straightforward patterns. In addition, in situations where the data are of high quality, containing minimal noise and outliers, small datasets can still be effective. So, high-quality data with clear, meaningful patterns can enable models to learn robust relationships without requiring large volumes of data. Furthermore, as in the present investigated case, problems that are well-constrained and the feature space is relatively small, ML models can perform well with relatively limited data [25].
3.2. Tool Performance Estimation Using FEA
FEM is a powerful computational tool that can simulate the physical behavior of materials and structures under various conditions, making it well-suited for analyzing the complex interactions between cutting tools and workpieces during milling operations. Firstly, a simulation of the perpendicular impact test was conducted in order to estimate the maximum developed stresses on the coated cutting tool, aiding that way in the creation of the coating’s corresponding ‘Woehler’ diagram (also known as ‘Stress-Number of cycles’ diagram). Then, a FE model was employed to determine the cutting forces, predicting also the distribution of stresses on the cutting edge. Finally, the combination of the coating’s fatigue behavior, using the S-N diagram, coupled with the numerically calculated stresses on the cutting insert, provided the necessary insights to assess the lifespan of the coated tool using FEA.
3.2.1. Fatigue Endurance Strength Determination
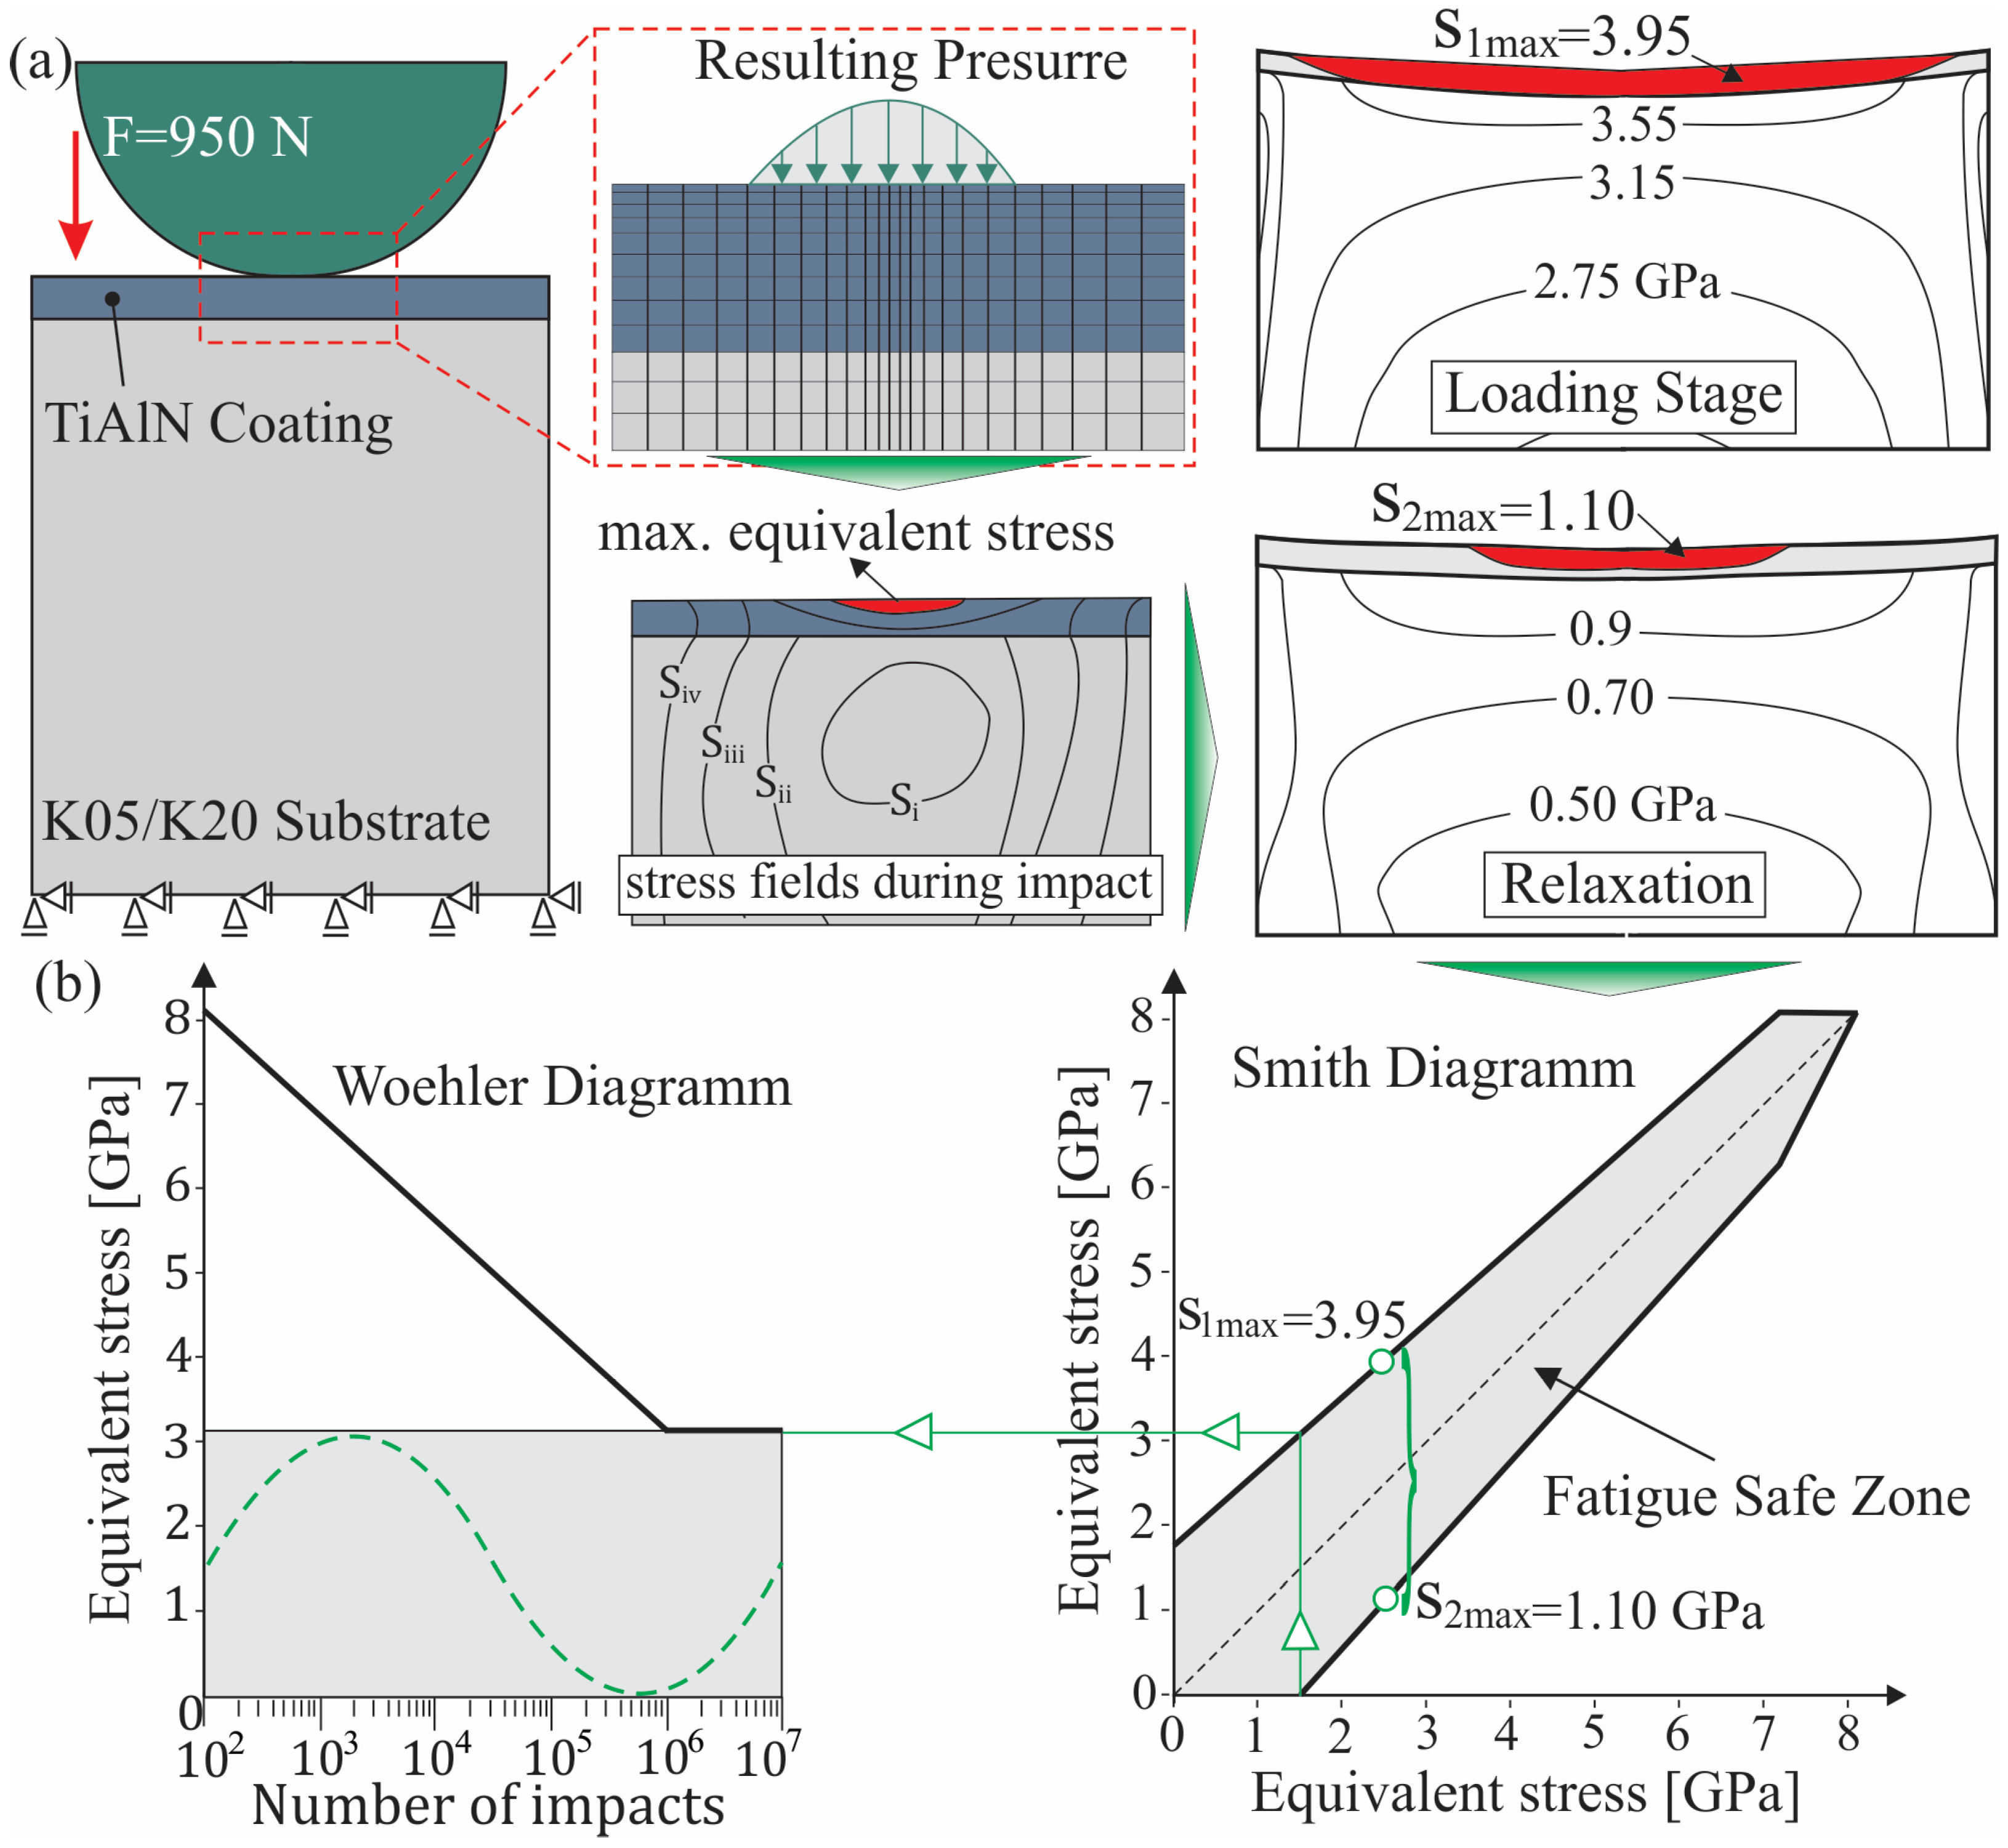
A 2D FE model was utilized using the ANSYS 2024 R2 software to analyze the coated surface response under quasi-static loads, which was based on [26]. The model, along with the boundary conditions and finite element discretization, is depicted in the left part of Figure 8a. To mesh the 2D geometry of the carbide ball, coating, and substrate, plane elements were selected, resulting in approximately 27,000 elements. In addition, contact elements were utilized to define the interface between the ball indenter and the coating, where the contact elements can be used in the simulation such that no penetration could take place between the indenter and the examined coating. Hence, the nodes on the contact surfaces will be prevented from unrealistic penetration into the volume of the target surface, as well as ensuring proper load transmission. In addition, the adhesion properties of the coating and substrate interface could also be simulated through the implementation of appropriate contact elements. However, it must be noted that in the case of the perpendicular impact test, the adhesion between the coating and its substrate does not affect its performance [26]. Moreover, a Y-axis constraint was imposed on the nodes at the bottom surface of the substrate. The deformation induced in the coating and substrate by the slow penetration of the carbide ball into the film was evaluated at predefined indentation depths. Using this FE model, both maximum indentation depth and remaining imprint depth (RID) after coating relaxation were determined as functions of the reaction force amplitude, leading to an equivalent resulting pressure, which deforms the investigated coated tool, as presented in the middle part of Figure 8a.
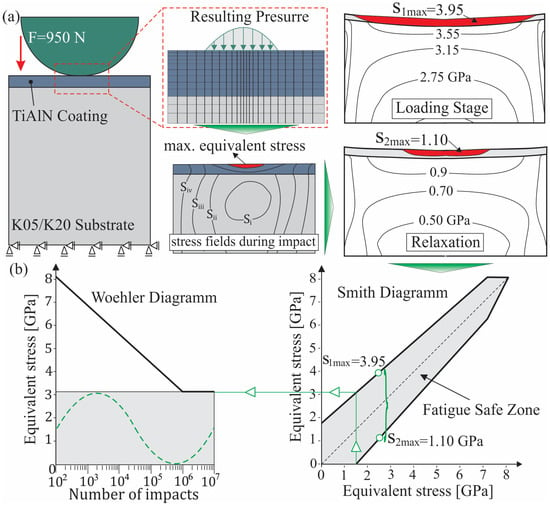
Figure 8.
(a) Numerical simulation of the perpendicular impact test; (b) Generation of Smith-like and Woehler diagrams based on FEA results.
Taking into account that at the maximum impact force Fmax, which corresponds to the fatigue threshold force of 950 N (see Figure 4), the correlated maximum equivalent stress in the coating during its loading is equal to 3.95 GPa, and the remaining one due to the substrate plastic deformation is 1.10 GPa. Utilizing these data, the Smith-like diagram exhibited in the right part of Figure 8b was constructed [19]. This diagram enables the determination of the coating fatigue endurance stress under cyclic loading, where the load varies from zero to a specified maximum value. Based on the obtained values, the Woehler-like diagram was also created, as depicted in the left part of Figure 8b. This diagram is essential for understanding how materials respond to repeated loading and predicting their fatigue life. Finally, it is worth mentioning that the data used to generate these graphs are independent of the coating’s adhesion, as the film experiences only vertical loading during the perpendicular impact test.
3.2.2. Stress Distribution During the Milling Process
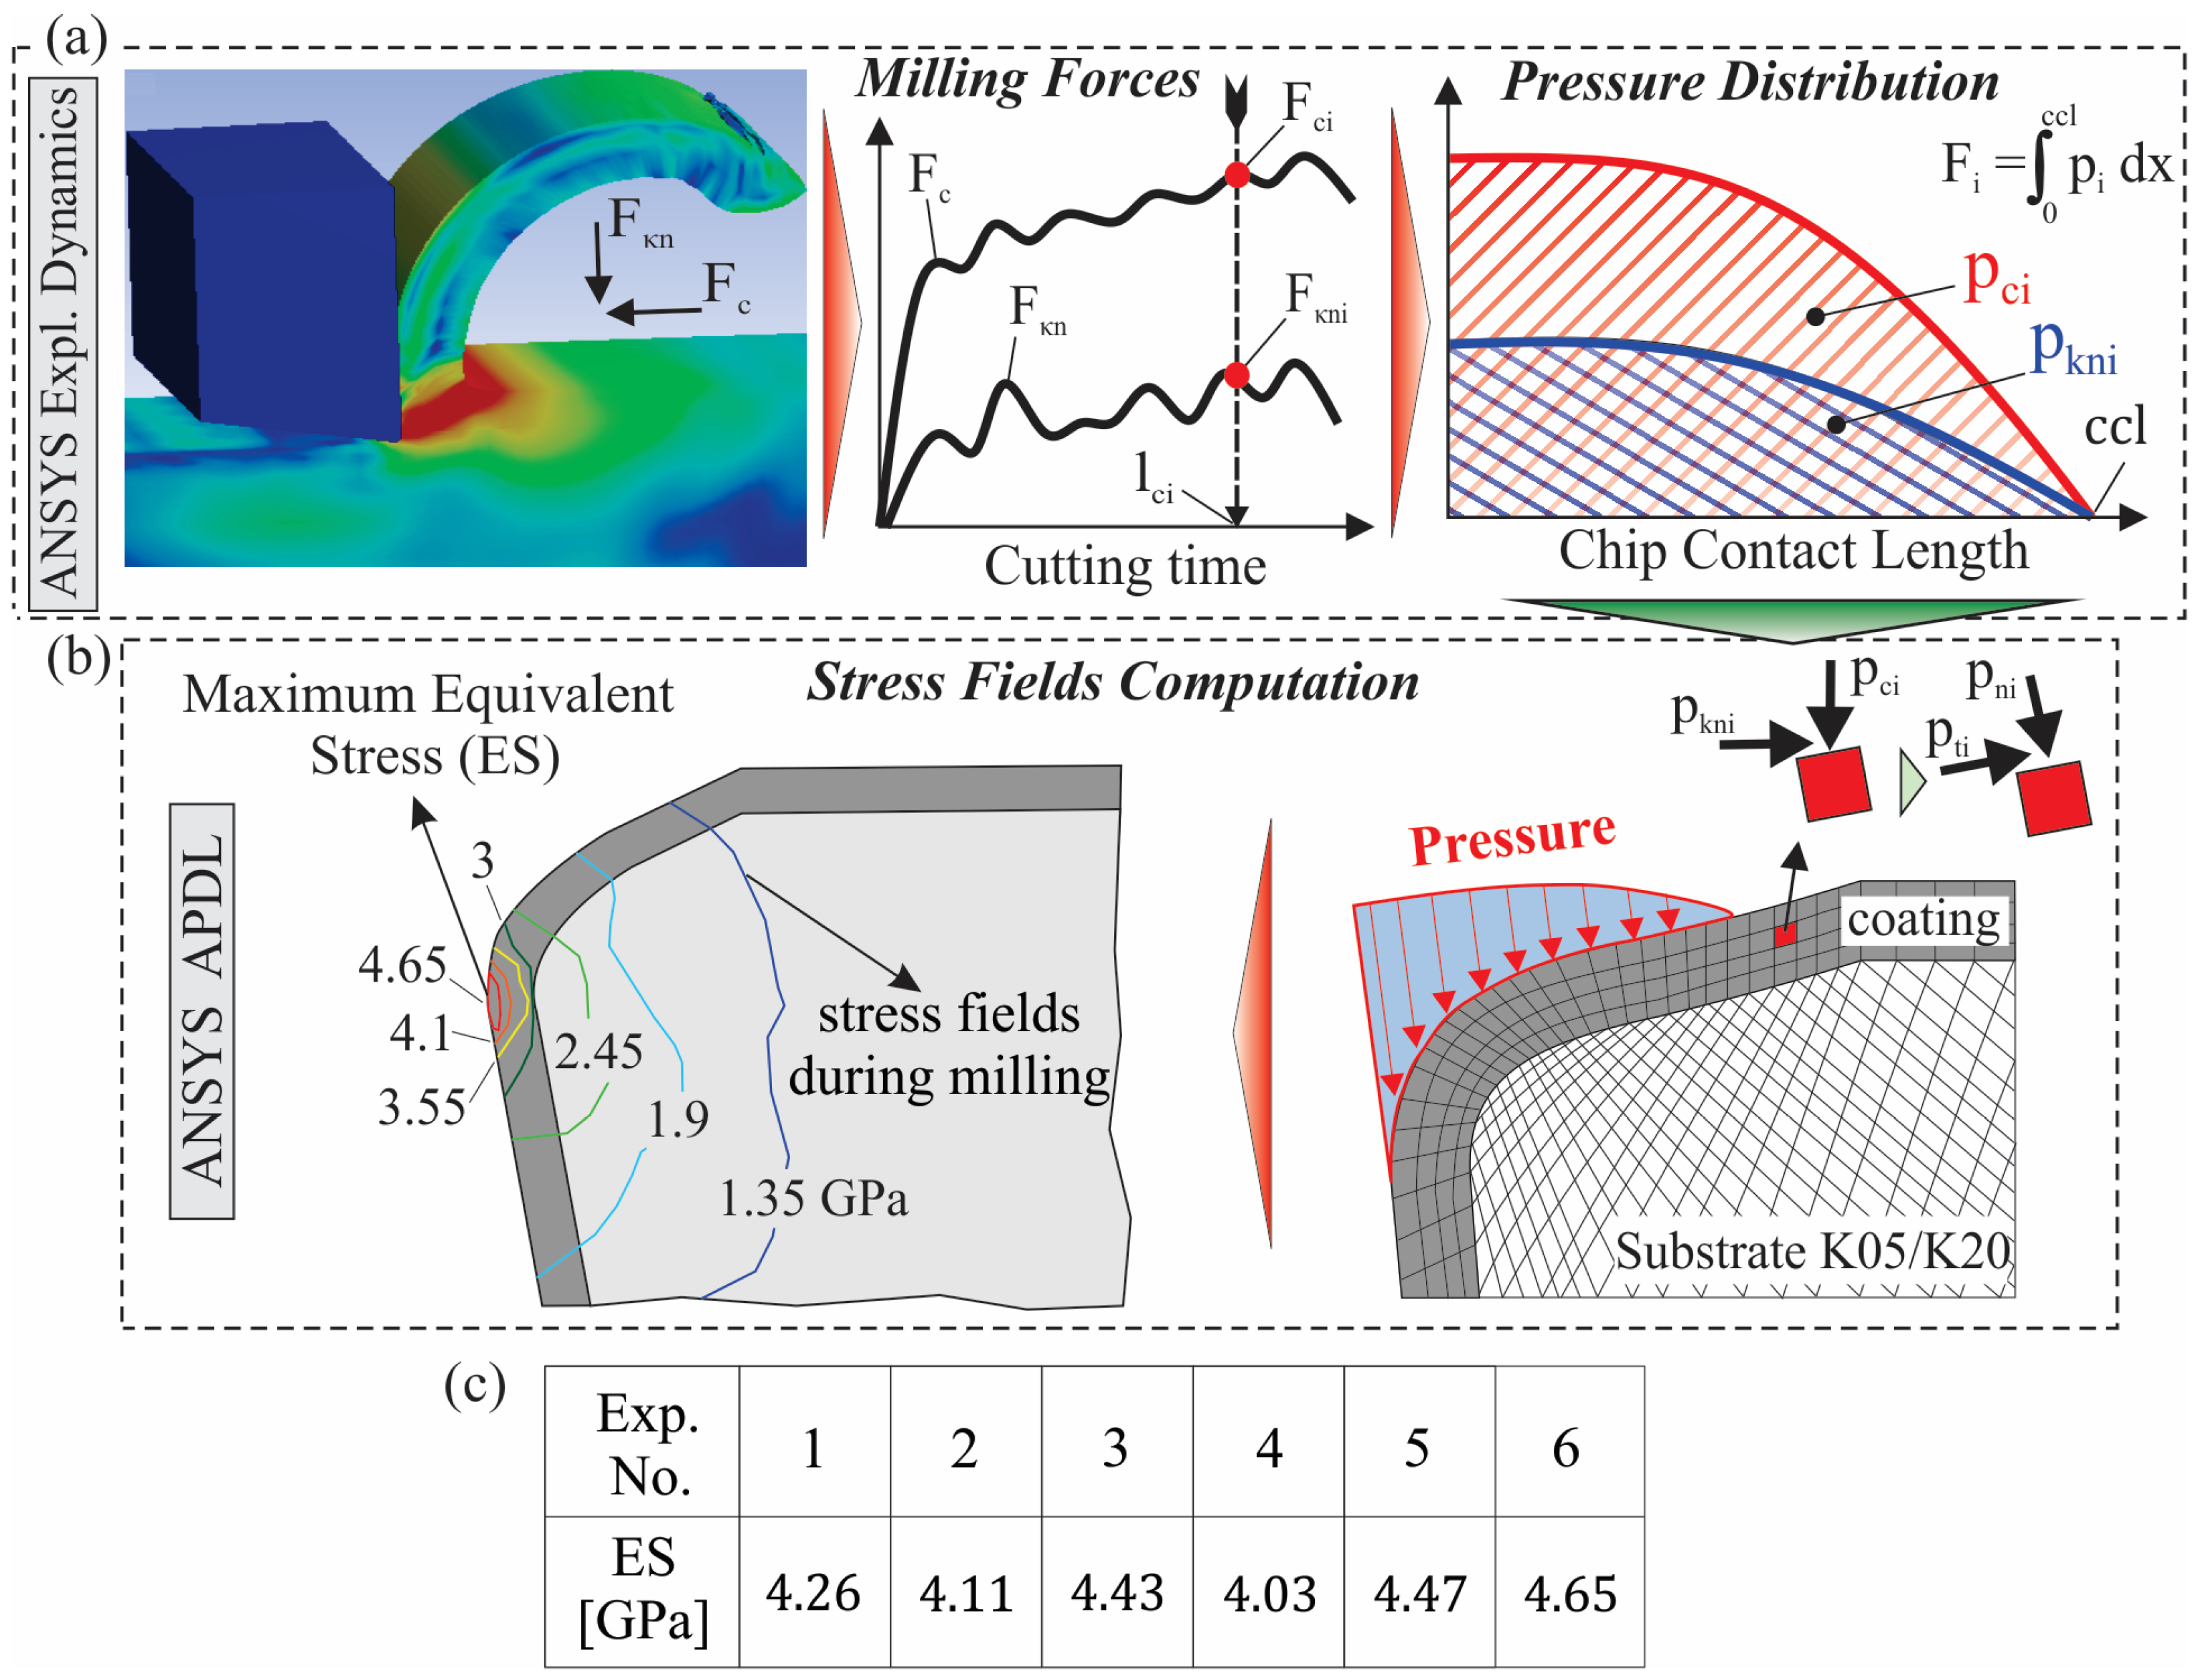
Considering the computation of the developed forces during the machining process, a numerical model was used applying explicit dynamics analysis based on [11]. In the FE model, the workpiece was treated as a plastic material, while the tool was considered rigid. The mechanical properties of the coated insert were modeled via a bilinear anisotropic approach to account for elastic–plastic deformations, based on Figure 2. To ensure an accurate FEA simulation of the milling procedure, a flow stress model was incorporated to represent the material’s constitutive behavior under large deformations and high-speed cutting conditions. In particular, the Johnson–Cook constitutive model was utilized, which describes the flow stress of the workpiece material as a function of strain, strain rate, and temperature. Moreover, the FE model incorporates the kinematics of face milling and the applied cutting conditions, including cutting speed, radial depth of cut, and feed rate. This approach accurately represents the motion of the cutting insert, its engagement with the workpiece material, and their subsequent interactions. The definition of the interactions between the cutting tool and the workpiece material was modeled using a frictional contact formulation. The stress fields generated during the process were concentrated near the contact area between the workpiece and the coated cutting insert, as depicted in Figure 9a. It is worth mentioning that the cutting forces Fc and Fkn are the result of the integration of the developed stress fields over the elements that remain in contact with the cutting tool and are calculated by the software. Next, these force distributions were approximated using a second-degree polynomial curve, where the pressure distributions (pci, pkni) along the chip contact length (ccl) are presented in the right section of Figure 9a. As a result, the associated superficial normal ‘pn’ and tangential ‘pt’ pressures were applied to the respective elements within the ccl, as illustrated in the right section of Figure 9b. Taking into account the calculated cutting forces as well as the chip contact lengths and by applying a FE simulation model of the material removal process based on [19], the developed stresses at the cutting edge were also determined, as illustrated in the left part of Figure 9b. Finally, results of the maximum equivalent stresses on the test set are documented in Figure 9c.

Figure 9.
(a) Computation of the milling forces and the corresponding pressure distribution; (b) Determination of the stress fields in the cutting edge; (c) Maximum equivalent stresses at the test set.
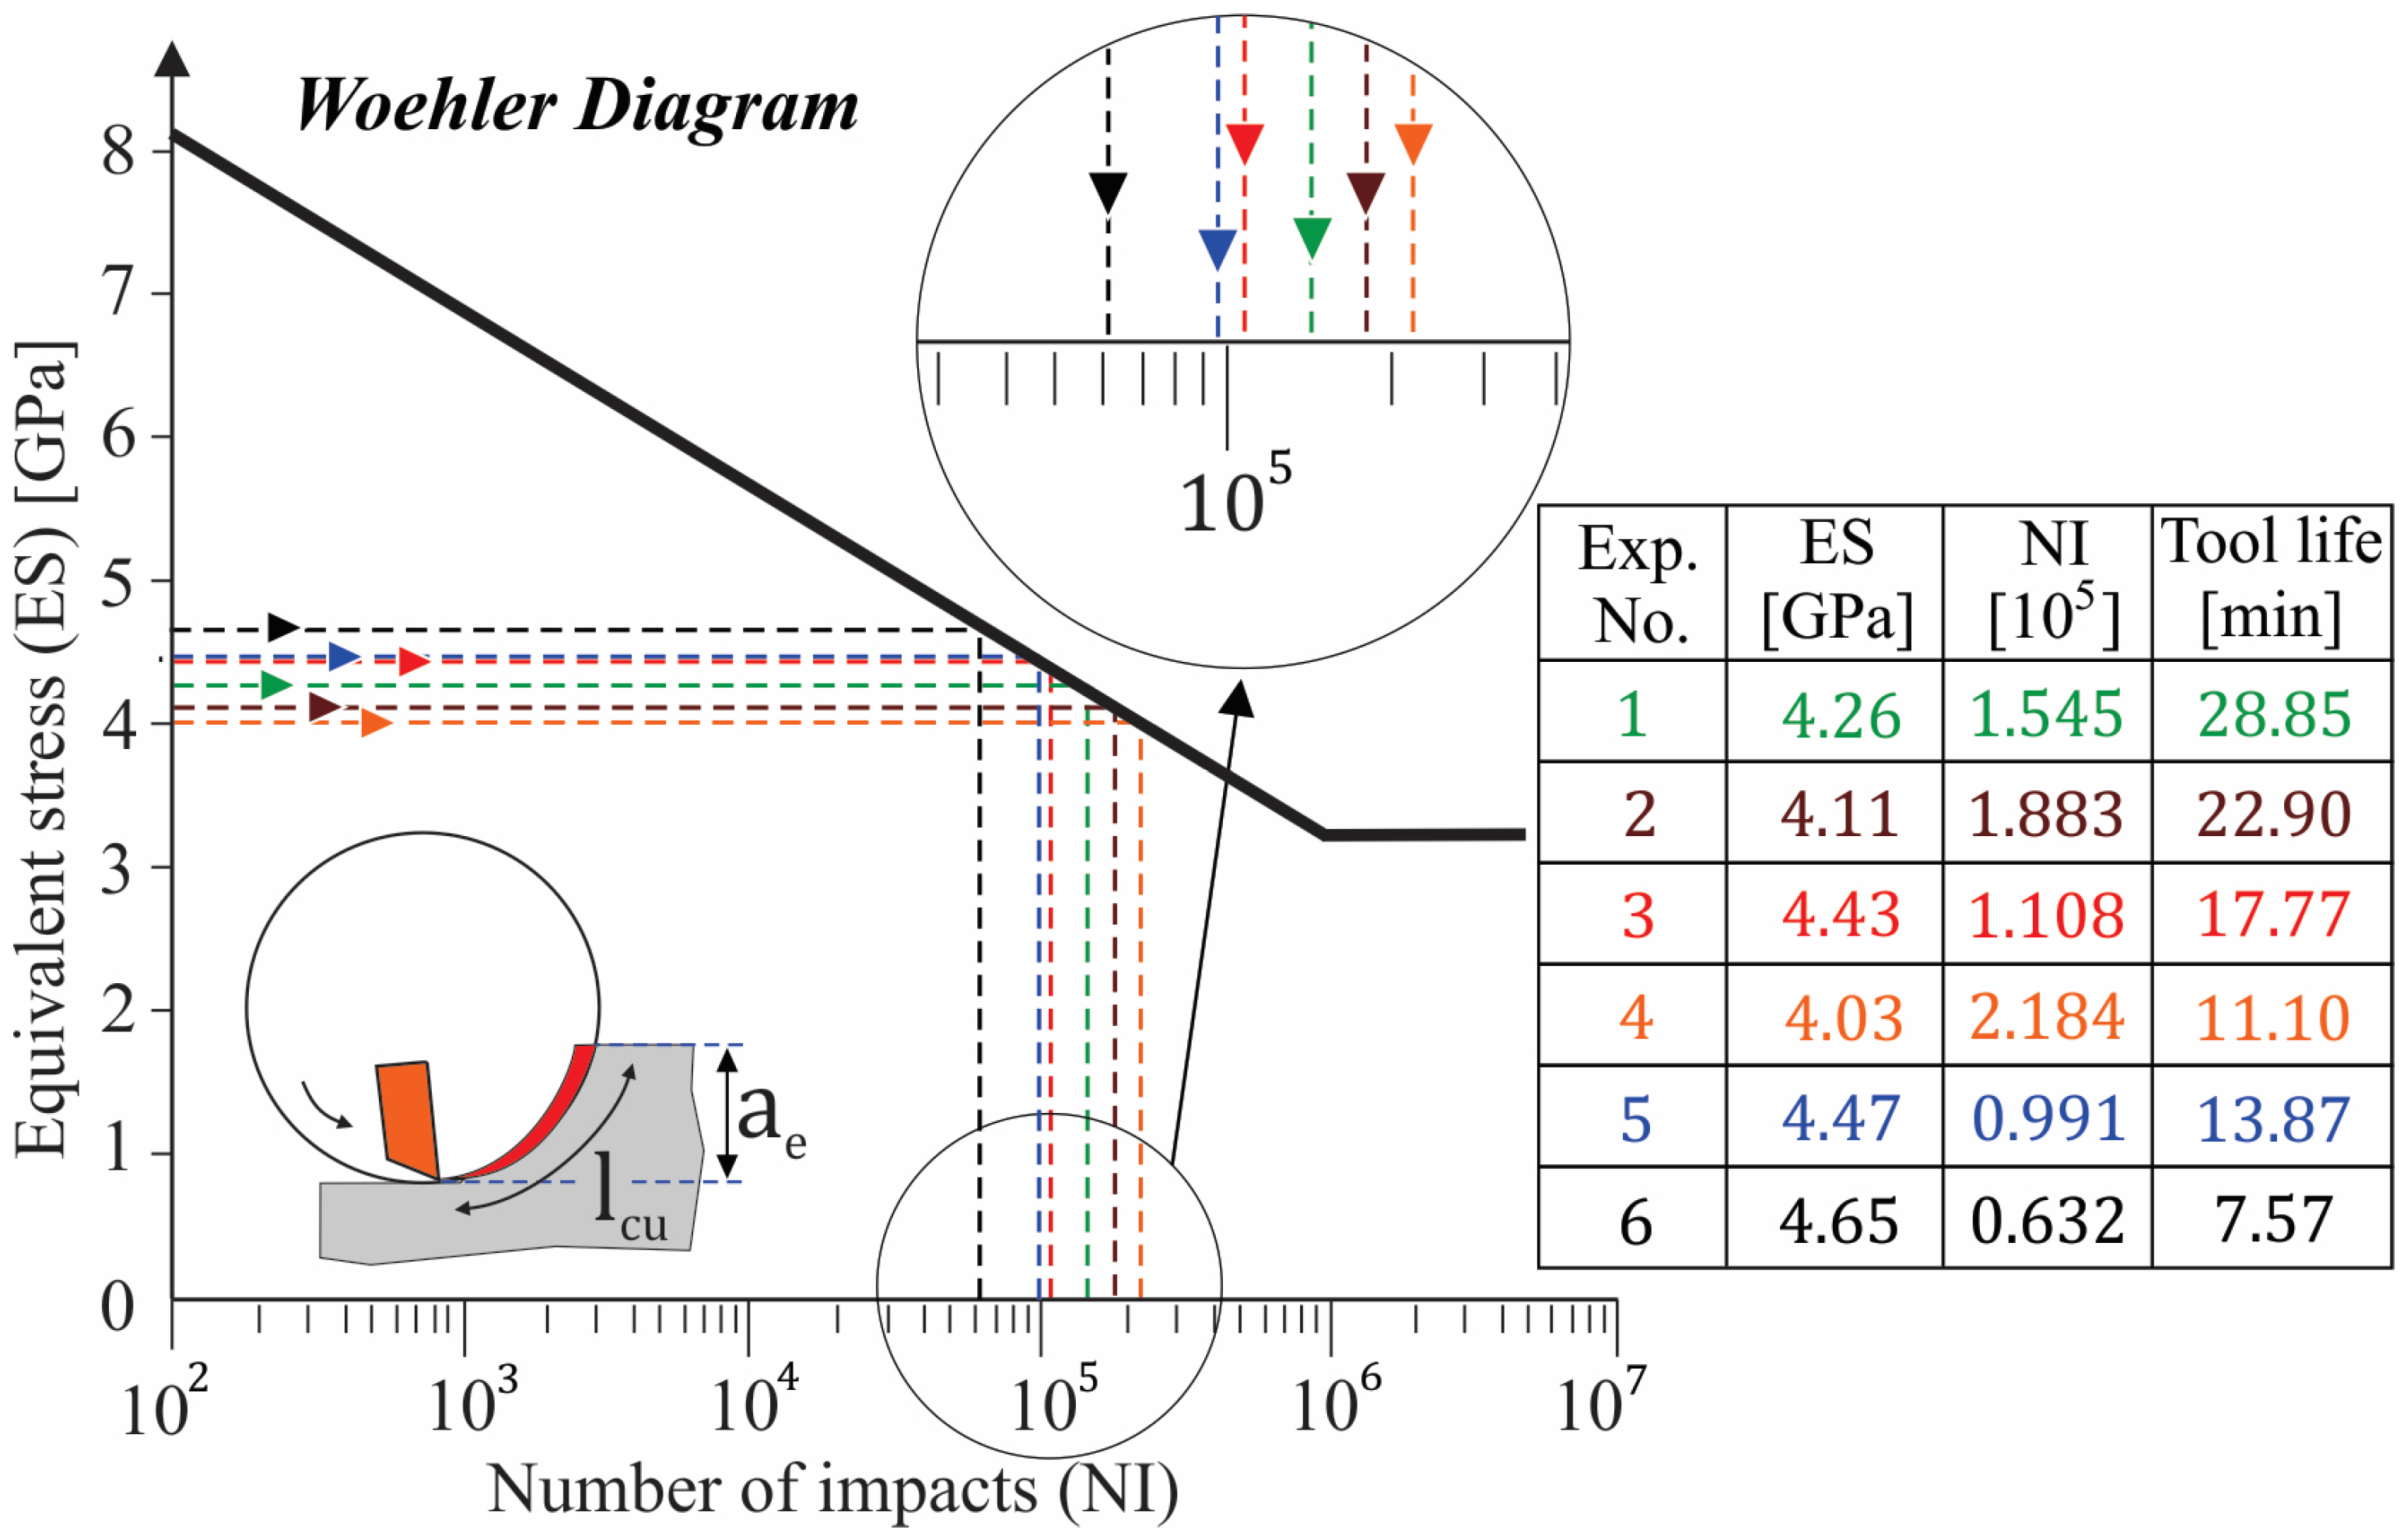
The outcomes of the milling FE simulation model coupled with the experimentally defined S-N diagram were considered in order to estimate the lifespan of the employed cutting tools on the test set. In particular, Figure 10 displays the forecasted number of cuts for each experiment of the test set, such as to achieve a flank wear equal to the predefined criterion. More specifically, the horizontal axis represents the number of cycles to failure (N) on a logarithmic scale, and the vertical axis shows the stress amplitude applied to the material during cyclic loading. Hence, the diagram indicates how many machining cycles the coated tool can endure before failure occurs. The main idea is that higher stress fields during the machining process (calculated via the FEM model in Figure 9c) would lead to a smaller number of cuts due to the determined Woehler diagram of Figure 8b [19].
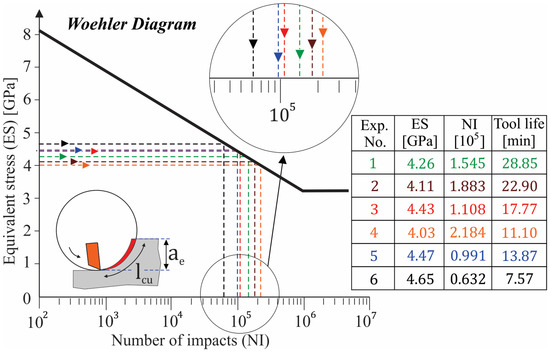
Figure 10.
FEM-based calculation of the coated tool’s lifespan based on the maximum stress of the cutting edge.
3.3. Comparison of Learning-Based Models and FEM-Supported Simulations
Figure 11 presents a comparison between the numerical predictions of the FE and the ML-based models on the test set. Three key conclusions can be drawn from the data shown in the figure. Firstly, the comparison indicates a strong agreement between the predicted and actual accumulated tool life across all the developed predictive models. In addition, ML models, particularly the ANN, demonstrated higher accuracy compared to the other approaches while also requiring significantly less computation time compared to the FE model. However, the FE simulation eliminates the need for time-consuming milling experiments, which are otherwise required to collect datasets for each specific workpiece material. Finally, despite the relatively small dataset, the AI-based forecasts exhibit a high level of convergence, further reinforcing their reliability.
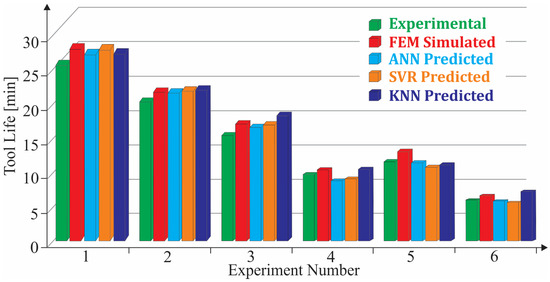
Figure 11.
Comparison between the experimental results and the numerical and AI predictions on the cutting tool’s performance.
3.4. Cutting Tool Performance Optimization
The developed ANN model was also utilized to calculate the optimal values of the milling parameters. Specifically, a routine is implemented to identify the machining conditions that maximize the lifespan of the coated inserts. Since a standard optimization routine might only identify local maxima of the objective function, a repetitive procedure was necessary to locate the global maximum. To address this, a loop with multiple starting points within the boundaries of the machining parameters was applied. This allowed the optimization algorithm to run repeatedly, computing various local maxima. During each iteration, the calculated local maximum was compared to the global maximum, and if an improvement was found, the global maximum was updated. The pseudocode for this methodology is provided in Algorithm 1. As a result of this process, the values of the milling parameters yielding the longest lifespan for the cutting tool were determined.
| Algorithm 1: Pseudocode for the parameter’s optimization pipeline |
| Input: Vcmin, Vcmax: min., max. Cutting speed aemin, aemax: min., max. Radial depth fzmin, fzmax: min., max. Feed rate Vstep, astep, fstep: Step increments 1: initialize: Vc = Vcmin, ae = aemin, fz = fzmin 2: global_max = 0 3: for Vc = Vcmin && Vc ≤ Vcmax 4: for ae = Vcmin && ae ≤ aemax 5: for fz = fzmin && fz ≤ fzmax 6: tensor_data = X (Vc, ae, fz) 7: Tool_Life_Prediction = Model(tensor_data) 8: if Tool_Life_Prediction > global_max then 9: Vcopt = Vc, aeopt = ae, fzopt = fz 10: global_ max = Tool_Life_Prediction 11: end if 12: fz = fz + fstep 13: end for 14: ae = ae + astep 15: end for 16: Vc = Vc + Vstep 17: end for 18: return global_ max, Vcopt, aeopt, fzopt Output: Optimized Manufacturing Conditions (Vc = 100, ae = 20, fz = 0.2) |
4. Conclusions
The optimization of coated carbide tools in milling procedures composes an essential task for improving machining efficiency, reducing costs, and extending tool life. The present work focused on investigating the wear behavior of coated tools under varying machining conditions, including feed rate, velocity, and radial depth, through an experimentally generated dataset. To enhance predictive capabilities, machine learning models such as artificial neural network, k-nearest neighbors, and support vector regression were developed to estimate tool life based on these machining parameters. In parallel, FEM simulations were also conducted to numerically model the wear mechanisms and analyze the milling process under different operating conditions. A comparative analysis of AI-based predictions and FEM simulations provided valuable insights into the strengths and limitations of both methodologies. In particular, AI techniques demonstrated the ability to deliver rapid, data-driven predictions with minimal computational cost, making them well-suited for real-time tool wear monitoring and manufacturing parameters optimization. On the other hand, FEM models provide a deeper physical understanding of the wear mechanisms at play, allowing for precise analysis of stress distribution, heat generation, and material deformation during milling procedures.
The findings of this study contribute to the ongoing advancements of predictive manufacturing and process optimization in machining operations. By leveraging AI-driven models for tool wear prediction and FEM simulations for in-depth wear analysis, manufacturers can make informed decisions to enhance tool life, reduce downtime, and improve overall productivity. Future research may further refine the developed models by integrating more experimental data for the training phase of the AI algorithms, as well as investigate additional parameters such as coating composition and tool geometry. Moreover, future work could study hybrid AI models that combine multiple learning techniques for improved accuracy. Furthermore, deep learning, reinforcement learning, and convolutional neural networks could also be explored to refine tool wear predictions. Ultimately, the combination of AI and FEM methodologies could offer a powerful framework for the intelligent optimization of coated tools in milling applications, paving the way for more efficient and cost-effective manufacturing processes. By exploring these future directions, the machining industry can further enhance the accuracy, reliability, and applicability of predictive models for tool wear estimation and process optimization, contributing to smarter and more efficient manufacturing systems.
Funding
This research received no external funding.
Institutional Review Board Statement
Not applicable.
Informed Consent Statement
Not applicable.
Data Availability Statement
The original contributions presented in this study are included in the article. Further inquiries can be directed to the corresponding author.
Conflicts of Interest
The author declares no conflicts of interest.
References
- Li, W. Advanced Manufacturing and Precision Machining. Appl. Sci. 2024, 14, 11642. [Google Scholar] [CrossRef]
- Silva, F.J.G.; Martinho, R.P.; Magalhães, L.L.; Fernandes, F.; Sales-Contini, R.C.M.; Durão, L.M.; Casais, R.C.B.; Sousa, V.F.C. A Comparative Study of Different Milling Strategies on Productivity, Tool Wear, Surface Roughness, and Vibration. J. Manuf. Mater. Process. 2024, 8, 115. [Google Scholar] [CrossRef]
- Abellán-Nebot, J.V.; Vila Pastor, C.; Siller, H.R. A Review of the Factors Influencing Surface Roughness in Machining and Their Impact on Sustainability. Sustainability 2024, 16, 1917. [Google Scholar] [CrossRef]
- Sambo, A.M.; Younas, M.; Njuguna, J. Insights into Machining Techniques for Additively Manufactured Ti6Al4V Alloy: A Comprehensive Review. Appl. Sci. 2024, 14, 10340. [Google Scholar] [CrossRef]
- Sousa, V.F.C.; Castanheira, J.; Silva, F.J.G.; Fecheira, J.S.; Pinto, G.; Baptista, A. Wear Behavior of Uncoated and Coated Tools in Milling Operations of AMPCO (Cu-Be) Alloy. Appl. Sci. 2021, 11, 7762. [Google Scholar] [CrossRef]
- Sousa, V.F.C.; Silva, F.J.G. Recent Advances on Coated Milling Tool Technology—A Comprehensive Review. Coatings 2020, 10, 235. [Google Scholar] [CrossRef]
- Muhamad, S.S.; Ghani, J.A.; Che Haron, C.H.; Yazid, H. Wear Mechanism of Multilayer Coated Carbide Cutting Tool in the Milling Process of AISI 4340 under Cryogenic Environment. Materials 2022, 15, 524. [Google Scholar] [CrossRef]
- Chowdhury, M.S.I.; Bose, B.; Rawal, S.; Fox-Rabinovich, G.S.; Veldhuis, S.C. Investigation of the Wear Behavior of PVD Coated Carbide Tools during Ti6Al4V Machining with Intensive Built Up Edge Formation. Coatings 2021, 11, 266. [Google Scholar] [CrossRef]
- Bazaz, S.M.; Ratava, J.; Lohtander, M.; Varis, J. An Investigation of Factors Influencing Tool Life in the Metal Cutting Turning Process by Dimensional Analysis. Machines 2023, 11, 393. [Google Scholar] [CrossRef]
- Paszkiewicz, A.; Piecuch, G.; Żabiński, T.; Bolanowski, M.; Salach, M.; Rączka, D. Estimation of Tool Life in the Milling Process—Testing Regression Models. Sensors 2023, 23, 9346. [Google Scholar] [CrossRef]
- Charalampous, P. Prediction of cutting forces in milling using machine learning algorithms and finite element analysis. J. Mater. Eng. Perform. 2021, 30, 2002–2013. [Google Scholar] [CrossRef]
- Reeber, T.; Wolf, J.; Möhring, H.-C. A Data-Driven Approach for Cutting Force Prediction in FEM Machining Simulations Using Gradient Boosted Machines. J. Manuf. Mater. Process. 2024, 8, 107. [Google Scholar] [CrossRef]
- Rodríguez, J.M.; Carbonell, J.M.; Jonsén, P. Numerical Methods for the Modelling of Chip Formation. Arch. Comput. Methods Eng. 2020, 27, 387–412. [Google Scholar] [CrossRef]
- Vishwakarma, P.; Sharma, A. 3D Finite Element Analysis of milling process for non-ferrous metal using deform-3D. Mater. Today Proc. 2020, 26, 525–528. [Google Scholar] [CrossRef]
- Munaro, R.; Attanasio, A.; Del Prete, A. Tool Wear Monitoring with Artificial Intelligence Methods: A Review. J. Manuf. Mater. Process. 2023, 7, 129. [Google Scholar] [CrossRef]
- Val, S.; Lambán, M.P.; Lucia, J.; Royo, J. Analysis and Prediction of Wear in Interchangeable Milling Insert Tools Using Artificial Intelligence Techniques. Appl. Sci. 2024, 14, 11840. [Google Scholar] [CrossRef]
- Kaliyannan, D.; Thangamuthu, M.; Pradeep, P.; Gnansekaran, S.; Rakkiyannan, J.; Pramanik, A. Tool Condition Monitoring in the Milling Process Using Deep Learning and Reinforcement Learning. J. Sens. Actuator Netw. 2024, 13, 42. [Google Scholar] [CrossRef]
- Gao, P.; Liang, Z.; Wang, X.; Li, S.; Zhou, T. Effects of different chamfered cutting edges of micro end mill on cutting performance. Int. J. Adv. Manuf. Technol. 2018, 96, 1215–1224. [Google Scholar] [CrossRef]
- Skordaris, G.; Bouzakis, K.-D.; Charalampous, P.; Kotsanis, T.; Bouzakis, E.; Bejjani, R. Bias Voltage Effect on the Mechanical Properties, Adhesion and Milling Performance of PVD Films on Cemented Carbide Inserts. Wear 2018, 404–405, 50–61. [Google Scholar] [CrossRef]
- Uddeholm. Available online: http://www.uddeholm.gr/Storage/Media/Shared/SteelBrochures/Impax%20Supreme/PB_impax_supreme_english.pdf (accessed on 1 March 2025).
- Abbas, A.T.; Abdelnasser, E.; Naeim, N.; Alqosaibi, K.F.; Al-Bahkali, E.A.; Elkaseer, A. Effect of Milling Strategy on the Surface Quality of AISI P20 Mold Steel. Metals 2024, 14, 48. [Google Scholar] [CrossRef]
- Wang, T.; Zha, X.; Chen, F.; Wang, J.; Lin, L.; Xie, H.; Lin, F.; Jiang, F. Research on cutting performance of coated cutting tools by a new impact test method considering contact stress condition caused by segmented chips. J. Manuf. Process. 2021, 68, 1569–1584. [Google Scholar] [CrossRef]
- Bouzakis, E.; Bouzakis, K.-D.; Skordaris, G.; Charalampous, P.; Kombogiannis, S.; Lemmer, O. Fatigue strength of diamond coating-substrate interface assessed by inclined impact tests at ambient and elevated temperatures. Diam. Relat. Mater. 2014, 50, 77–85. [Google Scholar] [CrossRef]
- Sevgin, F. Machine Learning-Based Temperature Forecasting for Sustainable Climate Change Adaptation and Mitigation. Sustainability 2025, 17, 1812. [Google Scholar] [CrossRef]
- Shobayo, O.; Adeyemi-Longe, S.; Popoola, O.; Okoyeigbo, O. A Comparative Analysis of Machine Learning and Deep Learning Techniques for Accurate Market Price Forecasting. Analytics 2025, 4, 5. [Google Scholar] [CrossRef]
- Bouzakis, K.-D.; Asimakopoulos, A.; Michailidis, N.; Kompogiannis, S.; Maliaris, G.; Giannopoulos, G.; Pavlidou, E.; Erkens, G. The inclined impact test, an efficient method to characterize coatings’ cohesion and adhesion properties. Thin Solid Film. 2004, 469–470, 254–262. [Google Scholar] [CrossRef]


Disclaimer/Publisher’s Note: The statements, opinions and data contained in all publications are solely those of the individual author(s) and contributor(s) and not of MDPI and/or the editor(s). MDPI and/or the editor(s) disclaim responsibility for any injury to people or property resulting from any ideas, methods, instructions or products referred to in the content. |
© 2025 by the author. Licensee MDPI, Basel, Switzerland. This article is an open access article distributed under the terms and conditions of the Creative Commons Attribution (CC BY) license (https://creativecommons.org/licenses/by/4.0/).