Article

Structural, Morphological and Thermoluminescence Properties of Mn-Doped Zinc Zirconate (ZnZrO3) Phosphors

by
Habtamu F. Etefa
* and
Francis B. Dejene
Department of Physics, Walter Sisulu University, Private Bag X-1, Mthatha 5117, South Africa
*
Author to whom correspondence should be addressed.
Appl. Sci. 2025, 15(7), 3761; https://doi.org/10.3390/app15073761
Submission received: 30 January 2025 / Revised: 11 March 2025 / Accepted: 18 March 2025 / Published: 29 March 2025

Abstract

:
We investigated the thermoluminescence (TL) properties of Mn-doped zinc zirconate (ZnZrO3:Mn) phosphors under beta (β) radiation. SEM revealed morphological changes with varying levels of Mn doping (0–5%), while XRD confirmed a pure cubic phase. Mn doping introduced luminescent centers, enhancing emission efficiency. Mn2+ ions facilitated green/red emissions (4T16A1), while Mn4+ contributed to deep-red emissions (2E → 4A₂), making the material suitable for optoelectronic applications. Compared to conventional phosphors, ZnZrO3:Mn exhibited superior thermal stability, enhanced luminescence, and tunable emissions. The TL dose−response showed a systematic peak shift to higher temperatures with increasing radiation dose, confirming its potential for use in accurate dosimetry. The TL glow curves displayed primary (349 K) and secondary (473 K) peaks that were influenced by heating-rate variations, which led to peak shifts and increased intensity. An innovative thermal-cleaning approach (110–336 °C) refined luminescence by stabilizing deeper traps while erasing shallow-trap signals. This combined effect of Mn doping and thermal treatment optimized ZnZrO3 phosphors’ structural, optical, and TL properties. These findings provide insights into their potential use in radiation dosimetry and display technologies, offering a new strategy for future perspective luminescent materials

1. Introduction

Thermoluminescence (TL) refers to the phenomenon whereby natural or synthetic materials emit light upon being heated to temperatures below their incandescence threshold. This process occurs in insulating or semiconductor materials that have been previously subjected to ionizing radiation, with the emission of light being activated during the heating process [1,2].
Substances based on zinc zirconate (ZnZrO3) are affordable and uncomplicated to work with. However, their temperature stability and sensitivity differ greatly and depend heavily on the preparation procedure [3]. A high damage threshold, exceptional optical homogeneity, transparency, phase-matching ranges, and a significant nonlinear coefficient are some of the special qualities of nonlinear optical crystal zirconate. For a variety of nonlinear optical applications, this material thus offers an enticing substitute for the resources that are currently being used [4]. To the best of our knowledge, the thermally stimulated luminescence (TSL) properties of XZnZrO3 (X = Mn) materials have not been extensively studied in published research. Phosphors play a pivotal role in a wide range of applications, including solid-state lighting, display technologies, radiation dosimetry, and optoelectronic devices [5]. Among the various phosphor materials, zinc zirconate (ZnZrO3) has garnered significant attention due to its unique structural, optical, and thermal properties, which make it a promising candidate for use in advanced luminescent materials [6]. However, the synthesis of high-quality ZnZrO3 phosphors remains a challenging task, primarily due to issues related to phase purity, morphological control, and luminescence efficiency [6,7]. These challenges are further compounded during attempts to incorporate dopants, such as manganese (Mn), to enhance the material’s optical properties.
One of the primary challenges in synthesizing ZnZrO3 phosphors is the need to achieve a single-phase material with minimal impurities. The formation of secondary phases, such as ZnO or ZrO2, during synthesis can significantly degrade the luminescent performance of the phosphor [8,9]. Additionally, controlling the morphology of ZnZrO3 particles is critical, as particle size and shape directly influence the material’s optical properties and its suitability for specific applications. For instance, irregular or agglomerated particles can lead to inefficient light emission and poor dispersion in host matrices [10]. Another significant issue is the optimization of thermoluminescence (TL) properties, which are essential for applications in radiation dosimetry [8]. The TL characteristics of ZnZrO3 phosphors are highly sensitive to synthesis conditions, dopant concentration, and defect structures within the material. While Mn doping has been shown to improve the luminescence efficiency of ZnZrO3 by introducing new energy levels within the bandgap, achieving the optimal dopant concentration without inducing quenching effects remains a critical challenge. In light of these challenges, this study aims to investigate the structural, morphological, and thermoluminescence properties of Mn-doped ZnZrO3 phosphors. By systematically exploring the synthesis parameters and dopant concentrations, we seek to address the existing problems in the field and contribute to the development of high-performance ZnZrO3-based phosphors. The findings of this research are expected to provide valuable insights into the design and optimization of luminescent materials for advanced technological applications.
For the examination of the intricate TL glow curves of the studied samples, the VHR and PS methods provide relatively straightforward and effective ways to estimate kinetic parameters [11,12]. Through these methods, additional information about capturing mechanisms and the motion of charge carriers during thermoluminescence may be obtained; such results would supplement the findings obtained via the VHR and PS procedures [10,13,14]. Like that in borates, the luminescence emission in zinc zirconate can also be influenced by various defects in its crystal lattice. Oxygen vacancies are common in ZnZrO3 and act as luminescence centers [10]. These defects create localized energy states within the bandgap, which can trap charge carriers (electrons or holes). Upon thermal or optical excitation, the recombination of these carriers can result in luminescent emission. Vacancies at the zinc or zirconium lattice sites may also affect the luminescence properties by altering the local electronic environment [15,16]. These vacancies could contribute to the creation of donor or acceptor levels, impacting the emission spectra. The TL behaviors of the Eu-activated ZnB2O4 host lattice have been explored at beta doses ranging from 0.1 to 10 Gy, according to a study by T. Dogan et al. [17]. Similarly, Francis and Habtamu stated that the CaB4O7:Eu3+ phosphors host lattice has been investigated at beta doses ranging from 77.1 to 185.04 Gy [18]. These studies followed up on the results obtained in previous work. Other studies have examined how the TL behavior of Eu-activated ZnB2O4 changes with different heating speeds. To assess the dose−response relationship, specimens were exposed to beta-radiation doses ranging from 10 to 1000 Gy, as stated by G. Souadi et al. [19]. At 1000 Gy, the thermoluminescence (TL) intensity peaked, although it never reached saturation [20]. A thorough examination of the thermoluminescence glow curve was performed on Eu-doped Li2MoO4 utilizing various techniques, including the Hoogenstraaten method, the initial rise method (IR), a TM-Tstop experiment, and varying heating rates (VHR), to ascertain the parameters of the peaks. Another study by Halefoglu et al. revealed an abnormal effect on heating rate with a beta dose of 5 Gy in the region of 0.5–20 °C s−1 [21,22]. Mn-doped CaSO4 phosphors have gained significant attention due to their unique structural and thermoluminescence properties [23]. These phosphors are widely used in various applications such as radiation dosimetry, luminescent devices, and optoelectronic devices [24]. Zinc zirconate (ZnZrO3) phosphors have drawn a great deal of interest because of their special thermoluminescence and structural characteristics. Numerous applications, including radiation dosimetry, luminous devices, and optoelectronic devices, use these phosphors extensively [25]. Due to their intriguing qualities, such as being non-toxic, having good sensing behavior, and having increased photocatalytic efficacy, zinc zirconium oxide (ZnZrO3) nanocomposites were chosen for this research [26,27]. Due to their notable qualities and potential uses in transparent conducting, zinc zirconium oxide nanocomposites are appealing to materials researchers [28]. However, research on nanocomposites of zinc and zirconium oxide is lacking in this area. Physical, chemical, and biosynthetic approaches have been used to synthesize bimetallic oxide nanocomposites and transition metal nanocomposites in the past few years. Both physical and chemical approaches have traditionally relied on environmentally hazardous, expensive, time-consuming, and intricate processes involving toxic reagents, high temperatures, and specialized equipment. Both physical and chemical methods have involved the incorporation of external additives during the reactions [8,29,30].
The primary objective of this study is to investigate the impact of manganese (Mn) doping on the crystalline structure of zinc zirconate (ZnZrO3:Mn) phosphors. This involves a detailed analysis of changes in lattice parameters, coordination environments, and the formation of defects or impurities within the crystal lattice. The study also aims to comprehensively evaluate the thermoluminescence (TL) of the glow-curve properties of Mn-doped zinc zirconate (ZnZrO3:Mn) phosphors. Key parameters such as sensitivity, dose−response, thermal stability, variable heating rate (VHR) behavior, and fading were examined to assess their potential for dosimetric applications. Ultimately, the goal is to enhance the structural integrity and luminescence efficiency of Mn-doped zinc ZnZrO3:Mn phosphors, optimizing their performance for thermoluminescence dosimetry and various optoelectronic applications. However, particular attention was given to the structural, morphological and TL glow properties of the ZnZrO3:Mn phosphor material.

2. Experimental Details

2.1. Procedure

The composite synthesis process involved using 80 wt.% zirconium butoxide dissolved in 1-butanol (sourced from Aldrich, St. Louis, MO, USA) and 98% zinc nitrate alongside nitric acid and ammonia solution (from Merck, Rahway, NJ, USA). The detailed preparation methodology followed that used in our earlier work [31]. In this procedure, zirconium (IV) butoxide was reacted with concentrated nitric acid to form a zirconium nitrate solution. The solution was subsequently diluted with 50 mL of de-ionized water and mixed with a 0.03 M zinc nitrate solution. Six samples were prepared by incorporating different molar concentrations of manganese acetate (Mn+3 ions) per mole. Citric acid was added as a fuel and complexing agent to enhance the process. The pH of the mixture was adjusted to pH 7 using an ammonia solution under continuous stirring. The precursor mixtures were then subjected to heating until spontaneous combustion occurred, driven by the self-propagating exothermic reaction. The resulting lightweight, fluffy composite powders were carefully ground using a mortar and pestle and subsequently calcined at 600 °C for 2 h, as described in previous work [32].

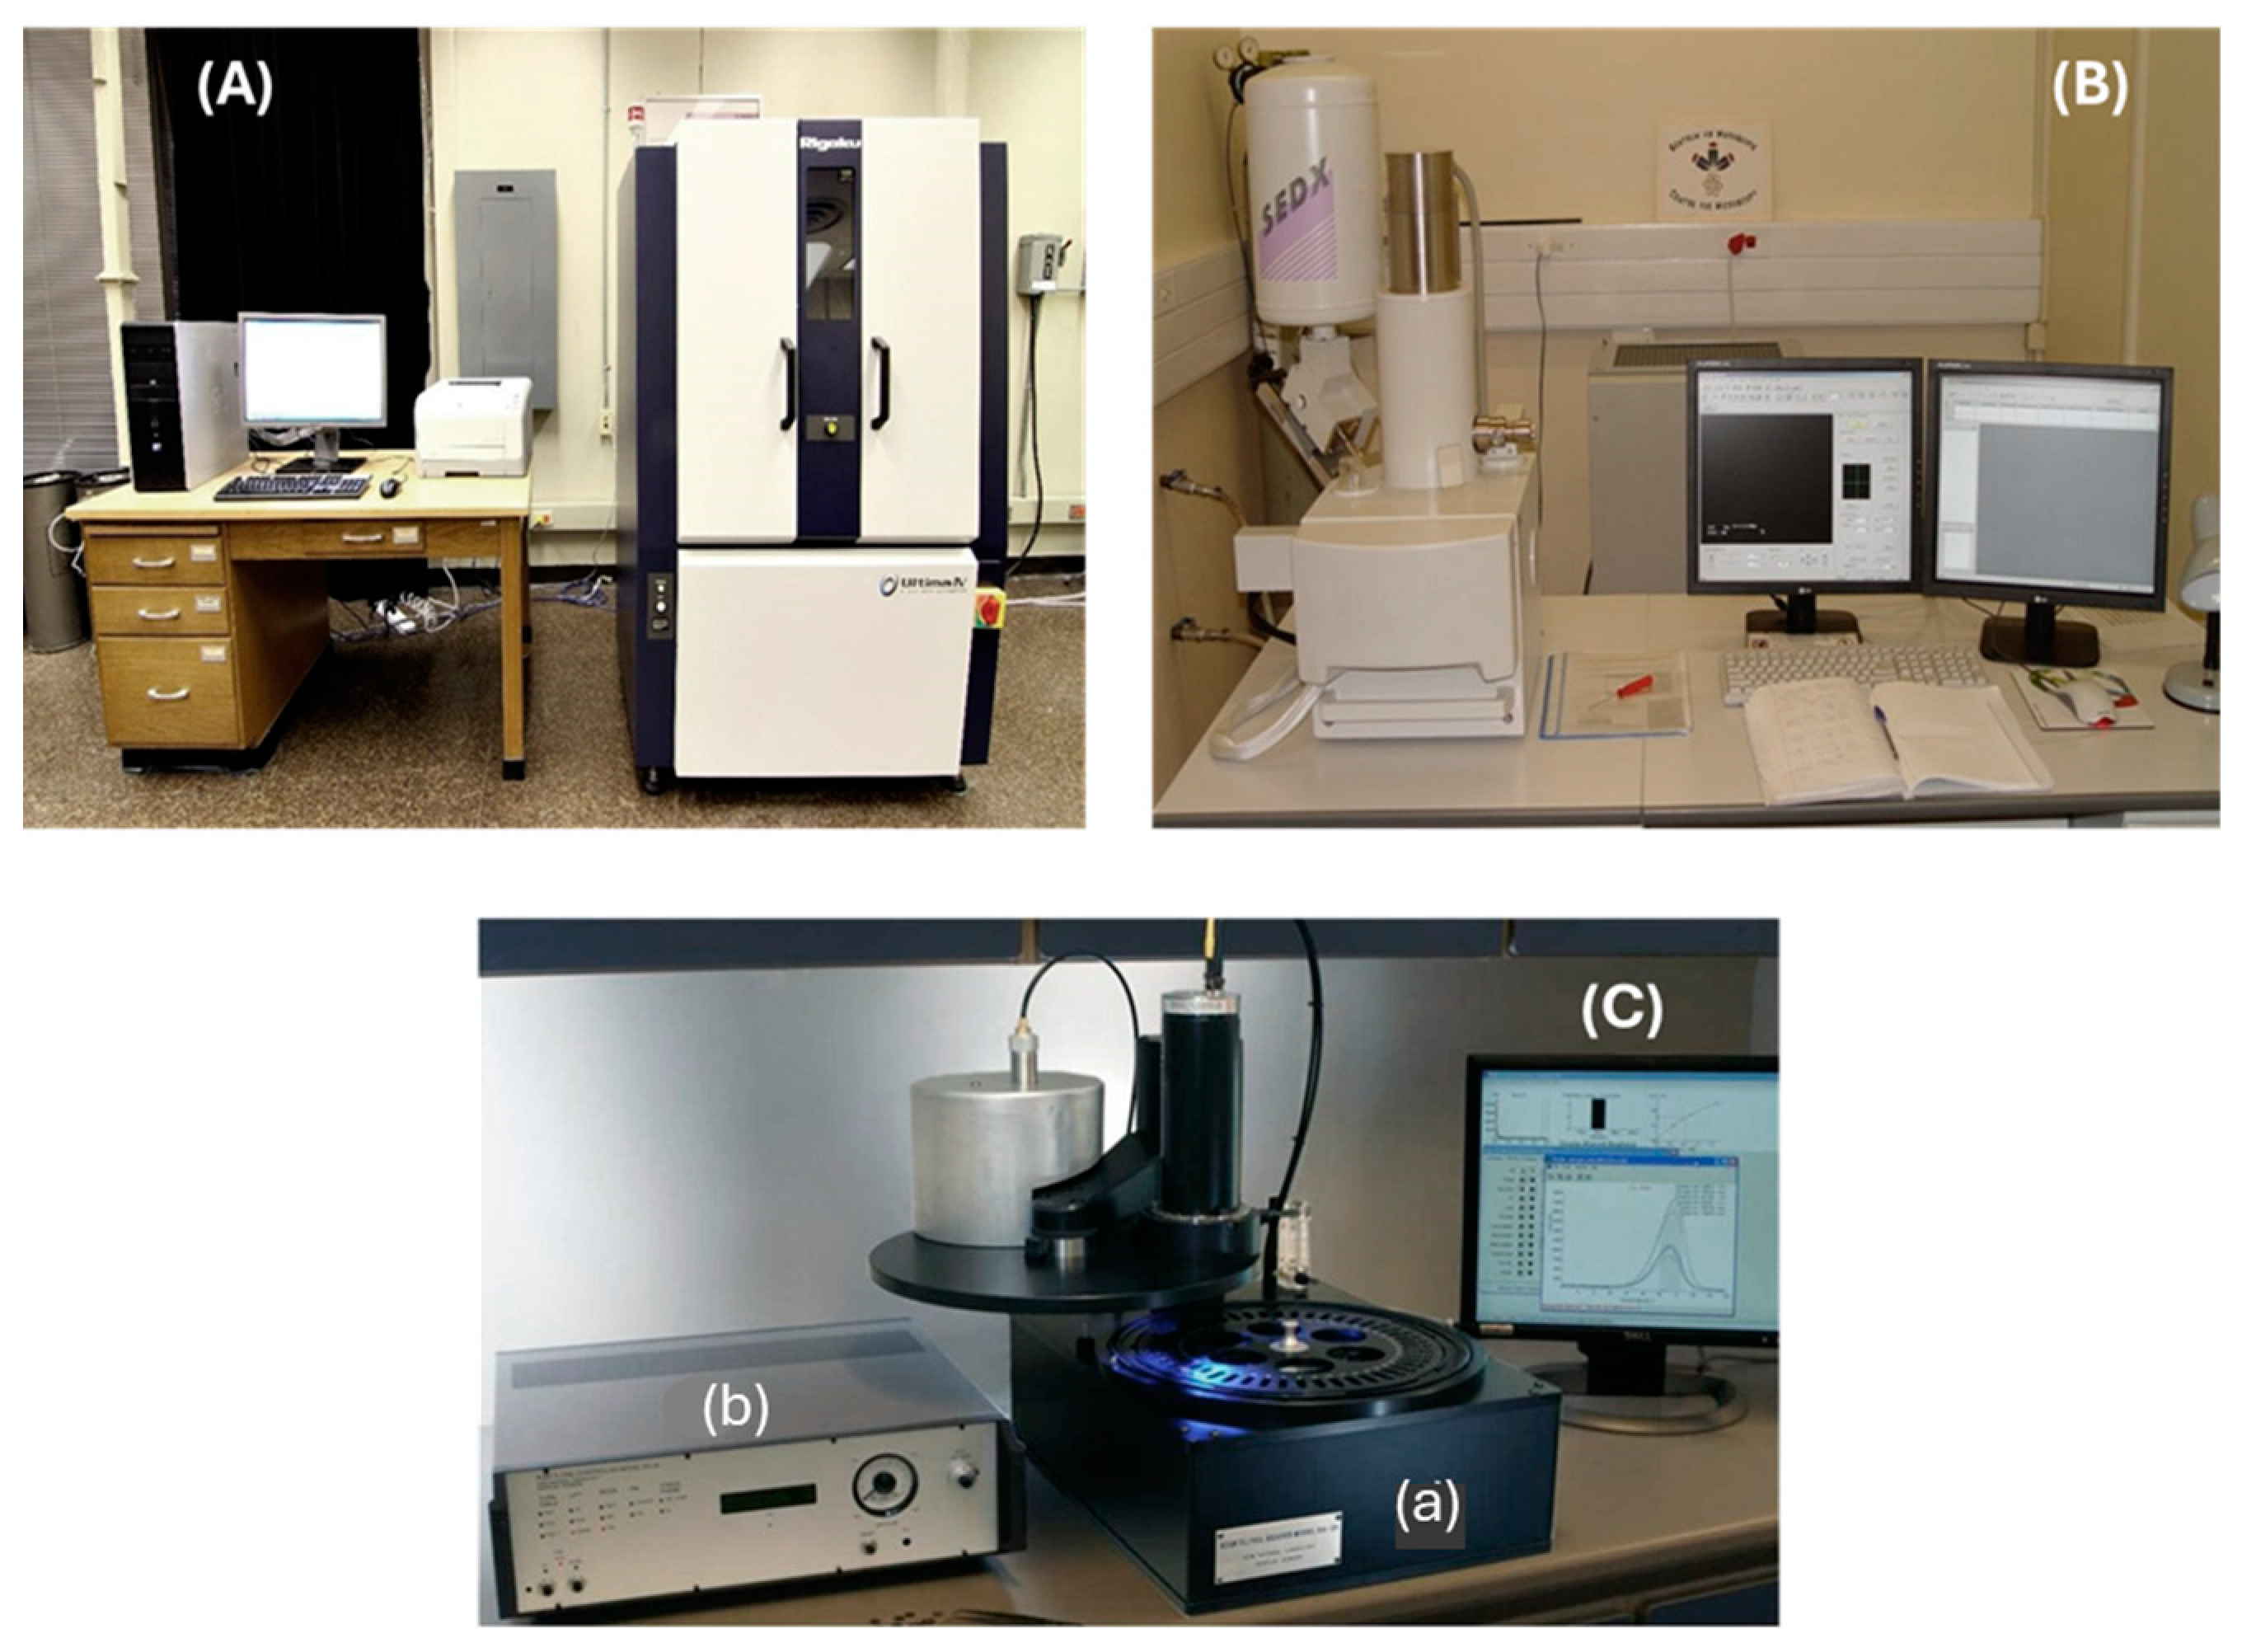
2.2. Characterization

The Rigaku SmartLab Diffractometer (Rigaku SmartLab, Neu-Isenburg, Germany) obtained powder X-ray diffraction patterns (XRD) using Cu Kα = 1.5406 Å (40 kV, 40 mA) radiation. The usual range for scanning was 20° < 2θ < 80°. The measurements were taken at a rate of 5.0985 degrees per minute in increments of 0.02. The length-limiting slit was 10 mm; the incidence slit was 0.66 degrees; and the divergence slit was 0.66 degrees (Figure 1A). A Shimadzu model ZU SSX-550 Superscan scanning electron microscope (SEM) (Shimadzu, Columbia, MD, USA) was used to analyze the sizes and shapes of the particles of ZnZrO3:Mn+3 phosphor at a spectral slit width of 1.5 nm to examine the morphology of the produced materials, as seen in Figure 1B. TL measurements were conducted using samples in discs that were 5 mm in diameter and 1 mm thick. Before heating, the samples were excited at a rate of 10.75 Gy per minute using a beta source from the 90Sr isotope that was located nearby. In a nitrogen atmosphere, measurements were conducted with a Risø model TL/OSL-DA-20 luminescence reader (Risø DTU, Roskilde, Denmark). A Risø TL/OSL reader model DA-20, which features a PM tube with a bialkali photocathode (Electron Tubes, 9235QA) that has an extended UV response with maximum detection efficiency between 200 and 800 nm, was used to perform TL and OSL measurements. Figure 1 shows a picture of this system. Detection filters prevented scattered stimulation light from reaching the PMT. Three interchangeable filter packs are included with the standard Risø reader: the Hoya U-340, Schott BG-39, and Corning 7-59 (Guide to “The RisQ TL/OSL Reader”). First, the heating element heated the sample, which then was raised into the measuring position. A nitrogen flow cooled the heating strip and shielded the heating system from oxidation at elevated temperatures. The Schott BG-39 filter extracted the TL glow peaks between 250 and 800 nm (seen in Figure 1C).

3. Results and Discussion

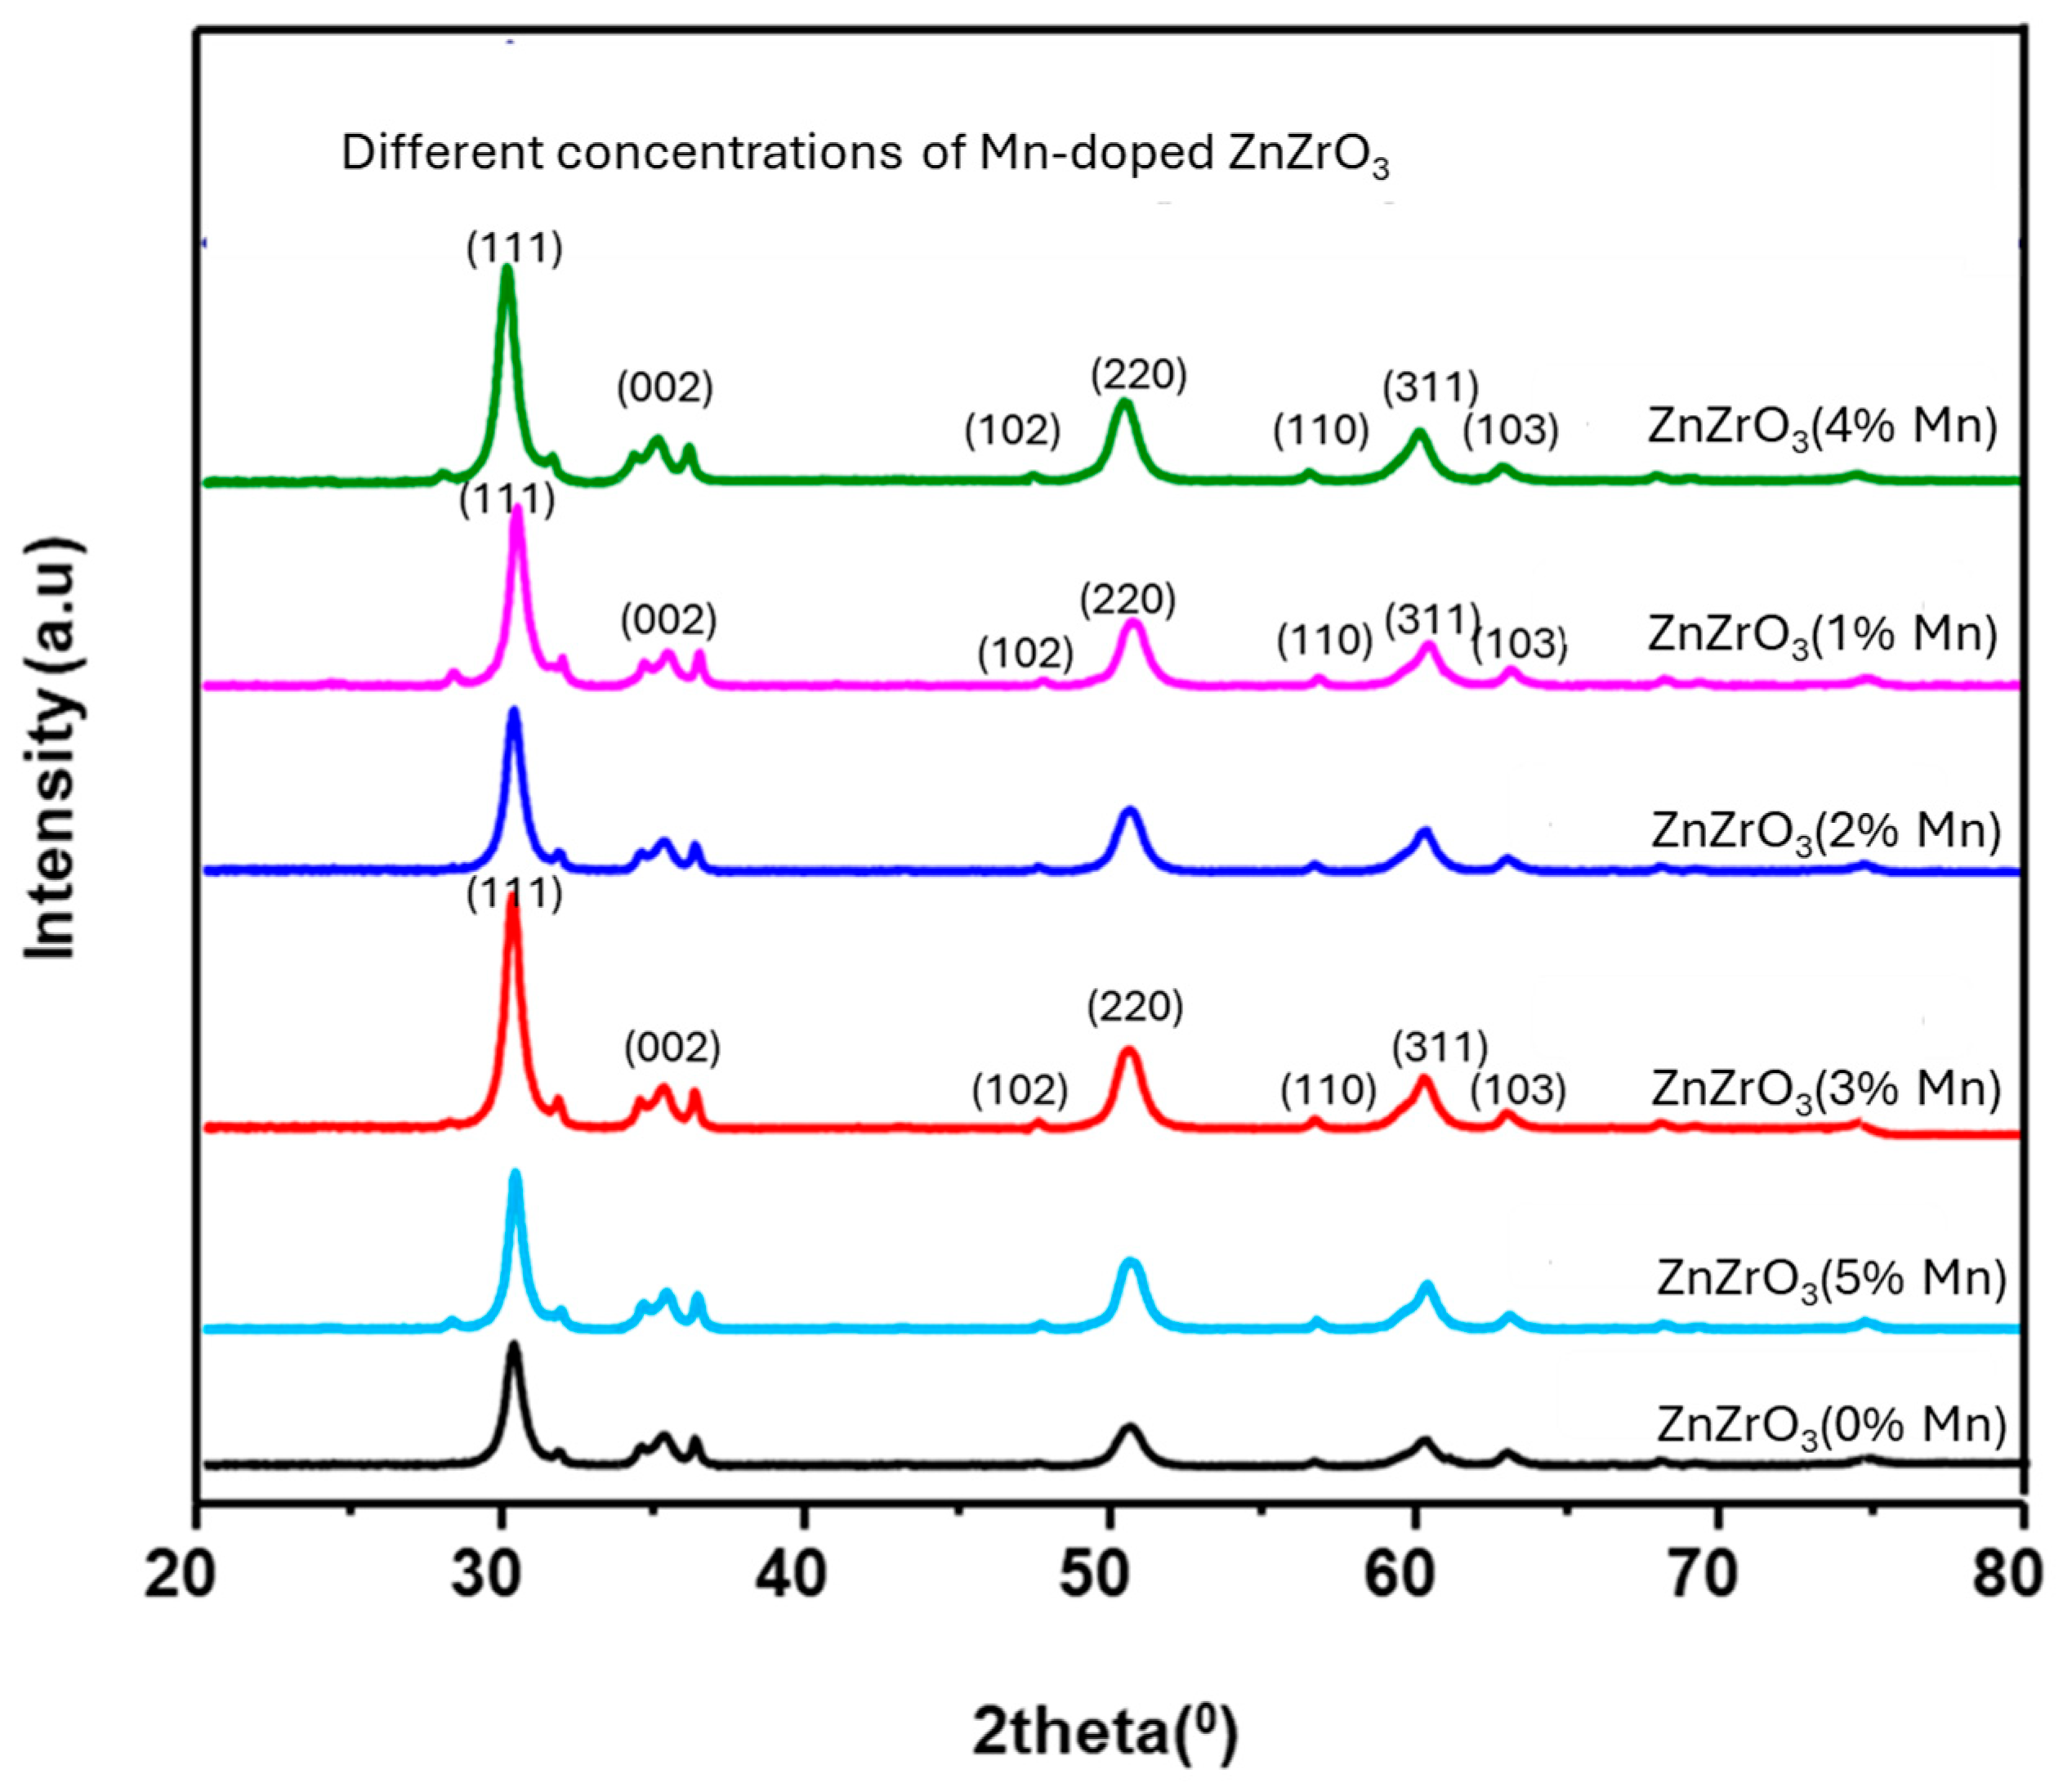
3.1. Morphological and Structural Properties

The scanning electron microscopy (SEM) images provided in Figure 2 illustrate the morphological changes in ZnZrO3 with varying manganese (Mn) doping concentrations ranging from 0% to 5%. The SEM images of ZnZrO3 at different Mn concentrations (1%, 2%, 3%, 4%, and 5%) reveal distinct morphological characteristics across the samples. The undoped sample exhibits a highly porous and irregular surface morphology with larger voids and agglomerated particles. In contrast, the surface of ZnZrO3 doped with 1% Mn displays enhanced smoothness, marked by fewer voids and reduced porosity compared to the undoped sample, as well as the presence of smaller grains and denser structures. This smoother surface morphology suggests an improvement in crystallinity, which may enhance light-emission efficiency in phosphors by minimizing surface defects.
The morphology of ZnZrO3 doped with 2% Mn is characterized by a more compact and dense structure, with fewer cracks and smaller pores. This increased compactness indicates improved structural integrity, which may contribute to a more uniform dopant distribution and enhanced light-emission properties. The sample doped with 3% Mn shows evidence of particle coalescence, with the formation of some rough regions. This slight roughness can increase light scattering, enhancing specific luminescent properties contingent upon excitation conditions. Similarly, the morphology of ZnZrO3 doped with 4% Mn again is characterized by a smoother surface, with plate-like structures that indicate grain growth and densification. The larger grain size and reduced number of defects in this sample would likely minimize non-radiative losses, which is advantageous for achieving higher luminescent efficiency.
However, the structure consists of aggregated and irregularly shaped plate-like particles, with micro-cracks becoming evident for ZnZrO3 doped with 5% Mn. Excessive doping leads to structural stress, resulting in cracks and grain coarsening, which could decrease luminescent efficiency due to defect-induced quenching. From a morphological perspective, 2–3% Mn doping appears ideal for phosphor applications, balancing compactness, crystallinity, and reduced porosity. The SEM images reveal that Mn doping significantly influences the morphology of ZnZrO3 and that 2–3% Mn doping is optimal for achieving enhanced compactness and reduced defects, which are critical for phosphor performance. Higher doping concentrations (4–5% Mn) may degrade performance due to structural stress and defect-induced non-radiative losses, though they can still be useful in specific applications requiring defect-sensitive luminescence properties. In summary, the SEM data suggest that a low level of Mn doping (3%) results in a homogeneous, overlapping structure, while undoped ZnZrO3 tends to develop a granular morphology at elevated temperatures. This comprehensive understanding sheds light on the intricate relationship between doping, heat treatment, and the resulting morphological characteristics of ZnZrO3 nanocomposites.
The XRD patterns of ZnZrO3 nanocomposites at various Mn-doping concentrations are shown in Figure 3. The three major characteristic peaks observed at 2θ = 30.13°, 51.01°, and 60.71° correspond to the (111), (220), and (311) planes, respectively. These values are consistent with the reference patterns from JCPDF files 00-036-1451 and 00-037-1413, aligning with the findings reported by N. Matinise et al. [8,31]. Furthermore, the calculated lattice constants match the reported values: for JCPDF 00-036-1451, a = 3.24972a = 3.24972 Å and c = 5.2161c = 5.2161 Å, while for JCPDF 00-037-1413, a = 5.04310a = 5.04310 Å, b = 5.2020b = 5.2020 Å, and c = 5.2640c = 5.2640 Å, with axial ratios a/b = 0.9694a/b = 0.9694 and c/b = 1.0119c/b = 1.0119. The doped samples show well-defined crystallization diffractions, which agree ZnZrO3 (cubic)-nanocomposites. The Mn-doped sample’s 3% XRD measurement showed that the structure is a pure crystalline phase of cubic ZnZrO3 nanocomposites. The annealed samples’ patterns showed no peaks from impurities or residues, suggesting that the nanocomposites are purely crystalline. High crystallinity also promotes efficient energy transfer and minimizes scattering losses during the excitation and emission processes.
The Mn dopant can substitute for Zn or Zr in the ZnZrO3 lattice, modifying the electronic structure and creating suitable energy states for luminescence with average crystalline sizes of 28 nm and 24 nm in ZnZrO3 and Mn (3%)-doped ZnZrO3, respectively. Manganese ions can exist in multiple oxidation states depending on the doping concentration (e.g., Mn2+ or Mn4+), each contributing differently to the emission properties. Mn2+ ions are known for their strong green/red emissions due to the 4T16A1 transitions. In contrast, Mn4+ ions exhibit deep-red emissions via 2E → 4A2 transitions.
The average crystalline sizes predicated by the Debye–Sherrer equation for Mn-doped samples (3%) were found to be 28 and 24 nm, respectively (Equation (1)). XRD analyses of the samples (3% Mn-doped ZnZrO3) [33] were also conducted.
D = k λ β cos θ
1 d 2 = h 2 + k 2 + l 2 a 2
where k is the crystal width constant at (0.94), (hkl) are the Miller indices from the JCPDS reference files, θ is the Bragg angle, λ is the X-ray wavelength, and β is the full width at half-maximum (FWHM).
The photoluminescence (PL) spectra of (Figure 4) Mn-doped ZnZrO3 nanoparticle nanocomposites, which extend from 350 to 900 nm, reveal key insights into their electronic and defect structures. The emission bands at approximately 500, 502, 604, and 612 nm correspond to green and red luminescence. The green emission at around 500–502 nm suggests the presence of defect-induced radiative transitions, which can be attributed to oxygen vacancies acting as electron-trapping sites that facilitate radiative recombination, producing green emissions. These vacancies generate defect states within the bandgap, enabling electron-hole pair recombination through mid-gap energy levels. Zinc and zirconium vacancies or interstitials also contribute to defect-related emissions. Defect states caused by Zn2+ or Zr4+ vacancies in the ZnZrO3 lattice can introduce additional energy levels that participate in visible emissions. When ZnZrO3 is doped with Mn ions, an emissions-band shift appears in the red region (604–612 nm). This red emission arises from the Mn2+ ion substitution at either Zn2+ or Zr4+ sites. The introduction of Mn ions alters the electronic structure, leading to new radiative transitions.

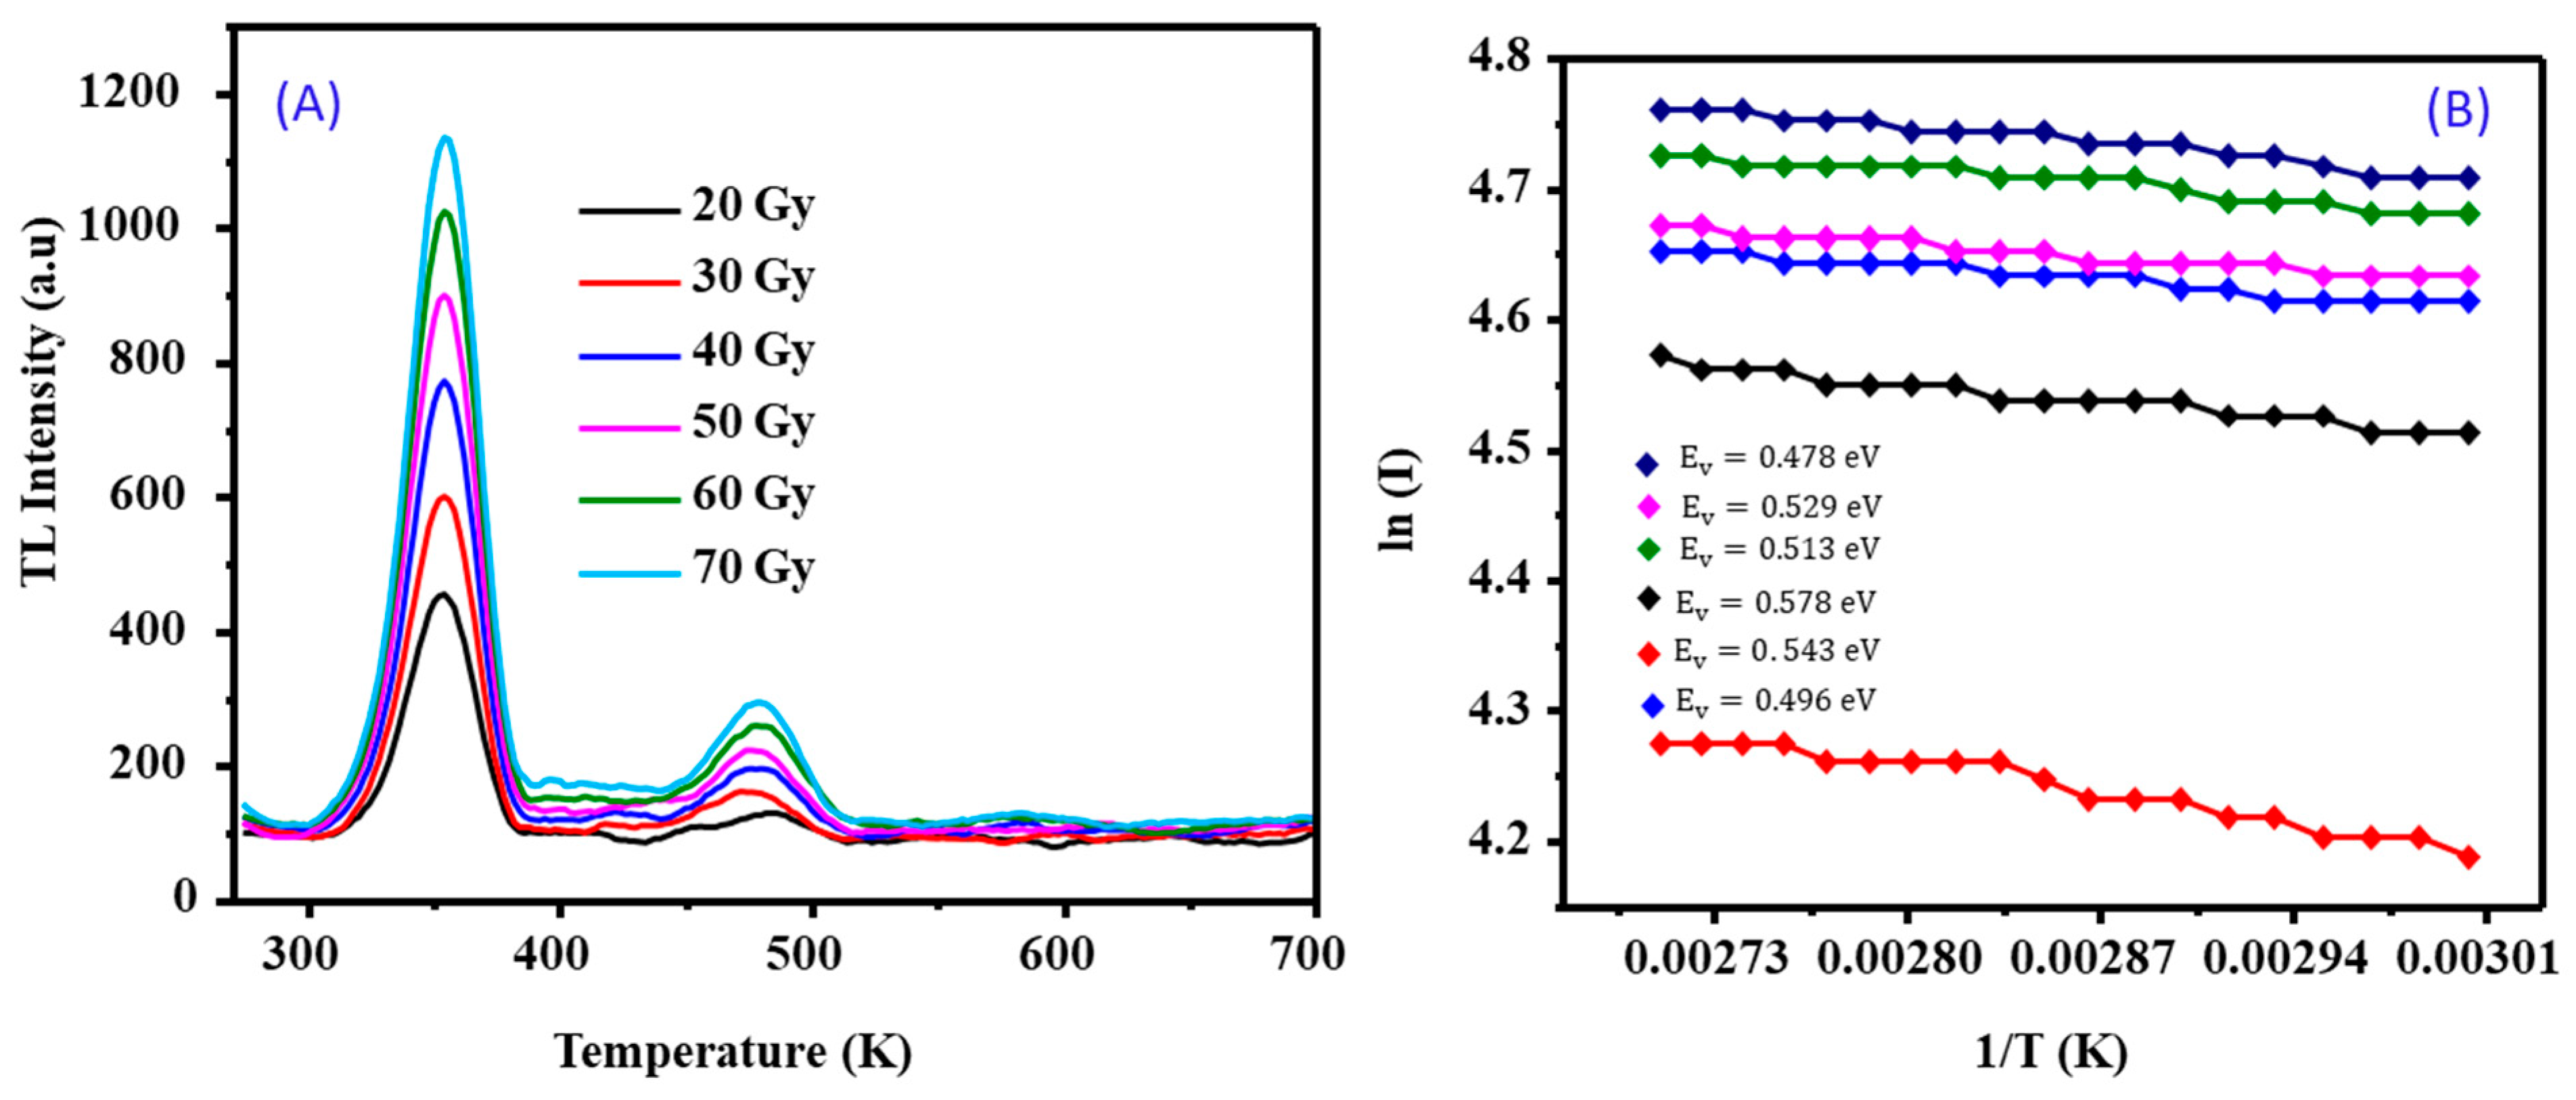
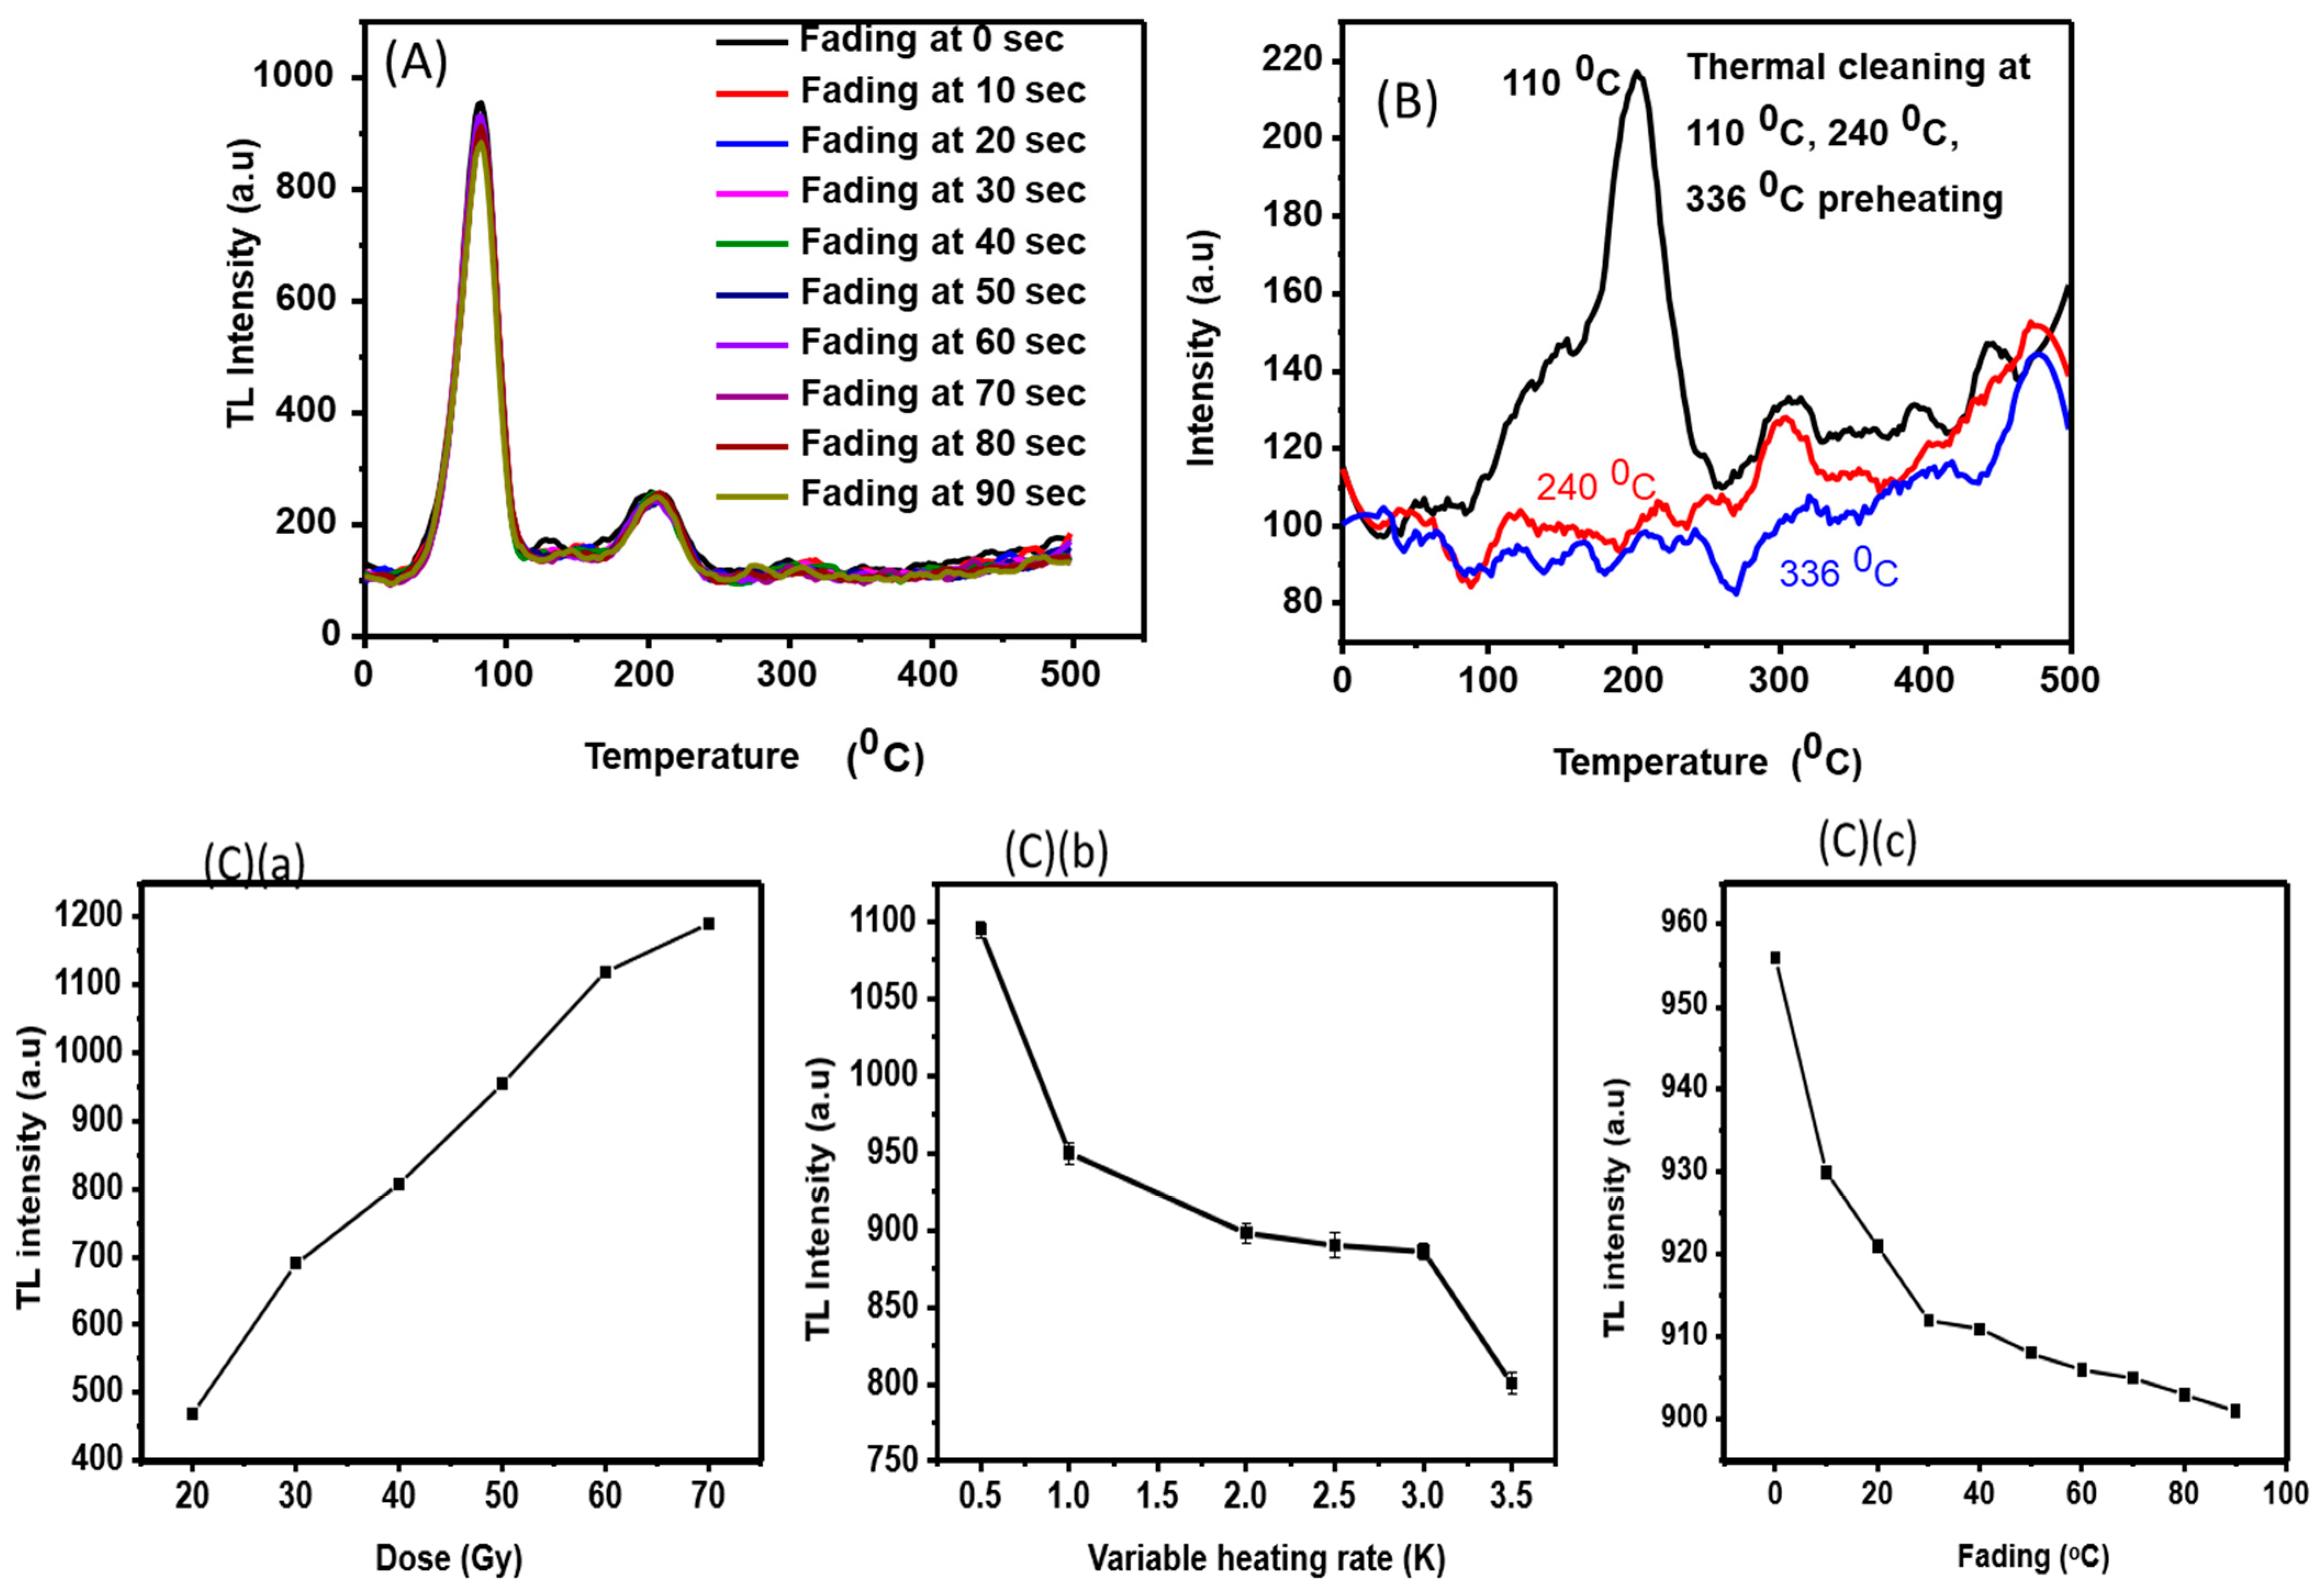
3.2. Analysis of Dose−Response Graphs

3.2.1. Stability Study

Figure 5 shows thermoluminescence (TL) glow curves for a sample subjected to beta irradiation, measured at a heating rate of 5 K/s. The two curves (red and blue) correspond to repeated measurements on the same sample. The TL glow curves from repeated measurements nearly overlap, indicating high reproducibility. This suggests that the sample retains its luminescent properties across multiple heating cycles. The glow curve exhibits two well-defined peaks at approximately 349 K and 473 K. These peaks correspond to distinct trap levels in the material where charge carriers are released upon heating. The variation in TL intensity resulting from obtaining many measurements from the same sample is depicted in Figure 5. The intensity data were recorded at each case’s peak maximum, and the TL was recorded at 5 K s−1. Every set of results has one thing in common: the intensity stays roughly consistent when it is measured repeatedly. This results from sensitization. This characteristic is also clearly apparent in the profiles displayed in Figure 5, where the graphs for the observations taken at 5 K s−1 are situated precisely above one another. The sample yielded well-defined peaks at around 349 and 473 K for beta irradiation.

3.2.2. Dose−Response

The samples were exposed to several doses of radiation ranging from 20 to 70 Gy at a constant linear heating rate of 5 K s−1 to examine the impact of dose-dependency on the reported peak positions. The TL response curve for ZnZrO3 (3% Mn) nanoparticles at various beta-irradiation doses ranging from 20 to 70 Gy is displayed in Figure 6A. A phosphor must have a linear dose−response to serve as a TL dosimeter. Because beta-irradiated phosphors cannot go deeper and cannot induce lattice defects, the TL response is mainly generated by the surface traps. As the irradiation dose increases, the density of surface defects also rises, increasing the peak intensity. Competition between radiative and nonradiative centers, or between various types of trapping centers, results in the TL intensity [34]. It has been found that the concentration (no) of the trapped charge carriers is proportional to the glow curve intensity (I) during heating [35,36]. The primary glow curve at 349 K and a secondary one at 473 K are displayed in Figure 6A. It has been noted that as the dosage increases, so does the peak intensity. This is because an increase in dose causes an increase in the number of luminescence centers, which raises the peak intensity. In other words, the higher the energy density of the ionizing radiation, the more electron−hole pairs are trapped, and as a result, the TL intensity peak rises as the dose of beta irradiation increases. It has been noted that as the dosage increases, so does the peak intensity. This is because an increase in dose causes an increase in the number of luminescence centers, which raises the peak intensity. In other words, the higher the energy density of the ionizing radiation, the more electron−hole pairs are trapped, and as a result, the TL intensity peak rises as the dose of beta irradiation increases.
The dose−response behavior of Mn-doped ZnZrO3 phosphor shows a systematic shift in TL glow-curve peaks toward higher temperatures with increasing radiation doses. At lower doses, electrons occupy shallow traps with lower activation energies, releasing at lower temperatures. With higher doses, deeper traps with higher activation energies are filled, leading to thermal stimulation at higher temperatures and shifting the TL peaks, revealing dose-dependent trapping and thermal-release mechanisms [18].
The underlying premise of the first-rise method for determining trap depths from six stability measurements in Figure 6B is that the concentration of trapped charge carriers is comparatively stable on the low-temperature side of a TL glow curve [37]. Only a very small portion of the charge carriers can escape with the limited thermal energy available [18].
I T = C e x p E K T
where E is the activation energy, k is Boltzmann’s constant, and C is a constant of proportionality, which comprises the frequency factor s, which is assumed to be independent of temperature, allowing us to approximate the equations for first-, second-, and general-order kinetics. The low temperature is shown by an Arrhenius plot, which plots the glow curve as l n I versus 1 / T .
The activation energy for TL was determined at a heating rate of 5 °C s−1 after irradiation to 70 Gy; the first glow curve in Figure 6B illustrates the impact of repeated measurements on the same sample. Therefore, using the following equation, Ev can be evaluated without knowing the frequency factor s, as follows [18]:
E v = d l n I d 1 T  
Figure 7A highlights the effects of the Variable Heating Rate (VHR) on the thermoluminescence (TL) glow curve. As the heating rate increases from 0.5 K·s−1 to 4.5 K·s−1, the peak temperature shifts towards higher values. This directly results from the relationship between the heating rate and the thermal activation of trapped charge carriers within the material. At lower heating rates, the trapped charge carriers have more time to escape and contribute to the glow curve at relatively lower temperatures. Conversely, as the heating rate increases, there is less time for thermal excitation at lower temperatures, leading to the release of charge carriers only at higher temperatures, where the activation energy is overcome more quickly. This behavior is characteristic of TL glow peaks governed by first- and second-order kinetics, where the position of the glow peak is dependent on the rate of input of thermal energy into the system.
Additionally, the figure reveals that the fluorescence intensity of the primary glow peak increases significantly, by up to 100%, as the heating rate increases. This increase in intensity can be attributed to the thermal lag that occurs at higher heating rates. At slower heating rates, the recombination of charge carriers occurs over a broader range of temperatures, leading to a spread-out glow peak with lower intensity. However, at higher heating rates, the rapid increase in temperature causes the trapped charge carriers to be released over a narrower range of temperatures, resulting in a sharper and more intense glow peak. This simultaneous shift in peak temperature and increase in peak intensity supports the TL hypothesis, as it aligns with the expected behavior for TL processes that follow first- and second-order kinetics. In such cases, the kinetics are influenced by both the activation energy and the heating rate, which together determine the peak’s thermal position and the overall luminescence intensity observed. Additionally, the impact of changes in the heating rate was investigated. A peak shift to higher temperatures, a decrease in peak height, and a comparatively greater TL intensity at the final temperature of 600 K were the outcomes of an increase in heating rate (Figure 6A). This peak-shift behavior yields peaks qualitatively comparable to the TL peaks generated by a delocalized recombination process.
Figure 7B, above, illustrates the thermoluminescence (TL) intensity and temperature of the glow peak as a function of the Variable Heating Rate (VHR). The relationship between these parameters reveals critical insights into the thermal behavior of the luminescent material under varying heating rates.
The TL intensity (black dashed line) increases significantly as the heating rate increases. This can be attributed to the thermal lag effect, which becomes more prominent at higher heating rates. At slower heating rates, charge carriers are released and recombine gradually over a broader temperature range, resulting in a lower peak intensity. In contrast, at higher heating rates, the temperature rises more rapidly, leading to a narrower release window for trapped charge carriers. This concentrated release produces a sharper, more intense glow peak, as seen in Figure 7B. The increase in intensity suggests that the luminescent centers are efficiently excited and recombined within the material as the heating rate increases. The blue line with square markers represents the temperature of the TL peak as a function of the heating rate. The figure demonstrates that the peak temperature shifts to higher values as the heating rate increases. This behavior is consistent with first-order and second-order kinetics in thermoluminescence, where the thermal activation of trapped charge carriers depends on the rate at which thermal energy is supplied. At lower heating rates, charge carriers have sufficient time to escape at lower temperatures, resulting in a lower peak temperature. Conversely, at higher heating rates, the material’s temperature increases rapidly, causing the charge carriers to be released only at higher thermal energies, which shifts the peak temperature upward. In summary, the TL intensity increases and the peak temperature shifts to higher values with increasing heating rates. These trends reflect the combined effects of thermal lag, activation energy, and the kinetic nature of the TL process, which are critical for understanding the material’s luminescent behavior under varying thermal conditions.
The shift of the peak temperature Tm with increasing heating rate β (K·s−1) can be modelled using Equation (5) for first-order kinetics, as follows:
T m = E K B 1 K B T m E l n s β
where E —Activation energy (eV), K B —Boltzmann constant (8.617 × 10⁻⁵ eV/K−1, T m —the temperature of the TL peak (K), s —Frequency factor(s−1), and β —heating rate (Ks−1).
The TL intensity (I) at a given heating rate β can be expressed using the general glow curve equation, as in Equation (6), which is derived from the kinetic order. For first-order kinetics, the TL intensity is calculated as follows:
I ( T ) = s n o   e x p   ( E K B T   e x p     s β T o T e x p   ( E K B T ) d T
where I ( T ) —TL intensity at a temperature T , n o —Initial concentration of trapped electrons, and T o —Initial temperature (K). Therefore, TL peak temperature shifts logarithmically with heating rate, as seen in Equation (7), below:
T m   ~   E K B l n s β
The provided Figure 8A,B illustrates TL glow curves and their behavior, specifically, their fading over time (0–90 s) and the effects of thermal cleaning at different temperatures. TL fading refers to the loss of TL intensity over time due to the gradual detrapping of charge carriers at ambient or elevated temperatures. The figure likely represents TL measurements conducted at different time intervals after irradiation. The TL signal arises from trapped charge carriers in defect centers that escape when thermally stimulated. At room temperature (or slightly elevated temperatures), shallow traps (low activation energy) can release carriers spontaneously over time, causing significant fading. Deeper traps (higher activation energy) are more thermally stable and retain charge carriers for longer durations, resulting in minimal fading.
Thermal cleaning (seen in Figure 8B) is a process whereby the TL signal is intentionally erased by heating the sample to specific temperatures. This selectively removes carriers from shallow traps while preserving those in deeper traps. The TL glow curves show reduced intensity for peaks at lower temperatures after thermal cleaning at progressively higher temperatures. Higher-temperature peaks remain unaffected until the sample is heated beyond its corresponding activation-energy threshold. When a sample is heated to a certain temperature, Tc (cleaning temperature), charge carriers in traps with activation energies E below a certain threshold are released. Traps with activation energies higher than E remain occupied and contribute to TL intensity at higher temperatures. Thermal cleaning was applied to the thermoluminescence (TL) glow curve of ZnZrO3:Mn nanopowders to refine the material’s luminescence properties and eliminate impurities. This process significantly enhances the clarity and efficiency of the glow-curve analysis by removing unwanted elements, ensuring a more pristine and precise assessment of the sample’s performance.
This study conducted thermal cleaning across a temperature range from 110 °C to 336 °C, with increments of 50 °C. The sample, irradiated with a dose of 70 Gy, underwent preheating to 336 °C, a temperature corresponding to the high-temperature tail of the third glow peak, also recognized as the main peak. After the sample had been cooled back to room temperature, the residual glow curves were meticulously recorded during gradual reheating of the sample. This controlled procedure not only purified the material but also allowed for an improved and detailed analysis of its thermoluminescent behavior, highlighting the remarkable stability and enhanced performance of ZnZrO3:Mn nanopowders.
The graph in Figure 8C(a) depicts the relationship between TL intensity and radiation dose for ZnZrO3:Mn. At lower doses, the intensity increases linearly with radiation dose, suggesting a proportional relationship. This behavior is attributable to the uniform filling of trapping centers within the material’s crystal lattice, where a higher dose introduces more trapped charge carriers, directly enhancing the TL intensity. However, at higher doses, the graph deviates slightly from linearity. This non-linearity arises due to competing processes such as radiative and non-radiative recombination. At higher doses, a saturation effect may occur, where the trapping centers are nearly full and additional radiation leads to losses through non-radiative pathways. The graph shows that as the radiation dose increased in increments of 5 Gy, the TL intensity grew correspondingly by 50 a.u., highlighting the material’s sensitivity to radiation. This sensitivity is vital for dosimetric applications, where precision in dose detection is paramount. In Figure 8C(b), the graph illustrates how TL intensity varied with changes in the heating rate. The TL intensity decreases as the heating rate increases, showing an inverse proportionality. This phenomenon occurred because a higher heating rate rapidly releases trapped charge carriers, leading to incomplete or inefficient recombination at luminescent centers. At slower heating rates, the thermal energy allows trapped electrons to recombine radiatively, leading to higher TL intensity. Conversely, with faster heating rates, non-radiative processes become more dominant, reducing TL intensity. The data reveal that as the heating rate increased in increments of 0.5 K/s, the TL intensity decreased by 25 a.u. This relationship is essential in optimizing experimental conditions to maximize the material’s luminescence output.
Figure 8C(c) presents the relationship between TL intensity and fading over time for ZnZrO3: Mn. Fading is defined as the gradual loss of TL intensity due to the escape of trapped charge carriers from defect centers within the crystal structure. The graph in Figure 8C(c) shows a clear inverse relationship, where the TL intensity diminishes as fading time increases. This behavior highlights the instability of trapped charge carriers over extended periods, when thermal or environmental factors contribute to their release. The fading rate provides critical insights into the storage and long-term usability of the material. ZnZrO3: Mn demonstrates a trend of declining TL intensity with increasing fading time, underlining the need for proper handling and usage timelines in applications like dosimetry and luminescent devices. Thus, the fundamental thermoluminescence properties of ZnZrO3: Mn include a linear response at lower radiation doses and deviation at higher doses, highlighting the material’s dose sensitivity and saturation behavior. The inverse relationship between TL intensity and heating rate demonstrates the importance of optimized heating conditions for efficient luminescence, and the fading analysis reveals the material’s temporal stability, which is crucial for long-term applications.

4. Conclusions

This study comprehensively analyses the morphological, structural, and thermoluminescent (TL) properties of Mn-doped ZnZrO3 nanoparticles. An optimal Mn-doping concentration of 2–3% enhanced crystallinity, minimizes defects, and improves luminescence efficiency. ZnZrO3:Mn nanocomposites exhibited green (500–502 nm) and red (604–612 nm) emissions, attributable to oxygen vacancies and Mn2+ substitutions. XRD confirmed high crystallinity, which further enhances luminescence. Beta (β) irradiation response peaks at 349 K and 473 K increased in intensity with higher doses, indicating stable trapping levels. Increased irradiation doses enhanced TL response due to higher trap densities. Variable heating rate (VHR) studies revealed peak shifts to higher temperatures and increased intensity at elevated rates, with these attributable to thermal lag. These results affirm the material’s potential for use in TL dosimetry, highlighting systematic dose-dependent trapping and energy-release mechanisms. TL intensity increased with increasing heating rate, with a higher peak temperature due to thermal activation. Fading analysis showed an intensity decline over time due to carrier de-trapping. Thermal cleaning improved luminescence by eliminating shallow traps. The dose−response relationship was linear at low doses but deviated at higher doses due to saturation effects. TL intensity decreased with further heating rate increases, emphasizing the need for optimized conditions. These findings confirm ZnZrO3:Mn’s stability, sensitivity, and suitability for dosimetric applications requiring precise luminescence control.

Author Contributions

H.F.E.: writing—original draft preparation; Conceptualization, methodology, investigation; F.B.D.: resources; validation; writing—review and editing, visualization, supervision, project administration, funding acquisition. All authors have read and agreed to the published version of the manuscript.

Funding

This research received no external funding.

Institutional Review Board Statement

No applicable.

Informed Consent Statement

Not applicable.

Data Availability Statement

All the data will be available on request by the corresponding authors.

Acknowledgments

The authors also acknowledge the physics department at Walter Sisulu University for helping with the research technique systems used to characterize the materials employed in this work.

Conflicts of Interest

The authors declare no conflicts of interest.

References

  1. Williams, O.M.; Spooner, N.A. Defect pair mechanism for quartz intermediate temperature thermoluminescence bands. Radiat. Meas. 2018, 108, 41–44. [Google Scholar]
  2. Chen, R.; Lawless, J.; Pagonis, V. Thermoluminescence associated with two-electron traps. Radiat. Meas. 2017, 99, 10–17. [Google Scholar]
  3. Gaber, A.; Abd El-Hamid, H.; Ngida, R.E.; Sadek, H.; Khattab, R. Synthesis, characterization and corrosive resistance of ZnO and ZrO2 coated TiO2 substrate prepared via polymeric method and microwave combustion. Ceram. Int. 2024, 50, 38917–38932. [Google Scholar]
  4. Kothiyal, G.; Ananthanarayanan, A.; Dey, G. Glass and glass-ceramics. In Functional Materials Preparation, Processing and Applications; Elsevier: Amsterdam, The Netherlands, 2012; pp. 323–386. [Google Scholar]
  5. Shinde, K.N.; Dhoble, S.; Swart, H.; Park, K. Phosphate Phosphors for Solid-State Lighting; Springer Science & Business Media: Berlin/Heidelberg, Germany, 2012. [Google Scholar]
  6. Murthy, K. Phosphor for Optoelectronic Devices: A Review. J. Innov. Electron. Commun. Eng. 2013, 3, 21–28. [Google Scholar]
  7. Hussain, N.; Ayoub, I.; Mushtaq, U.; Sehgal, R.; Rubab, S.; Sehgal, R.; Swart, H.C.; Kumar, V. Introduction to phosphors and luminescence. In Rare-Earth-Activated Phosphors; Elsevier: Amsterdam, The Netherlands, 2022; pp. 3–41. [Google Scholar]
  8. Matinise, N.; Mayedwa, N.; Kaviyarasu, K.; Nuru, Z.; Madiba, I.; Mongwaketsi, N.; Fuku, X.; Maaza, M. Zinc zirconate (ZnZrO3) nanocomposites bimetallic designed by green synthesis via Moringa Olefeira extract for high-performance electrochemical applications. Mater. Today Proc. 2021, 36, 401–407. [Google Scholar] [CrossRef]
  9. Ramos-Garcés, M.V.; Colón, J.L. Preparation of zirconium phosphate nanomaterials and their applications as inorganic supports for the oxygen evolution reaction. Nanomaterials 2020, 10, 822. [Google Scholar] [CrossRef]
  10. Martínez-Martínez, R.; García-Hipólito, M.; Juárez-López, G.; González, J.Z.; Brito, F.R.; Olvera, R.C.; Mendoza, J.G.; Falcony, C. Synthesis, structural and optical studies for ZnO-ZrO2-ZnZrO3: Tb3+ luminescent coatings deposited by Ultrasonic Spray Pyrolysis method. Ceram. Int. 2024, 50, 54885–54896. [Google Scholar] [CrossRef]
  11. Kafadar, V.E. The Effect of Various Experimental Parameters on Glow Peaks and TL Kinetics of Some Dosimetric Materials. Ph.D. Thesis, National Thesis Center of Turkey (Ulusal Tez Merkezi), Ankara, Turkey, 2009. [Google Scholar]
  12. Bakr, M.; Omer, M. Determination of thermoluminescence kinetic parameters of La2O3 doped with Dy3+ and Eu3+. Materials 2020, 13, 1047. [Google Scholar] [CrossRef]
  13. Yazan, H.; Portakal-Uçar, Z.; Akça, S.; Topaksu, M.; Townsend, P.; Can, N. Thermoluminescence of Ce and Nd co-doped CaF2 phosphors after beta irradiation. J. Lumin. 2021, 234, 117949. [Google Scholar]
  14. Nawi, S.N.M.; Khandaker, M.U.; Bradley, D.; Sani, S.A.; Al-mugren, K. Characterization of a promising luminescence-based graphite radiation dosimeter. Radiat. Phys. Chem. 2021, 188, 109663. [Google Scholar]
  15. Yang, L.; Gai, S.; Ding, H.; Yang, D.; Feng, L.; Yang, P. Recent progress in inorganic afterglow materials: Mechanisms, persistent luminescent properties, modulating methods, and bioimaging applications. Adv. Opt. Mater. 2023, 11, 2202382. [Google Scholar] [CrossRef]
  16. Gaggero, E.; Calza, P.; Cerrato, E.; Paganini, M.C. Cerium-, europium-and erbium-modified ZnO and ZrO2 for photocatalytic water treatment applications: A review. Catalysts 2021, 11, 1520. [Google Scholar] [CrossRef]
  17. Dogan, T.; Tormo, L.; Akca, S.; Kucuk, N.; Guinea, J.G.; Karabulut, Y.; Ayvacikli, M.; Oglakci, M.; Topaksu, M.; Can, N. Cathodoluminescence and thermoluminescence of ZnB2O4: Eu3+ phosphors prepared via wet-chemical synthesis. Ceram. Int. 2019, 45, 4918–4925. [Google Scholar] [CrossRef]
  18. Dejene, F.B.; Etefa, H.F. Thermoluminescence (TL) properties of Eu3+ incorporated with CaB4O7 phosphors prepared by solution-combustion process. Appl. Radiat. Isot. 2024, 214, 111522. [Google Scholar] [CrossRef]
  19. Correcher Delgado, V.; Benavente Cuevas, J.F. Thermoluminescence glow curve analysis and kinetic parameters of Eu doped Li2MoO4 ceramic phosphors. Ceram. Int. 2023, 48, 19258–19265. [Google Scholar]
  20. Horowitz, Y.; Oster, L.; Eliyahu, I. The saga of the thermoluminescence (TL) mechanisms and dosimetric characteristics of LiF: Mg, Ti (TLD-100). J. Lumin. 2019, 214, 116527. [Google Scholar] [CrossRef]
  21. Halefoglu, Y.; Oglakci, M.; Portakal, Z.; Akca, S.; Souadi, G.; Canimoglu, A.; Topaksu, M.; Can, N. A study on thermoluminescence behaviour of Eu doped LaB3O6 irradiated with beta particles. Radiat. Phys. Chem. 2020, 168, 108571. [Google Scholar] [CrossRef]
  22. Halefoglu, Y.Z.; Oglakci, M.; Yuksel, M.; Canimoglu, A.; Topaksu, M.; Can, N. Structural and spectroscopic properties of LaAlBO3 doped with Eu3+ ions. Appl. Radiat. Isot. 2019, 154, 108876. [Google Scholar]
  23. Lakshmanan, A. Photoluminescence and thermostimulated luminescence processes in rare-earth-doped CaSO4 phosphors. Prog. Mater. Sci. 1999, 44, 1–187. [Google Scholar] [CrossRef]
  24. Silva, A.M.; Rodrigues, D.S.; Guedes, B.D.; Silveira, I.S.; Antonio, P.L.; Junot, D.O.; Caldas, L.V.; Souza, D.N. Exploring the luminescence properties and dosimetric characteristics of CaSO4: Tb, CaSO4: Mn, and CaSO4: Mn, Tb phosphors synthesized by slow evaporation route. Radiat. Meas. 2024, 177, 107261. [Google Scholar] [CrossRef]
  25. Ma, Y.; Linghu, C.; Yang, M.; Yu, H.; Dong, X.; Xia, L. A porous Eu-PTA/Tb-SSA/ZrO2/ZnZrO3 light color adjustable phosphor: Luminescent property and application of warm white LED. J. Rare Earths 2024, 42, 1421–1428. [Google Scholar] [CrossRef]
  26. Sherly, E.; Vijaya, J.J.; Selvam, N.C.S.; Kennedy, L.J. Microwave assisted combustion synthesis of coupled ZnO–ZrO2 nanoparticles and their role in the photocatalytic degradation of 2, 4-dichlorophenol. Ceram. Int. 2014, 40, 5681–5691. [Google Scholar]
  27. Ibrahim, M. Preparation and characterization of mesoporous ZnO-ZrO2 doped by Cr, Nd and Dy as a catalyst for conversion of coumarin using ultrasensitive fluorometric method. Solid State Sci. 2017, 66, 23–30. [Google Scholar] [CrossRef]
  28. Dodson, J.J.; Neal, L.M.; Hagelin-Weaver, H.E. The influence of ZnO, CeO2 and ZrO2 on nanoparticle-oxide-supported palladium oxide catalysts for the oxidative coupling of 4-methylpyridine. J. Mol. Catal. A Chem. 2011, 341, 42–50. [Google Scholar]
  29. Fuku, X.; Matinise, N.; Masikini, M.; Kasinathan, K.; Maaza, M. An electrochemically active green synthesized polycrystalline NiO/MgO catalyst: Use in photo-catalytic applications. Mater. Res. Bull. 2018, 97, 457–465. [Google Scholar]
  30. Kennedy, J.; Maaza, M.; Kaviyarasu, K.; Manikandan, E. Synthesis and analytical applications of photoluminescent carbon nanosheet by exfoliation of graphite oxide without purification. J. Mater. Sci. Mater. Electron. 2016, 27, 13080–13085. [Google Scholar]
  31. Musembi, M.; Dejene, F. Investigation of the effect of precursor ratios on the solution combustion synthesis of zinc zirconate nanocomposite. Heliyon 2019, 5, e03028. [Google Scholar]
  32. Musembi, M.K.; Dejene, F.B.; Ahemen, I. Structural and optical characteristics of dysprosium-doped zinc zirconate nanocomposites. OSA Contin. 2020, 3, 2332–2346. [Google Scholar] [CrossRef]
  33. Siyalo, S.; Etefa, H.F.; Dejene, F.B. Enhancing Structural and Optical Properties of CuO Thin Films through Gallium Doping: A Pathway to Enhanced Photoluminescence and Predict for Solar Cells Applications. Chem. Phys. Impact 2025, 10, 100832. [Google Scholar]
  34. Lawless, J.; Chen, R.; Lo, D.; Pagonis, V. A model for non-monotonic dose dependence of thermoluminescence (TL). J. Phys. Condens. Matter 2005, 17, 737. [Google Scholar] [CrossRef]
  35. Chen, R. On the calculation of activation energies and frequency factors from glow curves. J. Appl. Phys. 1969, 40, 570–585. [Google Scholar] [CrossRef]
  36. Dejene, F. Thermoluminescence study of beta irradiated Sr2CeO4: Eu3+ phosphor synthesized using solution-combustion process. J. Lumin. 2018, 199, 433–441. [Google Scholar] [CrossRef]
  37. Sankara, R.; Rao, G.S. Eu3+ Luminescence, Ce4+ → Eu3+ Energy Transfer, and White-Red Light Generation in Sr2CeO4. J. Electrochem. Soc. 2000, 147, 2773. [Google Scholar] [CrossRef]
Figure 1. (A) XRD (Rigaku SmartLab Diffractometer used to obtain powder X-ray diffraction patterns); (B) SEM (a Shimadzu model ZU SSX-550 Super); (C) Risø model TL/OSL-DA-20 luminescence reader: (a) reader, (b) controller.
Applsci 15 03761 g001
Figure 2. SEM images of ZnZrO3 at different levels of Mn doping.
Applsci 15 03761 g002
Figure 3. XRD graphs for ZnZrO3 at different levels of Mn doping.
Applsci 15 03761 g003
Figure 4. PL emissions of ZnZrCO3 (red) and Mn-doped ZnZrCO3 (black).
Applsci 15 03761 g004
Figure 5. TL glow curve of ZnZrO3-Mn phosphor with repeated TL measurements, measured at a heating rate of 5.0 K s−1 following irradiation to 70 Gy.
Applsci 15 03761 g005
Figure 6. (A) Analysis of dose−response graphs. (B) Plot of ln(I) vs. 1/T for six successive TL glow curve recorded in ZnZrO3:Mn.
Applsci 15 03761 g006
Figure 7. (A) TL curves produced using different variable heating rates. (B) TL intensity and temperature vs. VHR.
Applsci 15 03761 g007
Figure 8. (A) Glow curves of ZnZrO3: Mn for TL measurements with fading at different times (s). (B) Thermal cleaning of ZnZrO3: Mn with preheating at 110 °C, 240 °C, and 336 °C. (C) (a) Shows the values of TL versus dose (Gy); (b) shows a relationship between the TL intensity and variable heating ratel; (c) shows a graph of TL intensity vs. fading.
Applsci 15 03761 g008
Disclaimer/Publisher’s Note: The statements, opinions and data contained in all publications are solely those of the individual author(s) and contributor(s) and not of MDPI and/or the editor(s). MDPI and/or the editor(s) disclaim responsibility for any injury to people or property resulting from any ideas, methods, instructions or products referred to in the content.

