Article

Comprehensive Evaluation of Cultivated Land Quality in Black Soil of Northeast China: Emphasizing Functional Diversity and Risk Management

1
Department of Land Use Engineering, College of Land Science and Technology, Beijing 100193, China
2
Key Laboratory of Arable Land Conservation in North China, Ministry of Agriculture and Rural Affairs, Beijing 100193, China
3
Land Consolidation and Rehabilitation Center, Ministry of Natural Resources, Beijing 100035, China
*
Authors to whom correspondence should be addressed.
Appl. Sci. 2025, 15(7), 3753; https://doi.org/10.3390/app15073753
Submission received: 5 March 2025 / Revised: 23 March 2025 / Accepted: 25 March 2025 / Published: 29 March 2025

Abstract

:
The cultivated land in the black soil of Northeast China (BSNC), due to long-term high-input and high-output utilization, is facing a series of challenges such as soil erosion, compaction, and nutrient loss. However, the existing cultivated land quality evaluation (CLQE) lacks regional specificity, making it difficult to accurately reflect the cultivated land quality (CLQ) characteristics across different areas. Therefore, this study proposes a comprehensive evaluation framework that integrates both cultivated land functionality and degradation risk, establishing an assessment system consisting of 18 indicators to comprehensively evaluate the CLQ in the BSNC from multiple perspectives. The results indicate that the CLQ in the BSNC exhibits a declining trend from north to south, with second- and third-grade land dominating, accounting for 75.68% of the total cultivated land area. The overall cultivated land functionality increases from west to east, with the Liaohe Plain Region (LHP) performing the best. Low-risk cultivated land is primarily concentrated in the Songnen Plain Region (SNP) and the Western Sandy Region (WS), covering 38.55% of the total cultivated land area. Additionally, this study finds a trade-off between the primary productivity function and the resource utilization efficiency function across different regions, while a synergistic relationship is observed between resource utilization efficiency and soil nutrient maintenance functions. This research emphasizes the necessity of balancing productivity and ecological protection to achieve the sustainable and efficient use of the BSNC.

Graphical Abstract

1. Introduction

Black soil is one of the most fertile soils in the world, known as the “giant panda of soils”, playing a crucial role in both mitigating and adapting to climate change. The sustainable management of black soil contributes significantly to achieving sustainable development goals [1] and has thus attracted widespread attention and research from scholars globally [2,3]. The total cultivated land area in the black soil of Northeast China (BSNC) region covers 538.1 million mu, making it one of the three major black soil belts suitable for cultivation in the Northern Hemisphere [4,5,6]. The region is rich in climatic resources, with strong solar radiation, synchronized rainfall and heat, significant diurnal temperature variation, and a suitable frost-free period, providing favorable natural conditions for agricultural development. Both the quantity and quality of cultivated land in this region are crucial to national food security [7].
However, due to the region’s long history of intensive agricultural development, the ecological environment has been severely damaged, leading to significant soil erosion and a decline in land quality [8,9]. Notably, the degradation of cultivated land in this region has resulted in a series of interconnected risks: soil erosion, nutrient depletion, soil compaction, and salinization [10]. The extensive focus on high-yield farming practices, while improving short-term productivity, has masked long-term soil degradation, exacerbating both ecological and production risks [11,12]. The lack of effective land management, coupled with a weakened farmland shelterbelt system, further intensifies these risks, threatening not only the sustainability of agricultural production but also the broader ecological safety of the region.
Many scholars have explored CLQE from various perspectives, such as the construction of evaluation indicator systems, selection of evaluation indicators, and development of evaluation methods [13,14,15]. For example, Cornell University in the United States developed a soil health assessment framework that comprehensively considers chemical, physical, and biological processes to evaluate soil quality [16]. In contrast, research in the United Kingdom and Canada has mainly focused on the classification of soil productivity, emphasizing the impact of cultivated land changes on agricultural production [17]. The European Union’s research has been more problem-oriented, assessing soil quality by comparing it with the level of risks the soil faces [18]. The Muencheberg Soil Quality Rating system combines soil health and site conditions to comprehensively evaluate and classify cultivated land [19]. Additionally, Bünemann [20] summarized the concepts, connotations, and indicator selection for soil quality and proposed a comprehensive evaluation method based on the physical, chemical, and biological characteristics of soil. Wu [21] argued that cultivated land productivity, site conditions, and soil health together determine the sustainable development potential, emphasizing their coupling and coordination. Su [22] used system theory and catastrophe theory to assess the potential degradation impacts on CLQ in the black soil region. Sui [23] analyzed the degradation of CLQ from a genetic perspective. Tang [24] developed an evaluation system for the black soil region, considering natural resources, soil properties, infrastructure, and ecosystem health. Despite these advances, limitations remain. Most studies focus on soil productivity and health, overlooking the integration of ecological functions and degradation risks [25,26,27]. While China’s current national standards provide scientific indicators and methodologies for the investigation, monitoring, and evaluation of CLQ, their design is predominantly grounded in principles of universality, failing to adequately incorporate region-specific constraints [28,29]. Consequently, these standards do not fully reflect the actual conditions and unique characteristics of cropland resources across diverse regions. Although local standards exhibit a degree of regional specificity, their formulation often lacks systematic emphasis on maintaining cultivated land functions and degradation risks, resulting in an insufficient representation of regional traits [24]. Therefore, there is a clear need to develop a more comprehensive evaluation system that not only considers soil health and productivity but also the diverse ecological functions of cultivated land and the associated degradation risks.
This study proposes a comprehensive evaluation framework that integrates both cultivated land functionality and degradation risk, aiming to address the gaps in existing research and provide a scientific basis and decision-making support for the effective protection and sustainable use of black soil. Specifically, this study first analyzes the key indicators affecting the CLQ of black soil and identifies potential degradation risks. Secondly, a comprehensive evaluation model is constructed based on these indicators. Finally, the model is applied to evaluate the CLQ of the BSNC, and corresponding management recommendations are proposed. This evaluation system, through multi-dimensional considerations, not only accurately reflects the current state of black soil quality but also provides a new perspective for the further development of evaluation methods, particularly in the shift from single-function to multi-function evaluations [30,31].
The remainder of this paper is organized as follows: Section 2 introduces the theoretical framework and research methodology underpinning the study. Section 3 presents the results of the CLQ evaluation for the BSNC region. Section 4 analyzes the correlations between cropland functionality and degradation risks, alongside an assessment of degradation risks across different regions. Finally, Section 5 concludes this study with key findings and policy recommendations.

2. Materials and Methods

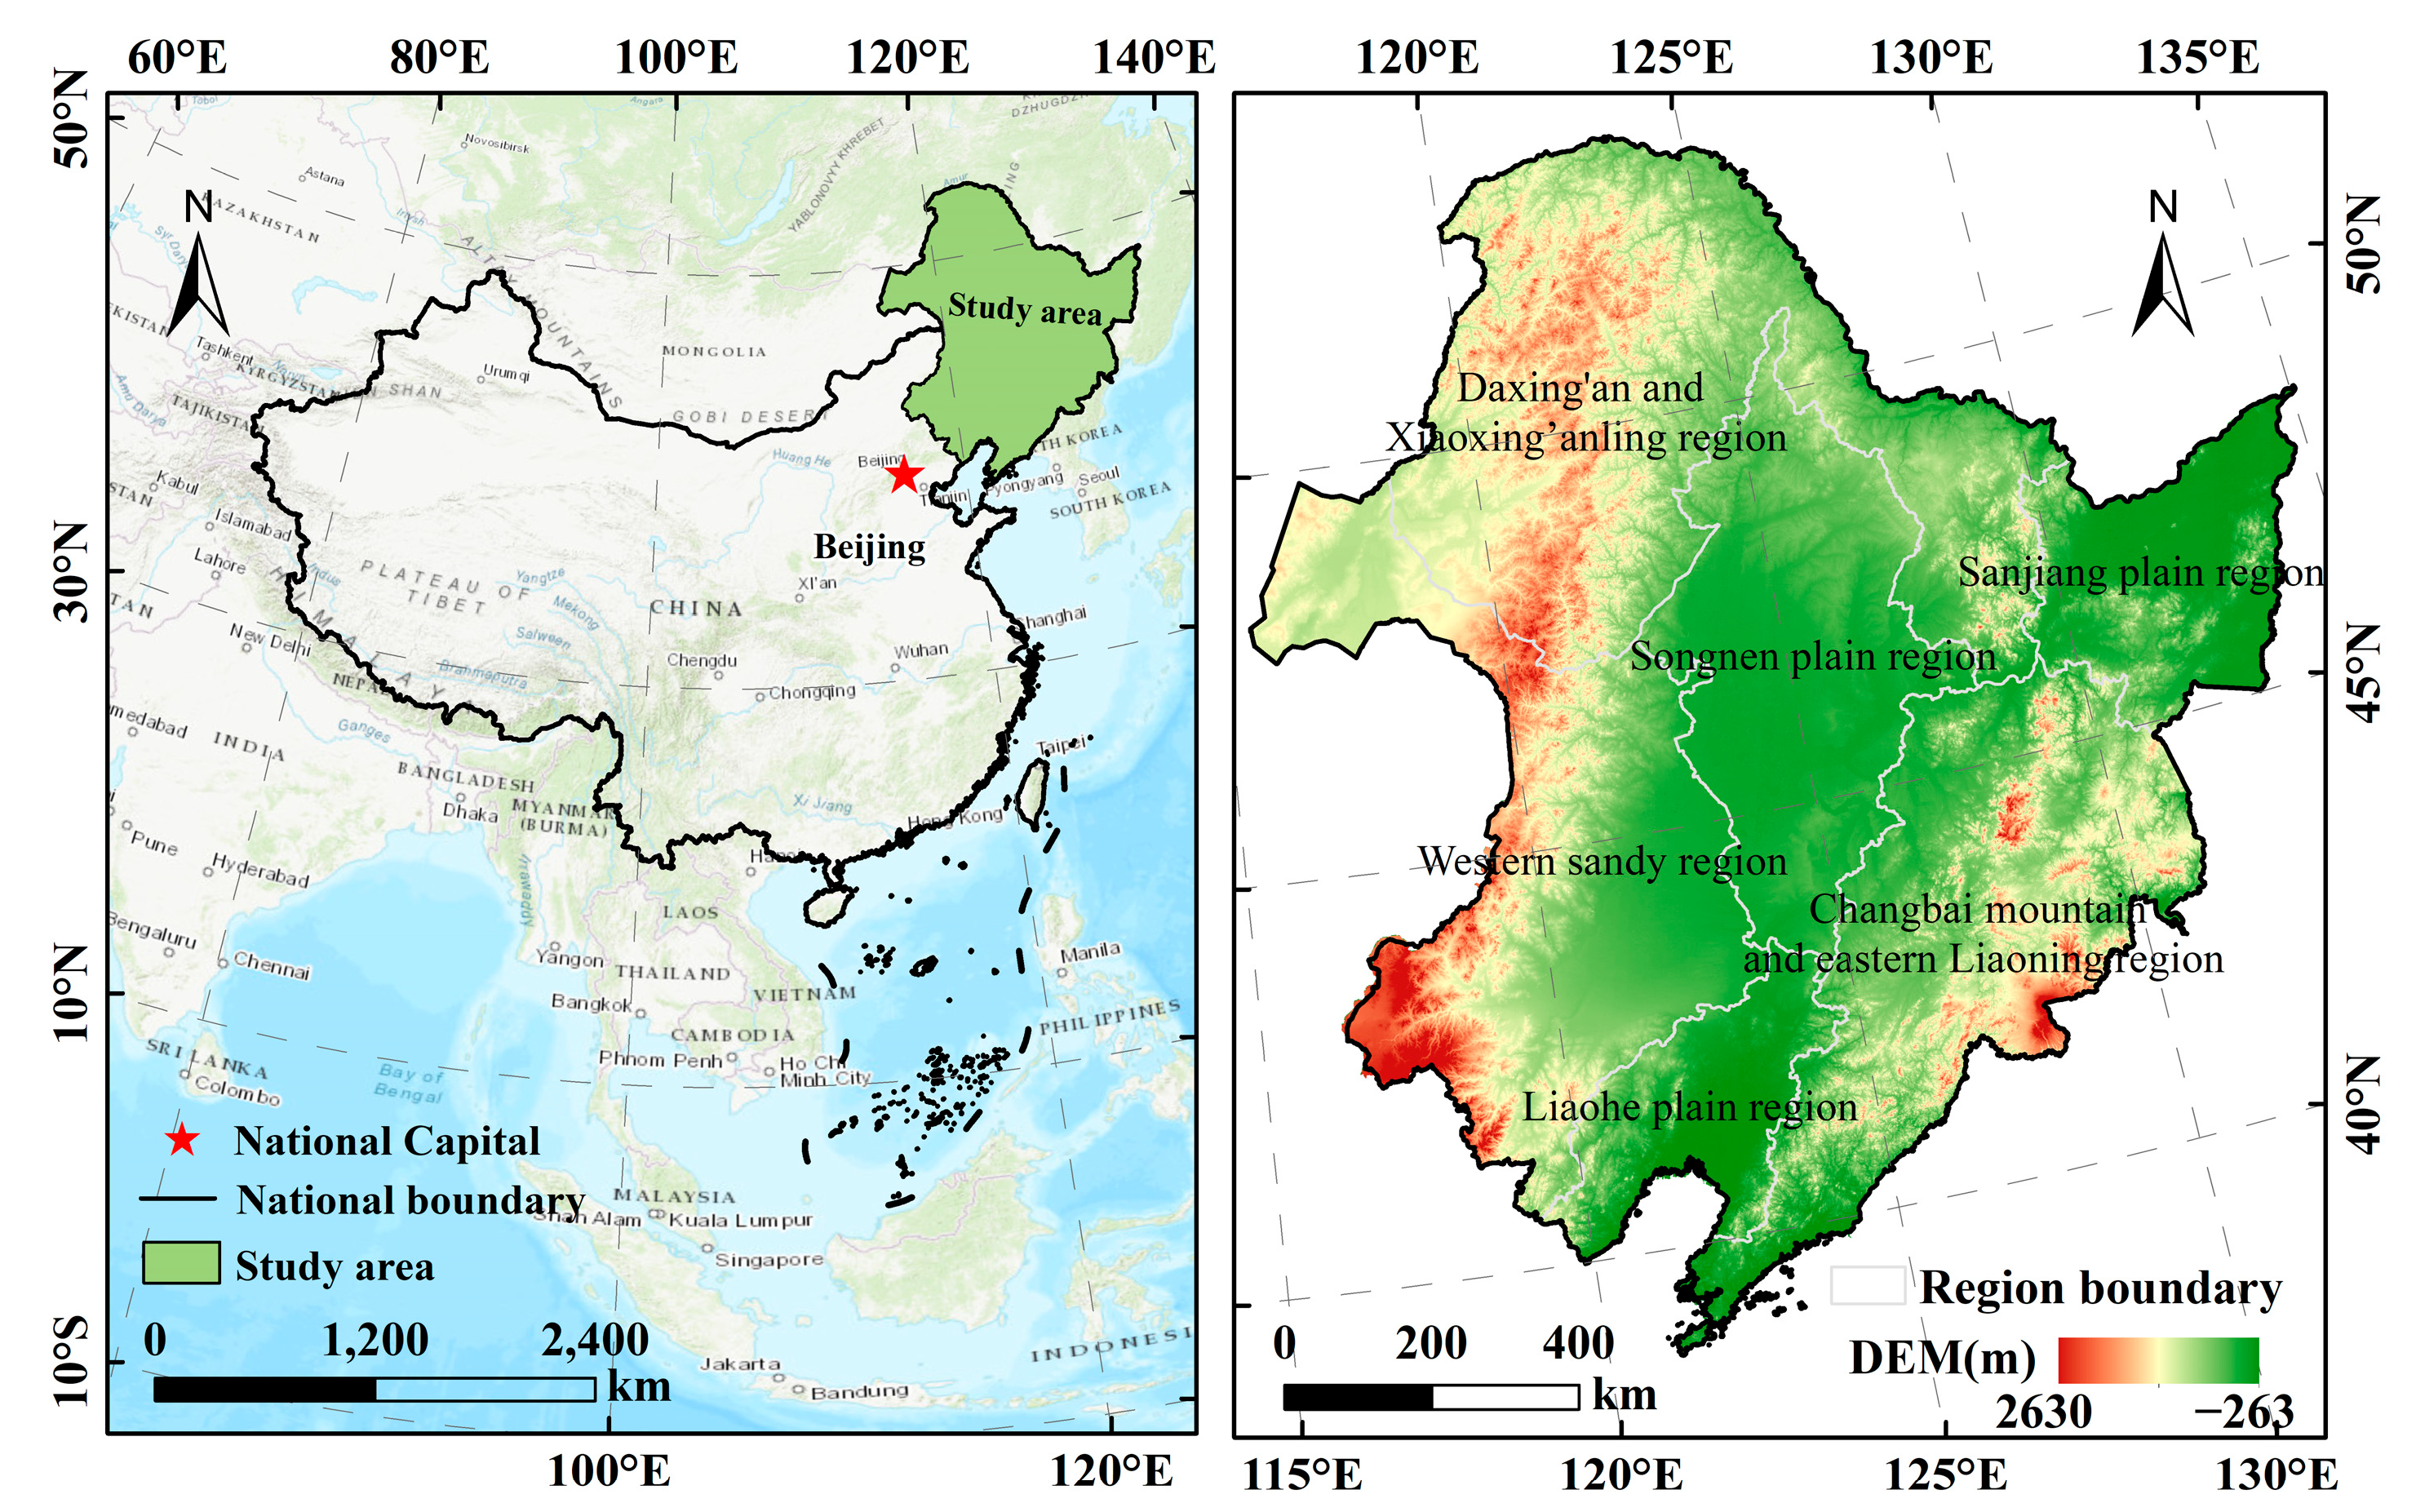
2.1. Overview of the Research Area

BSNC is a type of fertile cultivated land characterized by a black or dark humus-rich surface layer. The region spans from 115° E to 135° E in longitude and from 38° N to 53° N in latitude (Figure 1). The total area is approximately 1.25 million square kilometers, with 375,000 square kilometers being cultivated land. BSNC exhibits significant differences in climate, topography, soil, and land use. Based on the principles of regional similarity and inter-regional differences, this study divides the BSNC into six types: the Songnen Plain Region (SNP), the Sanjiang Plain Region (SJP), the Liaohe Plain Region (LHP), the Changbai Mountain and Eastern Liaoning Region (CBMEL), the Western Sandy Region (WS), and the Daxing’an and Xiaoxing’anling (DXXXL) [32]. The effective accumulated temperature ≥ 10 °C gradually decreased from south to north, with the highest being 3685.1 °C in the LHP region and the lowest being 1446.6 °C in the DXXXL region. The annual average precipitation decreases gradually from east to west, with the CML region averaging 585.7 mm of annual precipitation, which is significantly higher than that in other areas. The elevation increases first and then decreases from west to east, with lower elevations mainly found in river alluvial plains. The average elevations in SNP, SJP, and LHP are 212.8 m, 152.5 m, and 155.3 m, respectively. The terrain in CBMEL, WS, DXXXL, and other areas has significant undulations and diverse features. The elevation range of CBMEL is −186 m to 2630 m, that of WS is 86 m to 2054 m, and that of DXXXL is 65 m to 1706 m. SNP and LHP primarily cultivate crops like rice, corn, and soybeans, with SJP focusing primarily on rice. WS and DXXL mainly grow corn and soybeans. Due to its higher elevation, CBMEL mainly cultivates crops such as corn, winter wheat, soybeans, and sorghum.

2.2. Data Sources and Processing

The data collected in this study included indicators related to land use, stand conditions, soil properties, and cropland utilization (Table 1). To ensure data consistency, all raster data were adjusted to a scale of 1 km × 1 km using the resampling tool of ArcGIS 10.7 software to ensure consistency and comparability between different datasets. The point data were processed into raster data by spatial interpolation techniques to ensure the completeness of spatial coverage and facilitate subsequent analyses.
The rate of agroforestry networks was evaluated through the analysis of 30 m × 30 m land use and cover change (1985–2022). Farmland forest networks play a significant role in the protection of cultivated land, the prevention of wind erosion, and the provision of ecological benefits. In this study, the farmland forest reticulation rate was determined by calculating the ratio of the area of cultivated land protected by the forest network to the total area of cultivated land. Based on the prevalence of certain tree species (e.g., poplar and elm) in the northeast region, an average tree height of 40 m was established, with a forest network spacing of 800 m. This configuration was designed to effectively safeguard farmland while simultaneously facilitating optimal ventilation and light conditions for crops. An 800 m buffer zone was created around the forested land, and the cultivated land data were superimposed to determine the area of cultivated land protected by the forest network [8]. The proportion of this area to the total cultivated land area was calculated to derive the rate of farmland forest reticulation in each municipality.
The average production cost per mu is a significant element in the assessment of CLQ. This was calculated as the sum of the average fertilizer cost per mu and the cost of machinery. The extensive utilization of mechanization in contemporary agricultural practices and the prevalent overuse of fertilizers in Chinese agriculture have been identified as the primary determinants influencing production costs [33]. By integrating the costs associated with fertilizers and machinery, this study effectively demonstrates the spatial variability of production costs to a great extent.
The estimation of the thickness of the black soil layer was based on the United Nations’ definition of black soil, specifically where the soil organic matter content exceeds 2% [34]. Data were obtained from the 250 m Global Soil Organic Carbon dataset, which provides the soil organic matter content at different depths (0–5 cm, 5–15 cm, 15–30 cm, 30–60 cm, 60–100 cm, and 100–200 cm). It was assumed that the midpoint of each layer represented the organic matter content at that depth (e.g., the 0–5 cm layer represents a depth of 2.5 cm). The thickness of the black soil layer was then estimated by identifying the depth intervals at which the organic matter content exceeded 2% and applying linear interpolation. If the organic matter content fell below 2% in the shallowest layer (2.5 cm), the thickness of the black soil layer was set to 0. Conversely, if the content remained above 2% at a depth of 150 cm, the thickness was set to 150 cm. While the method relies on certain assumptions, it provides a reasonable estimation of the black soil layer’s thickness and effectively reflects its approximate distribution, particularly when direct measurement data are unavailable.

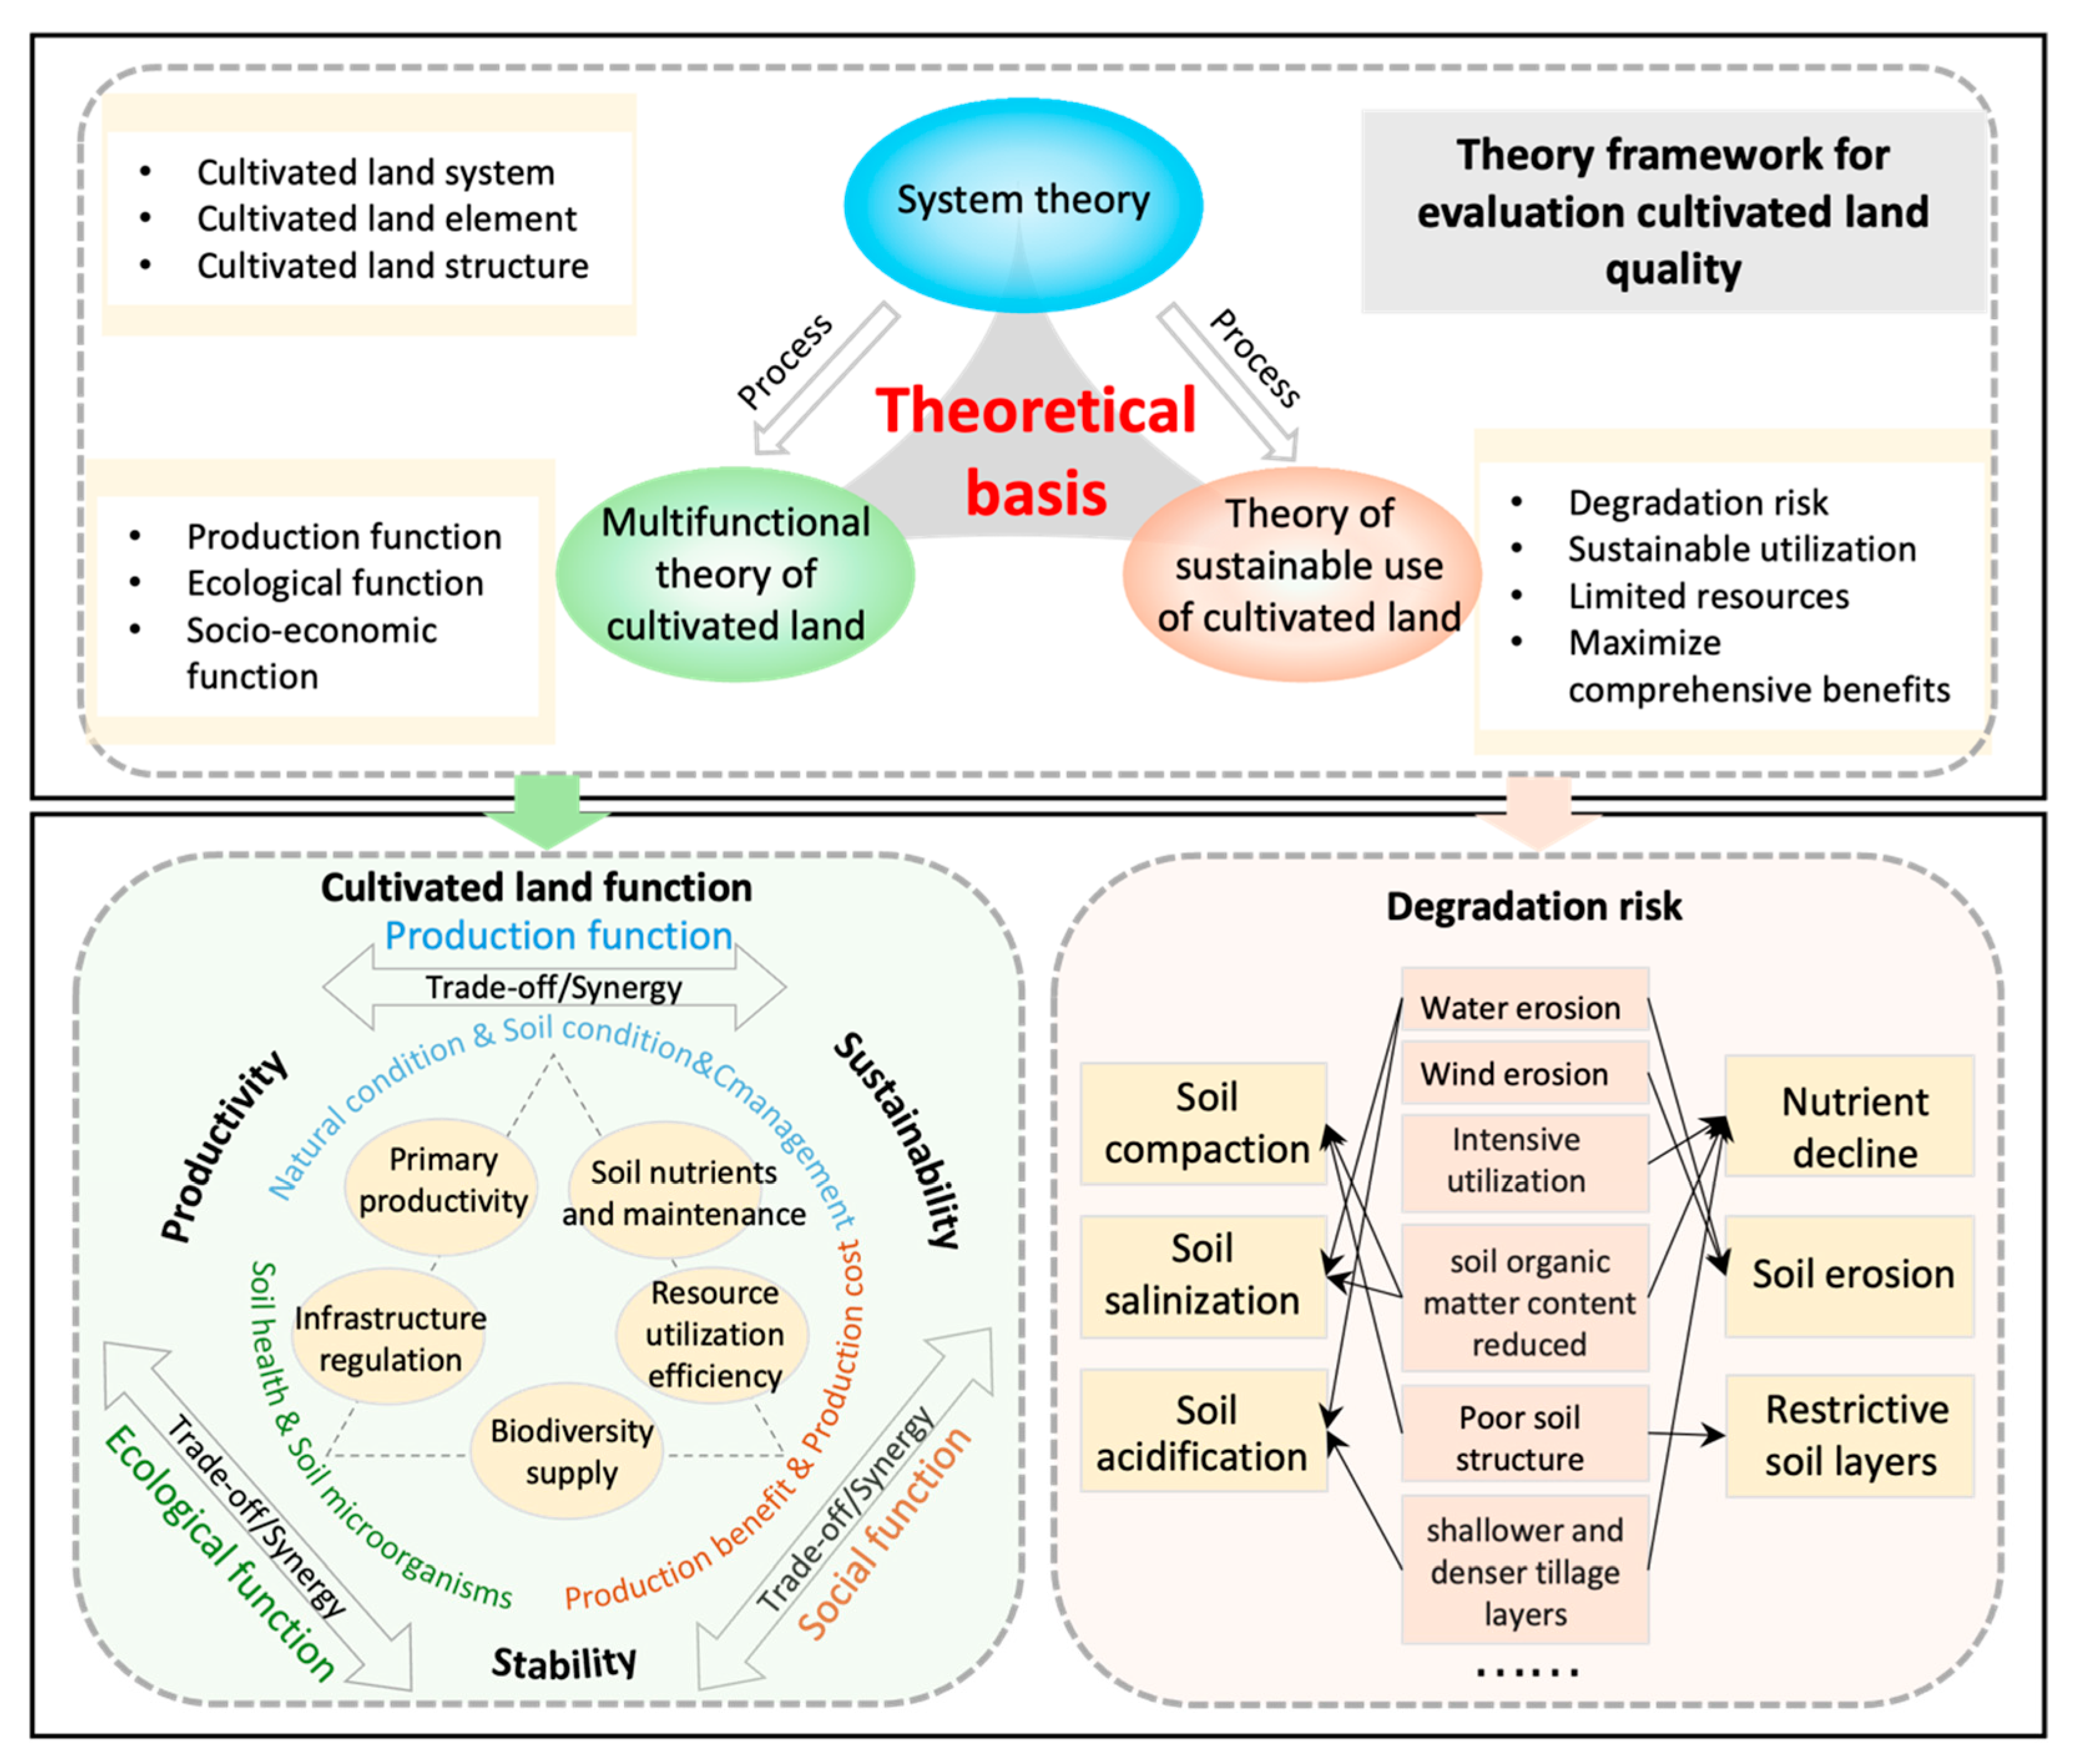
2.3. Research Framework

Cultivated land is land developed by humans for crop production and represents a special type of land use [35]. Initially, the concept of CLQ primarily focused on basic soil fertility, but it has now expanded to include suitability, production potential, ecological safety, and sustainability [36,37,38]. The quality of black soil cultivated land depends on its ability to perform and maintain functions, as well as its resilience under external pressures. Therefore, CLQ evaluation should be primarily based on cultivated land functionality, while incorporating degradation risks that may affect these functions into the evaluation system. In this study, the research framework of “Cultivated Land Quality–Function/Degradation Risk–Evaluation Indicators” was established. The traditional evaluation of the quality of arable land in China has primarily focused on the quantity of resources and production functions, with less emphasis on multifunctionality and sustainable use. This study, therefore, emphasizes the productivity, stability, and sustainability of arable land, thereby addressing this shortcoming.
This study employs an approach to indicator selection, encompassing both the functional aspects of cropland and the associated risk of degradation. The former evaluation index system is more comprehensive, theoretical, and systematic, focusing on the assessment of cultivated land function. In contrast, the latter addresses the actual problems of cultivated land protection in the black soil, highlighting the key challenges faced by regions in cropland utilization and construction. Cultivated land functions may be classified into three principal categories: production, ecology, and society. Of these, the production function is of the utmost importance. The northeast black soil benefits from a mild climate, four distinct seasons, simultaneous precipitation and heat, and sufficient light, which collectively provide favorable natural conditions for crop growth [39]. The higher effective cumulative temperature of ≥10 °C in the LHP, the high organic matter soil in the SJP and DXXXL, and the deep soil layer in the SNP create superior conditions for crop growth in terms of heat, nutrients, and root growth. Furthermore, the region’s well-developed dry farming practices have reinforced the production function of its arable land. This function can be further categorized into three distinct categories: primary productivity (PP), soil nutrient and maintenance (SNM), and infrastructure regulation (IR) functions. The evaluation of primary productivity is based on terrain conditions that are not influenced by human activities. The maintenance and nutrient functions of the soil are crucial for the sustenance of crop growth and the attainment of sustainable production [40]. These functions are evaluated through the assessment of soil property indicators. Infrastructure regulation reflects human management and adaptation of cropland and is evaluated through indicators of human activities in cropland utilization. The sustainable utilization of cropland is contingent upon the maintenance of its ecological functions. Regarding soil attributes, soil microbial diversity is indicative of the complexity and stability of cropland ecosystems, thereby facilitating the maintenance of soil health and ecological functions [41]. In this study, the biodiversity supply (BS) function was incorporated into the index system to reflect the capacity of arable land to sustain the ecosystem and biodiversity [42]. The social function reflects the social attributes of arable land. As a significant agricultural production region in China, the northeastern black soil area is directly associated with food security and agricultural output. The cultivation of high-yield arable land not only ensures the domestic food supply but also enhances the export potential of agricultural products, which has a positive impact on the national economy. Furthermore, the development and utilization of black soil in Northeast China has a significant positive impact on local economic development, creating employment opportunities and promoting the prosperity of related industrial chains, such as agricultural machinery and fertilizers [33]. This, in turn, leads to regional economic growth. The application of modern agricultural technology has led to increased production efficiency, a reduction in production costs, and an increase in farmers’ income. This has had a profound impact on social stability and economic development. This study measures the ability of technological progress in agricultural production to reduce production costs and improve efficiency by setting the resource utilization efficiency (RUE) function.
BSRNC is susceptible to a multitude of soil degradation risks, including soil erosion [43], nutrient decline, soil compaction [44], soil acidification [45], soil salinization, and the formation of barrier soil layers [9]. The reclamation of cultivated land has resulted in the degradation of the original ecosystem of the black soil. Furthermore, the prevalence of extreme weather conditions has contributed to an acceleration in wind and water erosion, leading to a notable reduction in the thickness of the black soil layer [43]. Since 1950, there has been a notable reduction in the thickness of the top black soil layer, which has decreased from 80 cm to 20–40 cm [46]. It is estimated that if the current rate of loss of the existing black soil is maintained, the black soil layer will be completely depleted within the next 40–50 years [47]. The long-term cultivation of the black soil in Northeast China has resulted in a decline in nutrients, with the organic matter content decreasing from an initial range of 60–80 g/kg to 20–30 g/kg [3]. This has had a detrimental impact on soil fertility and crop growth. In contrast, soil compaction can be attributed to the prolonged utilization of heavy machinery, which results in soil consolidation and a reduction in porosity, consequently influencing soil permeability and water infiltration capacity. Some studies have indicated that long-term fertilization over the past three decades has diminished the pH of black soil by 0.59 units, with soil acidification becoming a significant concern [47].

2.4. Indicator System Construction

Based on Figure 2, we selected representative indicators and established a multi-factor, multi-functional evaluation system for the quality of the black soil. By referencing the “Third National Soil Census”, the “Third National Land Survey Classification of Cultivated Land Resource Quality”, and the European Union’s soil environmental quality monitoring indicators, we employed principal component analysis (PCA) to select representative indicators within cultivated land functions. Building on this foundation and combining the results of the questionnaire surveys and the literature review, we finalized the evaluation indicators for cultivated land functions and degradation risks.
Considering the significant differences in site conditions and soil attributes across different regions, we performed PCA for each type of region separately [35,48] to determine the representative indicators for each area. Combining the results from the questionnaire survey and PCA, we finally established a comprehensive evaluation index system for black soil cultivated land quality (Table 1). Among the selected indicators, 11 indicators reflect the cultivated land function, suitable for evaluating the quality of black soil cultivated land, and 7 reflect degradation risks, and different degradation indicators are selected for different types of areas.

2.5. Indicator Weight Determination and Calculation of Comprehensive Index

The fuzzy membership degree primarily addresses conceptual issues that cannot be expressed with data [49]. It quantifies these issues using the concepts of membership degree and membership functions, linking evaluation indicators to different membership function models for cultivated land quality. These functions are classified into three types: S-shaped function, reverse S-shaped function, and parabolic function [50]. For numerical indicators, when within a specified range, the membership degree can be obtained through the function; otherwise, it is either 0 or 1 [51]. For conceptual indicators, the membership degree is directly given. In this study, the membership degree calculation was performed in ArcGIS using the Spatial Analysis tool.
The Analytic Hierarchy Process (AHP) is a method used for resolving complex multi-objective decision-making problems by decomposing the decision-related elements into multiple layers (goals, criteria, and alternatives) for qualitative and quantitative analyses [52]. In this study, the final weights of the cultivated land function indicators were obtained by averaging the weights derived from both AHP and PCA (Table 2). Due to the limited number of degradation risk indicators for each type of region, typically 2–3 indicators, the weights of these evaluation indicators were averaged based on the number of evaluation indicators in each region.
This study uses the weighted summation method [53] to calculate the comprehensive index. The specific steps are as follows: Multiply the weight of the cultivated land function index by the corresponding membership degree to obtain the cultivated land function index. Multiply the weight of the cultivated land degradation index by the corresponding membership degree to obtain the cultivated land degradation risk index. Multiply the cultivated land function evaluation result by the degradation risk result to obtain the cultivated land quality value.
The evaluation results of the cultivated land function index and degradation risk index both range from 0 to 1. The cultivated land function index is evenly divided into five grades: [0–0.2) as Grade 5, [0.2–0.4) as Grade 4, and so on. The degradation risk index is categorized as [0–0.2) for high risk, [0.2–0.4) for higher risk, [0.4–0.6) for moderate risk, [0.6–0.8) for lower risk, and [0.8–1] for low risk. The comprehensive evaluation index ranges from 0.11 to 0.79 and is evenly divided into five grades, with Grade 1 representing the best performance and Grade 5 representing the worst.

3. Results and Analysis

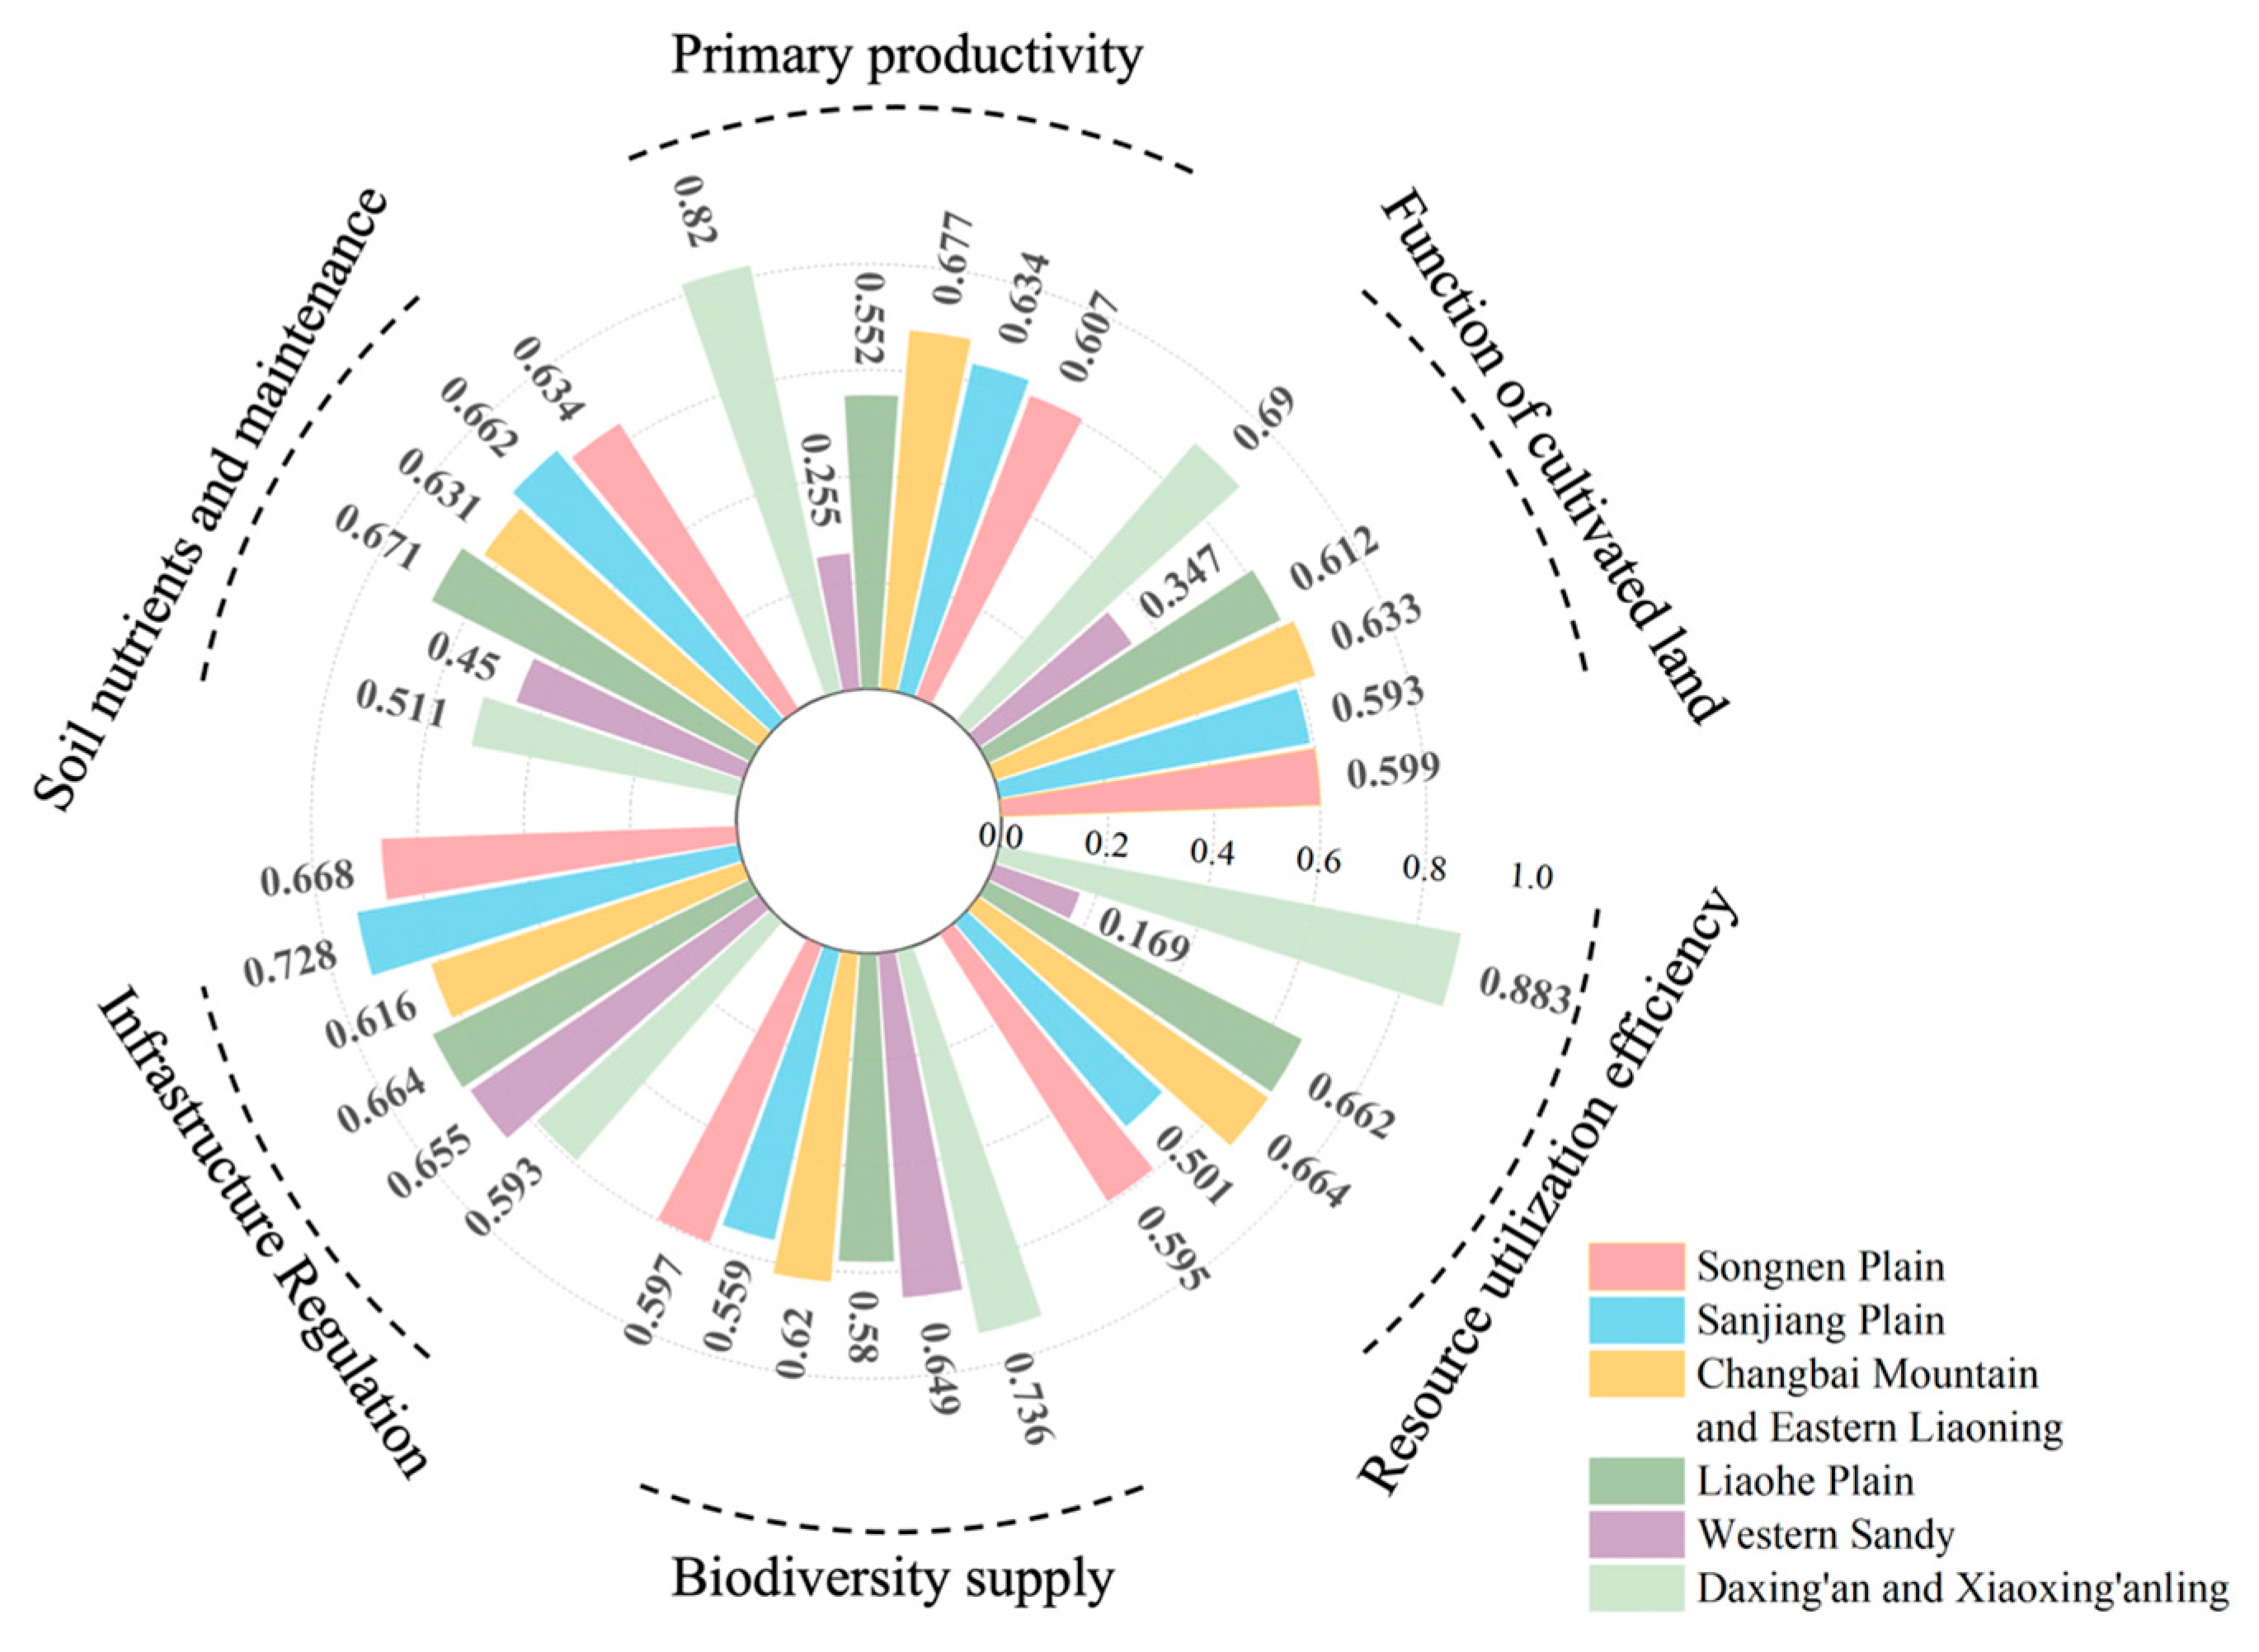
3.1. Evaluation Results of Cultivated Land Quality Based on Cultivated Land Function

The evaluation results of cultivated land quality based on the cultivated land function in the BSNC demonstrate excellence across multiple dimensions, with the incorporation of specific area data providing additional clarity. From the northwest to the southeast, the primary productivity (PP) function of cultivated land exhibits an increasing trend (Figure 3a), with over 97.40% of the land classified as Grade 3 or higher, indicating significant agricultural production potential. Specifically, the area classified as Grade 3 is 131,200 m2, Grade 2 is 231,401 m2, and Grade 1 is 7838 m2, reflecting regional variations in PP (Table 3), such as the predominance of Grade 1 and Grade 2 land in the LHP and CBMEL, where they account for 99.6% and 93.8% of the total area, respectively. The soil nutrients and maintenance (SNM) function gradually weakens from northeast to southwest (Figure 3b), with 372,259 m2 of land rated as Grade 3, 339,022 m2 as Grade 2, and 3104 m2 as Grade 1, demonstrating overall good soil quality, particularly in regions such as the SJP, where all cultivated land is classified as high grade. The infrastructure regulation (IR) function is most pronounced in CBMEL (Figure 3c), where 181,925 m2 of land is categorized as Grade 3, 184,377 m2 as Grade 2, and 12,321 m2 as Grade 1. The biodiversity supply (BS) function, however, is the weakest among all, with 41,649 m2 and 153,280 m2 of land classified as Grades 5 and 4, respectively, while only 13,488 m2 falls into Grade 1, highlighting significant constraints in biodiversity support. Resource utilization efficiency (RUE) also shows considerable variation (Figure 3e), with 32,868 m2 and 15,586 m2 of land categorized as Grades 5 and 4, respectively, while land classified as Grades 1 and 2, comprising 157,301 m2 and 123,630 m2, respectively, is concentrated in regions such as DXXXL and SJP, demonstrating advantages in cost-effectiveness and resource use efficiency. Overall, the cultivated land function in the BSNC performs well, with Grade 2 and Grade 3 land accounting for 59.27% and 40.73% of the total area, respectively, reflecting a balanced approach to agricultural productivity and land use efficiency within the study region (Figure 3f).
As shown in Figure 4, the scores for comprehensive cultivated land function and SNM function in most areas range from 0.6 to 0.8. In contrast, the BS function is generally weaker. The cultivated land function of the LHP is the most balanced, with most function indices ranging from 0.6 to 0.8. In the SJP and DXXXL, the BS function scores range from 0 to 0.4, while the RUE function scores range from 0.8 to 1. This indicates that there are significant regional differences in the BS function and RUE function, which affect the balance of different cultivated land functions across regions. The balanced functionality in the LHP promotes the development of its comprehensive cultivated land function, while the disparity in functionality in DXXXL corresponds to its lower grade of comprehensive cultivated land function. The results indicate that the balanced development of individual cultivated land functions is crucial for improving comprehensive cultivated land function.

3.2. Evaluation Results of Cultivated Land Quality Based on Degradation Risk

This study conducted a comprehensive assessment of the cultivated land degradation risk in different types of regions within the BSNC. The results indicate that in the SNP, low-to-moderate-risk land accounts for 96.30% of the total area (Figure 5). In the SJP, 87.80% of the cultivated land faced moderate or lower risk. In the LHP, 98.32% of the cultivated land was at moderate or lower risk. In DXXXL and WS, the distribution of degradation risk was not significant, while in CBMEL, the degradation risk showed a trend of being lower in the north and higher in the south. Based on Table 4, it can be observed that low-risk and very-low-risk cultivated land accounts for the majority of the region. However, the Liaohe Plain and Sanjiang Plain exhibit relatively higher degradation risks, making them key areas for future land protection and management efforts. These findings provide a clear basis for the regionalized and refined management of degradation risks in the black soil region, while also laying a foundation for the development of differentiated protection strategies.
Overall, low-risk cultivated land is mainly concentrated in the SNP and WS, accounting for 38.55% of the total area. Lower-risk cultivated land is widely distributed, accounting for 40.64%. Moderate-risk cultivated land accounts for 17.14%, primarily located in the SNP, LHP, and SJP. Higher- and high-risk cultivated land makes up only 3.67%, primarily concentrated in the southern parts of the SJP and the SNP. The western regions, due to their arid climate and minimal human activity, exhibited lower degradation risks for cultivated land. In contrast, the eastern regions faced greater risks of soil erosion and nutrient loss due to higher precipitation and intensive agricultural activities.

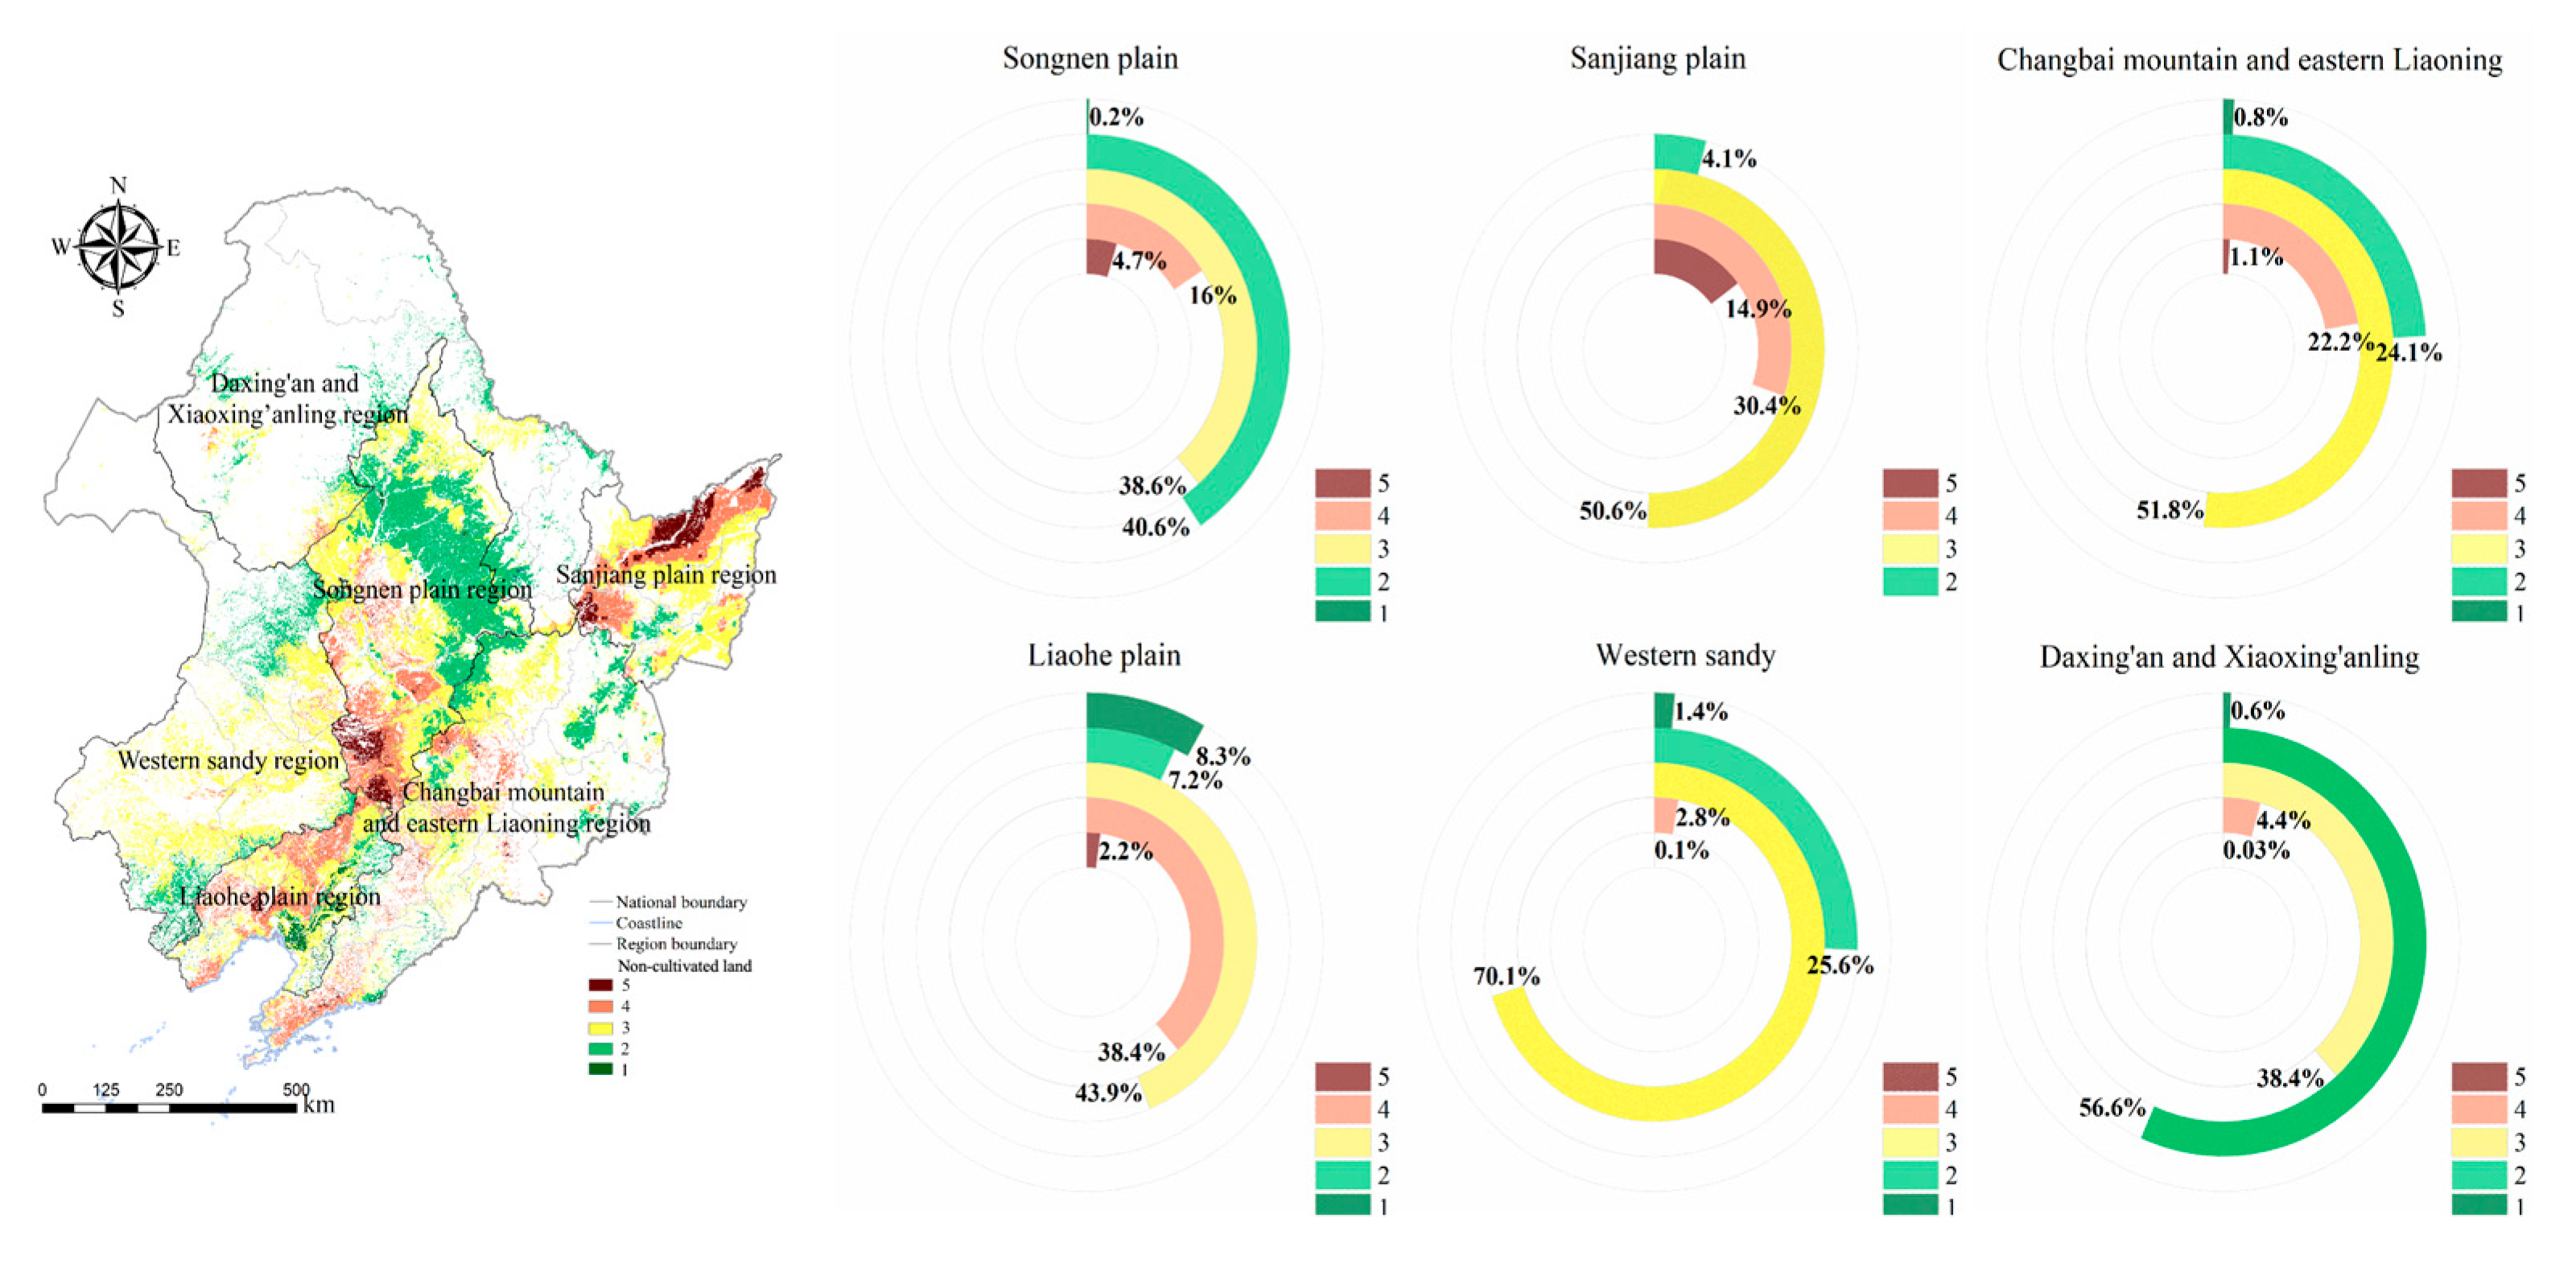
3.3. Comprehensive Evaluation Results of Cultivated Land Quality

The spatial distribution of CLQ in the BSNC shows a gradual decrease from north to south. Grade 1 cultivated land accounts for 1.39% of the total cultivated land area (Figure 6), primarily distributed in the LHP. Grade 2 and 3 cultivated land makes up 75.68% of the total area and is mainly found in the northern SNP, WS, CBMEL, and the SJP. Grade 4 cultivated land is located in the western LHP, SJP, and southern SNP, accounting for 18.73%. Grade 5 cultivated land constitutes 4.20%. Overall, the CLQ in the BSNC is relatively high, with more than three-quarters of the land being Grade 1 to Grade 3, indicating significant progress in black soil protection efforts.

4. Discussion

4.1. Comprehensive Analysis of Evaluation Results

We adopted a scientific theoretical framework and an evaluation index system. Previous studies evaluating cultivated land quality considered soil health, “functional management”, soil stress, and the “short board effect” [54,55]. Based on these foundations, we constructed an evaluation framework of “Cultivated Land Quality–Function/Degradation Risk–Evaluation Indicators.” The evaluation index system is divided into two parts: cultivated land function and degradation risk. This approach has not been previously used in the evaluation of cultivated land quality in China. Traditional evaluations have mainly focused on cultivated land resources and production functions, without assessing the multifunctionality and sustainable protection and utilization of cultivated land. When choosing indicators, Bünemann [20] pointed out that climatic factors are usually not included in cultivated land quality evaluation. Our study addresses this by incorporating indicators such as annual precipitation and accumulated temperature into the evaluation. Moreover, for different degradation risks, we referred to the European Union soil environmental quality system. This study also introduced soil biological indicators to improve the evaluation accuracy [56]. In summary, through a comprehensive evaluation from multiple perspectives and indicators, this study significantly enhances the evaluation grade of cultivated land quality in black soil regions.
Comparing the results of this study with the “Bulletin on the quality grades of cultivated land in China in 2019” (hereinafter referred to as the “Bulletin”), significant differences are found. The “Bulletin”, based on the national standard “Cultivated Land Quality Grade” (GB/T 33469-2016) [57], divides cultivated land quality into ten grades, with Grades 1 to 4 accounting for 67.29% of the total cultivated land area in Northeast China. We divide cultivated land quality into five grades, assuming that Grade I corresponds to Grades 1 and 2 in the “Bulletin”. Our results show that Grades 1 to 4 account for 28.46% of the total cultivated land area, which is significantly lower than the “Bulletin” results. Wang [4] evaluated 320 counties in the BSNC, showing that the overall quality of cultivated land is relatively good, with an average grade of 3, indicating a high grade. In contrast, our study shows that Grades 5 and 6 account for 48.61% of the total area, suggesting that most of the cultivated land is of moderate quality [47]. This discrepancy may be due to our study considering the impact of degradation risk on cultivated land quality and incorporating it as a limiting factor in the evaluation system, emphasizing the sustainable utilization of cultivated land. Therefore, the evaluation results of this study are more conservative yet somewhat more progressive compared to previous studies, but they are also more comprehensive and scientific.
To analyze the coupling between cultivated land functions and degradation risks, we employed a bivariate analysis method to examine the spatial distribution of different levels of cultivated land functions and degradation risks. As shown in Figure 7, most regions exhibit high–high or low–low distributions of cultivated land functions and degradation risks. In the SNP and SJP regions, both cultivated land functions and degradation risks are at higher levels. In the CBMEL, WS, and DXXXL regions, both cultivated land functions and degradation risks are at lower levels. However, in the LHP, low-level cultivated land functions and high-level degradation risks coexist. Overall, cultivated land functions are generally higher in plain areas, accompanied by higher degradation risks, while both cultivated land functions and degradation risks are relatively lower in hilly and mountainous areas.

4.2. Trade-Offs and Synergies of Cultivated Land Functions

This study analyzed the relationships among cultivated land functions using the Spearman rank correlation coefficient (Figure 8) to reveal their trade-offs and synergies [58]. The results show a trade-off between the PP and RUE functions across different types of regions, with the correlation coefficient ranging between −0.2 and −0.6, except in CBMEL. This indicates that high-productivity farmland is typically associated with higher production costs. There is a synergistic relationship between the RUE and SNM functions, as indicated by correlation coefficients ranging from 0.15 to 0.65 in most regions, suggesting that enhancing the RUE contributes to maintaining soil nutrients [59]. For example, conservation tillage techniques in the SNP reduce input costs while significantly enhancing the sustainable and efficient use of cultivated land [32,60]. In all regions, the BS function shows a positive correlation with the PP function, with the strongest correlation observed in CBMEL (correlation coefficient = 0.78). In contrast, the correlation coefficient between BS and SNM is less than 0, indicating a trade-off relationship. This suggests that the soil microbial diversity is closely related to site conditions, soil texture, and organic matter content. Areas with high accumulated temperature, abundant precipitation, and low altitude are favorable for the growth of crops and microorganisms [61]. Moreover, there is a more common trade-off relationship between resource use efficiency functions and biodiversity functions, indicating that excessive fertilizer input reduces soil biodiversity. It is recommended to reduce the use of chemical fertilizers and pesticides, adopt organic fertilizers, and implement crop rotation to enhance soil conservation functions. Although this study did not analyze the trade-offs and synergies of cultivated land functions over time, we quantified the correlations between these functions. The results remind us that while improving the production functions of cultivated land, we must also pay attention to protecting the ecological and social functions of the land. This is of great significance for cultivated land protection and management. Multifunctional management of cultivated land may become an important approach for the future utilization of land systems [62].

4.3. Analysis of Cultivated Land Degradation Risks

This study found that the southern area of the SNP faces higher degradation risks for cultivated land. Long-term intensive farming has resulted in a thinner black soil layer and reduced soil organic matter content in this region [11], increasing the risk of soil erosion and nutrient depletion. In the western regions, the area of saline–alkali soil has expanded, and the pH value of other soils except saline–alkali soil has dropped to 5.5–6.5 [63], further exacerbating the degradation risk of cultivated land. It is recommended to promote conservation tillage techniques, such as no till or reduced tillage, to minimize surface soil disturbance. Additionally, increasing the straw return and the application of organic fertilizers can help enhance the soil organic matter content. In the northern part of the SJP, the albic layer is close to the surface and relatively thick. Xu [9] indicated that the albic soil in the SJP accounts for 51.91% of the total albic soil area in the BSNC, with the thickness of the black soil layer being only one-third to one-quarter that of normal black soil. The low soil organic matter content leads to obstructive soil layers and nutrient decline, posing a high degradation risk to cultivated land. In the LHP, most of the cultivated land has a soil organic matter content of less than 2% [64]. Mechanical tillage has increased the soil bulk density and decreased the nutrient supply capacity [65], resulting in a high degradation risk for cultivated land in this area. It is recommended to improve the aeration and nutrient supply capacity of the albic layer through subsoiling and the application of organic fertilizers. Additionally, increasing the proportion of straw return, combined with the effective application of NPK compound fertilizers, can help replenish soil nutrients.
DXXXL has the lowest effective accumulated temperature among the six regions, which is unfavorable for crop growth. The southern part of this region has thin black soil layers, low soil organic matter content, a high proportion of topsoil thickness less than 20 cm, and weak agricultural infrastructure, leading to a high risk of land degradation. CBMEL has generally higher altitudes, with cloudy and less sunny conditions in mountainous areas, affecting crop growth and yield [52]. The soil pH of cultivated land in this area is around 7, slightly acidic in the central and southern parts, with low soil organic matter content, resulting in a lower degradation risk. It is recommended to plant green manure crops (such as alfalfa) to improve soil structure and increase organic matter content. For areas with severe compaction, regular subsoiling should be conducted to enhance soil aeration. Additionally, precise control of chemical fertilizer application, combined with the use of organic fertilizers, can improve soil nutrient use efficiency. The WS region is mainly composed of eolian sandy soil, meadow soil, and brown soil, with relatively high soil pH and sodium–alkali levels, posing risks of soil salinization and alkalization. It is recommended to promote grassland restoration and windbreak sand fixation measures, such as planting drought-resistant shrubs (e.g., Caragana and Salix psammophila). This can be combined with the cultivation of salt-tolerant economic crops and the development of forestry and grass industries to optimize land use structure.

5. Conclusions

We developed an evaluation framework integrating cultivated land functionality and degradation risk to assess cropland quality (CLQ) in Northeast China’s black soil region (BSNC), highlighting sustainable land use. Our analysis showed that over 97.40% of the land excels in primary productivity (PP), with areas like LHP and CBMEL rated as Grades 1 and 2, yet biodiversity supply (BS) is notably weak, with over 98% of some areas in Grades 4 and 5. Degradation risks are low across 79% of the SNP region, but higher risks, such as those of erosion and nutrient depletion, persist in the Liaohe and Sanjiang Plains. Based on the specific degradation characteristics of the different regions mentioned above, it is essential to implement tailored strategies combining modern agricultural technologies and ecological conservation measures. These strategies include conservation tillage, soil improvement, and crop structure adjustment, aiming to achieve the sustainable utilization and efficient management of cultivated land. Additionally, it is crucial to strengthen the long-term monitoring of cultivated land degradation to provide scientific support for precise management and policy formulation.
This study focuses on the black soil of Northeast China (BSNC) region, which may limit the generalizability of its findings to other black soil ecosystems with differing environmental or policy contexts. The selection of specific indicators might overlook additional factors influencing cropland quality (CLQ). Future research should investigate longitudinal trends in CLQ, expand the spatial scope, and incorporate additional indicators, such as microbial metrics, to advance sustainable cropland management.

Author Contributions

Conceptualization, H.T., Y.Z. and Y.D.; methodology, Q.L., Y.Z., Y.L. and J.N.; software, M.G., J.N. and Q.X.; investigation, H.T., J.N., Q.X., M.L. and Y.D.; resources, H.T. and Y.H.; data curation, H.T., Q.L. and Y.D.; writing—original draft preparation, H.T., Y.Z. and Q.L.; writing—review and editing, Y.Z., H.T. and M.G.; visualization, Y.Z., M.G., Y.L. and J.N.; supervision, H.T., Q.X., M.L. and Y.D.; project administration, H.T., Y.H., M.L. and Y.H.; funding acquisition, H.T., Y.L. and Y.H. All authors have read and agreed to the published version of the manuscript.

Funding

This work was supported by the National Key R&D Program of China (Grant No. 2021YFD1500201); the National Natural Science Foundation of China (Grant No. 69191019); and the Government Fund Project (Grant No. 20241411044). We would like to thank our editor and the anonymous reviewers for their valuable comments.

Institutional Review Board Statement

Not applicable.

Informed Consent Statement

Not applicable.

Data Availability Statement

The data presented in this study are available on request from the corresponding author. The data are not publicly available due to privacy.

Conflicts of Interest

The authors declare no conflicts of interest.

References

  1. FAO. Global Status of Black Soils. Rome. 2022. Available online: https://doi.org/10.4060/cc3124en (accessed on 25 November 2023).
  2. Sorokin, A.; Owens, P.; Láng, V.; Jiang, Z.-D.; Michéli, E.; Krasilnikov, P. “Black soils” in the Russian Soil Classification system, the US Soil Taxonomy and the WRB: Quantitative correlation and implications for pedodiversity assessment. Catena 2021, 196, 104824. [Google Scholar] [CrossRef]
  3. Han, X.; Zou, W.; Yang, F. Main achievements, challenges, and recommendations of black soil conservation and utilization in China. Bull. Chin. Acad. Sci. 2021, 36, 1194–1202. [Google Scholar] [CrossRef]
  4. Wang, M.; Liu, X.; Liu, Z.; Wang, F.; Li, X.; Hou, G.; Zhao, S. Evaluation and driving force analysis of cultivated land quality in black soil region of Northeast China. Chin. Geogr. Sci. 2023, 33, 601–615. [Google Scholar] [CrossRef]
  5. Ren, S.; Song, C.; Ye, S.; Cheng, F. Land use evaluation considering soil properties and agricultural infrastructure in black soil region. Land Degrad. Dev. 2023, 34, 5373–5388. [Google Scholar] [CrossRef]
  6. Li, X.; Wang, D.; Ren, Y.; Wang, Z.; Zhou, Y. Soil quality assessment of croplands in the black soil zone of Jilin Province, China: Establishing a minimum data set model. Ecol. Indic. 2019, 107, 105251. [Google Scholar] [CrossRef]
  7. Li, J.; Guo, H.; Shi, C. Evaluation method of new cultivated land quality in Guanzhong Plain of Shaanxi Province: Taking Longting Town land consolidation project as an example. IOP Conf. Ser. Earth Environ. Sci. 2018, 185, 012024. [Google Scholar] [CrossRef]
  8. Qian, F.; Xiang, Z.; Wang, H.; Gu, H. Evaluating cultivated land quality in county territory using the minimum data set, land evaluation and site assessment (LESA). Trans. Chin. Soc. Agric. Eng. 2023, 39, 239–248. [Google Scholar] [CrossRef]
  9. Xu, Y.; Pei, J.; Li, S.; Zou, H.T.; Wang, J.K.; Zhang, J.B. Main characteristics and utilization countermeasures for black soils in different regions of Northeast China. Chin. J. Soil Sci. 2023, 54, 495–504. [Google Scholar] [CrossRef]
  10. Qiu, S.; Hao, X.; Zhao, S.; Xu, X.; Wang, X.; He, P.; Zhou, W. Causes of fertility decline and countermeasures for protection and utilization of upland black soil—An analysis from the perspective of nutrient resources high-efficient utilization. J. Plant Nutr. Fert. 2025, 31, 1–11. [Google Scholar] [CrossRef]
  11. Geng, J.; Tan, Q.; Lv, J.; Fang, H. Assessing spatial variations in soil organic carbon and C:N ratio in Northeast China’s black soil region: Insights from Landsat-9 satellite and crop growth information. Soil Tillage Res. 2024, 235, 105897. [Google Scholar] [CrossRef]
  12. Gu, Z.; Xie, Y.; Gao, Y.; Ren, X.; Cheng, C.; Wang, S. Quantitative assessment of soil productivity and predicted impacts of water erosion in the black soil region of Northeastern China. Sci. Total Environ. 2018, 637–638, 706–716. [Google Scholar] [CrossRef]
  13. McBratney, A.; Field, D.; Koch, A. The dimensions of soil security. Geoderma 2014, 213, 203–213. [Google Scholar] [CrossRef]
  14. Wang, L.; Tian, Y.; Yao, X.; Zhu, Y.; Cao, W. Predicting grain yield and protein content in wheat by fusing multi-sensor and multi-temporal remote-sensing images. Field Crops Res. 2014, 164, 178–188. [Google Scholar] [CrossRef]
  15. Liu, Y.; Zhang, Y.; Guo, L. Towards realistic assessment of cultivated land quality in an ecologically fragile environment: A satellite imagery-based approach. Appl. Geogr. 2010, 30, 271–281. [Google Scholar] [CrossRef]
  16. Moebius-Clune, B.; Moebius-Clune, D.; Gugino, B.; Idowu, O.J.; Schindelbeck, R.R.; Ristow, A.J.; van Es, H.M.; Thies, J.E.; Shayler, H.A.; McBride, M.B.; et al. Comprehensive Assessment of Soil Health; Cornell University: Geneva, Switzerland, 2016; pp. 1–18. [Google Scholar]
  17. Huffman, E.; Eilers, R.; Padbury, G.; Wall, G.; MacDonald, K. Canadian agri-environmental indicators related to land quality: Integrating census and biophysical data to estimate soil cover, wind erosion and soil salinity. Agric. Ecosyst. Environ. 2000, 81, 113–123. [Google Scholar] [CrossRef]
  18. Van Beek, C.; Tóth, G. Risk assessment methodologies of soil threats in europe. In JRC Scientific and Policy Reports; EUR 24097; European Commission: Brussels, Belgium, 2012; p. 24097. [Google Scholar] [CrossRef]
  19. Mueller, L.; Schindler, U.; Shepherd, T.G.; Ball, B.C.; Smolentseva, E.; Pachikin, K.; Hu, C.; Hennings, V.; Sheudshen, A.K.; Behrendt, A.; et al. The Muencheberg Soil Quality Rating (SQR); ZALF—Leibniz Centre for Agricultural Landscape Research: Müncheberg, Germany, 2007. [Google Scholar]
  20. Bünemann, E.; Bongiorno, G.; Bai, Z.; Creamer, R.; Brussaard, L. Soil quality—A critical review. Soil Biol. Biochem. 2018, 120, 105–125. [Google Scholar] [CrossRef]
  21. Wu, F.; Mo, C.; Dai, X.; Li, H. Spatial analysis of cultivated land productivity, site condition and cultivated land health at county scale. Int. J. Environ. Res. Public Health 2022, 19, 12266. [Google Scholar] [CrossRef]
  22. Su, H.; Wu, C. Diagnosis and evolution characteristics of cultivated land system health condition in the Black Soil Region of Northeast China: A case study of Keshan County. Econ. Geogr. 2023, 6, 166–175. [Google Scholar] [CrossRef]
  23. Sui, H.; Song, G. Spatial and temporal differentiation of cultivated land quality degradation in a typical black soil region of Northeast China from the perspective of genetics and variation: A case study in Fujin City. China Land Sci. 2022, 36, 53–62. [Google Scholar] [CrossRef]
  24. Tang, H.; Niu, J.; Niu, Z.; Liu, Q.; Huang, Y.; Yun, W.; Shen, C.; Huo, Z. System cognition and analytic technology of cultivated land quality from a data perspective. Land 2023, 12, 237. [Google Scholar] [CrossRef]
  25. Zhao, R.; Wu, K.; Li, X.; Gao, N.; Yu, M. Discussion on the unified survey and evaluation of cultivated land quality at county scale for China’s 3rd National Land Survey: A case study of Wen County, Henan Province. Sustainability 2021, 13, 2513. [Google Scholar] [CrossRef]
  26. Song, W.; Zhang, H.; Zhao, R.; Wu, K.; Li, X.; Niu, B.; Li, J. Study on cultivated land quality evaluation from the perspective of farmland ecosystems. Ecol. Indic. 2022, 139, 108959. [Google Scholar] [CrossRef]
  27. Zhou, W.; Liu, Q.; Huang, Y. Deepening the cognition of black soil cultivated land quality and strengthening the evaluation and monitoring of cultivated land quality. Agric. Compr. Dev. China 2022, 11, 15–18. [Google Scholar]
  28. TD/T 1005-2003; Regulations for Classification on Agricultural Land. Standards Press of China: Beijing, China, 2003. Available online: https://www.nssi.org.cn/nssi/front/12452770 (accessed on 25 November 2023).
  29. TD/T 1055-2019; Technical Regulation of the Third Nationwide Land Survey. Standards Press of China: Beijing, China, 2019. Available online: https://www.nssi.org.cn/nssi/front/108831133 (accessed on 28 November 2023).
  30. Rutgers, M.; Mulder, C.; Schouten, A. Soil Ecosystem Profiling in the Netherlands with Ten References for Soil Biological Quality; RIVM Report 607604009/2008; RIVM: Bilthoven, The Netherlands, 2008. [Google Scholar]
  31. Blagodatskaya, E.; Kuzyakov, Y. Active microorganisms in soil: Critical review of estimation criteria and approaches. Soil Biol. Biochem. 2013, 67, 192–211. [Google Scholar] [CrossRef]
  32. Yao, D.; Pei, J.; Wang, J. Temporal-spatial changes in cultivated land quality in a black soil region of Northeast China. Chin. J. Eco-Agric. 2020, 28, 104–114. [Google Scholar] [CrossRef]
  33. Han, X.; Zou, W. Effects and suggestions of black soil protection and soil fertility increase in Northeast China. Bull. Chin. Acad. Sci. 2018, 33, 206–212. [Google Scholar] [CrossRef]
  34. Meng, X.; Wang, H. Soil Map Based Harmonized World Soil Database (v1.2). In A Big Earth Data Platform for Three Poles; National Tibetan Plateau/Third Pole Environment Data Center: Beijing, China, 2018. [Google Scholar]
  35. Di Gregorio, A.; Jansen, L. Land Cover Classification System (LCCS): Classification Concepts and User Manual; FAO: Rome, Italy, 1998. [Google Scholar]
  36. Zhang, F.; An, P.; Wang, J.; Zhang, J.; Liu, L.; Chen, H. Soil quality criteria and methodologies of farmland grading. Resour. Sci. 2002, 24, 71–75. [Google Scholar] [CrossRef]
  37. Yun, W. Problems and countermeasures in the development and utilization of cultivated land resource in China. Bull. Chin. Acad. Sci. 2015, 30, 484–491. [Google Scholar] [CrossRef]
  38. Legaz, B.V.; De Souza, D.M.; Teixeira, R.; Antón, A.; Putman, B.; Sala, S. Soil quality, properties, and functions in life cycle assessment: An evaluation of models. J. Clean. Prod. 2017, 140, 502–515. [Google Scholar] [CrossRef]
  39. Kong, X.; Zhang, B.; Wen, L.; Hu, Y.; Lei, M.; Yao, J.; Xin, Y. Theoretical framework and research trends of cultivated land quality based on elements-process-function. China Land Sci. 2018, 32, 14–20. [Google Scholar]
  40. Deng, X.; Xu, X.; Wang, S. The tempo-spatial changes of soil fertility in farmland of China from the 1980s to the 2010s. Ecol. Indic. 2023, 146, 109913. [Google Scholar] [CrossRef]
  41. Li, C.; Wu, J. Land use transformation and eco-environmental effects based on production-living-ecological spatial synergy: Evidence from Shaanxi Province, China. Environ. Sci. Pollut. Res. 2022, 29, 41492–41504. [Google Scholar] [CrossRef]
  42. Kou, X.; Tao, Y.; Wang, S.; Wu, Z.; Wu, H.; He, H. How soil meso-/macro-faunas orchestrate ecosystem multifunctionality under different artificial disturbance conditions in the Changbai Mountain region, China. Land Degrad. Dev. 2022, 33, 3438–3445. [Google Scholar] [CrossRef]
  43. Wang, H.; Yang, S.; Wang, Y.; Gu, Z.; Xiong, S.; Huang, X.; Sun, M.; Zhang, S.; Guo, L.; Cui, J.; et al. Rates and causes of black soil erosion in Northeast China. Catena 2022, 214, 106250. [Google Scholar] [CrossRef]
  44. Nawaz, M.; Bourrie, G.; Trolard, F. Soil compaction impact and modelling: A review. Agron. Sustain. Dev. 2013, 33, 291–309. [Google Scholar] [CrossRef]
  45. Raza, S.; Miao, N.; Wang, P.; Ju, X.; Chen, Z.; Zhou, J.; Kuzyakov, Y. Dramatic loss of inorganic carbon by nitrogen-induced soil acidification in Chinese croplands. Glob. Change Biol. 2020, 26, 3738–3751. [Google Scholar] [CrossRef]
  46. Xie, Y.; Lin, H.; Ye, Y.; Ren, X. Changes in soil erosion in cropland in northeastern China over the past 300 years. Catena 2019, 176, 410–418. [Google Scholar] [CrossRef]
  47. Wu, H.; Wang, S.; Huai, S.; Yan, Z.; Ma, C.; Xue, Y.; Xu, M.; Lu, C. Evolutionary characteristics of fertility and productivity of typical black soil in recent 30 years. J. Plant Nutr. Fert. 2018, 24, 1456–1464. [Google Scholar] [CrossRef]
  48. Liu, X.; Qiao, G.; Guo, F.; Liu, D.; Li, Y.; Gou, Y.; Yu, R.; Zhou, W.; Huang, Y. Evaluation and obstacle analysis of cultivated horizon soil quality based on MDS in the dry farming areas of Huang-Huai-Hai Region. Trans. Chin. Soc. Agric. Eng. 2023, 39, 104–113. [Google Scholar] [CrossRef]
  49. Wu, C.; Liu, G.; Ma, G.; Liu, Q.; Yu, F.; Huang, C.; Zhao, Z.; Liang, L. Study of the differences in soil properties between the dry season and rainy season in the Mun River Basin. Catena 2019, 182, 104103. [Google Scholar] [CrossRef]
  50. Joss, B.N.; Hall, R.J.; Sidders, D.M.; Keddy, T. Fuzzy-logic modeling of land suitability for hybrid poplar across the Prairie Provinces of Canada. Environ. Monit. Assess. 2008, 141, 79–96. [Google Scholar] [CrossRef] [PubMed]
  51. Baja, S.; Chapman, D.; Dragovich, D. A conceptual model for defining and assessing land management units using a fuzzy modeling approach in GIS environment. Environ. Manag. 2002, 29, 647–661. [Google Scholar] [CrossRef]
  52. Ozdemir, M.S. Validity and inconsistency in the analytic hierarchy process. Appl. Math. Comput. 2005, 161, 707–720. [Google Scholar] [CrossRef]
  53. Yu, G.; Feng, J.; Che, Y.; Lin, X.; Hu, L.; Yang, S. The identification and assessment of ecological risks for land consolidation based on the anticipation of ecosystem stabilization: A case study in Hubei Province, China. Land Use Policy 2010, 27, 293–303. [Google Scholar] [CrossRef]
  54. Doran, J.W.; Coleman, D.C.; Bezdicek, D.F.; Stewart, B.A.; Haynes, R.J. Defining soil quality for a sustainable environment. In Soil Science Society of America Special Publication 35; Soil Science Society of America: Madison, WI, USA, 1994. [Google Scholar] [CrossRef]
  55. Schulte, R.P.; Creamer, R.E.; Donnellan, T.; Farrelly, N.; Fealy, R.; O’donoghue, C.; O’huallachain, D. Functional land management: A framework for managing soil-based ecosystem services for the sustainable intensification of agriculture. Environ. Sci. Policy 2014, 38, 45–58. [Google Scholar] [CrossRef]
  56. Barrios, E. Soil biota, ecosystem services and land productivity. Ecol. Econ. 2007, 64, 269–285. [Google Scholar] [CrossRef]
  57. Ministry of Agriculture and Rural Affairs. Bulletin of the Ministry of Agriculture and Rural Affairs of the People’s Republic of China on Farmland Quality Grades in 2019. (Bulletin of Ministry of Agriculture and Rural Affairs [2020] (No.1) [EB/0L]. Available online: https://www.gov.cn/xinwen/2020-05/13/content_5511129.htm. (accessed on 12 October 2023).
  58. Qian, F.; Chi, Y.; Xu, H. Study on evolution of trade-off and synergy relationship of multifunctional cultivated land from 2006 to 2020: A case study of Shenyang City. China Land Sci. 2022, 36, 31–41. [Google Scholar]
  59. Zhang, Y.; Dai, Y.; Chen, Y.; Ke, X. Spatial-temporal evolution and driving factors of cultivated land multifunctional coupling coordination development in China. Trans. Chin. Soc. Agric. Eng. 2023, 39, 244–255. [Google Scholar] [CrossRef]
  60. Han, X.; Zou, W.; Yan, J.; Li, N.; Li, Y.; Wang, J.; Li, L. Ecology in agriculture and long-term research guide protection of black soil and agricultural sustainable development in Northeast China. Bull. Chin. Acad. Sci. 2019, 34, 362–370. [Google Scholar] [CrossRef]
  61. Suxia, L.; Li, Z.; Wang, B. Trade-off and synergy relationships and regional regulation of multifunctional cultivated land in Henan Province. Trans. Chin. Soc. Agric. Mach. 2024, 55, 363–374. [Google Scholar]
  62. Liu, Y.; Wan, C.; Xu, G.; Chen, L.; Yang, C. Exploring the relationship and influencing factors of cultivated land multifunction in China from the perspective of trade-off/synergy. Ecol. Indic. 2023, 149, 110171. [Google Scholar] [CrossRef]
  63. Xin, J.; Wang, J.; Xue, Y. Evaluation of Cultivated Land Quality in the Black Soil Region of Northeast China; China Agriculture Press: Beijing, China, 2017. [Google Scholar]
  64. Xu, X.Z.; Xu, Y.; Chen, S.C.; Xu, S.G.; Zhang, H.W. Soil loss and conservation in the black soil region of Northeast China: A retrospective study. Environ. Sci. Policy 2010, 13, 793–800. [Google Scholar] [CrossRef]
  65. Ao, M.; Zhang, X.; Guan, Y. Research and practice of conservation tillage in black soil region of Northeast China. Bull. Chin. Acad. Sci. 2021, 36, 1203–1215. [Google Scholar] [CrossRef]
Figure 1. Location of the study area and the digital elevation model. All figures were produced on the basis of the Ministry of Natural Resources Standard Map Service System GS (2022) 1873 (http://bzdt.ch.mnr.gov.cn/, 3 July 2024), with no modifications to the base map boundaries.
Applsci 15 03753 g001
Figure 2. Research framework for cultivated land quality evaluation.
Applsci 15 03753 g002
Figure 3. Spatial distribution and area proportion of cultivated land function in the BSNC. (a) For primary productivity function; (b) for soil nutrients and maintenance function; (c) for infrastructure regulation function; (d) for biodiversity supply function; (e) for resource utilization efficiency function; and (f) for cultivated land function.
Applsci 15 03753 g003
Figure 4. Cultivated land function index in different regions. Different colors represent different types of regions. The outermost part represents the six cultivated land functions, and the inner number represents the cultivated land function index.
Applsci 15 03753 g004
Figure 5. Spatial distribution and risk grade area proportion of cultivated land degradation risk in the BSNC. The location map represents the risk level faced by different regions, and the pie chart represents the proportion of areas with different risk levels. (a) represents the Songnen Plain, (b) represents the Sanjiang Plain, (c) represents the Changbai Mountain and Eastern Liaoning, (d) represents the Liaohe Plain, (e) represents Western Sandy, and (f) represents Daxing’an and Xiaoxing’anling.
Applsci 15 03753 g005
Figure 6. Spatial distribution of comprehensive cultivated land quality assessment results in the black soil of Northeast China (BSNC) region. The right-hand side of the figure presents the proportional area of each evaluation grade across different regional types, providing a clear comparison of cultivated land quality levels in various areas.
Applsci 15 03753 g006
Figure 7. The spatial distribution of cultivated land functional levels and cultivated land risk levels, with different colors representing the distribution of cultivated land functional levels and cultivated land risk levels in the same area.
Applsci 15 03753 g007
Figure 8. Spearman rank correlation coefficient among cultivated land functions. A correlation coefficient greater than 0 indicates a positive correlation, one less than 0 indicates a negative correlation, and one equal to 0 indicates no correlation. a represents the Songnen Plain, b represents the Sanjiang Plain, c represents Changbai Mountain and Eastern Liaoning, d represents the Liaohe Plain, e represents Western Sandy, and f represents Daxing’an and Xiaoxing’anling. The asterisks indicate significance levels: * p < 0.05 indicates a difference, ** p < 0.01 indicates a significant correlation, and *** p < 0.001 indicates a highly significant correlation. Red diagonal lines denote self-correlations, which are not displayed as they are always equal to 1.
Applsci 15 03753 g008
Table 1. Evaluation index system and data source for cultivated land quality in the BSNC.
Criterion LayerIndicator LayerUnitSourceScale/Sample Size
Production functionPrimary productivityAccumulated temperature°Chttps://data.cma.cn/ (accessed on 12 October 2023)500 m × 500 m
Average annual precipitationmmhttps://www.resdc.cn/DOI/ (accessed on 10 October 2023)1 km × 1 km
Altitudemhttps://www.gscloud.cn/ (accessed on 10 October 2023)30 m × 30 m
Soil nutrients and maintenanceSoil texture-Third National Land Survey Point Data1878 points
Soil organic matterg/kgThird National Land Survey Point Data1878 points
Infrastructure regulationEffective soil depthcmBasic Soil Property Dataset of High-Resolution China Soil Information Grids (2010–2018)1 km × 1 km
Irrigation capacity%Third National Land Survey Point Data1878 points
Drainage capacity m/
acre
Survey and Evaluation Sample Data on Cultivated Land Quality in Various Counties and Districts in Northeast China (2021)10,583 points
Field shelterbelt ratio%https://www.zgtjnj.org/navibooklist-n3023062107-1.html (accessed on 12 October 2023) city
Ecological functionBiodiversity supplySoil biodiversity level-Third National Land Survey Point Data1878 points
Social functionResource utilization efficiencyPer-acre production cost-Ministry of Agriculture’s Report on the http://www.njhs.moa.gov.cn/nyjxhqk/202209/t20220919_6409640.htm (accessed on 12 October 2023)province
Degradation riskNutrient declineOrganic matter content changeg/kgThird National Land Survey Point Data1878 points
Soil erosionBlack soil layer thicknesscmhttps://www.isric.org/explore/soilgrids/ 15 October 2023 (accessed on 12 October 2023)-
Restrictive soil layersPosition of the albic layercmInformation obtained through searching-
Thickness of the albic layercmInformation obtained through searching-
Soil salinizationSodium alkalinity%Soil Map-Based Harmonized World Soil Database (v1.2)1 km × 1 km
Soil acidificationSoil pH-Basic Soil Property Dataset of High-Resolution China Soil Information Grids (2010–2018) 1 km × 1 km
Soil compactionSoil bulk densityg/cm3Basic Soil Property Dataset of High-Resolution China Soil Information Grids (2010–2018) 1 km × 1 km
Table 2. Weights of cultivated land function indicators.
Cultivated Land FunctionIndicatorWeight
Primary productivityAccumulated temperature0.1098
Average annual precipitation0.1258
Altitude0.0867
Soil nutrients and maintenanceSoil texture0.1621
Soil organic matter0.0706
Infrastructure RegulationEffective soil depth0.1086
Irrigation capacity0.0489
Drainage capacity0.0768
Field shelterbelt ratio0.0789
Biodiversity supplySoil biodiversity level0.0630
Resource utilization efficiencyPer-acre production cost0.0688
Table 3. The area proportion of each grade of the six major cultivated land functions.
Grade 5 (m2)Grade 4 (m2)Grade 3 (m2)Grade 2 (m2)Grade 1 (m2)
Primary productivity2879675131,200231,4017838
Soil nutrients and maintenance0037,259339,0223104
Infrastructure regulation0954181,925184,37712,321
Biodiversity supply41,649153,28099,45173,69313,488
Resource utilization efficiency32,86815,58651,882123,630157,301
Table 4. Proportion of degradation risk areas in the six types of areas.
Very High (m2)High (m2)Moderate (m2)Low (m2)Very Low (m2)
Songnen Plain19446714,84435,98264,812
Sanjiang Plain0705716,21830,8273321
Changbai Mountain and Eastern Liaoning0120914,51536,39818,058
Liaohe Plain2128318,54815,5076506
Western Sandy23575230,30231,875
Daxing’an and Xiaoxing’anling05610674120,767
Disclaimer/Publisher’s Note: The statements, opinions and data contained in all publications are solely those of the individual author(s) and contributor(s) and not of MDPI and/or the editor(s). MDPI and/or the editor(s) disclaim responsibility for any injury to people or property resulting from any ideas, methods, instructions or products referred to in the content.

