Article

Virtual Sound Source Construction Based on Direct-to-Reverberant Ratio Control Using Multiple Pairs of Parametric-Array Loudspeakers and Conventional Loudspeakers

1
Faculty of Design Technology, Osaka Sangyo University, Osaka 574-8530, Japan
2
College of Information Science and Engineering, Ritsumeikan University, Osaka 567-8570, Japan
*
Author to whom correspondence should be addressed.
Appl. Sci. 2025, 15(7), 3744; https://doi.org/10.3390/app15073744
Submission received: 23 February 2025 / Revised: 18 March 2025 / Accepted: 26 March 2025 / Published: 28 March 2025
(This article belongs to the Special Issue Spatial Audio and Sound Design)

Abstract

:
We propose a new method for constructing a virtual sound source (VSS) based on the direct-to-reverberant ratio (DRR) of room impulse responses (RIRs), using multiple pairs of parametric-array loudspeakers (PALs) and conventional loudspeakers (hereafter referred to simply as loudspeakers). In this paper, we focus on the differences in the DRRs of the RIRs generated by PALs and loudspeakers. The DRR of an RIR is recognized as a key cue for distance perception. A PAL can achieve super-directivity using an array of ultrasonic transducers. Its RIR exhibits a high DRR, characterized by a large-amplitude direct wave and low-amplitude reverberations. Consequently, a PAL makes the VSS appear to be closer to the listener. In contrast, a loudspeaker causes the VSS to be perceived as farther away because the sound it emits has a low DRR. The proposed method leverages the differences in the DRRs of the RIRs between PALs and loudspeakers. It controls the perceived distance of the VSS by reproducing the desired DRR at the listener’s position through a weighted combination of the RIRs emitted from PALs and loudspeakers into the air. Additionally, the proposed method adjusts the direction of the VSS using vector-based amplitude panning (VBAP). Finally, we have confirmed the effectiveness of the proposed method through evaluation experiments.

1. Introduction

Three-dimensional sound field reproduction [1,2,3] has been extensively investigated. Many methods and systems for reproduction have been proposed. In recent years, applications of this reproduction have attracted significant attention for achieving a high sense of presence in theaters, virtual live stages, and telecommunications.
One of the simplest systems is a binaural system [4,5,6,7] that reproduces a three-dimensional (3D) sound field through headphones. This system synthesizes the sound field by convolving a dry source signal with head-related transfer functions (HRTFs) [8,9,10], which are measured in advance. Since an HRTF is an acoustical transfer function between a sound source and an ear, it is necessary to measure the functions for all of the source positions to be reproduced. This requirement is generally costly because the HRTFs are specific to each individual. Although the HRTF of a dummy head can be used to reduce costs, accuracy and reproducibility are compromised.
One large-scale system is a transaural system [11,12,13,14] which consists of numerous remote loudspeakers. This system reproduces a three-dimensional sound field by controlling a multi-channel inverse filter between remote loudspeakers and both ears. Wave field synthesis (WFS) [15,16,17,18] is another type of large-scale system that consists of a loudspeaker array with numerous independently drivable loudspeakers. WFS can control the position of a virtual sound source (VSS) by synthesizing the wavefront.
As reasonable-scale systems, various surround systems have been proposed. These include stereo systems, 5.1-channel surround systems [19], and 22.2-channel surround systems [20], also referred to as channel-based systems. Channel-based systems can represent sound sources at the positions of the loudspeakers and therefore require numerous loudspeakers. On the other hand, object-based systems [21,22], such as Dolby Atmos, have also been proposed. These systems use multiple audio objects, positioning them as virtual sound sources (VSSs) based on vector-based amplitude panning (VBAP) [23]. In addition, high-order ambisonics (HOA) [24] has been proposed as a full-sphere surround sound technique. These surround sound systems can represent the localization of VSSs in terms of their direction. However, localization in terms of distance is also important to accurately representing a VSS. A conventional approach to distance localization is VBAP, which controls the sound pressure level [25]. However, the performance of this method is insufficient because the distance perception cues include not only sound pressure levels but also the Doppler effect [26] and the direct-to-reverberant ratio (DRR) [27,28,29,30,31].
Therefore, we previously proposed a 3D sound field construction method using parametric-array loudspeakers (PALs) [32,33,34,35]. A PAL [36,37,38,39,40,41] achieves sharper directivity by utilizing ultrasonic waves and can form a narrow audible field called an “audio spot”. A PAL has a significantly sharper directivity than that of a conventional loudspeaker (hereafter referred to simply as a loudspeaker). By using a PAL, we can easily construct a virtual sound source (VSS) in the air. We employ multiple PALs to form a focal point where the emitted sounds from each PAL converge. By doing so, we can reproduce the radiation characteristics of the acoustic waves emitted from a sound source and construct a VSS at the focal point. With this method, the listener perceives the position of the sound source at the focal point by listening to the sounds emitted from the PALs and the reverberation in the room. In addition, we have proposed a virtual sound source construction method based on wave field synthesis using a PAL array and a conventional loudspeaker array [42]. This method utilizes the PAL array and the loudspeaker array to improve the sound quality and focal point control, but it is insufficient for direct-to-reverberant ratio (DRR) control. Although this method allows for the construction of a VSS at any point in the air, the previously proposed approach requires a very large number of PALs.
Thus, we are currently proposing a VSS construction method based on DRR control of the room impulse responses (RIRs) using multiple pairs of PALs and loudspeakers, which are of a comparable scale to a surround system [43,44]. This method leverages the difference in the DRRs between the PAL and the loudspeaker. In this approach, gain weighting is applied to the input signals of the PAL and the loudspeaker to achieve the desired DRR corresponding to the VSS distance, while additional gain weighting is used to control the direction of the VSS using vector-based amplitude panning (VBAP). Furthermore, we have introduced distance attenuation into this method [45]. In previous studies, the DRRs obtained using this method tended to be lower than those of real sound sources. In this paper, we propose a VSS construction method based on a new DRR control technique using multiple pairs of PALs and loudspeakers. In the proposed method, we employ a weighting function based on the energy ratio for the PALs and a linear ratio for the loudspeakers in VBAP for distance and a weighting function based on the linear ratio in VBAP for the direction. For near distances around the listener’s head, DRR correction is introduced, as the DRRs deviate from those of real sound sources when the proposed method is used without DRR correction. The proposed method can easily construct a moving VSS and multiple VSSs based on simple gain control in all directions on the horizontal plane.
In the proposed method, the direct-to-reverberant ratio is controlled by adjusting the direct sound produced by parametric loudspeakers relative to the reflected sound and the reverberation generated by conventional loudspeakers installed in the actual environment. Therefore, the reflections from the room’s walls in the proposed method create a result that closely resembles the conditions in which a real sound source is placed in this location. In other words, the listener perceives the natural reflections and reverberation (the room transfer function) of the room, and the proposed method causes little discomfort.
The reflections and reverberation of the actual environment arrive at the listener’s ears from all directions, and as the listener’s head moves, the room transfer function changes. If the room transfer function were to be simulated and applied to the PAL, it would be necessary to recalculate the room transfer function in real time without any delay in response to the listener’s head movements. However, achieving this is extremely difficult. This mismatch in the room transfer function causes significant discomfort to the listener. On the other hand, in the proposed method, even if the listener’s head moves, only the spatial transfer function of the actual environment changes, resulting in almost no mismatch in the room transfer function. Therefore, the listener can perceive the virtual sound source within the sweet spot of the proposed method without experiencing any discomfort, even when moving.
Finally, we confirmed the effectiveness of the proposed method through evaluation experiments.

2. Analysis of Room Impulse Responses Using Parametric-Array Loudspeakers and Conventional Loudspeakers

Figure 1a,b show the RIRs of a conventional loudspeaker and a PAL under the condition that the distance between the listener and the loudspeaker is 2.0 m.
As shown in Figure 1, the RIRs of a PAL and a conventional loudspeaker have different direct-to-reverberant ratios (DRRs) under the same experimental conditions. A PAL can achieve super-directivity by utilizing rectilinear ultrasonic waves. The RIR of a PAL has a high DRR, characterized by a large-amplitude direct wave and low-amplitude reverberations. Thus, a PAL causes the VSS to be perceived as closer to the listener. On the other hand, a conventional loudspeaker causes the VSS to be perceived as farther from the listener because the sound it emits has a low DRR.

3. Conventional Construction of a VSS Based on Radiation Direction Control Using Parametric-Array Loudspeakers

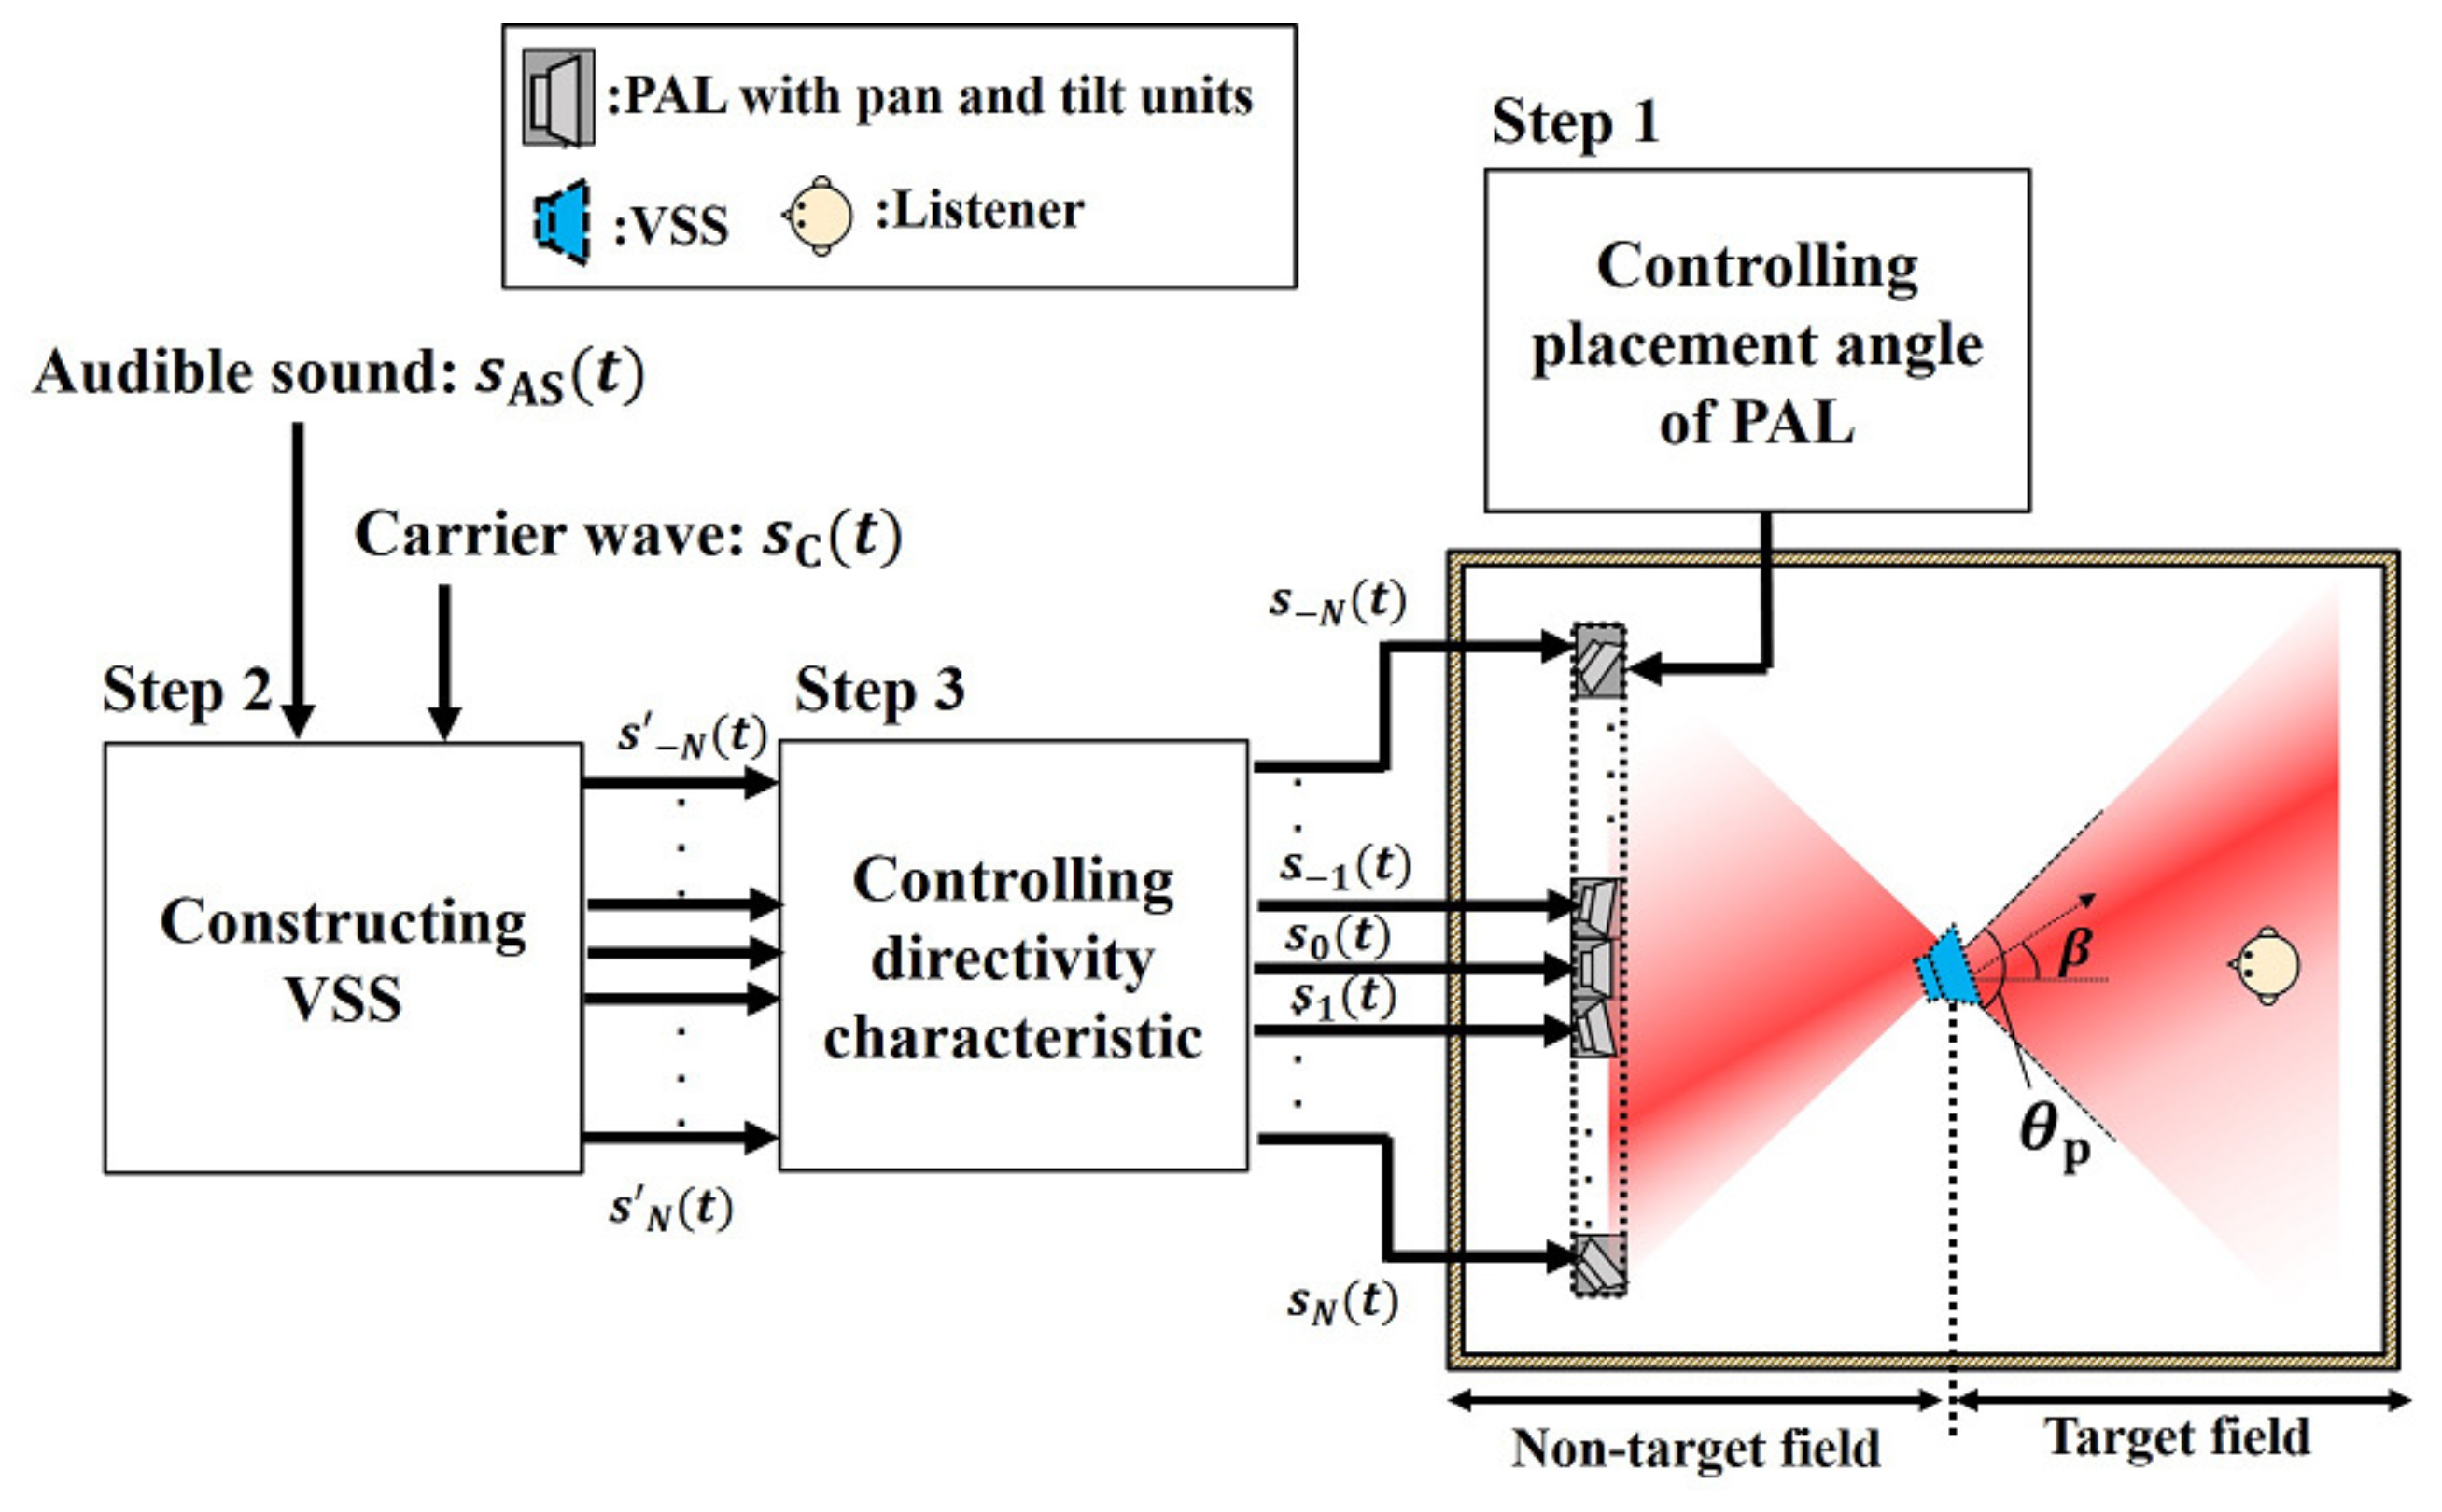
Figure 2 illustrates the conventional method. Multiple PALs are arranged in a linear formation, creating a linearly arranged PAL array.
By forming the focal point of the sound emitted from each PAL, a VSS is constructed at the focal point. In addition, pan and tilt units are mounted onto the PALs to electrically control the direction of an object. This allows for easy adjustment of the placement angle of each PAL and precise control over the position of the VSS. Furthermore, the proposed method enables control of the direction of radiation of the VSS.
As shown in Figure 2, when constructing a VSS with a radiation direction of β [deg.], we weight the output signal of each PAL to simulate the radiation characteristics of a real sound source (RSS) placed in the radiation direction β . By doing so, we can construct a VSS with the desired characteristics and radiation angle. By implementing this processing in both software and hardware, we can construct a VSS at any point in the air with the desired radiation direction.
However, a major drawback of this approach in surround sound applications is that it requires a very large number of PALs, which must be arranged to enclose a linear array of PALs.

4. Proposed Virtual Sound Source Construction Based on Direct-to-Reverberant Ratio Control Using Multiple Pairs of Parametric-Array Loudspeakers and Conventional Loudspeakers

In this paper, we propose a method for controlling the distance and direction of a virtual sound source (VSS) using multiple pairs of parametric-array loudspeakers and conventional loudspeakers. Figure 3 provides an overview of the proposed method with four pairs of PALs and loudspeakers.
In this arrangement, the proposed method can be used to construct a VSS in all directions on the horizontal plane. In the gain control process for each output in Figure 3, the gain coefficients are calculated for each output, and the input audible sound signal is weighted with these gain coefficients. In addition, the signals for the PALs consist of amplitude-modulated ultrasonic waves, where the input audible sound signal is amplitude-modulated with a carrier wave of an ultrasonic sine wave. Depending on the direction of the VSS, the driven loudspeakers are changed as follows:
  • The VSS in the front area (−45 to 45): The front L-ch PAL, the front L-ch loudspeaker, the front R-ch PAL, and the front R-ch loudspeaker in Figure 3 are driven;
  • The VSS in the right area (45 to 135): The front R-ch PAL, the front R-ch loudspeaker, the rear R-ch PAL, and the rear R-ch loudspeaker in Figure 3 are driven;
  • The VSS in the rear area (135 to −135): The rear R-ch PAL, the rear R-ch loudspeaker, the rear L-ch PAL, and the rear L-ch loudspeaker in Figure 3 are driven;
  • The VSS in the left area (−135 to −45): The front L-ch PAL, the front L-ch loudspeaker, the rear L-ch PAL, and the rear L-ch loudspeaker in Figure 3 are driven.
Here, the output signals can be calculated using the same algorithm even if the driven loudspeakers are changed.
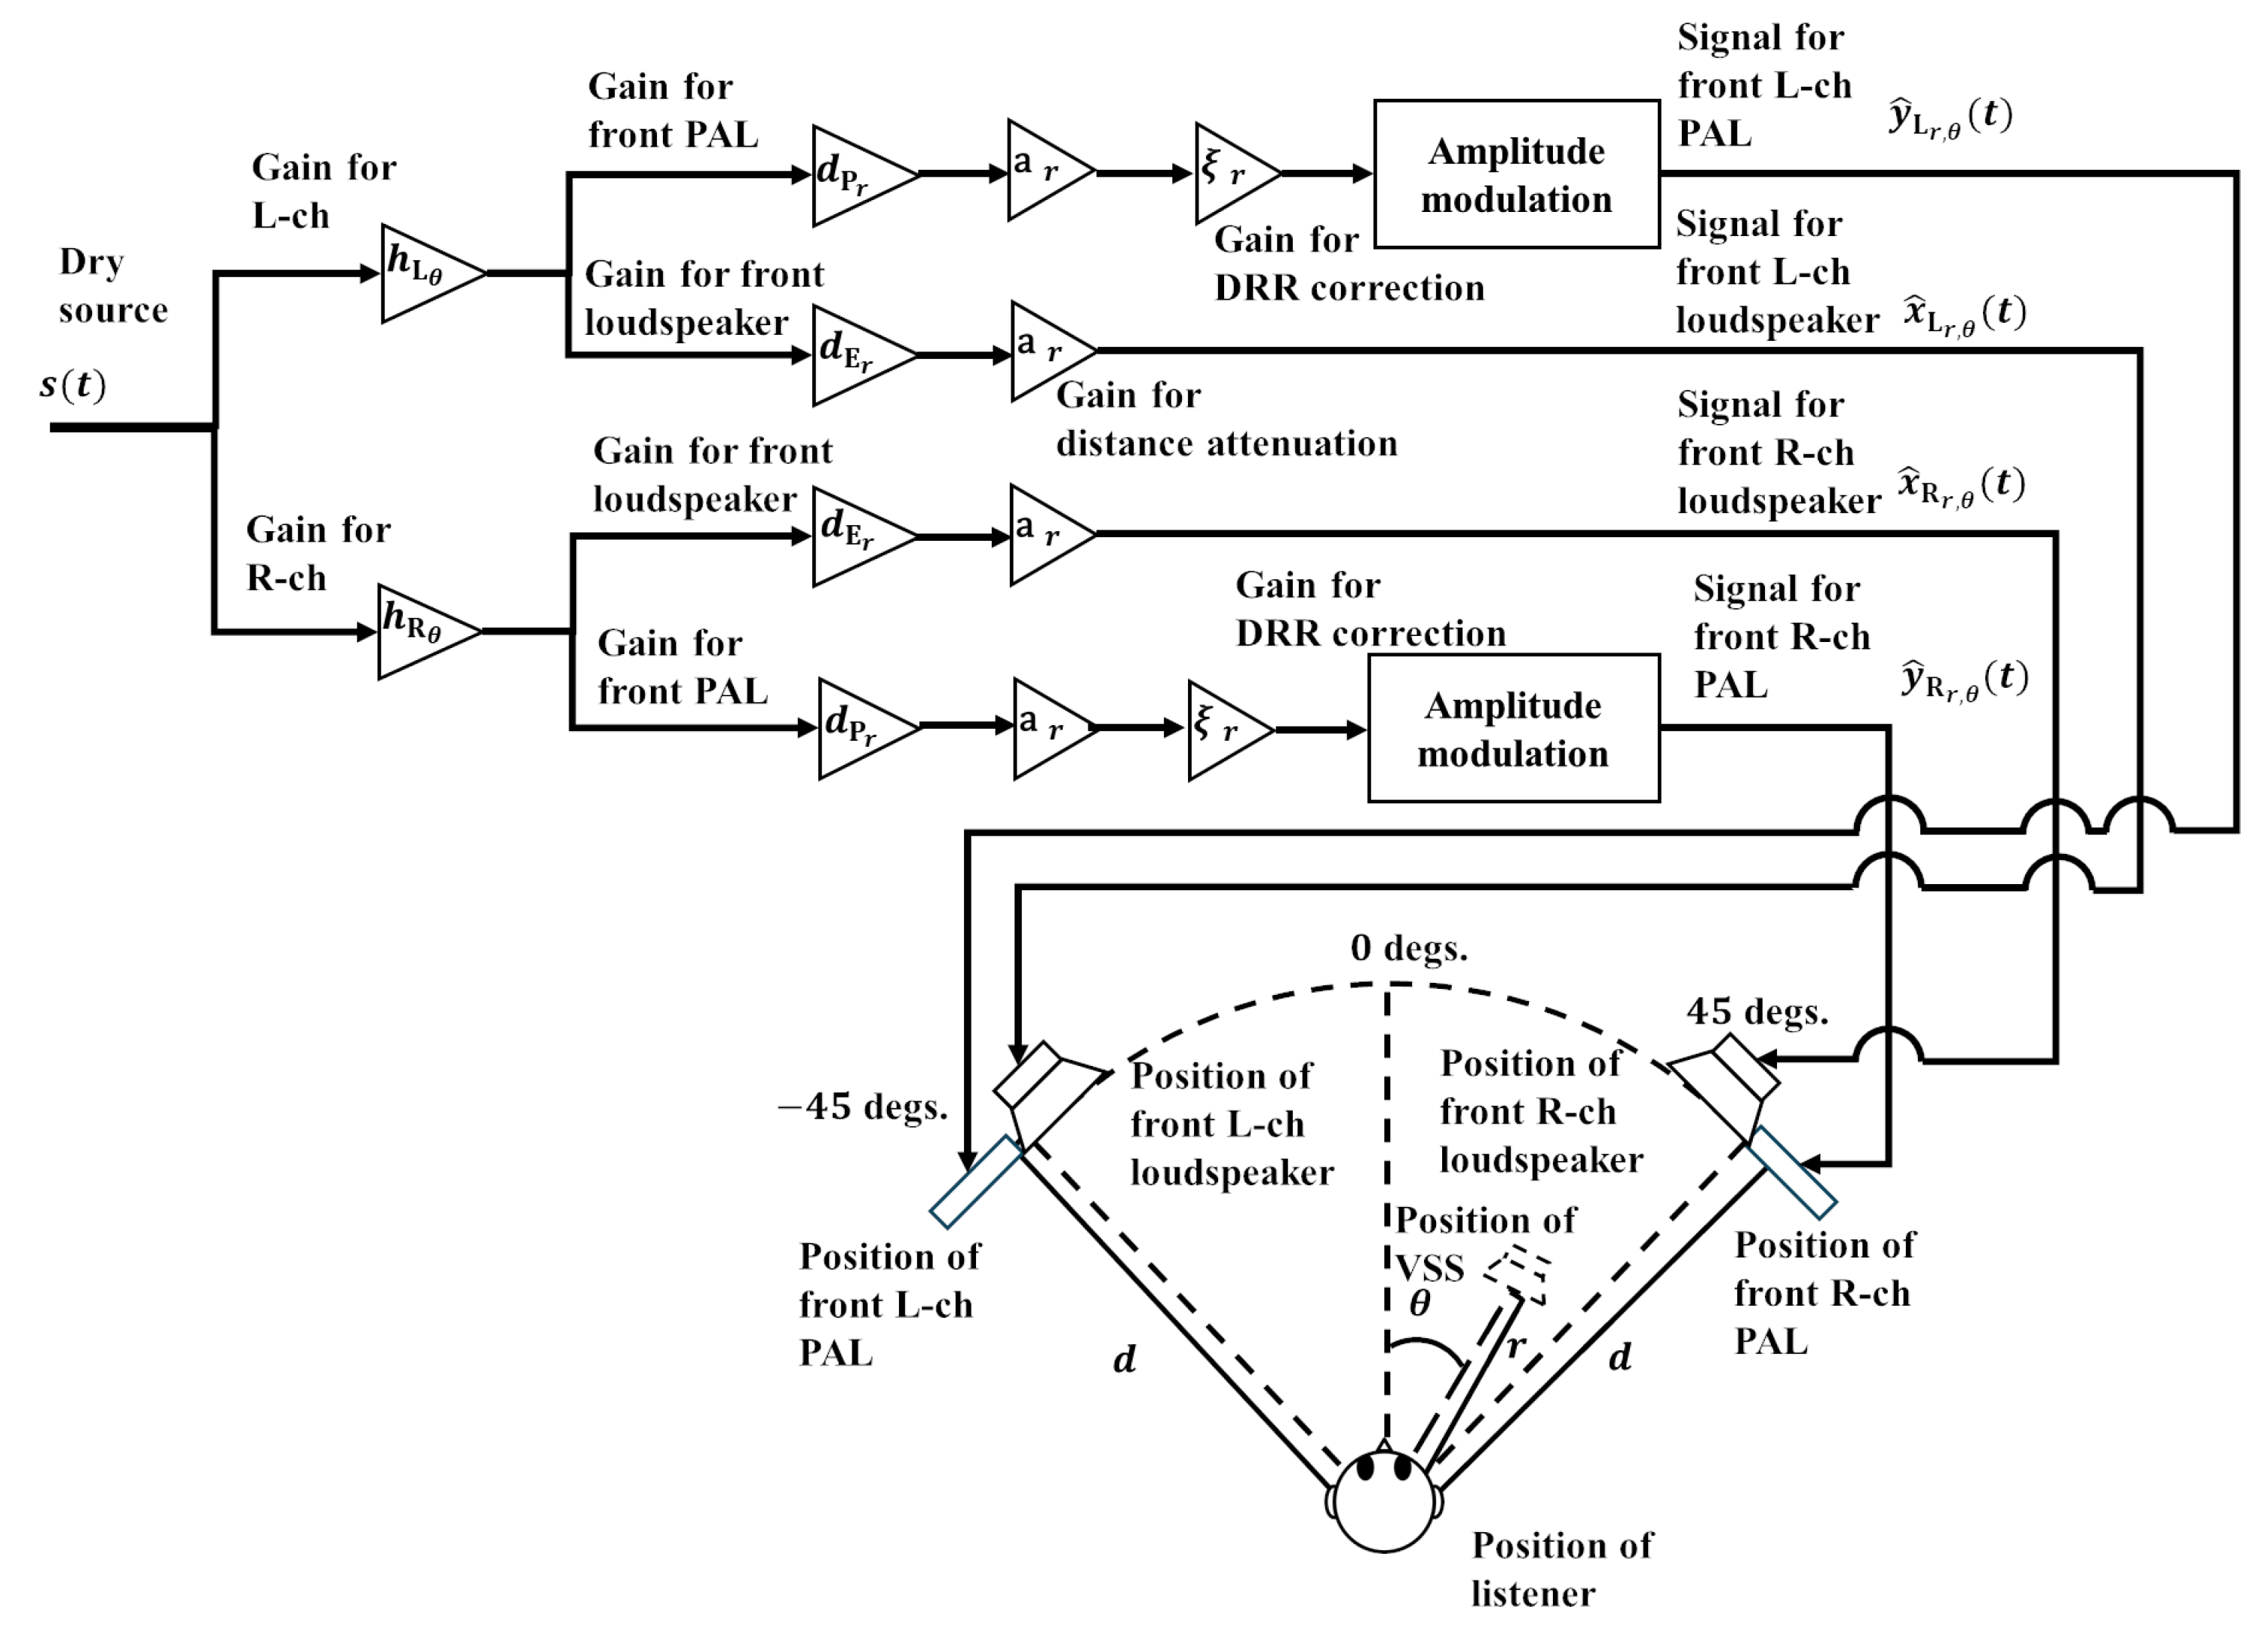
Thus, we provide an overview of the output signal design using the proposed method in the front area (−45 to 45), as shown in Figure 4.
As can be seen, the output signals are designed so that the VSS is located in the front area, with two pairs of PALs and loudspeakers used for the front area.
The weighting functions for the direction of the VSS are calculated using a linear ratio of the angle as follows:
h L θ = 45 θ 90 ,
h R θ = 45 + θ 90
where θ [deg.] ( 45 θ 45 ) is the direction of the VSS, and h L θ and h R θ are the weighting coefficients for the left- and right-side loudspeakers, respectively.
The weighting coefficients for the distance of the VSS are calculated using a linear ratio for the loudspeaker and an energy ratio for the PAL as follows:
d E r = σ r 1 · r d ,
d P r = σ r 1 · d r d ,
σ r = r d + d r d ,
where r [m] ( 0 r d ) is the distance to the VSS, σ r 1 is the amplitude normalization factor for r m, and d E r and d P r are the weighting functions for the distance r m of the loudspeakers and PALs, respectively.
The distance attenuation function is calculated as follows:
a r = e η r ,
where η is the attenuation factor. η is determined using a regression analysis based on the room impulse responses measured at 0.1 m, 0.2 m, and 0.3 m. Additionally, the proposed method must normalize the sound pressure level of the audible sound from both the loudspeakers and PALs at the listener’s head position.
The output signals for the front area are calculated as follows:
x ^ L r , θ ( t ) = d E r · h L θ · a r · s ( t ) ,
y ^ L r , θ ( t ) = d P r · h L θ · a r · ξ r · ( 1 + s ( t ) ) c ( t ) ,
x ^ R r , θ ( t ) = d E r · h R θ · a r · s ( t ) ,
y ^ R r , θ ( t ) = d P r · h R θ · a r · ξ r · ( 1 + s ( t ) ) c ( t ) ,
where ξ r is the weighting function for DRR correction at the position ( r , θ ) , c ( t ) is the ultrasonic carrier wave, s ( t ) is the normalized input signal of the audible sound, a r is the weighting function for distance attenuation at the distance r, x ^ L r , θ ( t ) is the output signal for the loudspeaker in the FL direction, x ^ R r , θ ( t ) is the output signal for the loudspeaker in the FR direction, y ^ L r , θ ( t ) is the output signal for the PAL in the FL direction, and y ^ R r , θ ( t ) is the output signal for the PAL in the FR direction.
These outputs simply achieve DRR control for distance and amplitude panning for direction. To apply this method to another area, the output channels should be selected based on back-projection to the VSS coordinates for each area.
In the right area (45 to 135) in Figure 3, the corresponding relationship between the output signals and loudspeakers is as follows:
  • The output signal for the front R-ch loudspeaker: x ^ L r , θ ( t ) ;
  • The output signal for the front R-ch PAL: y ^ L r , θ ( t ) ;
  • The output signal for the rear R-ch loudspeaker: x ^ R r , θ ( t ) ;
  • The output signal for the rear R-ch PAL: y ^ R r , θ ( t ) .
In the rear area (135 to −135) in Figure 3, the corresponding relationship between the output signals and loudspeakers is as follows:
  • The output signal for the rear R-ch loudspeaker: x ^ L r , θ ( t ) ;
  • The output signal for the rear R-ch PAL: y ^ L r , θ ( t ) ;
  • The output signal for the rear L-ch loudspeaker: x ^ R r , θ ( t ) ;
  • The output signal for the rear L-ch PAL: y ^ R r , θ ( t ) .
In the left area (−135 to −45) in Figure 3, the corresponding relationship between the output signals and loudspeakers is as follows:
  • The output signal for the rear L-ch loudspeaker: x ^ L r , θ ( t ) ;
  • The output signal for the rear L-ch PAL: y ^ L r , θ ( t ) ;
  • The output signal for the front L-ch loudspeaker: x ^ R r , θ ( t ) ;
  • The output signal for the front L-ch PAL: y ^ R r , θ ( t ) .
By switching the above outputs, a VSS can be constructed in all directions on the horizontal plane.

5. DRR Correction Based on a Regression Analysis

At near distances around the listener’s head, the DRRs tend to diverge between a real sound source and the proposed method. To address this, the proposed method applies DRR correction for near distances around the listener’s head.
First, the room impulse responses are measured at 0.1 m, 0.2 m, and 0.3 m as near distances around the listener’s head. The real DRRs are then calculated using these room impulse responses as follows:
rDRR r = n = 0 T D F s 1 g r 2 ( n ) n = T D F s T M F s 1 g r 2 ( n ) ,
where r (0.1 m, 0.2 m, and 0.3 m) is the distance between the listener’s head and the real sound source, g r ( n ) is the room impulse response at distance r, T D (=7 ms) is the signal length of the direct wave, T M is the signal length of the room impulse response, and F s is the sampling frequency. In the direct wave extraction of the conventional method [29], T D was set to approximately 4 ms. However, when the impulse response was actually measured and the direct wave was extracted, 4 ms was found to be too short for direct wave extraction. Therefore, T D was adjusted to 7 ms, which was the duration until the direct waveform became sufficiently small.
DRRs are calculated at near distances using the proposed method as follows:
pDRR r , ξ r = n = 0 T D F s 1 ( x r ( n ) + ξ r · y r ( n ) ) 2 n = T D F s T M F s 1 ( x r ( n ) + ξ r · y r ( n ) ) 2 ,
where ξ r (initially ξ r = 1.0 ) is the weighting function for DRR correction, x r ( n ) is the RIR for the loudspeaker’s output at distance r, and y r ( n ) is the RIR for the PAL’s output at distance r.
At certain distances, the weighting coefficients are calculated as follows:
ξ ^ r = arg min ξ r | rDRR r pDRR r , ξ r |
The weighting function ξ r for DRR correction is calculated using the regression line for ξ ^ as follows:
ξ r = α r + β ,
where α and β are calculated using ξ ^ r . For 0 m r 0.3 m, ξ r is calculated using Equation (14). On the other hand, for 0.3 m < r , ξ r = 1.0 .

6. The Objective Evaluation Experiment

In the experiments, we confirm the effectiveness of DRR control using the proposed method.

6.1. The Experimental Conditions with Objective Evaluation

Table 1, Table 2 and Table 3 show the experimental equipment, the experimental conditions, and the specific experimental conditions for the PAL, respectively.
In this experiment, we measured the impulse responses using the time-stretched pulse (TSP) method [46,47].
Parametric and conventional loudspeakers were calibrated by adjusting the power amplifier so that L A = 80 dB at the position of the listener’s ears. The proposed method has a sweet spot, similar to conventional surround sound techniques. The extent of the sweet spot depends on the distance between the parametric loudspeaker and the listener, as well as the radiation characteristics of the parametric loudspeaker. The parametric loudspeaker used in this experiment has a directivity angle of 25, forming a sweet spot approximately 0.9 m in diameter at a distance of 2 m. Within this sweet spot, the VSS can be constructed using the proposed method even if the listeners move.
To evaluate the performance in different environments, we conducted experiments in two settings—a living room and a live studio—with different reverberation times, as shown in Table 2. The impulse responses were measured at 0.1 m intervals, from 0 to 2 m in the living room environment and from 0 to 1.5 m in the live studio environment.
The sound source was a TSP signal (signal length: 2 19 samples; bandwidth: 0 to 8 kHz). The weighting function ξ r for DRR correction was calculated using the RIRs measured at 0.1 m, 0.2 m, and 0.3 m. The DRR of the VSS synthesized using the proposed method is considered more accurate when it is closer to the DRR calculated from the RIR measured for the loudspeaker. The DRRs were calculated using Equations (11) and (12).
We evaluated the following four conditions:
  • Real: The real sound source using a loudspeaker;
  • Conventional: The conventional method [45];
  • Proposed w/o DRR correction: The proposed method without DRR correction;
  • Proposed: The proposed method.
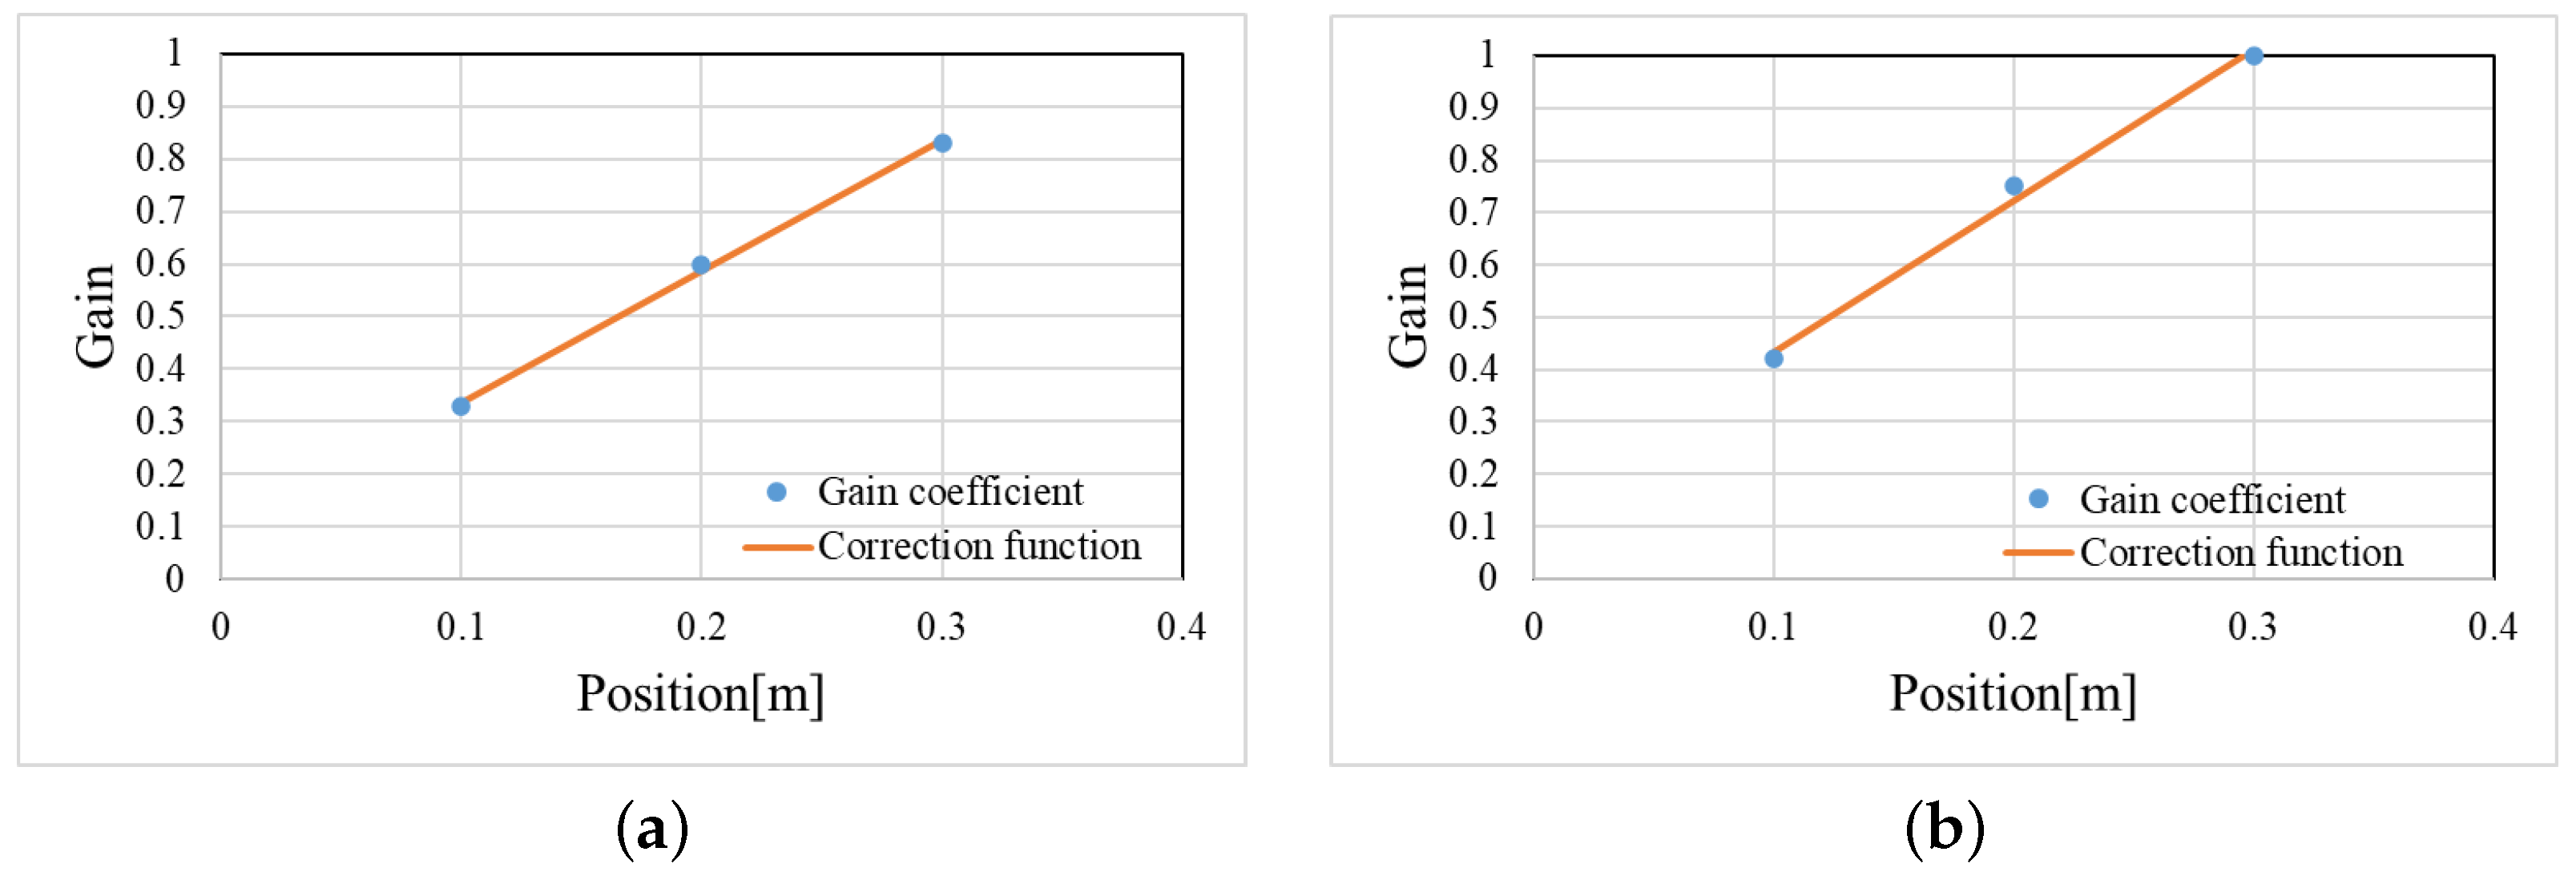
Figure 5 illustrates the weighting functions in the proposed method, and Table 4 presents the parameters for the correction function. We calculated the alpha and beta parameters using linear approximation with the least squares method [48].
As shown in Figure 5 and Table 4, we confirmed that the weighting function was appropriately designed in both environments.

6.2. The Experimental Results Obtained Through the Objective Evaluation

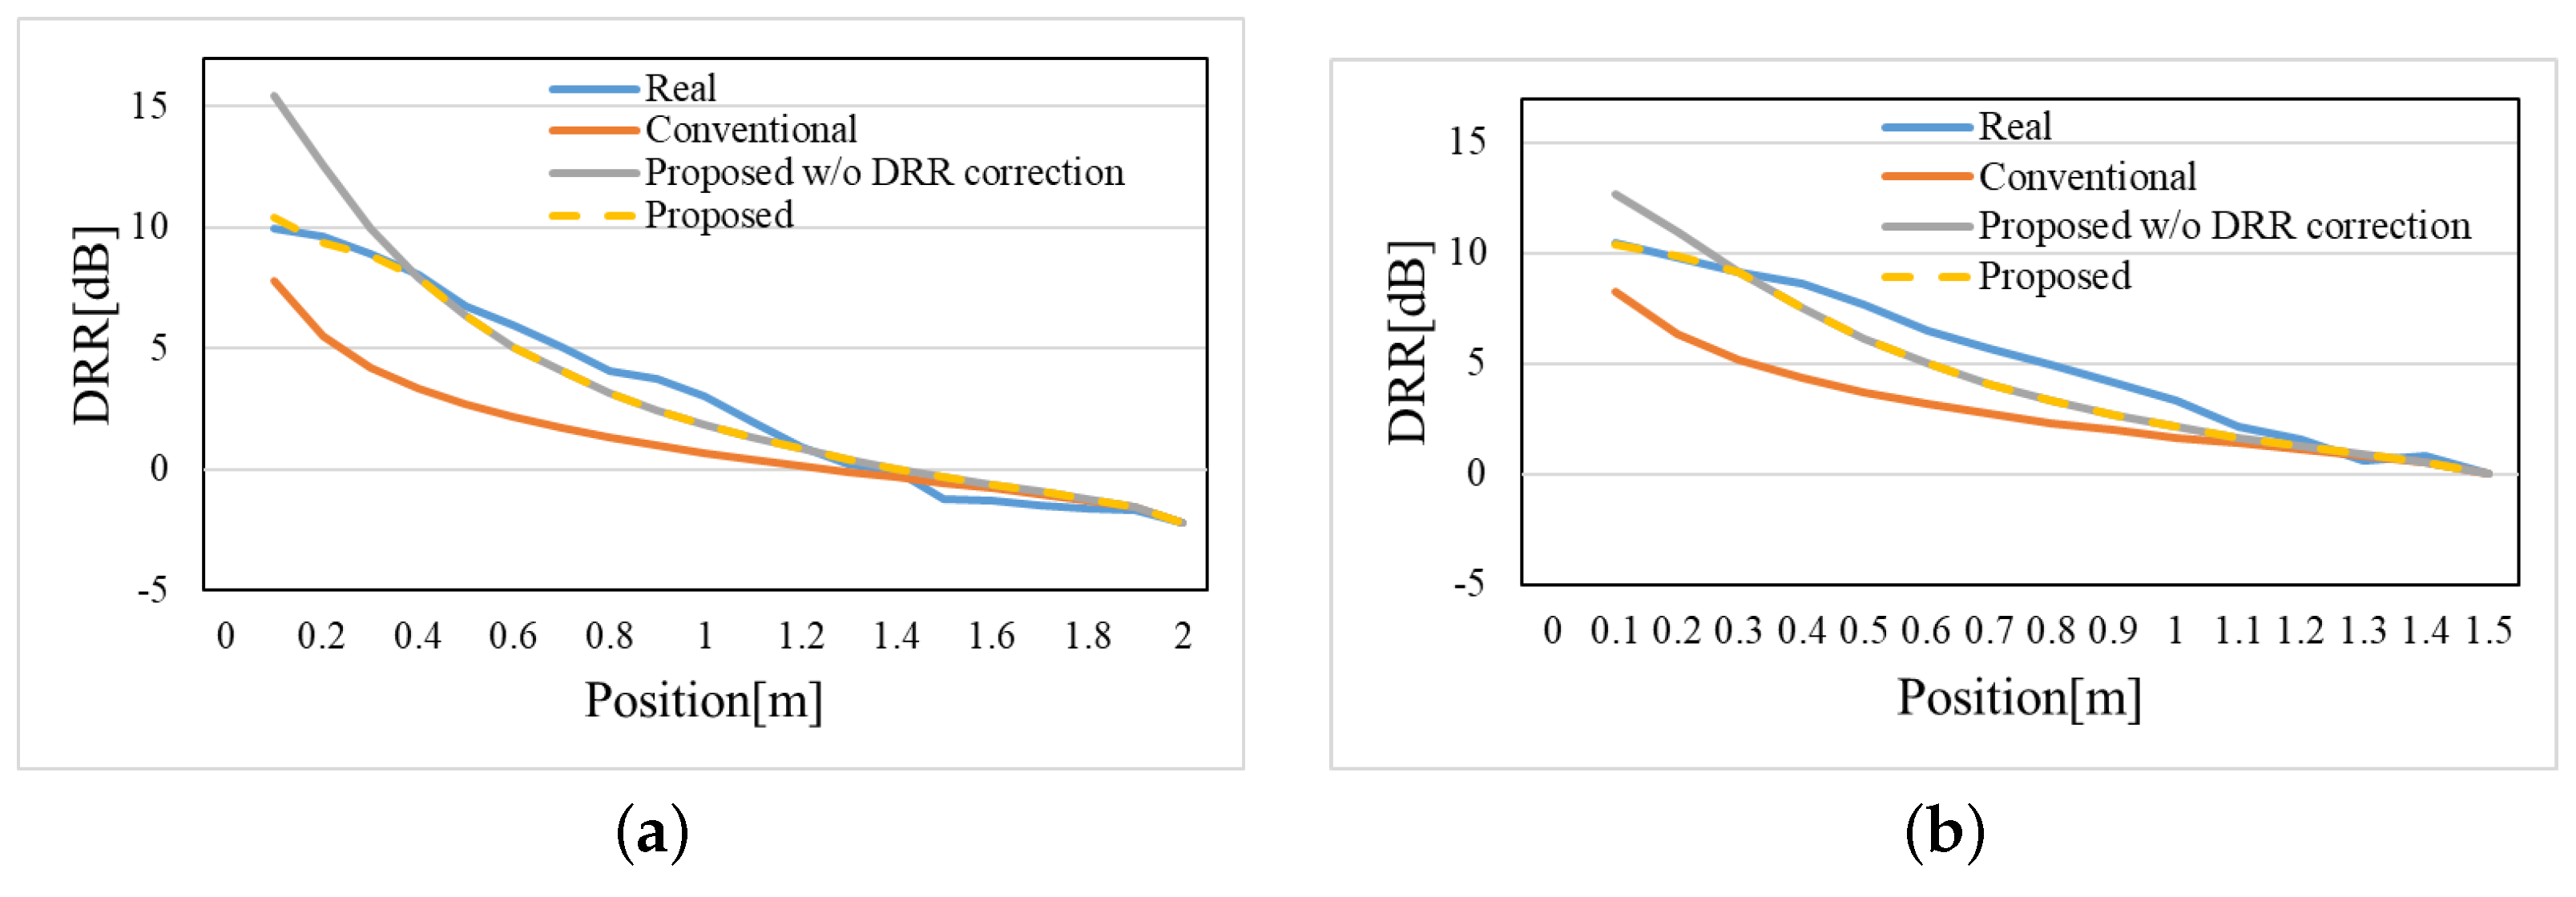
Figure 6 shows the DRRs for the real sound source, the conventional method, and the proposed method.
As shown in Figure 6, we confirmed that the proposed method improved the DRRs compared to those in the conventional method.
However, the DRRs of the proposed method without DRR correction diverged from the real DRRs at distances below 0.3 m. On the other hand, the DRRs were improved by DRR correction in the proposed method at close range.
The DRRs of the proposed method closely approximate the real DRRs, with DRR errors of approximately 1 dB in the living room environment and 3 dB in the live studio environment.

7. The Subjective Evaluation Experiment

To confirm the effectiveness of the proposed method, we evaluated the localization performance for distance and direction using the conventional method, the proposed method, and the real sound source with the loudspeaker.

7.1. Experimental Conditions for the Subjective Evaluation

In the subjective evaluation, the experimental equipment and conditions were the same as those shown in Table 1, Table 2 and Table 3.
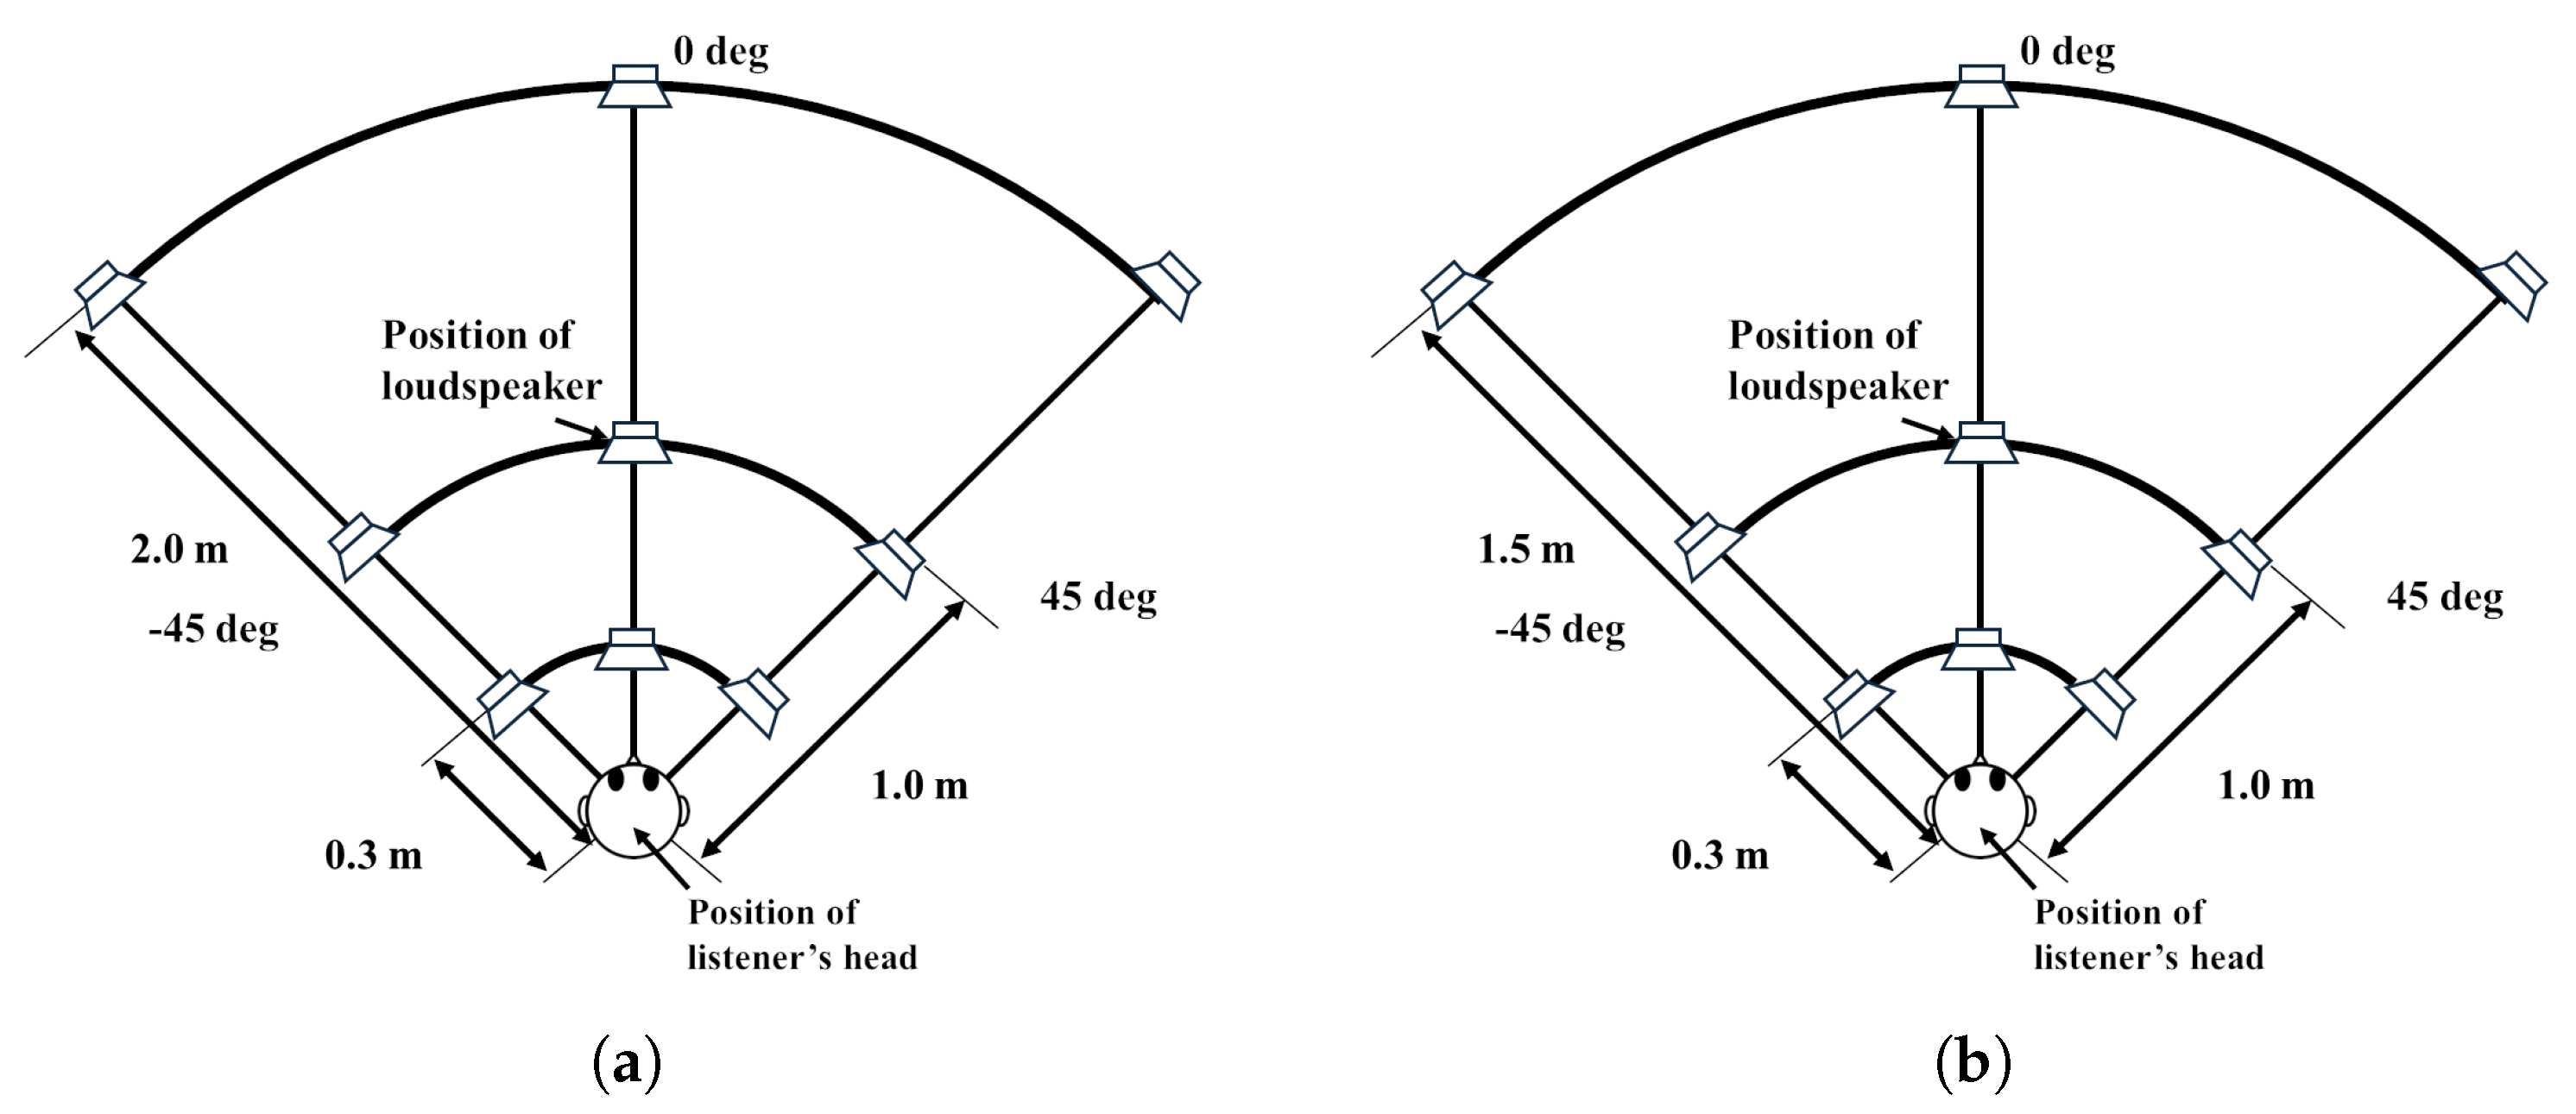
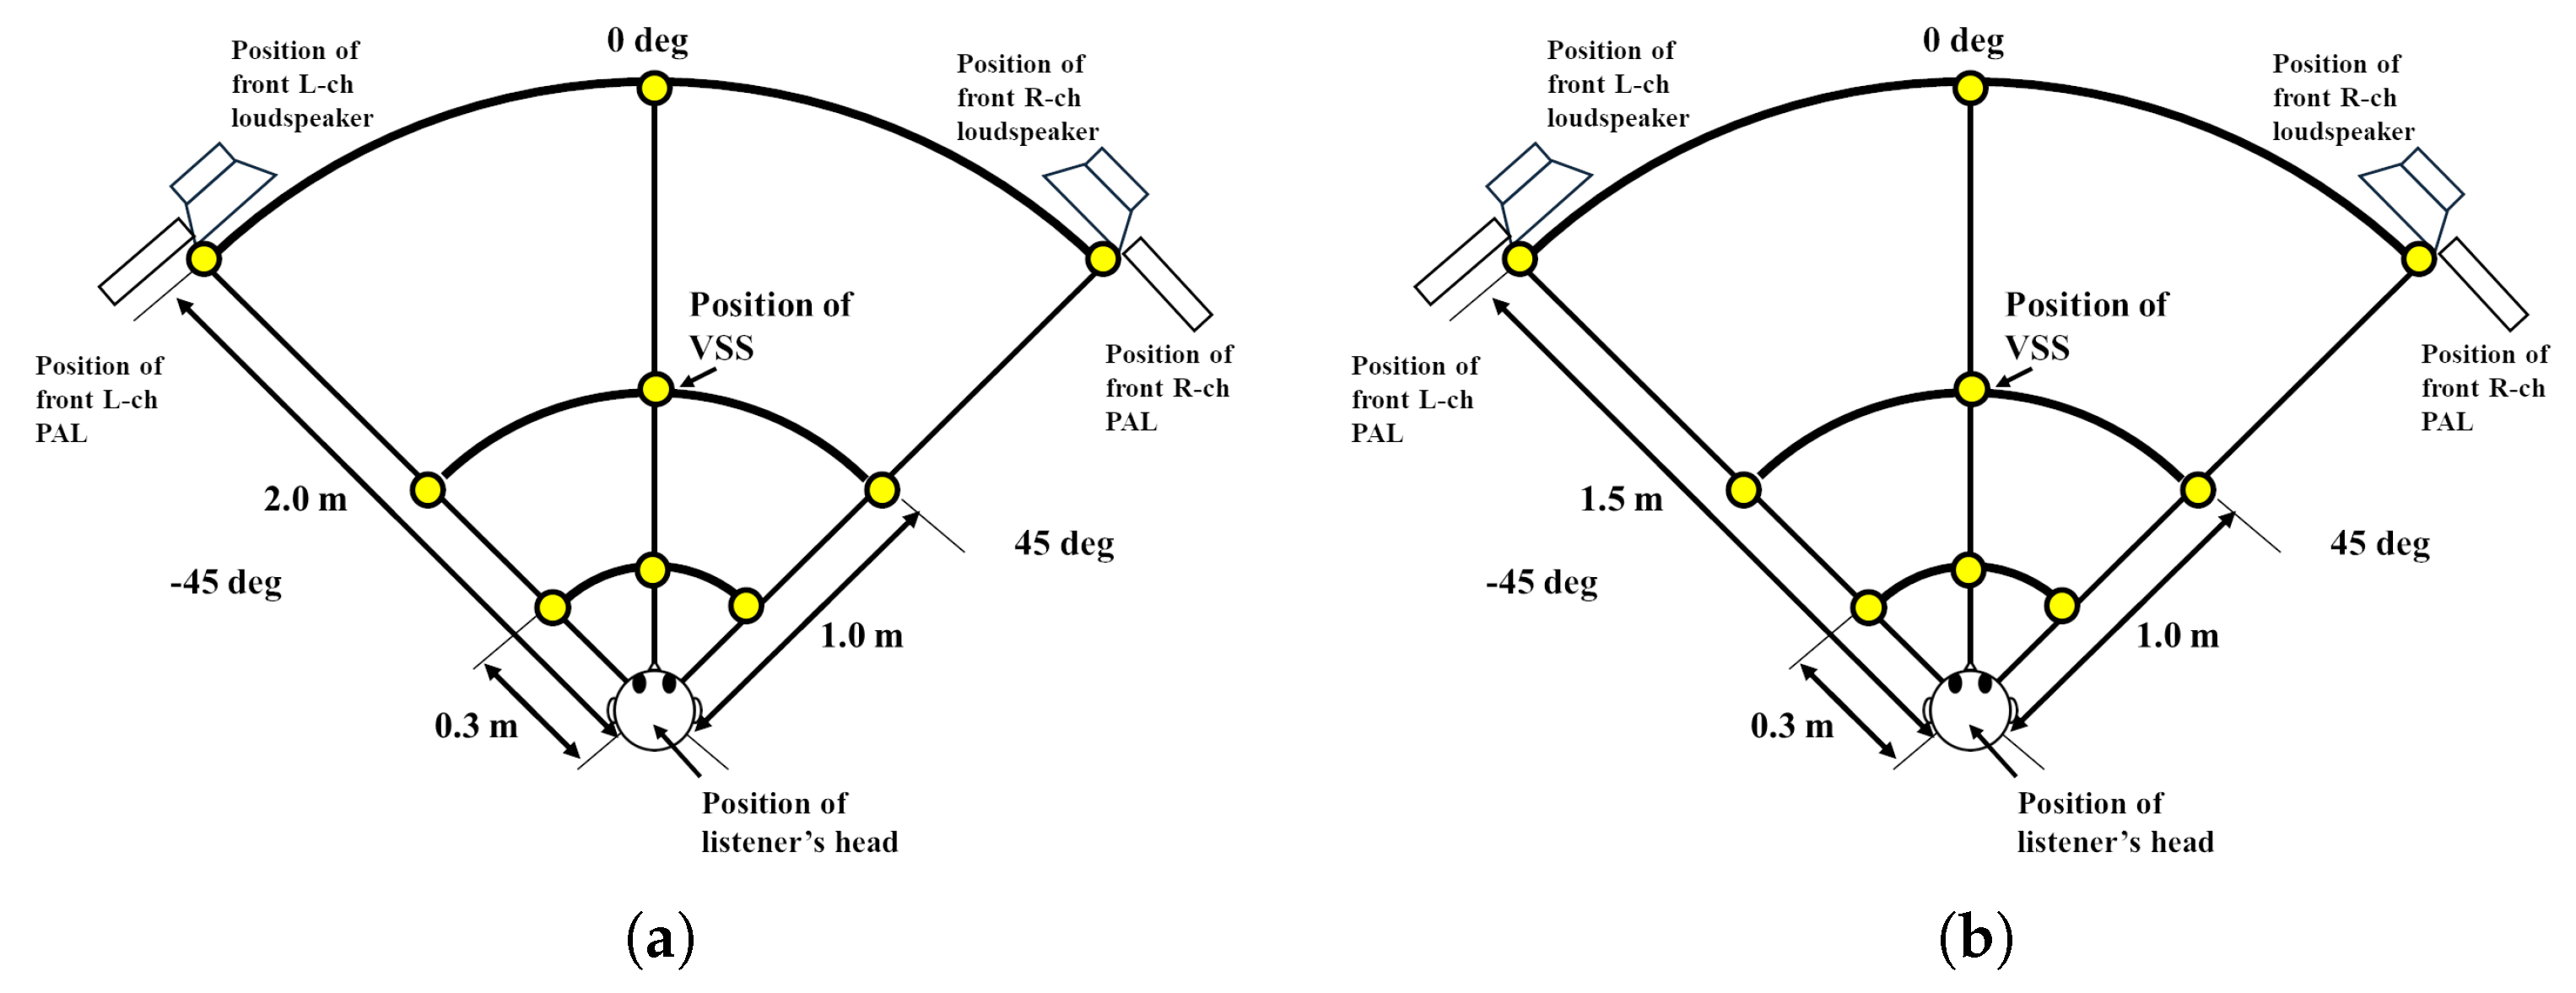
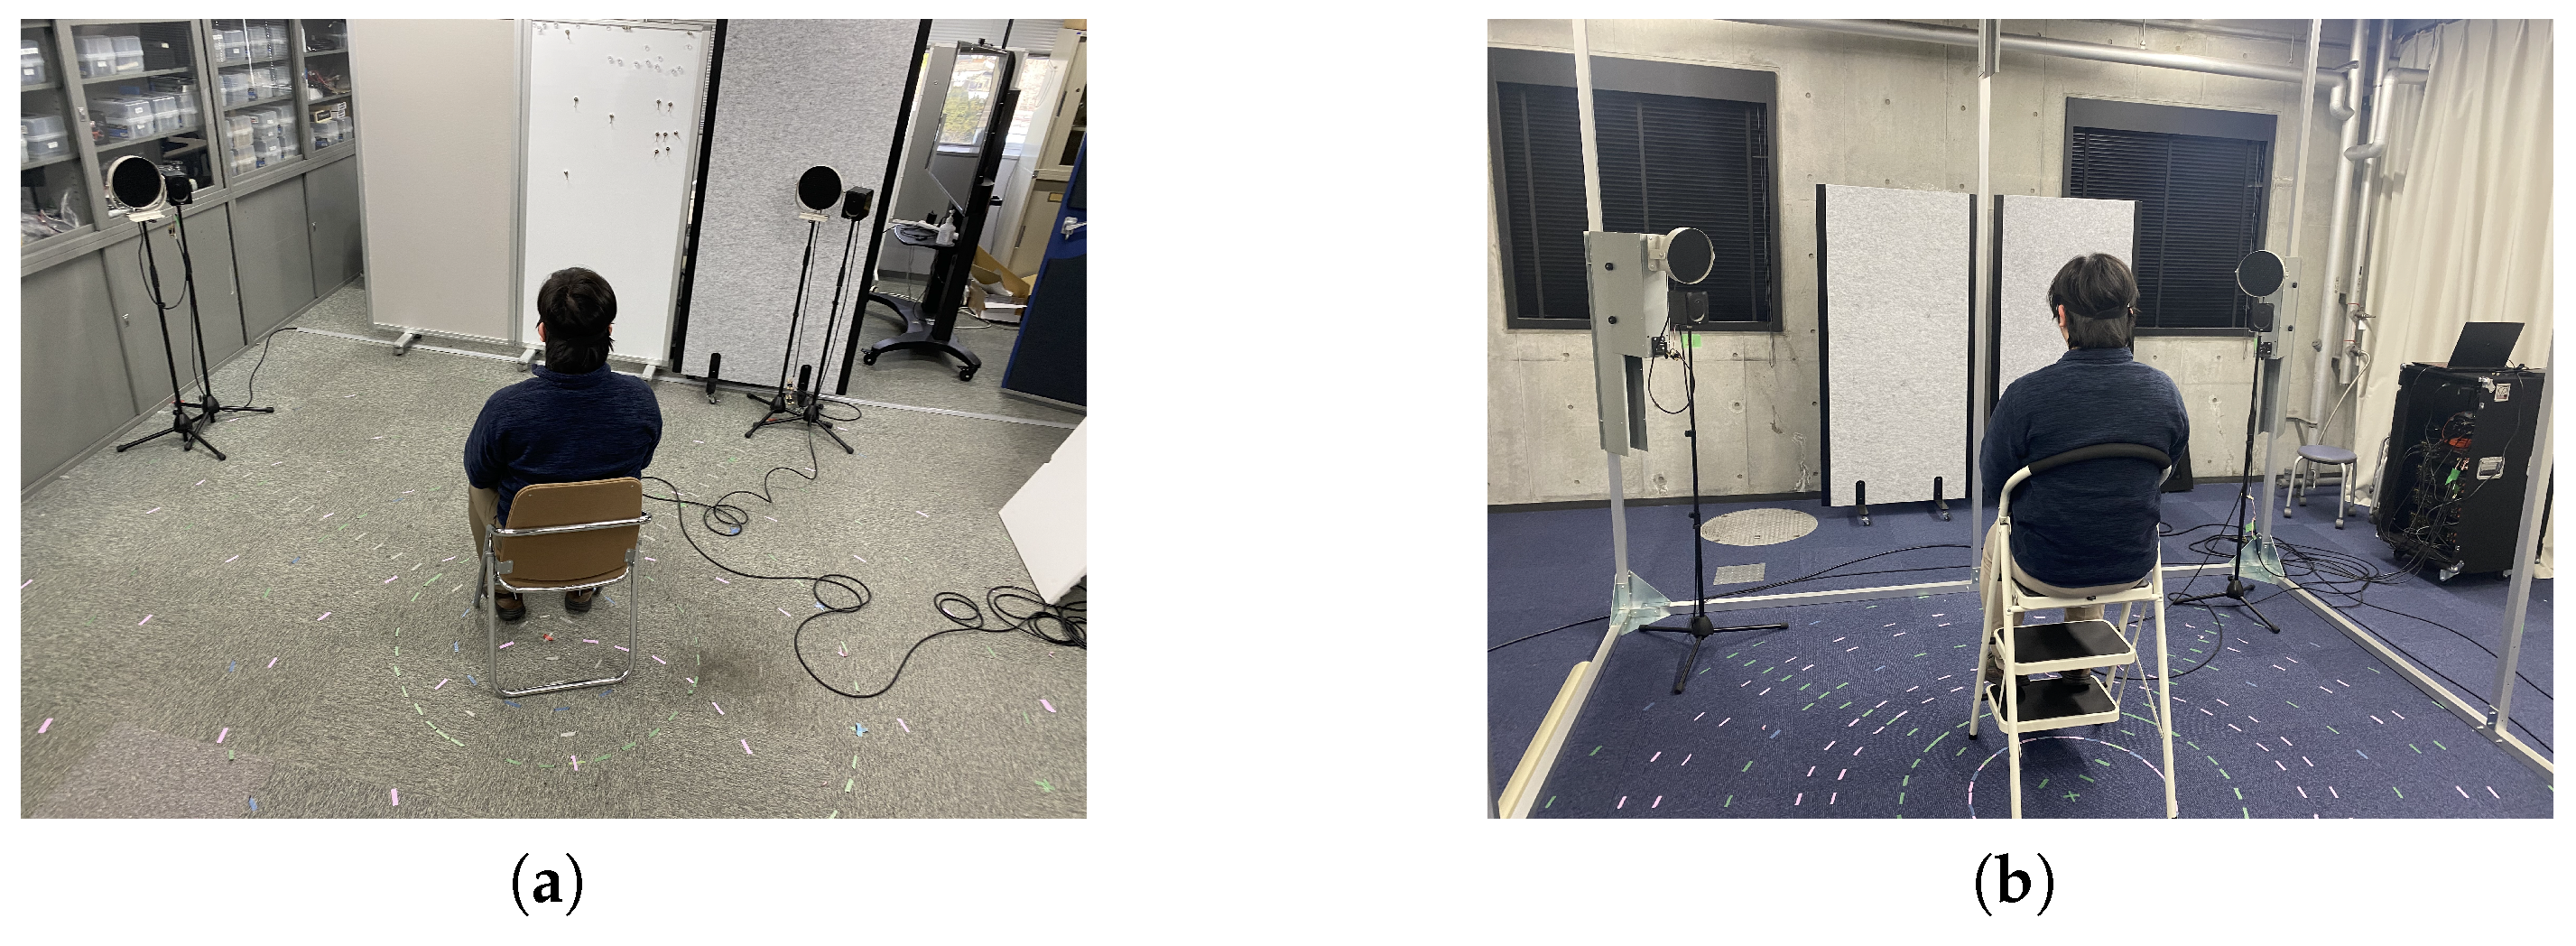
Figure 7 illustrates the experimental arrangement for the real sound source (loudspeaker), and Figure 8 shows the experimental arrangement for the conventional and proposed methods. Figure 9 presents the experimental scene for the subjective evaluation.
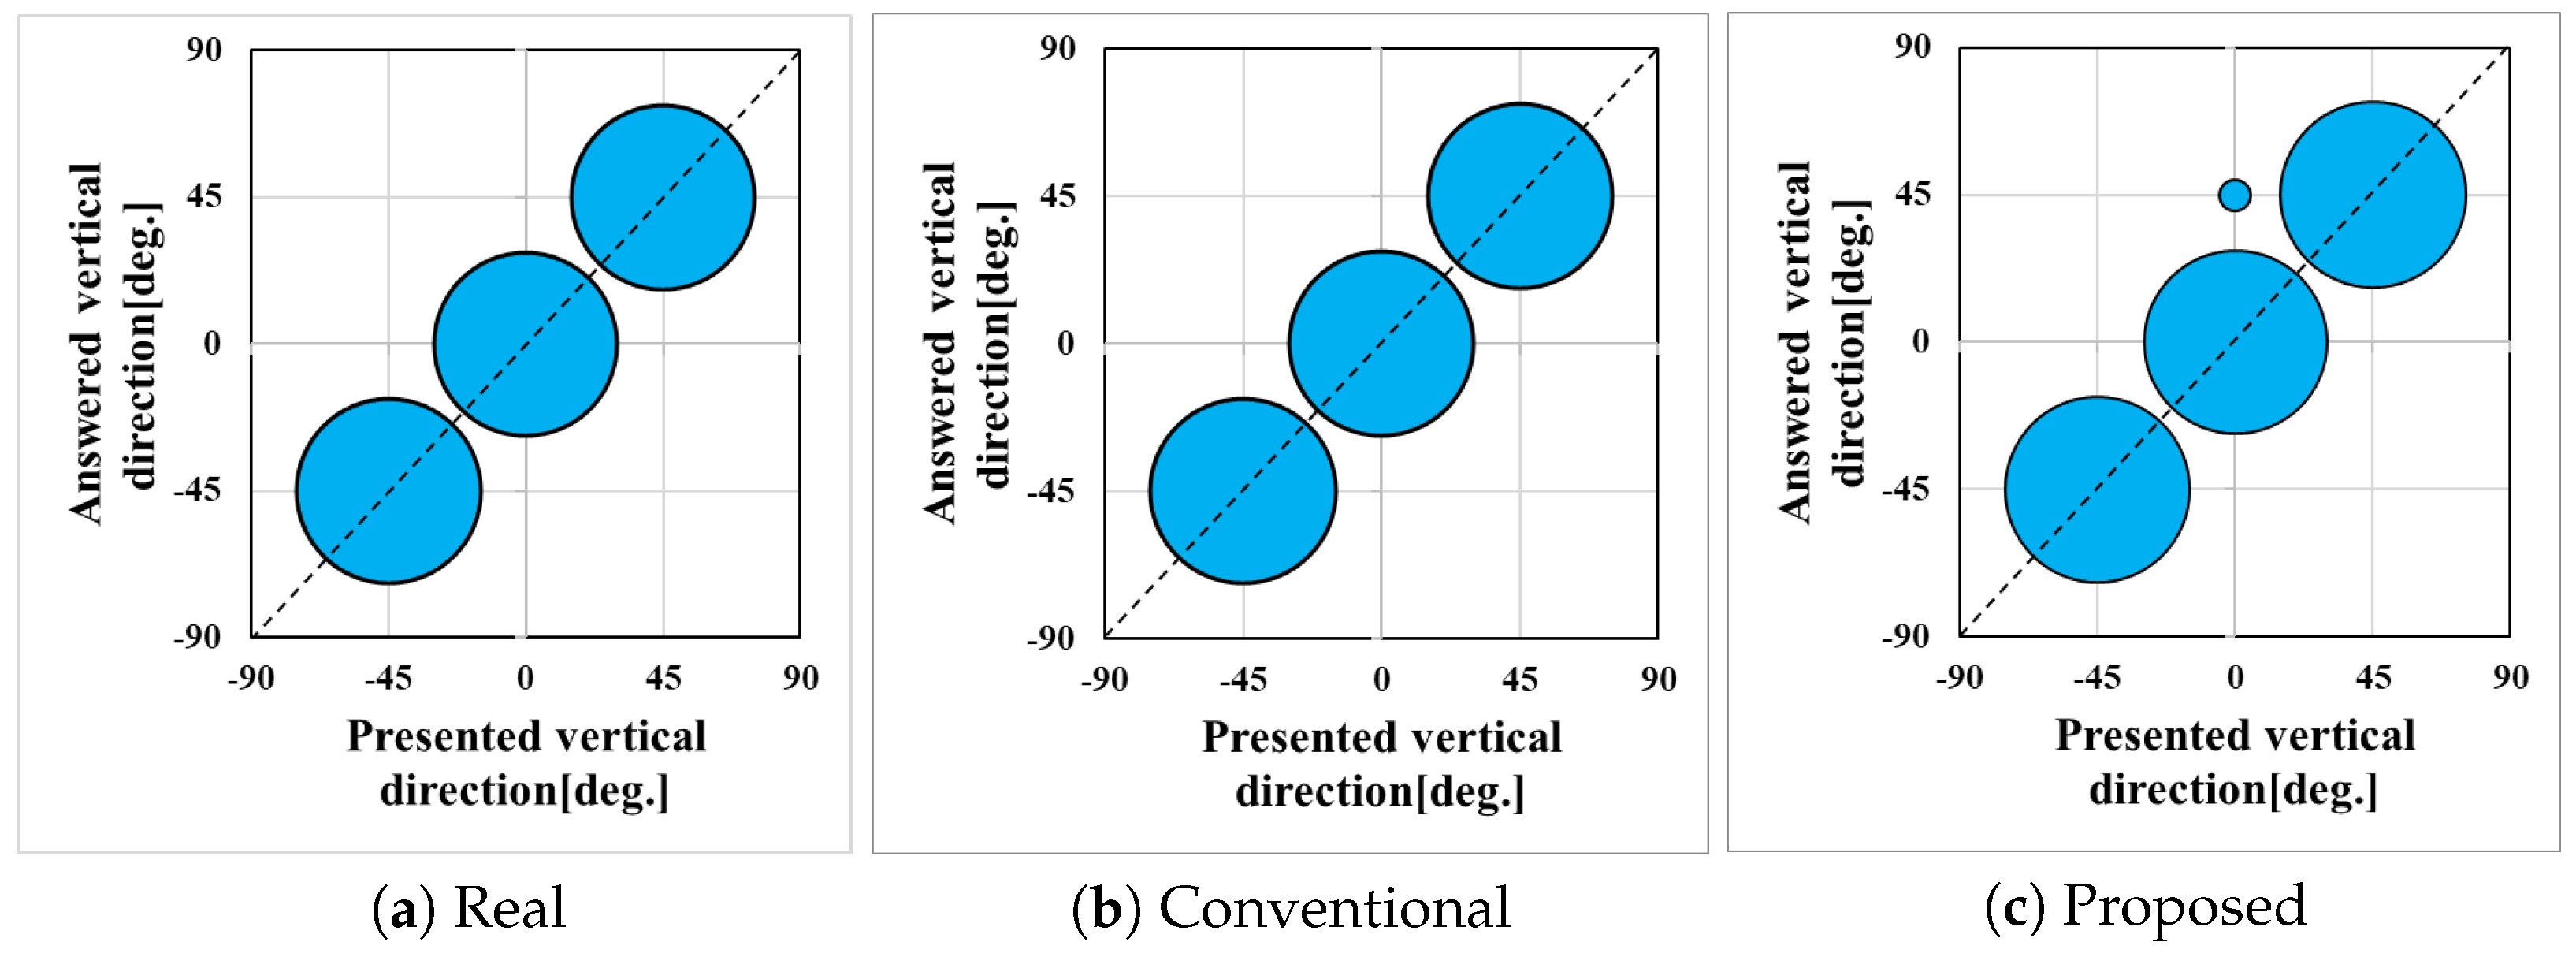
The experiment involved twelve male participants. The positions of the sound source were randomly selected, and the sound source was presented to each of the twelve participants once per position. The participants were then asked to report the perceived distance and direction of the virtual sound source. The frequency distribution of the responses was visualized using a bubble chart. The variation among subjects was evaluated using box plots for the correct answer rate. The distances chosen were 0.3, 1.0, or 1.5 m (in the living room environment) or 2.0 m (in the live studio environment), and the directions chosen were −45, 0, or 45.
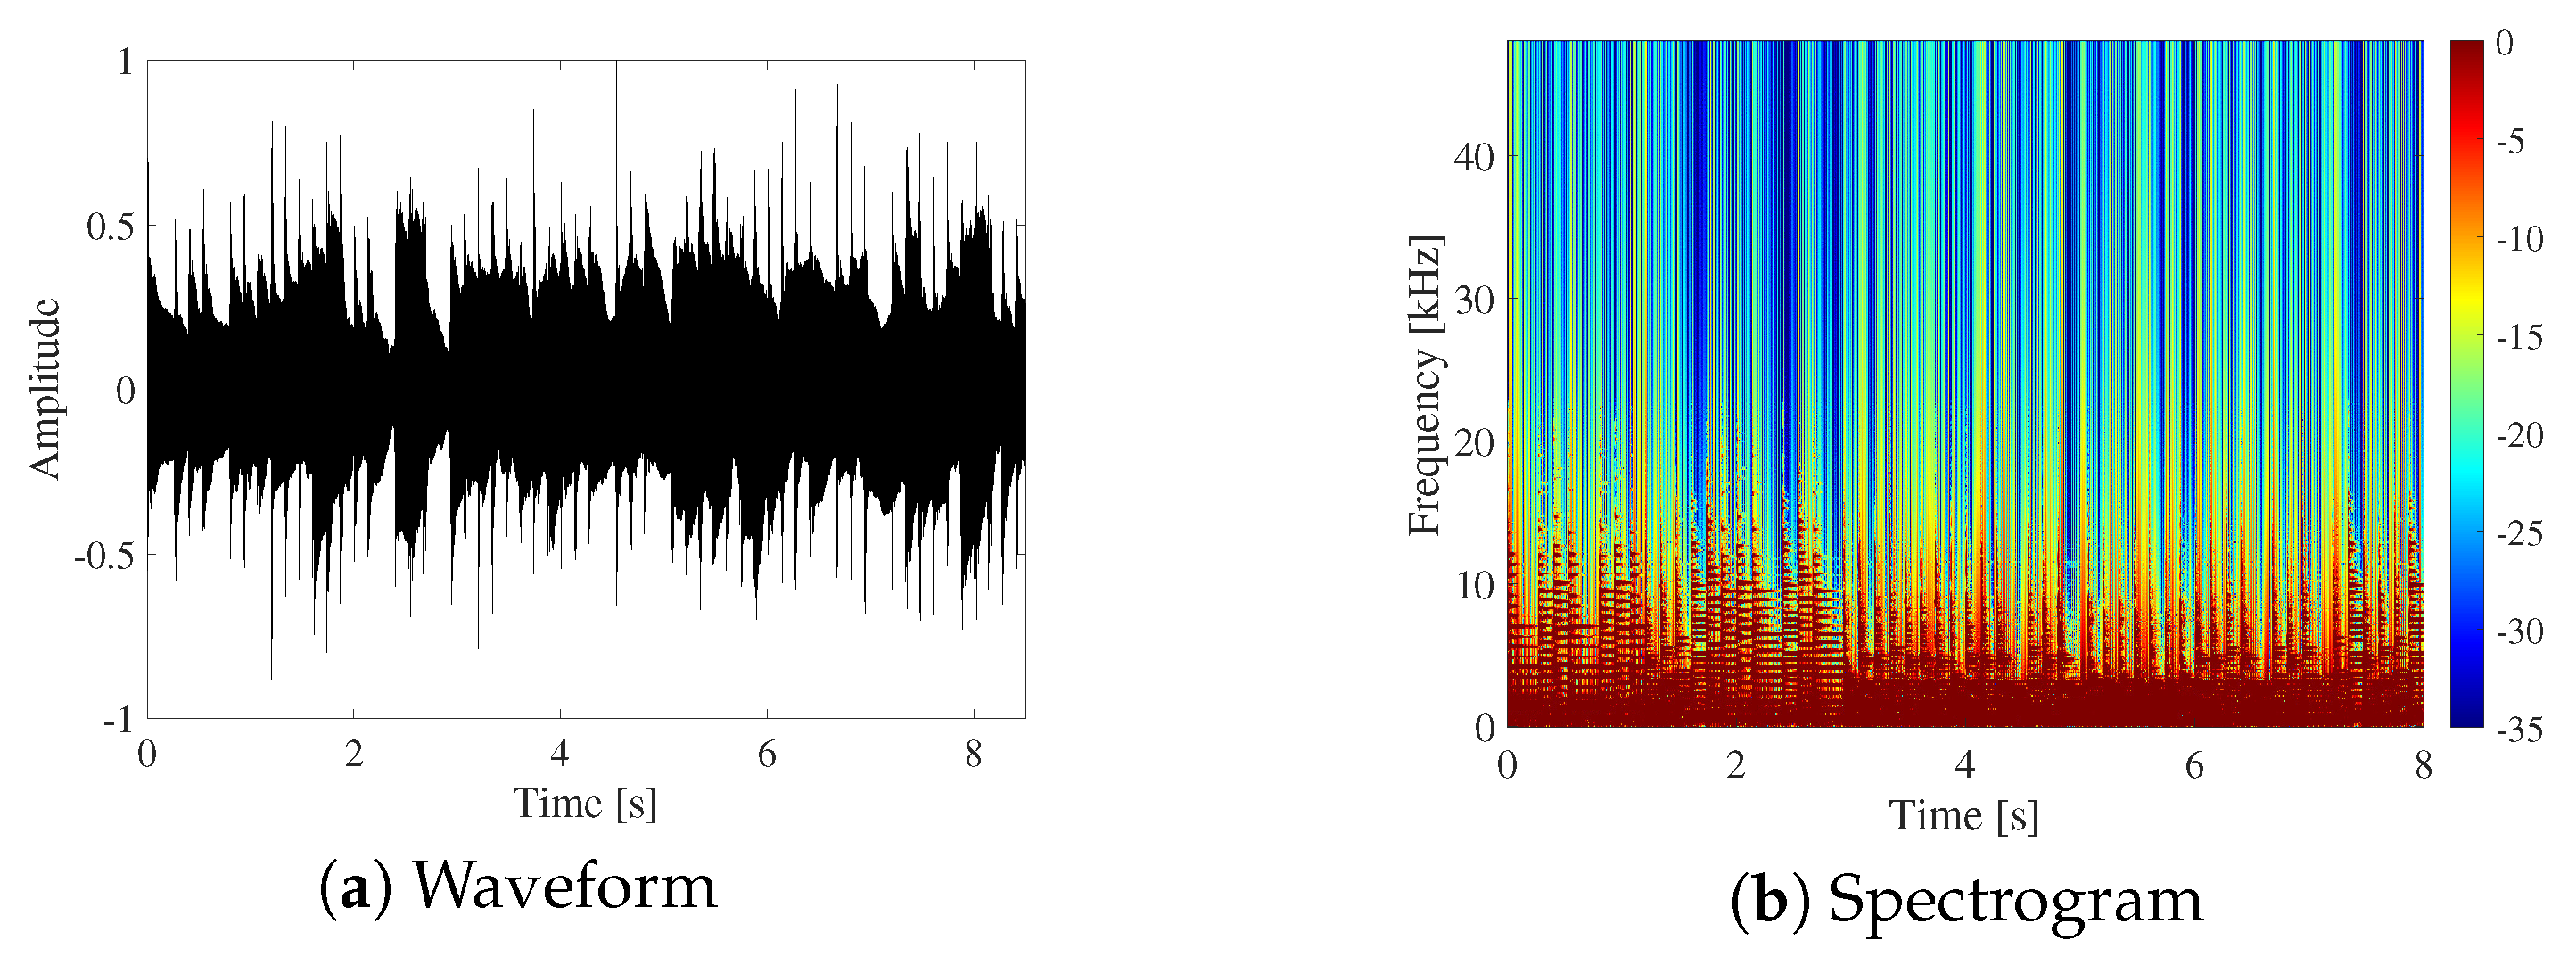
The dry sound source was generated using ElectroBass as the instrument in Roland’s Zenbeats DAW (Digital Audio Workstation) [49], creating a sound source with the C major key melody of Pachelbel’s Canon and then applying an effect in the same DAW to raise its pitch by one octave. The sampling frequency was 96 kHz, and the quantization was 16 bits. Figure 10 shows the waveform and spectrum of the generated dry sound source.
Additionally, the experiment was conducted without visual cues. Specifically, the listeners heard and responded to each test sound while wearing an eye mask. In other words, the device was hidden from view.
We evaluated the following three conditions:
  • Real: The real sound source using the loudspeaker;
  • Conventional: The conventional method [45];
  • Proposed: The proposed method.

7.2. Experimental Results of the Subjective Evaluation

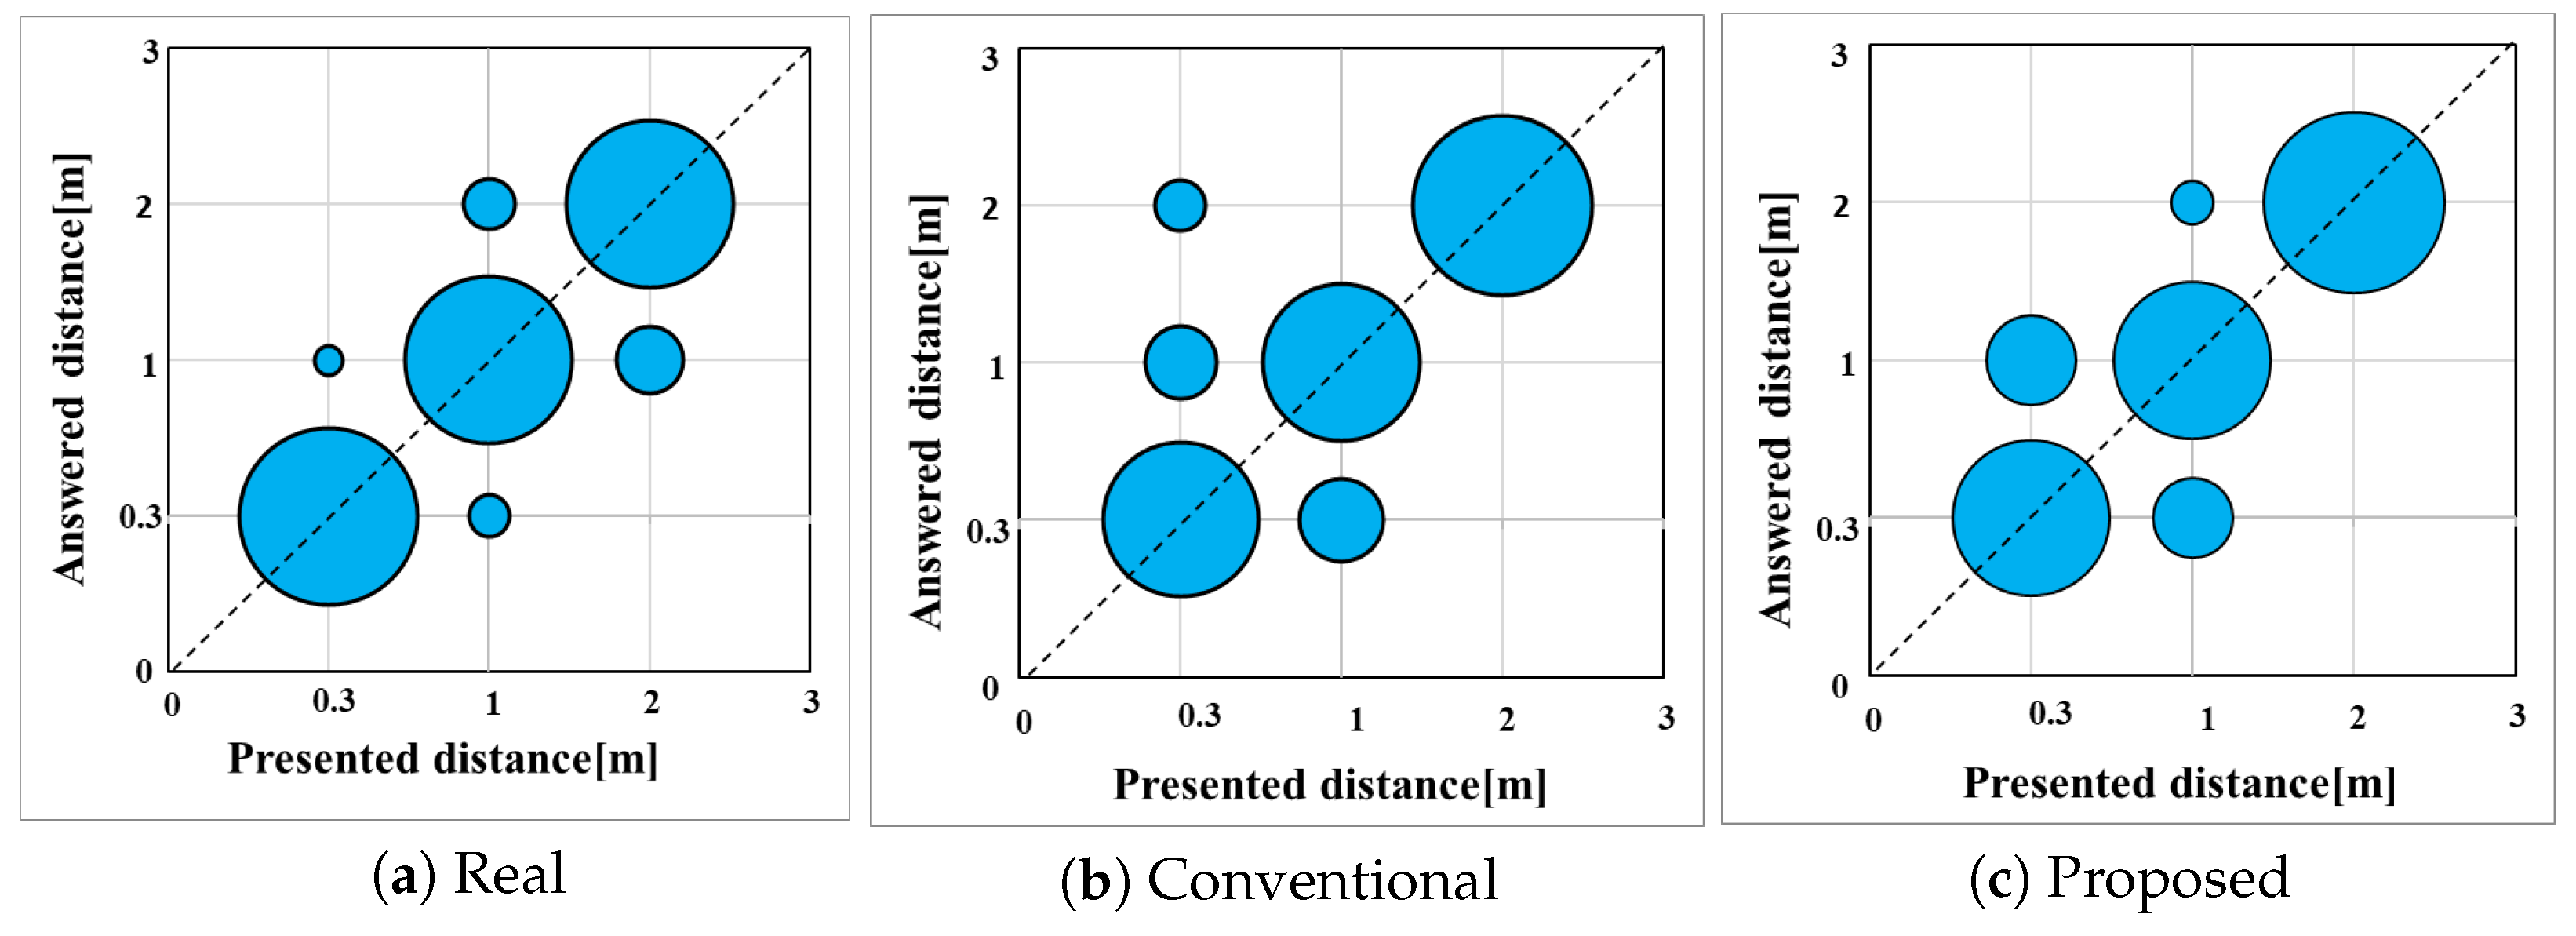
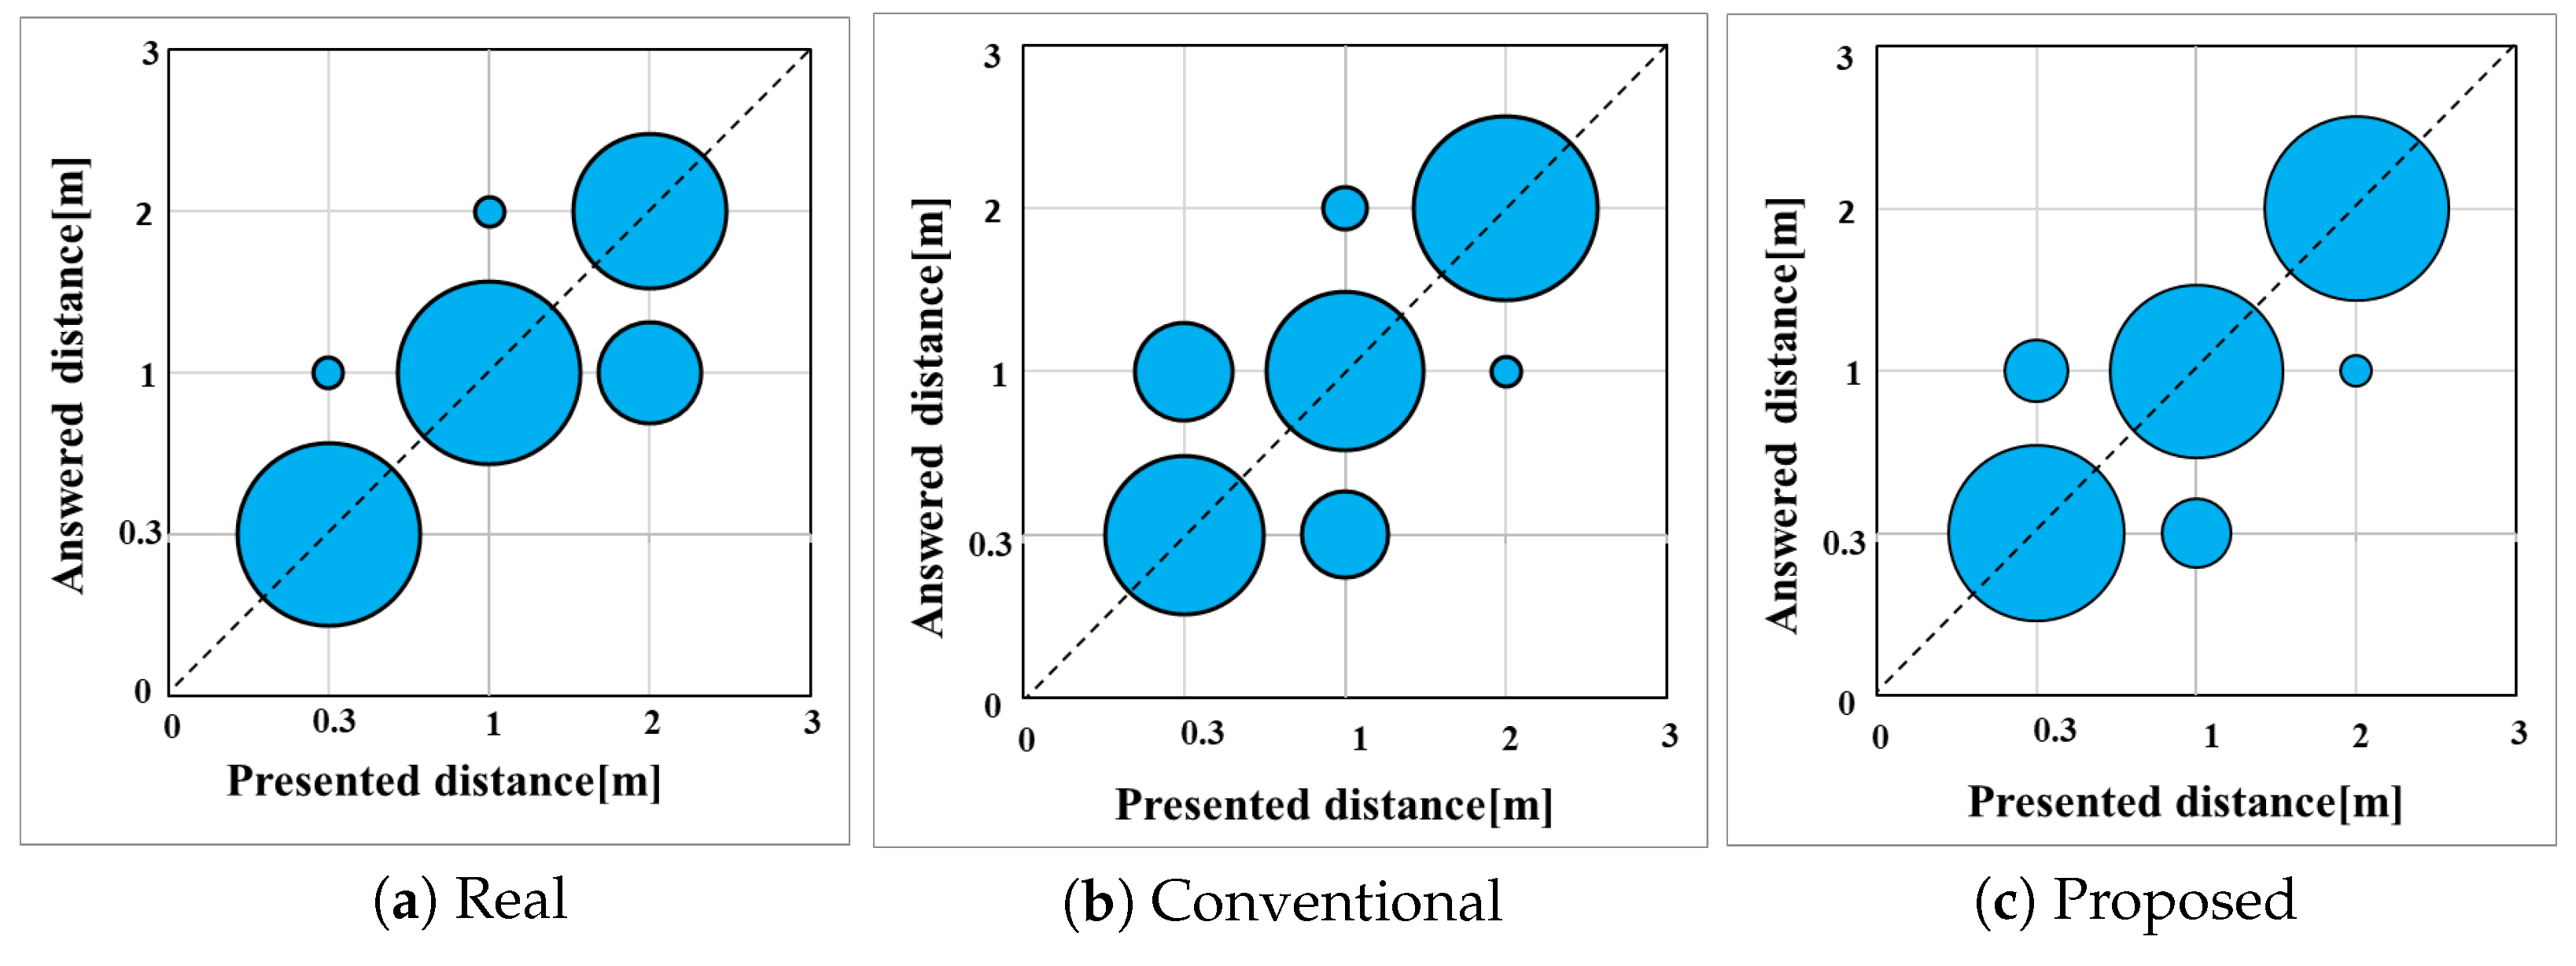
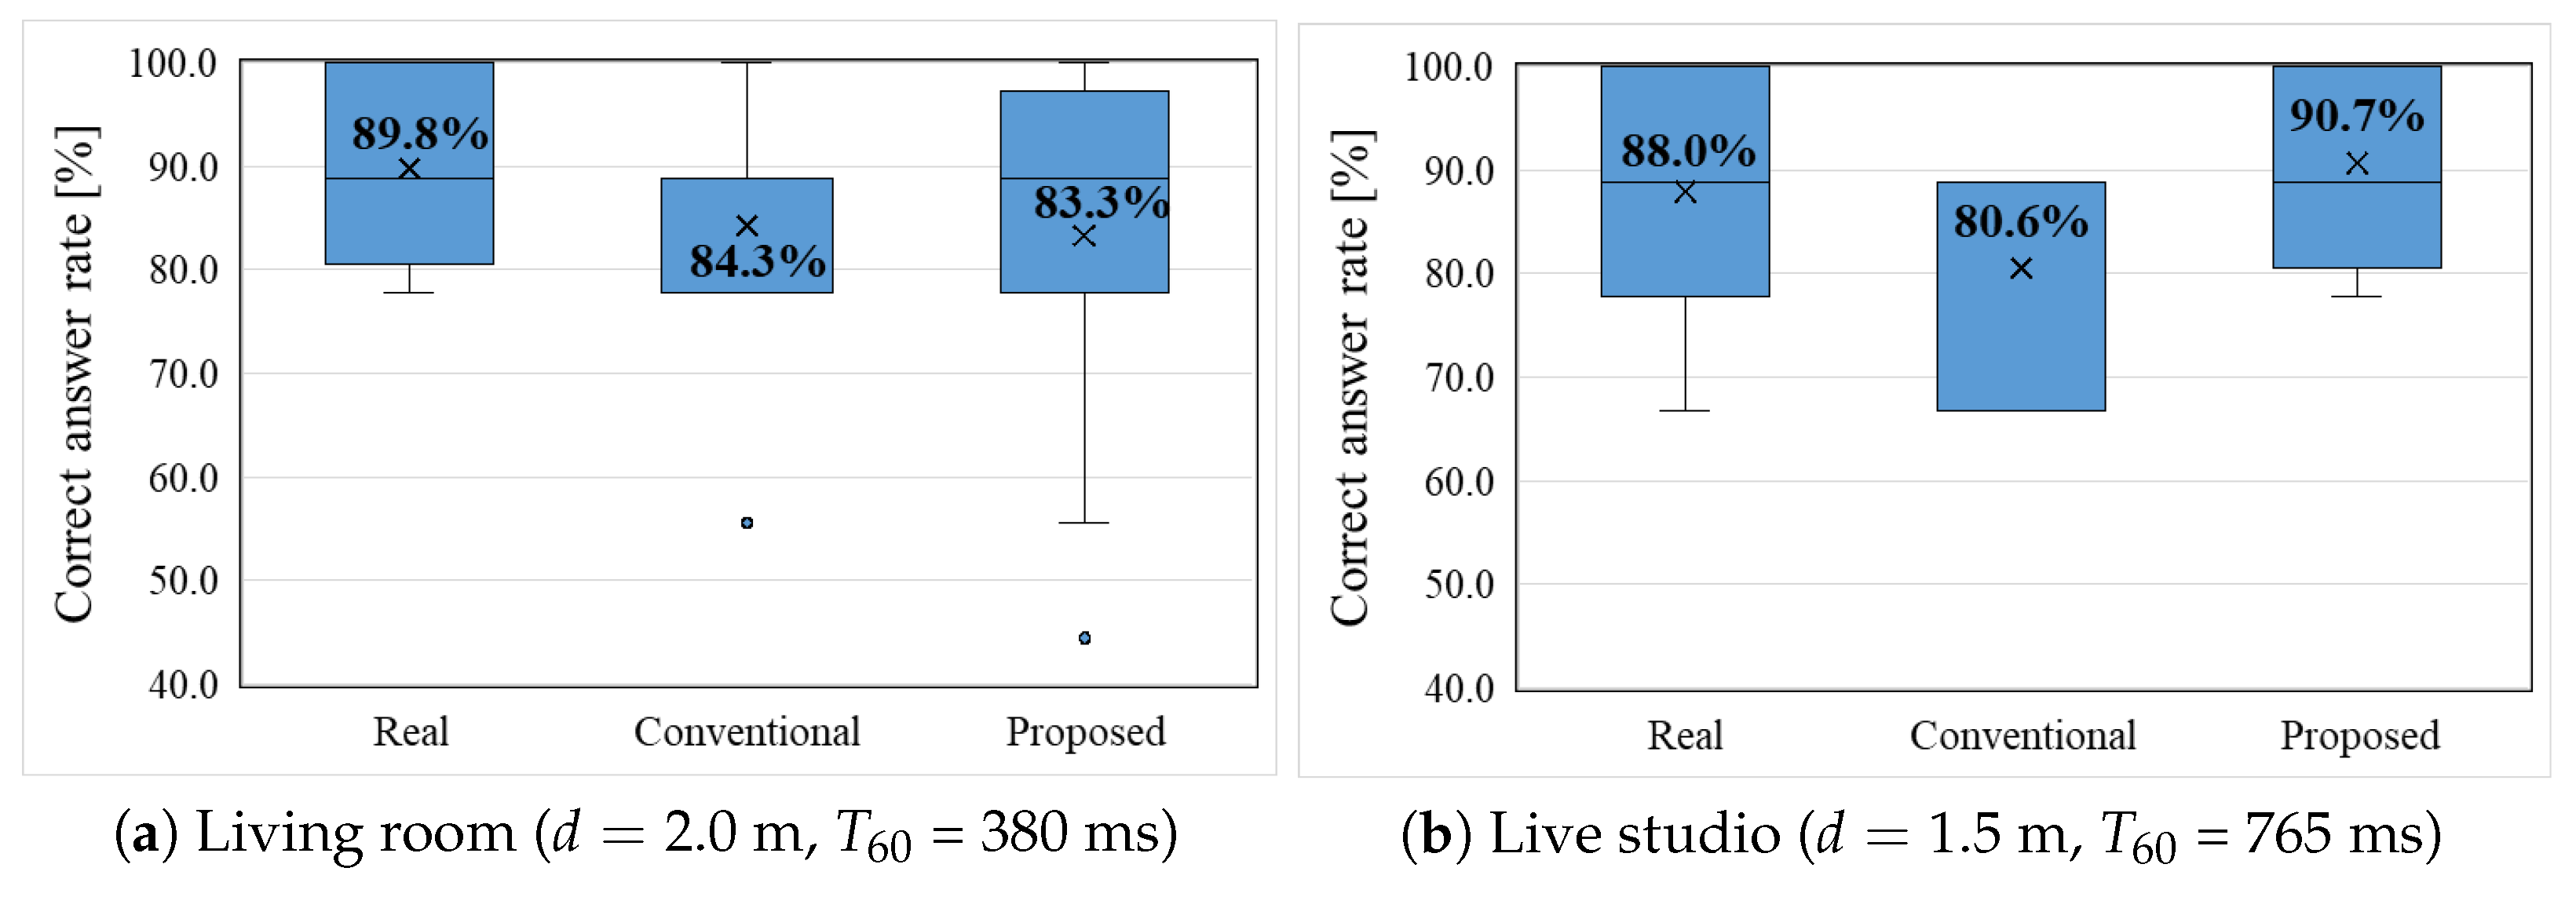
Figure 11 shows the frequency distribution of the responses for distance in the living room environment, and Figure 12 shows the frequency distribution of the responses for distance in the live studio environment. Figure 13 shows a box plot of the correct answer rate for distance. In Figure 11 and Figure 12, the bubbles on the dotted line indicate correct answers. A bubble’s size is drawn in proportion to its frequency.
In the bubble charts in Figure 11 and Figure 12, the horizontal axis represents the presented distance, while the vertical axis represents the answered distance relative to the presented distance, with larger circles indicating a higher frequency of that response. The condition where the presented distance equals the answered distance is represented by bubbles on the diagonal, which indicate correct responses. Figure 11 and Figure 12 show the overall bubble charts summarizing all of the subjects’ distance responses. Figure 13, on the other hand, presents a box plot of the number of correct responses against the total number of trials for distance. The percentage of correct responses is calculated for each subject, with individual differences represented in the box plot.
As shown in Figure 11, Figure 12 and Figure 13, the performance of distance estimation using the conventional method and the proposed method decreased compared to that of the real sound source in the living room environment. In this environment, the performance of the proposed method was approximately equal to that of the conventional method.
On the other hand, in distance estimation, the performance of the proposed method is approximately equal to that of the real sound source in the live studio environment. In contrast, in the live studio environment, the performance of the conventional method is degraded by approximately 20% compared to that of the proposed method.
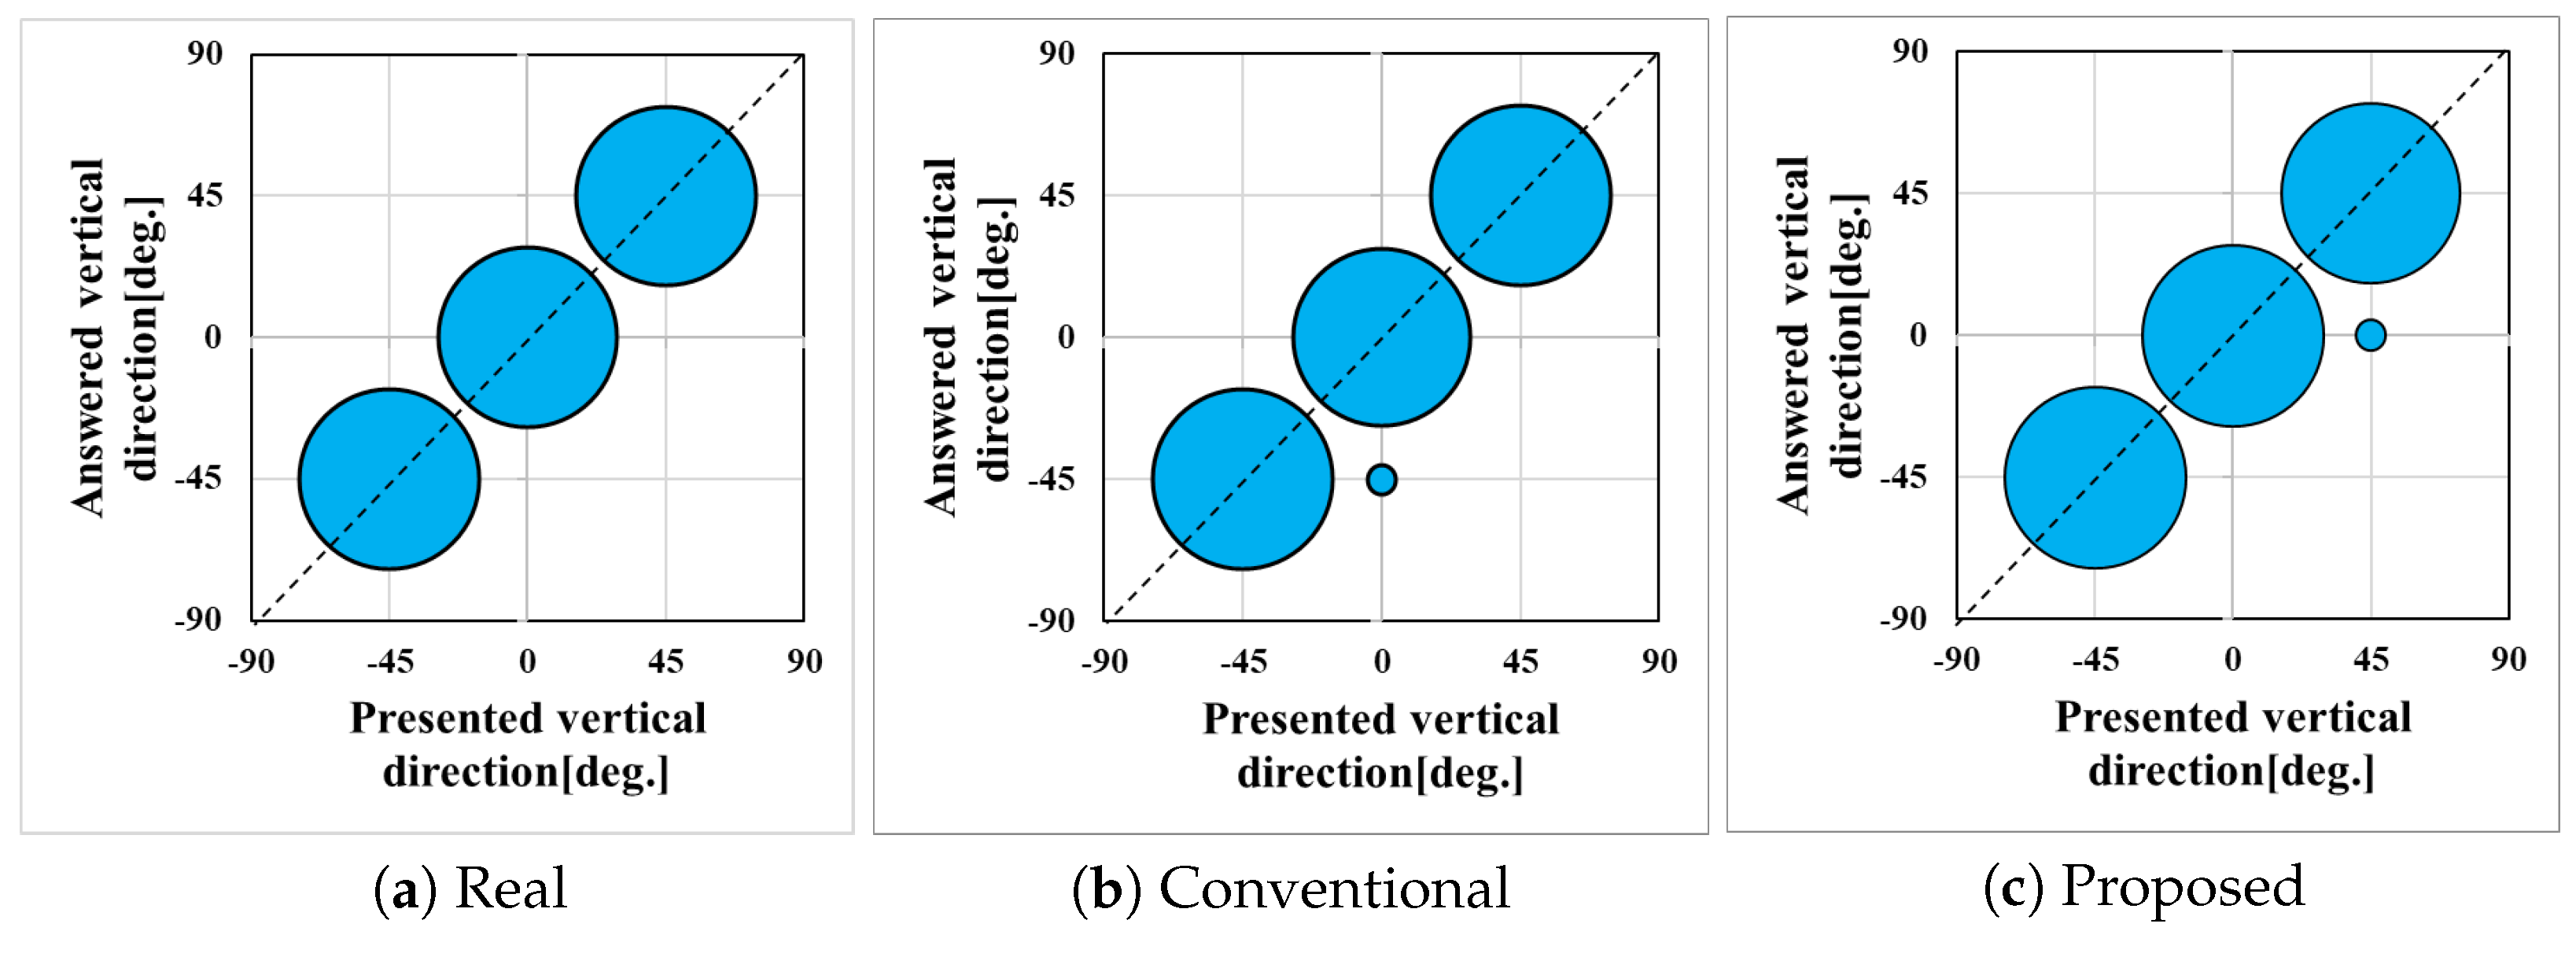
Figure 14 shows the frequency distribution of the responses for direction in the living room environment, and Figure 15 shows the frequency distribution of the responses for direction in the live studio environment. Figure 16 shows a box plot of the correct answer rate for direction. In Figure 14 and Figure 15, the bubbles on the dotted line indicate correct answers. A bubble’s size is drawn in proportion to its frequency.
Similarly, in the bubble charts in Figure 14 and Figure 15, the horizontal axis represents the presented direction, while the vertical axis represents the answered direction in response to the presented direction, with larger circles indicating a higher frequency of such responses. Conditions where the presented and answered directions are equal are represented by bubbles on the diagonal, which indicate correct responses. Figure 14 and Figure 15 show the overall bubble charts summarizing all of the subjects’ orientation responses. Figure 16, on the other hand, presents a box plot of the number of correct responses against the total number of trials for orientation. The percentage of correct responses is calculated for each subject, with individual differences represented in the box plot.
As shown in Figure 14, Figure 15 and Figure 16, the performance in direction estimation is consistently high across all conditions. We confirmed the effectiveness of direction control with VBAP using PALs and loudspeakers.
From the above experimental results, we confirmed the effectiveness of the proposed method. The proposed method demonstrates a high performance for distance presentation, particularly in high-reverberation environments.

8. Conclusions

In this paper, we proposed DRR construction based on a new distance control method using multiple pairs of parametric-array loudspeakers and conventional loudspeakers. The proposed method utilizes a weighting function based on the energy ratio for the PAL and a linear ratio for the loudspeaker in VBAP for distance, as well as a weighting function based on the linear ratio in VBAP for direction. In addition, DRR correction was introduced for near distances around the listener’s head. We conducted objective and subjective evaluation experiments in different reverberation environments. As a result of the objective evaluation experiments, the DRRs of the proposed method closely approximated the real DRRs, with DRR errors of approximately 1 dB in the living room environment and 3 dB in the live studio environment. As a result of the subjective evaluation experiments, the performance of the proposed method was approximately 20% superior to that of the conventional method in the live studio environment. We confirmed the effectiveness of the proposed method through all experiments. In the future, we intend to incorporate the vertical axis into the proposed method to achieve a more immersive audio experience.

Author Contributions

Conceptualization: M.N. and T.E. Methodology: M.N. and T.E. Software: T.E. Validation: M.N., T.E., T.T. and T.N. Formal analysis: M.N. and T.E. Investigation: M.N. and T.E. Resources: M.N. and T.N. Data curation: M.N. and T.E. Writing—original draft preparation: M.N. Writing—review and editing: M.N., T.E., T.T. and T.N. Visualization: M.N. and T.E. Supervision: M.N. Project administration: M.N. Funding acquisition: M.N. and T.N. All authors have read and agreed to the published version of the manuscript.

Funding

This work was partly supported by JSPS KAKENHI Grant Nos. JP21H03488, JP23H03425, JP23K21691, and JP23K28115.

Institutional Review Board Statement

The study was conducted in accordance with the Declaration of Helsinki, and approved by the Ethics Committee of Osaka Sangyo University (Protocol code: 2022-Jinrin-10, Approval date: 19 May 2022).

Informed Consent Statement

Informed consent was obtained from all subjects involved in the study.

Data Availability Statement

The original contributions presented in this study are included in the article. Further inquiries can be directed to the corresponding author.

Conflicts of Interest

The authors declare no conflicts of interest. The funders had no role in the design of this study; in the collection, analyses, or interpretation of the data; in the writing of the manuscript; or in the decision to publish the results.

References

  1. Berkout, A.; de Vries, D.; Vogel, P. Acoustic control by wave field synthesis. J. Acoust. Soc. Am. 1993, 93, 2764–2778. [Google Scholar]
  2. Bauck, J.; Cooper, D. Generalized transaural stereo and applications. J. Acoust. Soc. Am. 1996, 44, 683–705. [Google Scholar]
  3. Zhang, G.; Huang, Q.; Liu, K. Three-dimensional sound field reproduction based on multi-resolution sparse representation. In Proceedings of the 2015 IEEE International Conference on Signal Processing, Communications and Computing (ICSPCC), Ningbo, China, 19–22 September 2015; pp. 1–5. [Google Scholar]
  4. Zhou, L.; Bao, C.; Jia, M.; Bu, B. Range extrapolation of Head-Related Transfer Function using improved Higher Order Ambisonics. In Proceedings of the Signal and Information Processing Association Annual Summit and Conference (APSIPA), 2014 Asia-Pacific, Siem Reap, Cambodia, 9–12 December 2014; pp. 1–4. [Google Scholar]
  5. Tomasetti, M.; Turchet, L. Playing With Others Using Headphones: Musicians Prefer Binaural Audio With Head Tracking Over Stereo. IEEE Trans.-Hum.-Mach. Syst. 2023, 53, 501–511. [Google Scholar]
  6. Gao, R.; Grauman, K. 2.5D Visual Sound. In Proceedings of the 2019 IEEE/CVF Conference on Computer Vision and Pattern Recognition (CVPR), Long Beach, CA, USA, 15–20 June 2019; pp. 324–333. [Google Scholar]
  7. Zaunschirm, M.; Schorkhuber, C.; Holdrich, R. Binaural rendering of Ambisonic signals by head-related impulse response time alignment and a diffuseness constraint. J. Acoust. Soc. Am. 2018, 143, 3616–3627. [Google Scholar] [CrossRef]
  8. Alotaibi, S.S.; Wickert, M. Modeling of Individual Head-Related Transfer Functions (HRTFs) Based on Spatiotemporal and Anthropometric Features Using Deep Neural Networks. IEEE Access 2024, 12, 14620–14635. [Google Scholar]
  9. Romigh, G.D.; Brungart, D.S.; Stern, R.M.; Simpson, B.D. Efficient Real Spherical Harmonic Representation of Head-Related Transfer Functions. IEEE J. Sel. Top. Signal Process. 2015, 9, 921–930. [Google Scholar]
  10. Wang, Y.; Yu, G. Typicality analysis on statistical shape model-based average head and its head-related transfer functions. J. Acoust. Soc. Am. 2025, 157, 57–69. [Google Scholar]
  11. Kurabayashi, H.; Otani, M.; Itoh, K.; Hashimoto, M.; Kayama, M. Development of dynamic transaural reproduction system using non-contact head tracking. In Proceedings of the 2013 IEEE 2nd Global Conference on Consumer Electronics (GCCE), Tokyo, Japan, 1–4 October 2013; pp. 12–16. [Google Scholar]
  12. Samejima, T.; Kobayashi, K.; Sekiguchi, S. Transaural system using acoustic contrast as its objective function. Acoust. Sci. Technol. 2021, 42, 206–209. [Google Scholar]
  13. Shore, A.; Tropiano, A.J.; Hartmann, W.M. Matched transaural synthesis with probe microphones for psychoacoustical experiments. J. Acoust. Soc. Am. 2019, 145, 1313–1330. [Google Scholar]
  14. Shore, A.; Hartmann, W.M. Improvements in transaural synthesis with the Moore-Penrose pseudoinverse matrix. J. Acoust. Soc. Am. 2018, 143, 1938. [Google Scholar]
  15. Omoto, A.; Ise, S.; Ikeda, Y.; Ueno, K.; Enomoto, S.; Kobayashiy, M. Sound field reproduction and sharing system based on the boundary surface control principle. Acoust. Sci. Technol. 2015, 36, 1–11. [Google Scholar] [CrossRef]
  16. Zheng, J.; Tu, W.; Zhang, X.; Yang, W.; Zhai, S.; Shen, C. A Sound Image Reproduction Model Based on Personalized Weight Vectors. In Advances in Multimedia Information Processing–PCM 2018: 19th Pacific-Rim Conference on Multimedia, Hefei, China, 21–22 September 2018; Proceedings, Part II 19; Springer International Publishing: Cham, Switzerland, 2018; pp. 607–617. [Google Scholar]
  17. Hirohashi, M.; Haneda, Y. Subjective Evaluation of a Focused Sound Source Reproducing at the positions of a Listenerfs Moving Hand. In Proceedings of the 2023 Asia Pacific Signal and Information Processing Association Annual Summit and Conference (APSIPA ASC), Taipei, Taiwan, 31 October–3 November 2023; pp. 2395–2401. [Google Scholar]
  18. Jeon, I.; Lee, S. Driving function in wave field synthesis with integral approximation considering uneven contribution of loudspeaker units. J. Acoust. Soc. Am. 2024, 156, 3877–3892. [Google Scholar] [CrossRef] [PubMed]
  19. Lund, T. Enhanced Localization in 5.1 Production. J. Audio Eng. Soc. 2000, 109, 5243. [Google Scholar]
  20. Hamasaki, K.; Nishiguchi, T.; Okumura, R.; Nakayama, Y.; Ando, A. A 22.2 multichannel sound system for ultrahigh-definition TV. SMPTE Motion Imaging J. 2008, 117, 40–49. [Google Scholar] [CrossRef]
  21. Rumsey, F. Immersive Audio, Objects, and Coding. J. Audio Eng. Soc. 2015, 63, 394–398. [Google Scholar]
  22. Rumsey, F. Immersive Audio: Objects, Mixing, and Rendering. J. Audio Eng. Soc. 2016, 64, 584–588. [Google Scholar]
  23. Pulkki, V. Virtual Sound Source Positioning Using Vector Base Amplitude Panning. J. Audio Eng. Soc. 1997, 45, 456–466. [Google Scholar]
  24. Daniel, J.; Nicol, R.; Moreau, S. Further investigations of High Order Ambisonics and wavefield synthesis for holophonic sound imaging. In Proceedings of the Audio Engineering Society 114th International Convention, Amsterdam, The Netherlands, 22–25 March 2003; p. 5788. [Google Scholar]
  25. Lopez, J.; Gutierrez, P.; Cobos, M.; Aguilera, E. Sound distance perception comparison between Wave Field Synthesis and Vector Base Amplitude Panning. In Proceedings of the 2014 6th International Symposium on Communications, Control and Signal Processing (ISCCSP), Athens, Greece, 21–23 May 2014; pp. 165–168. [Google Scholar]
  26. Yang, L.; Yang, L.; Ho, K. Moving target localization in multistatic sonar using time delays, Doppler shifts and arrival angles. In Proceedings of the 2017 IEEE International Conference on Acoustics, Speech and Signal Processing (ICASSP), New Orleans, LA, USA, 5–9 March 2017; pp. 3399–3403. [Google Scholar]
  27. Roman, N.; Wang, D.; Brow, G. Speech segregation based on sound localization. J. Acoust. Soc. Am. 2003, 114, 2236–2252. [Google Scholar] [CrossRef]
  28. Kuttruff, H. Room Acousticsn; Elsevier Science Publishers Ltd.: Cambridge, UK, 1973. [Google Scholar]
  29. Lu, Y.C.; Cooke, M. Binaural Estimation of Sound Source Distance via the Direct-to-Reverberant Energy Ratio for Static and Moving Sources. IEEE Trans. Audio Speech Lang. Process. 2010, 18, 1793–1805. [Google Scholar]
  30. Madmoni, L.; Tibor, S.; Nelken, I.; Rafaely, B. The Effect of Partial Time-Frequency Masking of the Direct Sound on the Perception of Reverberant Speech. IEEE/ACM Trans. Audio Speech Lang. Process. 2021, 29, 2037–2047. [Google Scholar] [CrossRef]
  31. Prodi, N.; Pellegatti, M.; Visentin, C. Effects of type of early reflection, clarity of speech, reverberation and diffuse noise on the spatial perception of a speech source and its intelligibility. J. Acoust. Soc. Am. 2022, 151, 3522–3534. [Google Scholar] [PubMed]
  32. Ogami, Y.; Nakayama, M.; Nishiura, T. Virtual sound source construction based on radiation direction control using multiple parametric array loudspeakers. J. Acoust. Soc. Am. 2019, 146, 1314–1325. [Google Scholar] [PubMed]
  33. Geng, Y.; Sayama, S.; Nakayama, M.; Nishiura, T. Movable Virtual Sound Source Construction Based on Wave Field Synthesis using a Linear Parametric Loudspeaker Array. APSIPA Trans. Signal Inf. Process. 2023, 12, 1–21. [Google Scholar] [CrossRef]
  34. Zhu, Y.; Qin, L.; Ma, W.; Fan, F.; Wu, M.; Kuang, Z.; Yang, J. A nonlinear sound field control method for a multi-channel parametric array loudspeaker array. J. Acoust. Soc. Am. 2025, 157, 962–975. [Google Scholar]
  35. Ma, W.; Zhu, Y.; Ji, P.; Kuang, Z.; Wu, M.; Yang, J. Differential Volterra filter: A two-stage decoupling method for audible sounds generated by parametric array loudspeakers based on Westervelt equation. J. Acoust. Soc. Am. 2025, 157, 1057–1071. [Google Scholar]
  36. Westervelt, P. Parametric acoustic array. J. Acoust. Soc. Am. 1963, 35, 535–537. [Google Scholar] [CrossRef]
  37. Aoki, K.; Kamakura, T.; Kumamoto, Y. Parametric loudspeaker-characteristics of acoustic field and suitable modulation of carrier ultrasound. Electron. Commun. Jpn. 1991, 74, 76–82. [Google Scholar] [CrossRef]
  38. Sugibayashi, Y.; Kurimoto, S.; Ikefuji, D.; Morise, M.; Nishiura, T. Three-dimensional acoustic sound field reproduction based on hybrid combination of multiple parametric loudspeakers and electrodynamic subwoofer. Appl. Acoust. 2012, 73, 1282–1288. [Google Scholar]
  39. Shi, C.; Nomura, H.; Kamakura, T.; Gan, W. Development of a steerable stereophonic parametric loudspeaker. In Proceedings of the Signal and Information Processing Association Annual Summit and Conference (APSIPA), 2014 Asia-Pacific, Siem Reap, Cambodia, 9–12 December 2014; pp. 1–5. [Google Scholar]
  40. Ikefuji, D.; Tsujii, H.; Masunaga, S.; Nakayama, M.; Nishiura, T.; Yamashita, Y. Reverberation Steering and Listening Area Expansion on 3-D Sound Field Reproduction with Parametric Array Loudspeaker. In Proceedings of the Signal and Information Processing Association Annual Summit and Conference (APSIPA), 2014 Asia-Pacific, Siem Reap, Cambodia, 9–12 December 2014; pp. 1–5. [Google Scholar]
  41. Geng, Y.; Shimokata, M.; Nakayama, M.; Nishiura, T. Visualization of Demodulated Sound Based on Sequential Acoustic Ray Tracing with Self-Demodulation in Parametric Array Loudspeakers. Appl. Sci. 2024, 14, 5241. [Google Scholar] [CrossRef]
  42. Geng, Y.; Hirose, A.; Iwagami, M.; Nakayama, M.; Nishiura, T. Enhanced Virtual Sound Source Construction Based on Wave Field Synthesis Using Crossfade Processing with Electro-Dynamic and Parametric Loudspeaker Arrays. Appl. Sci. 2024, 14, 11911. [Google Scholar] [CrossRef]
  43. Nakayama, M.; Nishiura, T. Distance Control of Virtual Sound Source Using Parametric and Dynamic Loudspeakers. In Proceedings of the 2018 Asia-Pacific Signal and Information Processing Association Annual Summit and Conference (APSIPA ASC), Honolulu, HI, USA, 12–15 November 2018; pp. 1262–1267. [Google Scholar]
  44. Ekawa, T.; Nakayama, M.; Takahashi, T. Virtual Sound Source Rendering Based on Distance Control to Penetrate Listeners Using Surround Parametric-array and Electrodynamic Loudspeakers. In Proceedings of the 2021 Asia-Pacific Signal and Information Processing Association Annual Summit and Conference (APSIPA ASC), Tokyo, Japan, 14–17 December 2021; pp. 1008–1015. [Google Scholar]
  45. Ekawa, T.; Geng, Y.; Nishiura, T.; Nakayama, M. Mid-air Acoustic Hologram Using Distance Attenuation and Phase Correction with Parametric-array and Electrodynamic Loudspeakers. In Proceedings of the 2021 Asia-Pacific Signal and Information Processing Association Annual Summit and Conference (APSIPA ASC), Tokyo, Japan, 14–17 December 2021; pp. 1–4. [Google Scholar]
  46. Berkhout, A.; de Vries, D.; Boone, M. A new method to acquir impulse responses in concert halls. J. Acoust. Soc. Am. 1980, 68, 179–183. [Google Scholar]
  47. Aoshima, N. Computer-generated pulse signal applied for sound measurement. J. Acoust. Soc. Am. 1981, 69, 1484–1488. [Google Scholar]
  48. Montgomery, D.C.; Peck, E.A.; Vining, G.G. Introduction to Linear Regression Analysis, 6th ed.; Wiley Series in Probability and Mathematical Statistics; Wiley: New York, NY, USA, 2021. [Google Scholar]
  49. Roland. Zenbeats. 2019. Available online: https://www.roland.com/global/products/rc_zenbeats/ (accessed on 16 March 2025).
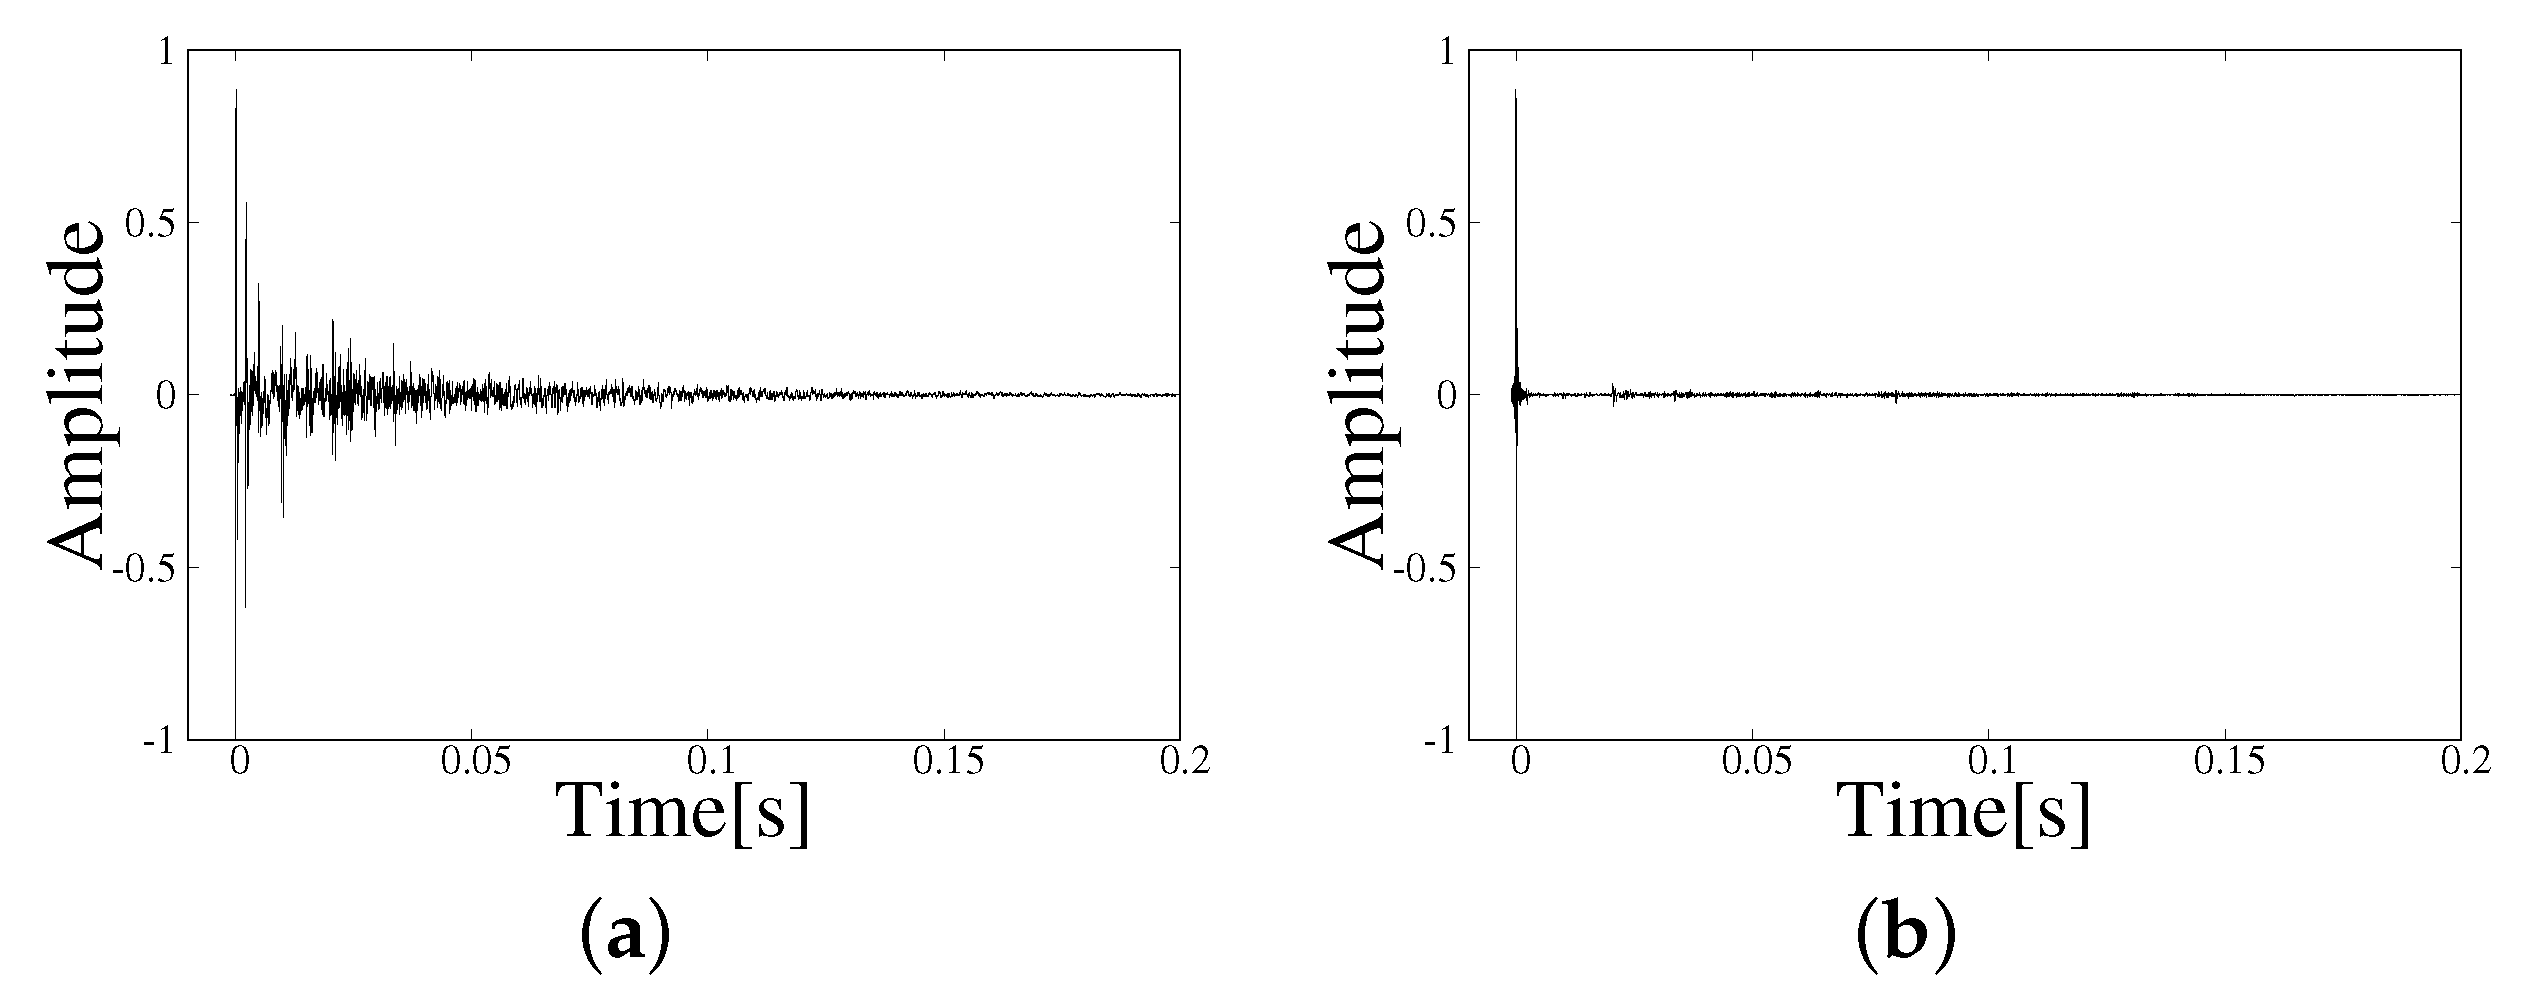
Figure 1. Waveforms of RIRs in the living room ( T 60 = 380 ms). (a) Using a conventional loudspeaker (DRR: 2.2 dB). (b) Using a PAL (DRR: 16.2 dB).
Applsci 15 03744 g001
Figure 2. Overview of the conventional method.
Applsci 15 03744 g002
Figure 3. Overview of the proposed method with four pairs of PALs and loudspeakers.
Applsci 15 03744 g003
Figure 4. Overview of front area output signal design in the proposed method.
Applsci 15 03744 g004
Figure 5. Weighting functions in the proposed method. (a) Living room ( d = 2.0 m, T 60 = 380 ms). (b) Live studio ( d = 1.5 m, T 60 = 765 ms).
Applsci 15 03744 g005
Figure 6. DRRs for the real sound source, the conventional method, and the proposed method. (a) Living room ( d = 2.0 m, T 60 = 380 ms). (b) Live studio ( d = 1.5 m, T 60 = 765 ms).
Applsci 15 03744 g006
Figure 7. Experimental arrangement for the real sound source (loudspeaker) in the subjective evaluation. (a) Living room ( d = 2.0 m, T 60 = 380 ms). (b) Live studio ( d = 1.5 m, T 60 = 765 ms).
Applsci 15 03744 g007
Figure 8. Experimental arrangement for the conventional and proposed methods in the subjective evaluation. (a) Living room ( d = 2.0 m, T 60 = 380 ms). (b) Live studio ( d = 1.5 m, T 60 = 765 ms).
Applsci 15 03744 g008
Figure 9. Experimental scene for subjective evaluation. (a) Living room ( d = 2.0 m, T 60 = 380 ms). (b) Live studio ( d = 1.5 m, T 60 = 765 ms).
Applsci 15 03744 g009
Figure 10. Waveform and specrrum of the generated dry sound souce.
Applsci 15 03744 g010
Figure 11. Frequency distribution of answers for distance in the living room.
Applsci 15 03744 g011
Figure 12. Frequency distribution of answers for distance in the live studio.
Applsci 15 03744 g012
Figure 13. Correct answer rate for distance.
Applsci 15 03744 g013
Figure 14. Frequency distribution of answers with direction in the living room.
Applsci 15 03744 g014
Figure 15. Frequency distribution of answers with direction in the live studio.
Applsci 15 03744 g015
Figure 16. Correct answer rate for direction.
Applsci 15 03744 g016
Table 1. Experimental equipment.
PALMITSUBISHI ELECTRIC ENGINEERING in Tokyo, Japan,
MSP-50E
Conventional loudspeakerELAC in Kiel, Germany, BS302
Power amplifierYAMAHA in Shizuoka, Japan, XM4180
MicrophoneSENNHEISER in Wedemark, Germany, MKH8020
A/D, D/A converterRME in Haimhausen, Germany, Fireface UFX II
Living room15,808, Building 15, Osaka Sangyo University in Osaka, Japan
Live studio17,104, Building 17, Osaka Sangyo University in Osaka, Japan
Table 2. Experimental conditions.
Reverberation timeLiving room: T 60 = 380 ms
Live studio: T 60 = 765 ms
Sampling frequency96 kHz
Quantization16 bits
Table 3. Experimental conditions for the PAL.
Carrier frequency40 kHz
Modulation methodAM-DSB
Table 4. Parameters for correction function.
Living RoomLive Studio
α 2.702.75
β 0.120.17
Disclaimer/Publisher’s Note: The statements, opinions and data contained in all publications are solely those of the individual author(s) and contributor(s) and not of MDPI and/or the editor(s). MDPI and/or the editor(s) disclaim responsibility for any injury to people or property resulting from any ideas, methods, instructions or products referred to in the content.