Abstract
This paper proposes a novel receiver coil configuration referred to as the Vertical Coil (VC), which substantially improves energy transfer efficiency in Dynamic Wireless Power Transfer (DWPT) systems for electric vehicles (EVs). Unlike the commonly used horizontally oriented coil layout (DDQ), the VC design employs multiple coils wound vertically around a ferrite core, thereby capturing magnetic flux more effectively over an extended spatial range. Through comprehensive simulations on full-scale models and corroborating small bench model experiments, we demonstrate that the VC configuration not only achieves a higher peak efficiency exceeding 90% but also widens the efficient power transfer zone by approximately 50% compared to DDQ. This broader coverage translates into an overall energy capture increase of more than 50% during a full pass of the vehicle over the transmitter coils, a significant step toward facilitating the implementation of DWPT technology. While mutual coupling among the VC coils can alter the system’s resonance frequency, our results confirm that this effect does not impede the VC’s superior energy transfer performance. Consequently, the new VC receiver design offers a promising pathway for advancing DWPT technology for reducing EV battery size and extending driving range.
1. Introduction
While electric vehicles (EVs) are being promoted as the mode of transportation of the future, the conventional model of battery-powered EVs faces numerous challenges which impact both the environment and the energy ecosystem. Specifically, the substantial size and weight of batteries needed for long-distance travel pose significant environmental risks. The batteries, due to their capacity, contribute to considerable CO2 emissions during manufacturing, involve the use of non-renewable resources such as lithium, and generate a large quantity of hazardous waste when they reach the end of their life cycle. Furthermore, the weight of the batteries, sometimes constituting up to half of an EV’s total mass, reduces the vehicle’s energy efficiency. Therefore, the ability to reduce battery size and weight would result in a significant positive impact on the EV industry and market.
Another critical issue is the slow charging process of EVs compared to refueling traditional combustion engine vehicles. The expectation for quick refueling is not being met by current fast-charging technology, which still has a long way to go. Additionally, the existing infrastructure for charging stations is considerably behind that of gasoline stations, making long-distance travel with EVs impractical. Moreover, EV charging, and in particular high-power fast-charging, demands a large amount of electrical power [1]. This surge in demand can strain the electrical grids of densely populated areas, potentially rendering EV charging unfeasible as the population of EVs grows.
Wireless Power Transfer (WPT) technology offers a more user-friendly approach to charging electric vehicles (EVs), i.e., charging in convenient locations, such as designated parking spots [2]. Dynamic Wireless Power Transfer (DWPT) technology presents a further revolutionary step by allowing EVs to charge while in motion, which could dramatically reduce the need for large and heavy on-board batteries. This innovation carries the potential to achieve an essentially unlimited driving range, with the vehicle’s battery primarily serving to support brief diversions from equipped roads. The adoption of DWPT could lead to a leap in energy efficiency for EVs, both in terms of operational energy use and the environmental impact of battery production. With smaller batteries, DWPT systems significantly cut down on CO2 emissions [3], reduce the generation of hazardous waste at the end of the battery’s life [4], and save energy given the reduced weight of the EV [5]. The efficiency of energy transfer between the road and the EV is a significant issue. The EV–road infrastructure requirements dictate distances on the order of tens of centimeters between the transmitting and receiving coils (see an example in [6]). Therefore, WPT’s reliance on electromagnetic coupling, which sees a dramatic reduction in energy transfer efficiency with distance, presents technical hurdles. While WPT can somewhat mitigate this using retractable receiver coils during stationary charging, such a solution is not feasible for DWPT during driving due to vehicle clearance regulations. The dynamic interaction between the road-embedded transmitting coils and the receiver coils attached to the moving vehicle’s chassis in DWPT systems also requires careful consideration, given the variable coupling efficiency as the vehicle moves. Most important technology-related questions may be summarized under the umbrella of energy transfer efficiency. It is therefore a worldwide endeavor to achieve the highest efficiency possible.
Figure 1 schematically illustrates the commonly used coil configuration for DWPT. More coil layout configurations with their cons and pros are reviewed in the full thesis manuscript presented in [7]. While several studies show that circular transmitter and receiver coils may exhibit a higher efficiency than rectangular coils [8], in this work we focus on the bipolar rectangular coil transmitter coil layout, which is already in use in DWPT pilot projects worldwide [9]. The design of the upper set of coils, the receiver, is known as “DDQ”, named after its geometric arrangement, which consists of two “D”-shaped coils positioned side by side (DD) and a third coil placed above them (Q). This configuration follows the same principles for collecting magnetic flux lines as observed in other works that utilize similar designs [10,11,12,13]. All three coils are positioned horizontally (i.e., the coil plane is parallel to the road), with a ferrite plate situated above the coils. Ferrite serves to divert the magnetic flux lines and increase the total magnetic flux lines that cross the coils. It is also uses as a magnetic screen, as it significantly reduces the magnetic flux above it, at the EV floor height.
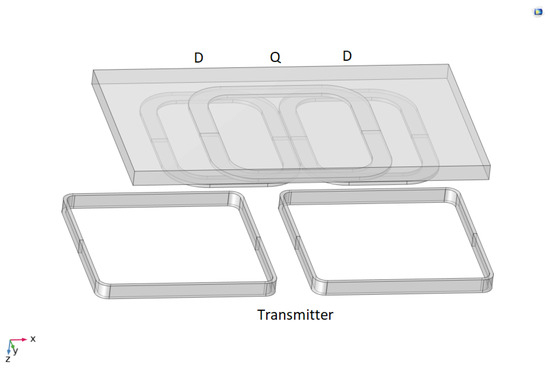
Figure 1.
Typical transmitter (lower coils) and DDQ receiver coils configuration.
Figure 2 displays the magnetic field intensity distribution generated by the transmitter coils. These coils (shown in the bottom part of Figure 1 and Figure 2) are connected in series in a bi-polar orientation. Therefore, the flux lines generated in one polarity in one coil are closed in reversed polarity through the other. As seen in Figure 2, the flux lines arrive at the receiving coils’ height at a low angle, and the ferrite deflects them to increase the angle. As a result, an increased electromagnetic coupling coefficient between the transmitter and receiver coils is achieved, increasing energy transfer efficiency to about 80% [14]. However, a larger angle seems desirable for further efficiency improvement. Therefore, the goal of the present work is to suggest a new coil configuration to achieve even higher efficiency levels. To achieve this, we propose a configuration which we name “Vertical Coils” (VCs). As displayed in Figure 3, multiple receiving coils are wound around a ferrite core, making the ferrite the central element. Since the ferrite concentrates the magnetic flux lines therein and orients them in an angle close to perpendicular to the receiver coils, we prove that this new configuration results in higher voltage output and increased overall efficiency.
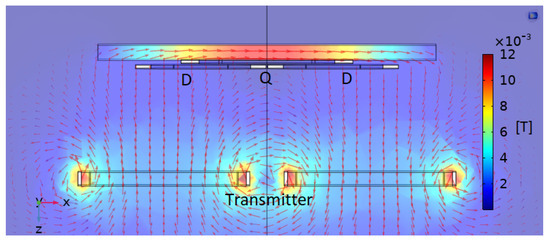
Figure 2.
Side view of magnetic field lines logarithmic distribution. Colors represent magnetic field intensity [T].
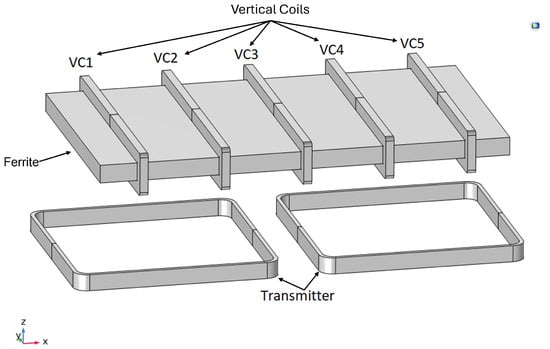
Figure 3.
VC geometric model. VC 1 to VC 5 are the vertical coils.
The idea of rotating the receiver coil plane, from near parallel to near vertical to the flux line direction, seems trivial for improving voltage pickup and energy transfer. The main reason why such a design was not adopted is the clear space requirement between the EV chassis and the road. As this implies a tradeoff between coil plane angle and its cross-section, the VC configuration would require smaller coil area due to this clearance limit. An increase in the plane angle dictates a decrease in cross-section and vice versa. In this work, we show, both in simulations and experimentally, that the insertion of the ferrite plate to serve as a magnetic core for the receiver coils tips the scale in favor of this innovative design. Upon operating in the low B(H) curve regime of the ferrite, its high permeability compensates for the loss in cross-section area. Furthermore, the number of vertical coils can vary and increase as desired. Finally, one may add to the design another set of vertical coils, perpendicular to the set shown in Figure 4 and oriented with its long dimension parallel to the direction of motion. Such coils would pick up residual magnetic flux lines in the transverse direction. In the following, we examine a case study for the VC design composed of five equally distributed coils and compare it to the DDQ design. Once we establish a match in the small-scale model, we can confidently assert that constructing the large-scale model will follow the same principles as outlined in the simulations. Further studies will be required to optimize the VC design for number of coils, turns, spacing, etc.
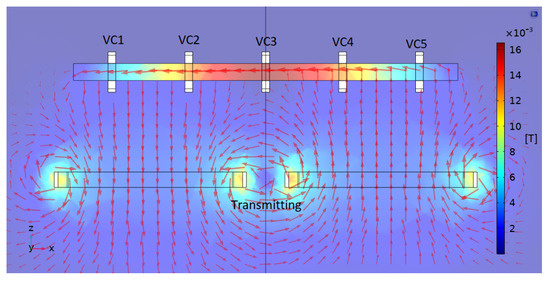
Figure 4.
VC magnetic field density logarithmic distribution. Colors represent magnetic field intensity [T].
In the subsequent section, we begin by simulating the full-size receiver layout to understand its behavior. Following this, we simulate, design, construct, and experimentally validate a small-scale laboratory model. Through this process, we demonstrate the feasibility of the VC configuration and its potential to achieve significantly higher energy transfer efficiency compared to the DDQ approach.
2. Methodology
Electromagnetic and electric simulations were performed using COMSOL 6.2 and LTspice software version 24.1.4. COMSOL is a finite element simulation program that divides a geometric model into a mesh of spatial elements and solves partial differential equations (PDEs) in the electromagnetic field [15]. In our COMSOL model, we imposed magnetic insulation on the sphere (world) and initialized Ampere’s Law on the world, while also applying Ampere’s Law with the B–H curve formulation to the ferrite core. To each coil, we generated a ramp-up wave separately at each measured location. The mesh consists of 775,046 domain elements, 15,602 boundary elements, and 3286 edge elements using the Free Tetrahedral option. In the study, we employed a sweep on the location along the x-axis, combined with a Coil Geometry Analysis and a Time-Dependent solver. LTspice is a software tool used to simulate electrical circuits [16]. Using COMSOL and the method described in [17], we were able to extract the coupling coefficients between the transmitting coils and each of the receiving coils. These coupling values were then incorporated into LTspice to simulate the electrical circuit. Using the results, we calculated both the input and output power to estimate the efficiency of the system. We then changed the output values based on the location of each receiving coil, allowing us to calculate the efficiency relative to the position of each coil. Measurements of the lab-scaled models were performed utilizing an HP 8904A synthesizer to excite the transmitting coils. An amplifier was added to allow sufficient voltage to activate the rectifying circuit. Measurements of the resonance frequency of the system were conducted using Keysight Vector Network Analyzer (VNA) [18]. The VNA applies power at varying frequencies to the system and measures the output across the frequency spectrum. By analyzing the power level as a function of frequency, we can determine the efficiency of the power transfer at each frequency. The resonance frequency is identified as the point at which the system achieves maximum power transfer, indicated by the peak in the measured spectrum. Ferrite materials are widely used in wireless power transfer systems due to their high magnetic permeability and low magnetic losses. In this work, we used a stack of 56 × 100 × 1.1 mm3 ferrite plates with magnetic characteristics described in ref. [19]. To facilitate the relative movement of the transmitting and receiving coils with respect to each other, we printed the 3D rail system displayed in Figure 5 [20]. This setup allows position adjustments of the transmitter coils relative to the receiver coils, which remain position-fixed. The electronic box depicted in Figure 5 contains the simple elements used to form the circuit on the receiving side displayed in Figure 6. For each vertical coil, a capacitor of 150 nF is connected to the coil in series. Then, a rectifying bridge continues to carry a resistor load of 0.1 Ω. The BNC ports shown in Figure 5 enable for each VC circuit measurements of the coil, capacitor, and load voltage waveforms. Of course, the same values of inductance, capacitance, and load resistor were used both for the simulations and experiments. For the large VC models, capacitor values of 13.3 nF were used in the simulations to maintain the same resonance frequency with coils of higher inductance.
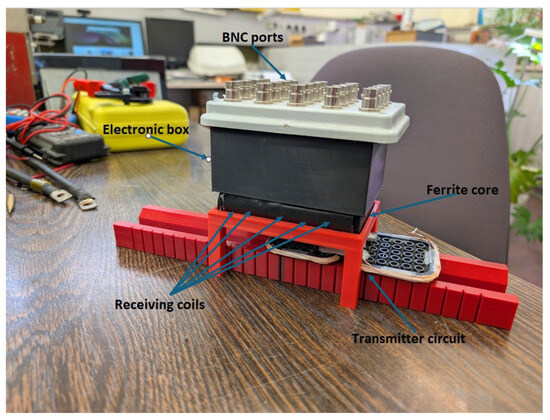
Figure 5.
Experimental setup of lab model.
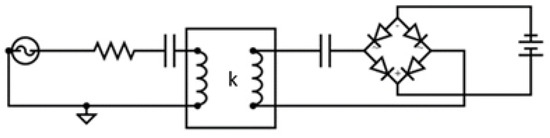
Figure 6.
Scheme of basic WPT system.
We began by simulating full-scale models of the DDQ and VC receiver layout. We then continued to simulate and experimentally measure small, lab-scale models of both. In verifying that for the reduced-size models, simulations and experiments are in accordance, we can deduce that one may rely on simulation results for the full-scale designs. The dimensions used for all models are summarized in Table 1. The overall dimensions of the VC large model are 125 × 50 × 10, whereas the DDQ large model measures 125 × 40 × 8.

Table 1.
Dimensions of DDQ and VC simulated and lab models.
3. Results
Figure 6 presents a simple scheme of a wireless power transfer (WPT) system that operates using resonant coupling between two inductive coils. The AC voltage source generates an alternating current which flows through a series RLC circuit. The resistor accounts for potential losses in the circuit, while the inductance stands for the transmitting coils and the capacitance is added to achieve resonance conditions at the pre-defined frequency. In the VC design, the secondary circuit is replicated for each vertical coil, five in the case presented in this work. For simplicity, Figure 6 displays only one secondary coil and the symbol denotes the coupling coefficient between the VC and the transmitter coils.
The voltage induced in the secondary coil passes through another capacitor, which further tunes the receiving side to the same resonant frequency as the transmitter. This resonance allows for maximum power transfer efficiency between the coils. The alternating current induced in the receiving coil then enters a full-bridge rectifier, which converts the AC power from the coil into direct current (DC) to charge the EV battery via a DC capacitor link.
To measure the efficiency, we calculate the power at both the transmitting and receiving sides of the system. We determined the power by using Equation (1) using the time-dependent voltage/current of the source or the receiving end:
The system’s efficiency is defined as the following ratio:
When the receiver coils layout passes above the transmitter, the coupling allows for an efficient energy transfer. At resonance, the impedance is minimized; hence, the current is maximized and the induced voltage at the receiver end supports an optimized charging procedure of the battery.
The proposed VC configuration includes one pair of transmitting coils and five receiving coils, resulting in a complex matrix of coupling interactions among the coils. This is because the coupling occurs not only between the transmitting coil and each receiving coil but also among the receiving coils themselves. Each coil is influenced by the magnetic fields generated by all other coils, leading to mutual-inductance effects across the entire system.
The values of the self-inductance, mutual-inductance, and coupling coefficients are influenced by the geometric properties of the coils and their position in space. This means that at each specific location, the values between the transmitting coil and each of the receiving coils will vary, reflecting changes in their relative positions and distances.
To generate the matrix of values at each position, we applied the method suggested in [17]. For each coil, we simulate a constant current ramp rate and then the voltage at each of the other coils.
We then calculate the mutual-inductance between the coils according to Equation (3):
The coupling coefficient is then calculated using Equation (4):
In Table 2 and Table 3, columns and rows 2–6 represent the five receiving coils in the full-scale VC system, respectively, while column and row 7 represent the transmitting coils. The cell values in Table 2 give the inductance in µH units. The diagonal represents the self-inductance of each VC coil and the rest of the cells exhibit the mutual-inductance values between pairs of VC coils. Similarly, Table 3 displays the coupling coefficients for the set of VC coils. As expected, VC 3, which is right on top of the center of the transmitting coils, presents the highest coupling between a receiver coil and the transmitter, 0.105. VC 1 and 2 are far apart from the axis of symmetry and, hence, have lower k values. Since the magnetic field drops sharply as one moves away from the center, the k values drop dramatically and it is clearly seen that the reduction in k of VC 1 to VC 2 is larger than that of VC 2 to VC 3. VC 4 and VC 5 show a symmetric behavior with symmetric k-values. In the same way, Table 4 and Table 5 display the inductance and coupling values of the DDQ layout in the same way. Columns and rows 2–3 correspond to the DD and Q coils, respectively, and column and row 4 represent the transmitting side in the DDQ system. Here, since coil Q is positioned at the center of symmetry, its coupling with the transmitter coils is negligible. At this position, the DD coils only contribute to energy transfer with a maximum value of k of 0.081. Table 3 and Table 4 demonstrate that for the “0” position (when the centers of transmitting and receiving coils overlap), the VC design exhibits higher k values than the DDQ. Not only is the center coil VC 1 k higher by almost 30% than the DD k, but all other VC coils also participate and contribute while the Q coil in the DDQ configuration does not. This situation may change with position and therefore, for each position, a new table was generated, and these values were then incorporated into the LTspice calculations. This approach allowed us to account for the variations in the coupling coefficients between the transmitting and receiving coils as their relative positions shifted. Although this method provides a discrete solution for the dynamic transition of the EV above the transmission coils, we use it as an approximation for a continuous dynamic pass.
Table 2.
VC mutual-inductance [μH] matrix at 0 position (large model—transmitter and receiver’s center overlap).
Table 3.
VC coupling matrix at 0 position (large model—transmitter and receiver’s center overlap).
Table 4.
DDQ mutual-inductance [μH] matrix at 0 position (transmitter and receiver’s center overlap).
Table 5.
DDQ coupling matrix at 0 position (transmitter and receiver’s center overlap).
One might initially assume that if we know the coupling coefficient at the 0 position for one vertical coil, the same value will apply to any other coil when it is located at the 0 position. However, the non-linear nature of the ferrite complicates this situation. Due to demagnetization effects, the local permeability of the ferrite plate varies with the distance from its edges; hence, the magnetic field intensity is inhomogeneous throughout its cross-section. A vertical coil wound around the central cross-section would experience a higher field intensity than a coil wound near the edge. As a result, k values at the position 0 differ between the VCs, however symmetric around the center coil. The non-linear nature of the B-H curve makes it even more complex since the permeability, µ, and therefore k, become dependent on the amplitude of the current of the transmitter coils. In this work, we have set the current in the current source to 50 A and the resonance circuit to maintain operation in the linear section of the B-H curve. For simplicity, in this proof of concept study, the capacitors for each of the VC coils were selected at the zero position taking into account the self-inductance values only. The calculated efficiency of both the DDQ and VC configurations is displayed in Figure 7. For the DDQ, the efficiency peaks at around 85% and remains relatively flat at approximately 80%, between positions of −50 cm and 50 cm. Beyond this range, efficiency drops sharply over the next 50 cm on either side, eventually reaching nearly 0%. This behavior indicates that the DDQ system charges the vehicle over about 200 cm. However, the most effective charging occurs within the central 100 cm. In the VC configuration, the maximum efficiency reaches approximately 93%. The graph reveals four distinct peaks: two central peaks reaching 93% efficiency, and two edge peaks reaching 66% efficiency. The most effective charging range spans between −40 cm and 40 cm. In addition, there are significant efficient regions from −110 cm to −70 cm and from 70 cm to 110 cm, although these are less efficient compared to the central region. Beyond these points, the efficiency declines, reaching nearly 0% at −150 cm and 150 cm. While the highest efficiency of the VC is still concentrated around the central region, it exhibits efficient energy transfer over a broader range than the DDQ configuration, with substantial but lower efficiency zones extending towards the edges. The reason why the VC configuration has a wider range of efficiency is due to the way the magnetic flux lines interact with the receiving coils. The presence of a ferromagnetic core alters the direction of the magnetic field lines. In the VC configuration, these lines run horizontally through the ferrite, meaning that receiving coils perpendicular to these lines pick up of more flux over a greater distance. This ability to collect flux more effectively over a wider area is a key advantage of the VC method compared to the DDQ method.
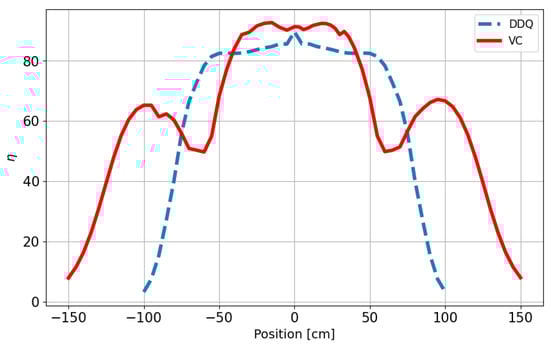
Figure 7.
Simulation results of the energy transfer efficiency in the DDQ (blue curve) and the VC (red) models.
When an EV passes above the transmitter, the total amount of energy transferred to its receiver would be equivalent to the area below the efficiency curve multiplied by the time duration of the pass and the power of the source. In Figure 7, the ratio of the area below the curves of the VC to the DDQ is 1.54. This means that the VC receiver would harvest 54% more energy from the source during a full pass than the DDQ receiver, hence the importance of the expansion of the efficiency curve. The fluctuations observed in the efficiency graph are not of significant concern. While it is, of course, preferable to avoid any “dips” in the graph, the primary objective is to maximize the area under the curve, as this corresponds to greater energy transfer. The consistency of the graph is secondary to achieving this goal, and we have successfully fulfilled that aim.
To experimentally validate these results, we scaled down both models to bench-top dimensions which could be easily measured in the lab. We then simulated, constructed, and measured the smaller models to show that the results of the simulations and the actual models were in accordance. The dimensions of the VC and DDQ scaled-down models are displayed in Table 1. Some of the dimensions were dictated by the dimensions of the readily available hardware, such as the ferrite plates. Although far from optimal, these models enabled us to examine the agreement between simulation and experiment results.
For simplicity, we focus here on the results of the VC scaled-down model which are presented in Figure 8. The solid curve, presenting the simulated efficiency, exhibits two distinct peaks and two mid-level peaks. The VC graph spans a range from −15 to 15 cm (the transmitter coils span from −5.5 to 5.5 cm; see Table 1). This indicates that even when the device is not positioned directly above the transmitting coils, it still picks up magnetic flux and receives energy. The experimental results, displayed as dots in the figure, agree with the simulated results in their main findings: the figure displays two distinct high peaks and two mid-level peaks and it spans over the same position range. However, there are differences in the locations of these peaks and in their values, and the measured efficiency is lower around the center and higher outwards than the simulated values. The quantitative discrepancies between the simulation and the measurements may be attributed to several factors: imperfection in coil positioning, the use of a stack of thin ferrite plates instead of the simulated bulk, variance between the simulated and actual B(H) curve of the material, variations in the actual values of the electric circuit components, and variations in the resonance frequencies. All may lead to symmetry breaking and changes in the measured values. Still, as the experiment and simulations describe the same qualitative features, we assume that the simulations may be relied upon. The results from a scaled-down DDQ lab model, which exhibit similar qualitative agreements and quantitative discrepancies between simulations and experiments, further support the reliability of the simulations for studying receiver configurations. These results are not presented here.
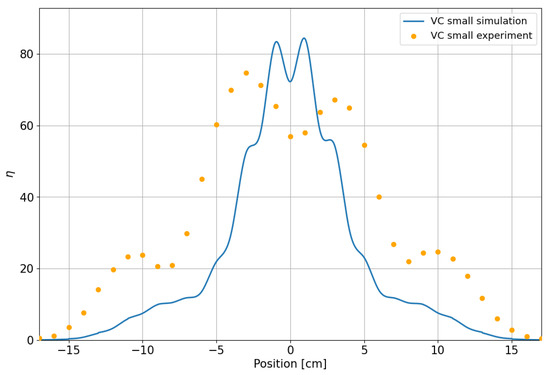
Figure 8.
Energy transfer efficiency in the small VC mode. Blue curve: simulation results. Yellow dots: measurement results.
In the following, we describe measurements of the resonance frequency. The transmitter and VC resonance circuit configurations were designed to operate at 85 kHz, within the standard frequency range of DWPT for EV applications. The capacitor for each VC circuit was selected to achieve a resonance frequency of 85 kHz for the self-inductance of each VC coil. However, as seen in Figure 9, VNA measurements of the power that returns to the source (S11) in the transmitter circuit reveal a drop in impedance (peak in transmission) at 55.5 kHz, as we can see in Figure 10. Measurements of the power absorbed by the VC circuits (S21) show a distribution of resonance frequencies, with VC 1, 2, 4 and 5 resonating at 55.5 kHz, while coil 3 resonates at 60 kHz. These measurements do not fully represent the actual operation of the charging process. Since the power of the VNA is insufficient for providing the voltage required for activating the rectifying circuits, we were forced to short-circuit the other VC circuits every time a specific VC circuit was measured. In such a case, each coil “sees” all others and its induced current flows so as to cancel the change in flux in the others. The problem becomes a coupled set of resonators which requires special optimization [21] to be performed in future studies. As a result, each coil inductance is practically enhanced by this mutual-inductance. For a given capacitor, this increase in inductance reduces the resonance frequency, in accordance with our findings. Although this effect of the mutual VC coupling is less pronounced in the actual operation, we intend to extend this work to include the effect of the mutual inductance in the design so that the resonance frequency is brought back to the desired range. We also expect to achieve a better quantitative match between the simulation and the experimental results. The low Q-factor, defined as f/Δf, can be extracted from Figure 9 and Figure 10. These values are low (on the order of 10) and result from the self-inductance of the small VC model’s coil being approximately two orders of magnitude smaller than those presented in Table 2 for the full-scale model. The load resistor was kept at 0.1 Ω for both VC models. Significantly higher Q-factor values, around 850, are expected for the full-scale VC model.
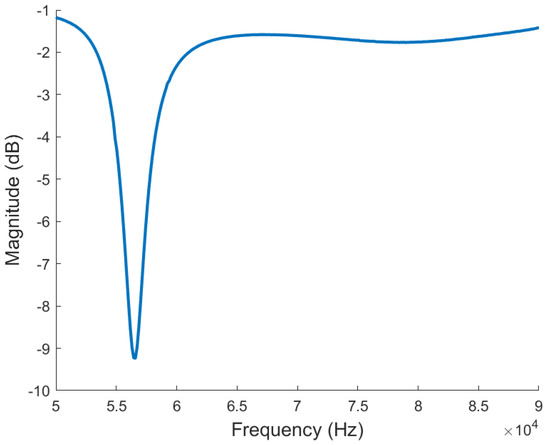
Figure 9.
Frequency−dependent returning power (S11) in the transmitter for the VC lab model.
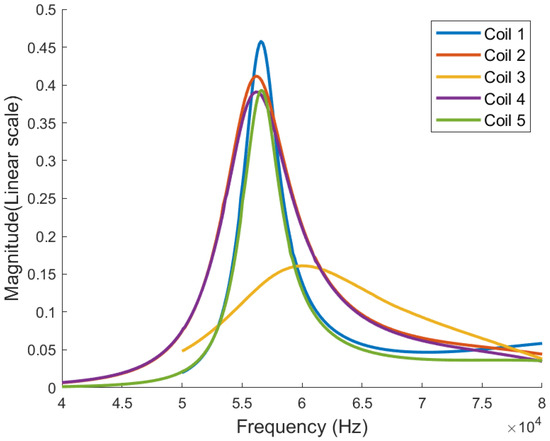
Figure 10.
Frequency−dependent transmitted power (S21) in the receivers for the VC lab model.
4. Conclusions
We proposed a new receiving coil configuration for use in Dynamic Wireless Power Transfer (DWPT) systems. The configuration utilizes multiple vertical coils (VCs) wound around a ferrite core, in contrast to the conventional DDQ coils mounted horizontally beneath a ferrite core. The required clearance between the EV and the road necessitates a small cross-section for the design of the vertical coils. However, our suggested VC design utilizes the ferrite core to align and concentrate the magnetic field lines so that the net flux captured by the VC coils results in a potential for better energy transfer efficiency, in comparison to the DDQ configuration. The VC configuration may include any number of coils, each operating at resonance frequency and connected to its separate rectifying circuit. Another set of VC coils, perpendicular to the set proposed here and directed with its long axis pointing at the direction of motion, may be also added to support pickup in a transverse direction. The VC design has the potential to improve the overall energy transmission efficiency in DWPT transmitter–receiver systems.
We simulated an actual scale model of this new configuration and analyzed the energy transfer efficiency versus receiver location. We performed the same analysis for the DDQ configuration of a similar scale and compared both performances. We then simulated and constructed small-scale models of both configurations and tested their energy transfer efficiency experimentally.
Key findings are that the VC configuration not only results in a higher peak efficiency when the receiver is right above the transmitter, but also spans a larger range of efficient energy transfer. For a full pass of the receiver above the transmitter, the VC receiver starts receiving energy sooner than the DDQ receiver and stops receiving it later, resulting in an effective range almost 50% wider than the DDQ receiver. Assuming the same velocity of crossing in both cases, the total energy transfer, reflected by the area beneath the position-dependent efficiency, would be over 50% higher in the VC receiver. The VC bench-model realized and tested in the lab showed a qualitative agreement between the experiment and the simulations. The efficiency curve’s main features and the significant widening of the curve were observed. However, quantitatively, there is room for improvement. VNA measurements imply that mutual-inductance between the VCs themselves plays a key role and shifts the resonance frequency from the designed value. Further study is required to incorporate these mutual inductance effects into the simulation and improve the physical model accordingly. The next sizing and optimization steps will include variations in the number of vertical coils, VC spacing, number of turns, coil shape, core cross-section, additional transverse coils, and optimal operating point along the core’s B(H) curve. Varying such parameters may contribute to more magnetic flux pickup; however, it may also result in an increase in mutual coupling and complexity and an increase in the weight and cost of the receiver. Hence, careful step-by-step optimization is required.
The novel VC receiver configuration has the potential to show better performance and higher energy transfer efficiency in comparison with the DDQ configuration. We believe that with further optimization and research, the VC receiver may be used commercially with superior performance.
Author Contributions
Conceptualization, S.W. and Y.N.; methodology, I.G., Y.N. and S.W.; software, I.G.; validation, I.G., A.R. and Y.N.; formal analysis, I.G.; investigation, I.G., A.R., Y.N. and S.W.; resources, S.W.; data curation, I.G.; writing original draft preparation, I.G. and S.W.; writing—review and editing, I.G. and S.W.; visualization, I.G.; supervision, S.W.; project administration, S.W.; funding acquisition, S.W. All authors have read and agreed to the published version of the manuscript.
Funding
This research received no external funding.
Institutional Review Board Statement
Not applicable.
Informed Consent Statement
Not applicable.
Data Availability Statement
The original contributions presented in the study are included in the article; further inquiries can be directed to the corresponding author(s).
Conflicts of Interest
Author Yasha Nikulshin was employed by the company N.T. TAO Ltd. The remaining authors declare that the research was conducted in the absence of any commercial or financial relationships that could be construed as a potential conflict of interest.
References
- Guo, C.L.; Wu, L.; Wang, D.; Qi, W.B.; Xiao, X.N. Impact of electric vehicle charging on power grid. In Proceedings of the 2011 International Conference on Electrical and Control Engineering, Yi’chang, China, 16–18 September 2011; IEEE: New York, NY, USA, 2011; pp. 2270–2274. [Google Scholar] [CrossRef]
- Zhang, Z.; Pang, H.; Georgiadis, A.; Cecati, C. Wireless Power Transfer—An Overview. IEEE Trans. Ind. Electron. 2019, 66, 1044–1058. [Google Scholar] [CrossRef]
- Lazzeroni, P.; Cirimele, V.; Canova, A. Economic and environmental sustainability of Dynamic Wireless Power Transfer for electric vehicles supporting reduction of local air pollutant emissions. Renew. Sustain. Energy Rev. 2021, 138, 110537. [Google Scholar] [CrossRef]
- Dunn, J. Can EV Batteries Be Used Again? 2024. Available online: https://blog.ucsusa.org/jessica-dunn/can-ev-batteries-be-used-again/ (accessed on 13 January 2025).
- Abdullah. Dynamic Wireless Power Transfer for Moving EVs: A Revolutionary Approach. 2024. Available online: https://www.evmechanica.com/dynamic-wireless-power-transfer-for-moving-evs-a-revolutionary-approach/ (accessed on 13 January 2025).
- Council of the European Communities. Council Directive 87/403/EEC of 25 June 1987 supplementing Annex I to Directive 70/156/EEC on the approximation of the laws of the Member States relating to the type-approval of motor vehicles and their trailers. Off. J. Eur. Communities 1987, L220, 44–47. Available online: https://eur-lex.europa.eu/legal-content/EN/TXT/?uri=CELEX%3A31987L0403 (accessed on 13 March 2025).
- Garrofy, I. Optimization of Transmitting and Receiving Coils for Improved Energy Transfer Efficiency in Dynamic Wireless Electric Vehicle Charging Systems; Institute of Superconductivity: Ramat Gan, Israel, 2025. [Google Scholar]
- Stankiewicz, J.M. Evaluation of the Influence of the Load Resistance on Power and Efficiency in the Square and Circular Periodic WPT Systems. Energies 2023, 16, 2950. [Google Scholar] [CrossRef]
- Elctreon Ltd. How It Works. Available online: https://electreon.com/technology (accessed on 20 January 2025).
- Trung, N.K.; Diep, N.T. A Maximum Transfer Efficiency Tracking Method for Dynamic Wireless Charging Systems of Electric Vehicles. J. Electr. Comput. Eng. 2021, 2021, 1–10. [Google Scholar] [CrossRef]
- Shin, J.; Shin, S.; Kim, Y.; Ahn, S.; Lee, S.; Jung, G.; Jeon, S.J.; Cho, D.H. Design and Implementation of Shaped Magnetic-Resonance-Based Wireless Power Transfer System for Roadway-Powered Moving Electric Vehicles. IEEE Trans. Ind. Electron. 2014, 61, 1179–1192. [Google Scholar] [CrossRef]
- Deng, Z.; Hu, H.; Su, Y.; Chen, F.; Xiao, J.; Tang, C.; Lin, T. Design of a 60 kW EV Dynamic Wireless Power Transfer System with Dual Transmitters and Dual Receivers. IEEE J. Emerg. Sel. Top. Power Electron. 2023, 12, 316–327. [Google Scholar] [CrossRef]
- Su, Z.; Shi, Z.; Duan, Y.; Yu, M.; Hong, Y.; Xu, C. A Wide-Range Voltage Output WPT System with Dual Decoupled Transmitter Coils. In Proceedings of the 2022 IEEE 9th International Conference on Power Electronics Systems and Applications (PESA), Hong Kong, China, 20–22 September 2022; IEEE: New York, NY, USA, 2022; pp. 1–6. [Google Scholar] [CrossRef]
- Sahar, B. Effect of Coil Configuration on Dynamic Wireless Power Transfer for Electric Vehicle Applications; Institute of Superconductivity: Ramat Gan, Israel, 2021. [Google Scholar]
- COMSOL Multiphysics. 2024. Available online: https://www.comsol.com (accessed on 13 January 2025).
- LTspice. 2024. Available online: https://www.analog.com/en/design-center/design-tools-and-calculators/ltspice-simulator.html (accessed on 13 January 2025).
- Linden, J.; Nikulshin, Y.; Wolfus, S.; Rumbak, H.; Ezer, O.; Yeshurun, Y. Method for calculating coupling coefficients in dynamic energy transfer for electric vehicles. In Proceedings of the 2017 Electric Vehicles International Conference (EV), Bucharest, Romania, 5–6 October 2017; IEEE: New York, NY, USA, 2017; pp. 1–4. [Google Scholar] [CrossRef]
- KEYSIGHT. 2024. Available online: https://www.keysight.com/us/en/products/network-analyzers/streamline-series-usb-vector-network-analyzers.html (accessed on 13 January 2025).
- Laird. Parameters of Ferrite. 2024. Available online: https://www.laird.com/products/inductive-components-emc-components-and-ferrite-cores/ferrite-plates-and-disks/mp-series/mp3940-0m0 (accessed on 13 January 2025).
- SOLIDWORKS. 2024. Available online: https://www.solidworks.com (accessed on 13 January 2025).
- Niu, S.; Lyu, R.; Lyu, J.; Chau, K.; Liu, W.; Jian, L. Optimal Resonant Condition for Maximum Output Power in Tightly Coupled WPT Systems Considering Harmonics. IEEE Trans. Power Electron. 2025, 40, 152–156. [Google Scholar] [CrossRef]
Disclaimer/Publisher’s Note: The statements, opinions and data contained in all publications are solely those of the individual author(s) and contributor(s) and not of MDPI and/or the editor(s). MDPI and/or the editor(s) disclaim responsibility for any injury to people or property resulting from any ideas, methods, instructions or products referred to in the content. |
© 2025 by the authors. Licensee MDPI, Basel, Switzerland. This article is an open access article distributed under the terms and conditions of the Creative Commons Attribution (CC BY) license (https://creativecommons.org/licenses/by/4.0/).