Article

Research on Performance Predictive Model and Parameter Optimization of Pneumatic Drum Seed Metering Device Based on Backpropagation Neural Network

School of Mechanical Engineering, Zhejiang Sci-Tech University, Hangzhou 310018, China
*
Author to whom correspondence should be addressed.
Appl. Sci. 2025, 15(7), 3682; https://doi.org/10.3390/app15073682
Submission received: 24 January 2025 / Revised: 22 March 2025 / Accepted: 26 March 2025 / Published: 27 March 2025

Abstract

:
This innovative method improves the inefficient optimization of the parameters of a pneumatic drum seed metering device. The method applies a backpropagation neural network (BPNN) to establish a predictive model and multi-objective particle swarm optimization (MOPSO) to search for the optimal solution. Six types of small vegetable seeds were selected to conduct orthogonal experiments of seeding performance. The results were used to build a dataset for building a BPNN predictive model according to the inputs of the physical properties of the seed (thousand-grain weight, kernel density, sphericity, and geometric mean diameter) and the parameters of the device (vacuum pressure, drum rotational speed, and suction hole diameter). From this, the model output the seeding performance indices (the missing and reseeding indexes). The MOPSO algorithm uses the BPNN predictive model as a fitness function to search for the optimal solution for three types of seeds, and the optimized results were verified through bench experiments. The results show that the predicted qualified indices for tomato, pepper, and bok choi seeds are 85.50%, 85.52%, and 84.87%, respectively. All the absolute errors between the predicted and experimental results are less than 3%, indicating that the results are reliable and meet the requirements for efficient parameter optimization of a seed metering device.

1. Introduction

Seeds have a variety of shapes, such as spherical, cylindrical, ellipsoidal, rhombic, oval, and so on [1,2]. When it comes to various seed types with different shapes, mechanical seed metering devices, which are generally designed with shaped holes for a specific seed type, have difficulty ensuring the good seeding performance and low seed damage rate of the seed metering for each seed type. Pneumatic seed metering devices generally have the structure of suction holes and an air chamber, and a vacuum created in the air chamber generates a pressure difference across the suction holes, by which the seeds are adsorbed and seed filling is achieved. Therefore, without the constraint of the shaped holes, pneumatic seed metering devices are able to meter the seeds with different shapes at a low seed damage rate, exhibiting high general applicability [3,4,5].
Vegetable seeds exhibit a wide diversity of types and shapes [6]. Thus, the pneumatic seed metering devices are more suitable for the metering work of vegetable seeds. Based on this fact, considerable research has been conducted on the design and optimization of pneumatic seed metering devices for vegetable seeds. Using pelletized vegetable seeds as the object, Xu et al. [7] optimized the suction hole type and designed a seed unloading mechanism for an air–suction vegetable seed metering device to solve the instability of the seed adsorption caused by blockage of the suction hole, and carried out orthogonal experiments and regression analysis to optimize the seed-throwing angle, working speed, and negative pressure. In the subsequent research, Xu et al. [8] further carried out the structural design and parameter optimization to address the problem of missed seeding of the device, using pelletized Chinese flowering cabbage seeds as the object. They designed a seed spoon structure that can disturb the seed groups and endow the seeds with a certain initial speed during the seed filling phase, which reduces the seed groups’ interference and the difficulty of seed adsorption, and they optimized the parameters of the seed spoon and seed cleaning device, reducing the missing rate and increasing the single-seed rate of the device. Zhang et al. [9] designed a seed stirring strip structure for a vegetable pneumatic seed metering device, and three types of vegetable seeds with different shapes (Chinese flowering cabbage, radish, and pepper seeds) were used for the structural design and parameter optimization research to enhance the general applicability of the device. Nine groups of experiments and regression analysis were first conducted to optimize parameters of the seed stirring strip for each seed type. Under the optimized parameters of the seed stirring strip, another 17 groups of experiments and regression analysis were then carried out to optimize working parameters of the device for each seed type. The research results show that the seeding performance of the device was improved for each seed type, and its general applicability was enhanced. To reduce the reseeding index of a vegetable air–suction seed metering device, Yan et al. [10] designed a four-stage seed cleaning mechanism using Chinese cabbage seeds as the object, optimizing the working speed, negative pressure, and parameters of the seed cleaning mechanism through orthogonal experiments and regression analysis, by which the device achieved better seed cleaning and seeding performance.
The research mentioned above reveals that, currently, problems of hole blockage, missed seeding, and reseeding exist in the operation of pneumatic vegetable seed metering devices, which are solved mainly through structural design and parameter optimization. However, each of the existing optimization studies of pneumatic vegetable seed metering devices is merely conducted for a small number of types (usually 1–3 types [11,12,13,14,15]) of vegetable seeds, for which reason the optimization results may not be applicable to other types or shapes of vegetable seeds. The complicated and time-consuming process of optimization to be repeated to obtain the optimal parameters for new types and shapes of vegetable seeds will lead to extremely low research efficiency. Therefore, it is of great importance to improve the parameter optimization efficiency to fully utilize the characteristic of the high general applicability of the pneumatic seed metering devices, enabling them to better perform seed metering for more types of vegetable seeds.
Some research has been conducted on pneumatic seed metering devices for multiple types of seeds. Davut Karayel et al. [16] measured the surface area, thousand-grain weight, kernel density, and sphericity of seven types of seeds and determined the optimal vacuum pressure for each. Then, an artificial neural network was used to establish a predictive model with these physical properties as inputs and the optimal vacuum pressure as output. The model’s accuracy was 99%, indicating that the optimal vacuum pressure can be accurately predicted from a seed’s physical properties. Zahra et al. [17] measured the thousand-grain weight, projected area, sphericity, kernel density, and geometric mean diameter of seven types of seeds, and conducted performance experiments. A regression model was established using genetic programming, with the seed properties and the operational parameters of the device as inputs and the uniformity of seed spacing as output. The coefficient of determination (R2) of the model was 0.938, indicating that the model described the influence of these factors on the uniformity of seed spacing well. Davut Karayel and Zahra et al. both used physical properties of seeds as model inputs, establishing seeding performance models using machine learning methods with strong learning ability to handle the extremely intricate nonlinear problem for which the patterns are exceedingly difficult to obtain—the differences in the device’s seeding performance between different types of seeds. Inspired by their research, we take the concept of utilizing physical properties of seeds to represent seeds and application of machine learning methods as the key to improvement of parameter optimization efficiency. To be specific, we aim to employ machine learning methods to establish a seeding performance predictive model with both seed physical properties and parameters of the device as inputs. Thus, when physical properties of seeds in the model inputs are fixed as those of a specific seed, the seeding performance for the seed can be predicted by inputting parameters of the device into the model.
Machine learning methods, including artificial neural networks (ANNs), random forest (RF), adaptive boosting (AdaBoost), support vector regression (SVR), and extreme learning machine (ELM), have been used for parameter optimization modeling in the field of agriculture. In the studies [16,18,19] of seed metering devices, ANNs were used to establish seeding performance predictive models, which showed excellent predictive accuracy. The high learning and information-processing abilities of ANNs make them more suitable for complex nonlinear modeling [20], which leads to the decision of using ANN to establish a seeding performance predictive model in this study.
The optimal parameters must be searched from the established model by specific methods to achieve parameter optimization. Moreover, multi-objective methods are needed for problems with multiple objectives. Pareek [21] used the multi-objective particle swarm optimization (MOPSO) algorithm to optimize the qualified index and seed spacing variation index of a seed metering device; Yang [22] used the non-dominated sorting genetic algorithm II (NSGA-II) to optimize the residual stress and Vickers hardness of the WC-10Co-4Cr coating. Meta-heuristic search algorithms, such as MOPSO and NSGA-II, are widely used in multi-objective optimization. Compared to other multi-objective optimization algorithms, the MOPSO algorithm has fewer adjustment parameters, faster convergence speed, and uniform Pareto optimal frontier distribution [21], which is suitable for further parameter optimization study.
In this paper, nine types of vegetable seeds and a pneumatic drum seed metering device were taken as the research objects, and the research on the efficient parameter optimization of the device was carried out using the BPNN and MOPSO algorithms. This paper consists of three parts:
  • A discussion of the dataset required for ANN training and testing through seeding performance experiments;
  • An explanation of using the backpropagation neural network (BPNN) to establish a predictive model of seeding performance from the input physical properties of seeds (geometric mean diameter, sphericity, thousand-grain weight, and kernel density), operational parameters (vacuum pressure and drum rotational speed), and structural parameters (suction hole diameter), producing seeding performance indices (missing index and reseeding index);
  • A description of the efficient optimization method of the combination of the BPNN predictive model and MOPSO algorithm (BPNN-MOPSO) to search for optimal device parameters, with the lowest missing and reseeding indexes as the optimization objectives.

2. Materials and Methods

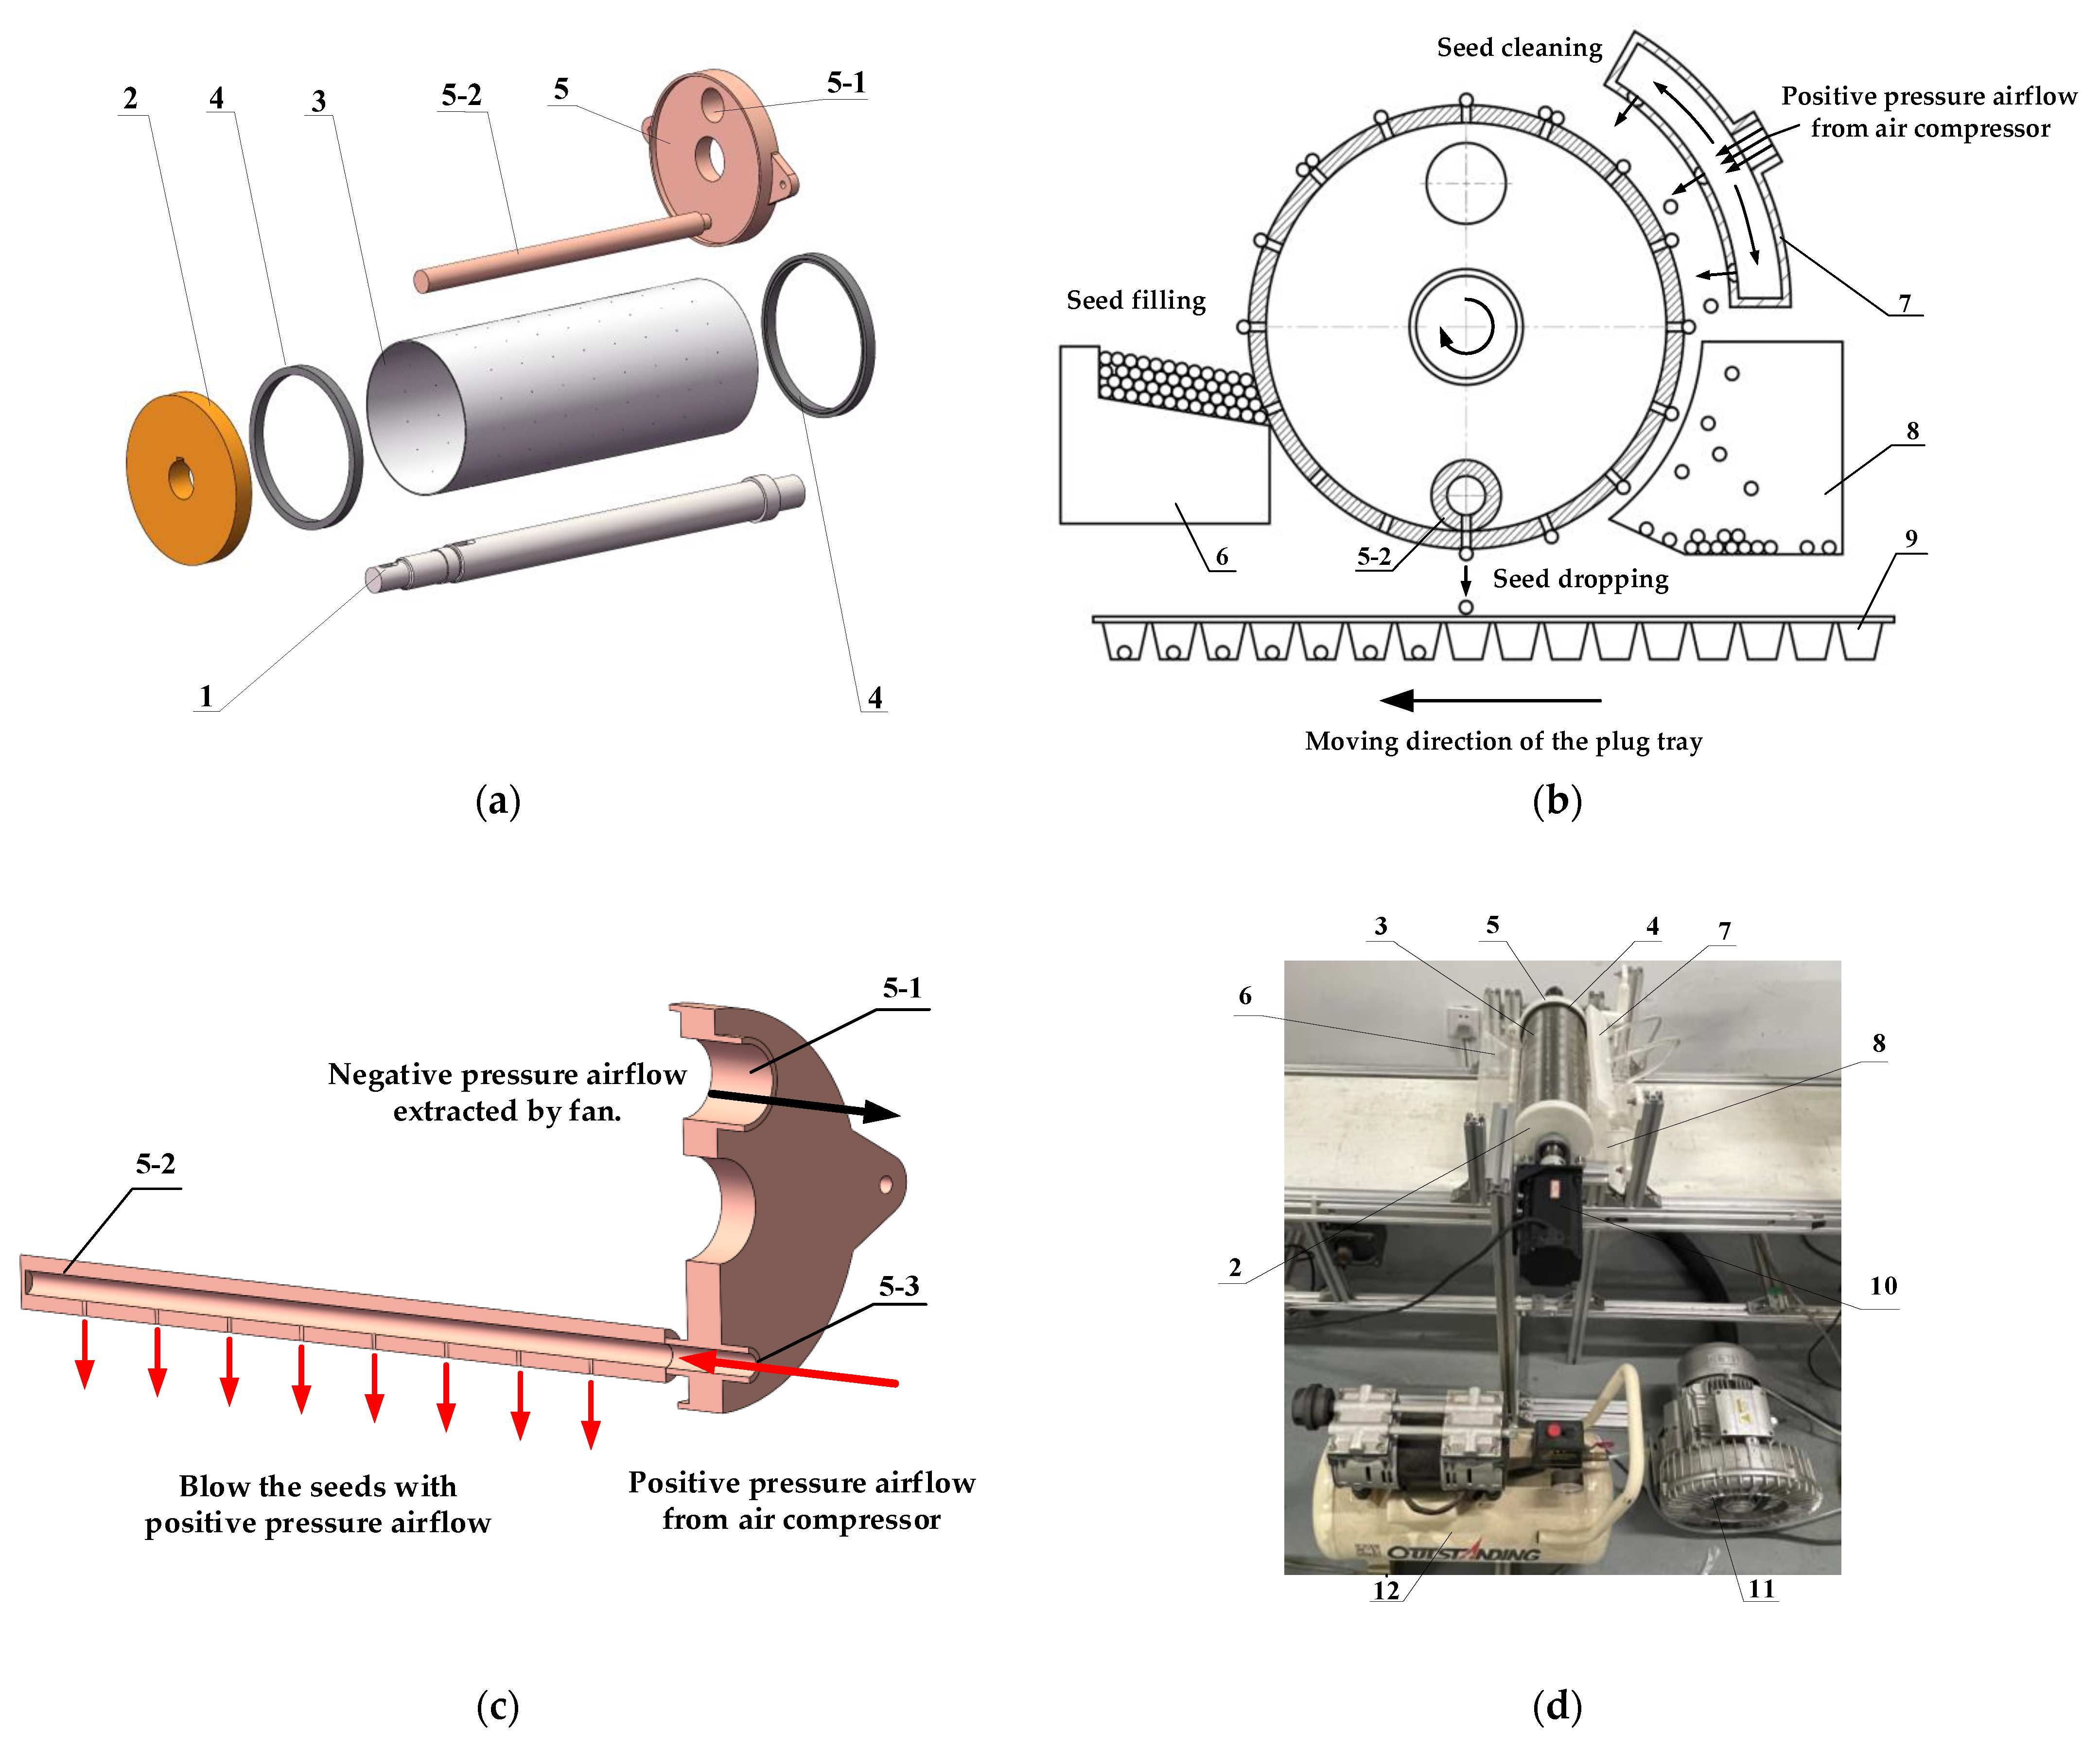
2.1. Overall Structure and Working Principle

Figure 1 shows the structure of the tested pneumatic drum seed metering device. The lugs at the ends fasten the air intake plate to the frame. One end of the drum is fitted with this plate to enable relative rotation, with the other embedded in the end cover and a rubber sealing ring at each end. The end cover is connected to the drive shaft with a flat key and transfers the shaft’s rotational motion. During the device’s operation, the air intake plate remains stationary, and the drive shaft drives the end cover, which in turn drives the drum to rotate.
We used a suction hole structure in the form of a seed suction nozzle with a conical flow channel inside, as shown in Figure 2. The seed suction nozzles were installed in the through holes processed on the surface of the drum.
Given the requirement for the drum’s operational linear speed to be below 0.35 m/s, its diameter was set at 120 mm after considering rotational speed and seeding efficiency. A 128-hole plug tray (8 × 16) was employed in the experiments of this study (as shown in Figure 3), so the number of axial suction hole rows of the drum was set to 8, which corresponds to the holes in the plug tray. The number of circumferential suction holes of the drum was set to 16 (evenly distributed at an interval of 22.5°), so that the 128-hole plug tray can be filled after one revolution of the drum.
As shown in Figure 1c, the air intake plate consists of three parts: negative pressure port, pressure isolation roller, and positive pressure port. The negative pressure port is connected to the fan, enabling the fan to exhaust air to create a vacuum inside the drum. The pressure isolation roller clings to the inner wall of the drum to isolate the vacuum pressure. The air outlets set below the roller correspond to the suction holes. The positive-pressure air flow from the air compressor enters the inner cavity of the roller through the positive pressure port and then is ejected through the air outlets, blowing off the seeds.
Figure 4 shows that the function unit of the seed cleaning device is equipped with three air inlets on its outer side. Eight rows of air outlets are evenly arranged on the inner side of the function unit, corresponding to the layout of the axial suction holes of the drum. The function unit is installed on the frame through the connecting piece to achieve fixation. As shown in Figure 1b, the positive-pressure air flow from the air compressor enters the inner cavity of the function unit through the air inlet and then is ejected from the air outlets, blowing off the extra seeds.
The working principle of the pneumatic drum seed metering device (as shown in Figure 1b): The fan exhausts air through the negative pressure port, creating a vacuum inside the drum. In the seed filling area, the pressure difference pulls seeds into moving suction holes as they pass the seed box. After finishing the seed filling, the drum carries the seeds into the seed cleaning area, where the extra seeds are removed under the effect of gravity and positive-pressure air flow from the seed cleaning device. Completing the seed cleaning, the drum with seeds enters the seed dropping area. When the drum rotates to the lowest point, the vacuum pressure is isolated by the pressure isolation roller, and the seeds fall into the plug tray under the effect of gravity and positive-pressure air flow from the pressure isolation roller.

2.2. Experimental Seeds and Physical Properties

Chinese cabbage (Beijingxin-III, MC ≤ 7.0%), carrot (Huangjian-I, MC ≤ 7.0%), sesame (Baizhi-II, MC ≤ 8.0%), onion (Zhongling Red Rose, MC ≤ 8.0%), cabbage (Jingfeng-I, MC ≤ 7.0%), radish (Jiujinwang, MC ≤ 8.0%), tomato (Laosharang, MC ≤ 7.0%), pepper (Hangjiao-I, MC ≤ 7.0%), and bok choi (Shanghaiqing 605, MC ≤ 7.0%) seeds were selected as experimental seeds in this study. The seed varieties and their moisture content (MC) have been indicated in the parentheses following the seed types. The first six types of seeds were used for the seeding performance experiments, and the last three types of seeds were used for the efficient parameter optimization and experimental verification.
For the establishment of the dataset required for network training, we measured four types of physical properties of the nine types of seeds, namely, the geometric mean diameter (Dg), sphericity (ϕ), thousand-grains weight (m1000), and kernel density (ρs). The length (L), width (W), and height (T) of the seeds were measured with an electronic vernier caliper (Yantai Greenery Tools Co., Ltd., Yantai, China); the data are shown in Table 1.
The thousand-grain weight of the seeds was measured with an electronic scale (Shenzhen CNW Electronics Co., Ltd., Shenzhen, China). The kernel density was determined by the pycnometer method, shown in Figure 5.
The computational formulas for the seeds’ physical properties are as follows:
D g = L W T 1 3 ,
ϕ = L W T 1 3 L ,
ρ s = m 1 ρ w m 2 m 3 + m 1 ,
where ρw is the density of the water; m1 is the weight of the seeds; m2 is the weight of the water and pycnometer; and m3 is the weight of the seeds, water, and pycnometer. Table 2 lists the physical properties.

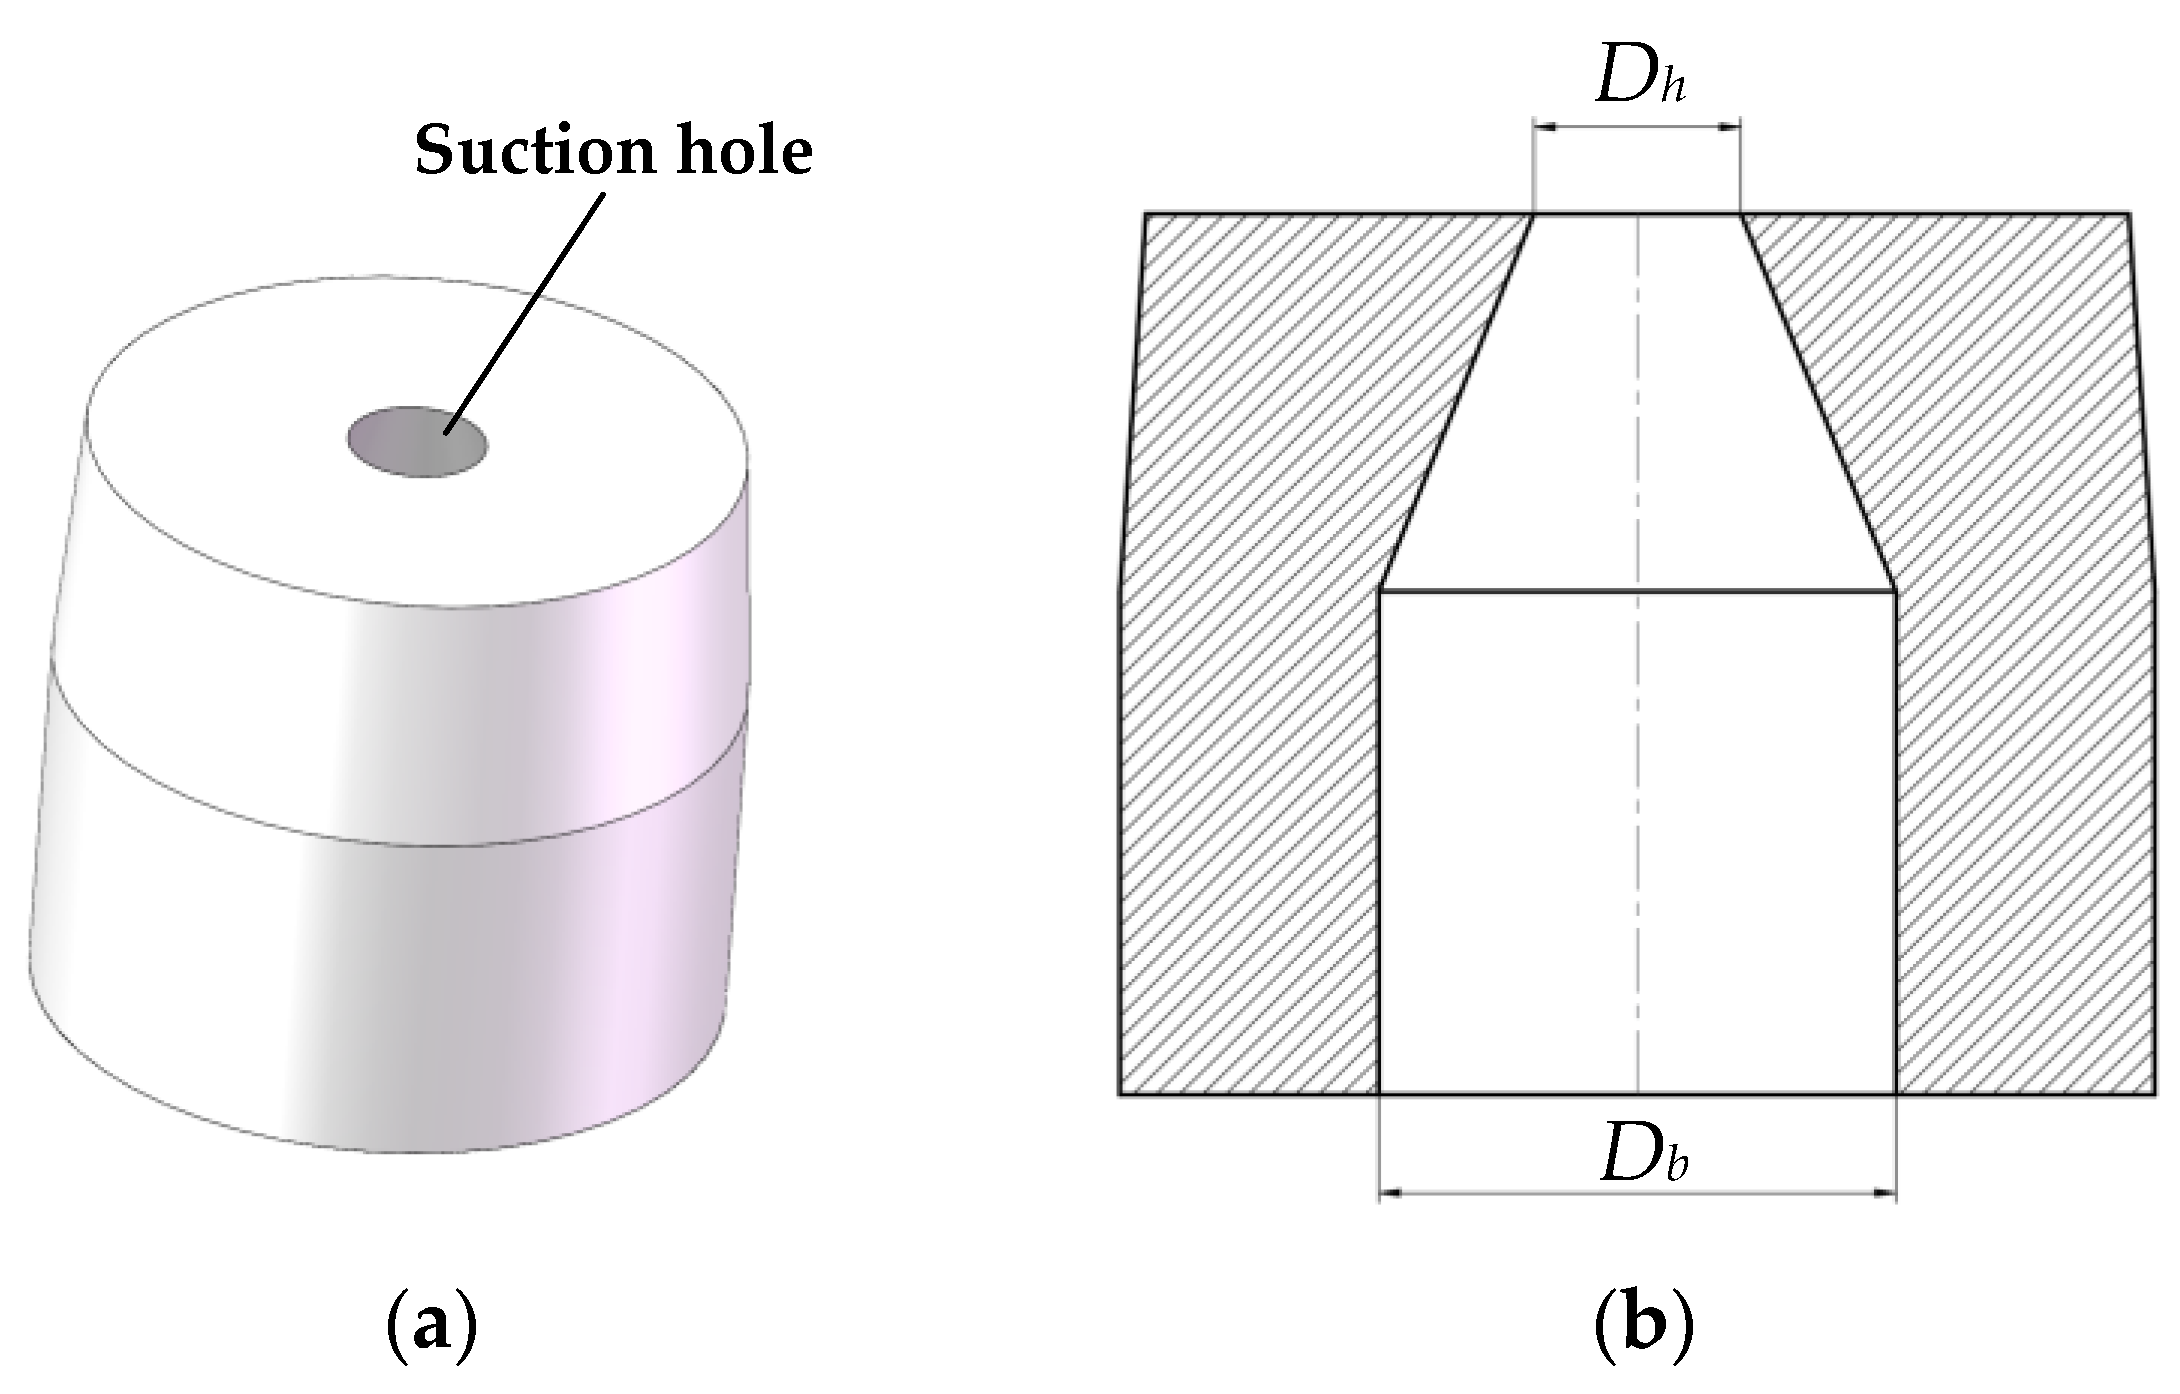
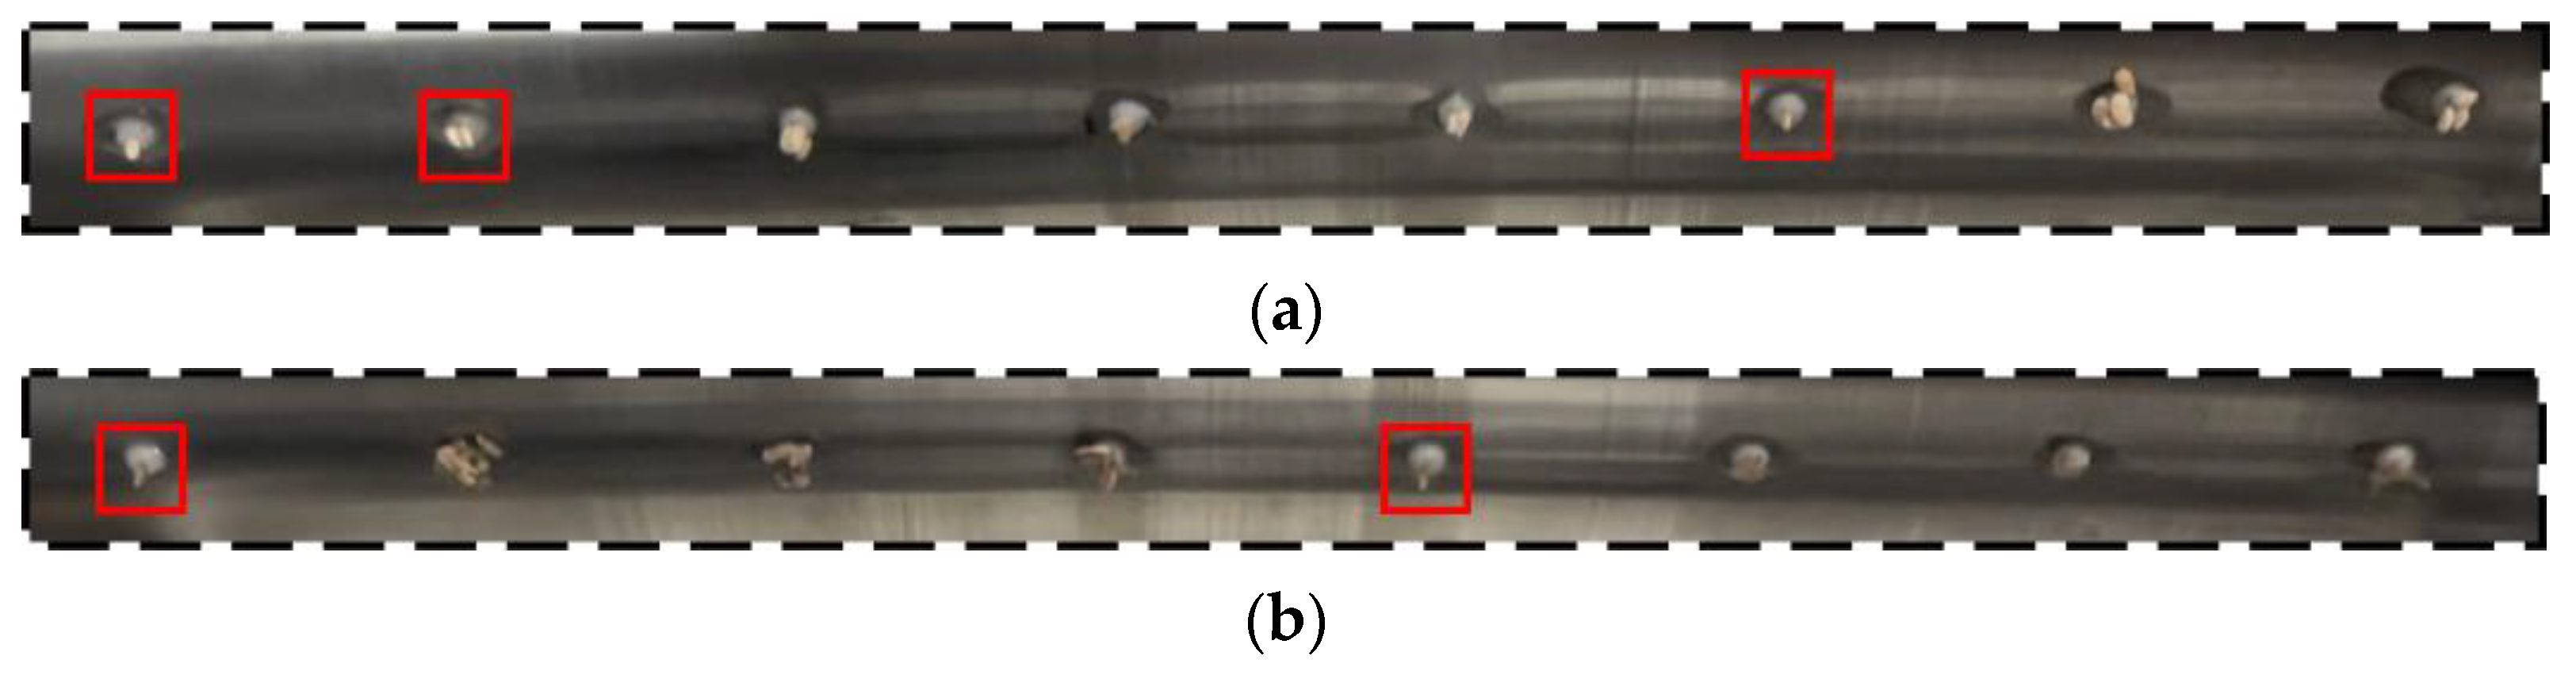
2.3. Influencing Factors and Seeding Performance Indices

The factors in this process are the hole diameter, vacuum pressure, and drum rotational speed. The seeding performance indices are the missing index (MI), the reseeding index (RI), and the qualified index (QI). MI is the percentage of holes with no seed. RI is the percentage of holes with more than two seeds. QI is the percentage of holes with one or two seeds. The expressions for MI, RI, and QI are as follows:
M I = N 1 N × 100 % ,
R I = N 2 N × 100 % ,
Q I = N 3 N × 100 % ,   and
N = N 1 + N 2 + N 3 ,
where N1 is the number of holes with no seeds; N2 is the number of holes with more than two seeds; N3 is the number of holes with one or two seeds; and N is the total number of holes.

2.4. Value Range of Factors

The suction hole diameter (Dh) depends on the seed size, as follows [23,24]:
D h = ( 0.6 ~ 0.7 ) D g .
Considering the values of the geometric mean diameter of six types of seeds, the range of the suction hole diameter was preliminarily determined to between 1.0 and 1.6 mm. However, the results of the adsorption tests revealed that for certain seeds with irregular shapes, such as sesame and carrot seeds, the suction hole diameter was relatively large. During the adsorption process, the phenomenon of seeds getting inserted into the suction holes was observed (as shown in Figure 6), which had a negative impact on the seeding performance. Therefore, the minimum dimension among the three-axis dimensions of each seed type was used to determine the value range of the suction hole diameter, which was found to be from 0.6 mm to 1.0 mm.
In our research group’s previous study [25], the performance of the pneumatic drum seed metering device was studied using pepper and radish seeds, and the results showed that a drum speed between 10 and 14 rpm was suitable for small seeds. Therefore, the drum speed was determined to be between 10 and 14 rpm in this paper. The vacuum pressure was set according to the seed type; thus, single-factor vacuum pressure experiments were conducted. For the single-factor experiments, the vacuum pressure range and levels of each type of seed were determined through preliminary tests, as shown in Table 3.
The hole diameter and drum speed were set to 0.8 mm and 12 rpm, respectively. Five groups of experiments were carried out for each seed type using the 128-hole plug tray. The procedure was repeated three times for each group. Figure 7 presents the average experimental results.
Figure 7 shows that with the increase in vacuum pressure, the MIs exhibit a downward tendency, the RIs increase accordingly, and the QIs increase first and then decrease. According to the results of the single-factor experiments, the suitable vacuum pressure range for each type of seed was determined. Table 4 lists the range of all influencing factors.

2.5. Orthogonal Experiments

Orthogonal experiments with three factors and three levels were designed using Design-Expert 13. Table 5 shows the factor level settings.
Fifteen groups of experiments were carried out for each seed type using a 128-hole plug tray. The procedure was repeated three times for each group. Table 6, Table 7, Table 8, Table 9, Table 10 and Table 11 show the average values.

2.6. Backpropagation Neural Network Predictive Model

BPNN is widely applied in regression problems [26,27,28]. This study used a BPNN to determine the relationships between the suction hole diameter, vacuum pressure, drum rotational speed, physical properties of seed types, and seeding performance.

2.6.1. Seeding Performance Dataset

The physical property data were merged into the dataset to form a complete dataset, which was then divided into a training set and a test set in an 8:2 ratio, with 72 and 18 data groups, respectively. To ensure the validity of the test set, three data groups were randomly selected from each seed’s experimental data to constitute the test set, as shown in Table 12. The remaining data were used as the training set.

2.6.2. Backpropagation Neural Network

A BPNN uses forward information and backward error correction propagation. It typically has a three-layer structure comprising input, hidden, and output layers [29]. The input layer neurons play a role in information transmission. BPNN-predicted results are obtained by applying the activation functions of the hidden and output layers to the weighted sum of the previous layer’s inputs, as follows [20]:
y k = f o j = 1 n U j k f h i = 1 m W i j x i + b h j + b o k ,
where y k is the kth output variable, and f o and f h are activation functions of the output layer and hidden layer, respectively; i, j, and k are the neurons of the input layer, the hidden layer, and the output layer, respectively, and designated as i = 1, 2, …, m; j = 1, 2, …, n; and k = 1, 2, …, l. Wij is the connection weight between the ith neuron in the input layer and the jth neuron in the hidden layer; Ujk is the connection weight between the jth neuron in the hidden layer and the kth neuron in the output layer; (bh)j is the bias for the jth neuron in the hidden layer; and (bo)k is the bias for the kth neuron in the output layer.

2.6.3. Evaluation Indices for Network Performance

The coefficient of determination (R2), root mean square error (RMSE), and mean absolute error (MAE) served as evaluation indices for the BPNN’s predictive performance. R2 indicates the degree of fitting of the predictive model: the closer its value is to 1, the more accurate the predicted results. RMSE and MAE evaluate the error of the predictive model. The closer their values are to 0, the smaller the predictive error. The expressions for R2, RMSE, and MAE are as follows [30,31]:
R 2 = 1 i = 1 n Y e i Y p i 2 i = 1 n Y e i Y e ¯ 2 ,
RMSE = 1 n i = 1 n Y e i Y p i 2 ,
MAE = 1 n i = 1 n Y e i Y p i ,
where Yei is the experimental value for the ith sample, and i = 1, 2, …, n, where n is the total number of samples. Ypi is the predicted value for the ith sample, and Y e ¯ is the average of the experimental values for all samples.

2.6.4. Establishment of BPNN Predictive Model

The BPNN predictive model was established using the newff function in MATLAB R2022a. To ensure the model’s accuracy, the sample data were normalized before use. This paper normalized the data within [0, 1], as follows:
y = x x min x max x min .
The settings of network training parameters are shown in Table 13. The network structure parameters, such as the number of hidden-layer neurons and the activation functions of the hidden and output layers, must be determined through tests.
According to the independent and dependent variables of the dataset, the numbers of the input- and output-layer neurons were set to 7 and 2, respectively. The number of hidden-layer neurons is not a constant value, which was preliminarily determined within [4,13] as follows:
p = m + n + A ,
where p is the number of hidden-layer neurons, which is determined to be an integer within the interval obtained through Formula (14); m is the number of input variables; n is the number of output variables; and A is a constant in [1, 10].

2.7. BPNN-MOPSO Parameter Optimization of the Seed Metering Device

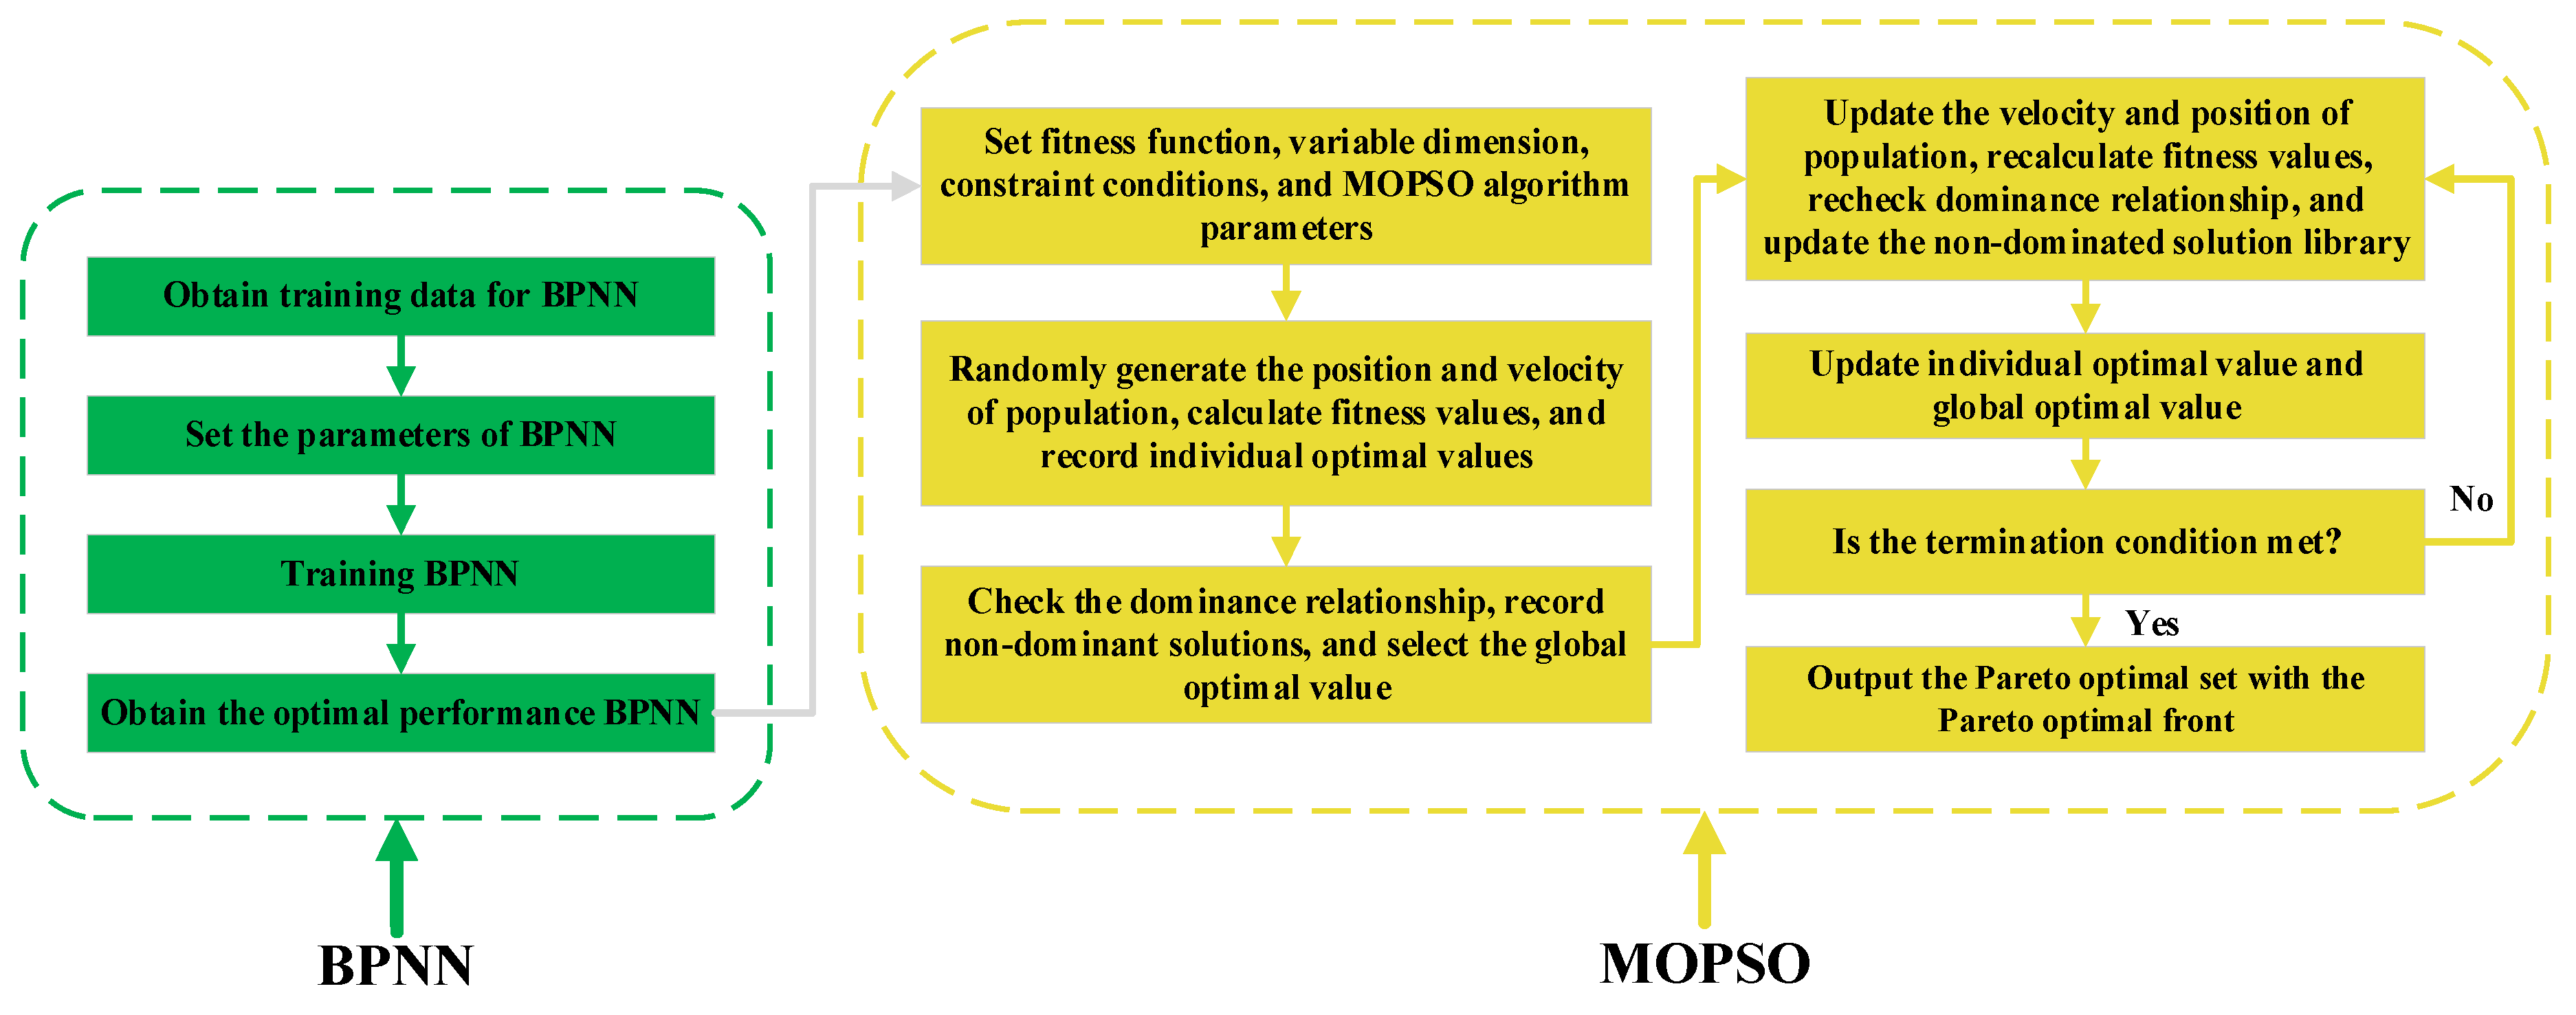
2.7.1. Principle and Flow of the MOPSO Algorithm

The MOPSO principle is the same as that of PSO and originates from the group behavior of foraging birds. When a bird finds food, others gather around to search for food. PSO searches for the extremum of a single optimization objective. Unlike PSO, MOPSO searches for a Pareto optimal set consisting of non-dominated solutions for multiple optimization objectives.
The main flow of the MOPSO algorithm is as follows:
  • Define a fitness function based on optimization objectives, determine the dimensions and constraints for each input variable, and set MOPSO algorithm parameters;
  • Randomly generate position and velocity vectors for the initial population; then, calculate and record the fitness value of each particle as the individual optimal value;
  • Based on Pareto dominance, check the dominance relationship of all particles, record all non-dominated solutions, and select one as the global optimal value;
  • Update the velocity and position vectors of the population, recalculate each particle’s fitness value, recheck the domination relationship, and update the non-domination solution library;
  • Update individual and global optimal values;
  • Check whether the maximum number of iterations is reached. If so, the algorithm terminates; otherwise, return to Step 4;
  • Output the Pareto optimal set and the Pareto optimal front.

2.7.2. Settings of the MOPSO Algorithm Parameters

The settings of the MOPSO algorithm parameters are shown in Table 14.

2.7.3. Mathematical Model for the Multi-Objective Optimization Problem

With minimal MI and RI as optimization objectives, and based on the constraint conditions of suction hole diameter, vacuum pressure, and drum rotational speed, a mathematical model for the multi-objective optimization problem was established, as follows:
x = a ,   b ,   c ,   d ,   x 1 ,   x 2 ,   x 3 min F x = f 1 x , f 2 x s . t . 0.6 x 1 1.0 e x 2 f g x 3 h ,
where a, b, c, and d are the geometric mean diameter (mm), sphericity (%), thousand-grain weight (g), and kernel density (g·cm−3) of seeds, respectively; x1, x2, and x3 are the suction hole diameter (mm), vacuum pressure (kPa), and drum rotational speed (rpm), respectively; and f1(x) and f2(x) are the prediction functions of MI and RI, respectively. Table 15 shows the values of e and f, which represent the lower and upper limits of the vacuum pressure, respectively, and g and h represent the lower and upper limits of the drum rotational speed, respectively.

2.7.4. Scoring Method for Solutions

To select a solution from the Pareto optimal set as the optimization result, we had to assign corresponding weights to the optimization objectives, score each solution, and select the one with the highest score as the final result. To ensure a highly qualified index for the seed metering device, the QI is also taken as an optimization objective and designated a corresponding weight. The weights of QI, MI, and RI were set to 0.6, 0.3, and 0.1, respectively. The indices were normalized before scoring. The normalization formulas for the positive index (QI) and negative indexes (MI and RI) and the scoring formula are as follows:
y i j = x i j min x i 1 , x i 2 , , x i n max x i 1 , x i 2 , , x i n min x i 1 , x i 2 , , x i n ,
y i j = max x i 1 , x i 2 , , x i n x i j max x i 1 , x i 2 , , x i n min x i 1 , x i 2 , , x i n ,
s j = i = 1 m ω i y i j .
where xij is the jth sample of the ith index, where i = 1, 2, …, m, j = 1, 2, …, n, m is the total number of indices, and n is the total number of solutions in the Pareto optimal set; and ωi is the weight of the ith index.

2.7.5. Process of BPNN-MOPSO

After network training, the optimal BPNN predictive model served as the fitness function in MOPSO. Then, the MOPSO algorithm searched for the optimal solution predicted by the BPNN predictive model. The BPNN-MOPSO process is shown in Figure 8. Before running the BPNN-MOPSO algorithm, the first four dimensions of the particles were fixed as the physical properties for each seed type. Thus, during algorithm execution, the BPNN predictive model becomes a seeding performance predictor for the seed type, then is used to optimize the device parameters.

3. Results and Discussion

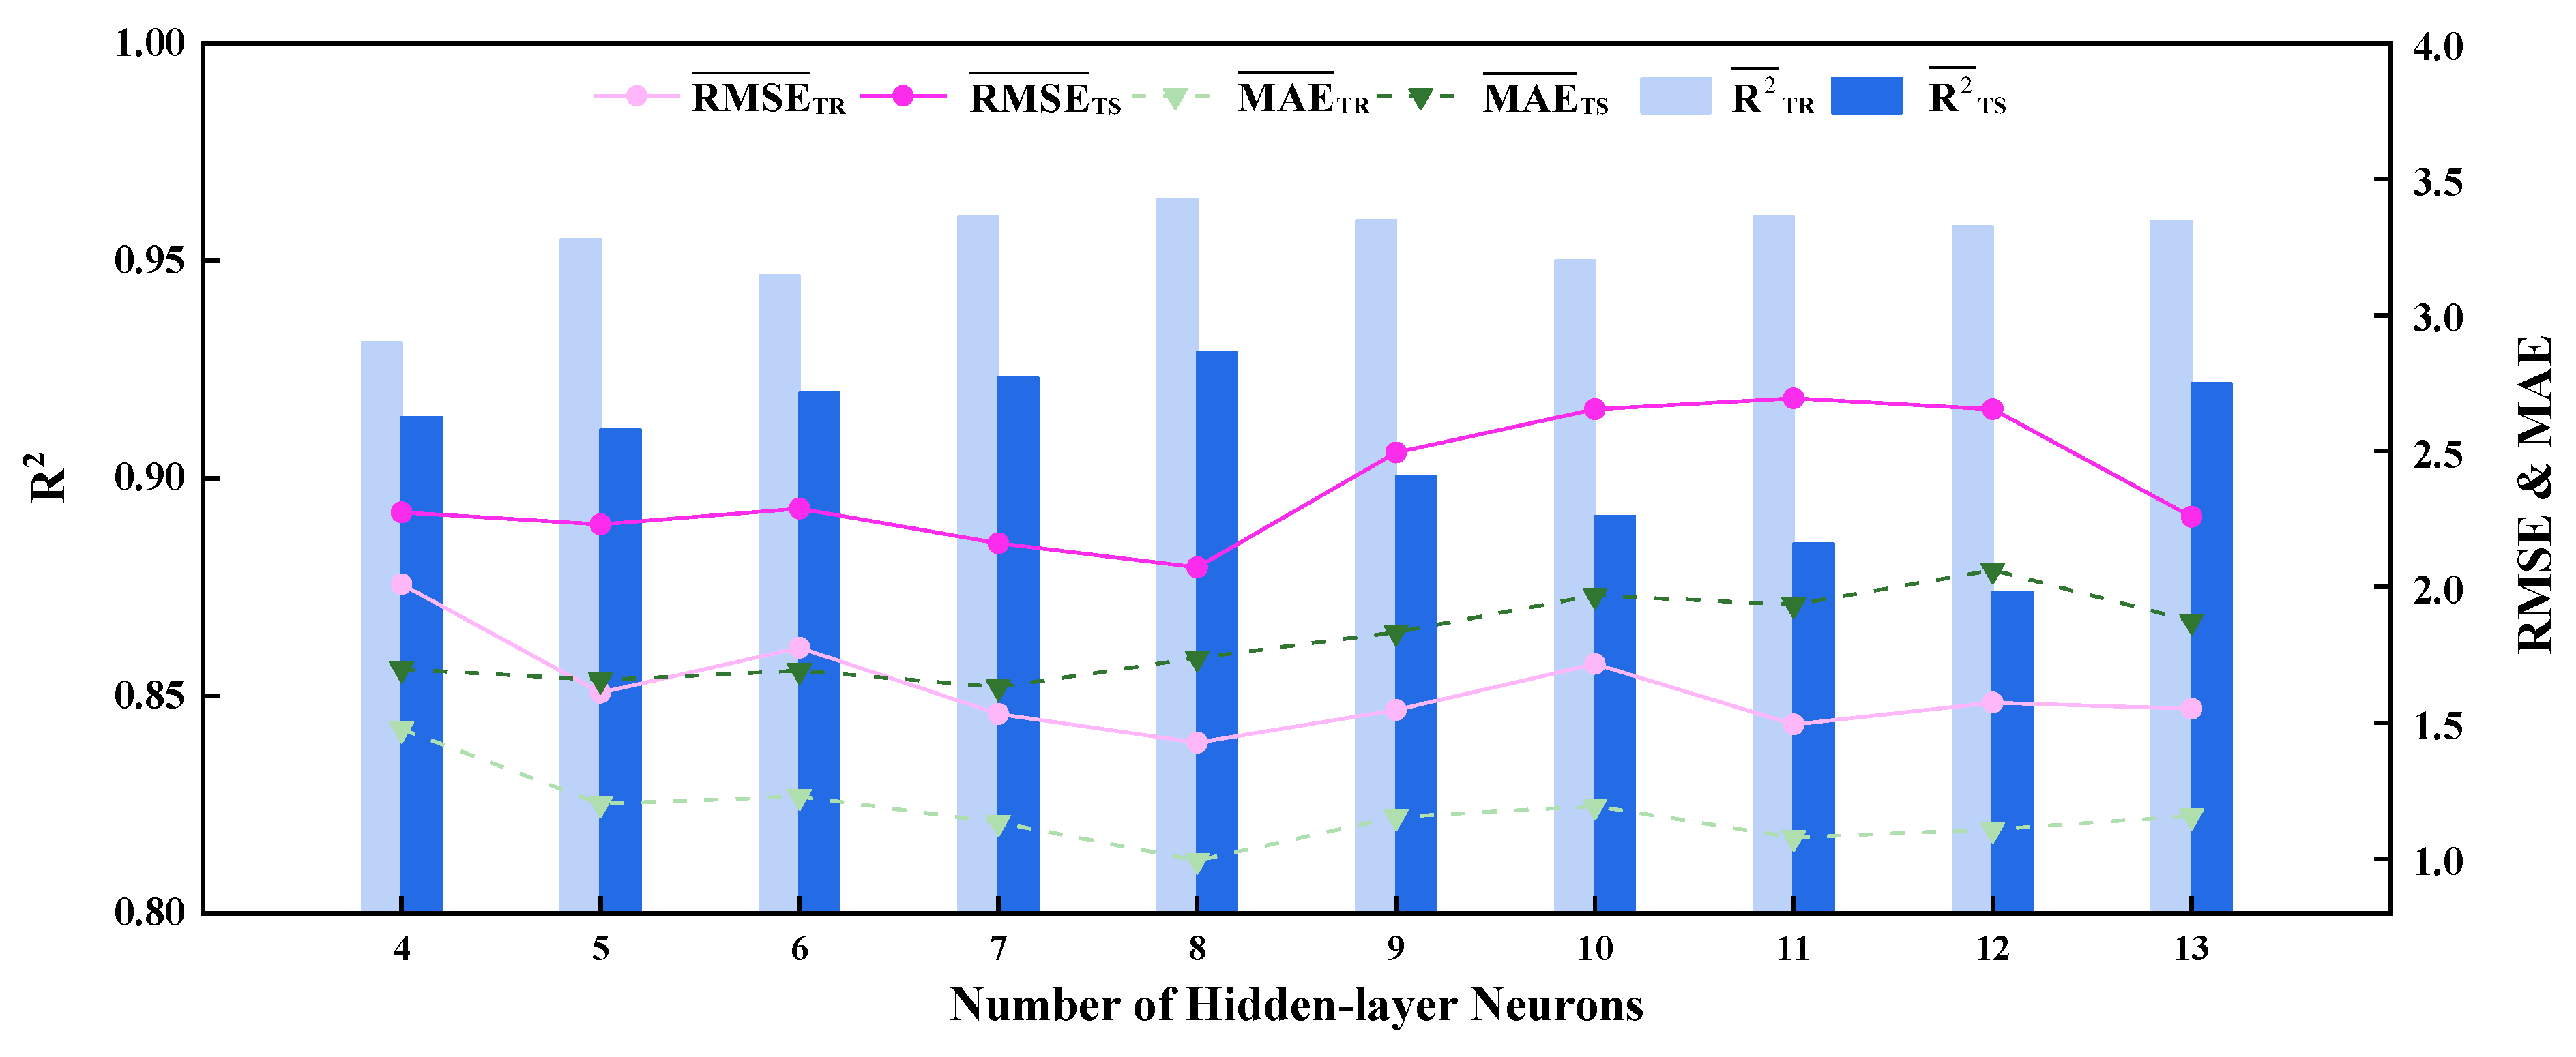
3.1. Determination of the Number of Hidden-Layer Neurons

The network was trained and tested to determine the optimal number of hidden-layer neurons, successively setting the number of hidden-layer neurons as integers in [4,13]. Owing to the characteristics of the gradient descent method, a BPNN tends to fall into local minima during training, which may result in the trained network not achieving optimal performance. Moreover, since the gradient descent path is not unique, the BPNN training is unstable [15], which means the network trained each time is inconsistent. Under each number of hidden-layer neurons, network training was repeated until 10 sets of network performance data with two output’s test set R2 values simultaneously greater than 0.8 were obtained. Then, the optimal set of data was selected from the 10 sets of data to represent the network performance under the current number of hidden-layer neurons. The network performance data were compared, as shown in Figure 9 and Table 16.
With eight hidden-layer neurons, network performance is excellent, as the values of the training set R 2 ¯ (0.9641) and the test set R 2 ¯ (0.9290) are higher than those obtained under other numbers of the hidden-layer neurons. Except that the test set MAE ¯ (1.7391) is slightly larger than that obtained with 4–7 neurons (1.6319–1.6981), the other performance indices are the optimal values. Thus, the number of hidden-layer neurons was set to 8.

3.2. Determination of the Activation Functions for the Hidden and Output Layers

Commonly used activation functions of hidden and output layers include logsig, tansig, and purelin. Therefore, the optimal activation function combination was determined by comparing the network performance under all combinations of the three activation functions. Since the R2 values of the two outputs were negative when the output-layer activation function was logsig, combinations with logsig as the output-layer activation function were excluded. The training results of the remaining combinations are shown in Figure 10 and Table 17.
Network performance is better for the logsig/purelin combination. Except that the training set R 2 ¯ (0.9641) is slightly smaller than that of the tansig/purelin combination (0.9646), the other network performance indices are the optimal values. Thus, the optimal activation function combination of the hidden and output layers was set to logsig/purelin.

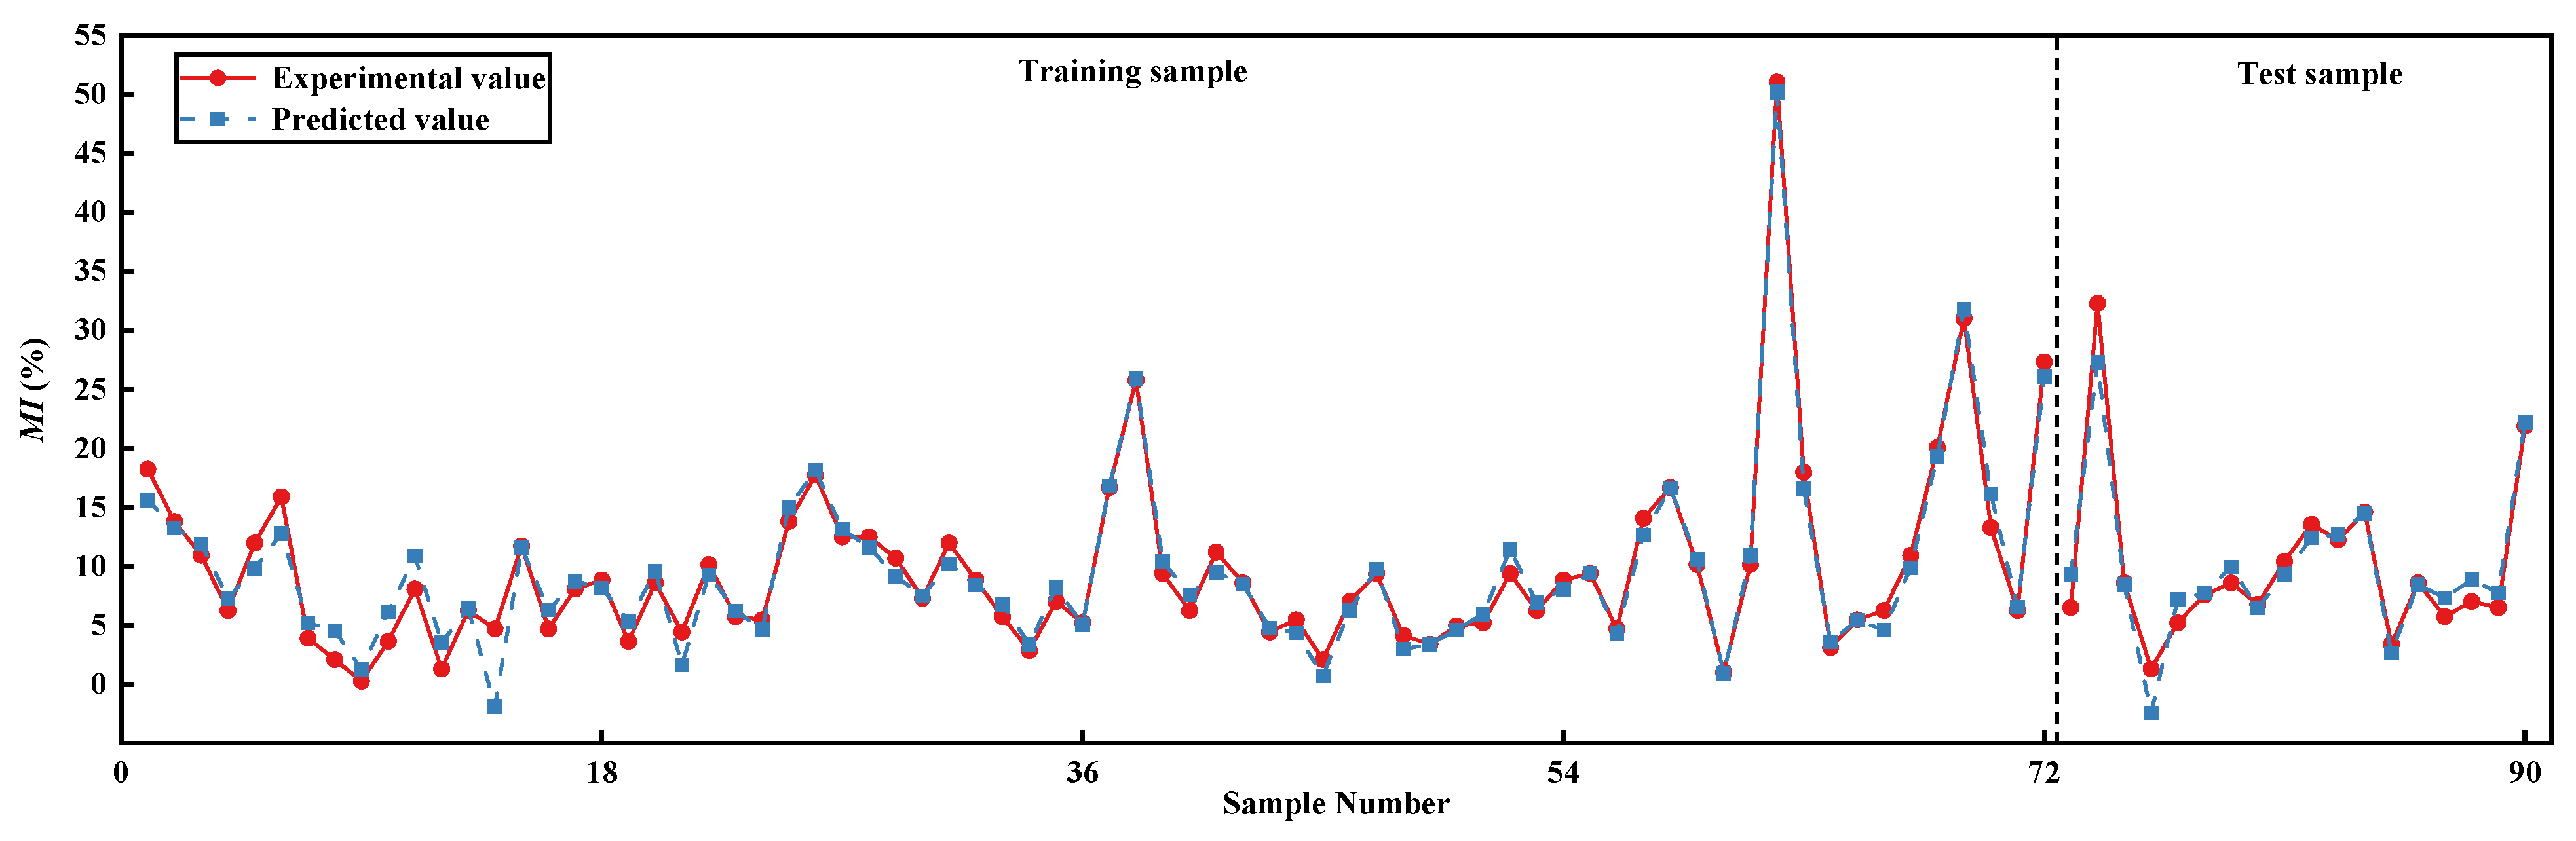
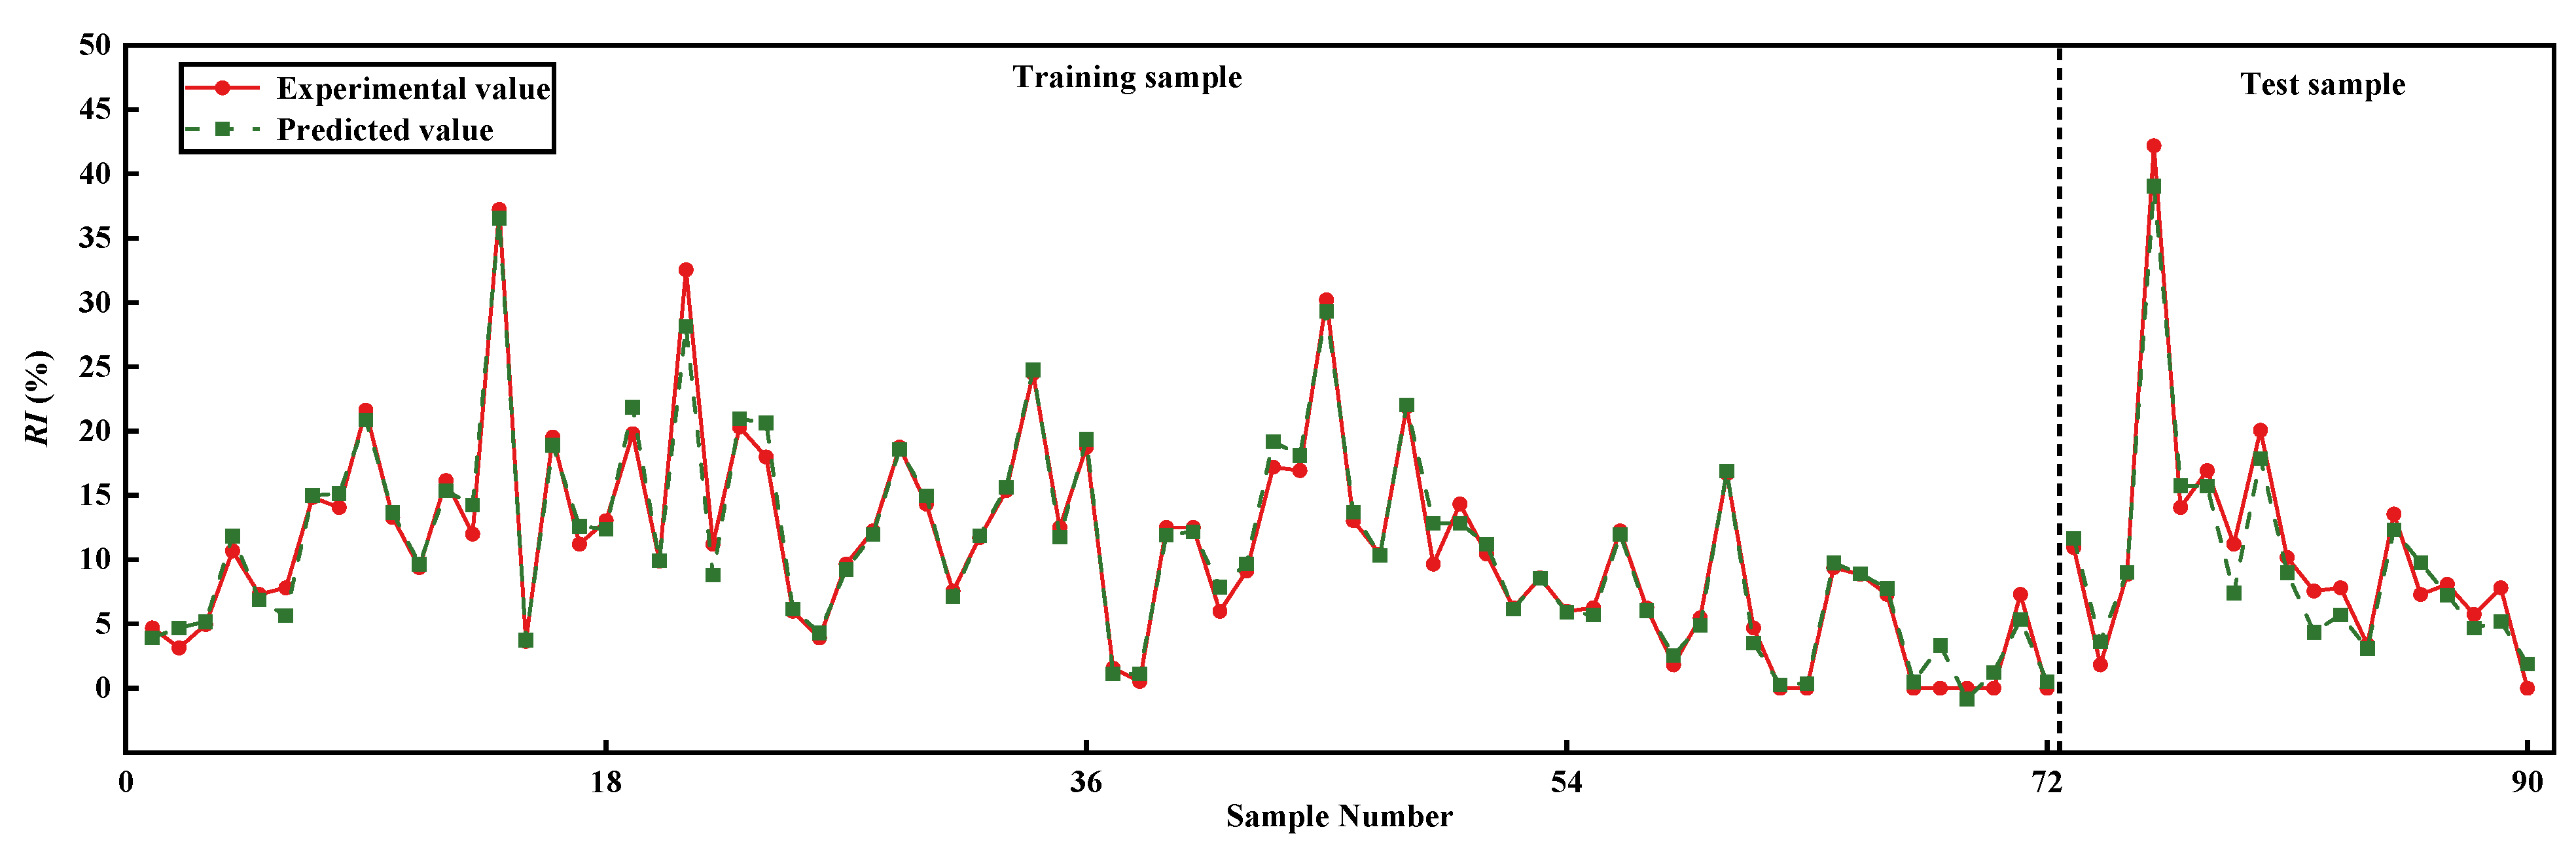
3.3. Determination of the Optimal BPNN Performance

The network structure parameters were determined, and then the BPNN was trained. After multiple-network training, the networks with excellent performance were saved, and the network performance data were recorded. All network performance data were compared, and the optimal network was selected for subsequent research.
Table 18 presents the performance data of the optimal network. The R2 values of two outputs for the training set are both above 0.96, demonstrating the high fitting degree of the network to the data in the training set. Moreover, the strong generalization ability of the network is manifested by the fact that the R2 values of two outputs for the test set are both above 0.92. The values of the error indices are basically within 2%, remaining at a relatively low level, indicating that the network has a small predictive error.
Use the sim function in MATLAB R2022a to obtain the predicted values of the outputs (MI and RI) corresponding to the inputs of the training and test sets, and then compare them with the experimental values (as shown in Table 6, Table 7, Table 8, Table 9, Table 10 and Table 11), as shown in Figure 11 and Figure 12. In the training sample part, the predicted curve basically coincides with the experimental curve, and the maximum absolute errors of the MI and RI are 6.56% and 4.42%, respectively; in the test sample part, except for a few individual samples, the predicted curve fits the experimental curve well, and the maximum absolute errors of the MI and RI are 5.01% and 3.80%, respectively. The comparison between the experimental and predicted values of the MI and RI also demonstrates the excellent fitting performance and strong generalization ability of the selected network.
The weights and biases of the optimal performance BPNN were extracted for the further combination of the BPNN predictive model and MOPSO algorithm, as shown in Table 19.

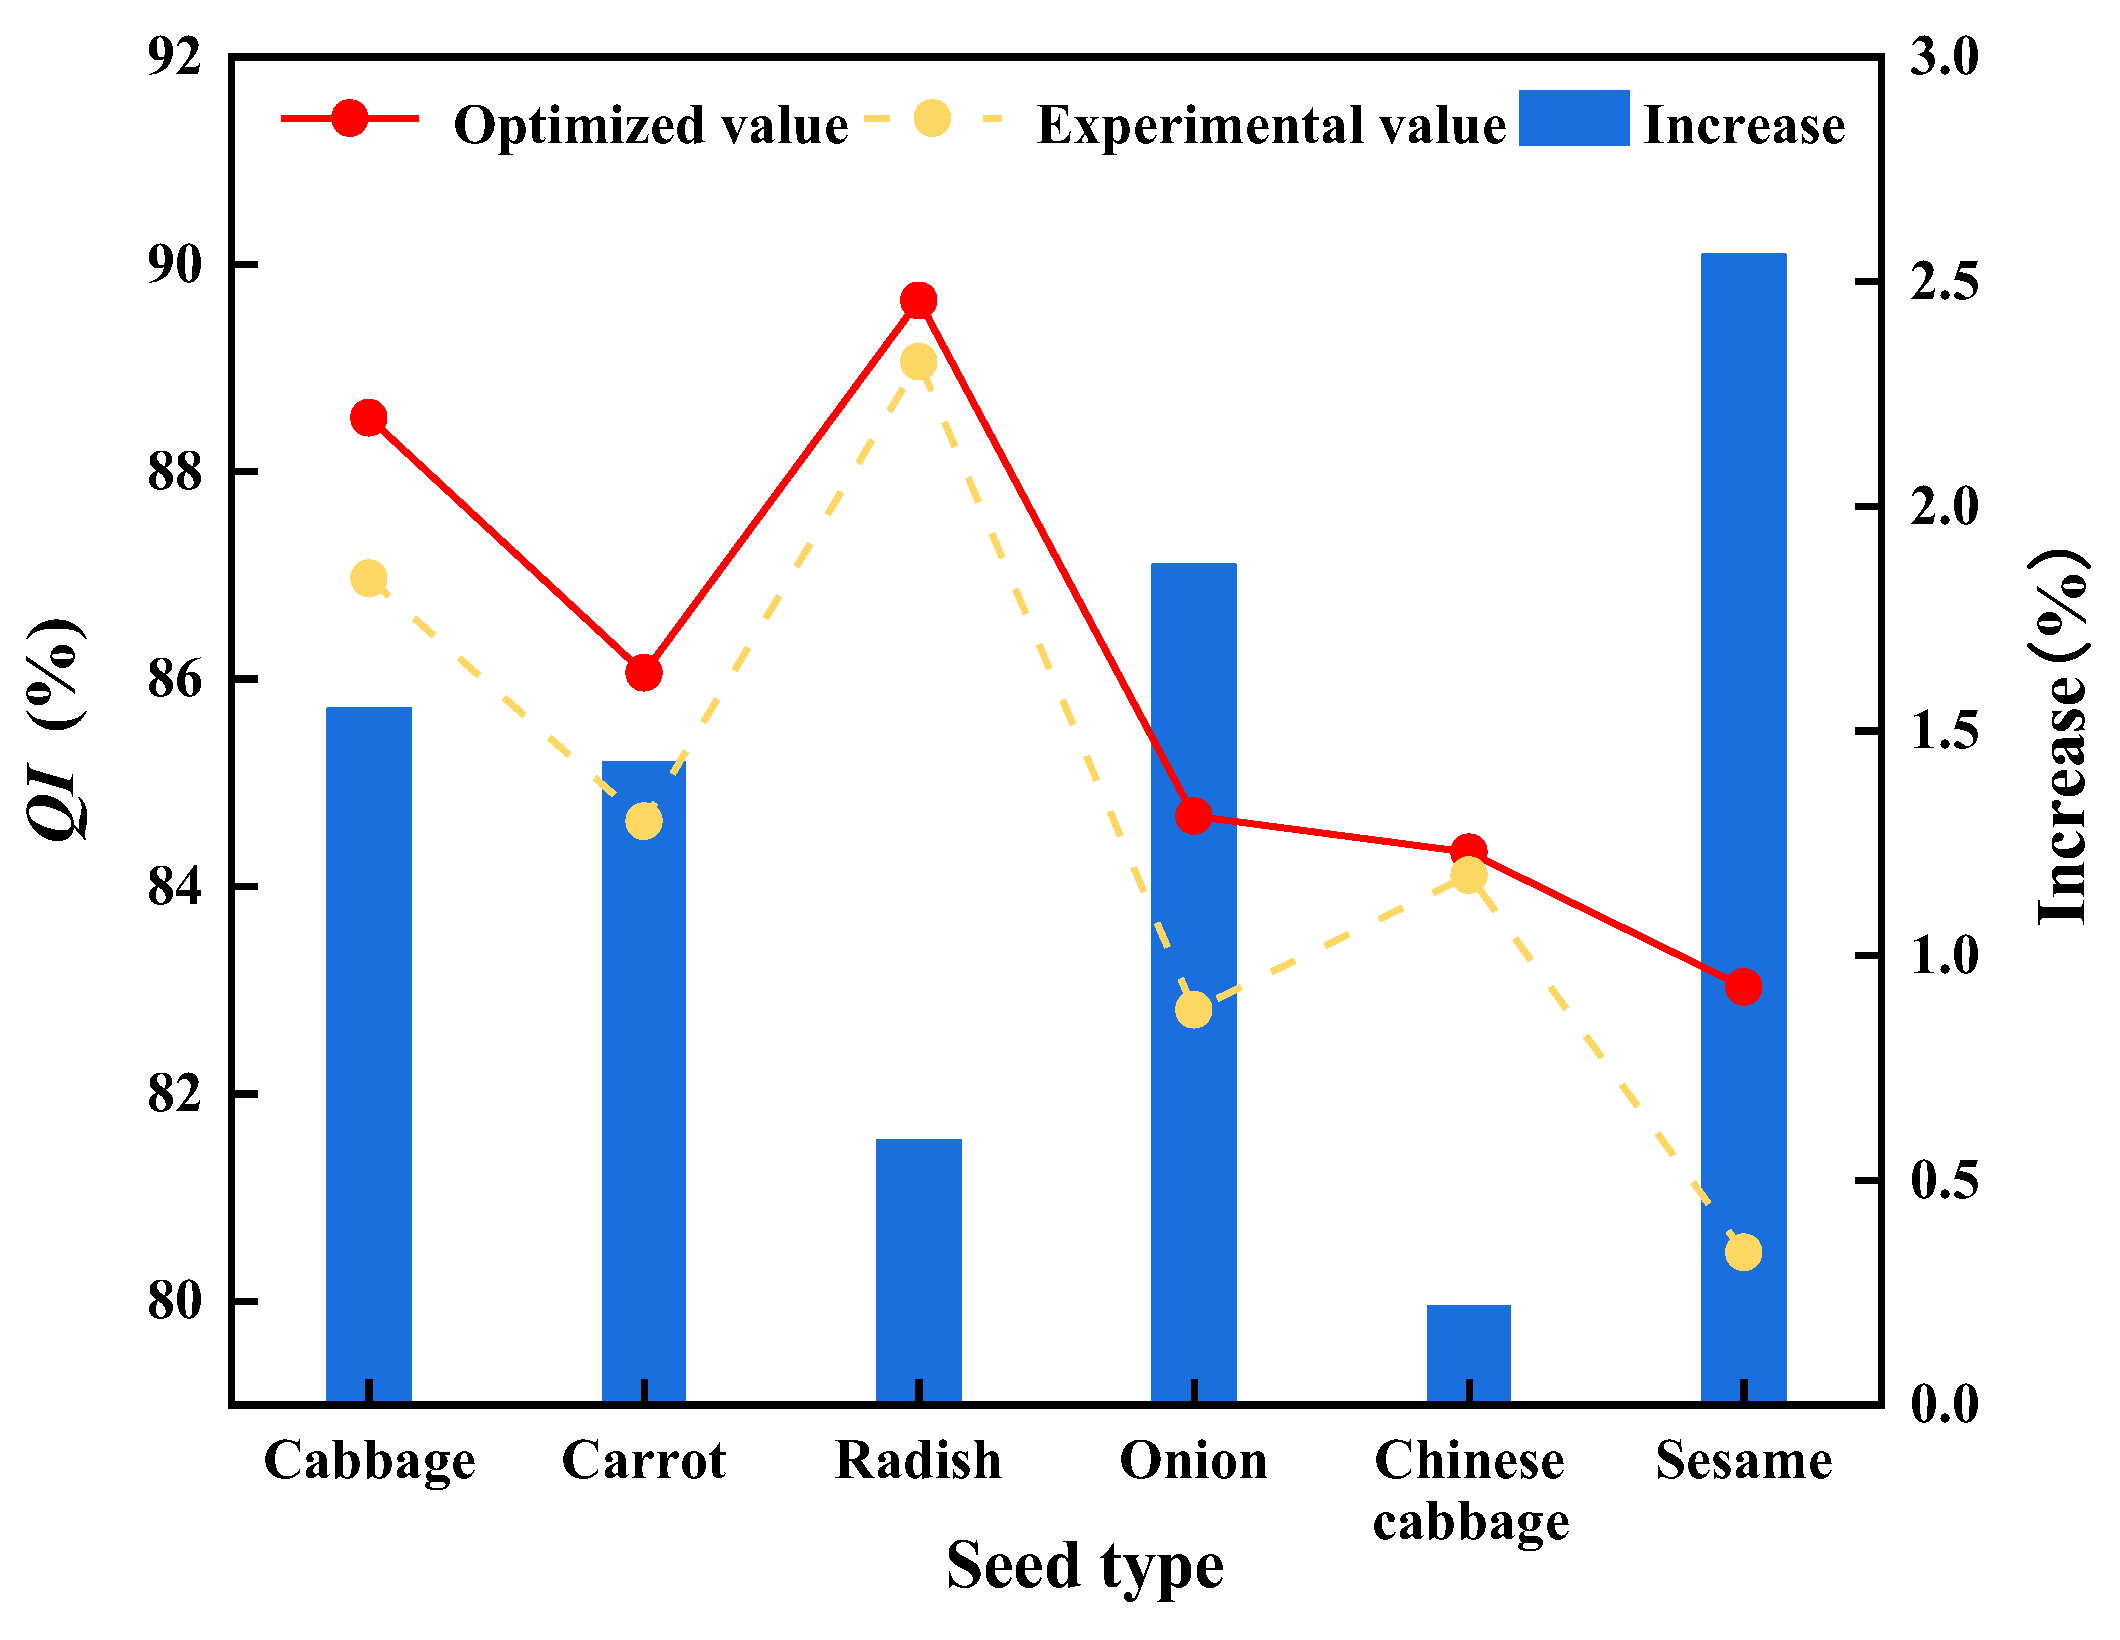
3.4. Verification of Optimization Capability of BPNN-MOPSO

Before carrying out efficient parameter optimization, the optimization capability of the BPNN-MOPSO algorithm needs to be verified. We optimized the device parameters for the six types of seeds used in the seeding performance experiments (cabbage, carrot, radish, onion, Chinese cabbage, and sesame seeds) using the BPNN-MOPSO algorithm. Then, the optimized values of QI were compared with the optimal experimental ones (as shown in Table 6, Table 7, Table 8, Table 9, Table 10 and Table 11) to validate whether the algorithm is able to improve the seeding performance by its optimization. The verification results are shown in Figure 13 and Table 20.
Table 20 and Figure 13 show that the optimized values of QI are higher than the optimal experimental ones, and the increases are 1.55%, 1.43%, 0.59%, 1.87%, 0.22%, and 2.53% for cabbage, carrot, radish, onion, Chinese cabbage, and sesame seeds, respectively. Therefore, the algorithm’s capability to optimize the seeding performance of the seed metering device was verified, laying a foundation for the implementation of efficient parameter optimization.

3.5. BPNN-MOPSO Efficient Parameter Optimization Results and Experimental Verification

The efficient parameter optimization of the device was carried out for the three types of seeds (tomato, pepper, and bok choi seeds) not having participated in the seeding performance experiments. Using the BPNN-MOPSO algorithm, the device parameters for tomato, pepper, and bok choi seeds were optimized. The Pareto optimal sets were obtained, and the corresponding Pareto optimal frontiers are shown in Figure 14.
Each Pareto optimal frontier includes 100 non-dominated solutions. In Figure 14a, the values of MIs and RIs distribute within the interval [5,17] and [1,17], respectively. The solution with the minimum MI (5.04%) simultaneously has the maximum RI (16.85%), so the corresponding QI (78.11%) might not be satisfactory. Therefore, the 100 non-dominated solutions for each seed type were scored by Equations (16)–(18) to determine the optimal solution. The solution with the highest score was recorded as the optimized result. The results are shown in Table 21.
The bench experiments were carried out to verify the optimization results in Table 21, and the verification results are shown in Table 22.
According to Table 22, the predicted qualified indices for tomato, pepper, and bok choi seeds are all greater than 80%, which are 85.50%, 85.52%, and 84.87%, respectively. All the absolute errors are less than 3%. The verification results prove the accuracy of the established BPNN predictive model and the effectiveness of the MOPSO algorithm for searching for the optimal solution, showing that the parameter optimization method based on the BPNN/MOPSO combination simplifies the parameter optimization process effectively, improves optimization efficiency, and shortens research time.

4. Conclusions

In this paper, an efficient parameter optimization method based on BPNN and the MOPSO algorithm was proposed to improve the efficiency of the parameter optimization for a pneumatic drum seed metering device. The main research conclusions are presented as follows:
(1)
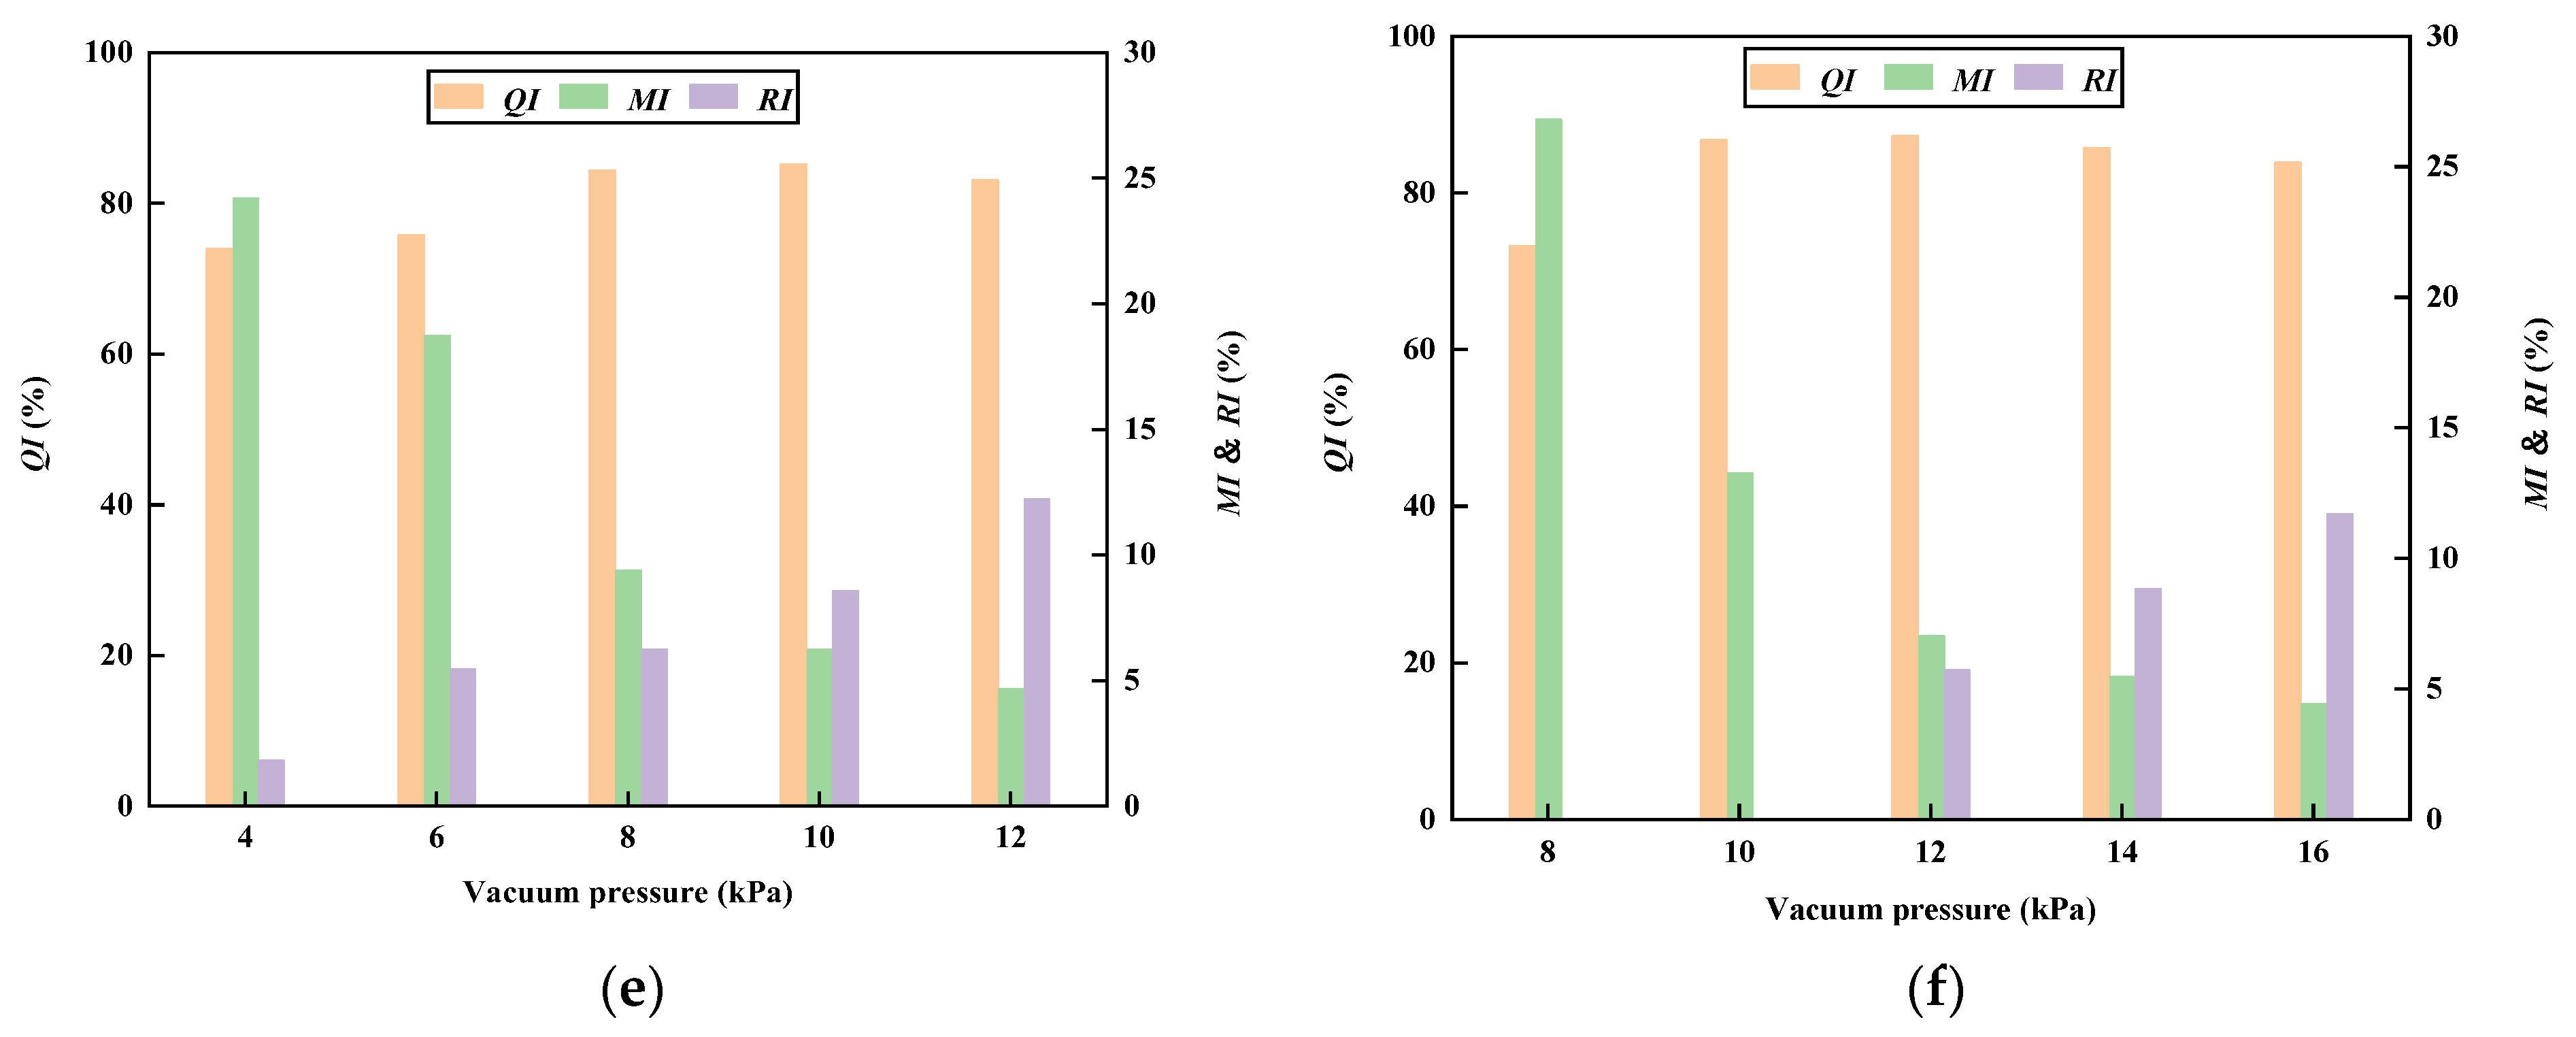
For six types of seeds (cabbage, carrot, radish, onion, Chinese cabbage, and sesame seeds), the range of the suction hole diameter was determined to be from 0.6 to 1.0 mm through the testing and analysis of the seed adsorption process. The suitable range of vacuum pressure for each seed type was determined by single-factor experiments: 6 to 10 kPa for Chinese cabbage, carrot, sesame, and onion seeds; 8 to 12 kPa for cabbage seeds; and 10 to 14 kPa for radish seeds. The seeding performance experiments were carried out, and the dataset used for network training and testing was obtained.
(2)
For the BPNN predictive model, when the number of the hidden-layer neurons and the combination of the activation functions of the hidden layer and output layer are eight and logsig/purelin, respectively, the training set R 2 ¯ (0.9641) and test set R 2 ¯ (0.9290) are at a high level, and the values of the error indices ( RMSE ¯ and MAE ¯ ) are basically within 2%, which are better than those obtained under other network parameters, showing good network performance. Thus, the number of the hidden-layer neurons and the combination of the activation functions were determined to be eight and logsig/purelin, respectively. Under the above values of network parameters, the BPNN with the optimal performance was obtained through training and testing. The R2 values of two outputs for the training set are both above 0.96; the R2 values of two outputs for the test set are both above 0.92; and the values of the error indices (RMSE and MAE) are basically within 2%, demonstrating the excellent fitting performance and strong generalization ability of the optimal BPNN predictive model.
(3)
In the validation of optimization capability, the values of QI optimized by the BPNN-MOPSO algorithm are higher than the optimal experimental ones for cabbage, carrot, radish, onion, Chinese cabbage, and sesame seeds, and the increases are 1.55%, 1.43%, 0.59%, 1.87%, 0.22%, and 2.53%, respectively.
(4)
Using the BPNN-MOPSO algorithm to carry out the efficient parameter optimization, the optimal device parameters and seeding performance for three untested seed types (tomato, pepper, and bok choi seeds) were sought. For tomato seeds, with a hole diameter of 0.75 mm, vacuum pressure of 5.6 kPa, and drum rotational speed of 13.7 rpm, the MI, RI, and QI were 11.85%, 2.66%, and 85.50%, respectively. For pepper seeds, with a hole diameter of 1.0 mm, vacuum pressure of 10.4 kPa, and drum rotational speed of 18.0 rpm, the MI, RI, and QI were 11.54%, 2.94%, and 85.52%, respectively. For bok choi seeds, with a hole diameter of 0.67 mm, vacuum pressure of 8.6 kPa, and drum rotational speed of 14.0 rpm, the MI, RI, and QI were 10.72%, 4.41%, and 84.87%, respectively. The bench experiments verified the optimization results. The results show that the absolute errors between the predicted and experimental values were all less than 3%.
Compared with commercial seeders, the pneumatic drum seed metering device in this study has a lower machining accuracy and was designed for a relatively large number of seed types. Thus, the seeding qualified index of the device (80% < QI < 90%) is lower than that of commercial seeders (QI ≥ 90%). In subsequent research, we will further improve and optimize the structure of the device to enhance its seeding performance.

Author Contributions

Conceptualization, Y.P. and Y.Y.; methodology, Y.P. and Y.Y.; software, Y.P.; validation, Y.P., J.Z., and Y.W.; formal analysis, Y.P.; investigation, Y.P., J.Z., W.Q., and Q.W.; data curation, Y.P.; writing—original draft preparation, Y.P.; writing—review and editing, Y.P. and Y.Y.; project administration, Y.P. and Y.Y.; funding acquisition, Y.Y. All authors have read and agreed to the published version of the manuscript.

Funding

This research was supported by The Key Research and Development Program of Zhejiang Province (No. 2023C02011) and the National Natural Science Foundation of China (Grant No. 51975538).

Institutional Review Board Statement

Not applicable.

Informed Consent Statement

Not applicable.

Data Availability Statement

The raw data supporting the conclusions of this article will be made available by the authors on request.

Acknowledgments

The authors would like to thank their school and all colleagues who contributed to the research work.

Conflicts of Interest

The authors declare no conflicts of interest.

References

  1. Zhang, H.S.; Hu, J. Seed Science, 2nd ed.; Science Press: Beijing, China, 2016; p. 46. [Google Scholar]
  2. Han, B.; Yang, Y.N.; Meng, F.C.; Liang, L.N.; Ge, Y.X. Improved design and performance experiment on air-suction drum-type seed metering device for rice with auto-cleaning block. Trans. Chin. Soc. Agric. Eng. 2016, 32, 18–25. [Google Scholar] [CrossRef]
  3. Yang, L.; Li, Z.M.; Zhang, D.X.; Li, C.; Cui, T.; He, X.T. Design and test of the T-shaped hole of centrifugal high-speed maize precision seed metering device. Trans. Chin. Soc. Agric. Eng. 2024, 40, 50–60. [Google Scholar] [CrossRef]
  4. Zang, Y.; Huang, Z.S.; Qin, W.; He, S.Y.; Qian, C.; Jiang, Y.C.; Tao, W.Y.; Zhang, M.L.; Wang, Z.M. Design of hybrid rice air-suction single-seed metering device. Trans. Chin. Soc. Agric. Eng. 2024, 40, 181–191. [Google Scholar] [CrossRef]
  5. Gao, X.J.; Yu, L.Y.; Wu, X.P.; Huang, Y.X.; Yan, X.L. Design and Experiment of Intelligent Seed Supply System of Air-assisted High Speed Precision Maize Seed Metering Device. Trans. Chin. Soc. Agric. Mach. 2023, 54, 66–75. [Google Scholar] [CrossRef]
  6. Jin, K.D. Research on the Movement Characteristics of Flat Seeds in the Seed Box of Metering Device with Air-Blowing Seed Feeding. Master’s Thesis, Zhejiang Sci-Tech University, Hangzhou, China, 2022. [Google Scholar]
  7. Xu, J.; Hou, J.W.; Wu, W.B.; Han, C.Y.; Wang, X.M.; Tang, T.; Sun, S.L. Key Structure Design and Experiment of Air-Suction Vegetable Seed-Metering Device. Agronomy 2022, 12, 675. [Google Scholar] [CrossRef]
  8. Xu, J.; Sun, S.L.; He, Z.K.; Wang, X.M.; Zeng, Z.H.; Li, J.; Wu, W.B. Design and optimization of seed-metering plate of air-suction vegetable seed-metering device based on DEM-CFD. Biosyst. Eng. 2023, 230, 277–300. [Google Scholar] [CrossRef]
  9. Zhang, M.H.; Jiang, Y.C.; He, S.Y.; Huang, Z.S.; Qin, W.; Qian, C.; Tao, W.Y.; Zang, Y. Design and experiment of the air suction wheel precision seed metering device for vegetables. Trans. Chin. Soc. Agric. Eng. 2023, 39, 98–109. [Google Scholar] [CrossRef]
  10. Yan, Y.Q.; Liu, L.J.; Liu, Y.Q.; Wu, H.H.; Lu, Q.; Liu, F.J. Design and Test of Four-stage Seed Cleaning Mechanism for Air-suction Vegetables Seed-metering Device. Trans. Chin. Soc. Agric. Mach. 2023, 54, 57–65. [Google Scholar] [CrossRef]
  11. Lin, P.; Liao, Q.X.; Wang, L.; Wang, B.S.; Liu, H. Seed suction performance and experiment of sesame precision hole seeding metering device. J. Huazhong Agric. Univ. 2021, 40, 195–206. [Google Scholar]
  12. Li, H.; Ma, Y.L.; Yu, H.M.; Wang, Y.J.; Sun, X.P.; Yin, J.Q. Design and Experiment of Group Air-suction Type Celery Seed Metering Device. Trans. Chin. Soc. Agric. Mach. 2023, 54, 87–95. [Google Scholar] [CrossRef]
  13. Yan, Y.Q. Optimization Design and Test of Gas-suction Seeding Unit of Small-Sized Spherical Vegetable. Master’s Thesis, Chinese Academy of Agricultural Mechanization Sciences, Beijing, China, 2022. [Google Scholar]
  14. Yue, H.X.; Tan, B.; Wei, S.; Xie, H. Structural Design and Analysis of Air Suction Precision Metering Device for White Radish. J. Agric. Sci. Technol. 2024, 26, 120–128. [Google Scholar] [CrossRef]
  15. Liu, H.; Liao, Y.T.; Wang, L.; Wang, B.S.; Du, Z.; Liao, Q.X. Design and Experiment of Positive and Negative Pressure Combination Precision Metering Device for Pakchoi. Trans. Chin. Soc. Agric. Mach. 2022, 53, 54–65. [Google Scholar] [CrossRef]
  16. Karayel, D.; Güngör, O.; Šarauskis, E. Estimation of Optimum Vacuum Pressure of Air-Suction Seed-Metering Device of Precision Seeders Using Artificial Neural Network Models. Agronomy 2022, 12, 1600. [Google Scholar] [CrossRef]
  17. Abdolahzare, Z.; Mehdizadeh, S.A. Nonlinear Mathematical Modeling of Seed Spacing Uniformity of a Pneumatic Planter Using Genetic Programming and Image Processing. Neural Comput. Appl. 2018, 29, 363–375. [Google Scholar] [CrossRef]
  18. Na, X.Y.; Zhao, C.Y.; Sun, S.M.; Zhang, Z.G. Performance test and forecast analysis for air suction seed metering device. J. Hunan Agric. Univ. Nat. Sci. 2015, 41, 440–442. [Google Scholar]
  19. Anantachar, M.; Kumar, P.G.V.; Guruswamy, T. Neural Network Prediction of Performance Parameters of an Inclined Plate Seed Metering Device and Its Reverse Mapping for the Determination of Optimum Design and Operational Parameters. Comput. Electron. Agric. 2010, 72, 87–98. [Google Scholar] [CrossRef]
  20. Roy, S.M.; Pareek, C.M.; Machavaram, R. Optimizing the Aeration Performance of a Perforated Pooled Circular Stepped Cascade Aerator Using Hybrid ANN-PSO Technique. Inf. Process. Agric. 2022, 9, 533–546. [Google Scholar] [CrossRef]
  21. Pareek, C.M.; Tewari, V.K.; Machavaram, R. Multi-Objective Optimization of Seeding Performance of a Pneumatic Precision Seed Metering Device Using Integrated ANN-MOPSO Approach. Eng. Appl. Artif. Intell. 2023, 117, 105559. [Google Scholar] [CrossRef]
  22. Yang, Y. Study on WC-10Co-4Cr Coating Prediction Model and Multi-objective Optimization by High Velocity Oxy-Fuel spraying Based on Neural Network. Master’s Thesis, Zhejiang University, Hangzhou, China, 2023. [Google Scholar]
  23. Yang, W.C.; Kan, C.L.; Zhang, X.W.; Wu, C.; Du, Q.; Pan, W.J. Design and Test of Precision Seed Metering Device for Panax notoginseng Seedling and Seeding by Air Suction. Trans. Chin. Soc. Agric. Mach. 2021, 52, 95–105. [Google Scholar] [CrossRef]
  24. Mei, Y.R. Design and Experiment of Pneumatic Roller Type Precision Seed-Metering Device for Tomato Seedlings. Master’s Thesis, Hunan Agricultural University, Changsha, China, 2022. [Google Scholar]
  25. Ke, S.D. Research on Virtual Prototype of Pneumatic Drum Seed Metering Device Based on Seed Characteristics. Master’s Thesis, Zhejiang Sci-Tech University, Hangzhou, China, 2022. [Google Scholar]
  26. Zhao, P.; Zeng, X.G.; Kou, H.Q.; Chen, H.Y. A Kind of Numerical Model Combined with Genetic Algorithm and Back Propagation Neural Network for Creep-Fatigue Life Prediction and Optimization of Double-Layered Annulus Metal Hydride Reactor and Verification of ASME-NH Code. Int. J. Hydrog. Energy 2024, 54, 1251–1263. [Google Scholar] [CrossRef]
  27. Chen, C.; Wang, X.S.; Pu, J.; Jiao, S.S. Kinetic Analysis and Back Propagation Neural Network Model for Shelf-Life Estimation of Stabilized Rice Bran. J. Food Eng. 2024, 380, 112168. [Google Scholar] [CrossRef]
  28. Liang, Q.Y.; Pan, X.L.; Qiu, Z.F.; Zhou, H.B. Design of Intelligent Quantitative Seeding System Based on BP Neural Network. J. Anhui Agric. Sci. 2019, 47, 197–201. [Google Scholar]
  29. Yao, S.C.; Li, D.W. Neural Network and Deep Learning: Simulation and Realization Based on MATLAB, 1st ed.; Tsinghua University Press: Beijing, China, 2022; p. 118. [Google Scholar]
  30. Li, W.; Kuang, C.W.; Chen, Y.X. Prediction Model of Soil Moisture in Hainan Island Based on Meteorological Factors. Chin. J. Trop. Agric. 2023, 43, 84–89. [Google Scholar]
  31. Yao, X.W.; Zhang, L.Y.; Xu, K.L.; Qi, Y. Study on neural network-based prediction model for biomass ash softening temperature. J. Saf. Environ. 2024, 24, 3801–3808. [Google Scholar]
Figure 1. Pneumatic drum seed metering device: (a) explosion diagram of the drum; (b) overall structure and working principle; (c) working principle of the air intake plate; (d) bench; (1) drive shaft; (2) end cover; (3) drum; (4) rubber sealing ring; (5) air intake plate; (5-1) negative pressure port; (5-2) pressure isolation roller; (5-3) positive pressure port; (6) seed box; (7) seed cleaning device; (8) seed recycling bin; (9) plug tray; (10) electrical machinery; (11) fan; and (12) air compressor.
Applsci 15 03682 g001
Figure 2. Seed suction nozzle: (a) structure; (b) internal conical flow channel. (Dh and Db denote suction hole diameter and major diameter of the conical flow channel, respectively).
Applsci 15 03682 g002
Figure 3. The 128-hole plug tray.
Applsci 15 03682 g003
Figure 4. Function unit of the seed cleaning device: (a) outer side; (b) inner side.
Applsci 15 03682 g004
Figure 5. Kernel density determination by pycnometer method: (a) weight of seeds; (b) weight of water and pycnometer; (c) weight of seeds, water, and pycnometer.
Applsci 15 03682 g005
Figure 6. Phenomenon of seeds getting inserted into the suction holes (as shown in red square frames): (a) sesame seeds; (b) carrot seeds.
Applsci 15 03682 g006
Figure 7. Results of the single-factor vacuum pressure experiments for (a) Chinese cabbage; (b) carrot; (c) sesame; (d) onion; (e) cabbage; and (f) radish seed (QI, MI, and RI denote qualified index, missing index, and reseeding index, respectively).
Applsci 15 03682 g007aApplsci 15 03682 g007b
Figure 8. BPNN-MOPSO process (BPNN-MOPSO denotes optimization method of the combination of the backpropagation neural network (BPNN) predictive model and multi-objective particle swarm optimization (MOPSO) algorithm).
Applsci 15 03682 g008
Figure 9. Comparison of the optimal network performance under each number of hidden-layer neurons (R2, RMSE, and MAE denote the coefficient of determination, root mean square error, and mean absolute error between experimental and BPNN-predicted values, respectively; ¯ denotes average value of network performance indices for missing index and reseeding index; TR and TS denote training set and test set, respectively).
Applsci 15 03682 g009
Figure 10. Comparison of optimal network performance under each activation function combination (R2, RMSE, and MAE denote the coefficient of determination, root mean square error, and mean absolute error between experimental and BPNN-predicted values, respectively; ¯ denotes average value of network performance indices for missing index and reseeding index; TR and TS denote training set and test set, respectively).
Applsci 15 03682 g010
Figure 11. Comparison of the experimental and BPNN-predicted values for the missing index (MI).
Applsci 15 03682 g011
Figure 12. Comparison of the experimental and BPNN-predicted values for the reseeding index (RI).
Applsci 15 03682 g012
Figure 13. Comparison of optimal experimental and optimized values of QI (qualified index).
Applsci 15 03682 g013
Figure 14. Pareto optimal frontiers for (a) tomato; (b) pepper; and (c) Bok choi (RI and MI denote reseeding index and missing index, respectively).
Applsci 15 03682 g014
Table 1. Three-axis dimensions of the seeds.
Seed TypeL/mmW/mmT/mm
Chinese cabbage3.44 ± 0.252.61 ± 0.212.01 ± 0.25
Carrot3.43 ± 0.541.58 ± 0.200.71 ± 0.11
Sesame2.97 ± 0.202.03 ± 0.181.43 ± 0.20
Onion3.08 ± 0.161.85 ± 0.140.87 ± 0.08
Cabbage2.04 ± 0.161.75 ± 0.131.52 ± 0.20
Radish1.94 ± 0.141.73 ± 0.121.54 ± 0.11
Tomato1.71 ± 0.111.59 ± 0.101.49 ± 0.11
Pepper4.02 ± 0.423.28 ± 0.350.80 ± 0.12
Bok choi3.41 ± 0.252.50 ± 0.290.67 ± 0.10
Table 2. Physical properties of seed types.
Seed TypeGeometric Mean Diameter
(mm)
Sphericity
(%)
Thousand-Grain Weight
(g)
Kernel Density
(g·cm−3)
Chinese cabbage1.73 ± 0.1189.27 ± 2.963.13 ± 0.100.977 ± 0.026
Carrot1.56 ± 0.1746.10 ± 5.191.84 ± 0.071.155 ± 0.016
Sesame1.71 ± 0.1055.34 ± 2.433.06 ± 0.070.930 ± 0.027
Onion2.04 ± 0.1168.99 ± 4.693.28 ± 0.021.131 ± 0.014
Cabbage1.75 ± 0.1386.25 ± 5.733.64 ± 0.160.940 ± 0.021
Radish2.62 ± 0.1976.25 ± 3.6411.27 ± 0.441.042 ± 0.014
Tomato1.78 ± 0.1352.33 ± 4.173.02 ± 0.061.147 ± 0.058
Pepper2.19 ± 0.2154.60 ± 3.775.47 ± 0.050.937 ± 0.054
Bok choi1.60 ± 0.1093.14 ± 2.792.60 ± 0.050.975 ± 0.039
Table 3. Vacuum pressure range and levels for single-factor vacuum pressure experiments.
Seed TypeRangeLevel (kPa)
12345
Radish8–16 kPa810121416
Chinese cabbage, carrot, sesame, onion, cabbage4–12 kPa4681012
Table 4. Range of influencing factors.
Seed TypeVacuum Pressure (kPa)Rotational Speed (rpm)Hole Diameter
(mm)
Chinese cabbage6–1010–140.61.0
Carrot
Sesame
Onion
Cabbage8–12
Radish1014
Table 5. Factor level settings.
FactorLevel
123
Hole diameter
(mm)
0.60.81.0
Vacuum pressure
(kPa)
6/8/108/10/1210/12/14
Rotational speed
(rpm)
101214
Table 6. Orthogonal experiment results for Chinese cabbage seeds.
Seed TypeHole
Diameter
(mm)
Vacuum
Pressure
(kPa)
Rotational
Speed
(rpm)
Missing
Index
(%)
Reseeding
Index
(%)
Qualified
Index
(%)
Chinese cabbage0.661018.234.6977.08
61432.291.8265.89
81213.803.1383.07
101410.944.9584.11
10106.5110.9482.55
0.88106.2510.6883.07
81411.987.2980.73
61215.897.8176.30
8128.598.8582.55
10123.9114.8481.25
1.08122.0814.0683.86
10100.2621.6178.13
6103.6513.2883.07
6148.079.3882.55
10141.3016.1582.55
Table 7. Orthogonal experiment results for carrot seeds.
Seed TypeHole
Diameter
(mm)
Vacuum
Pressure
(kPa)
Rotational
Speed
(rpm)
Missing
Index
(%)
Reseeding
Index
(%)
Qualified
Index
(%)
Carrot0.66108.599.8981.52
61411.723.6584.63
8128.0711.2080.73
10147.5516.9375.52
10105.7320.3173.96
0.88104.6919.5375.78
8148.8513.0278.13
61210.1611.2078.64
8125.2114.0680.73
10123.6519.7976.56
1.08124.4332.5563.02
10101.3042.1956.51
6105.4717.9776.56
6146.2511.9881.77
10144.6937.2458.07
Table 8. Orthogonal experiment results for sesame seeds.
Seed TypeHole
Diameter
(mm)
Vacuum
Pressure
(kPa)
Rotational
Speed
(rpm)
Missing
Index
(%)
Reseeding
Index
(%)
Qualified
Index
(%)
Sesame0.661013.805.9980.21
61417.713.9178.39
81212.509.6477.86
101412.5012.2475.26
101010.6818.7570.57
0.88107.2914.3278.39
81410.4210.1679.42
61211.987.5580.47
8128.8511.7279.43
10126.7720.0573.18
1.08125.7315.3678.91
10102.8624.4872.66
6107.0312.5080.47
6148.5911.2080.21
10145.2118.7576.04
Table 9. Orthogonal experiment results for onion seeds.
Seed TypeHole
Diameter
(mm)
Vacuum
Pressure
(kPa)
Rotational
Speed
(rpm)
Missing
Index
(%)
Reseeding
Index
(%)
Qualified
Index
(%)
Onion0.661016.671.5681.77
61425.780.5273.70
81214.583.3982.03
101412.247.8179.95
10109.3812.5078.13
0.88106.2512.5081.25
81411.205.9982.81
61213.547.5578.91
8128.599.1182.29
10124.4317.1978.39
1.08125.4716.9377.60
10102.0830.2167.71
6107.0313.0279.95
6149.3810.4280.21
10144.1721.8873.96
Table 10. Orthogonal experiment results for cabbage seeds.
Seed TypeHole
Diameter
(mm)
Vacuum
Pressure
(kPa)
Rotational
Speed
(rpm)
Missing
Index
(%)
Reseeding
Index
(%)
Qualified
Index
(%)
Cabbage0.6121410.165.4784.37
10129.386.2584.37
81014.066.2579.69
81416.671.8281.51
12108.597.2984.12
0.810105.2110.4284.37
10148.855.9985.16
8129.386.2584.37
10126.258.5985.16
12124.6912.2483.07
1.08145.738.0786.20
8104.9514.3280.73
10123.399.6486.97
12143.3913.5483.07
12101.0416.6782.29
Table 11. Orthogonal experiment results for radish seeds.
Seed TypeHole
Diameter
(mm)
Vacuum
Pressure
(kPa)
Rotational
Speed
(rpm)
Missing
Index
(%)
Reseeding
Index
(%)
Qualified
Index
(%)
Radish0.6121227.340.0072.66
101451.040.0048.96
101030.990.0069.01
141020.050.0079.95
141421.880.0078.12
0.812106.517.8185.68
121410.164.6985.15
101213.280.0086.72
12127.035.7387.24
14125.478.8585.68
1.014146.257.2986.46
14103.139.3887.49
12126.257.2986.46
101010.940.0089.06
101417.970.0082.03
Table 12. Test set data.
No.Geometric Mean
Diameter
(mm)
Sphericity
(%)
Thousand-Grain Weight
(g)
Kernel Density
(g·cm−3)
Hole
Diameter (mm)
Vacuum Pressure (kPa)Rotational Speed (rpm)Missing Index
(%)
Reseeding Index
(%)
11.7389.273.130.9770.610106.5110.94
21.7389.273.130.9770.661432.291.82
31.7389.273.130.9770.88128.598.85
41.5646.101.841.1551.010101.3042.19
51.5646.101.841.1550.88125.2114.06
61.5646.101.841.1550.610147.5516.93
71.7155.343.060.9301.06148.5911.20
81.7155.343.060.9300.810126.7720.05
91.7155.343.060.9300.881410.4210.16
102.0468.993.281.1310.861213.547.55
112.0468.993.281.1310.6101412.247.81
122.0468.993.281.1310.681214.583.39
131.7586.253.640.9401.012143.3913.54
141.7586.253.640.9400.612108.597.29
151.7586.253.640.9401.08145.738.07
162.6276.2511.271.0420.812127.035.73
172.6276.2511.271.0420.812106.517.81
182.6276.2511.271.0420.6141421.880.00
Table 13. Settings of the BPNN training parameters.
ParameterValue
Maximum no. of iterations1000
Target error1 × 10−4
Learning rate0.01
Training algorithmLevenberg–Marquardt
Table 14. Settings of the MOPSO algorithm parameters.
ParameterValue
Population size100
Non-dominated solution library size100
No. of iterations200
Individual learning coefficient1.5
Global learning coefficient1.5
Number of grids per dimension40
Inertia weightMax: 0.9
Min: 0.4
Table 15. Values of e, f, g, and h for each seed.
Seed Typex2x3
efgh
Cabbage8121018
Carrot4814
Radish1016
Tomato410
Chinese cabbage6
Sesame
Onion
Bok choi
Pepper18
Table 16. Optimal network performance under each number of hidden-layer neurons (R2, RMSE, and MAE denote the coefficient of determination, root mean square error, and mean absolute error between experimental and BPNN-predicted values, respectively; ¯ denotes average value of network performance indices for missing index and reseeding index).
No. of
Hidden-Layer Neurons
Average Value of Network Performance Indices for Two Outputs
Performance Indices for the Training SetPerformance Indices for the Test Set
RMSE ¯ MAE ¯ R 2 ¯ RMSE ¯ MAE ¯ R 2 ¯
42.01041.47750.93132.27441.69810.9141
51.61131.20200.95492.23061.65820.9112
61.77681.22970.94662.28811.69190.9196
71.53251.13330.96012.16071.63190.9231
81.42730.99350.96412.07281.73910.9290
91.54771.15390.95932.49431.83350.9004
101.71671.19450.95002.65381.96930.8913
111.49441.07830.96022.69421.93530.8850
121.57441.10790.95792.65392.06200.8738
131.55201.15760.95912.25831.87480.9218
Table 17. Optimal network performance under each activation function combination (R2, RMSE, and MAE denote the coefficient of determination, root mean square error, and mean absolute error between experimental and BPNN-predicted values, respectively; ¯ denotes average value of network performance indices for missing index and reseeding index).
Hidden-Layer
Activation Function
Output-Layer
Activation Function
Average Value of Network Performance Indices for Two Outputs
Performance Indices for the Training SetPerformance Indices for the Test Set
RMSE ¯ MAE ¯ R 2 ¯ RMSE ¯ MAE ¯ R 2 ¯
LogsigTansig2.20381.55650.91792.81722.15040.8766
LogsigPurelin1.42730.99350.96412.07281.73910.9290
TansigTansig2.00021.36020.93232.60831.93060.8949
TansigPurelin1.43031.06850.96462.14441.84520.9281
PurelinTansig3.06682.23870.84093.41412.42090.8192
PurelinPurelin3.82482.66580.75124.22893.03120.7071
Table 18. Performance of the optimal performance network (R2, RMSE, and MAE denote the coefficient of determination, root mean square error, and mean absolute error between experimental and BPNN-predicted values, respectively).
NetworkOutputDatasetPerformance Indices
RMSE MAE R 2
BPNN
(7-8-2)
Missing indexTraining set1.48831.09370.9627
Test set1.88071.34400.9287
Reseeding indexTraining set1.20640.84360.9753
Test set2.01781.75590.9497
Table 19. Weights and biases of the optimal performance BPNN.
Connection Weight Between Input and Hidden Layers
W1
Connection Weight Between Hidden and Output Layers (Transposition)
W2T
Hidden-Layer Bias
bh
Output-Layer Bias
bo
−2.7320−1.3529−0.64470.50440.72613.9120−0.9372−2.1289−0.55366.05003.1567
2.28522.0053−1.25720.51243.90600.98320.11910.5815−1.7001−4.0843−2.1084
−2.32900.24660.35220.89684.42550.5757−0.0804−1.45650.34606.4274
−1.6748−0.33260.83520.33860.37352.1485−0.5065−0.28701.39060.0285
0.42450.22094.0421−0.1324−0.7695−2.7666−1.74440.0490−0.2990−3.8582
−0.1538−1.43281.3190−2.7081−0.5418−1.2597−0.6917−0.05820.2649−0.5468
0.55341.7438−0.74041.07962.80591.27240.0536−0.80762.3069−2.5635
1.8411−1.7465−3.29822.4162−0.7691−1.94190.2147−0.09751.22903.1703
Table 20. Comparison of the optimal experimental and optimized results.
Seed Type ParameterIndices
Hole
Diameter (mm)
Vacuum
Pressure
(kPa)
Rotational
Speed
(rpm)
Missing
Index
(%)
Reseeding Index
(%)
Qualified Index
(%)
CabbageExperimental value1.0010.0123.399.6486.97
Optimized value1.0011.6185.206.2888.52
CarrotExperimental value0.606.01411.723.6584.63
Optimized value0.774.31411.702.2486.06
RadishExperimental value1.0010.01010.940.0089.06
Optimized value0.9810.6108.761.5989.65
OnionExperimental value0.808.01411.205.9982.81
Optimized value0.716.21011.963.3684.68
Chinese cabbageExperimental value0.6010.01410.944.9584.11
Optimized value0.709.01410.485.1984.33
SesameExperimental value1.006.0107.0312.5080.47
Optimized value0.856.31410.526.4683.03
Table 21. Optimization results.
Seed TypeParameterIndices
Hole
Diameter (mm)
Vacuum
Pressure
(kPa)
Rotational Speed
(rpm)
Missing
Index
(%)
Reseeding
Index
(%)
Qualified
Index
(%)
Tomato0.755.613.711.852.6685.50
Pepper1.0010.418.011.542.9485.52
Bok choi0.678.614.010.724.4184.87
Table 22. Verification results.
Seed Type Missing Index
(%)
Reseeding Index
(%)
Qualified Index
(%)
TomatoPredicted value11.852.6685.50
Experimental value11.192.0886.73
Absolute error0.660.581.23
PepperPredicted value11.542.9485.52
Experimental value8.853.6587.50
Absolute error2.690.711.98
Bok choiPredicted value10.724.4184.87
Experimental value9.115.2185.68
Absolute error1.610.800.81
Disclaimer/Publisher’s Note: The statements, opinions and data contained in all publications are solely those of the individual author(s) and contributor(s) and not of MDPI and/or the editor(s). MDPI and/or the editor(s) disclaim responsibility for any injury to people or property resulting from any ideas, methods, instructions or products referred to in the content.

