Abstract
Precise detection of canopy parameters is vital as it offers essential information for pest management in orchards. Among these parameters, leaf area density stands out as a key indicator of orchard canopies. A detection algorithm for leaf area density was proposed, and a leaf area density detection system for orchard canopies was designed based on the algorithm. By processing the point cloud data acquired by using LiDAR together with the algorithm, the total leaf area of the fitted leaves was calculated. Through an orthogonal regression experiment conducted on a laboratory-simulated canopy, this research established a mathematical calculation model (
= 0.96) for determining the leaf area density of an orchard canopy. The leaf area density of an orchard canopy can be calculated using the total leaf area of the fitted leaves and an established mathematical model. To assess the accuracy of the detection system, both laboratory-simulated canopy experiments and real orchard canopy experiments were conducted. The results revealed that the absolute value of the mean relative error in the laboratory-simulated canopy experiments was 11.58%, and the absolute value of the mean relative error in the orchard canopy experiments was 16.75%. The research results have confirmed the feasibility of the LiDAR point cloud data processing algorithm. Furthermore, this algorithm can provide theoretical support for the subsequent development of intelligent plant protection equipment in orchards.
1. Introduction
Excessive pesticide application leads to increased planting costs and poses threats to human health and the environment [1,2,3]. In recent years, to reduce pesticide usage while ensuring effective pest and disease control, precise variable-rate spraying has attracted extensive research attention [4,5,6,7,8,9]. Canopy parameters for orchards are major factors influencing the precision of variable-rate spraying using plant-protection machinery, encompassing parameters such as canopy thickness, shape, and leaf area density. Numerous scholars have conducted extensive research on online and precise measurement methods for canopy parameters in orchards [10,11,12].
Ultrasonic sensors are widely used for measuring canopy parameters in orchards. However, measurement accuracy is significantly affected by angular divergence, leading to susceptibility to variations in received signal strength and typically limited measurement range [13,14,15]. LiDAR sensors exhibit high measurement accuracy and stability, demonstrating excellent performance in orchard canopy parameter detection [16,17]. Under the assumption of uniform LiDAR motion, a single-line LiDAR was used to scan a canopy made of grapevines, and multiple frames of point cloud data were fused to obtain point cloud data of the canopy within the target area [18]. The ratio of height to width of point cloud clusters and point cloud density were evaluated to effectively identify the positions of tree trunks and support rods within the canopy point cloud [19]. A self-propelled vehicle equipped with a laser scanner was used to scan pruned and symmetrically regular orchard canopies, and the geometric parameters of the canopy including height, width, surface area, and volume were also measured [20]. The functional relationship between the number of point clouds and the number of leaves was analyzed and verified by using the Matlab curve fitting toolbox cftool, and mathematical functions were employed to fit the number of point clouds to the number of leaves to calculate leaf area density [21]. A leaf area detection algorithm based on LiDAR moving speed and detection distance was proposed. In laboratory-simulated canopy detection, the root mean square error of this algorithm was 1401.17 cm2, enhancing the reliability and accuracy of detection results [22]. The canopy was divided into four vertical sections and the relationship between leaf area density and the number of point clouds in different sections was explored to guide the spray. Experimental results showed that this variable-rate spraying method saved 68.30% of pesticide usage compared to traditional methods [23]. The LiDAR was used to scan the canopy structure, and the volume of the canopy section was calculated in real-time using a voxel grid method. This method achieved an accurate volume calculation in laboratory settings, with the relative error ranging from 3.30% to 9.40% [24]. A matrix analysis was conducted on the point clouds of a peanut canopy structure to obtain the canopy height characteristics. Experimental results indicated that the mean deviation from the actual results of the peanut canopy height, measured using this method, was 11% [25]. In the existing research, studies on canopy leaf density are mostly based on methods utilizing the point cloud count and the voxel grid count. Due to the resolution limitations of LiDAR, this leads to incompleteness in the scanning of leaf point clouds in canopy. The previous methods rely on leaf scanning point clouds for judgment, and can only improve measurement accuracy by continually enhancing resolution, which in turn will increase measurement and computation costs. Corresponding processing algorithms to address the incompleteness of leaf-scanning point clouds still need to be developed in order to enhance the capability to detect the leaf area density of orchard canopies.
This research uses inter-frame feature-matching from LiDAR scans of the canopy to obtain multi-angle fused point clouds of orchard canopies. Considering the shapes of the leaf point clouds in a canopy, a leaf area density detection algorithm based on leaf fitting is proposed to process the fused point cloud data. Experiments detecting the canopy leaf area density using LiDAR were conducted and a mathematical calculation model for detecting the canopy leaf area density was established. The feasibility and accuracy of the detection algorithm were verified through laboratory-simulated canopy tests and detection tests conducted in an orchard.
2. Materials and Methods
2.1. Canopy Leaf Area Density Detection System
The detection system for leaf area density of orchard canopies includes a LiDAR sensor, an industrial computer, a self-propelled cart, and a 12V DC power supply. The LiDAR sensor (MID-360, Livox Technology Co., Ltd., Shenzhen, China) is used to obtain point cloud data of the orchard canopy. It has a vertical field of view ranging from −7° to 52°, with an angular random error of less than 0.15°, and outputs 200,000 points per second. It is equipped with a six-axis inertial measurement IMU (icm40609, TDK InvenSense, San Jose, CA, USA), and it can accurately perceive the altitude information of the cart and acceleration data in three degrees of freedom. This can be used to detect changes in the position and orientation of the LiDAR during its movement in the orchard, thereby eliminating the point cloud caused by LiDAR’s motion. An industrial personal computer (NVIDIA Xavier NX 16G, NVIDIA, Santa Clara, CA, USA) is equipped with a canopy leaf area density detection algorithm based on leaf fitting, which is used for the collection and processing of the point cloud data. A self-propelled cart (Scoutmini, Robosen Robotics, Shenzhen, China) is used to carry the sensor and the industrial personal computer, enabling dynamic data acquisition of both the laboratory-simulated and orchard canopies. During experiments and tests, the cart’s speed is maintained at 0.5 . The DC power supply provides the necessary operating current for both the industrial PC and the LiDAR sensor. Data transmission between the LiDAR sensor and the industrial PC is achieved through a wired network connection. The detection system is shown in Figure 1.
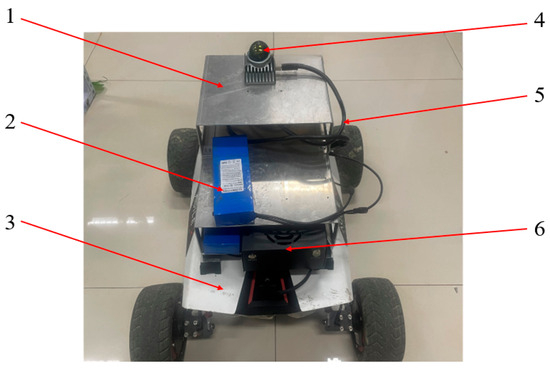
Figure 1.
Canopy parameter detection system. 1. Fixed bracket; 2. power supply; 3. self-propelled cart; 4. LiDAR sensor; 5. transmission cable; 6. industrial personal computer.
2.2. Leaf Area Density Detection Algorithm Based on Leaf Fitting
This research proposes a leaf fitting-based algorithm for detecting the leaf area density of an orchard canopy, which is designed to process point cloud data while fully considering the shape factors of leaves during the processing. The algorithm mainly consists of four key steps, which are detailed as follows:
The first step is data acquisition and preprocessing. The canopy leaf area density detection system obtains point cloud data by moving with the aid of a self-propelled vehicle. However, during the data collection process, due to the displacement of the LiDAR, the point cloud data is prone to distortion. To address this issue, this research adopts the LIO-LIVOX algorithm. On the one hand, it utilizes an Inertial Measurement Unit (IMU) to calibrate the LiDAR data, thereby reducing the point cloud distortion caused by changes in the LiDAR’s attitude. It employs a multi-angle LiDAR scan data fusion method. By matching the point clouds between different frames, it acquires LiDAR point cloud data of the orchard from various angles, thus improving the spatial resolution and accuracy of the orchard canopy parameters.
The second step is the removal of non-target point cloud. The point cloud data collected by LiDAR inevitably contains some non-canopy point clouds, which mainly originate from other objects in the surrounding environment, such as fixed orchard trellises, branches within the canopy, and weeds on the ground. To remove these non-target point cloud, this research employs multiple methods. First, the straight-through filtering method is utilized to eliminate point clouds that are directly far from the canopy. Second, considering that the shape and distribution of leaf clusters are relatively complex and their local sphericity is usually high, a screening method based on local sphericity (S) is adopted to eliminate non-target point clouds caused by fixed orchard trellises and branches within the canopy, with the threshold set as S < 0.1. Finally, the DBSCAN clustering algorithm is applied to remove point clouds of weeds on the ground, thereby obtaining the target canopy. The extracted canopy point clouds are then fitted with a cuboid to obtain key parameters such as canopy thickness and detection distance.
The third step is leaf fitting-based processing. This research employs a leaf fitting method to detect leaf area density. By extracting the contour or boundary information of the leaves, a more realistic leaf model is constructed. To some extent, this can mitigate the detection errors occurring due to incomplete leaf scanning point clouds caused by the resolution limitations of LiDAR, thus yielding more accurate leaf area calculation results. For different plant species and growth environments, various clustering methods can be adopted to improve the accuracy of leaf recognition. In environments such as orchards where leaves are densely packed and irregularly distributed, this research selects the distance-based K-means clustering method. The K-means method can group data points into a predefined number of clusters (k), ensuring that each data point within a cluster is closest to its respective cluster center. By adjusting the value of k and optimizing the selection of cluster centers, it can better adapt to the situation of densely packed and unevenly distributed leaves in orchards, thereby enhancing the accuracy of leaf recognition. In practical scenarios, the exact number of leaves is often difficult to obtain, and the chosen value of k directly affects the clustering results. To ensure the accuracy and stability of k, this research takes a series of measures. First, the canopy point cloud data is downsampled using a voxel grid size of 0.02 m × 0.02 m × 0.02 m. This step can reduce the interference of detection distance on the point cloud spacing and improve computational efficiency. Before conducting the leaf area density detection experiment, the length (L) and width (H) of the target leaves are measured and statistically analyzed. Using Equation (1), the number of point clouds () scanned from the front side of a single leaf after downsampling is calculated. Based on the result of Equation (2), the initial value of k for K-means clustering is determined, where represents the total number of valid point clouds in the canopy. Subsequently, the number of valid clusters obtained after the initial clustering is counted and the value of k are updated accordingly. Then, the K-means clustering continues and iterates three times until the value of k stabilizes.
The fourth step is the calculation of leaf area density. Using a method based on plane fitting of point cloud data, all point clouds in each cluster are projected onto the fitted plane. The coordinates of the edge point clouds of the entire cluster are statistically analyzed to form the outer contour of the cluster. The mark in Figure 2 represents an outer contour of the cluster. The enclosed area is then calculated using the polygon area calculation formula. By summing the areas of all clusters, the total leaf area of the fitted leaves from the canopy point cloud of the orchard is obtained. This fitted leaf area is then substituted into the established mathematical model for calculating canopy leaf area density of the orchard to calculate the density.
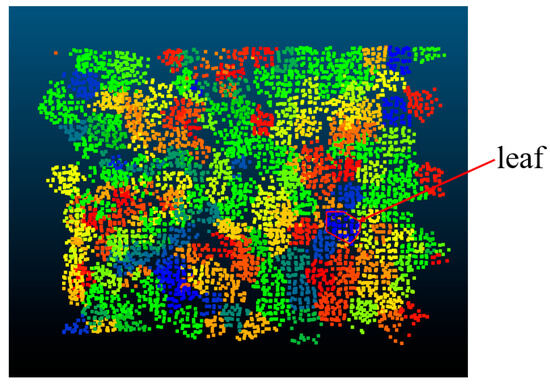
Figure 2.
Schematic diagram of leaf fitting. The colors in the image represent different clusters formed by point cloud segmentation.
2.3. Orthogonal Regression Experiment Design
When using LiDAR for canopy leaf area density detection, various factors can influence the results. These include detection distance, overlapping of leaves within the canopy, leaf distribution, and the magnitude of leaf area density, all of which can affect the scanned point cloud. Directly exploring the relationship between the area of point cloud-fitted leaves and leaf area density during the detection process can introduce certain errors. To mitigate these effects, this research designs a quadratic regression orthogonal experiment to establish a mathematical model for calculating leaf area density. The range of experimental factors is determined based on the target orchard and the operating conditions of plant protection machinery as references. The canopy thickness ranges from 0.2 m to 1.2 m, the leaf area density ranges from 2 to 6 , and the detection distance ranges from 1 m to 2 m. The coding table for the three-factor quadratic regression orthogonal design is shown in Table 1 The coding table for the orthogonal composite design of the three-factor quadratic regression is shown in Table 2. To avoid accidental errors in a single measurement, each experimental condition is measured 10 times.

Table 1.
Ternary quadratic regression orthogonal factor level coding table.
Table 2.
Binary quadratic regression orthogonal combination design coding.
2.4. Laboratory-Simulated Canopy
To explore the precise relationship between the area of laser point cloud-fitted leaves and the canopy leaf area density in an orchard, and to establish a mathematical model for calculating the canopy leaf area density, this research builds a laboratory-simulated test bench, with reference to the actual conditions of an orchard canopy. The test bench is shown in Figure 3. To facilitate the calculation of canopy volume, this research constructs the simulated canopy in a rectangular cuboid structure. The simulated canopy test bench is constructed using aluminum profiles, transparent lines, and artificial leaves. The aluminum profiles and transparent lines are used to fix the artificial leaves and effectively simulate the branch and trellis structure found in actual orchard canopy, while the artificial leaves are used to mimic real leaves. The specific dimensions of the simulated canopy are set as follows: canopy length is 1 m, canopy thickness is 1.3 m, and canopy height is 1 m. The artificial leaves are uniformly arranged in the detection area beneath the frame, with 3 to 13 layers placed along the direction of detection. The distance between each layer is 10 cm. By adjusting the number of layers and the quantity of artificial leaves, it is possible to simulate canopy conditions with varying canopy thicknesses and leaf area densities, thereby meeting the diverse requirements of the experiment.
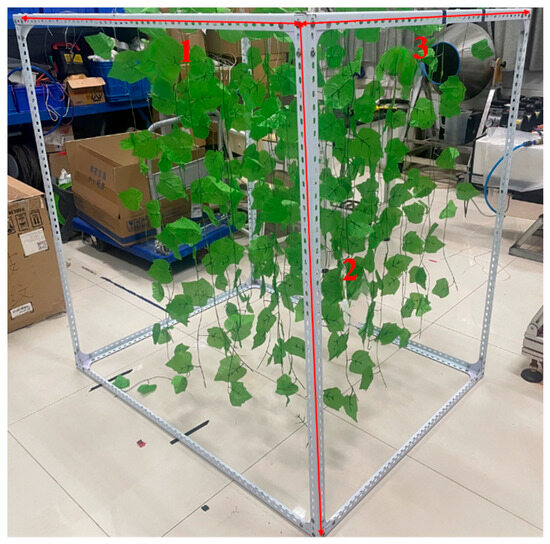
Figure 3.
Simulated canopy test bench. 1. Canopy thickness; 2. canopy height; 3. canopy width.
The definition of leaf area density in this research refers to the literature [15]. The areas of the artificial leaves were measured by randomly selecting 10 leaf samples. The sampled leaves were scanned using a scanner. The image processing software (Image Pro Plus, Meyer instruments, Inc., Houston, TX, USA) is used to calculate the area of the simulated leaves. The average leaf area of the artificial leaves is 65.12 cm2. The temperatures ranged from 20 °C to 23 °C.
2.5. Test Verification
To verify the accuracy of the mathematical calculation model for canopy leaf area density of an orchard based on leaf fitting, this research designs both laboratory-simulated canopy validation experiments and tests in a Nashi pear orchard with horizontal trellis cultivation. The settings for the laboratory-simulated canopy were configured by modifying the parameters, as shown specifically in Table 3. The orchard selected for this research is situated in Guanzhuangli, Fangxian Town, Danyang City, Jiangsu Province, China. The orchard adopts a standard planting pattern with row spacing of 4 m, an average tree height of 3 m, and plant spacing of 2 m. The mean temperature in the orchard is 21 °C, and the wind speed ranges between 1.6 and 2.5 . As shown in Figure 4, the self-propelled cart is positioned between two orchard rows, and the canopy on the left side of the cart’s path of travel is selected as the target canopy for detection. The red arrow indicates the direction of cart movement. The cart travels 10 m in the forward direction, with sampling being conducted every 0.8 m. The sampling areas are indicated by the red rectangles in Figure 4, each with a sampling width of 0.5 m, resulting in a total of 10 sampling points. To ensure the accuracy and reliability of the data, each sampling point undergoes three detections. Concurrently, manual measurements were taken for canopy height, canopy thickness, and leaf area density within the sampling areas. The canopy thickness is defined as the distance from the farthest edge of the left canopy to the trunk of the tree. The actual leaf area density is calculated using Equation (3), as shown in [10,15].
where T represents the canopy thickness measured at the sampling point, H represents the canopy height at the sampling point, d represents the sampling width,
represents the mean leaf area, and N represents the number of leaves within the sampling area.
Table 3.
Settings of laboratory-simulated canopy.
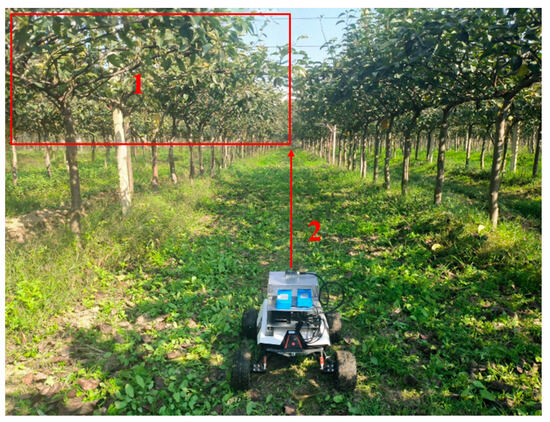
Figure 4.
Schematic diagram of field experiment. 1. Canopy; 2. forward direction.
3. Results
3.1. Mathematical Model Analysis
The results of the quadratic regression orthogonal experiment based on leaf fitting are shown in Table 4 below. The experimental results were calculated using software (MiniTab 2022, Minitab Inc., State College, PA, USA) and analyzed in conjunction with the results of the analysis of variance (ANOVA). The ANOVA results are presented in Table 5. Considering both the P-value and the F-value comprehensively, the cross-term () between canopy thickness () and leaf area density () shows a strong correlation with the fitted leaf area, and both the linear ( and quadratic ( terms of detection distance ( and the cross-term () also have significant effects on the results. Both canopy thickness () and leaf area density () will affect the degree of leaf interlacing, which directly influences the quantity of point cloud data returned by the lidar. The cross-term () has the most significant impact on the results. The detection distance ( will affect the intensity of the reflected optical signal received by the lidar, and thus it will also impact the results. Therefore, the fitting equation was optimized by removing insignificant terms, leading to the optimized result shown in Equation (4). The value of optimized fitting equation is 0.96.
Table 4.
Leaf fitting experiment results.
Table 5.
Standard deviation analysis of fitted equations.
3.2. Experiment Verification Results
The results of the laboratory-simulated canopy validation experiment are shown in Table 6, and the absolute value of average relative error is 11.58%. When the canopy thickness (0.60 m) and actual leaf area density ( remain constant, as the detection distance changes, the system’s measurement results are consistently higher than the actual values. The difference ranges from to . As the detection distance increases, the detection angle gradually decreases. During the canopy thickness measurement, the number of detected point cloud points from the rear decreases, leading to an underestimation of the measured canopy thickness. Consequently, this results in an overestimation of the leaf area density. The overall average error in the leaf area density measurement is 8.23%. When the canopy thickness (0.6 m) and detection distance (1.5 m) remain constant, the overall measurement discrepancy increases as the actual leaf area density rises. With the gradual increase in leaf area density, the number of leaves within the canopy increases, leading to more overlapping among leaves. When the actual leaf area density reaches , the measurement discrepancy decreases. Due to the occlusion effect, leaves in the rear of the canopy cause the detected point cloud data to become sparse and reduced in quantity. The non-uniform distribution of the point cloud tends to result in an underestimation of the measured canopy thickness. Consequently, this leads to an overestimation of the leaf area density measurement, which partially counteracts the overlapping error, ultimately reducing the overall discrepancy. When the detection distance (1.5 m) and actual leaf area density ( remain constant, the difference between the measured and true values ranges from to as the canopy thickness varies. When the canopy thickness exceeds 0.70 m, the discrepancy becomes significantly larger. As the canopy thickness increases, the point cloud data from the deeper layers becomes sparser during scanning, leading to an underestimation of the measured leaf area compared to the actual value. When the canopy thickness is small, the relative error is also small, indicating high accuracy. However, as the canopy thickness increases, the relative error gradually enlarges, suggesting that the detection accuracy of this algorithm will decrease when processing thicker canopies. Nevertheless, this algorithm still has certain advantages in overall performance and shows potential in detecting leaf area density.
Table 6.
Simulation of canopy experiment results.
The experimental results for the orchard are shown in Figure 5 below. The absolute average relative error of observed mean leaf area density and predicted mean leaf area density is 16.75% and maximum and minimum errors are 34.58% and 0.77%. When sampling occurs at the junction of the canopies of two trees, the leaves are concentrated on both sides of the sampling area, while the point cloud in the middle is relatively sparse, which can lead to missed and false detections of the canopy. When the leaf area density at the sampling point is below , the average relative error is 10.14%. The leaf area density detection based on the fitted leaf method demonstrates good applicability and accuracy. Within a certain range of leaf area density, the leaf area density detection method based on the fitted leaf approach demonstrates good applicability and accuracy.
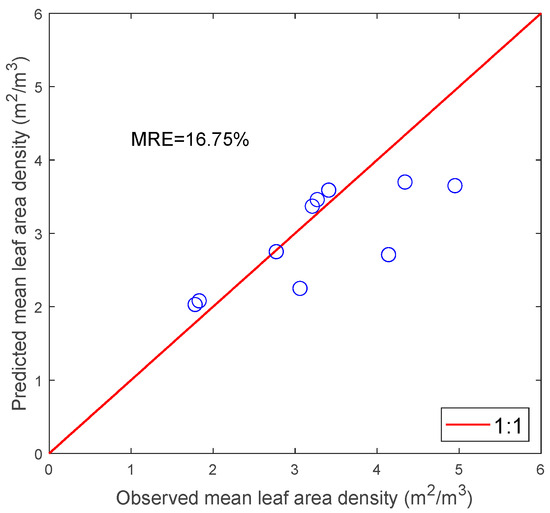
Figure 5.
Diagonal error plot for canopy leaf area density.
4. Discussion
In studies on canopy parameter detection using ultrasonic waves [10,14,15], it has been found that both their accuracy and resolution need further improvement. Although some algorithms for processing echo signals have been proposed, due to the relatively weak penetration ability of ultrasonic waves and the low resolution of ultrasonic measurement data, the estimation of leaves within the canopy is inaccurate. With the continuous advancement of technology, miniaturized and LiDAR devices have been applied in canopy parameter measurements [20,22,24,26]. Among the existing studies on canopy parameter measurements using LiDAR, methods based on point cloud counting and voxel grid counting are relatively commonly used. Point cloud counting can be employed to measure the canopy leaf area density. Relevant studies have further enhanced the accuracy by eliminating non-target point clouds within the canopy. However, the resolution of LiDAR is affected by its own hardware, leading to incomplete scanning of leaf point clouds within the canopy, which introduces errors into point cloud counting-based measurements. The voxel grid method can, to a certain extent, compensate for incomplete scanning. Nevertheless, it does not consider the shape of target leaves, making it unable to achieve more precise measurements. To address this issue, this research proposes a leaf area density detection algorithm based on leaf fitting. This algorithm clusters and fits the leaf point clouds within the canopy to approximate the outer contours of the leaves. This approach can, to some extent, reduce the impact of incomplete scanning. Both indoor and outdoor experimental results in this research confirm the feasibility and accuracy of the leaf area density detection algorithm based on leaf fitting.
In existing studies, unmanned aerial vehicles (UAVs) equipped with LiDAR are commonly used to measure fruit tree canopy information [11,27,28,29]. The acquired point cloud data is utilized to locate the target canopy or is further processed to calculate the volume of the target canopy, providing guidance for field operations. To further enhance accuracy, researchers calculate the leaf area of the target canopy based on the point cloud data obtained from LiDAR using the voxel-based inversion method. This research measures the leaf area of orchard canopies using a ground robot equipped with LiDAR. When traveling in the orchard, the ground robot is less affected by environmental factors such as wind and airflow, enabling it to maintain a relatively stable motion trajectory and attitude. This reduces the distortion and errors in point cloud data caused by platform shaking, thereby improving the stability and accuracy of data collection. The orchard studied in this research employs a horizontal trellis cultivation system, with metal mesh structures above it. The use of UAVs for measurement would introduce point cloud noise. However, the measurement system in this research had difficulty covering the top regions of the fruit tree canopies, failing to obtain more comprehensive three-dimensional information. This will be further considered for different application scenarios in later research.
In an orchard cultivated using the horizontal trellis system, when the leaf area density in the sampling area is lower than 4 m2/m3, the relative measurement error is 10.14%. This indicates that the leaf area density detection algorithm based on leaf fitting performs well within the leaf area density range of 1.0 m2/m3 to 4.0 m2/m3, demonstrating the applicability of the algorithm proposed in this research. This result is significantly better than that obtained using the ultrasonic method [10,15] and also superior to the result based on the method of measuring the number of leaves using point cloud counting [26]. However, as the leaf area density increases, the degree of overlap between leaves intensifies, significantly affecting the leaf fitting effect and leading to a gradual increase in errors. Due to the high degree of overlap, the scanning of leaf point clouds within the canopy is incomplete, which may result in an insufficient number of basic point clouds for leaf fitting. Consequently, during the fitting process, these leaves may merge with surrounding leaves or be filtered out as noise, thereby introducing errors into the detection of the leaf area density. To further verify the reliability of our conclusions, we plan to conduct orchard experiments at different stages in later research. The characteristics of tree canopy leaves vary in orchards at different stages. By conducting experiments at various times, we can obtain more comprehensive data to evaluate the stability and accuracy of our proposed canopy density detection method and the related conclusions.
The results of laboratory-simulated canopy validation experiments were superior to those conducted in an actual orchard with horizontal trellis cultivation. The mathematical calculation model (Formula 4) used in this research for orchard canopy leaf area density was derived from the results of laboratory-simulated canopy experiments. In these simulations, the arrangement of the artificial leaves only considered the scenario where the leaves were facing the LiDAR directly. However, in real situations, the growth angles of the leaves and the scanning angles of the LiDAR often have an impact on the detection results [30], particularly during the clustering process, where point clouds from leaves at different angles can lead to significant errors. In future research, a multi-sensor fusion algorithm will be incorporated to compensate for errors caused by angular variations.
5. Conclusions
This research proposes an orchard canopy leaf area density detection algorithm based on leaf fitting and constructs a detection system utilizing this algorithm. Through secondary orthogonal regression experiments conducted on laboratory-simulated canopy, a mathematical calculation model for orchard canopy leaf area density was established. The results indicate that this algorithm is suitable for detecting the leaf area density of orchard canopies.
Leaf area density detection was conducted for both laboratory-simulated canopies and orchard canopy under designed conditions. Experimental results showed that the absolute value of the average relative error was 11.58% in the laboratory-simulated canopy experiments and 16.75% in the orchard canopy experiments. These results verified the applicability and accuracy of the proposed algorithm compared to existing measurement methods.
The actual orchard experiment results indicated that the leaf area density detection algorithm based on leaf fitting performed well within a leaf area density range of 1.0–4.0 m2/m3. When the leaf area density index of the orchards was high, the algorithm was affected by increased leaf overlap, leading to a gradual increase in detection error.
This research established a mathematical calculation model for canopy leaf area density of orchard, further validating the capability of LiDAR technology in smart agriculture applications. In future research, a multi-sensor fusion algorithm will be incorporated to compensate for errors caused by leaf overlap and angle, further improving measurement accuracy. An integrated measurement and controlled spraying algorithm will be developed to facilitate the practical application of this technology.
Author Contributions
M.O.: conceptualization, methodology, writing—review and editing, supervision. Y.Z.: investigation, formal analysis, writing—original draft. Z.Y.: formal analysis, methodology. J.Z.: investigation, validation. W.J.: conceptualization, writing—review and editing. X.D.: investigation. All authors have read and agreed to the published version of the manuscript.
Funding
This research was funded by the Project of Faculty of Agricultural Equipment of Jiangsu University (No. NZXB20210101), Priority Academic Program Development of Jiangsu Higher Education Institutions (PAPD-2023-87).
Institutional Review Board Statement
Not applicable.
Informed Consent Statement
Not applicable.
Data Availability Statement
The data presented in this study are available within the article.
Acknowledgments
The authors thank the Faculty of Agricultural Equipment of Jiangsu University for its facilities and support.
Conflicts of Interest
The authors declare no conflicts of interest.
References
- Xiao, L.; Liu, J.; Ge, J. Dynamic game in agriculture and industry cross-sectoral water pollution governance in developing countries. Agric. Water Manag. 2021, 243, 106417. [Google Scholar] [CrossRef]
- Yang, Y.; Tao, Y.; Dou, H.; Xu, J.; Yang, Y.; Bu, Y.; Shan, Z.; Zhou, R. Progress in Research on Ecological Toxicity of Combined Pollution of Pesticide and Heavy Metals. Chin. J. Pestic. Sci. 2021, 23, 10–21. [Google Scholar]
- Guo, Z.; Wu, X.; Jayan, H.; Yin, L.; Xue, S.; El-Seedi, H.R.; Zou, X. Recent developments and applications of surface enhanced Raman scattering spectroscopy in safety detection of fruits and vegetables. Food Chem. 2024, 434, 137469. [Google Scholar] [CrossRef] [PubMed]
- Wang, A.C.; Li, W.; Men, X.H.; Gao, B.J.; Xu, Y.F.; Wei, X.H. Vegetation Detection Based on Spectral Information and Development of a Low-cost Vegetation Sensor for Selective Spraying. Pest Manag. Sci. 2022, 78, 2467–2476. [Google Scholar] [CrossRef]
- Ji, X.; Wang, A.; Wei, X. Precision Control of Spraying Quantity Based on Linear Active Disturbance Rejection Control Method. Agriculture 2021, 11, 761. [Google Scholar] [CrossRef]
- Zheng, Y.J.; Chen, B.T.; Lyu, H.T.; Kang, F.; Jiang, S.J. Research Progress of Orchard Plant Protection Mechanization Technology and Equipment in China. Trans. Chin. Soc. Agric. Eng. 2020, 36, 110–124. [Google Scholar]
- Zhou, Q.; Xue, X.; Chen, C.; Cai, C.; Jiao, Y. Canopy deposition characteristics of different orchard pesticide dose models. Int. J. Agric. Biol. Eng. 2023, 16, 1–6. [Google Scholar] [CrossRef]
- Liu, J.; Abbas, I.; Noor, R.S. Development of Deep Learning-Based Variable Rate Agrochemical Spraying System for Targeted Weeds Control in Strawberry Crop. Agronomy 2021, 11, 1480. [Google Scholar] [CrossRef]
- Zhang, C.F.; Zhai, C.Y.; Zhang, M.; Zhang, C.; Zou, W.; Zhao, C. Staggered-Phase Spray Control: A Method for Eliminating the Inhomogeneity of Deposition in Low-Frequency Pulse-Width Modulation (PWM) Variable Spray. Agriculture 2024, 14, 465. [Google Scholar] [CrossRef]
- Nan, Y.L.; Zhang, H.C.; Zheng, J.Q.; Bian, L.M.; Li, Y.X.; Yang, Y.; Zhang, M.; Ge, Y.F. Estimating Leaf Area Density of Osmanthus Trees Using Ultrasonic Sensing. Biosyst. Eng. 2019, 186, 60–70. [Google Scholar] [CrossRef]
- Oshio, H.; Asawa, T.; Hoyano, A.; Miyasaka, S. Estimation of the Leaf Area Density Distribution of Individual Trees Using High-resolution and Multi-return Airborne LiDAR Data. Remote Sens. Environ. 2015, 166, 116–125. [Google Scholar] [CrossRef]
- Wang, J.; Zhang, Y.; Gu, R. Research Status and Prospects on Plant Canopy Structure Measurement Using Visual Sensors Based on Three-Dimensional Reconstruction. Agriculture 2020, 10, 462. [Google Scholar] [CrossRef]
- Palleja, T.; Landers, A.J. Real time canopy density estimation using ultrasonic envelope signals in the orchard and vineyard. Comput. Electron. Agric. 2015, 115, 108–117. [Google Scholar] [CrossRef]
- Zhou, H.T.; Jia, W.D.; Li, Y.; Ou, M.X. Method for Estimating Canopy Thickness Using Ultrasonic Sensor Technology. Agriculture 2021, 11, 1011. [Google Scholar] [CrossRef]
- Ou, M.; Hu, T.; Hu, M.; Yang, S.; Jia, W.; Wang, M.; Jiang, L.; Wang, X.; Dong, X. Experiment of Canopy Leaf Area Density Estimation Method Based on Ultrasonic Echo Signal. Agriculture 2022, 12, 1569. [Google Scholar] [CrossRef]
- Qiao, B.Y.; He, X.K.; Wang, Z.C.; Han, L.; Liu, W.H.; Dong, X.; Liang, W.P. Development of Variable-rate Spraying System for High Clearance Wide Boom Sprayer Based on Li DAR Scanning. Trans. Chin. Soc. Agric. Eng. 2020, 36, 89–95. [Google Scholar]
- Gené-Mola, J.; Gregorio, E.; Guevara, J.; Auat, F.; Sanz-Cortiella, R.; Escolà, A.; Llorens, J.; Morros, J.R.; Ruiz-Hidalgo, J.; Vilaplana, V.; et al. Fruit Detection in an Apple Orchard Using a Mobile Terrestrial Laser Scanner. Biosyst. Eng. 2019, 187, 171–184. [Google Scholar] [CrossRef]
- Cheraïet, A.; Naud, O.; Carra, M.; Codis, S.; Lebeau, F.; Taylor, J. An Algorithm to Automate the Filtering and Classifying of 2D LiDAR Data for Site-specific Estimations of Canopy Height and Width in Vineyards. Biosyst. Eng. 2020, 200, 450–465. [Google Scholar] [CrossRef]
- Zeng, L.; Feng, J.; He, L. Semantic Segmentation of Sparse 3D Point Cloud Based on Geometrical Features for Trellis-structured Apple Orchard. Biosyst. Eng. 2020, 196, 46–55. [Google Scholar] [CrossRef]
- Lee, K.H.; Ehsani, R. A Laser Scanner Based Measurement System for Quantification of Citrus Tree Geometric Characteristics. Appl. Eng. Agric. 2009, 25, 777–788. [Google Scholar] [CrossRef]
- Zhang, M.N.; Lv, X.L.; Qiu, W.; Lei, X.H.; Yang, Q.S.; Zhang, D.X. Calculation Method of Leaf Area Density Based on Three-dimensional Laser Point Cloud. Trans. Chin. Soc. Agric. Mach. 2017, 48, 172–178. [Google Scholar]
- Qiujie, L.; Yuxi, X. Total Leaf Area Estimation Based on the Total Grid Area Measured Using Mobile Laser Scanning. Comput. Electron. Agric. 2023, 204, 107503. [Google Scholar]
- Xue, X.Y.; Yang, Z.Y.; Liang, X.Q.; Luo, Q.; Lyu, S.L.; Li, Z. Application and Experiments of the Atomization Mesh Used on the Plant Protection Spraying in Orchard. Trans. Chin. Soc. Agric. Eng. 2022, 38, 1–10. [Google Scholar]
- Cai, J.C.; Wang, X.; Song, J.; Wang, S.L.; Yang, S.; Zhao, C.J. Development of Real-time Laser-scanning System to Detect Tree Canopy Characteristics for Variable-rate Pesticide Application. Int. J. Agric. Biol. Eng. 2017, 10, 155–163. [Google Scholar]
- Cheng, M.; Cai, Z.J.; Wang, N.; Yuan, H.B. System Design for Peanut Canopy Height Information Acquisition Based on LiDAR. Trans. Chin. Soc. Agric. Eng. 2019, 35, 180–187. [Google Scholar]
- Mahmud, M.S.; Zahid, A.; He, L.; Choi, D.; Krawczyk, G.; Zhu, H.P.; Heinemann, P. Development of a LiDAR-guided section-based tree canopy density measurement system for precision spray applications. Comput. Electron. Agric. 2021, 182, 106053. [Google Scholar] [CrossRef]
- Mahmud, M.S.; He, L.; Heinemann, P.; Choi, D.; Zhu, H. Unmanned aerial vehicle based tree canopy characteristics measurement for precision spray applications. Smart Agric. Technol. 2023, 4, 100153. [Google Scholar] [CrossRef]
- Pu, Y.H.; Xu, D.D.; Wang, H.B.; Li, X.; Xu, X. A New Strategy for Individual Tree Detection and Segmentation from Leaf-on and Leaf-off UAV-LiDAR Point Clouds Based on Automatic Detection of Seed Points. Remote Sens. 2023, 15, 1619. [Google Scholar] [CrossRef]
- Luo, S.Z.; Liu, W.W.; Ren, Q.; Wei, H.Q.; Wang, C.; Xi, X.H.; Nie, S.; Li, D.; Ma, D.; Zhou, G.Q. Leaf area index estimation in maize and soybean using UAV LiDAR data. Precis. Agric. 2024, 25, 1915–1932. [Google Scholar] [CrossRef]
- Jejcic, V.; Godesa, T.; Hocevar, M.; Sirok, B.; Malnersic, A.; Stancar, A.; Lesnik, M.; Stajnko, D. Design and testing of an ultrasound system for targeted spraying in orchards. Stroj. Vestn. J. Mech. Eng. 2011, 57, 587–598. [Google Scholar] [CrossRef]
Disclaimer/Publisher’s Note: The statements, opinions and data contained in all publications are solely those of the individual author(s) and contributor(s) and not of MDPI and/or the editor(s). MDPI and/or the editor(s) disclaim responsibility for any injury to people or property resulting from any ideas, methods, instructions or products referred to in the content. |
© 2025 by the authors. Licensee MDPI, Basel, Switzerland. This article is an open access article distributed under the terms and conditions of the Creative Commons Attribution (CC BY) license (https://creativecommons.org/licenses/by/4.0/).