

Advanced Diagnostics of Aircraft Structures Using Automated Non-Invasive Imaging Techniques: A Comprehensive Review

 ,
,  ,
,  ,
,  and
and 
Abstract
1. Introduction
1.1. Structure of the Article
- Section 1: Introduction—This chapter introduces the challenges of inspecting aircraft structures and explains the importance of automation. It highlights the need to improve safety and efficiency and reduce operating and maintenance costs.
- Section 2: Materials and Methods—This chapter analyses the tools, methods, and techniques used, such as thermography, visual, and 3D scanning. It also explores common materials used in the aviation industry, including strengths and limitations, as well as the most common types of defects that appear during inspection. Special attention is given to how artificial intelligence could support these processes to enhance accuracy and reliability.
- Section 3: Discussion—This chapter emphasises the intellectual contributions of this research and its potential impact on the aviation industry, the non-destructive testing (NDT) field, and academia.
- Section 4: Conclusions—This chapter summarises the findings, highlighting the value of automated inspection. It stresses the importance of integrating AI with advanced tools to enhance outcomes and reduce human errors.
- Section 5: Future Directions—This section looks ahead, discussing the scientific aim and the specific objectives this work is willing to address.
1.2. Aircraft Structures and Defect Locations
- Fuselage: The main body of the aircraft, housing passengers, crew, and cargo.
- Wings: Provide lift and house fuel tanks and control surfaces.
- Empennage (Tail Section): Ensures stability and control through the horizontal and vertical stabilisers.
- Landing Gear: Supports the aircraft during takeoff, landing, and taxiing.
- Jet Engines: Generate thrust for propulsion.
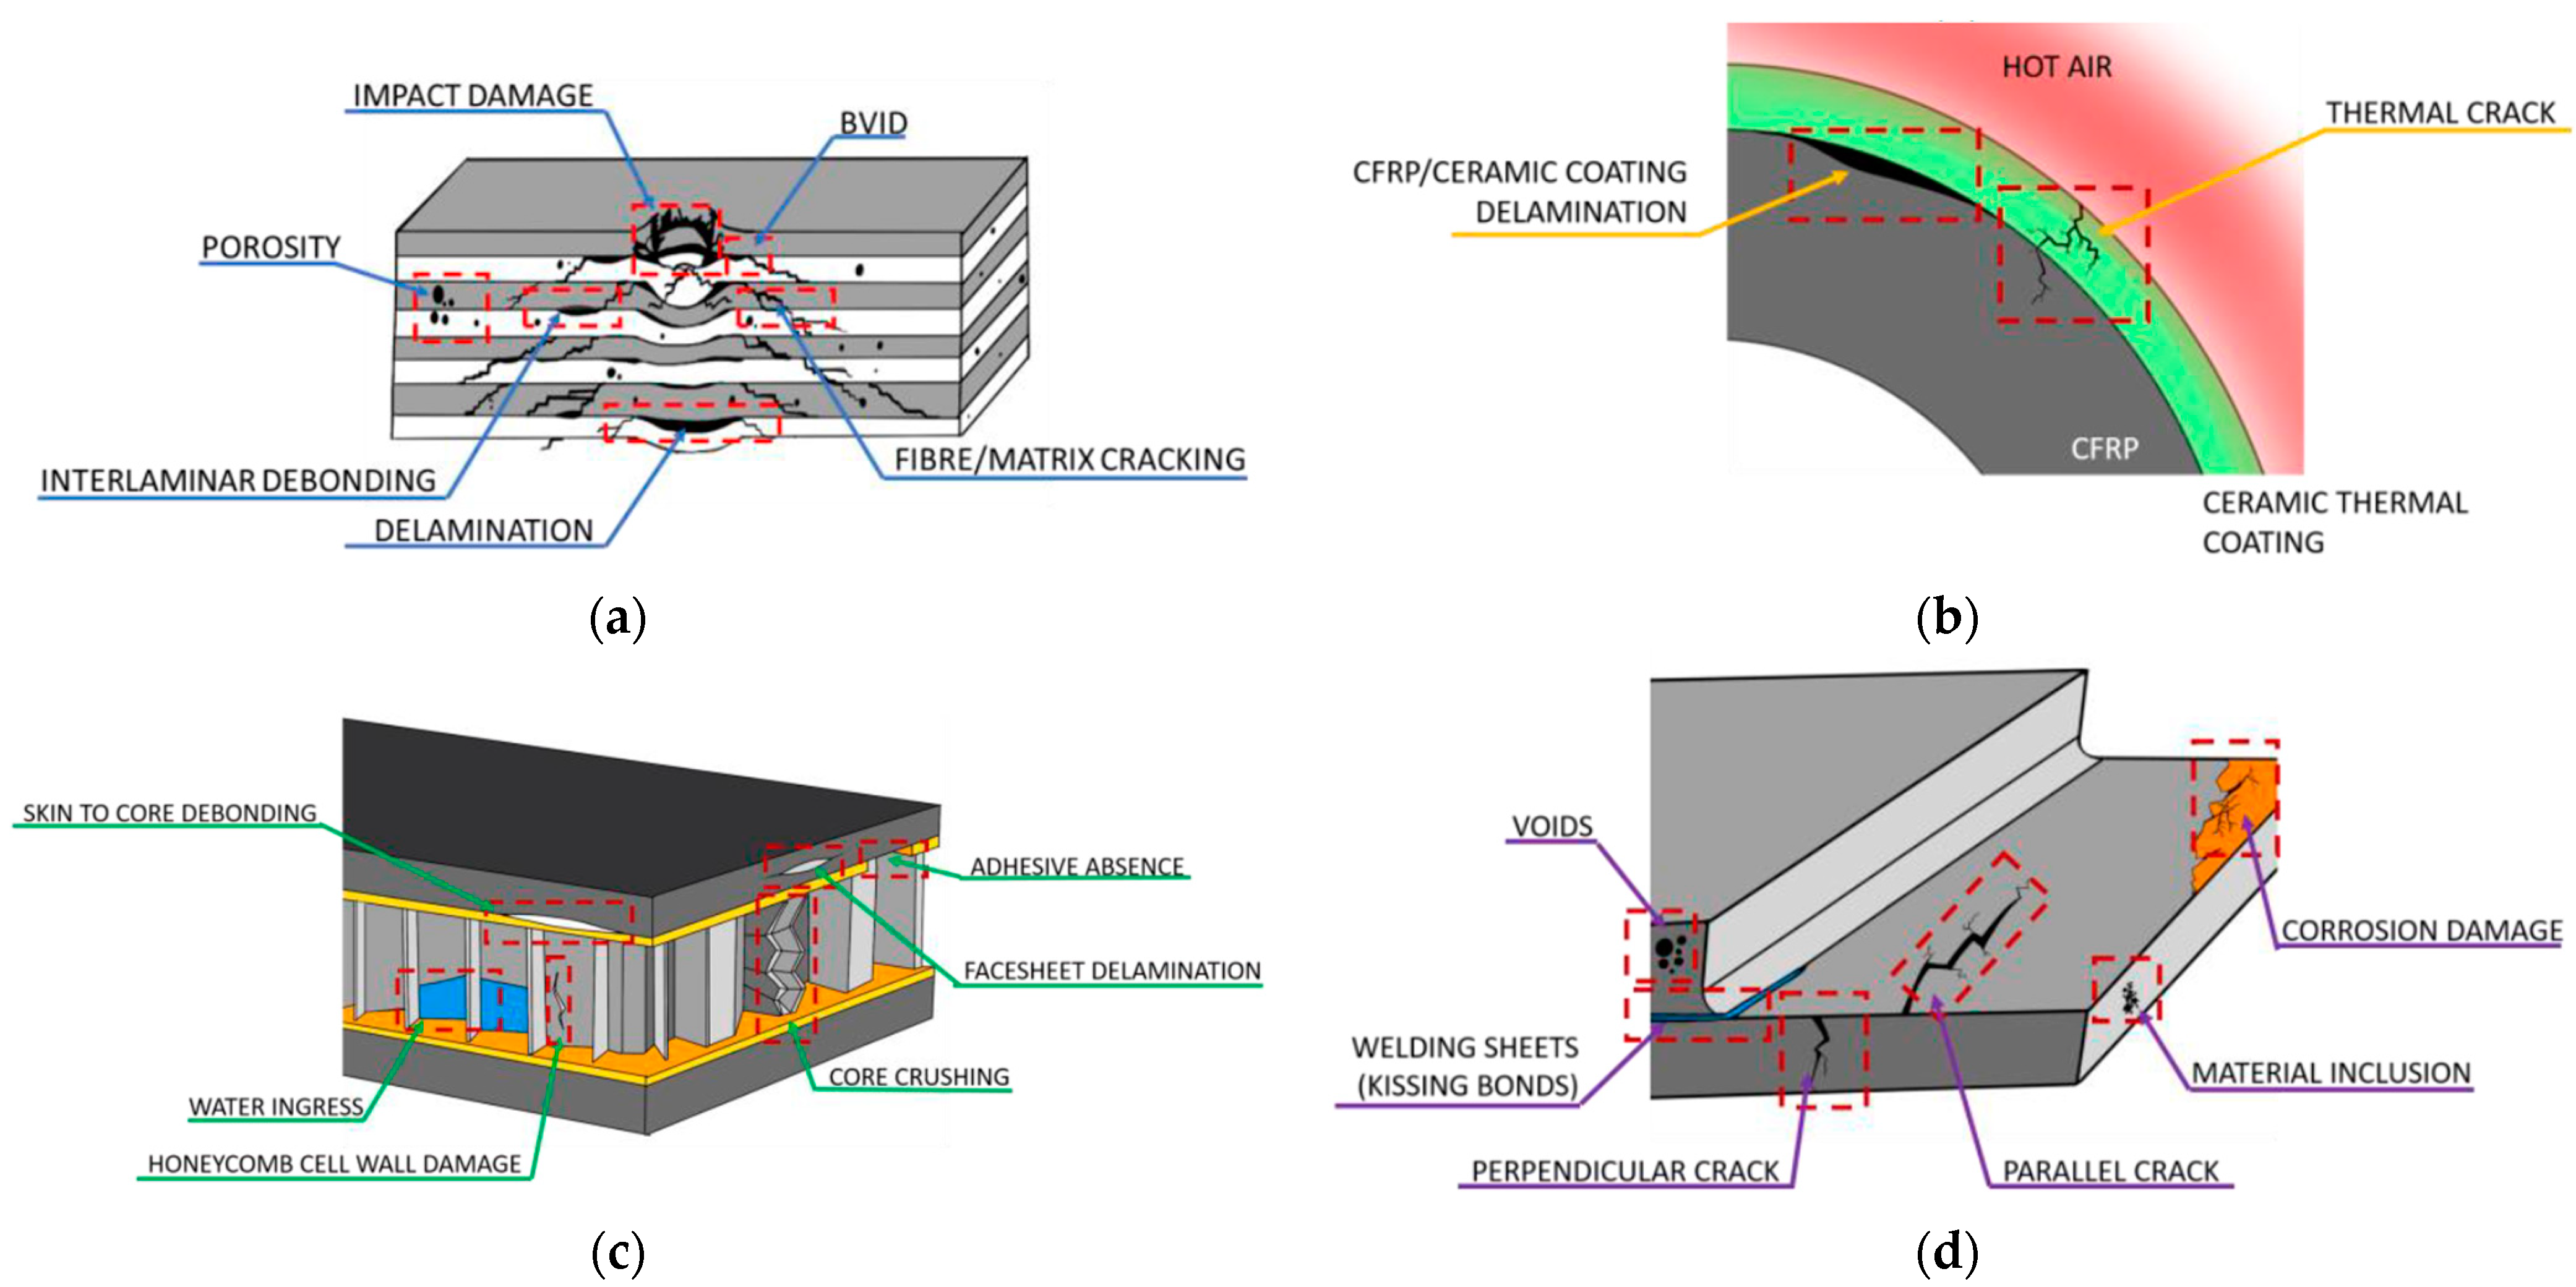
- Metallic Defects
- ○ Fuselage: Fatigue cracks, corrosion, pores, and material inclusions.
- ○ Doors and Structural Joints: Welding issues, foreign inclusions, and adhesive failures.
- ○ Landing Gear: Overload, wear, and creep due to repeated impact forces.
- Composite Defects
- ○ Wings: Delamination, fibre/matrix cracking, and impact damage.
- ○ Tail (Vertical/Horizontal Stabilisers): Honeycomb cell wall damage, core crushing, and skin-to-core debonding.
- ○ Jet Engines: Thermal stress cracking due to high-temperature exposure.

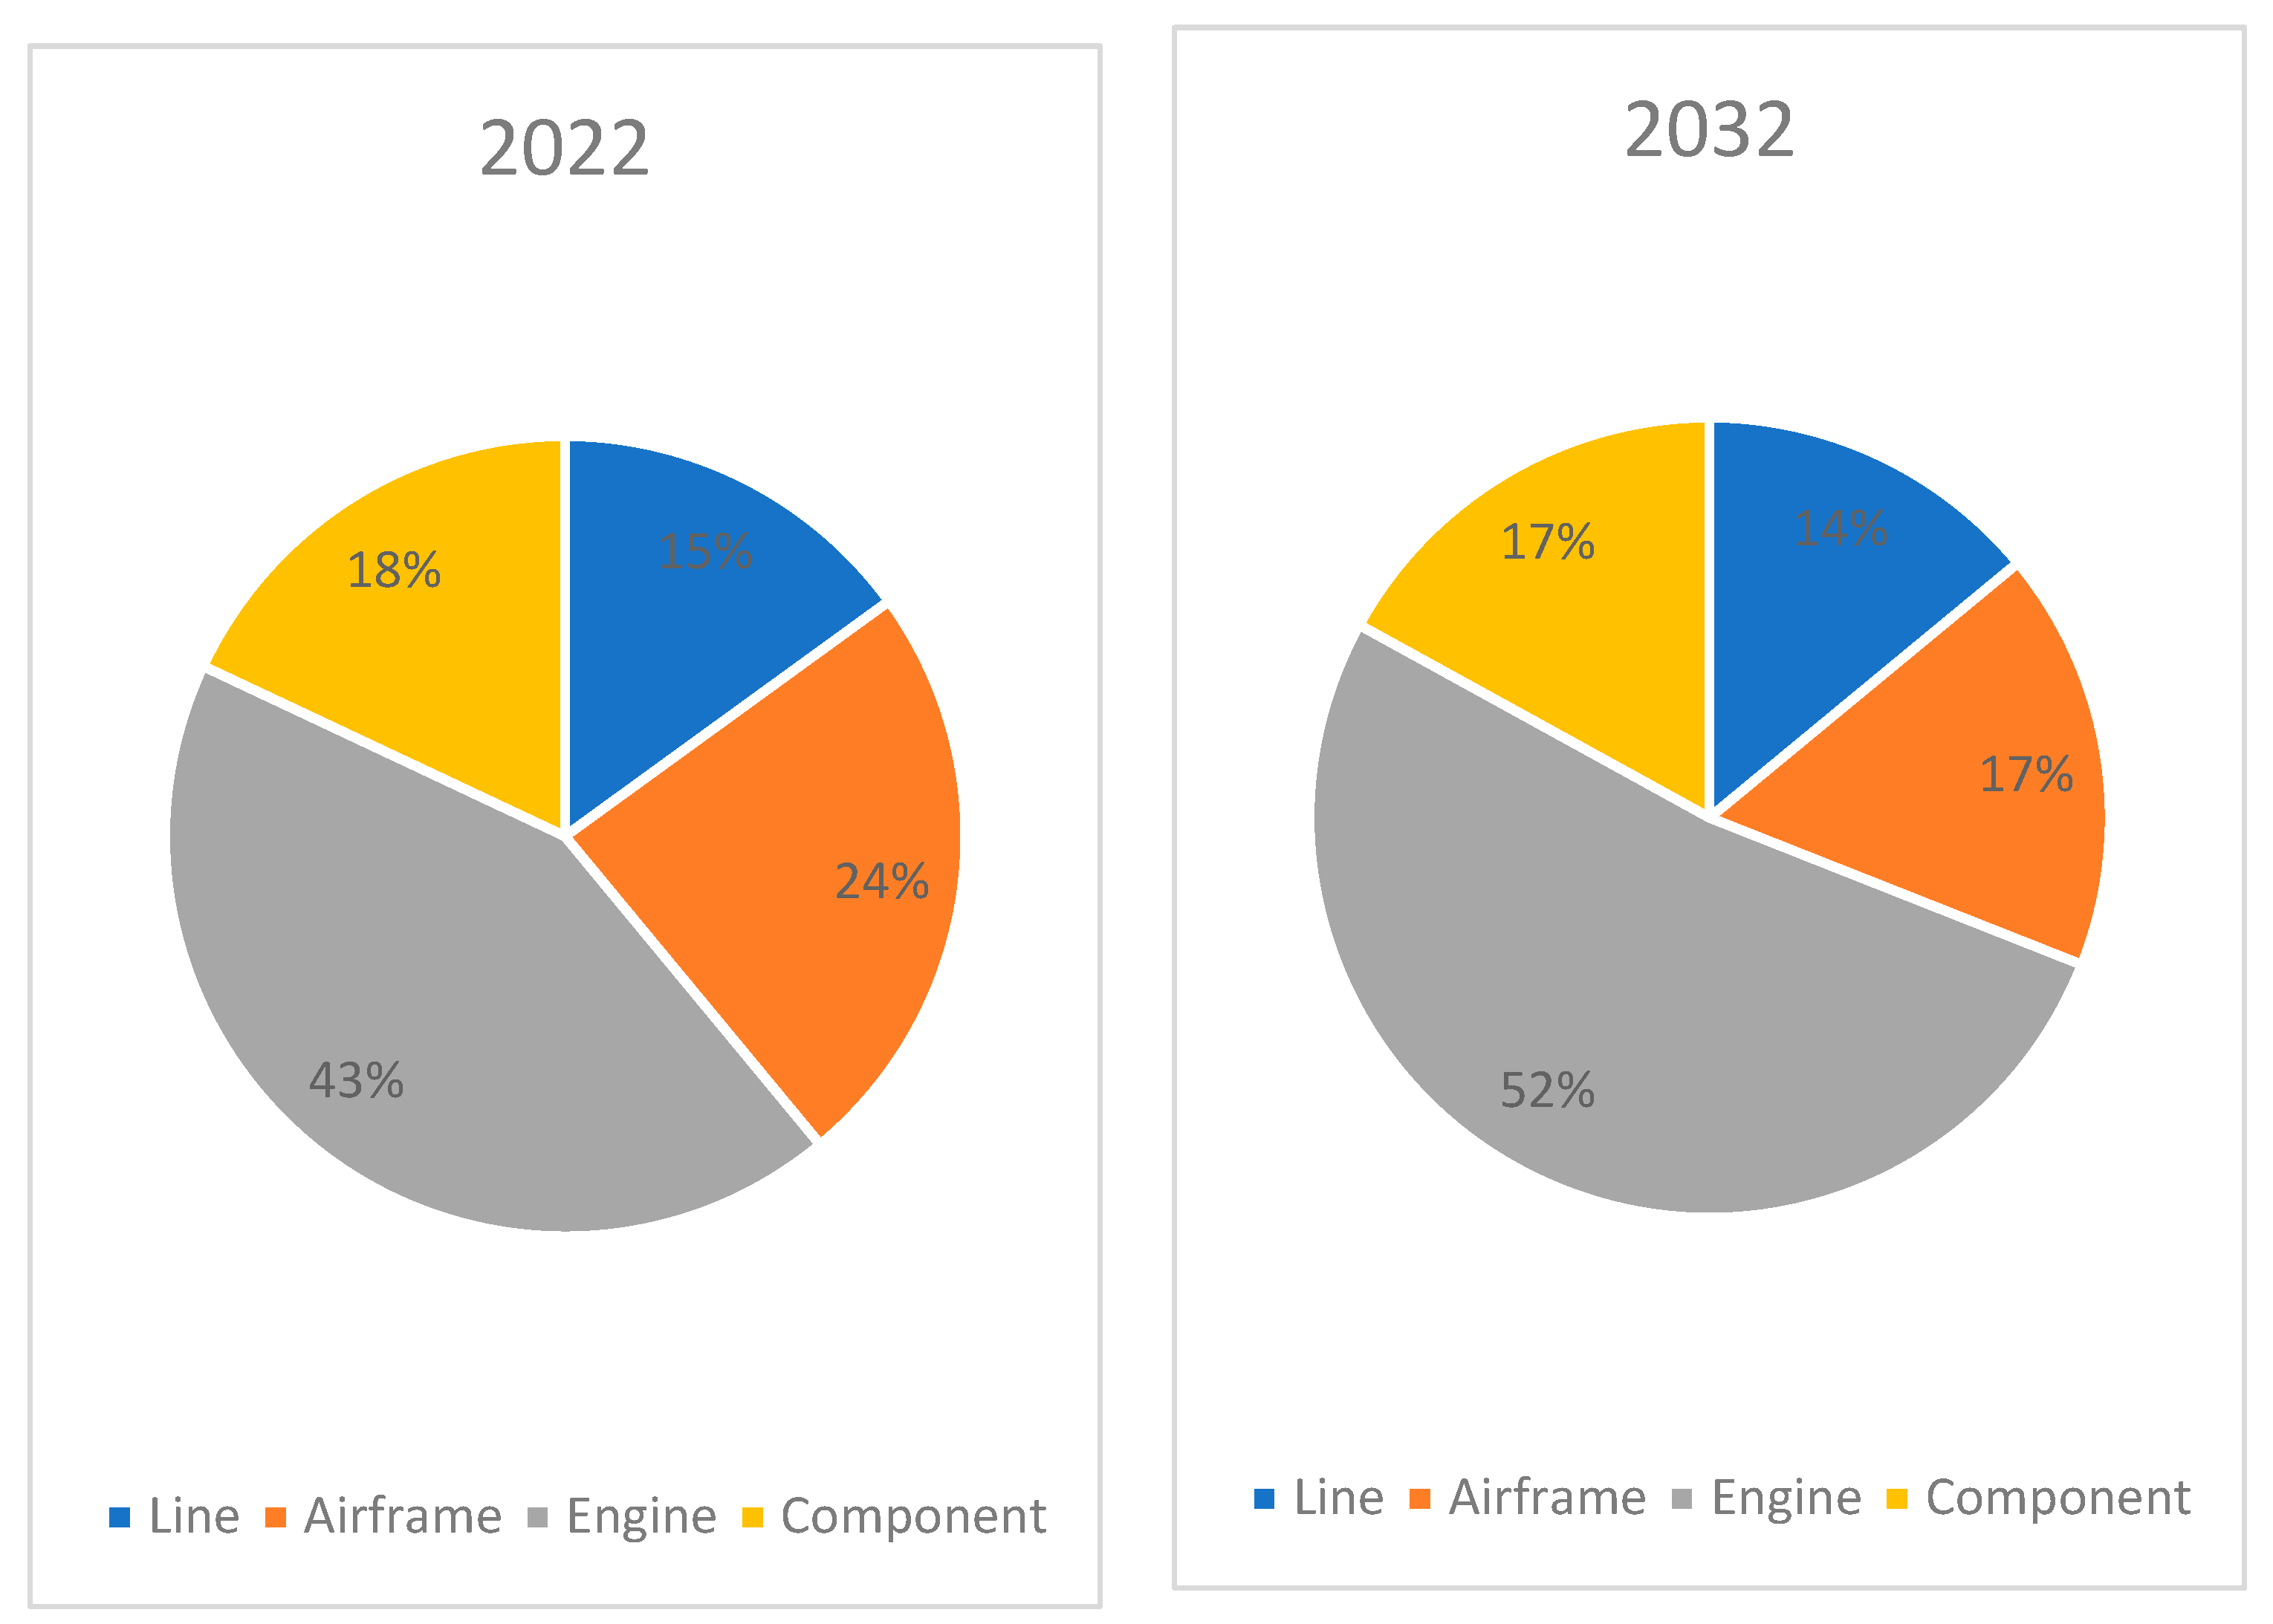
1.3. Aircraft Maintenance and Cost Analysis
1.4. Human Factor in Aircraft Maintenance
- In June 1990, British Airways Flight 5390 had an accident. The left cockpit windscreen was blown out, and the pilot was partially ejected through the open window. After investigation, they found that 84 out of the 90 bolts that fixed the windscreen were smaller in diameter. Due to a staff shortage during maintenance, the shift maintenance manager tried to help by fixing them himself. However, he never checked the maintenance manual, resulting in the incorrect bolt type being used to fix the windscreen [5].
- In 2003, a Raytheon (Beechcraft) 1900D aircraft lost control shortly after takeoff, leading to a crash caused by improper rigging of the elevator control system [6].
- In 2018, Southwest Airlines Flight 1380’s engine failed due to a fractured fan blade. Metal fatigue was the leading cause, and debris was inserted into the engine, resulting in a loss of power. The pilots tried an emergency landing; however, one passenger died [7].
- On 15 January 2023, Yeti Airlines Flight 691, was conducting a scheduled domestic flight from Kathmandu to Pokhara International Airport with 68 passengers and 4 crew members. During the final approach to Runway, the aircraft experienced a dual propeller feathering event, leading to a loss of thrust and subsequent aerodynamic stall. The flight crew inadvertently moved the condition levers to the feathered position, preventing thrust recovery. The aircraft crashed near the Seti River gorge, resulting in the fatalities of all 72 individuals on board. The Aircraft Accident Investigation Commission (AAIC) of Nepal identified high workload, human error, inadequate technical training, and non-compliance with SOPs as contributing factors. Nine safety recommendations were issued to improve crew training, approach procedures, and regulatory oversight to prevent similar incidents in the future [8].
- On 6 December 2023, a Qantas Airbus A380 underwent a scheduled three-day maintenance check at Los Angeles International Airport. During a borescope inspection of the left outboard engine, a 1.25 m nylon turning tool was inadvertently left inside the engine. Despite multiple post-maintenance inspections, the tool remained undetected, and the aircraft was released to service on 8 December 2023. Over the next month, the aircraft completed 34 flights totalling 293.74 h before the tool was discovered during a subsequent maintenance check on 1 January 2024. The Australian Transport Safety Bureau (ATSB) investigation revealed failures in tool accountability procedures, including the lack of a formal lost tool search before releasing the aircraft to service. In response, Qantas Engineering revised its tool control policies, emphasising stricter compliance to prevent similar occurrences in the future [9].
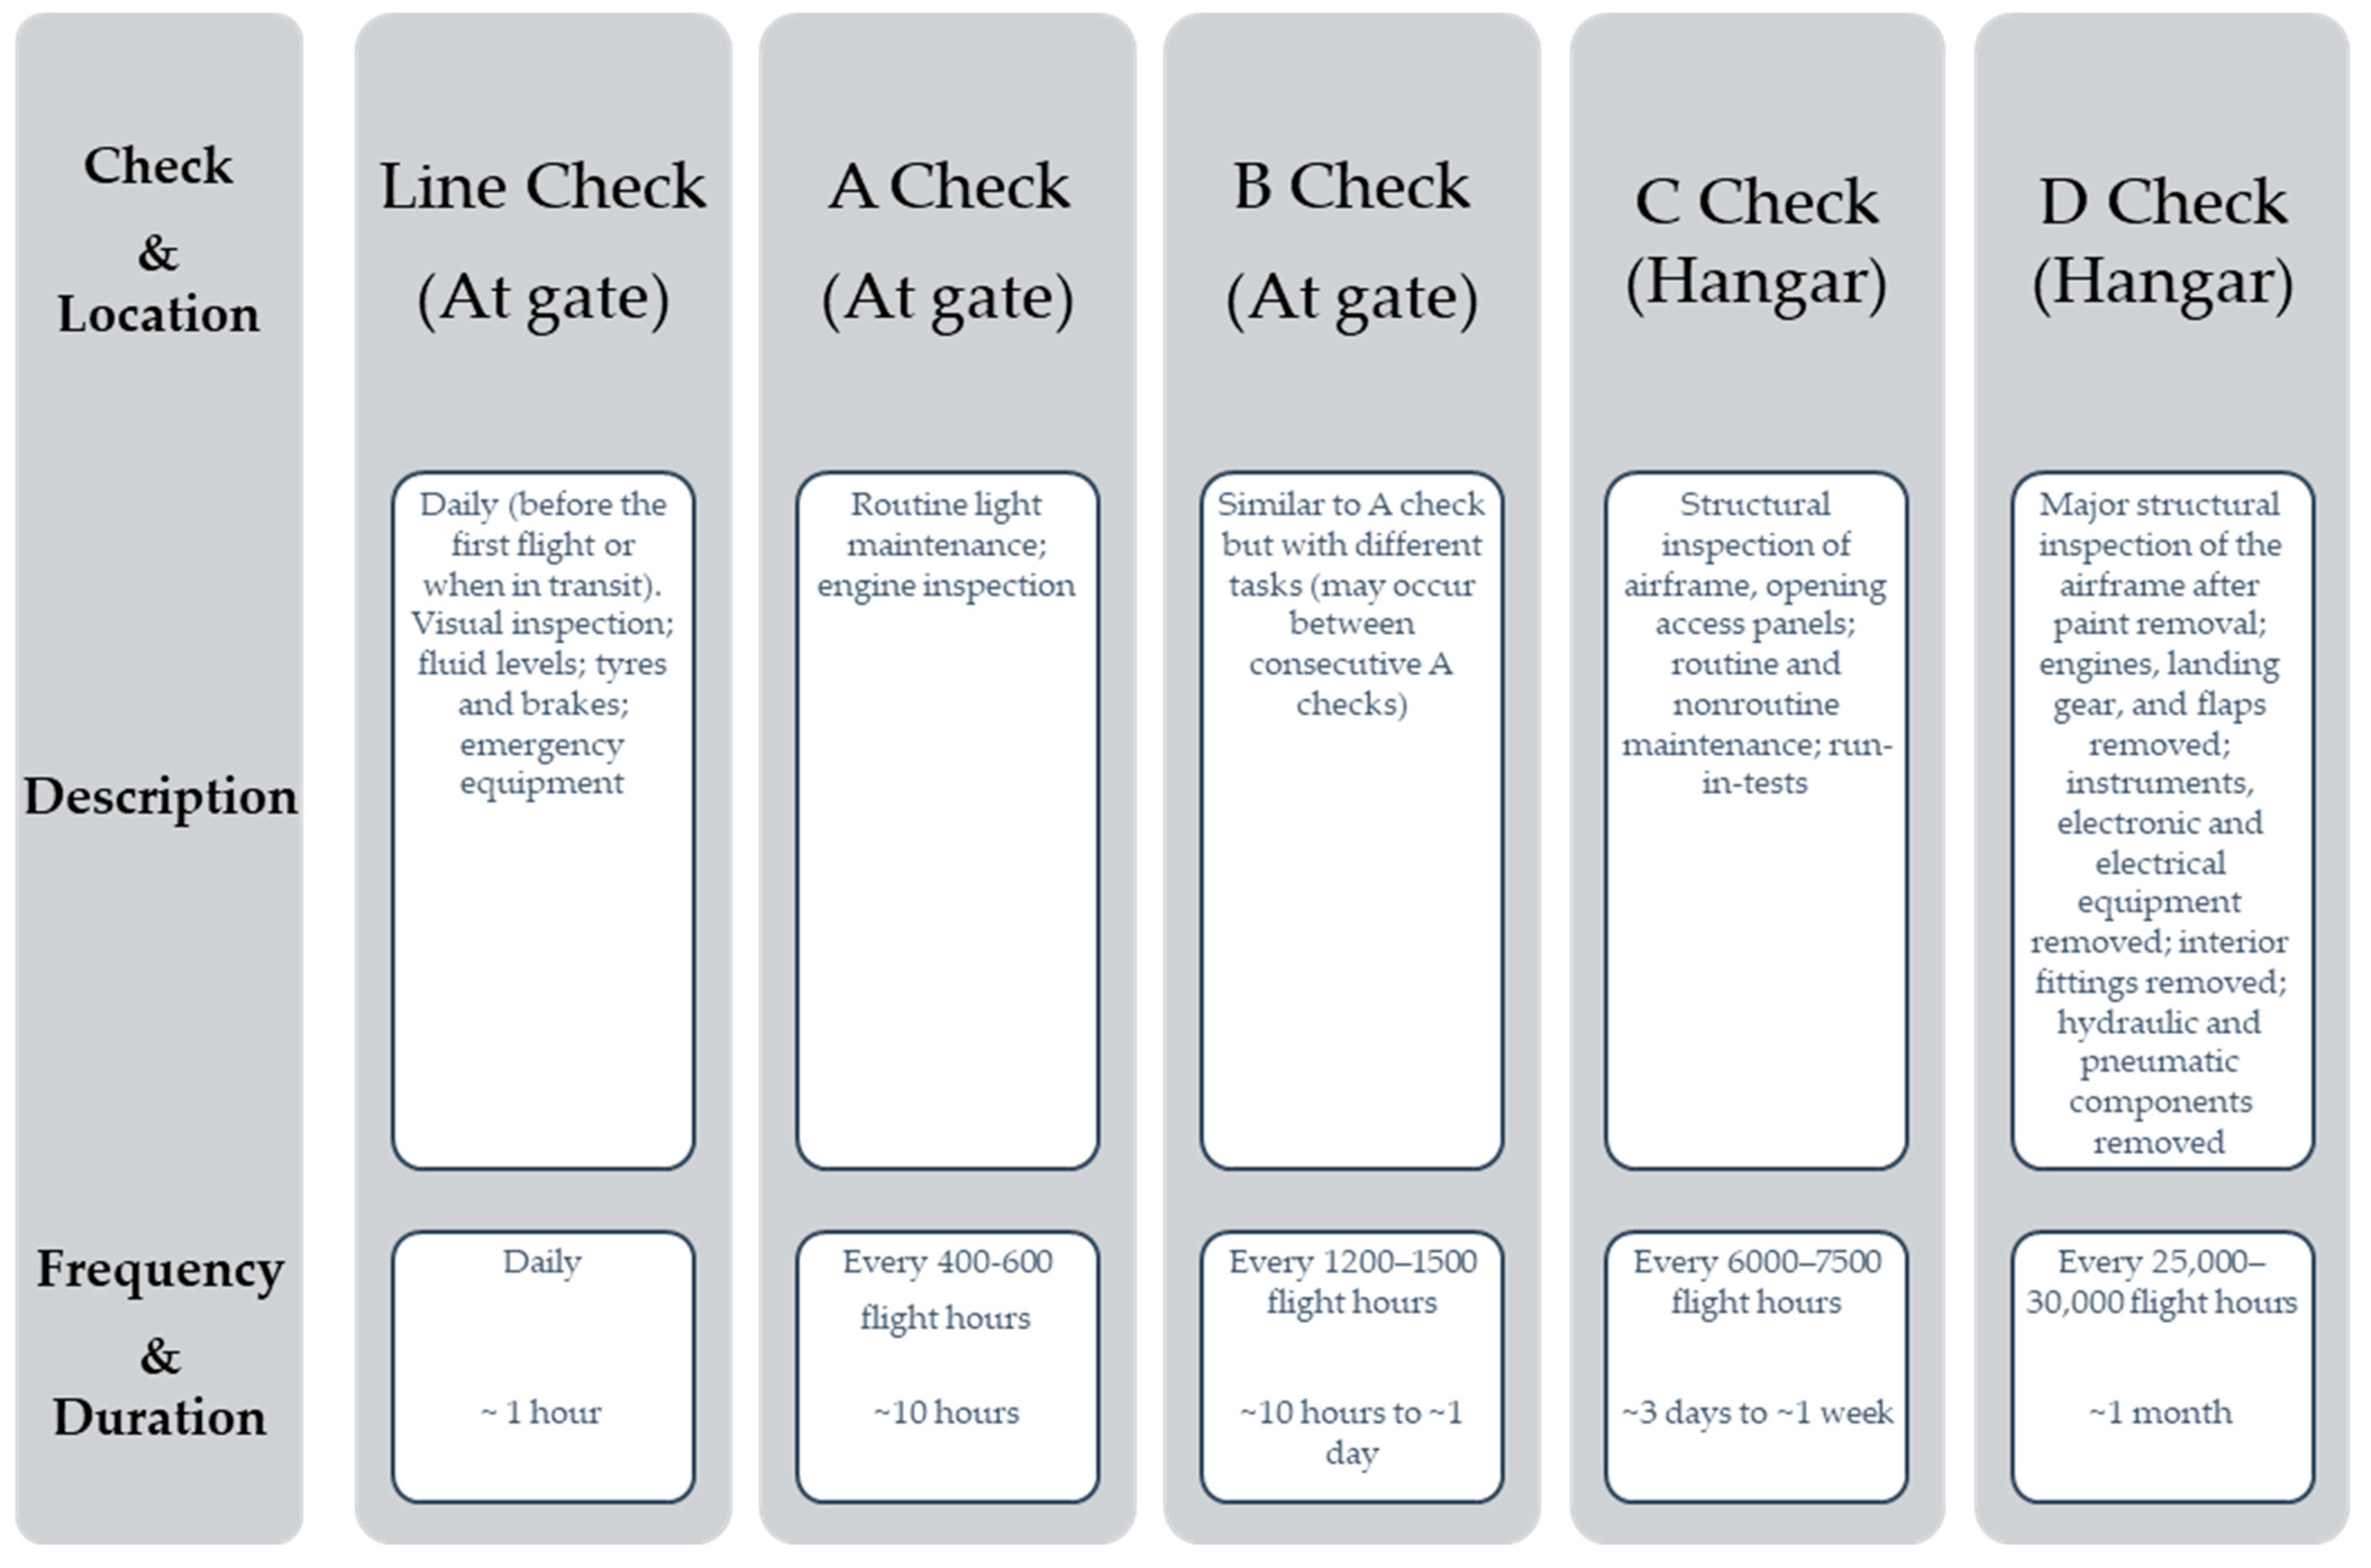
1.5. Aircraft Maintenance Categories
1.6. Manual Inspection
- To assess the overall condition of the airframe and components;
- Defects such as dents, delamination, cracks, and corrosion should be detected early before they reach a critical size;
- To detect manufacturing defects, in-service defects as well as unplanned defects;
- Finally, evidence of defects is to be collected to support information about the aircraft’s condition.
1.7. Automated Inspection and Robotic Systems
2. Methods and Materials
2.1. Non-Destructive Testing (NDT) Techniques
- Cost-Effectiveness: A good-quality camera and image-processing software are the two essential tools required to scan and reconstruct the 3D model compared to expensive specialised laser and LiDAR equipment [61];
- Detailed Texture Information: A critical advantage of photogrammetry is its ability to acquire high-resolution texture and colour information, which is especially important in the field of maintenance inspection where detailed textures and geometric information are so important [62];
- Versatility and Large-Area Coverage: Photogrammetry can be used for both large-scale and small-scale objects without concerns about geometry, texture, distance from the camera, or the speed of image capture. The use of drones for photogrammetry can be a great combination to capture large areas for mapping efficiently [63].
- Creation of a 3D Point Cloud: A 3D point cloud was generated to represent the spatial structure of the environment or objects.
- Key Point Verification in 2D Images: Each key point in the 2D image was checked to determine if it falls within the bounding box representing part of an object. If it does, this key point was associated with that object.
- Grouping of Key Points Across Multiple Images: When the same key point was visible in multiple images or on different parts of the object, these key points were grouped together, creating a “set” of similar detections.
- Estimation of 3D Locations: Once key points were grouped, their 3D spatial positions were analysed to estimate the location of each object.
- Application of Mean Shift Clustering for Precision: To refine the estimated location of each object, mean shift clustering was applied. This technique identified areas with high concentrations of key points, indicating the most probable 3D location of the object.
- Confirmation of Object Position through Maxima Identification: Areas where key points densely cluster (known as maxima) provide high confidence that an object is located within that specific 3D space.
- Key Point Extraction: All three tools use the SIFT algorithm to detect key points in images. Additionally, AliceVision supports AKAZE, providing flexibility for different types of image features.
- Key Point Matching: This step aligns similar points between images. COLMAP offers a variety of methods, including exhaustive, sequential, vocabulary tree, spatial matching, and a transitive option. OpenMVG uses brute force and approximate nearest neighbour (ANN) matching, while AliceVision relies on ANN and cascade hashing for faster matching.
- Geometric Verification: All tools support verifying geometric relationships using homography estimation (using 4 points), relative pose estimation (using 5 points), and fundamental matrix estimation (using 7–8 points). AliceVision also includes an additional homography growing method for a more robust verification.
- Incremental Bundle Adjustment: In the image resection and triangulation phase, COLMAP and OpenMVG both use P3P, DLT, and EPNP algorithms. AliceVision simplifies this step with just PnP and DLT, which are standard approaches for pose estimation and triangulation.
- Global Bundle Adjustment: All three tools use the CERES solver to optimise the 3D model by adjusting camera poses and point positions.
- Dense Point Cloud Generation: COLMAP and OpenMVG both use a patch-based stereo method to generate a dense point cloud. AliceVision, however, uses semi-global matching, a different approach that balances detail and processing speed.
2.2. Learning-Based Approaches
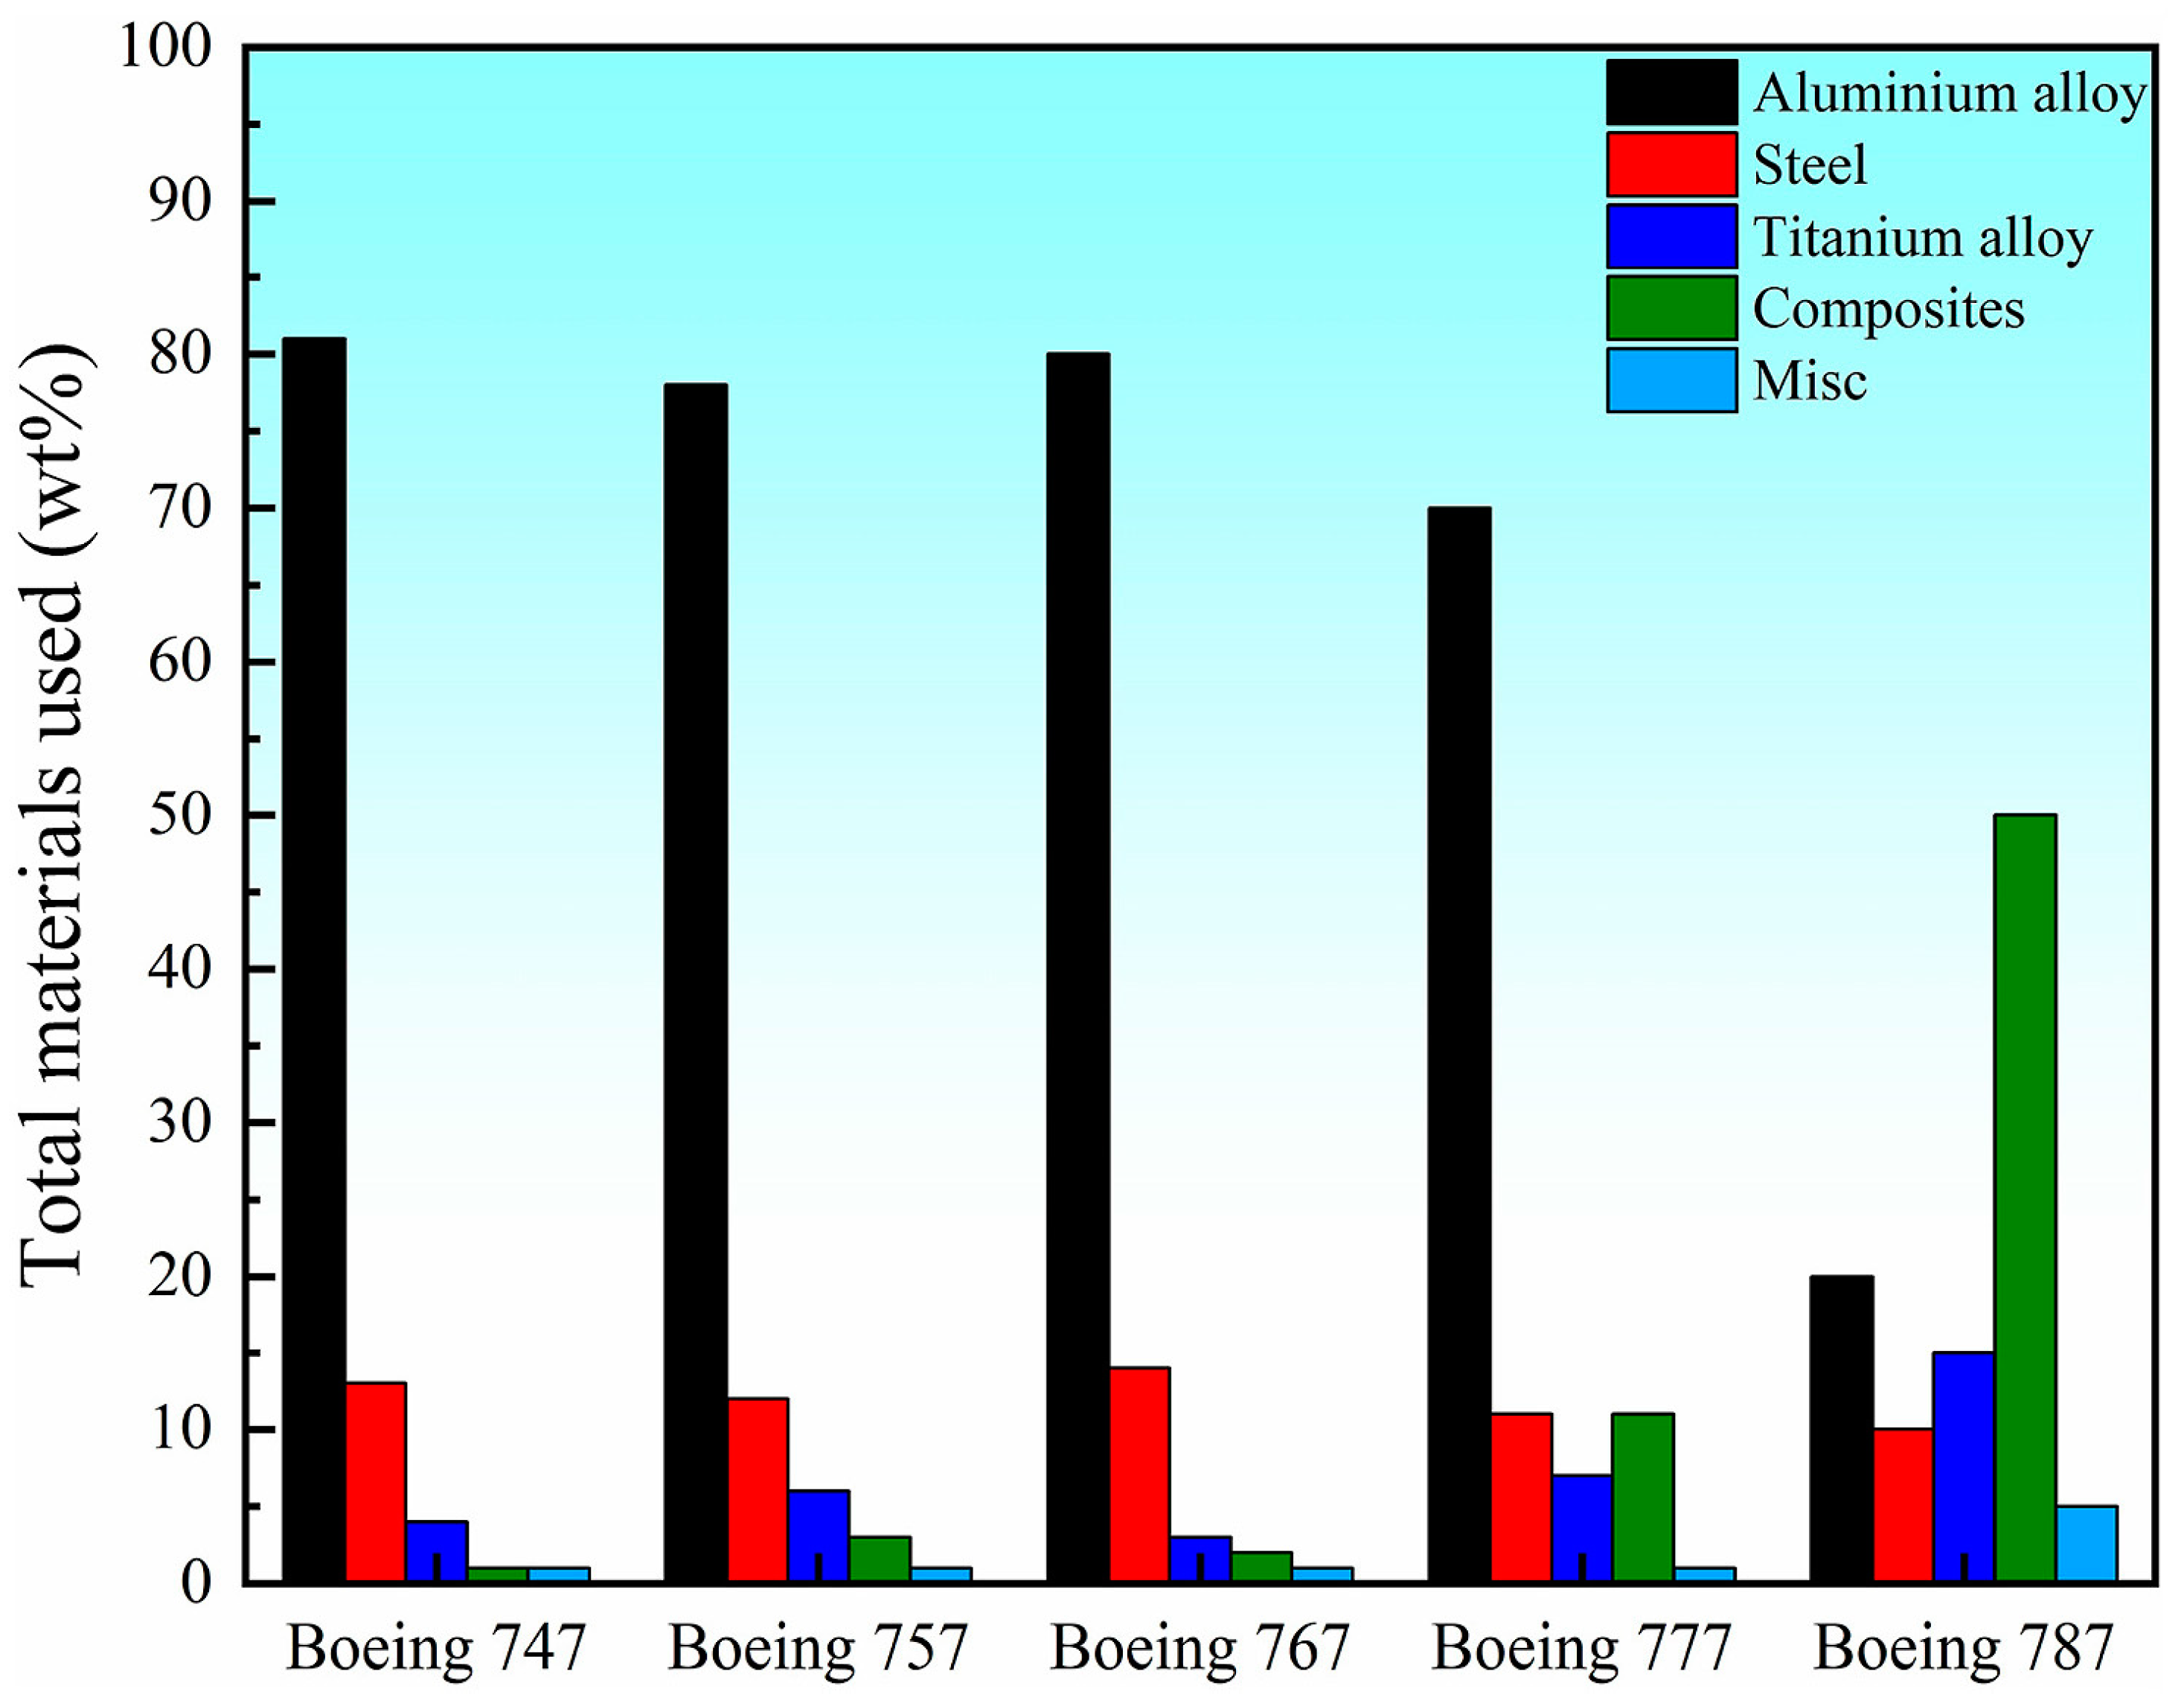
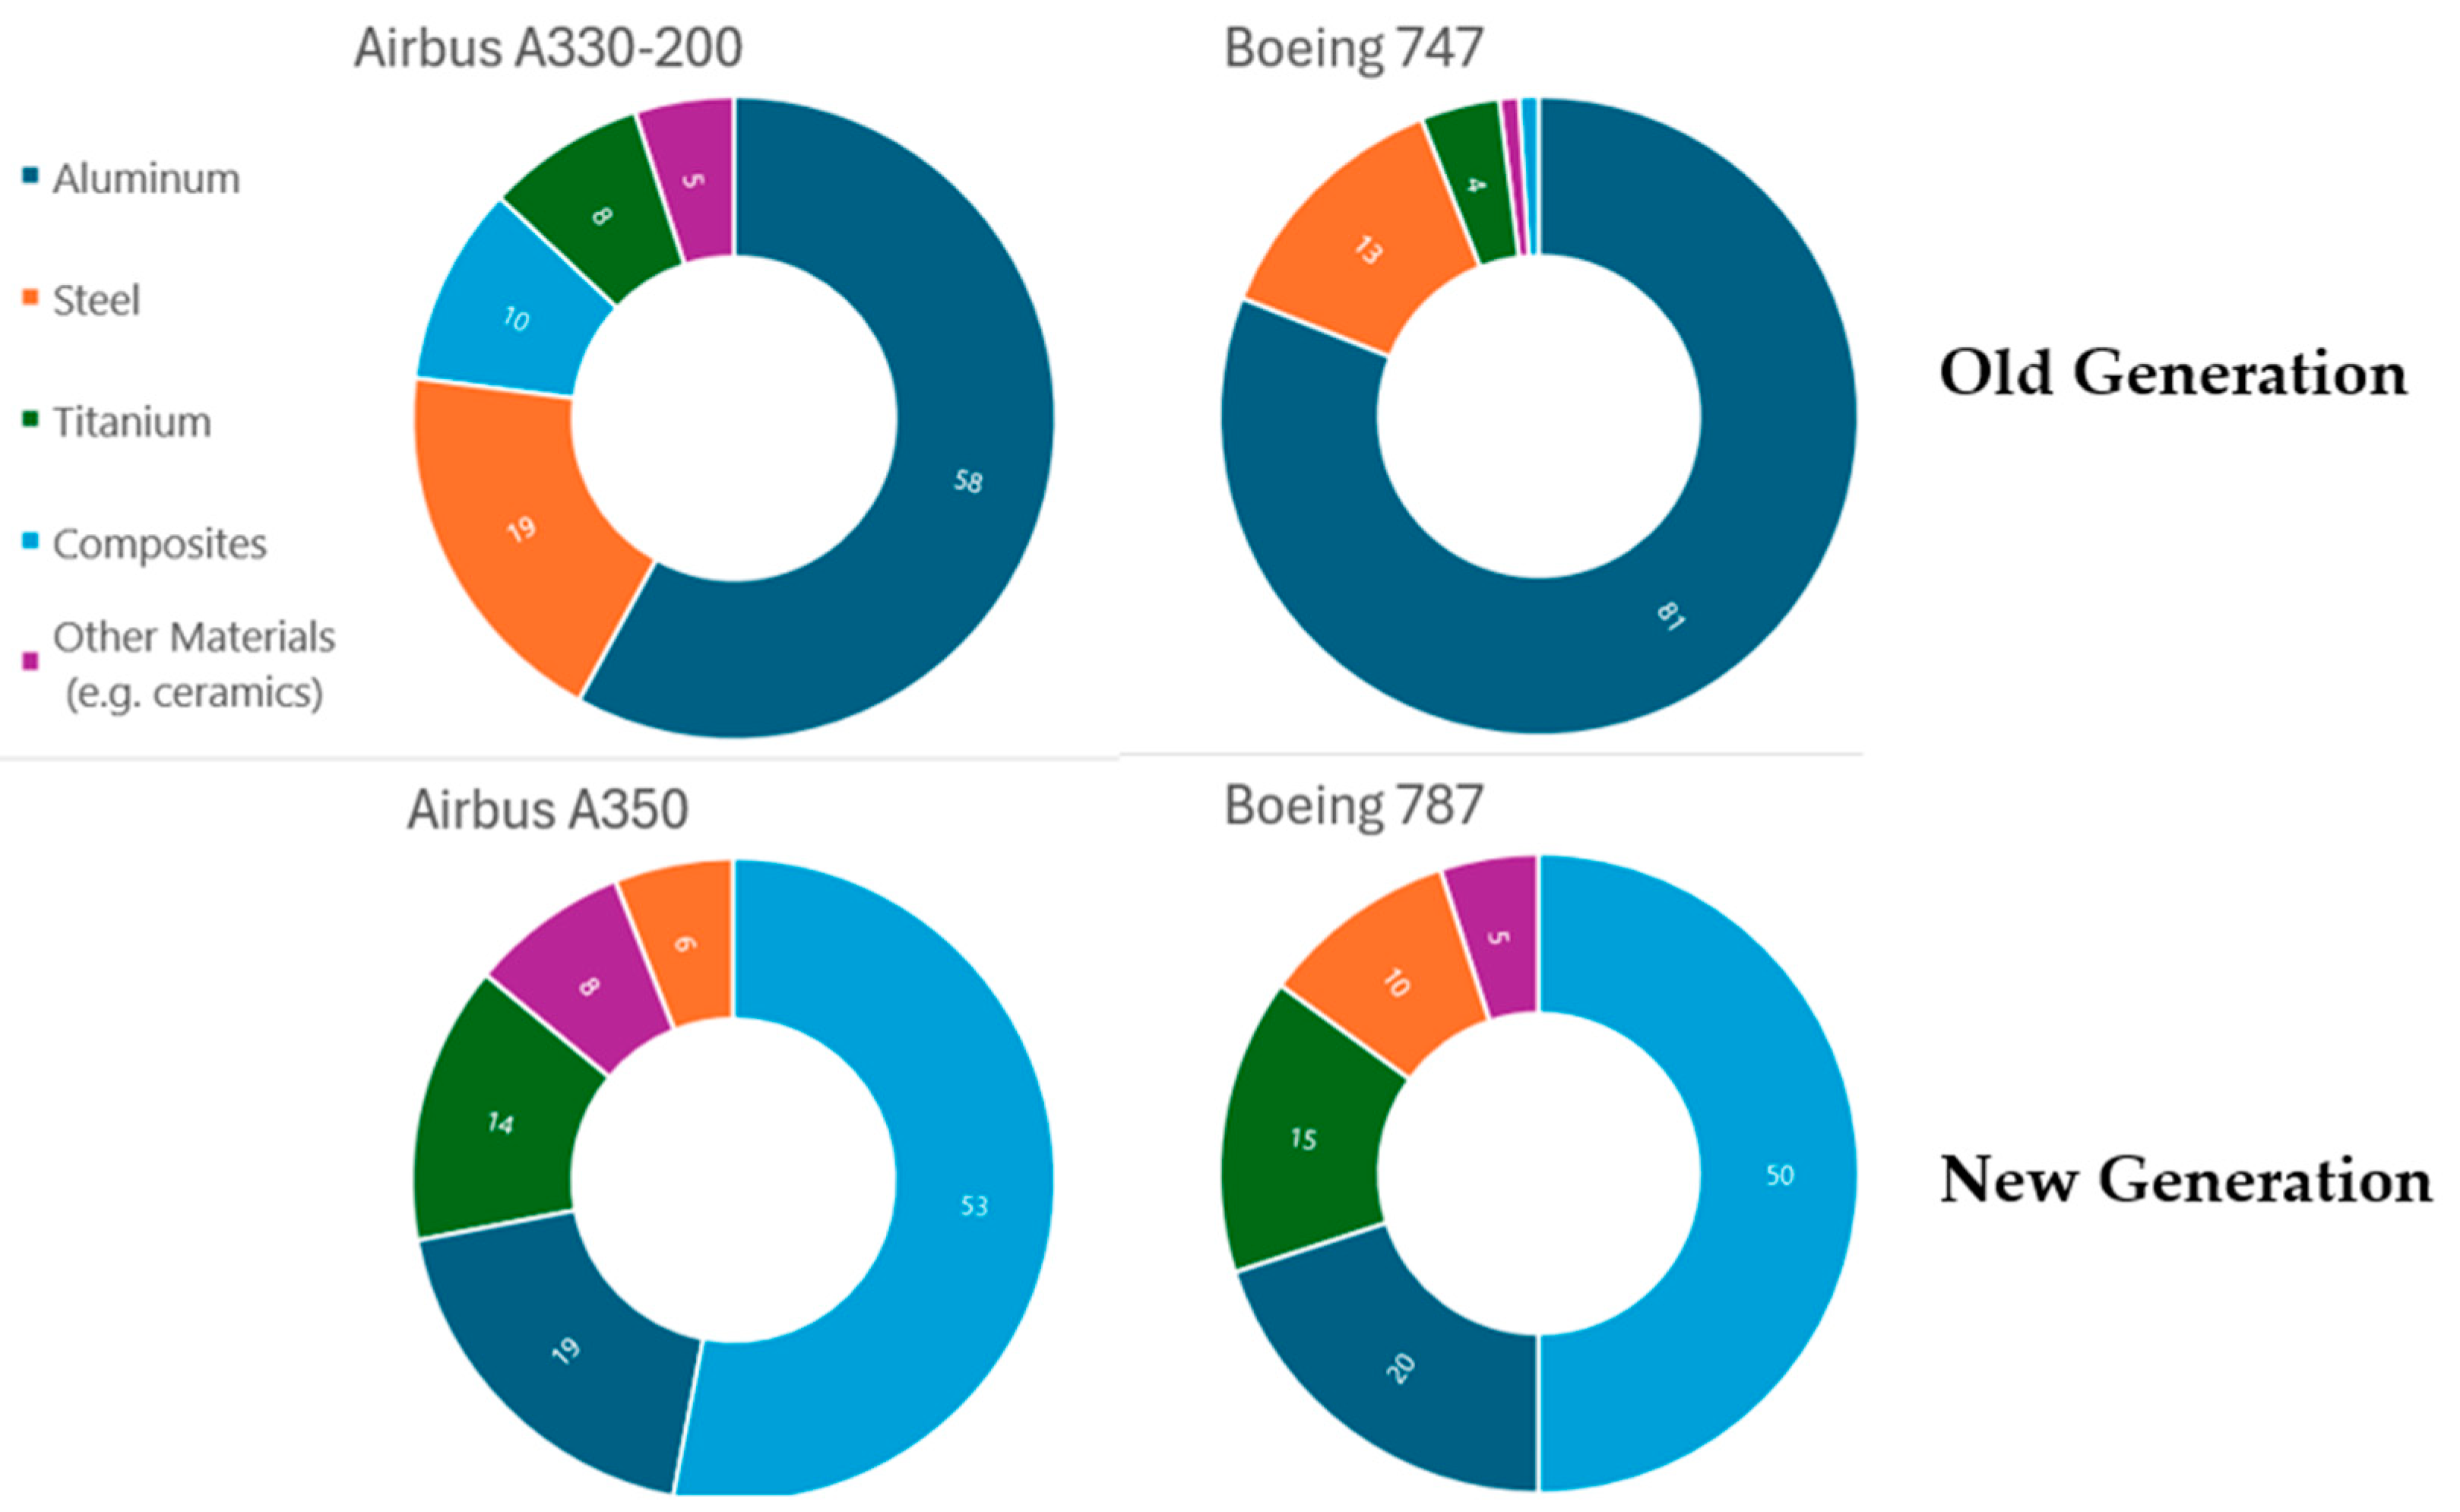
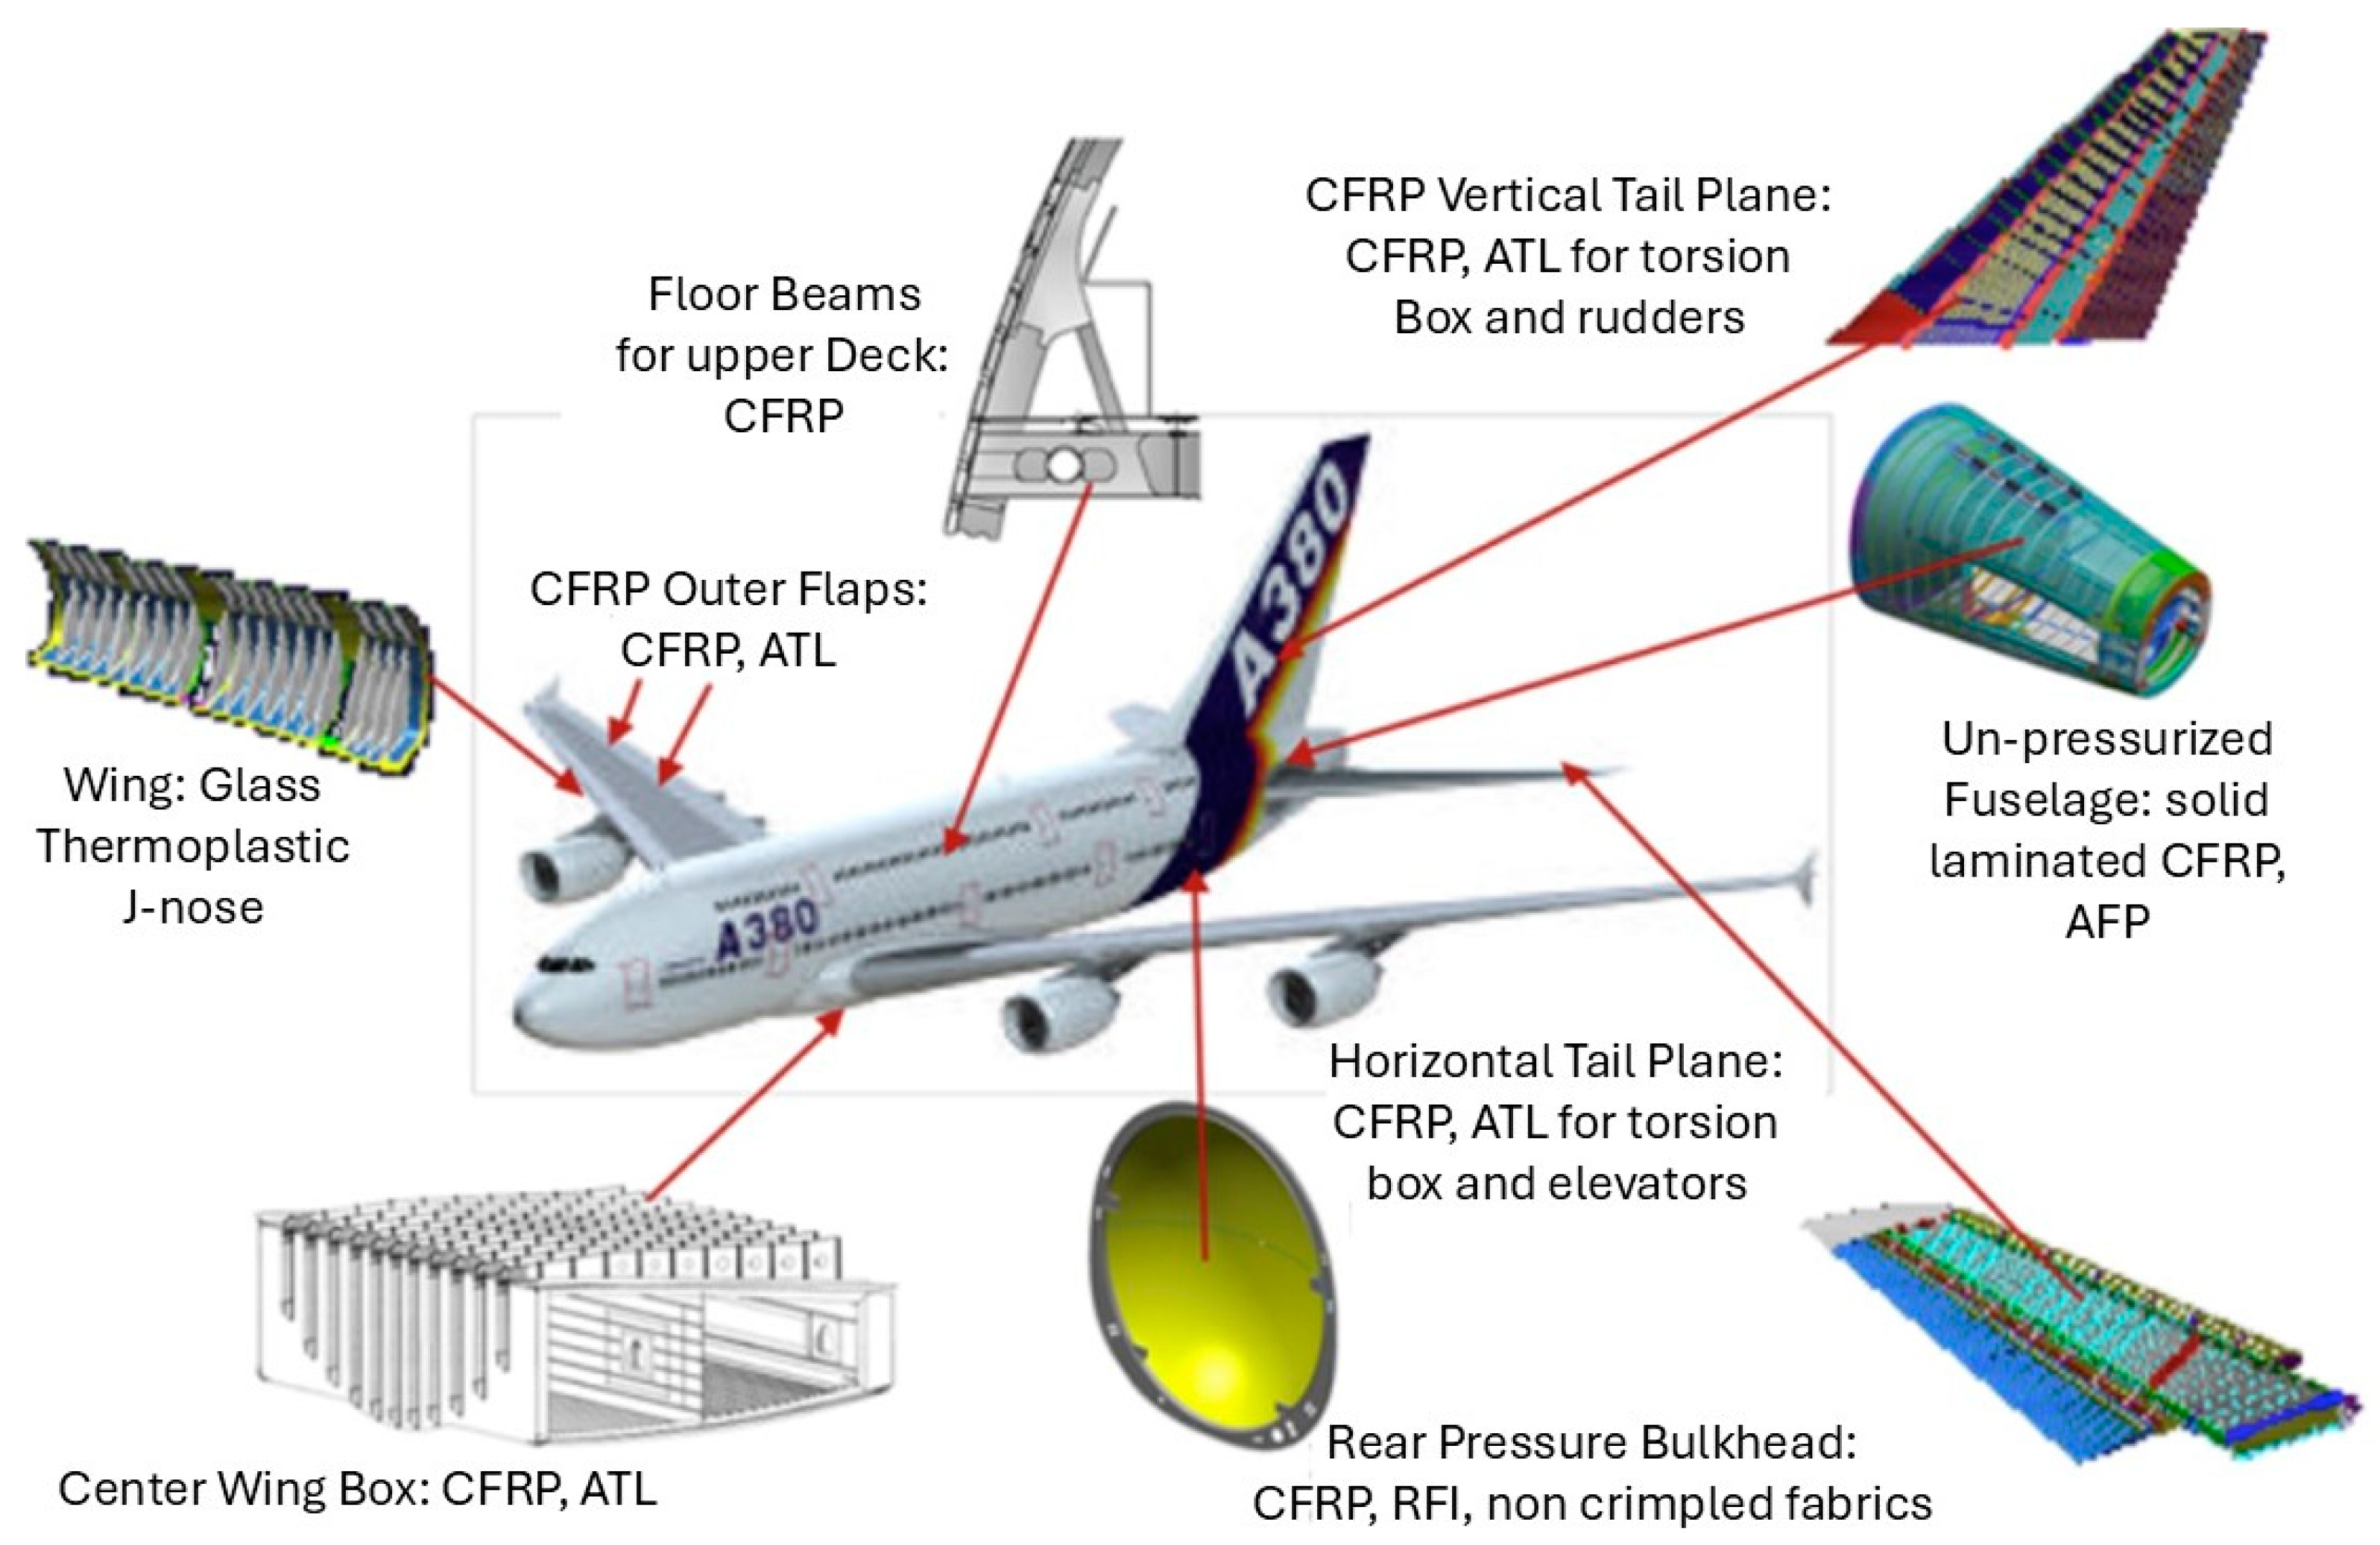
2.3. Material Selection
2.4. Type of Defects
2.5. Size and Depth Estimation Techniques
3. Discussion
4. Conclusions
5. Future Directions
- To develop a dataset comprising at least 1000 real and 500 synthetic images derived from the 3D model, ensuring it adheres to deep learning standards for accuracy, diversity, and quality.
- To train and develop a machine learning model capable of detecting and classifying the most common defects for each material, achieving a minimum precision of 80%, a recall of 70%, and an F1 score of at least 0.75.
- To address the challenges an unbalanced dataset poses and enhance the model’s performance by at least 5% by applying advanced imaging techniques.
- To develop a defect measurement tool capable of estimating the size and depth of the detected defect with an error rate below 10%.
Author Contributions
Funding
Institutional Review Board Statement
Informed Consent Statement
Data Availability Statement
Acknowledgments
Conflicts of Interest
References
- Scavini, J. File:Boeing 737-800 v1.0.png. 30 October 2011. Available online: https://commons.wikimedia.org/wiki/File:Boeing_737-800_v1.0.png (accessed on 6 February 2025).
- IATA Maintenance Cost Technical Group. Airline Maintenance Cost Executive Commentary FY2022 Data. February 2024. Available online: https://www.iata.org/en/services/data/safety/gadm/mcx/ (accessed on 30 December 2024).
- Inmarsat and Cranfield University. Why the Future of Aviation Starts with Connectivity. March 2022. Available online: https://www.inmarsat.com/en/news/latest-news/aviation/2022/technology-innovations-revolutionise-aviation-cranfield-inmarsat.html (accessed on 22 July 2024).
- Cazzato, D.; Olivares-Mendez, M.A.; Sanchez-Lopez, J.L.; Voos, H. Vision-Based Aircraft Pose Estimation for UAVs Autonomous Inspection without Fiducial Markers. In Proceedings of the 45th Annual Conference of the IEEE Industrial Electronics Society (IECON), Lisbon, Portugal, 14–17 October 2019. [Google Scholar] [CrossRef]
- Olaganathan, R. Human Factors in Aviation Maintenance: Understanding Errors, Management, and Technological Trends. Glob. J. Eng. Technol. Adv. 2024, 18, 92–101. [Google Scholar] [CrossRef]
- National Transportation Safety Board. Loss of Pitch Control During Takeoff, Air Midwest Flight 5481, Raytheon (Beechcraft) 1900D, N233YV. Charlotte, North Carolina. January 2003. Available online: https://www.ntsb.gov/investigations/AccidentReports/Reports/AAR0401.pdf (accessed on 30 December 2024).
- Prasad, V.S.K. A Case Analysis of Human Factors Affecting Aviation Maintenance Personnel. Int. J. Aviat. Aeronaut. Aerosp. 2024, 9, 123–134. [Google Scholar] [CrossRef]
- Aircraft Accident Investigation Commission. Final Report on the Accident of ATR72/212A Version 500 (Registration: 9N-ANC) That Occurred on 15 January 2023, near Pokhara International Airport. 2023. Available online: https://www.tourism.gov.np/files/1/9N-ANC%20FINAL%20Report.pdf (accessed on 5 February 2025).
- Australian Transport Safety Bureau. Foreign Object Debris Event Involving Airbus A380, VH-OQI. 2024. Available online: https://www.atsb.gov.au/sites/default/files/2024-11/AO-2024-006%20Final.pdf (accessed on 5 February 2025).
- Civil Aviation Authority. Aircraft Maintenance Incident Analysis. 2016. Available online: https://www.caa.co.uk/our-work/publications/documents/content/cap1367/ (accessed on 30 December 2024).
- Folkard, S.; Rhythms, B.; Shiftwork Centre, Department of Psychology, University of Wales. Work Hours of Aircraft Maintenance Personnel–CAA PAPER 2002/06. 2003. Available online: https://www.caa.co.uk/our-work/publications/documents/content/caa-paper-200206/ (accessed on 30 December 2024).
- Wang, Y.; Gogu, C.; Binaud, N.; Bes, C.; Haftka, R.T.; Kim, N.-H. Predictive airframe maintenance strategies using model-based prognostics. Proc. Inst. Mech. Eng. Part G J. Aerosp. Eng. 2018, 232, 690–709. [Google Scholar] [CrossRef]
- Saltoʇlu, R.; Humaira, N.; Inalhan, G. Aircraft Scheduled Airframe Maintenance and Downtime Integrated Cost Model. Adv. Oper. Res. 2016, 2016, 2576825. [Google Scholar] [CrossRef]
- Wang, Y.; Gogu, C.; Binaud, N.; Bes, C. Comparing Structural Airframe Maintenance Strategies Based on Probabilistic Estimates of the Remaining Useful Service Life. November 2021. Available online: https://hal.science/hal-03446462 (accessed on 30 December 2024).
- Sadasivan, S.; Greenstein, J.S.; Gramopadhye, A.K.; Duchowski, A.T. Use of Eye Movements as Feedforward Training for a Synthetic Aircraft Inspection Task. In Proceedings of the SIGCHI conference on Human factors in computing systems, Portland, OR, USA, 2–7 April 2005. [Google Scholar] [CrossRef]
- Papa, U.; Ponte, S. Preliminary Design of an Unmanned Aircraft System for Aircraft General Visual Inspection. Electronics 2018, 7, 435. [Google Scholar] [CrossRef]
- US Department of Transportation–Federal Aviation Administration. Visual Inspection for Aircraft. In Advisory Circular (AC); AC 43–204; US Department of Transportation–Federal Aviation Administration: Washington, DC, USA, 1997; pp. 1–236. [Google Scholar]
- Civil Aviation Authority. CAP 562: Civil Aircraft Airworthiness Information and Procedures, Issue 8, Amendment 1. April 2022. Available online: https://www.caa.co.uk/publication/pid/92 (accessed on 26 July 2024).
- Jovančević, I.; Pham, H.-H.; Orteu, J.-J.; Gilblas, R.; Harvent, J.; Maurice, X.; Brèthes, L. 3D Point Cloud Analysis for Detection and Characterization of Defects on Airplane Exterior Surface. J. Nondestr. Eval. 2017, 36, 74. [Google Scholar] [CrossRef]
- Reyno, T.; Marsden, C.; Wowk, D. Surface Damage Evaluation of Honeycomb Sandwich Aircraft Panels Using 3D Scanning Technology. NDT E Int. 2018, 97, 11–19. [Google Scholar] [CrossRef]
- ASamarathunga, A.I.; Piyasundara, N.; Wanigasooriya, A.I.; Kumara, B.S.; Vithanage, V.P.; Chathuranga, D.S. A Robotic Platform for Aircraft Composite Structure Inspection Using Thermography. Robotics 2022, 11, 62. [Google Scholar] [CrossRef]
- DiLaura, D.; Houser, K.; Mistrick, R.; Steffy, G. The IES Lighting Handbook, 10th ed.; Illuminating Engineering Society: New York, NY, USA, 2011. [Google Scholar]
- Rice, M.; Li, L.; Ying, G.; Wan, M.; Lim, E.T.; Feng, G.; Ng, J.; Jin-Li, M.N.T.; Babu, V.S. Automating the Visual Inspection of Aircraft. In Proceedings of the Singapore Aerospace Technology and Engineering Conference (SATEC), Singapore, 7 February 2018. [Google Scholar]
- Drury, C.G.; Watson, J. Good Practices in Visual Inspection: Human Factors in Aviation Maintenance—Phase Nine, Progress Report; Applied Ergonomics Group Inc: Madison, IL, USA, 2002. [Google Scholar]
- Hobbs, A. An Overview of Human Factors in Aviation Maintenance. Aviation Research and Analysis Report AR-2008-055. December 2008. Available online: https://www.atsb.gov.au/publications/2008/ar2008055 (accessed on 15 August 2024).
- Dalton, R.P.; Cawley, P.; Lowe, M.J.S. The Potential of Guided Waves for Monitoring Large Areas of Metallic Aircraft Fuselage Structure. J. Nondestruct. Eval. 2001, 20, 29–46. [Google Scholar] [CrossRef]
- Bauda, M.-A.; Bazot, C.; Larnier, S. Real-time ground marking analysis for safe trajectories of autonomous mobile robots. In Proceedings of the2017 IEEE International Workshop of Electronics, Control, Measurement, Signals and their Application to Mechatronics (ECMSM), Donostia, Spain, 24–26 May 2017. [Google Scholar]
- Futterlieb, M. Vision-Based Navigation in a Dynamic Environment. LAAS-CNRS, Toulouse, France. 2017. Available online: https://laas.hal.science/tel-01624233v2 (accessed on 30 December 2024).
- Lakrouf, M.; Larnier, S.; Devy, M.; Achour, N. Moving Obstacles Detection and Camera Pointing for Mobile Robot Applications. In Proceedings of the ICMRE 2017, 2017 3rd International Conference on Mechatronics and Robotics Engineering, Paris, France, 14 September 2017; p. 10. [Google Scholar]
- Futterlieb, M.; Cadenat, V.; Sentenac, T. A Navigational Framework Combining Visual Servoing and Spiral Obstacle Avoidance Techniques. In Proceedings of the2014 11th International Conference on Informatics in Control, Automation and Robotics (ICINCO), Vienna, Austria, 1–3 September 2014. [Google Scholar]
- Frejaville, J.; Larnier, S.; Vetault, S. Localisation à partir de données laser d’un robot naviguant autour d’un avion. In Proceedings of the Reconnaissance de Formes et Intelligence Artificielle, Clermont-Ferrand, France, 18 June 2016. [Google Scholar]
- Toman, R.; Rogala, T.; Synaszko, P.; Katunin, A. Robotized Mobile Platform for Non-Destructive Inspection of Aircraft Structures. Appl. Sci. 2024, 14, 10148. [Google Scholar] [CrossRef]
- Miranda, J.; Larnier, S.; Herbulot, A.; Devy, M. UAV-Based Inspection of Airplane Exterior Screws with Computer Vision. 2019. Available online: https://laas.hal.science/hal-02065284 (accessed on 30 December 2024).
- Claybrough, M. System and Method for Automatically Inspecting Surfaces. WO 2016/203151 A1, 22 December 2016. [Google Scholar]
- Plastropoulos, A.; Bardis, K.; Yazigi, G.; Avdelidis, N.P.; Droznika, M. Aircraft Skin Machine Learning-Based Defect Detection and Size Estimation in Visual Inspections. Technologies 2024, 12, 158. [Google Scholar] [CrossRef]
- Alexakis, E.; Delegou, E.T.; Lampropoulos, K.C.; Apostolopoulou, M.; Ntoutsi, I.; Moropoulou, A. NDT as a monitoring tool of the works progress and the assessment of materials and rehabilitation interventions at the Holy Aedicule of the Holy Sepulchre. Constr. Build. Mater. 2018, 189, 512–526. [Google Scholar] [CrossRef]
- Qu, Z.; Jiang, P.; Zhang, W. Development and application of infrared thermography non-destructive testing techniques. Sensors 2020, 20, 3851. [Google Scholar] [CrossRef] [PubMed]
- Torbali, M.E.; Zolotas, A.; Avdelidis, N.P. A State-of-the-Art Review of Non-Destructive Testing Image Fusion and Critical Insights on the Inspection of Aerospace Composites towards Sustainable Maintenance Repair Operations. Appl. Sci. 2023, 13, 2732. [Google Scholar] [CrossRef]
- Ciampa, F.; Mahmoodi, P.; Pinto, F.; Meo, M. Recent advances in active infrared thermography for non-destructive testing of aerospace components. Sensors 2018, 18, 609. [Google Scholar] [CrossRef]
- Thulasy, T.N.; Nohuddin, P.N.E.; Nusyirwan, I.F.; Hijazi, M.H.A.; Zahra, M.M.A. Application of 3D scanning technology in Royal Malaysian Air Force Industrial Revolution 4.0-based aircraft maintenance. IET Netw. 2022, 11, 62–67. [Google Scholar] [CrossRef]
- Le Reun, A.; Subrin, K.; Dubois, A.; Garnier, S. Improving accuracy reconstruction of parts through a capability study: A methodology for X-ray Computed Tomography Robotic Cell. Rob. Auton. Syst. 2023, 164, 104564. [Google Scholar] [CrossRef]
- Zhang, D.; Watson, R.; Dobie, G.; Macleod, C.; Pierce, G. Autonomous ultrasonic inspection using unmanned aerial vehicle. In Proceedings of the 2018 IEEE International Ultrasonics Symposium (IUS), Kobe, Japan, 22–25 October 2018. [Google Scholar] [CrossRef]
- Kikechi, B.M. Evaluation of Effectiveness of Non-Destructive Testing Techniques for Inspection of Critical Aircraft Components: A Case of the Kenyan Aviation Industry; University of Nairobi: Nairobi, Kenya, 2020. [Google Scholar]
- Luk, B.L.; Chan, H.S. Human Factors and Ergonomics in Dye Penetrant and Magnetic Particles Nondestructive Inspection Methods. 2007. Available online: https://www.engineeringletters.com/issues_v15/issue_1/EL_15_1_25.pdf (accessed on 30 December 2024).
- Tzitzilonis, V.; Malandrakis, K.; Fragonara, L.Z.; Domingo, J.A.G.; Avdelidis, N.P.; Tsourdos, A.; Forster, K. Inspection of Aircraft Wing Panels Using Unmanned Aerial Vehicles. Sensors 2019, 19, 1824. [Google Scholar] [CrossRef]
- Lysenko, I.; Kuts, Y.; Uchanin, V.; Mirchev, Y.; Levchenko, O. Evaluation of Eddy Current Array Performance in Detecting Aircraft Component Defects. Trans. Aerosp. Res. 2024, 275, 1–9. [Google Scholar] [CrossRef]
- Holford, K.M.; Eaton, M.J.; Hensman, J.J.; Pullin, R.; Evans, S.L.; Dervilis, N.; Worden, K. A new methodology for automating acoustic emission detection of metallic fatigue fractures in highly demanding aerospace environments: An overview. Prog. Aerosp. Sci. 2017, 90, 1–11. [Google Scholar] [CrossRef]
- Sfarra, S.; Ibarra-Castanedo, C.; Avdelidis, N.P.; Genest, M.; Bouchagier, L.; Kourousis, D.; Tsimogiannis, A.; Anastassopoulous, A.; Bendada, A.; Maldague, X.; et al. A comparative investigation for the nondestructive testing of honeycomb structures by holographic interferometry and infrared thermography. J. Phys. Conf. Ser. 2010, 214, 012071. [Google Scholar] [CrossRef]
- Montesano, J.; Fawaz, Z.; Bougherara, H. Use of infrared thermography to investigate the fatigue behavior of a carbon fiber reinforced polymer composite. Compos. Struct. 2013, 97, 76–83. [Google Scholar] [CrossRef]
- Alhammad, M.; Avdelidis, N.P.; Castanedo, C.I.; Maldague, X.; Zolotas, A.; Torbali, E.; Genest, M. Multi-label classification algorithms for composite materials under infrared thermography testing. Quant. Infrared Thermogr. J. 2022, 21, 3–29. [Google Scholar] [CrossRef]
- Eshkalak, S.K.; Ghomi, E.R.; Dai, Y.; Choudhury, D.; Ramakrishna, S. The role of three-dimensional printing in healthcare and medicine. Mater. Des. 2020, 194, 108940. [Google Scholar] [CrossRef]
- Aimar, A.; Palermo, A.; Innocenti, B. The Role of 3D Printing in Medical Applications: A State of the Art. J. Healthc. Eng. 2019, 2019, 5340616. [Google Scholar] [CrossRef]
- Skublewska-Paszkowska, M.; Milosz, M.; Powroznik, P.; Lukasik, E. 3D technologies for intangible cultural heritage preservation—Literature review for selected databases. Herit. Sci. 2022, 10, 3. [Google Scholar] [CrossRef]
- Wits, W.W.; García, J.R.R.; Becker, J.M.J. How additive manufacturing enables more sustainable end-user maintenance, repair and overhaul (MRO) strategies. Procedia CIRP 2016, 40, 693–698. [Google Scholar] [CrossRef]
- Morze, N.V.; Varchenko-Trotsenko, L.O.; Tiutiunnyk, A.V. Introduction of STEAM Education with the Use of 3D Technologies: Modelling, Scanning and Printing. 2016. Available online: https://elibrary.kubg.edu.ua/id/eprint/16224/ (accessed on 30 December 2024).
- Tofail, S.A.M.; Koumoulos, E.P.; Bandyopadhyay, A.; Bose, S.; O’Donoghue, L.; Charitidis, C. Additive manufacturing: Scientific and technological challenges, market uptake and opportunities. Mater. Today 2018, 21, 22–37. [Google Scholar] [CrossRef]
- Javaid, M.; Haleem, A.; Pratap, S.R.; Suman, R. Industrial perspectives of 3D scanning: Features, roles and it’s analytical applications. Sens. Int. 2021, 2, 100114. [Google Scholar] [CrossRef]
- Warwick, G. Lidar Advances as Sensor for Commercial Aviation. Aviation Week Network. 2017. Available online: https://aviationweek.com/aerospace/lidar-advances-sensor-commercial-aviation (accessed on 30 December 2024).
- Boehler, W.; Vicent, M.B.; Marbs, A. Investigating Laser Scanner Accuracy. In Proceedings of the CIPA 2003 XIXth International Symposium, Antalya, Turkey, 30 September–4 October 2003. [Google Scholar]
- Vosselman, G.; Maas, H.-G. Airborne and Terrestrial Laser Scanning; Whittles Publishing: Boca Raton, FL, USA, 2010. [Google Scholar]
- Westoby, M.J.; Brasington, J.; Glasser, N.F.; Hambrey, M.J.; Reynolds, J.M. Structure-from-Motion’ photogrammetry: A low-cost, effective tool for geoscience applications. Geomorphology 2012, 179, 300–314. [Google Scholar] [CrossRef]
- Remondino, F.; El-hakim, S. Image-based 3D modelling: A review. Photogramm. Rec. 2006, 21, 269–291. [Google Scholar] [CrossRef]
- Colomina, I.; Molina, P. Unmanned aerial systems for photogrammetry and remote sensing: A review. ISPRS J. Photogramm. Remote Sens. 2014, 92, 79–97. [Google Scholar] [CrossRef]
- Edelman, G.J.; Aalders, M.C. Photogrammetry using visible, infrared, hyperspectral and thermal imaging of crime scenes. Forensic Sci. Int. 2018, 292, 181–189. [Google Scholar] [CrossRef] [PubMed]
- Dabous, S.A.; Al-Ruzouq, R.; Llort, D. Three-dimensional modeling and defect quantification of existing concrete bridges based on photogrammetry and computer aided design. Ain Shams Eng. J. 2023, 14, 102231. [Google Scholar] [CrossRef]
- Wu, J.; Shi, Y.; Wang, H.; Wen, Y.; Du, Y. Surface Defect Detection of Nanjing City Wall Based on UAV Oblique Photogrammetry and TLS. Remote. Sens. 2023, 15, 2089. [Google Scholar] [CrossRef]
- Califano, N.; Murakami, D. 3D Localization of Defects in Facility Inspection; National Aeronautics and Space Administration (NASA): Melbourne, FL, USA, 2020. Available online: https://ntrs.nasa.gov/api/citations/20205000516/downloads/FCRAR2020.pdf (accessed on 30 December 2024).
- Stathopoulou, E.K.; Welponer, M.; Remondino, F. Open-source image-based 3D reconstruction pipelines: Review, comparison and evaluation. In International Archives of the Photogrammetry, Remote Sensing and Spatial Information Sciences—ISPRS Archives; Copernicus GmbH for the International Society for Photogrammetry and Remote Sensing (ISPRS): Göttingen, Germany, 2019; pp. 331–338. [Google Scholar] [CrossRef]
- Lowe, D.G. Distinctive Image Features from Scale-Invariant Keypoints. November 2004. Available online: https://link.springer.com/article/10.1023/B:VISI.0000029664.99615.94 (accessed on 30 December 2024).
- Alcantarilla, P.F.; Nuevo, J.; Bartoli, A. Fast Explicit Diffusion for Accelerated Features in Nonlinear Scale Spaces. In Proceedings of the BMVC 2013—Electronic Proceedings of the British Machine Vision Conference, Bristol, UK, 9–13 September 2013; British Machine Vision Association, BMVA. pp. 1281–1298. Available online: https://bmva-archive.org.uk/bmvc/2013/Papers/paper0013/abstract0013.pdf (accessed on 18 March 2025). [CrossRef]
- Schönberger, J.L.; Price, T.; Sattler, T.; Frahm, J.-M.; Pollefeys, M. A Vote-and-Verify Strategy for Fast Spatial Verification in Image Retrieval. In Proceedings of the Computer Vision–ACCV 2016: 13th Asian Conference on Computer Vision, Taipei, Taiwan, 20–24 November 2016. [Google Scholar] [CrossRef]
- Schönberger, J.L.; Frahm, J.-M. Structure-from-Motion Revisited. In Proceedings of the IEEE Conference on Computer Vision and Pattern Recognition, Las Vegas, NV, USA, 27–30 June 2016. [Google Scholar] [CrossRef]
- Muja, M.; Lowe, D.G. Fast Approximate Nearest Neighbors with Automatic Algorithm Configuration. In Proceedings of the International Conference on Computer Vision Theory and Applications, Lisbon, Portugal, 5–8 February 2009; Available online: https://www.cs.ubc.ca/~lowe/papers/09muja.pdf (accessed on 30 December 2024).
- Cheng, J.; Leng, C.; Wu, J.; Cui, H.; Lu, H. Fast and Accurate Image Matching with Cascade Hashing for 3D Reconstruction. In Proceedings of the 2014 IEEE Conference on Computer Vision and Pattern Recognition (CVPR), Columbus, OH, USA, 23–28 June 2014; Available online: https://openaccess.thecvf.com/content_cvpr_2014/papers/Cheng_Fast_and_Accurate_2014_CVPR_paper.pdf (accessed on 30 December 2024).
- Hartley, R.; Zisserman, A. Multiple View Geometry in Computer Vision, 2nd ed.; Cambridge University Press: Cambridge, UK, 2003. [Google Scholar] [CrossRef]
- Stewénius, H.; Engels, C.; Nistér, D. Recent developments on direct relative orientation. J. Photogramm. Remote Sens. 2006, 60, 284–294. [Google Scholar] [CrossRef]
- Srajer, F. Image Matching for Dynamic Scenes. May 2016. Available online: https://dspace.cvut.cz/bitstream/handle/10467/64771/MU-DP-2016-posudek-Sara_Radim.pdf (accessed on 30 December 2024).
- Gao, X.-S.; Hou, X.-R.; Tang, J.; Cheng, H.-F. Complete Solution Classification for the Perspective-Three-Point Problem. IEEE Trans. Pattern Anal. Mach. Intell. 2003, 25, 930–943. [Google Scholar] [CrossRef]
- Lepetit, V.; Moreno-Noguer, F.; Fua, P. EPnP: An Accurate O(n) Solution to the PnP Problem. Int. J. Comput. Vis. 2008, 81, 155–166. [Google Scholar] [CrossRef]
- Agarwal, S.; Mierle, K.; The Ceres Solver Team. Ceres Solver. October 2023. Available online: https://github.com/ceres-solver/ceres-solver (accessed on 16 October 2024).
- Schönberger, J.L.; Zheng, E.; Pollefeys, M.; Frahm, J.-M. Pixelwise View Selection for Unstructured Multi-View Stereo. In Proceedings of the Computer Vision–ECCV 2016: 14th European Conference, Amsterdam, The Netherlands, 11–14 October 2016. [Google Scholar] [CrossRef]
- Shen, S. Accurate Multiple View 3D Reconstruction Using Patch-Based Stereo for Large-Scale Scenes. IEEE Trans. Image Process. 2013, 22, 1901–1914. [Google Scholar] [CrossRef]
- Hirschmüller, H. Stereo Processing by Semiglobal Matching and Mutual Information. IEEE Trans. Pattern Anal. Mach. Intell. 2008, 30, 328–341. [Google Scholar] [CrossRef]
- Alexakis, E.; Delegou, E.T.; Mavrepis, P.; Rifios, A.; Kyriazis, D.; Moropoulou, A. A novel application of deep learning approach over IRT images for the automated detection of rising damp on historical masonries. Case Stud. Constr. Mater. 2024, 20, e02889. [Google Scholar] [CrossRef]
- Wang, C.; Wang, X.; Zhou, X.; Li, Z. The Aircraft Skin Crack Inspection Based on Different-Source Sensors and Support Vector Machines. J. Nondestruct. Eval. 2016, 35, 46. [Google Scholar] [CrossRef]
- Malekzadeh, T.; Abdollahzadeh, M.; Nejati, H.; Cheung, N.-M. Aircraft Fuselage Defect Detection Using Deep Neural Networks. December 2017. Available online: https://arxiv.org/abs/1712.09213 (accessed on 30 December 2024).
- Krizhevsky, A.; Sutskever, I.; Hinton, G.E. ImageNet Classification with Deep Convolutional Neural Networks. In Advances in Neural Information Processing Systems; ISPRS: Lake Tahoe, NV, USA, 2012; Available online: https://papers.nips.cc/paper/2012/file/c399862d3b9d6b76c8436e924a68c45b-Paper.pdf (accessed on 30 December 2024).
- Chatfield, K.; Simonyan, K.; Vedaldi, A.; Zisserman, A. Return of the Devil in the Details: Delving Deep into Convolutional Nets. In Proceedings of the British Machine Vision Conference (BMVC), Nottinghamshire, UK, 1–5 September 2014; pp. 1–12. Available online: https://arxiv.org/abs/1405.3531 (accessed on 30 December 2024).
- Bay, H.; Tuytelaars, T.; Van Gool, L. SURF: Speeded Up Robust Features. In Proceedings of the 9th European Conference on Computer Vision (ECCV), Graz, Austria, 7–13 May 2006; Springer: Berlin/Heidelberg, Germany, 2006; pp. 404–417. [Google Scholar] [CrossRef]
- Vedaldi, A.; Lenc, K. MatConvNet—Convolutional Neural Networks for MATLAB. May 2016. Available online: https://arxiv.org/abs/1412.4564 (accessed on 31 December 2024).
- Miranda, J.; Veith, J.; Larnier, S.; Herbulot, A.; Devy, M. Machine learning approaches for defect classification on aircraft fuselage images acquired by a UAV. In Proceedings of the Fourteenth International Conference on Quality Control by Artificial Vision, Mulhouse, France; 2019; pp. 111–124. [Google Scholar] [CrossRef]
- Bouarfa, S.; Doğru, A.; Arizar, R.; Aydoğan, R.; Serafico, J. Towards Automated Aircraft Maintenance Inspection. A Use Case of Detecting Aircraft Dents Using Mask R-CNN. In Proceedings of the AIAA Scitech 2020 Forum, Orlando, FL, USA, 6–10 January 2020; American Institute of Aeronautics and Astronautics Inc.: Reston, VA, USA, 2020. [Google Scholar] [CrossRef]
- Dutta, A.; Zisserman, A.; Jain, M. The VIA Annotation Software for Images, Audio and Video. Nice, France. October 2019. Available online: https://arxiv.org/abs/1904.10699 (accessed on 31 December 2024).
- Ren, I.; Zahiri, F.; Sutton, G.; Kurfess, T.; Saldana, C. A Deep Ensemble Classifier for Surface Defect Detection in Aircraft Visual Inspection. Smart Sustain. Manuf. Syst. 2020, 4, 81–94. [Google Scholar] [CrossRef]
- Avdelidis, N.P.; Tsourdos, A.; Lafiosca, P.; Plaster, R.; Plaster, A.; Droznika, M. Defects Recognition Algorithm Development from Visual UAV Inspections. Sensors 2022, 22, 4682. [Google Scholar] [CrossRef]
- Ding, M.; Wu, B.; Xu, J.; Kasule, A.N.; Zuo, H. Visual inspection of aircraft skin: Automated pixel-level defect detection by instance segmentation. Chin. J. Aeronaut. 2022, 35, 254–264. [Google Scholar] [CrossRef]
- Jaeger, B.E.; Schmid, S.; Grosse, C.U.; Gögelein, A.; Elischberger, F. Infrared Thermal Imaging-Based Turbine Blade Crack Classification Using Deep Learning. J. Nondestr. Eval. 2022, 41, 74. [Google Scholar] [CrossRef]
- Oh, X.; Loh, L.; Foong, S.; Koh, Z.B.A.; Ng, K.L.; Tan, P.K.; Toh, P.L.P.; Tan, U.-X. CNN-Based Camera Pose Estimation and Localization of Scan Images for Aircraft Visual InspectionAircraft Visual Inspection. IEEE Trans. Intell. Transp. Syst. 2024, 25, 8629–8640. [Google Scholar] [CrossRef]
- Zhang, X.; Chen, Y.; Hu, J. Recent advances in the development of aerospace materials. Prog. Aerosp. Sci. 2018, 97, 22–34. [Google Scholar] [CrossRef]
- Li, J.; Zhan, D.; Jiang, Z.; Zhang, H.; Yang, Y.; Zhang, Y. Progress on improving strength-toughness of ultra-high strength martensitic steels for aerospace applications: A review. J. Mater. Res. Technol. 2023, 23, 172–190. [Google Scholar] [CrossRef]
- Suomalainen, E.; Celikel, A.; Vénuat, P. Aircraft Metals Recycling: Process, Challenges and Opportunities. 2014. Available online: https://api.semanticscholar.org/CorpusID:214587198 (accessed on 31 December 2024).
- Tah, B. Manufacturing and Structural Analysis of a Lightweight Sandwich Composite UAV Wing. 2007. Available online: https://etd.lib.metu.edu.tr/upload/12608774/index.pdf (accessed on 31 December 2024).
- Wong, K.; Rudd, C.; Pickering, S.; Liu, X.L. Composites recycling solutions for the aviation industry. Sci. China Technol. Sci. 2017, 60, 1291–1300. [Google Scholar] [CrossRef]
- Skoczylas, J.; Samborski, S.; Kłonica, M. The Application of Composite Materials in the Aerospace Industry. J. Technol. Exploit. Mech. Eng. 2019, 5, 1–6. [Google Scholar] [CrossRef]
- Sause, M.G.R.; Jasiūnienė, E. Structural Health Monitoring Damage Detection Systems for Aerospace; Springer: Berlin/Heidelberg, Germany, 2021; Available online: https://link.springer.com/book/10.1007/978-3-030-72192-3 (accessed on 31 December 2024).
- Griwodz, C.; Gasparini, S.; Calvet, L.; Gurdjos, P.; Castan, F.; Maujean, B.; De Lillo, G.; Lanthony, Y. AliceVision Meshroom: An open-source 3D reconstruction pipeline. In Proceedings of the MMSys ‘21: Proceedings of the 12th ACM Multimedia Systems Conference, Istanbul, Turkey, 7–11 September 2021; ACM: New York, NY, USA, 2021; pp. 241–247. [Google Scholar] [CrossRef]


| Reference | Technology | Test Object | Advantages | Limitations | Suitable Type of Defect to Be Detected |
|---|---|---|---|---|---|
| [37,38,39] | X-ray | Internal Defects | Not limited by material and geometry; most sensitive to volumetric defects | Defect depth limitations; strict installation and safety requirements; high cost | Porosity or Voids Debonding Foreign Bodies |
| [37,38,39] | Ultrasonic | Surface and Internal Defects | Sensitive to defects and quick results | Difficult to detect small, thin and complex parts; coupling agent and direct contact with the specimen is required | Porosity or Voids Delamination Debonding Foreign Bodies Cracks |
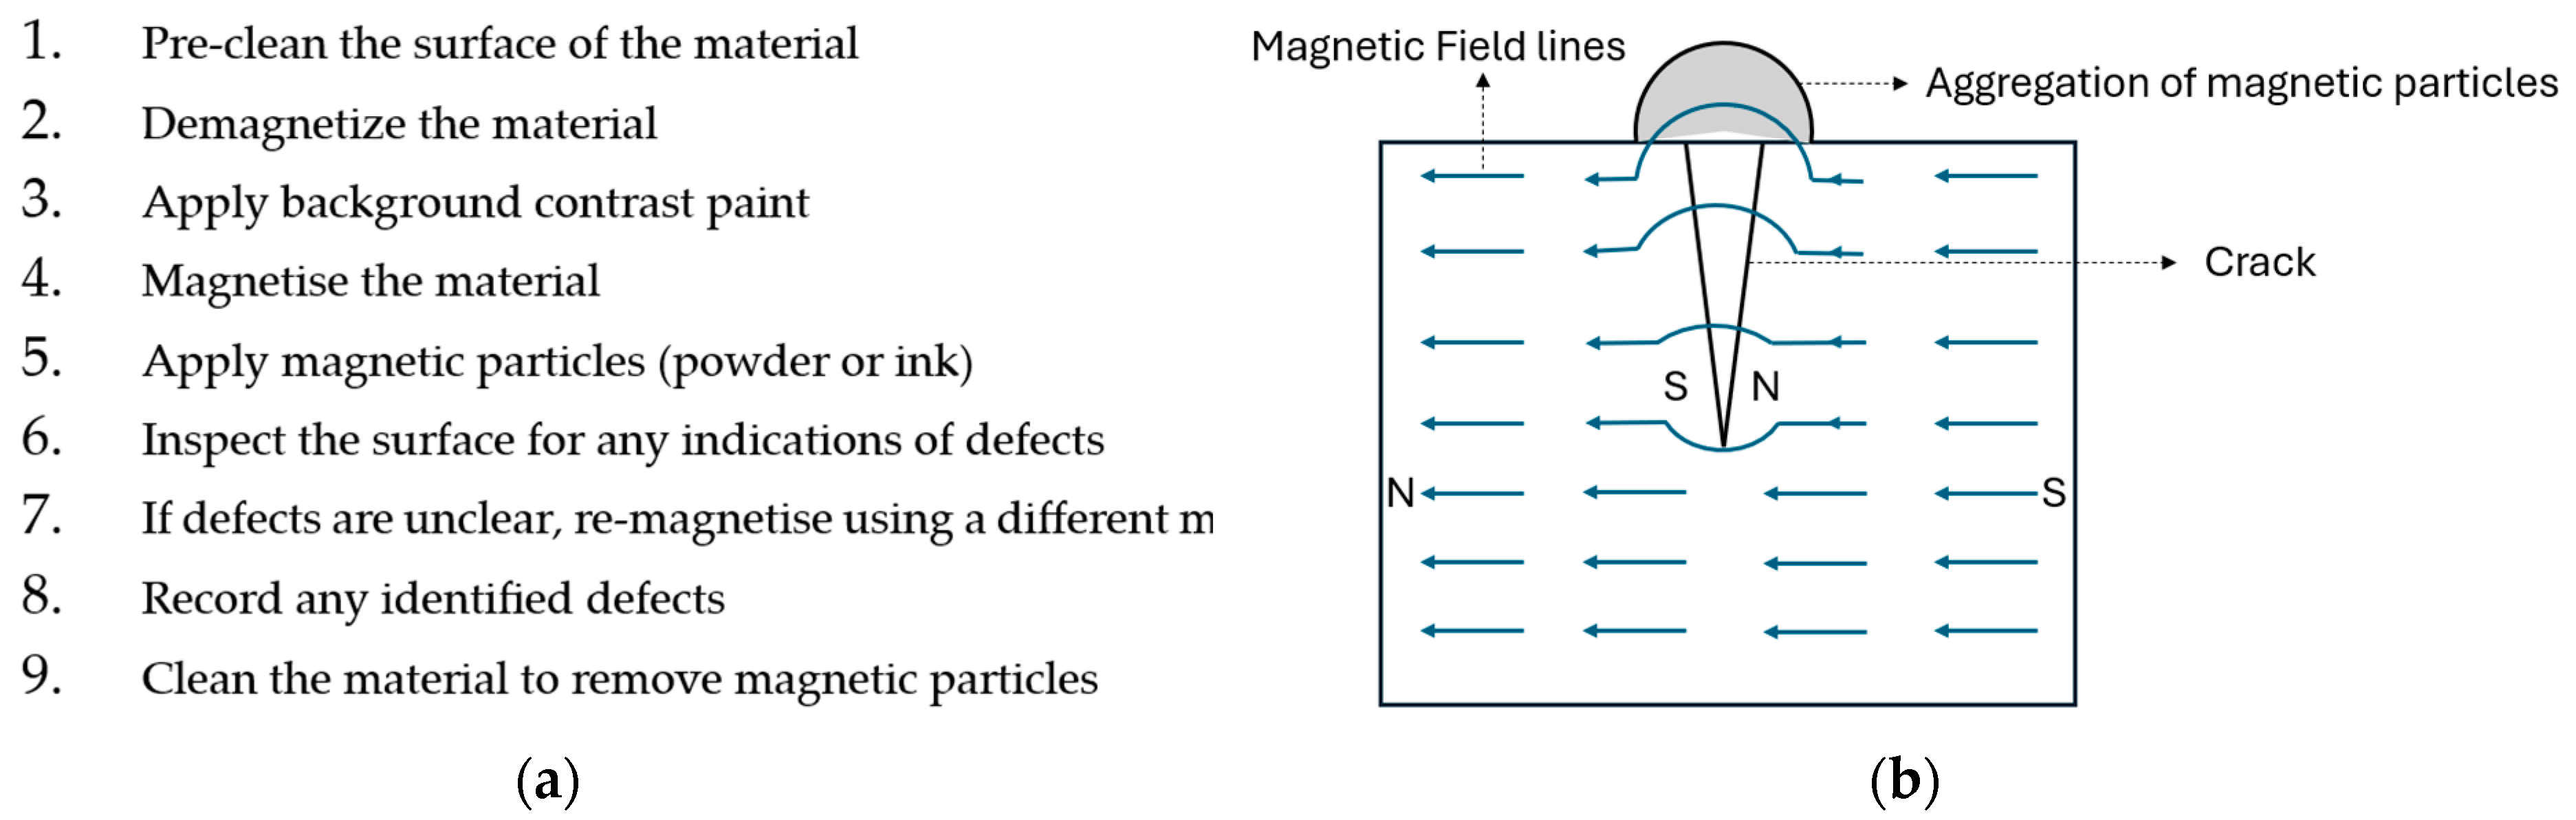
| [37,38,39] | Magnetic Particle | Surface and Near-Surface Defects | Higher sensitivity than ultrasonic or radiographic when testing surface defects | Limited to Ferromagnetic material; difficult to measure the defect depth | Cracks |
| [37,38,39] | Penetrant | Surface opening defect | The operation is simple, and the sensitivity is high | Only surface-opening defects can be detected | Surface-opening defects |
| [37,38,39] | Eddy Current | Surface and Near-Surface Defects | Highly automated system; time-saving; no couplant required | Limited to conductive material; easy to give a false display | Cracks |
| [37,38,39] | Acoustic Emission | Surface and Internal Defects | Effective for active defects | Having issues with the defect size and shape aspects | Porosity or Voids Delamination Debonding Foreign Bodies Cracks |
| [37,38,39] | Infrared Thermography (IRT) | Surface and Near-Surface Defects | Suitable with metallic and non-metallic materials; no contamination or contact of the test piece | The detection depth is not deep enough; | Delamination Debonding Corrosion Impact Damage Cracks |
| [19,20,40] | 3D Scanning—Laser/LiDAR | Surface Defects | High accuracy; non-contact Inspection; quick data acquisition; detailed 3D mapping; suitable for a wide range of materials and geometries | Surface-only detection; reflectivity issues; high equipment cost; environmental sensitivity | Dents Surface wear Surface deformation Corrosion |
| Method | Heat Source | Heating Duration | Depth of Penetration | Primary Application | Suitable Aircraft Defect |
|---|---|---|---|---|---|
| PT | High-energy flash/laser | Short, intense pulse | Shallow to medium | Surface and near-surface defects | Surface cracks, delamination, impact damage |
| LIT | Modulated laser/halogen lamp | Modulated, periodic | Medium | Deeper subsurface defects | Fatigue cracks, corrosion, bonding defects |
| SHT | Infrared lamps/heaters | Gradual, continuous heating | Medium to deep | Subsurface and deep defects | Delamination, deep cracks, corrosion |
| LPT | Continuous lamp/laser | Extended duration | Deep | Deeper subsurface defects | Corrosion, internal cracks, delamination |
| FMT | Frequency-modulated energy source | Variable frequency pulses | Medium to deep | Subsurface defect detection | Delamination, debonding, cracks |
| LST | Focused laser spot | Focused, short pulse on a spot | Shallow | Localised defect detection | Localised cracks, impact damage |
| LLT | Laser line | Focused, continuous line heating | Medium | Defect detection along a line | Cracks, corrosion along structural lines |
| Aspect | Laser Scanning | LiDAR Scanning |
|---|---|---|
| Purpose | High-precision scanning of objects or structures to create detailed 3D models | Large-scale mapping and environmental scanning using distance measurement |
| Method | Uses a laser beam to measure reflected light and capture an object’s shape and dimensions | It uses pulsed laser beams to measure the time it takes for light to reflect and return, creating 3D maps |
| Best For | Capturing small to medium-sized objects in great detail | Mapping large areas and scanning complex environments |
| Typical Applications | Manufacturing, architecture, reverse engineering, 3D modelling of surfaces | Topography, forestry, urban planning, autonomous vehicles |
| Range | Short to medium range (up to several metres) | Long range (hundreds of metres to kilometres) |
| Accuracy | Extremely high, capturing fine surface details | High, but typically less detailed than laser scanning |
| Data Output | Point clouds representing detailed object surfaces | Point clouds representing wide-area 3D maps |
| COLMAP | OpenMVG | AliceVision | |
|---|---|---|---|
| Key point extraction | SIFT [69] | SIFT [69] AKAZE [70] | SIFT [69] AKAZE [70] |
| Key point matching | Exhaustive, Sequential, Vocabulary Tree [71] Spatial [72] Transitive [72] | Brute Force, ANN [73] Cascade Hashing [74] | ANN [73] Cascade Hashing [74] |
| Geometric verification | 4 points homography [75] 5 points relative pose [76] 7–8 points F-matrix [75] | 4 points homography [75] 5 points relative pose [76] 7–8 points F-matrix [75] | 4 points homography [75] 5 points relative pose [76] 7–8 points F-matrix [75] homography growing [77] |
| Incremental bundle (image resection and triangulation) | P3P [78] + DLT, EPnP [79] + DLT | P3P [78] + DLT, EPnP [79] + DLT | PnP [78] + DLT |
| Global bundle adjustment | CERES [80] | CERES [80] | CERES [80] |
| Dense point cloud generation | Patch-based stereo [81] | Patch-based stereo [82] | Semi Global Matching [83] |
| Author | Year | Feature Extractor | Classifier | Selection of ROI | Performance Metrics | Type of Defect | Data Processing | Environment/Libraries | Dataset |
|---|---|---|---|---|---|---|---|---|---|
| Congqing Wang [85] | 2016 |
| Multi-class Support Vector Machine (SVM), optimised with a Genetic Algorithm (GA) | N/A |
|
|
|
|
|
| Touba Malekzadeh [86] | 2017 | CNN pre-trained on ImageNet: AlexNet [87] and VGG-F [88] | SVM with a linear kernel | SURF Interest Point Extractor [89] |
|
|
|
|
|
| Julien Miranda [91] | 2019 | ResNet50 (fine-tuned) | Hybrid approach combining CNN with Prototypical Networks for few-shot learning | N/A |
|
|
|
|
|
| Julien Miranda [33] | 2019 | CNN with models like SSD (Single Shot Detector) and YOLO (You Only Look Once) | Generative Adversarial Network (GAN) to create prior patterns for matching detected screws | Manually identified as Zones of Interest (ZOIs) focused on screws |
|
|
|
|
|
| Soufiane Bouarfa [92] | 2020 | Mask R-CNN | N/A | N/A |
| Dents |
|
|
|
| Ivan Ren [94] | 2020 | Pre-trained CNNs: VGG, GoogLeNet, and ResNet with 18, 34, and 50 layers | 3 CNN base learners (ResNet18, GoogLeNet, and VGG11_bn) Homogeneous (three ResNet18 models), Dimensionally diverse (ResNet18, ResNet34, ResNet50), and Structurally diverse (ResNet18, GoogLeNet, VGG11_bn) | An ROI of 672 × 448 pixels was manually selected and then divided into smaller 224 × 224 images | 3x ResNet18
|
|
|
|
|
| Nicolas P. Avdelidis [95] | 2022 | Pretrained CNN: DenseNet201 | Ensemble of CNN models (EfficientNetB1, EfficientNetB5, EfficientNetB4, DenseNet169) | Manual cropping with Python script |
|
|
|
|
|
| Meng DING [96] | 2022 | ResNet-50 backbone, pre-trained on ImageNet | Improved Mask Scoring R-CNN framework. A new classifier head with four convolutional layers and a fully connected layer | A Region Proposal Network (RPN) identifies Regions of Interest (ROIs) automatically |
|
|
|
|
|
| Benedict E. Jaeger [97] | 2022 | CNN architecture: ResNet-18 | The ResNet-18 CNN was adapted for binary classification (crack or no crack) | For the SIM, 64 × 64-pixel patches were cropped from specific regions in the larger images |
|
|
|
|
|
| Xueyan Oh [98] | 2024 | A PoseNet, adapted with an Xception backbone Trained on ImageNet | Not available | The model operated on images captured from quadrants defined around the aircraft to localise each scan image |
| Focused on the spatial localisation of visual inspection images on the aircraft’s surface |
|
|
|
| Component | Applied Loads/Conditions | Material Requirements | Example Materials |
|---|---|---|---|
| Wing | Subjected to bending during flight; additional loads during taxiing, take-off, and landing; compression on the upper surface and tension on the lower surface during flight | High tensile and compressive strength | 2024 Al-based alloy: Moderate yield strength (324 MPa), good fracture toughness (37 MPa m1/2), high elongation (21%); Polymer Matrix Composites (PMC) such as CFRP: High strength (3450–4830 MPa), elastic modulus (224–241 GPa), high-temperature resistance (290–345 °C) |
| Fuselage | Exposed to high cabin pressure and shear loads | High tensile and shear strength | 2024 Al-based alloy: Used for moderate yield strength and durability |
| Exhaust Nozzle | Exposed to high temperatures | High-temperature capability | Ceramic Matrix Composites (CMC) |
| Aircraft Brakes | Subjected to extremely high temperatures (up to 1200 °C under emergency conditions) | High-temperature resistance | Carbon fibre-reinforced silicon carbide |
| Ailerons, Flaps, Landing-Gear, Doors | High specific strength and specific modulus needed | Lightweight with high strength-to-weight ratio | Polymer Matrix Composites (PMC): Both thermoset and thermoplastic PMCs |
| Type of Defects During Manufacturing and In-Service | Material | |
| Metallic | Composite | |
❖ Fatigue cracks | ❖ Disbonds | |
❖ Pores and voids | ❖ Delamination | |
❖ Corrosion | ❖ Foreign Inclusion | |
❖ Material inclusions | ❖ Fibre/Matrix Cracking | |
❖ Welded sheets without metal diffusion | ❖ Honeycomb cell wall damage | |
❖ Overload | ❖ Porosity | |
❖ Wear | ❖ Thermal stress cracking | |
❖ Creep | ❖ Fatigue | |
❖ Impact damage and BVID | ||
❖ Water ingress | ||
❖ Absence of adhesive | ||
❖ Skin-to-core debonding | ||
❖ Core crushing | ||
| Criteria | Sub-Criteria | Parameters | NDT Technologies | |||||||||
|---|---|---|---|---|---|---|---|---|---|---|---|---|
| X-Ray | Ultrasonic | Magnetic Particle | Penetrant | Eddy Current | Acoustic Emission | IRT | 3D Scanning | |||||
| Laser | LiDAR | Photogrammetry (RGB) | ||||||||||
| Capability | Surface defects | Cracks Surface-Opening Corrosion Impact Damage Dents Surface Wear Surface Deformation | X | X | X | X | X | X X X | X X X X | X X X X | X X X X | |
| Near-surface defects | Cracks Debonding Corrosion Impact Damage Delamination | X | X X X | X | X | X X X | X X X X X | |||||
| Non-Contact Inspection | No-coupling agent required | X | Requires a coupling medium (gel, water, or oil) | Requires magnetic ink or powder application | Requires liquid penetrant and developer application | Requires probe contact with the material | Needs direct contact with the structure | X | X | X | X | |
| Performance under different environments | Efficiency under different finishes | High defect detection capability under different materials | X Metals, composites, ceramics | X Metals, composites, some plastics | Only ferromagnetic materials | Only materials with smooth surfaces | Conductive materials only | X Metals, composites, some ceramics | X Metals, composites, plastics | X Most materials | Most solid structures | X All visible materials |
| Consistency | Repeatability | X | X | Manual application only | Depends on surface preparation, dwell time, and lighting | X | Depends on sensor placement and background noise | Environmental factors | X | X | X | |
| Sensitivity | High defect detection accuracy | X | X | X | X | X | X | X | X | X | X | |
| High coverage range | Requires multiple exposures | Requires manual scanning | Only works in localised areas | Requires individual component inspection | Limited to small probe areas | X | X | Moderate coverage range | X | X | ||
| Ease of use | Ease of data collection | Portability | Heavy equipment, shielding is required | X | X | X | X | X | X | X | X | X |
| Ease of use | Ease of data collection | Minimum safety requirements | Radiation hazard requires shielding and legal permits | X | X | Uses chemicals that require proper ventilation | X | X | X | X | X | X |
| Ease of data analysis | Minimum complexity of data analysis | Requires trained personnel to interpret images | X | X | X | X | Complex waveform analysis requires signal processing and pattern recognition | X | X | X | X | |
| Cost | Data collection cost | Low equipment and software cost | Requires expensive equipment, protective shielding, and specialised software | Advanced phased-array systems cost more | X | X | X Interpretation software can add cost | It needs multiple sensors and advanced signal-processing software | X | High-precision versions are costly | X More expensive than photogrammetry | X |
| Speed | Data collection speed | High acquisition speed | Requires exposure time + processing time | Single-probe scanning takes time | X | Requires dwell time for the penetrant to seep into defects | X | X | X | Scanning large surfaces takes time | X | X |
| Speed | Data analysis speed | Data analysis is quick and efficient | Requires image processing, defect interpretation, and expert review | X | X | X | X | Requires signal processing and pattern analysis | X | Requires point cloud processing | Large datasets require software processing | Post-processing takes time |
| TOTAL SCORE | 5 | 11 | 9 | 6 | 10 | 10 | 18 | 11 | 13 | 14 | ||
Disclaimer/Publisher’s Note: The statements, opinions and data contained in all publications are solely those of the individual author(s) and contributor(s) and not of MDPI and/or the editor(s). MDPI and/or the editor(s) disclaim responsibility for any injury to people or property resulting from any ideas, methods, instructions or products referred to in the content. |
© 2025 by the authors. Licensee MDPI, Basel, Switzerland. This article is an open access article distributed under the terms and conditions of the Creative Commons Attribution (CC BY) license (https://creativecommons.org/licenses/by/4.0/).
Share and Cite
Bardis, K.; Avdelidis, N.P.; Ibarra-Castanedo, C.; Maldague, X.P.V.; Fernandes, H. Advanced Diagnostics of Aircraft Structures Using Automated Non-Invasive Imaging Techniques: A Comprehensive Review. Appl. Sci. 2025, 15, 3584. https://doi.org/10.3390/app15073584
Bardis K, Avdelidis NP, Ibarra-Castanedo C, Maldague XPV, Fernandes H. Advanced Diagnostics of Aircraft Structures Using Automated Non-Invasive Imaging Techniques: A Comprehensive Review. Applied Sciences. 2025; 15(7):3584. https://doi.org/10.3390/app15073584
Chicago/Turabian StyleBardis, Kostas, Nicolas P. Avdelidis, Clemente Ibarra-Castanedo, Xavier P. V. Maldague, and Henrique Fernandes. 2025. "Advanced Diagnostics of Aircraft Structures Using Automated Non-Invasive Imaging Techniques: A Comprehensive Review" Applied Sciences 15, no. 7: 3584. https://doi.org/10.3390/app15073584
APA StyleBardis, K., Avdelidis, N. P., Ibarra-Castanedo, C., Maldague, X. P. V., & Fernandes, H. (2025). Advanced Diagnostics of Aircraft Structures Using Automated Non-Invasive Imaging Techniques: A Comprehensive Review. Applied Sciences, 15(7), 3584. https://doi.org/10.3390/app15073584