
Optimization of Nitrogen Fertilization Strategies for Drip Irrigation of Cotton in Large Fields by DSSAT Combined with a Genetic Algorithm

Abstract
1. Introduction
2. Materials and Methods
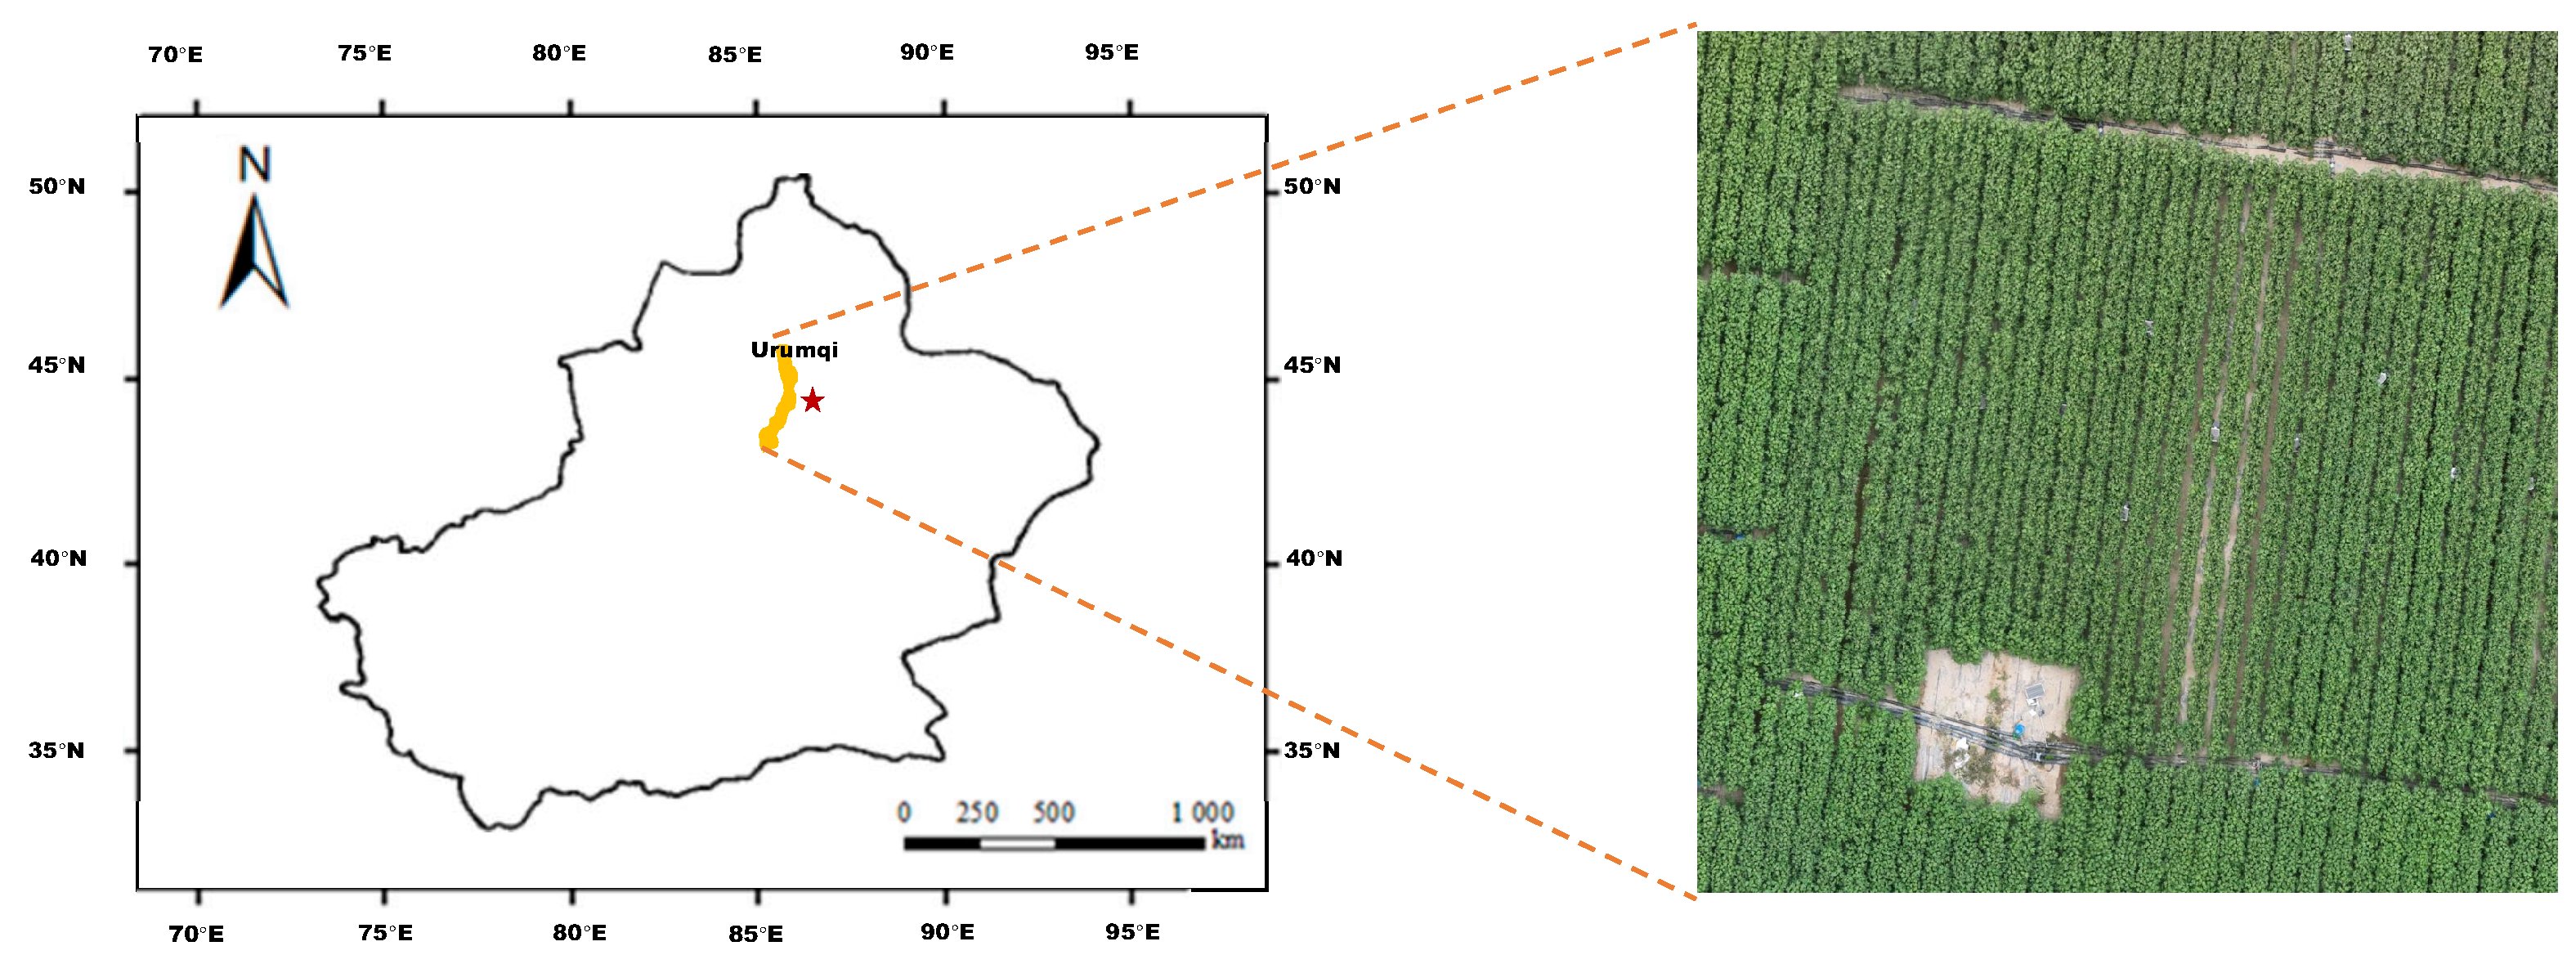
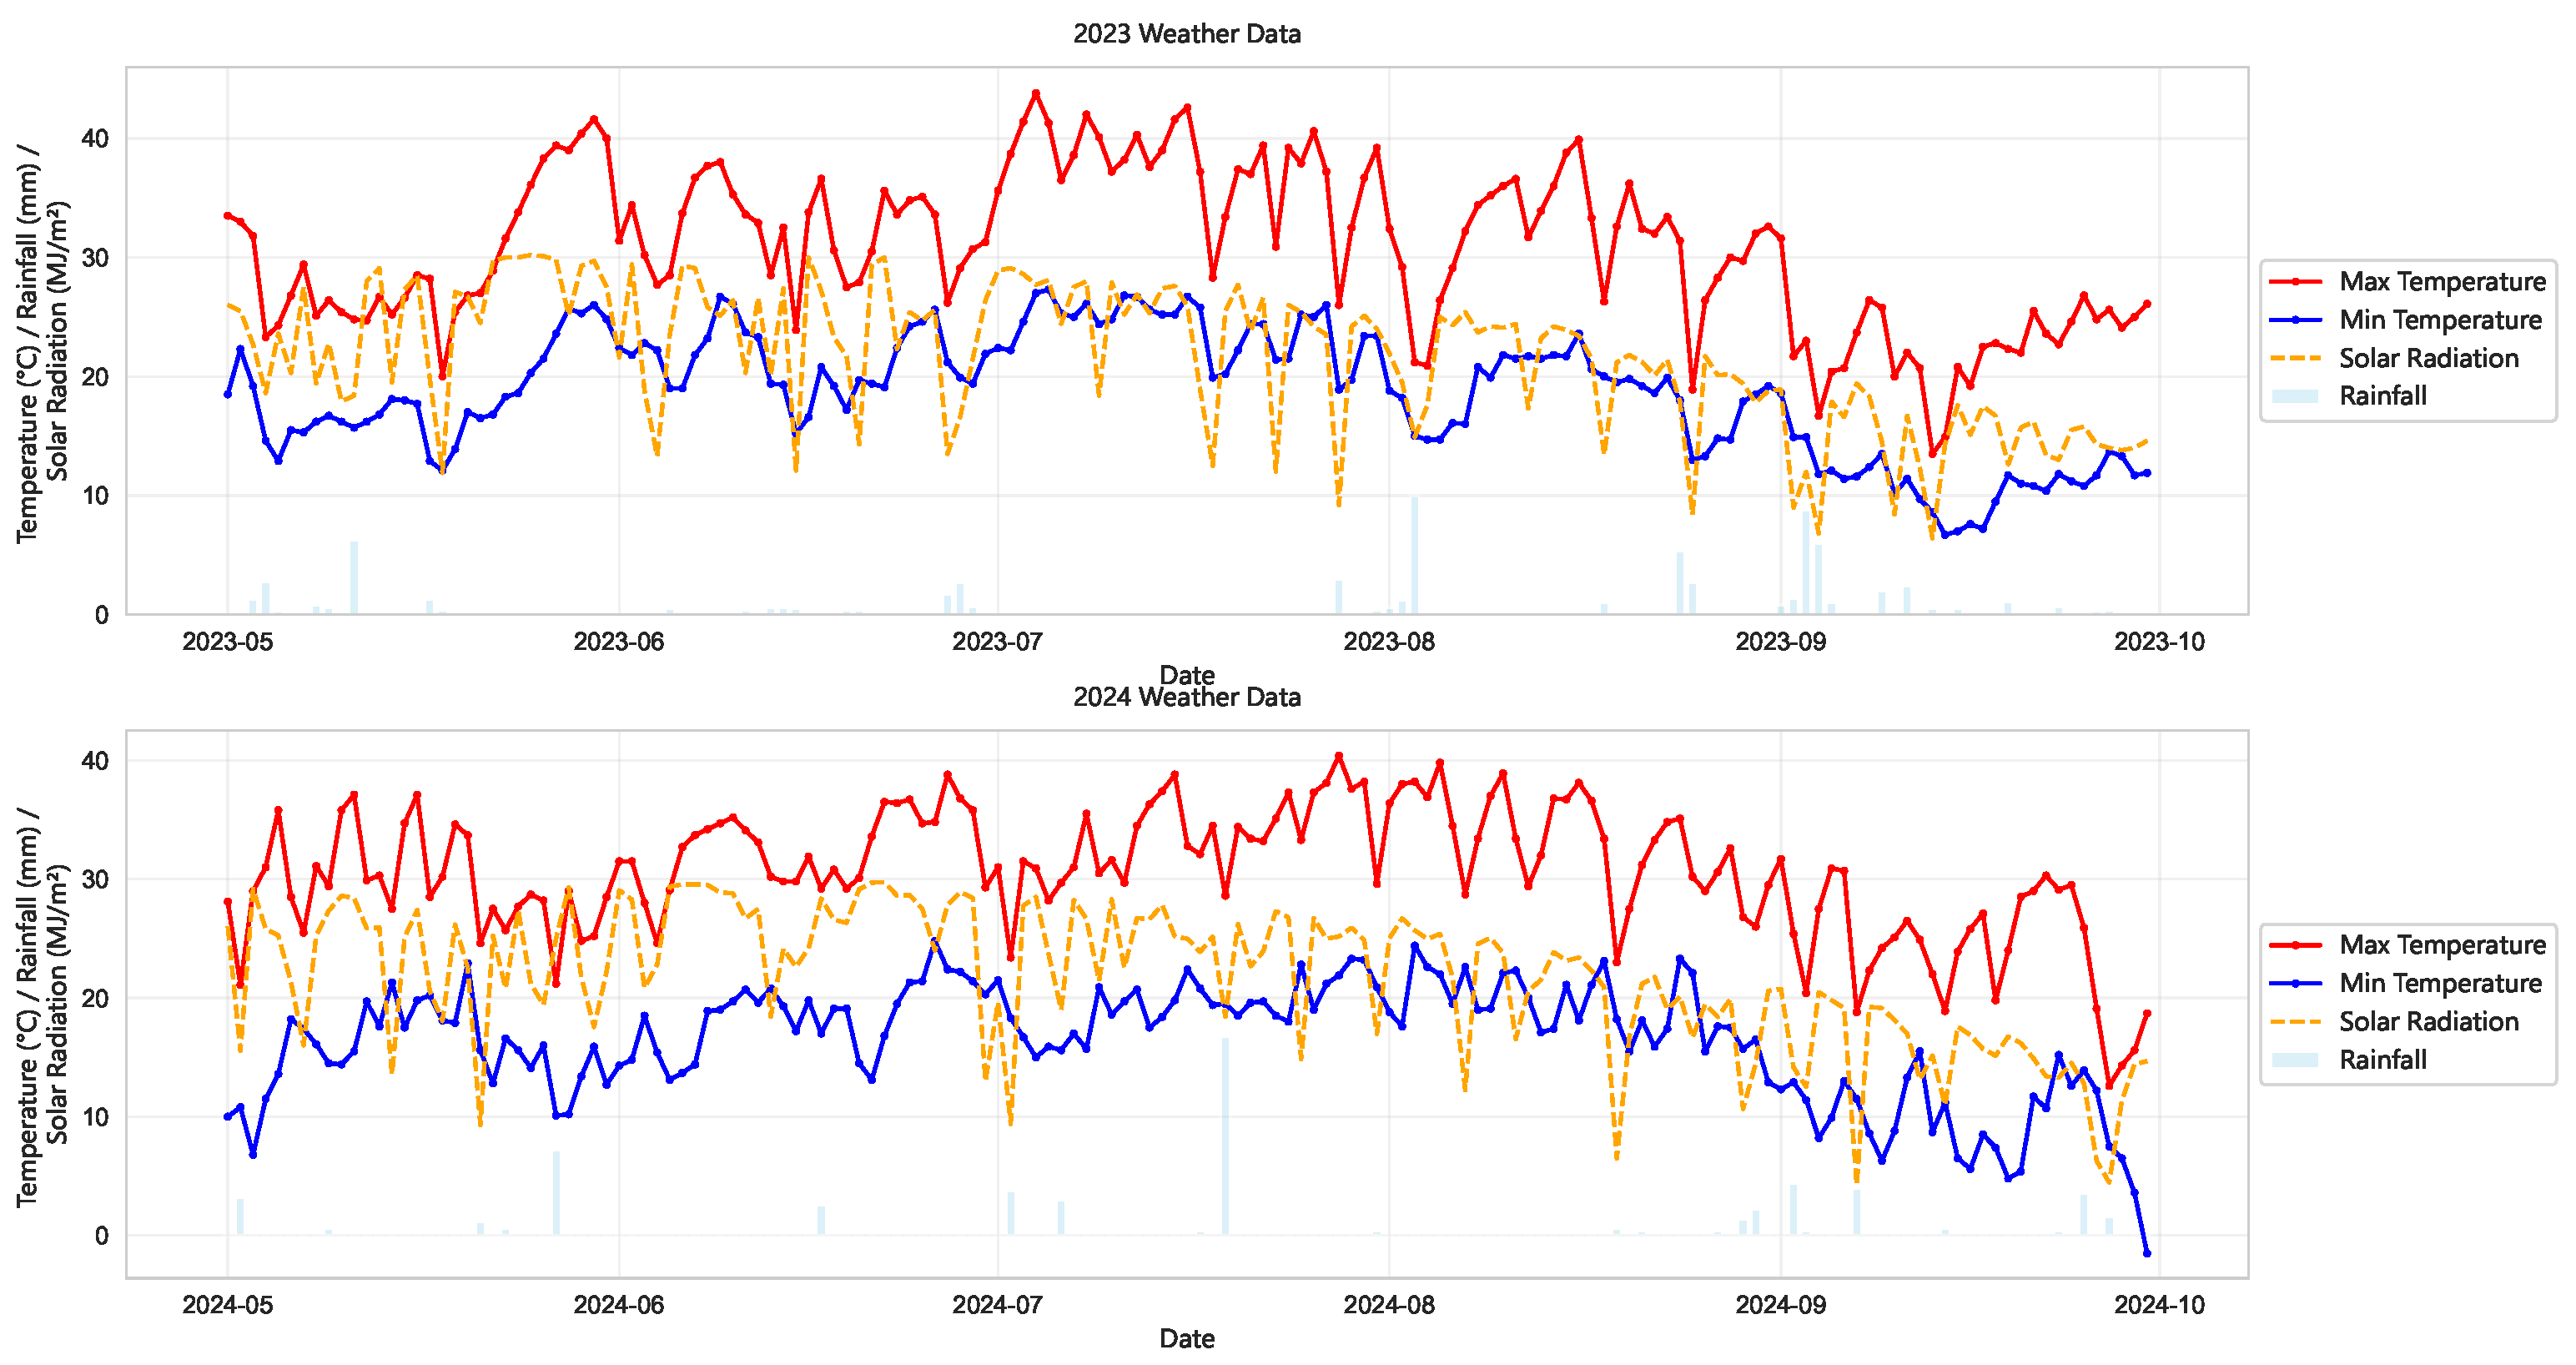
2.1. Study Site and Experimental Design
- Organic carbon: (Walkley–Black wet oxidation);
- Total phosphorus: (microwave-assisted HNO3 digestion/ICP-OES);
- Bioavailable phosphorus (Olsen-P): ;
- Total nitrogen: (Kjeldahl digestion);
- Mineral N ( + ): (2 M KCl extraction);
- Soil–water pH (1:2.5): .
2.2. Experimental Indicators and Methods
2.2.1. Phenological Monitoring
2.2.2. Biomass Sampling Protocol
- –
- 105 °C for 30 min (enzyme deactivation);
- –
- 75 °C to constant mass (±0.01 g precision).
2.2.3. Yield Determination
2.3. CSM-CROPGRO-Cotton Model
2.4. Sensitivity Analysis Design
3. Model Calibration and Optimization
3.1. Model Calibration and Uncertainty Quantification
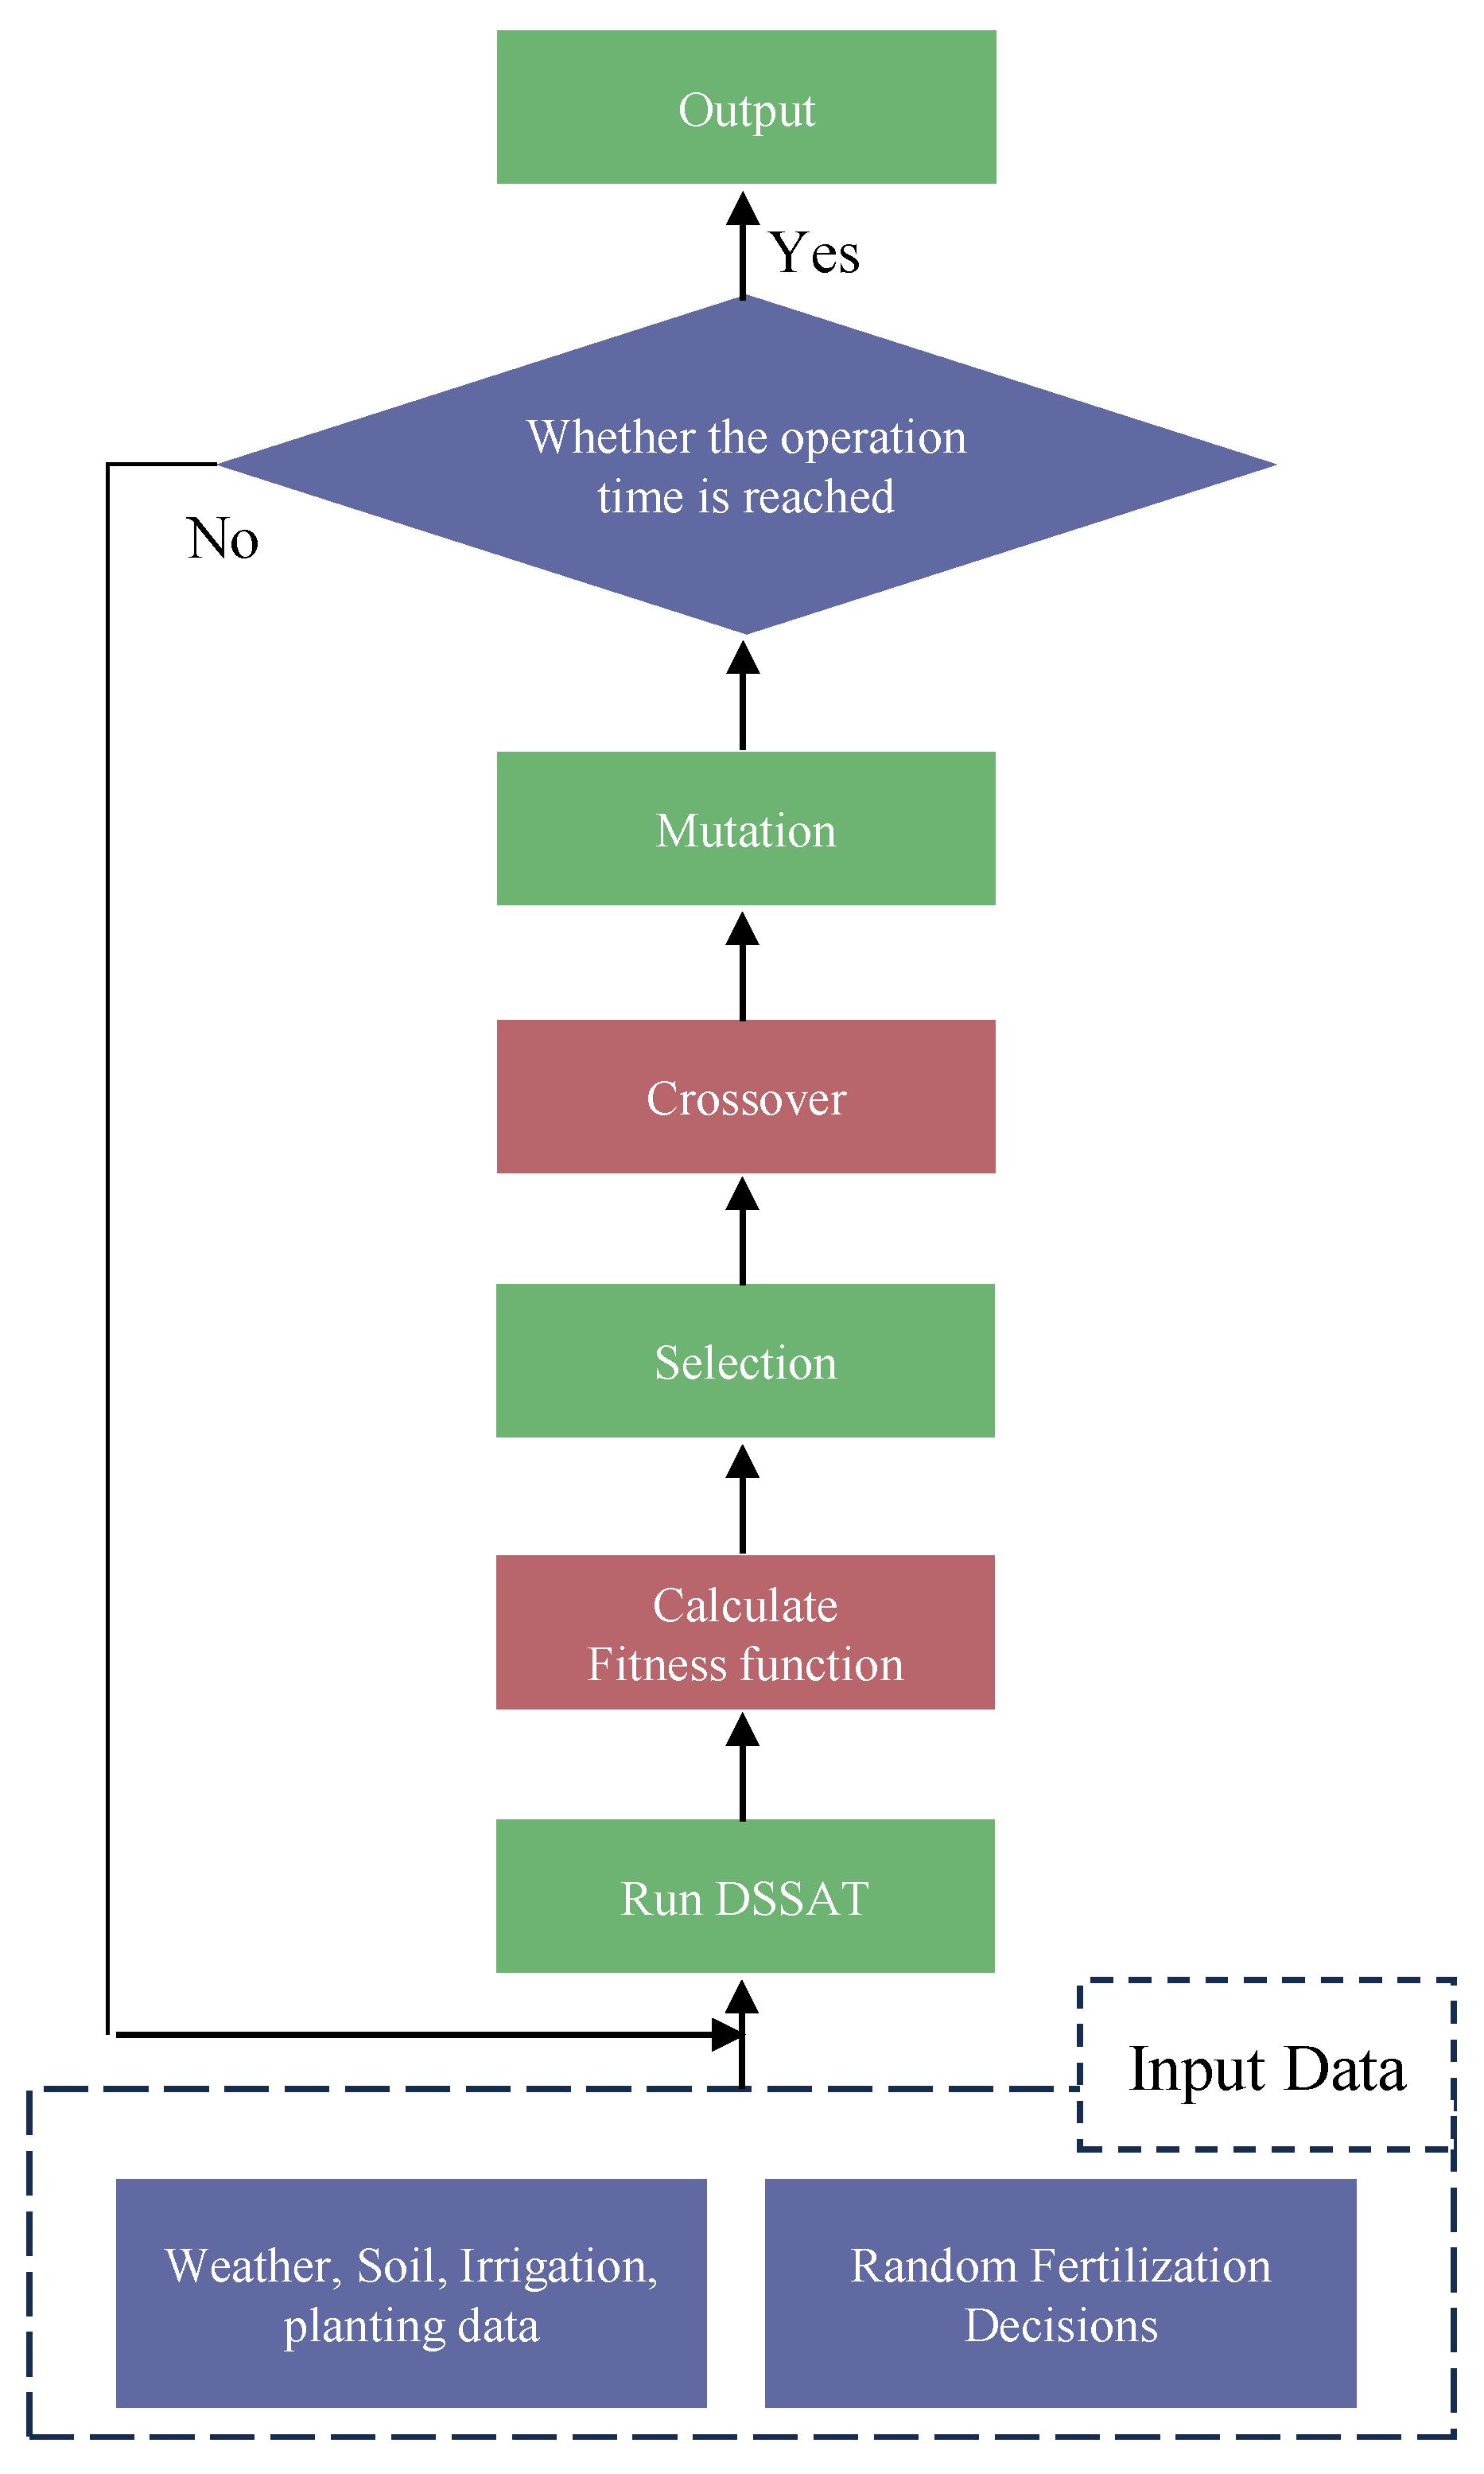
3.2. Genetic Algorithm Optimization Framework
3.2.1. Parameterization Strategy
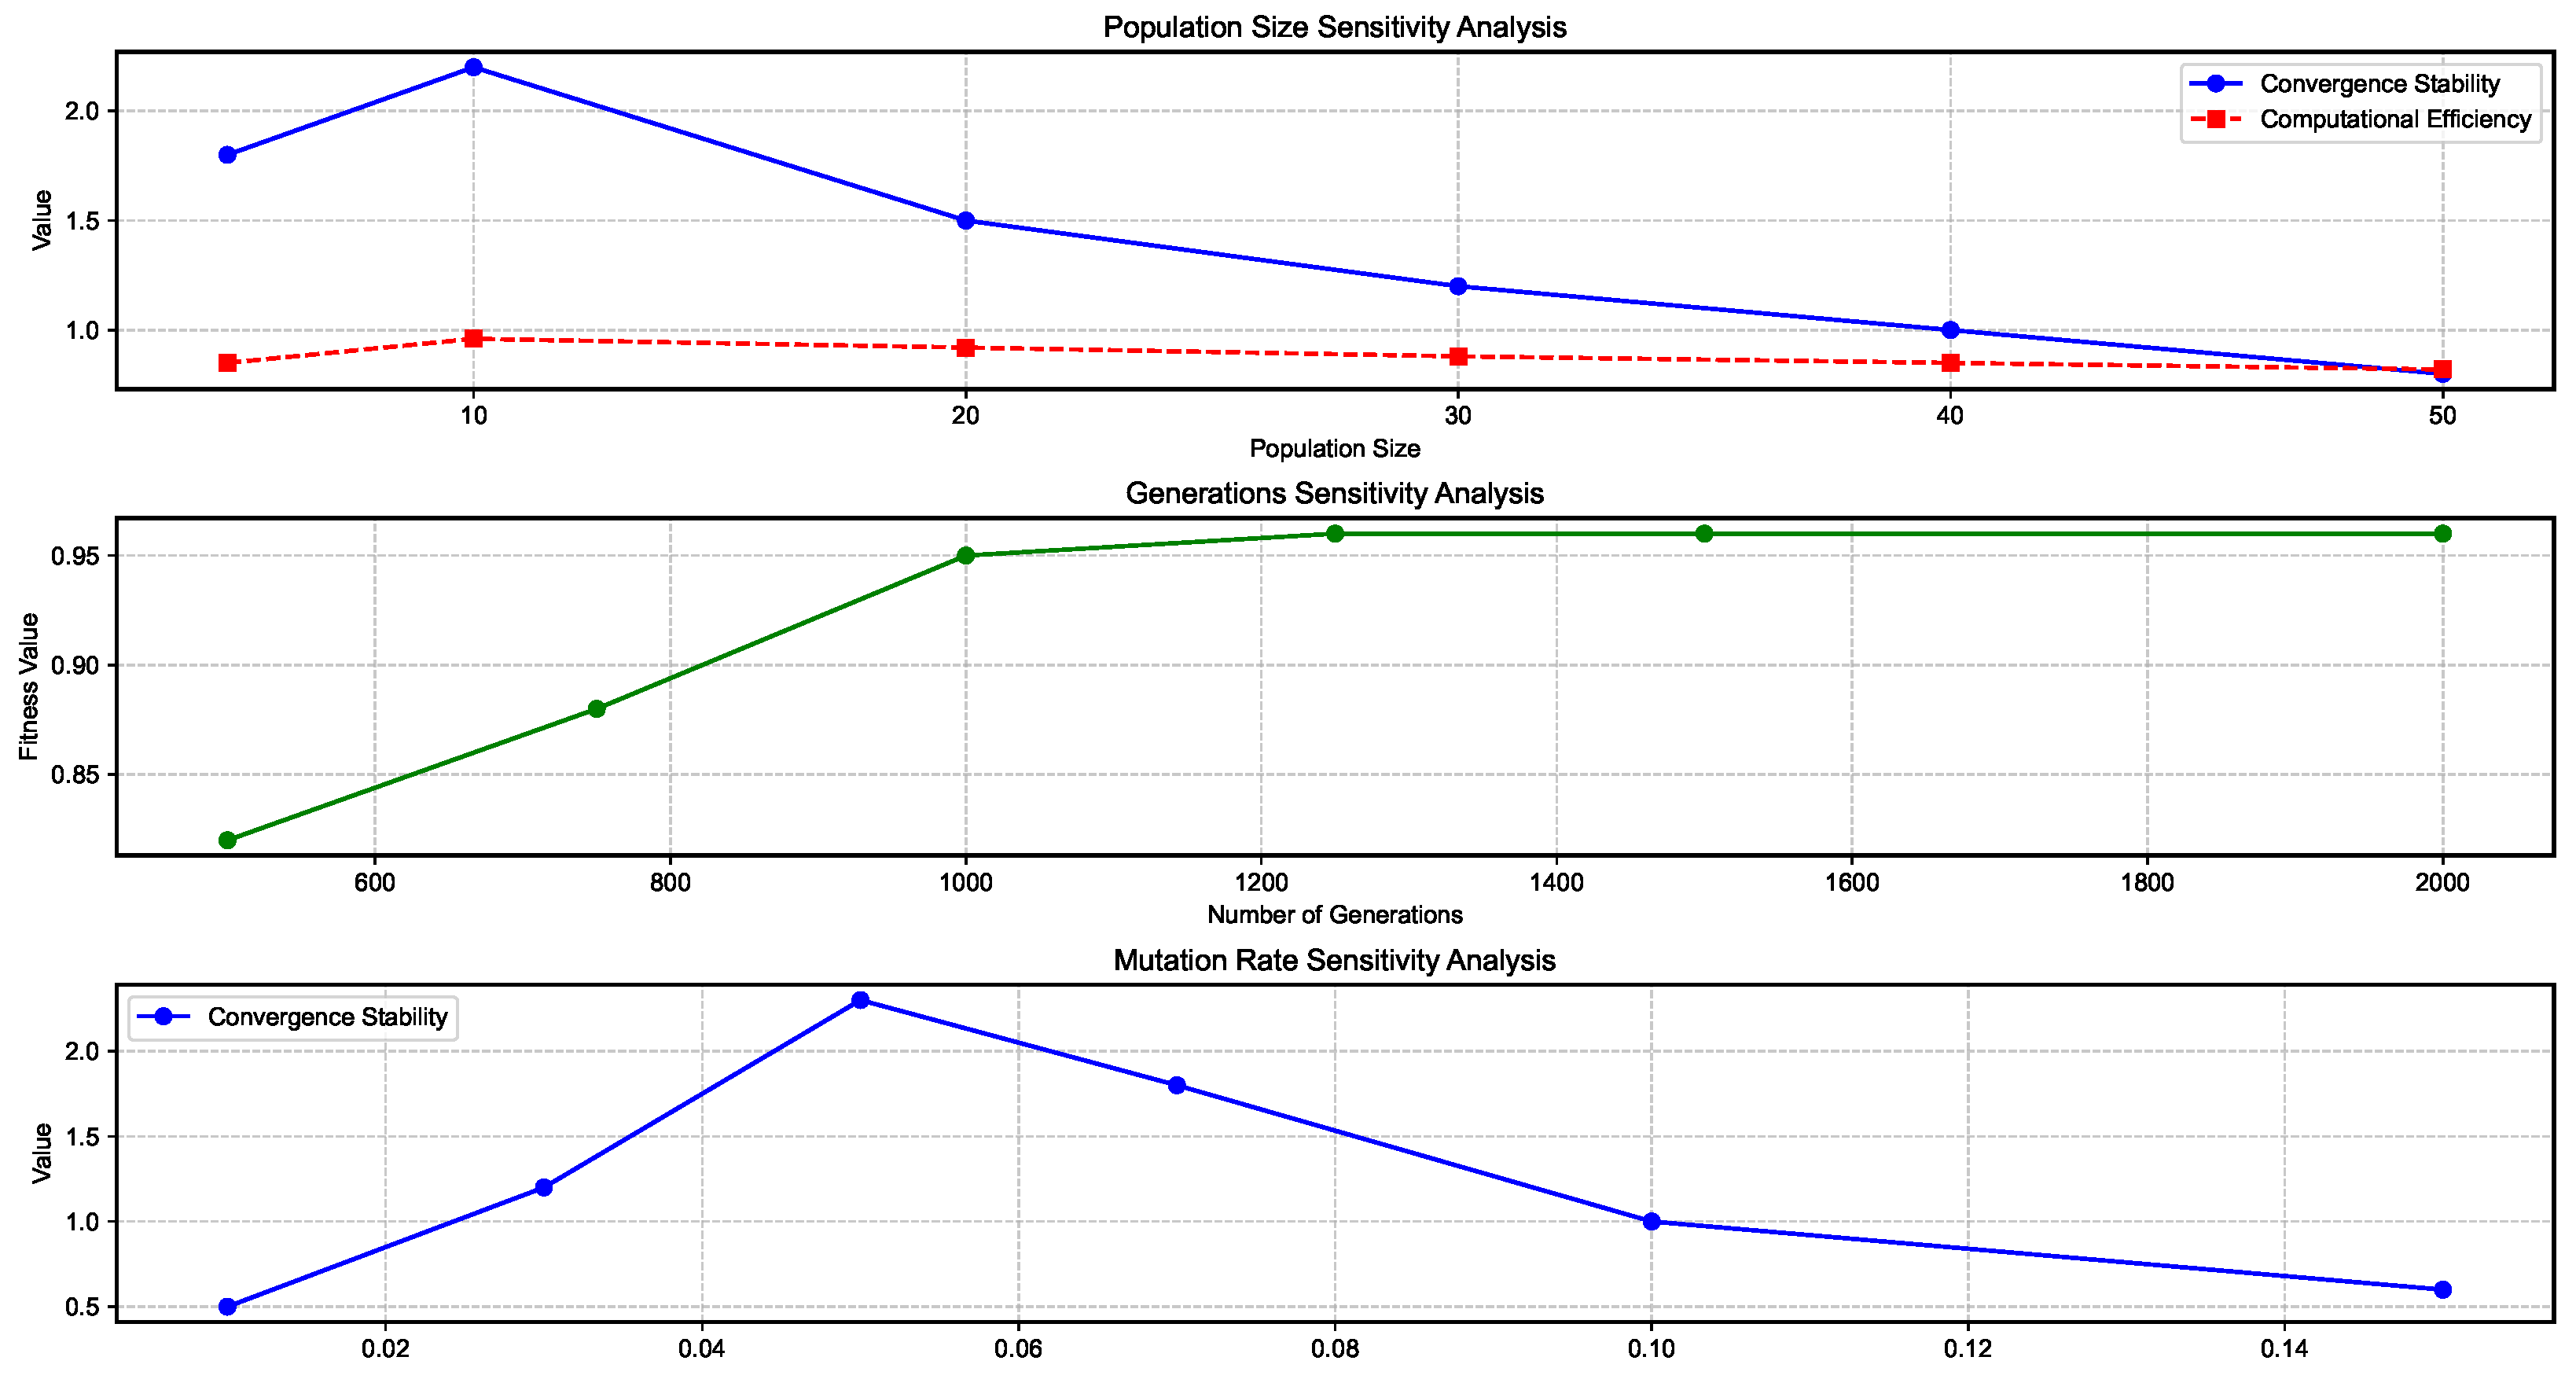
3.2.2. Parameter Sensitivity Analysis
3.2.3. Fitness Evaluation
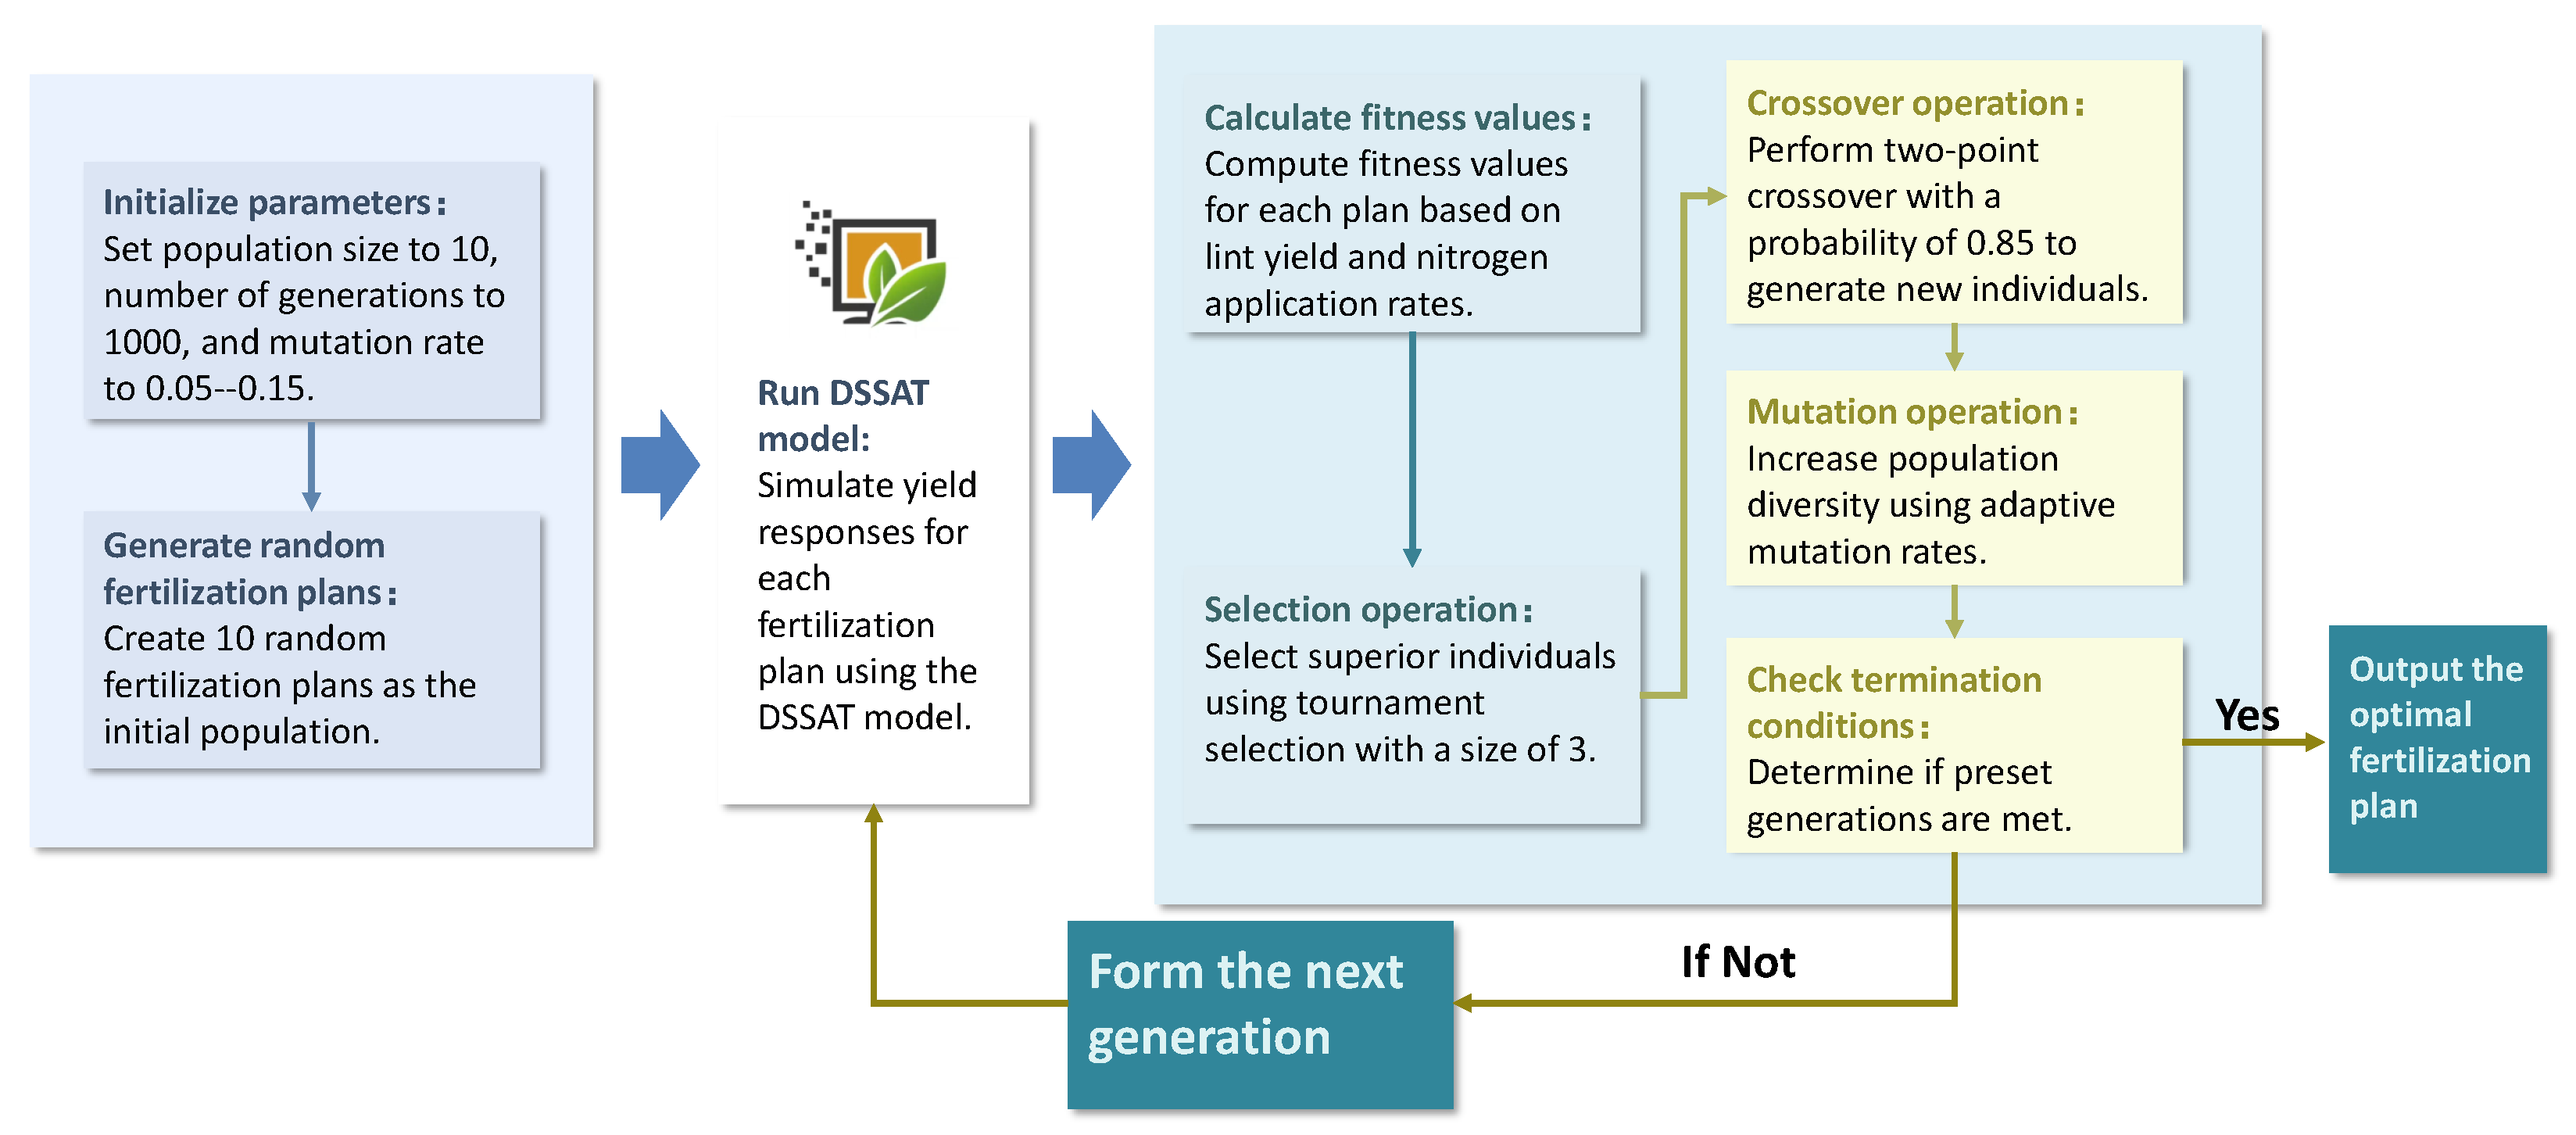
3.2.4. Evolutionary Operators
- Selection: Tournament selection (size = 3) outperformed roulette wheel approaches in maintaining population diversity (Shannon index > 1.8 vs. 1.2), particularly crucial given the high parameter correlation structure ( > 0.6 between adjacent stages).
- Crossover: Two-point crossover (probability = 0.85) preserves linked fertilization timing effects better than single-point operations, as quantified by linkage disequilibrium metrics ( > 0.7 vs. 0.4).
- Mutation: Adaptive mutation rates (0.05–0.15) based on generation progress prevent premature convergence, utilizing sigmoidal decay, where g is generation number.
3.2.5. Model Integration
3.2.6. Genetic Algorithm Framework
4. Results
4.1. Model Validation and Comparative Analysis
4.1.1. Physiological Process Representation Advantage
4.1.2. Limitations of Data-Driven Approaches
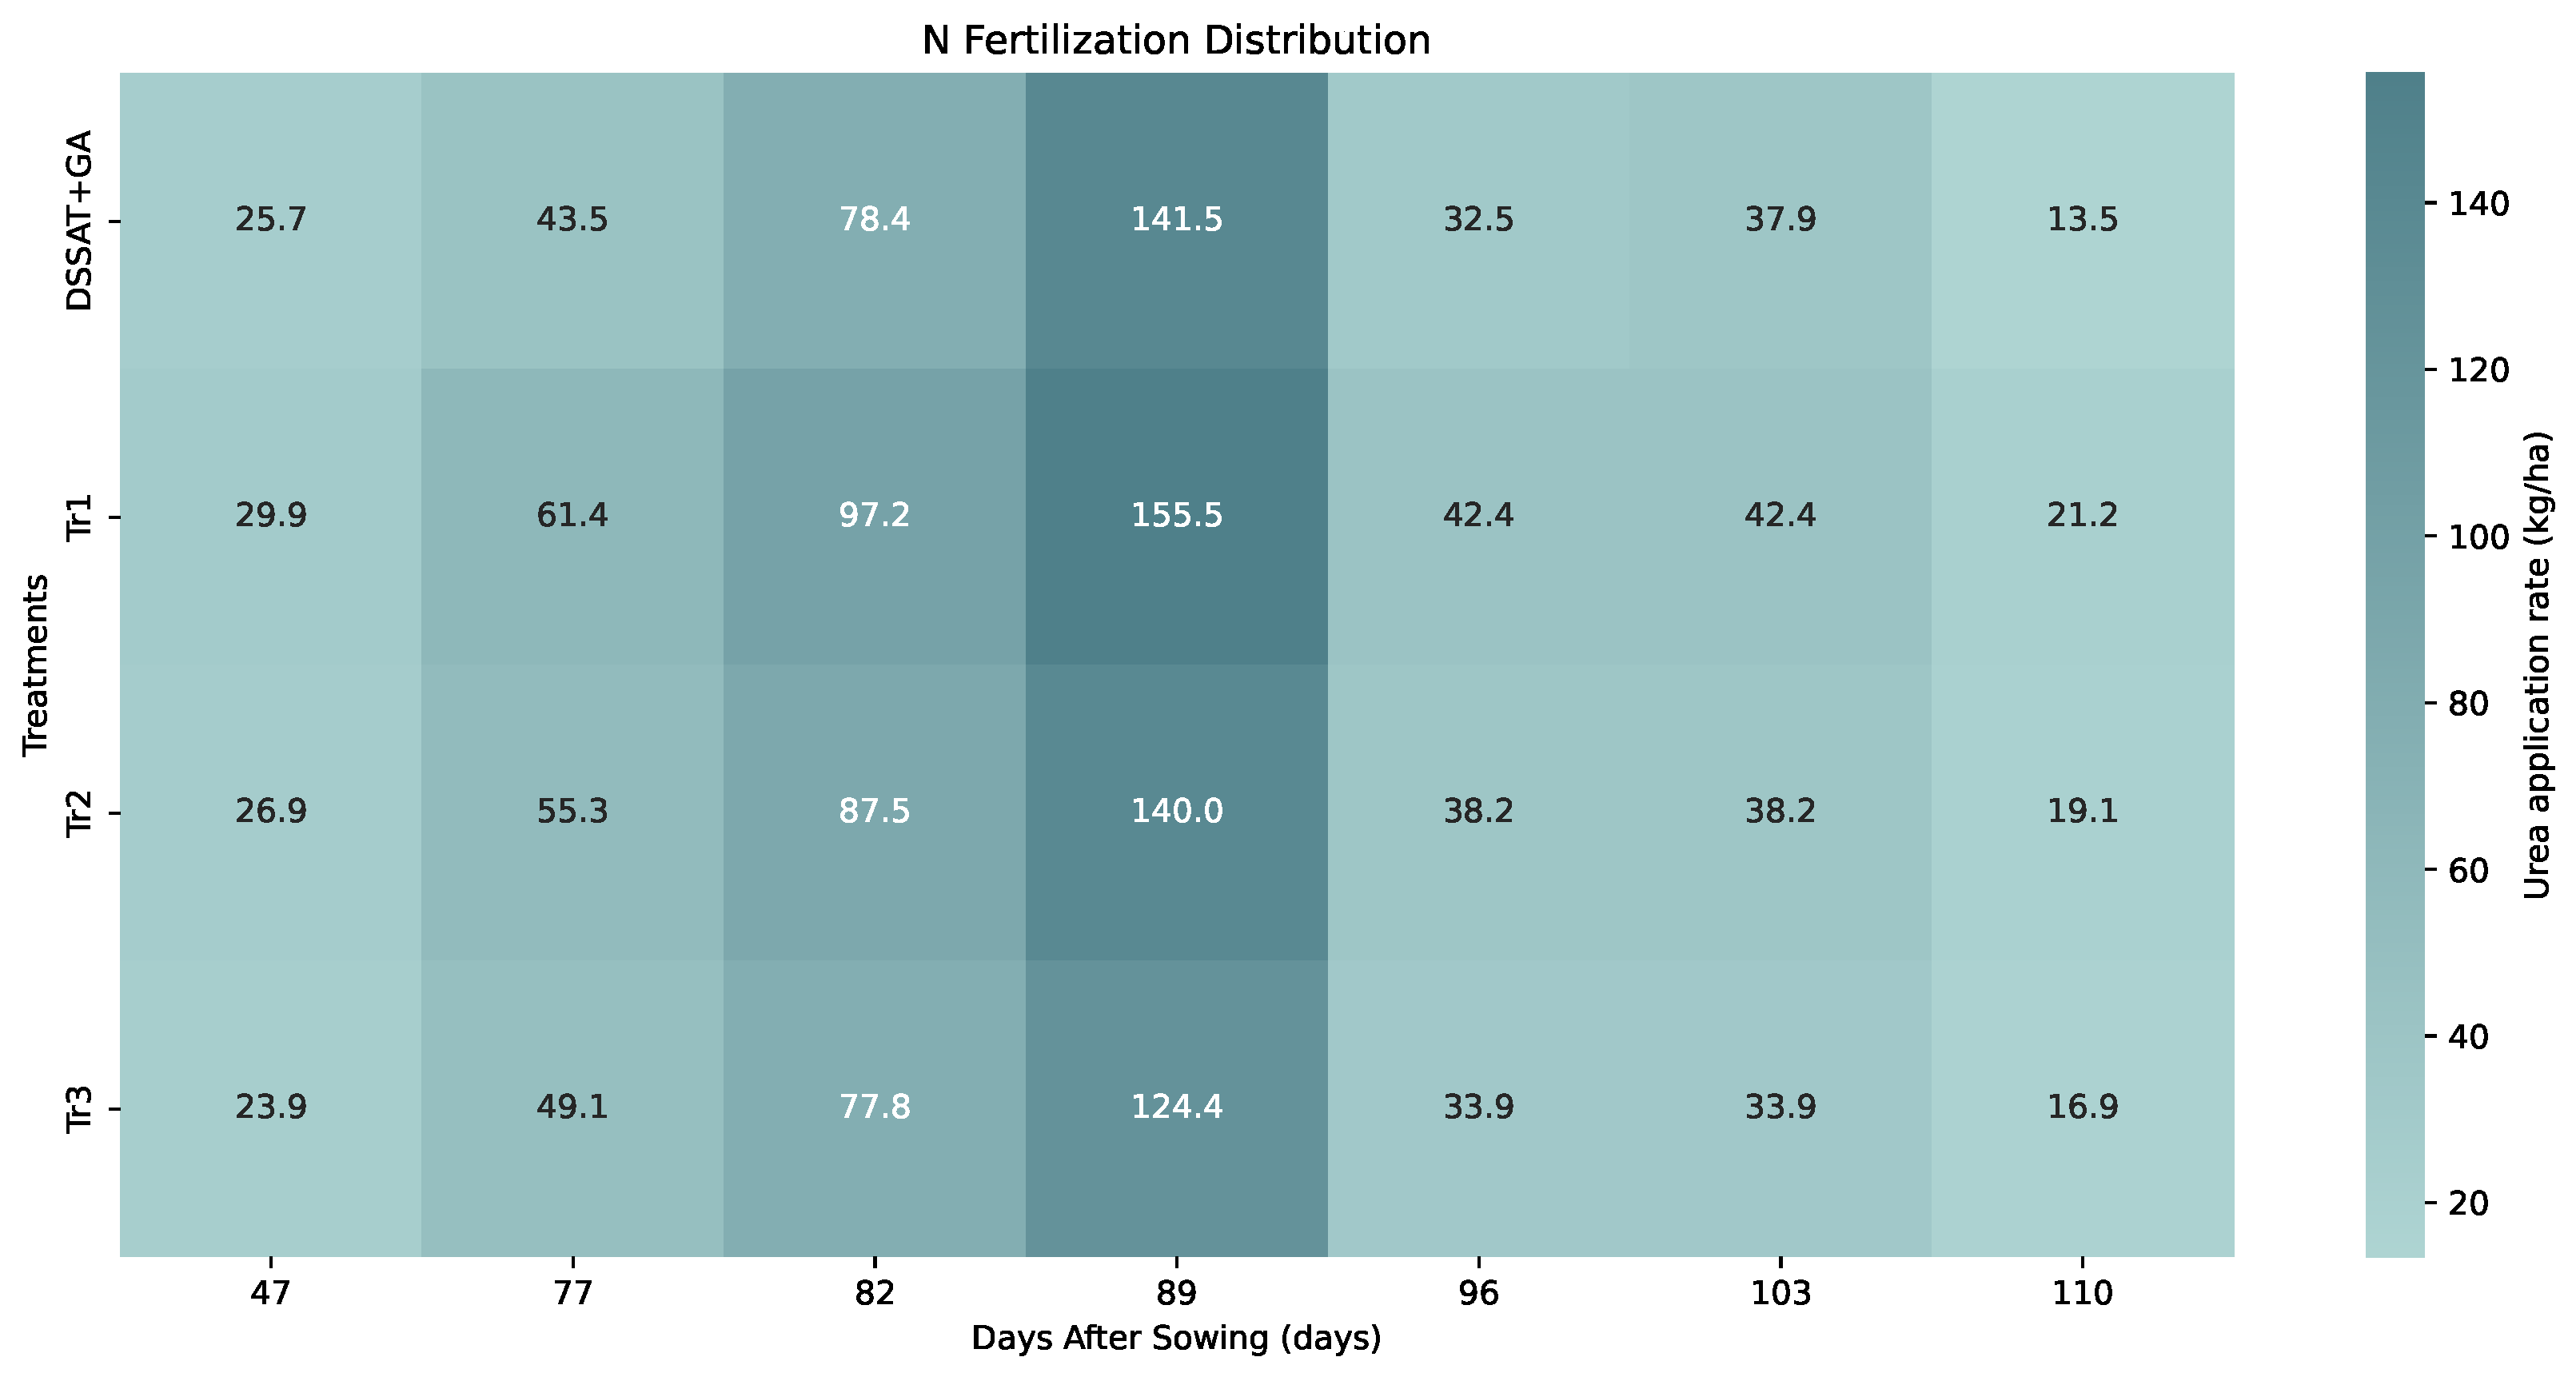
4.2. Comparison of Fertilization Decision Strategies
4.2.1. Comparison of Fertilization Strategy
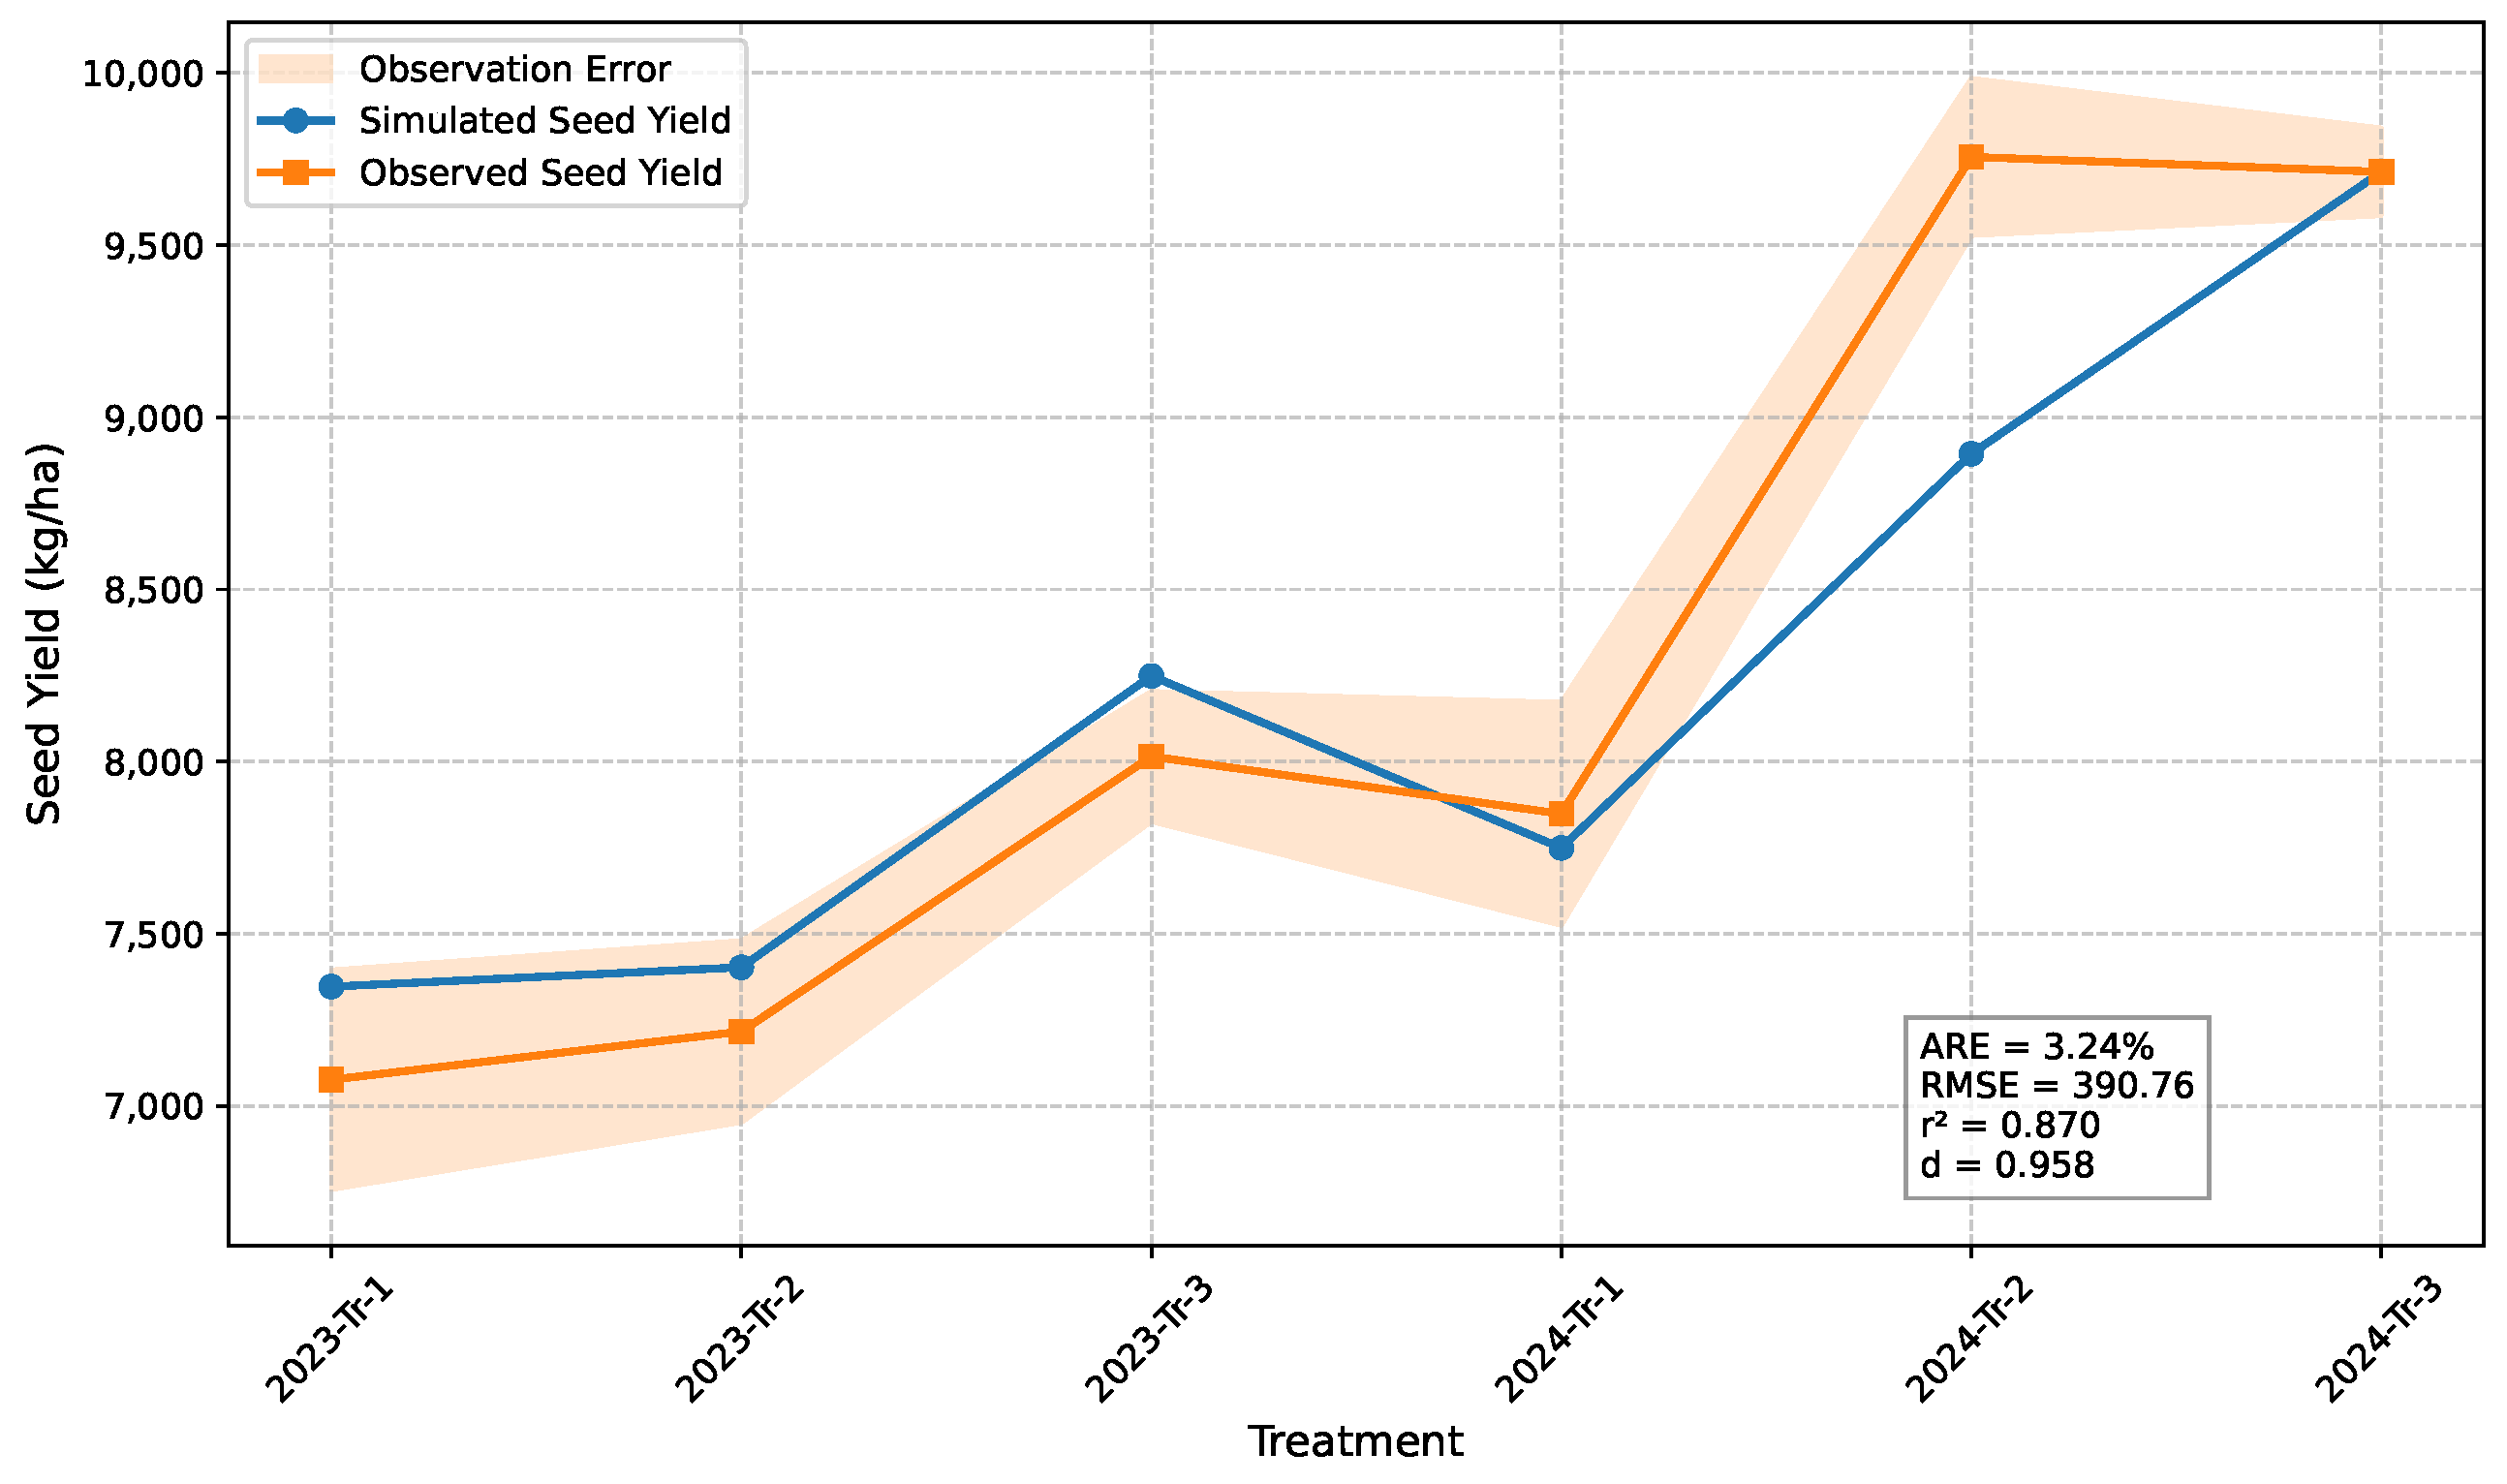
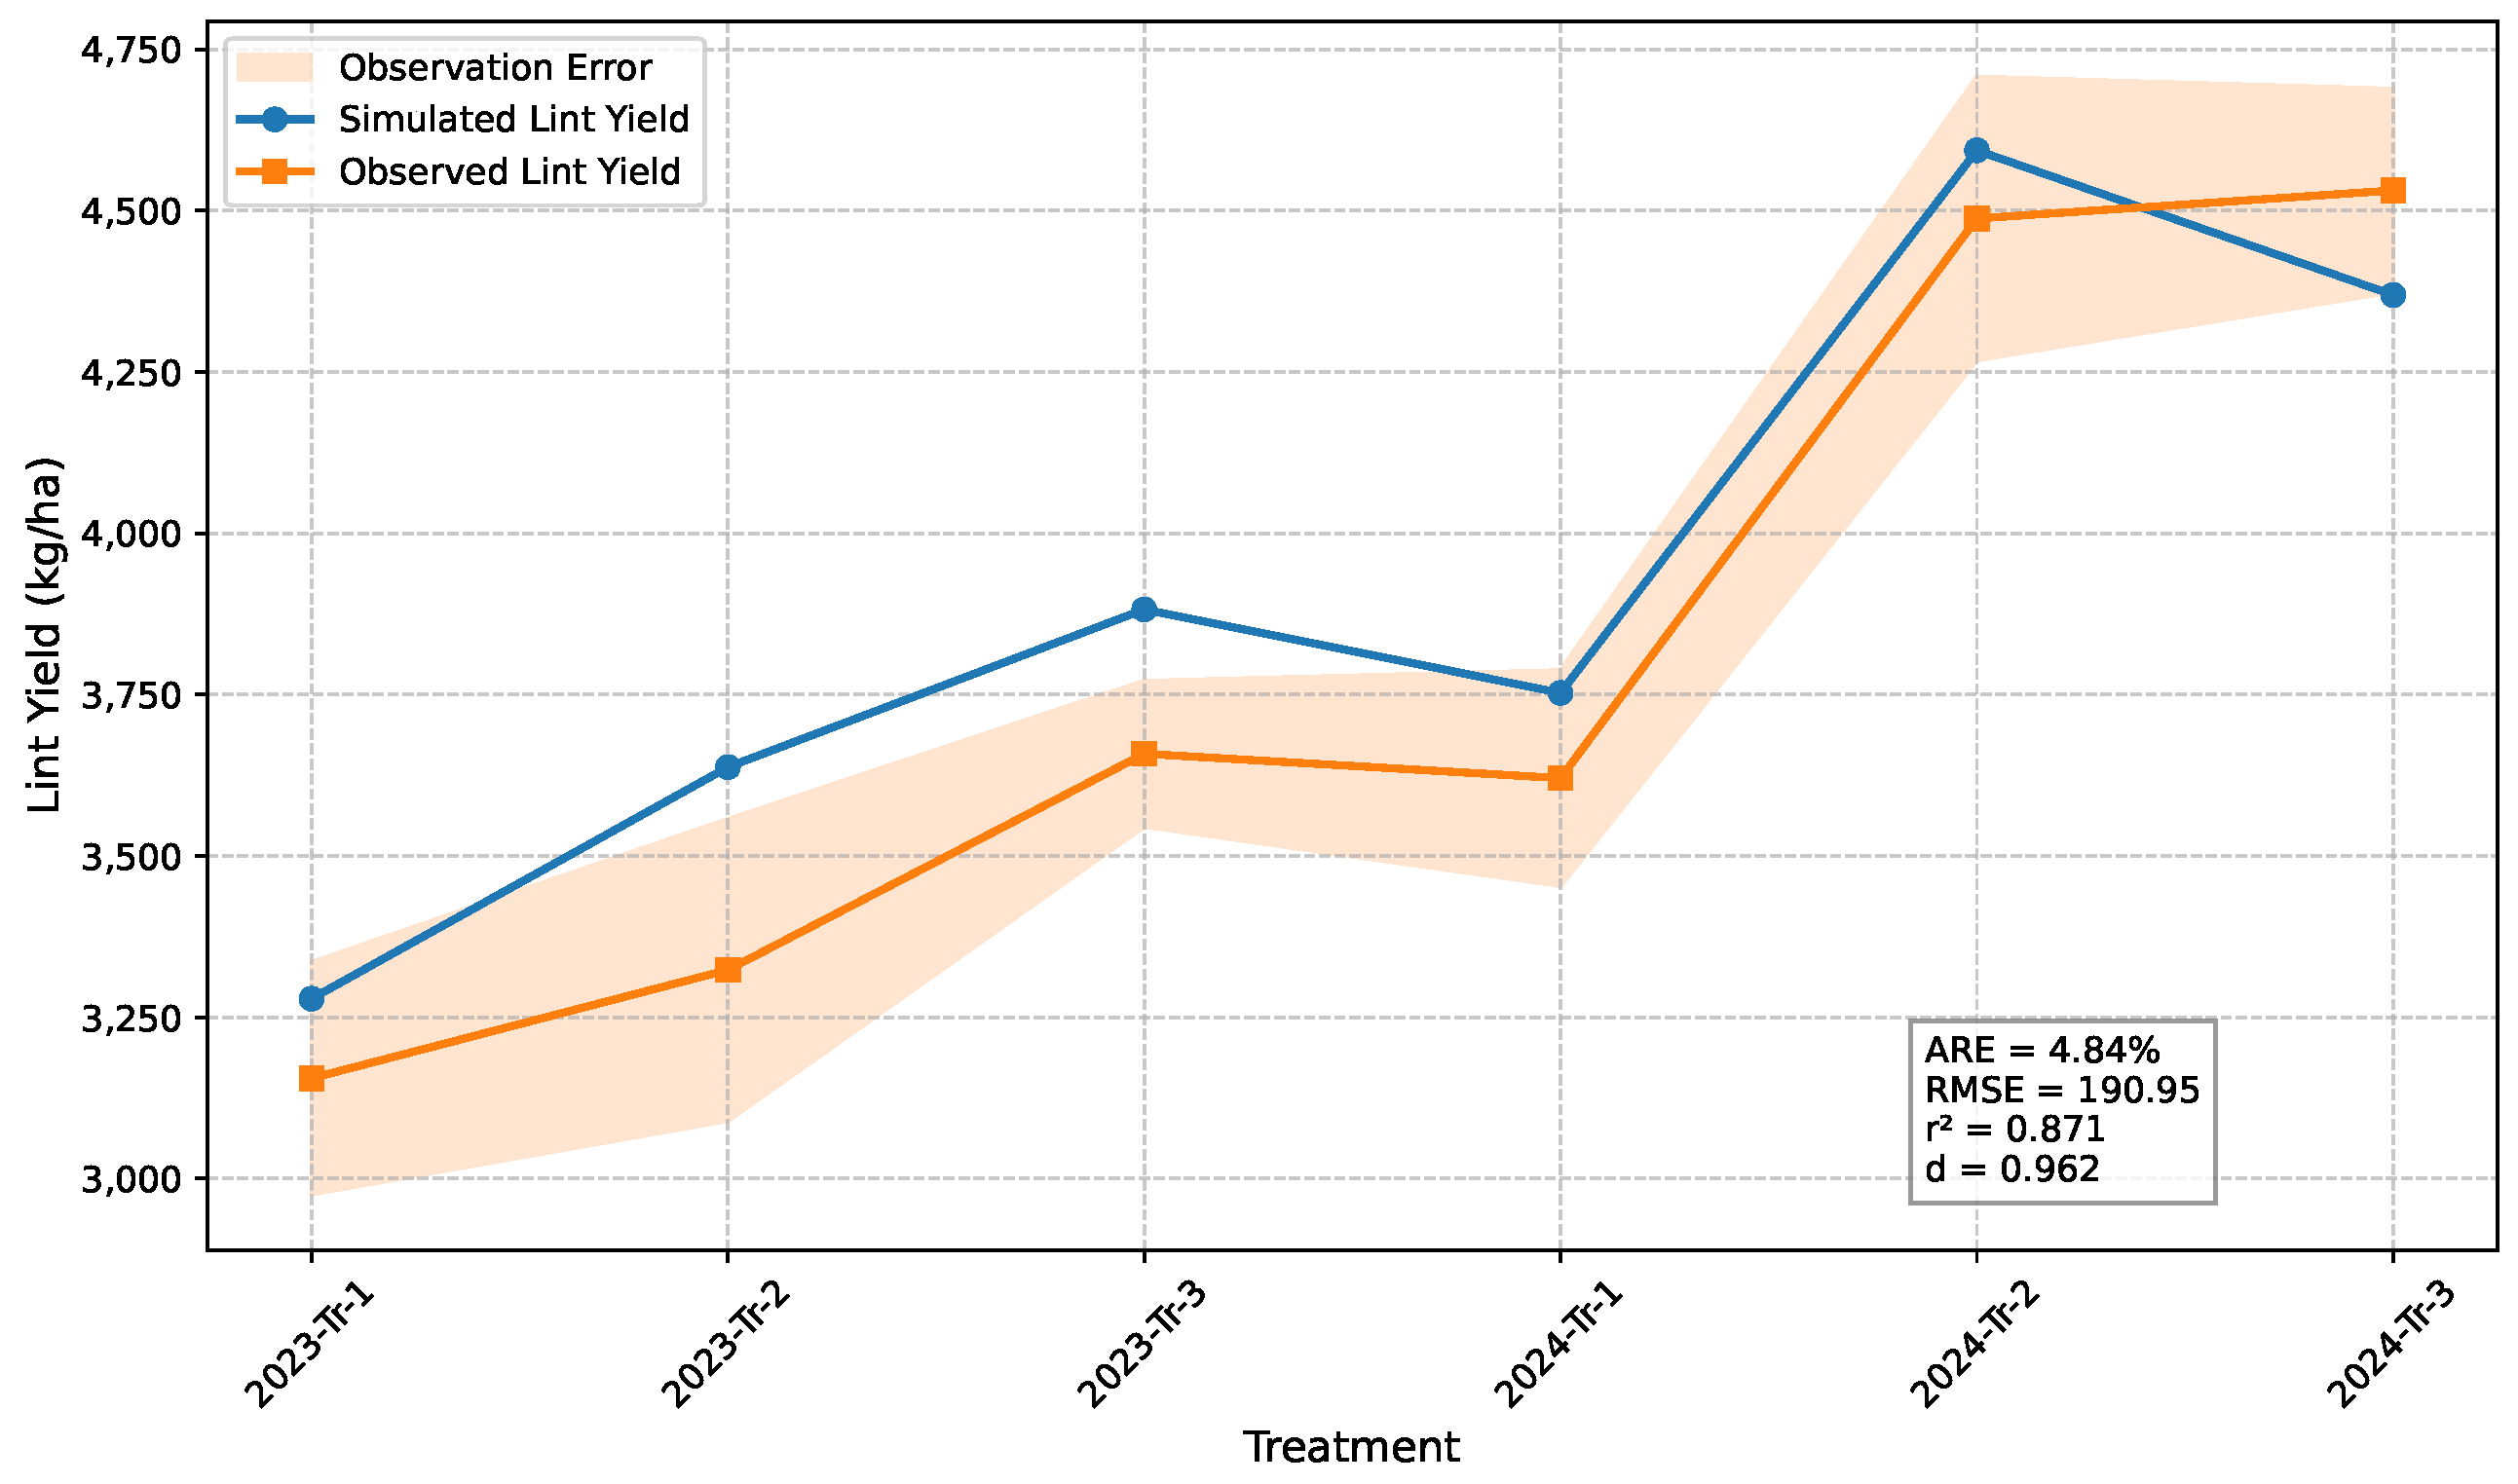
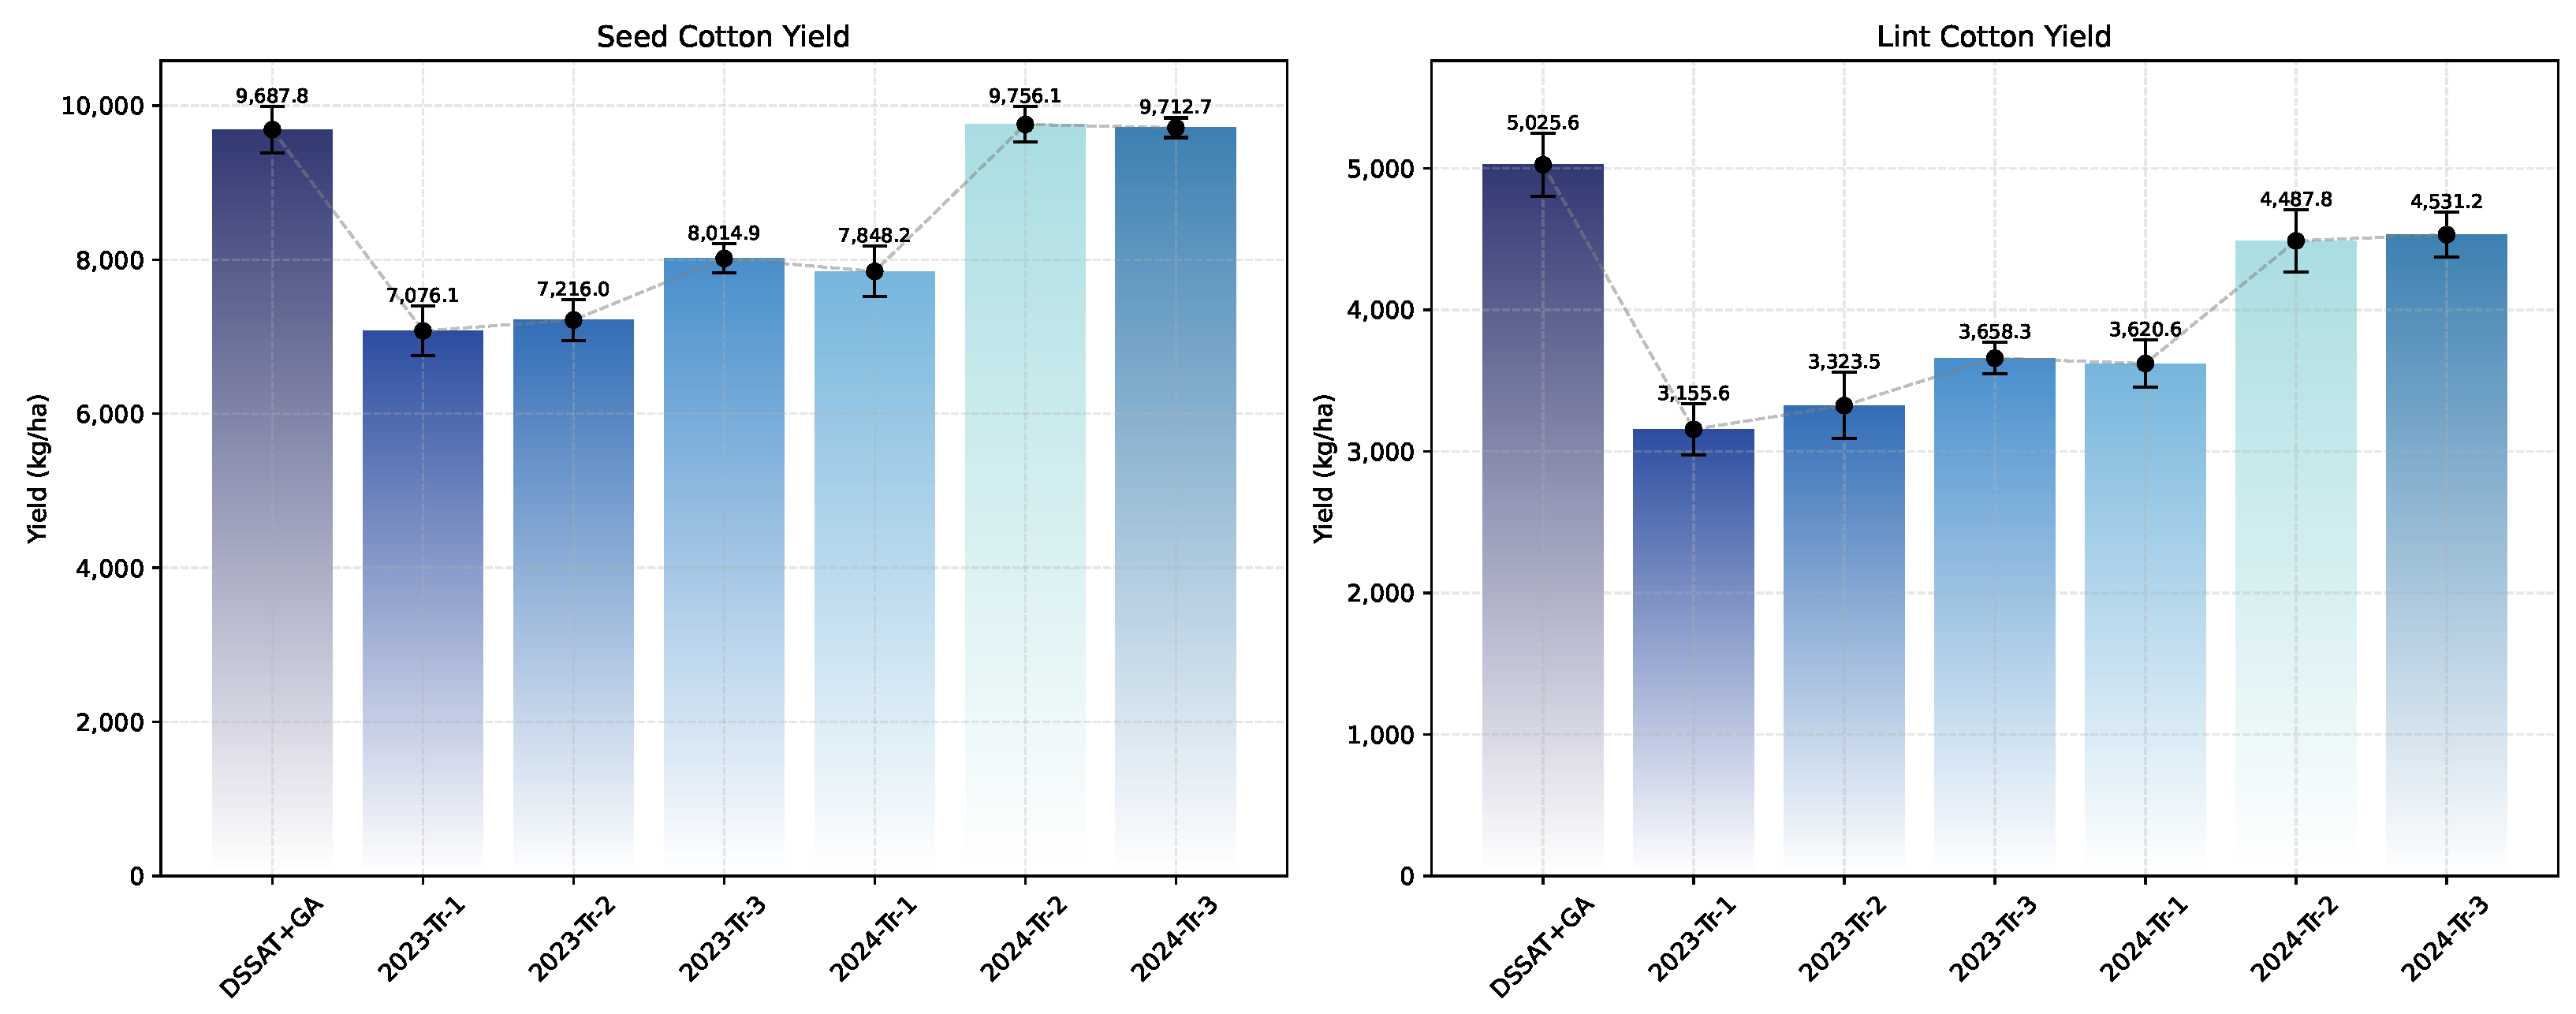
4.2.2. Yield Comparison
4.2.3. Benefit Comparison
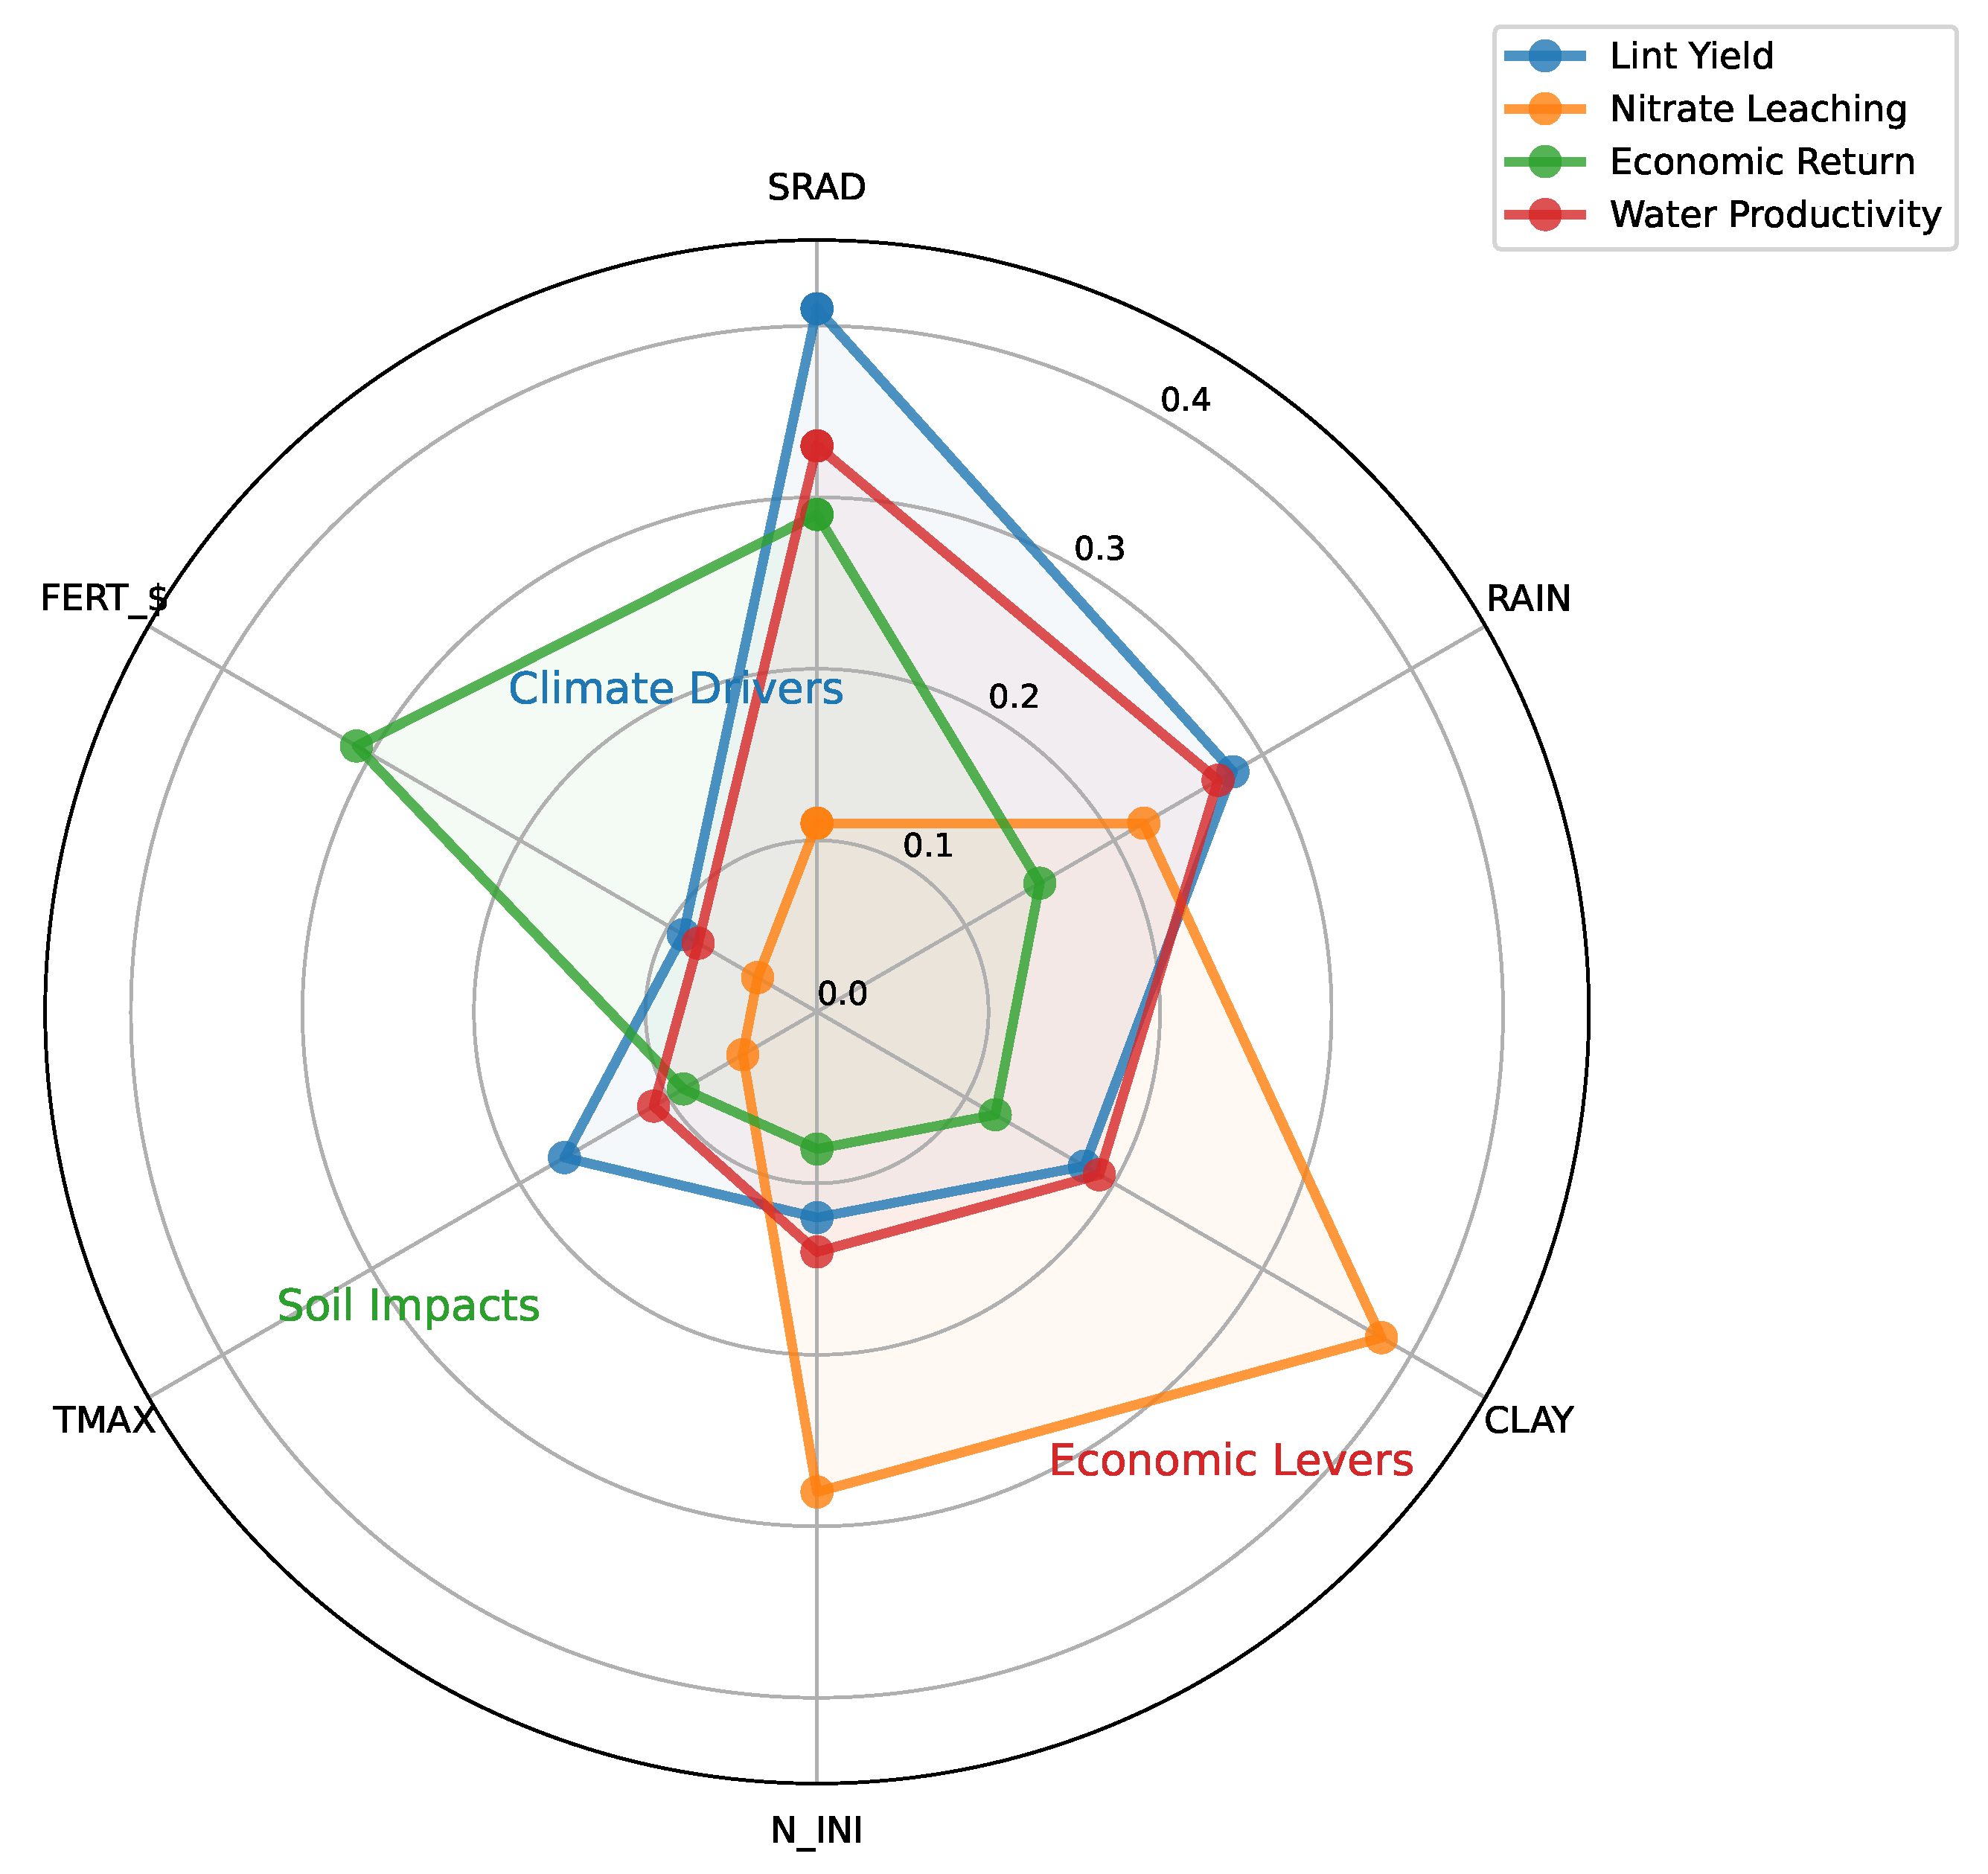
4.3. Sensitivity Analysis
4.4. Comparative Analysis with Proximal Policy Optimization (PPO)
4.5. Input Sensitivity and Decision Robustness
5. Discussion
5.1. Key Findings of This Study
5.2. Implications for Large-Scale Implementation
5.3. Soil Variability and Broader Applicability
5.4. Limitations of This Study and Future Work
5.4.1. Limitations
5.4.2. Future Work
6. Conclusions
Author Contributions
Funding
Data Availability Statement
Acknowledgments
Conflicts of Interest
References
- Amrouk, E.; Palmeri, F. Recent Trends and Prospects in the World Cotton Market and Policy Developments; FAO: Rome, Italy, 2021. [Google Scholar]
- Jiang, Y.; Liu, D.y.; Li, J.m.; Wang, P. Soil quality assessment of continuous cropping cotton fields for different years in Manas river basin. Agric. Res. Arid. Areas 2021, 39, 186–193. [Google Scholar]
- Zhang, X.; Mlynaryk, N.; Japee, S.; Ungerleider, L. Multiple Objects of Attentional Selection in Human Visual Cortex. J. Vis. 2016, 16, 603. [Google Scholar] [CrossRef]
- Norse, D.; Ju, X. Environmental costs of China’s food security. Agric. Ecosyst. Environ. 2015, 209, 5–14. [Google Scholar] [CrossRef]
- Liu, A.; Li, Z.; Zhang, D.; Cui, Z.; Zhan, L.; Xu, S.; Zhang, Y.; Dai, J.; Li, W.; Nie, J. One-off basal application of nitrogen fertilizer increases the biological yield but not the economic yield of cotton in moderate fertility soil. Field Crop. Res. 2022, 288, 108702. [Google Scholar] [CrossRef]
- Malik, K. Interactive Effect of Spacing and Nitrogen Fertilization on Yield Parameters and Economics of Cotton (Gossypium Hirsutum L.) Var. H-1098(i). Int. J. Pure App. Biosci. 2021, 9, 75–82. [Google Scholar] [CrossRef]
- Zhao, C.; Liu, B.; Xiao, L.; Hoogenboom, G.; Boote, K.J.; Kassie, B.T.; Pavan, W.; Shelia, V.; Kim, K.S.; Hernandez-Ochoa, I.M.; et al. A simple crop model. Eur. J. Agron. 2019, 104, 97–106. [Google Scholar] [CrossRef]
- Bassu, S.; Brisson, N.; Durand, J.L.; Boote, K.; Lizaso, J.; Jones, J.W.; Rosenzweig, C.; Ruane, A.C.; Adam, M.; Baron, C.; et al. How do various maize crop models vary in their responses to climate change. Agric. For. Meteorol. 2014, 191, 116–135. [Google Scholar] [CrossRef]
- Asseng, S.; Ewert, F.; Rosenzweig, C.; Jones, J.W.; Hatfield, J.L.; Ruane, A.C.; Boote, K.J.; Thorburn, P.J.; Rotter, R.P.; Cammarano, D.; et al. Uncertainty in simulating wheat yields under climate change. Nat. Clim. Chang. 2013, 3, 827–832. [Google Scholar] [CrossRef]
- Jones, J.W.; Antle, J.M.; Basso, B.; Boote, K.J.; Conant, R.T.; Foster, I.; Godfray, H.C.J.; Herrero, M.; Howitt, R.E.; Janssen, S.; et al. Brief history of agricultural systems modeling. Agric. Syst. 2017, 155, 240–254. [Google Scholar] [CrossRef]
- Du, J.; Zhang, N.; Gong, K.; Du, M.; Yang, Y.; Wang, X. Optimization of cotton irrigation schedule under mulch drip irrigation in southern Xinjiang based on DSSAT model. Chin. J. Ecol. 2021, 40, 3760–3768. [Google Scholar]
- Wang, H.; Cheng, M.; Liao, Z.; Guo, J.; Zhang, F.; Fan, J.; Feng, H.; Yang, Q.; Wu, L.; Wang, X. Performance evaluation of AquaCrop and DSSAT-SUBSTOR-Potato models in simulating potato growth, yield and water productivity under various drip fertigation regimes. Agric. Water Manag. 2023, 276, 108076. [Google Scholar] [CrossRef]
- Hong, T.; Xin, L.; Ze, Z.; Caixia, Y.; Lulu, M.; Wei, S. Influence of Climate Change on Cotton Production Potential Based on DSSAT Model Simulation. Cotton Sci. 2020, 32, 113–120. [Google Scholar] [CrossRef]
- Pourebrahimi Foumani, M.; Yin, X.; Fu, J.S.; Yang, C.E.; Adotey, R. Impact of future climate from different general circulation models on cotton yield predictions in north Cotton Belt through crop simulation with DSSAT. Field Crop. Res. 2025, 322, 109719. [Google Scholar] [CrossRef]
- Bai, Y.; Gao, J. Optimization of the nitrogen fertilizer schedule of maize under drip irrigation in Jilin, China, based on DSSAT and GA. Agric. Water Manag. 2021, 244, 106555. [Google Scholar] [CrossRef]
- Gupta, R.; Bhattarai, R.; Coppess, J.W.; Jeong, H.; Ruffatti, M.; Armstrong, S.D. Modeling the impact of winter cover crop on tile drainage and nitrate loss using DSSAT model. Agric. Water Manag. 2022, 272, 107862. [Google Scholar] [CrossRef]
- Chen, Y.; Yu, Z.; Han, Z.; Sun, W.; He, L. A Decision-Making System for Cotton Irrigation Based on Reinforcement Learning Strategy. Agronomy 2024, 14, 11. [Google Scholar] [CrossRef]
- Wang, Y.; Jiang, K.; Shen, H.; Wang, N.; Liu, R.; Wu, J.; Ma, X. Decision-making method for maize irrigation in supplementary irrigation areas based on the DSSAT model and a genetic algorithm. Agric. Water Manag. 2023, 280, 108231. [Google Scholar] [CrossRef]
- Babel, M.S.; Deb, P.; Soni, P. Performance evaluation of AquaCrop and DSSAT-CERES for maize under different irrigation and manure application rates in the Himalayan region of India. Agric. Res. 2019, 8, 207–217. [Google Scholar] [CrossRef]
- Ge, H.; Ma, F.; Li, Z.; Du, C. Estimating rice yield by assimilating UAV-derived plant nitrogen concentration into the DSSAT model: Evaluation at different assimilation time windows. Field Crop. Res. 2022, 288, 108705. [Google Scholar] [CrossRef]
- Wang, M.; Zhang, L.; Lin, Y.; Zhao, J.; Qin, Y.; Li, Q.; Liu, H.; Sun, B.; Wang, L. Analysis and Closing of the High-Production-Maize Yield Gap in the Semi-Arid Area of Northeast China. Agronomy 2024, 14, 30. [Google Scholar] [CrossRef]
- Wang, L.; Lin, M.; Han, Z.; Han, L.; He, L.; Sun, W. Simulating the Effects of Drought Stress Timing and the Amount Irrigation on Cotton Yield Using the CSM-CROPGRO-Cotton Model. Agronomy 2024, 14, 14. [Google Scholar] [CrossRef]
- Beck, H.; Zimmermann, N.; McVicar, T.; Vergopolan, N.; Berg, A.; Wood, E.F. Present and future Köppen-Geiger climate classification maps at 1-km resolution. Sci. Data 2018, 5, 180214. [Google Scholar] [CrossRef] [PubMed]
- Belaqziz, S.; Khabba, S.; Er-Raki, S.; Jarlan, L.; Le Page, M.; Kharrou, M.; Adnani, M.E.; Chehbouni, A. A new irrigation priority index based on remote sensing data for assessing the networks irrigation scheduling. Agric. Water Manag. 2013, 119, 1–9. [Google Scholar] [CrossRef]
- Allen, R.G. Crop Evapotranspiration-Guidelines for Computing Crop Water Requirements; FAO Irrigation and Drainage Paper (FAO); FAO: Rome, Italy, 1998; Volume 56. [Google Scholar]
- Su, L.; Wang, Q.; Bai, Y. An analysis of yearly trends in growing degree days and the relationship between growing degree day values and reference evapotranspiration in Turpan area, China. Theor. Appl. Climatol. 2013, 113, 711–724. [Google Scholar] [CrossRef]
- Mcconnell, J.S.; Baker, W.H.; Miller, D.M.; Frizzell, B.S.; Varvil, J.J. Nitrogen Fertilization of Cotton Cultivars of Differing Maturity. Agron. J. 1993, 85, 1151–1156. [Google Scholar]
- Hou, X.; Fan, J.; Zhang, F.; Hu, W.; Xiang, Y. Optimization of water and nitrogen management to improve seed cotton yield, water productivity and economic benefit of mulched drip-irrigated cotton in southern Xinjiang, China. Field Crop. Res. 2024, 308, 109301. [Google Scholar] [CrossRef]
- Zadoks, J.C.; Chang, T.T.; Konzak, C.F. A decimal code for the growth stages of cereals. Weed Res. 1974, 14, 415–421. [Google Scholar]
- Jones, J.; Hoogenboom, G.; Porter, C.; Boote, K.; Batchelor, W.; Hunt, L.; Wilkens, P.; Singh, U.; Gijsman, A.; Ritchie, J. The DSSAT cropping system model. Eur. J. Agron. 2003, 18, 235–265. [Google Scholar] [CrossRef]
- Hoogenboom, G.; Porter, C.H.; Boote, K.J.; Shelia, V.; Jones, J.W. The DSSAT Crop Modeling Ecosystem. In Advances in Crop Modelling for a Sustainable Agriculture; Burleigh Dodds Science Publishing: Sawston, UK, 2019. [Google Scholar]
- Sarkar, R. Decision Support Systems for Agrotechnology Transfer; Springer: Dutch, The Netherlands, 2012. [Google Scholar]
- Modala, N.R.; Ale, S.; Rajan, N.; Munster, C.; Barnes, E. Evaluation of the CSM-CROPGRO-Cotton model for the Texas rolling plains region and simulation of deficit irrigation strategies for increasing water use efficiency. Trans. Asabe 2015, 58, 685–696. [Google Scholar]
- Adhikari, P.; Gowda, P.H.; Marek, G.W.; Brauer, D.K.; Kisekka, I.; Northup, B.; Rocateli, A. Calibration and Validation of CSM-CROPGRO-Cotton Model Using Lysimeter Data in the Texas High Plains. J. Contemp. Water Res. Educ. 2017, 162, 61–78. [Google Scholar]
- Ma, R.; Cao, N.; Li, Y.; Hou, Y.; Wang, Y.; Zhang, Q.; Wang, T.; Cui, J.; Li, B.; Shi, W.; et al. Rational reduction of planting density and enhancement of NUE were effective methods to mitigate maize yield loss due to excessive rainfall. Eur. J. Agron. 2024, 160, 127326. [Google Scholar] [CrossRef]
- Meena, S.K.; Rakshit, A.; Meena, V.S. Effect of seed bio-priming and N doses under varied soil type on nitrogen use efficiency (NUE) of wheat (Triticum aestivum L.) under greenhouse conditions. Biocatal. Agric. Biotechnol. 2016, 6, 68–75. [Google Scholar] [CrossRef]
- Jiang, R.; He, W.; Zhou, W.; Hou, Y.; Yang, J.; He, P. Exploring management strategies to improve maize yield and nitrogen use efficiency in northeast China using the DNDC and DSSAT models. Comput. Electron. Agric. 2019, 166, 104988. [Google Scholar] [CrossRef]
- Moriasi, D.N.; Arnold, J.G.; Van Liew, M.W.; Bingner, R.L.; Harmel, R.D.; Veith, T.L. Model evaluation guidelines for systematic quantification of accuracy in watershed simulations. Trans. ASABE 2007, 50, 885–900. [Google Scholar] [CrossRef]
- Holland, J. Adaptation in Natural and Artificial Systems: An Introductory Analysis with Application to Biology, Control & Artificial Intelligence; University of Michigan: Ann Arbor, MI, USA, 1975. [Google Scholar]
- Cui, S.; Adamowski, J.F.; Albano, R.; Wu, M.; Cao, X. Optimal resource reallocation can achieve water conservation, emissions reduction, and improve irrigated agricultural systems. Agric. Syst. 2024, 221, 13. [Google Scholar] [CrossRef]
- Khosla, R.; Alley, M.M. Soil-Specific Nitrogen Management on Mid-Atlantic Coastal lain Soils. Better Crop. Plant Food 1999, LXXXIII, 6–7. [Google Scholar]
- Irmak, S.; Djaman, K.; Rudnick, D.R. Effect of full and limited irrigation amount and frequency on subsurface drip-irrigated maize evapotranspiration, yield, water use efficiency and yield response factors. Irrig. Sci. 2016, 34, 271–286. [Google Scholar] [CrossRef]
- Sui, J.; Wang, J.; Gong, S.; Xu, D.; Zhang, Y.; Qin, Q. Assessment of maize yield-increasing potential and optimum N level under mulched drip irrigation in the Northeast of China. Field Crop. Res. 2018, 215, 132–139. [Google Scholar]

| Parameter | Study Site (Daxiqu) | Regional Average a | Arid Threshold b |
|---|---|---|---|
| Mean annual temp. (°C) | 6.8 (∆3.2 †) | 7.1 ± 1.5 | < 8.0 |
| Sunshine duration (h/yr) | 2700 | 2850 ± 150 | >2500 |
| ≥10 °C growing degree days | 3450 | 3200 ± 200 | 2800–3500 |
| Precipitation (mm/yr) | 190 | 230 ± 40 | <250 |
| Aridity index c | 0.38 | 0.42 ± 0.05 | <0.5 |
| Diurnal ∆T (°C) | 15.7 | 12.3 ± 2.1 | >10.0 |
| Frost-free (days) | 175 ± 15 | 165 ± 20 | ≥150 |
| Parameter | Shallow Layer (10–20 cm) | Deep Layer (40–100 cm) |
|---|---|---|
| Particle size distribution | ||
| Gravel (>2 mm, %) | 7.0 | 8.0 |
| Sand (0.05–2 mm, %) | 31.0 | 31.0 |
| Silt (0.002–0.05 mm, %) | 46.0 | 43.0 |
| Clay (<0.002 mm, %) | 23.0 | 26.0 |
| Soil texture class a | Silty clay loam | Clay loam |
| Physical properties | ||
| Bulk density (Mg m−3) | 1.37 | 1.35 |
| Water holding capacity (cm3 cm−3) | 0.35 | 0.38 |
| Chemical properties | ||
| Organic carbon (%) | 0.46 | 0.27 |
| pH (1:5 H2O) | 7.41 | 7.76 |
| CEC b (cmol kg−1) | 11.0 | 13.0 |
| Clay-specific CEC (cmolc kg−1) | 44.0 | 56.0 |
| EC1:5 (dS m−1) | 11.2 | 24.0 |
| Exchangeable sodium percentage (%) | 15.0 | 16.0 |
| CaCO3 equivalent (%) | 3.2 | 4.8 |
| Treatment | Total Fertilizer | Seedling Stage | Bud Stage | Boll Stage 1 | Boll Stage 2 | Boll Stage 3 | Boll Stage 4 | Boll Stage 5 |
|---|---|---|---|---|---|---|---|---|
| T1_2023 | 253.35 | 16.84 | 34.57 | 54.72 | 87.56 | 23.87 | 23.87 | 11.92 |
| T2_2023 | 228.02 | 15.16 | 31.12 | 49.25 | 78.80 | 21.48 | 21.48 | 10.72 |
| T3_2023 | 202.68 | 13.47 | 27.66 | 43.78 | 70.05 | 19.09 | 19.09 | 9.53 |
| T1_2024 | 253.35 | 16.84 | 34.57 | 54.72 | 87.56 | 23.87 | 23.87 | 11.92 |
| T2_2024 | 228.02 | 15.16 | 31.12 | 49.25 | 78.80 | 21.48 | 21.48 | 10.72 |
| T3_2024 | 202.68 | 13.47 | 27.66 | 43.78 | 70.05 | 19.09 | 19.09 | 9.53 |
| Year | Treatment | Number of Plants | Simulated Seed Cotton Yield (kg/ha) | Observed Seed Cotton Yield (kg/ha) |
|---|---|---|---|---|
| 2023 | Tr1-1 | 18 | 6372.081 | |
| Tr1-2 | 20 | 7346.4 | 7725.227 | |
| Tr1-3 | 16 | 7130.919 | ||
| Tr2-1 | 17 | 6151.878 | ||
| Tr2-2 | 15 | 7402.5 | 7875.663 | |
| Tr2-3 | 17 | 7620.444 | ||
| Tr3-1 | 13 | 6915.882 | ||
| Tr3-2 | 21 | 8370.9 | 9142.245 | |
| Tr3-3 | 21 | 8688.594 | ||
| 2024 | Tr1-1 | 21 | 7739.8 | |
| Tr1-2 | 20 | 7769.2 | 8325.2 | |
| Tr1-3 | 16 | 7479.7 | ||
| Tr2-1 | 18 | 10,861.8 | ||
| Tr2-2 | 15 | 8893.7 | 9556.1 | |
| Tr2-3 | 21 | 8650.4 | ||
| Tr3-1 | 19 | 9886.2 | ||
| Tr3-2 | 19 | 9712.7 | 9951.2 | |
| Tr3-3 | 19 | 9300.8 |
| Year | Treatment | Number of Plants | Simulated Lint Yield (kg/ha) | Observed Lint Yield (kg/ha) |
|---|---|---|---|---|
| 2023 | Tr1-1 | 18 | 2897.523 | |
| Tr1-2 | 20 | 3155.6 | 3624.611 | |
| Tr1-3 | 16 | 3314.385 | ||
| Tr2-1 | 17 | 2804.882 | ||
| Tr2-2 | 15 | 3137.7 | 3628.184 | |
| Tr2-3 | 17 | 3537.326 | ||
| Tr3-1 | 13 | 3156.506 | ||
| Tr3-2 | 21 | 3658.4 | 4356.539 | |
| Tr3-3 | 21 | 4133.004 | ||
| 2024 | Tr1-1 | 21 | 3642.3 | |
| Tr1-2 | 20 | 3594.2 | 3837.4 | |
| Tr1-3 | 16 | 3382.1 | ||
| Tr2-1 | 18 | 4943.1 | ||
| Tr2-2 | 15 | 4148.6 | 4422.8 | |
| Tr2-3 | 21 | 4097.6 | ||
| Tr3-1 | 19 | 4617.9 | ||
| Tr3-2 | 19 | 4629.4 | 4682.9 | |
| Tr3-3 | 19 | 4292.7 |
| Stage | T1 | T2 | T3 | T4 | T5 | T6 | T7 |
|---|---|---|---|---|---|---|---|
| DAS | 47 | 77 | 82 | 89 | 96 | 103 | 110 |
| Range (kg/ha) | 10–900 | ||||||
| Model | RMSE (kg/ha) | R2 |
|---|---|---|
| DSSAT | 190.95 | 0.871 |
| BP | 519.57 | −0.606 |
| XGBoost | 465.02 | −1.637 |
| Random Forest | 409.35 | −4.549 |
| KNN | 371.04 | −0.052 |
| Treatment | Seed Cotton (kg ha−1) | Lint Cotton (kg ha−1) | Fiber Quality (Unitless) |
|---|---|---|---|
| DSSAT + GA | 9687.8 ± 320 a | 5025.6 ± 210 *** | 0.51 ± 0.03 ** |
| 2023-Tr-1 | 7076.08 ± 285 b | 3155.55 ± 180 c | 0.45 ± 0.02 |
| 2023-Tr-2 | 7215.99 ± 310 b | 3323.46 ± 195 bc | 0.46 ± 0.02 |
| 2023-Tr-3 | 8014.9 ± 335 ab | 3658.35 ± 205 b | 0.46 ± 0.03 |
| 2024-Tr-1 | 7848.2 ± 305 ab | 3620.59 ± 190 b | 0.46 ± 0.02 |
| 2024-Tr-2 | 9756.09 ± 345 a | 4487.8 ± 225 a | 0.46 ± 0.03 |
| 2024-Tr-3 | 9712.74 ± 330 a | 4531.17 ± 215 a | 0.47 ± 0.02 |
| Metric | DSSAT + GA | Tr1 | Tr2 | Tr3 |
|---|---|---|---|---|
| Urea application | 372.83 ± 18.7 a | 450 ± 22.5 b | 405 ± 20.3 ab | 360 ± 17.9 a |
| NUE | 13.48 ± 0.62 ** | 8.05 ± 0.45 | 11.08 ± 0.53 * | 12.59 ± 0.58 |
| Scenario | Method | Net Profit | Absolute Net Profit Change (%) | Relative Net Profit Change (%) |
|---|---|---|---|---|
| Baseline | T3 | 9960.5091 | 0 | 0 |
| Baseline | DSSAT + GA | 11,057.956 | 11.02 | 11.02 |
| N cost +20% | T3 | 9931.7091 | −0.29 | 0 |
| N cost +20% | DSSAT + GA | 11,028.1296 | 10.72 | 11.04 |
| N cost −20% | T3 | 9989.3091 | 0.29 | 0 |
| N cost −20% | DSSAT + GA | 11,087.7824 | 11.32 | 10.99 |
| Cotton price +15% | T3 | 11,476.18547 | 15.22 | 0 |
| Cotton price +15% | DSSAT + GA | 12,739.0192 | 27.9 | 11 |
| Cotton price −15% | T3 | 8444.832735 | −15.22 | 0 |
| Cotton price −15% | DSSAT + GA | 9376.8928 | −5.86 | 11.04 |
| Combined stress | T3 | 8416.032735 | −15.51 | 0 |
| Combined stress | DSSAT + GA | 9347.0664 | −6.16 | 11.06 |
| Metric | DSSAT-GA (Sim) | PPO (Sim) | Difference (%) | 95% CI | p-Value |
|---|---|---|---|---|---|
| Nitrogen input (kg ha−1) | 358.2 ± 12.6 | 401.5 ± 17.9 | +12.1 | [29.3, 57.1] | <0.001 |
| Seed cotton yield (kg ha−1) | 9532.4 ± 302 | 9214.7 ± 327 | −3.3 | [−495.2, −141.8] | 0.003 |
| Lint yield (kg ha−1) | 4876.3 ± 198 | 4632.8 ± 221 | −5.0 | [−365.5, −122.3] | <0.001 |
| NUE (kg kg−1) | 13.61 ± 0.58 | 11.54 ± 0.66 | −15.2 | [−2.41, −1.73] | <0.001 |
| Economic return (USD ha−1) | 10873 ± 395 | 9925 ± 452 | −8.7 | [−1698, −602] | 0.001 |
| Fiber quality index | 0.50 ± 0.03 | 0.46 ± 0.04 | −8.0 | [−0.07, −0.02] | 0.009 |
Disclaimer/Publisher’s Note: The statements, opinions and data contained in all publications are solely those of the individual author(s) and contributor(s) and not of MDPI and/or the editor(s). MDPI and/or the editor(s) disclaim responsibility for any injury to people or property resulting from any ideas, methods, instructions or products referred to in the content. |
© 2025 by the authors. Licensee MDPI, Basel, Switzerland. This article is an open access article distributed under the terms and conditions of the Creative Commons Attribution (CC BY) license (https://creativecommons.org/licenses/by/4.0/).
Share and Cite
Yu, Z.; Fu, W. Optimization of Nitrogen Fertilization Strategies for Drip Irrigation of Cotton in Large Fields by DSSAT Combined with a Genetic Algorithm. Appl. Sci. 2025, 15, 3580. https://doi.org/10.3390/app15073580
Yu Z, Fu W. Optimization of Nitrogen Fertilization Strategies for Drip Irrigation of Cotton in Large Fields by DSSAT Combined with a Genetic Algorithm. Applied Sciences. 2025; 15(7):3580. https://doi.org/10.3390/app15073580
Chicago/Turabian StyleYu, Zhuo, and Weiguo Fu. 2025. "Optimization of Nitrogen Fertilization Strategies for Drip Irrigation of Cotton in Large Fields by DSSAT Combined with a Genetic Algorithm" Applied Sciences 15, no. 7: 3580. https://doi.org/10.3390/app15073580
APA StyleYu, Z., & Fu, W. (2025). Optimization of Nitrogen Fertilization Strategies for Drip Irrigation of Cotton in Large Fields by DSSAT Combined with a Genetic Algorithm. Applied Sciences, 15(7), 3580. https://doi.org/10.3390/app15073580