1. Introduction
According to the types of energy dissipators [
1], research on flow energy dissipation can be divided into traditional underflow energy dissipation, surface flow energy dissipation, flipping flow energy dissipation, bucket energy dissipation, emerging pier energy dissipation (flaring gate pier, T-shaped pier), overflow dam surface energy dissipation [
2], etc.; and depending on the dam type, dam height conditions may use a variety of energy dissipatiors combined with energy dissipation [
3]. Existing conventional energy dissipators are often rigidly connected to the discharge structure [
4], such as underflow, flipping flow, newer stepped overflow, and flexible overflow, which are all energy dissipated by water flow impact energy dissipators or water flow collisions with each other to produce water flow rolling and aggravate aeration [
5]. Sometimes, it may not be organized due to the limitation of topographic and geological conditions in the project area. In water conservation projects, jet energy dissipation is usually used in the flood discharge design of hydropower plants to reduce the scouring and erosion of the downstream river channel. Existing research on the statistical characteristics of jet turbulence mainly focuses on the first- and second-order statistical characteristics of jet turbulence.
The first-order statistical characteristics of turbulent flow can be described using the Euler or Lagrange methods.
Wang et al. [
6] used a large eddy simulation to study the flow field and the sound field of a round jet and obtained the axial velocity distribution along the center line of the jet. Liu et al. [
7] used a large eddy simulation to study the parallel jet flow field, and obtained the profiles of the averaged streamwise and lateral velocities of the jet and the root mean square profiles of the streamwise, lateral, and spanwise velocities. Xu et al. [
8] used large eddy simulation to study the flow field of the round jet, and obtained the axial velocity distribution along the center line of the jet and the radial distribution of the axial velocity at dimensionless lengths of the potential core at position
= 1, 2.5, and 5. Turutoglu et al. [
9] used the adaptive multiobjective optimization (AMO) method to study the Reynolds Stress Model (RSM) turbulence model and obtained the velocity and turbulence profiles calculated at the selected measuring points along the jet axis. Julianne [
10] used a FUN3D unstructured CFD program to study the Reynolds Stress Model of the axisymmetric nozzle under three working conditions, and obtained the central line profiles of velocity and turbulent kinetic energy, as well as the radial profiles of five positions downstream of the jet outlet, including streamwise and radial velocity, streamwise and radial turbulence intensity, turbulent shear stress, and turbulent kinetic energy.
Alenius [
11] used large eddy simulation to study the jet flow field of the thick orifice plate, and obtained the average and root mean square velocity curves inside and downstream of the orifice. Ribeiro et al. [
12] studied the statistical characteristics of turbulent jets using an online digital sampling program. The results show that the probability of axial velocity on the central line is slightly non-Gaussian, and the observed probability deviation of axial velocity u usually depends on the behavior difference of the corresponding distribution of positive and negative radial velocity v; the outward transmission (positive v) is related to the u distribution close to Gaussian, while the inward transmission (negative v) is related to the skewed u distribution. Bogoi et al. [
13] used a statistical analysis method to control the acoustic noise in a micro turbojet engine, and proved that the noise signal from the turbojet engine can be regarded as a generalized ergodic signal, which further allows the use of time averages in acoustic measurements. Gao et al. [
14] utilized particle velocity measurement and the laser-induced fluorescence method to measure the velocity field and temperature field of the thermal jet, and obtained the vertical variation of the main axis velocity of a thermal jet. Koh et al. [
15] studied turbulent distribution using a statistical analysis method, and the results show that the average velocity and turbulence intensity distribution of a single jet and a cold coaxial jet are almost the same. The strong temperature gradient in the hot coaxial jet enhances the mixing, resulting in a steep increase in turbulence intensity distribution near the end of the potential core. Compared with the distribution of a single jet and a cold coaxial jet, the turbulence intensity distribution obviously moves upstream.
The second-order statistical characteristics of turbulence can be divided into Euler spatial correlation, Euler time correlation, and Lagrange time correlation [
16].
For spatial turbulence, Reynolds stress can be written as the second-order correlations of two velocities in three directions on a spatial point, which belongs to a Euler spatial correlation [
17]. Joksimović et al. [
18] used the Improved Instability-Sensitive Reynolds Stress Model (IIS-RSM) method to study the statistical and dynamic flow characteristics in open channels with emerging jet configurations, and obtained the corresponding isocontours of the first- and second-order turbulence statistics on the central vertical plane. Huang et al. [
19] used the two-dimensional particle image velocimetry (2D-PIV) technique to study the Reynolds stress distribution and self-similarity of semi-confined impinging jets. The results show that the velocity scale of Reynolds stress decays with the power law, while its length scale increases linearly. Unlike free impinging jets, Reynolds stress does not show self-similarity when using external scaling. The autocorrelation function is a statistic that describes the degree of correlation between random variables at different times [
20]. It is usually regarded as Euler time correlation because it usually focuses on the time dependence of signals in a fixed spatial position. Zhao et al. [
21] used the power spectral density (PSD) function to study the stochastic process characteristics of fluid dynamics, and obtained the autocorrelation function and the autospectrum of fluid dynamics. Harker et al. [
22] used the Hilbert transform-based autocorrelation envelope to study jet noise, and the results show that large-scale noise radiation from an F-22A Raptor base deviates from the similar spectrum model. Fleury et al. [
23] used dual particle image velocimetry (dual-PIV) to study the space-time correlation of two subsonic isothermal circular jets with Mach numbers of 0.6 and 0.9, characterized the space-time correlation scales of the radial and axial velocity components, and obtained the self-similarity of the correlation functions in the shear layer and on the jet axis. Schmid [
24] studied the order reduction algorithm by generating a smaller system matrix directly from the snapshot, and proposed a method to recover the coherent mode from the ratio of the time cross-correlation of a time step to the autocorrelation of the original field.
The square of the time coefficient amplitude (usually the power spectrum in the frequency domain) is more consistent with the Euler time correlation because it usually describes the energy distribution of the signal at different time points (or frequency components). Autospectrum usually refers to the power spectral density (PSD) of the signal. The autospectrum describes the energy distribution of the signal in the frequency domain. It is obtained by the Fourier transform through an autocorrelation function (usually analyzed in the time domain), so it is more in line with the description of the Euler spatial correlation. Zhao et al. [
25] used the short-term Fourier transform (STFT) to study the time coefficient, and obtained a power spectral density diagram of the time coefficient corresponding to the typical modal fluid drag force. Zaman et al. [
26] studied the power spectral density (PSD) of the far-field noise of an unheated axisymmetric jet at subsonic speeds by using the published noise spectrum and the obtained spectra, and obtained the Strouhal number scaling of the PSD at
or higher. Hasselmann [
27] studied the spectral region using the principal oscillation patterns (POPs), and provided a synchronous optimization of the spatial and frequency-dependent representation of the second moments of the field. Von Storch et al. [
28] studied the traditional main oscillation mode, and pointed out that, in many practical situations, the time series is not stationary; that is to say, the first and second moments depend on the external cycle.
The energy dissipation of hydraulic structures is crucial to the overall safety and stability of hydraulic engineering projects [
29]. The energy dissipators in existing hydraulic engineering projects are often arranged on the surfaces of hydraulic structures within the project [
30]. However, they typically dissipate energy by intensifying the aeration of the flow to dissipate energy, which can sometimes lead to problems such as cavitation and erosion in drainage structures, and even induce vibration damage to discharge structures [
31]. Ma et al. [
32,
33] conducted a study on stepped spillways using model experiments, analyzing the variation patterns of conventional hydraulic parameters such as flow velocity, Froude number, and energy dissipation rate, as well as three relative hydraulic parameters along the spillway. Jet energy dissipation refers to the process in which, within a certain range, the water flow mixes with the medium, undergoes sudden expansions and contractions, and generates strong turbulence, effectively dissipating energy [
34,
35]. Nasrabadi et al. [
36] used the Flow3D model to study the air entrainment and energy dissipation process on stepped spillway surfaces, discussing the initial air entrainment point, the division of air-entrainment zones, and scale effects related to air entrainment. Zhang et al. [
37] conducted a comprehensive study of the Xiangjiaba Hydroelectric Plant using the 1:100 hydraulic model tests. They demonstrated that using multiple layers of horizontal submerged jets for energy dissipation in the flood discharge process is feasible, and the relevant parameters can meet the design requirements. Liu et al. [
38] presented a kind of jet-swirl cascade internal energy dissipator to solve the energy dissipation problem in the reconstruction of discharge tunnels with diversion tunnels and perform numerical simulation research on its feasibility and effectiveness, and the results showed that this energy dissipator has a good energy dissipation effect. Li et al. [
39] studied two propagation models of pulsating pressure, namely, the transient flow model and the seepage model, to investigate the pressure propagation mechanism in the gap. The research results indicate that energy-dissipating water flow can impact downstream hydraulic structures and induce strong vibrations. It is urgent to explore energy dissipation patterns that can isolate energy dissipation structures from hydraulic engineering projects.
Existing engineering studies such as underflow, pick flow, new stepped overflow, flexible overflow, etc. are often fixed on the surface of the discharge building and rigidly connected to the discharge building. The energy dissipation method can sometimes bring cavitation and erosion to the discharge building and even have the potential to induce vibration damage to the discharge building. Isolating the energy dissipator from the discharge structure is a feasible way to solve the above hazards, especially to solve the vibration damage of the discharge structure. The vertical jet energy dissipator is a kind of jet energy dissipator. The purpose of this dissipator is to add a special boundary condition (crushing needle) at the outlet of the jet to break the water flow. The crushing needle generates forced vibration under the action of the jet, which aggravates the aeration of the water flow and converts the mechanical energy into internal energy, thereby dissipating part of the mechanical energy of the water flow in the air. Compared with the traditional jet energy dissipator, this method has the advantage that the upstream water flow flows to the vertical jet device through the dissipation pipeline so that the vertical jet energy dissipation system is not limited by the terrain and geological conditions of the hub area. As a typical way to isolate the energy dissipator from the hydraulic hub project, this energy dissipation method is a supplement and improvement to existing jet energy dissipation. In this paper, the energy dissipation characteristics of the vertical jet energy dissipator, a new type of energy dissipation method, are analyzed and studied by means of numerical simulation and a physical model test in order to provide a theoretical basis for the application of the vertical jet energy dissipator. The objective of this study is to investigate the energy dissipation characteristics of this new vertical jet-type energy dissipator. Numerical simulations of vertical jets under various structural parameters using the WMLES turbulence model are used to provide a theoretical basis for its application. This analysis aimed to compare the gap in the state of the ar between traditional energy dissipators and new energy dissipators. In addition, physical model experiments were conducted to validate the numerical simulation results. Furthermore, the energy dissipation characteristics of the vertical jet energy dissipator under various structural parameters and Reynolds numbers were analyzed using the statistical moment method.
2. Materials and Methods
2.1. Structural Form and Structural Parameter Design
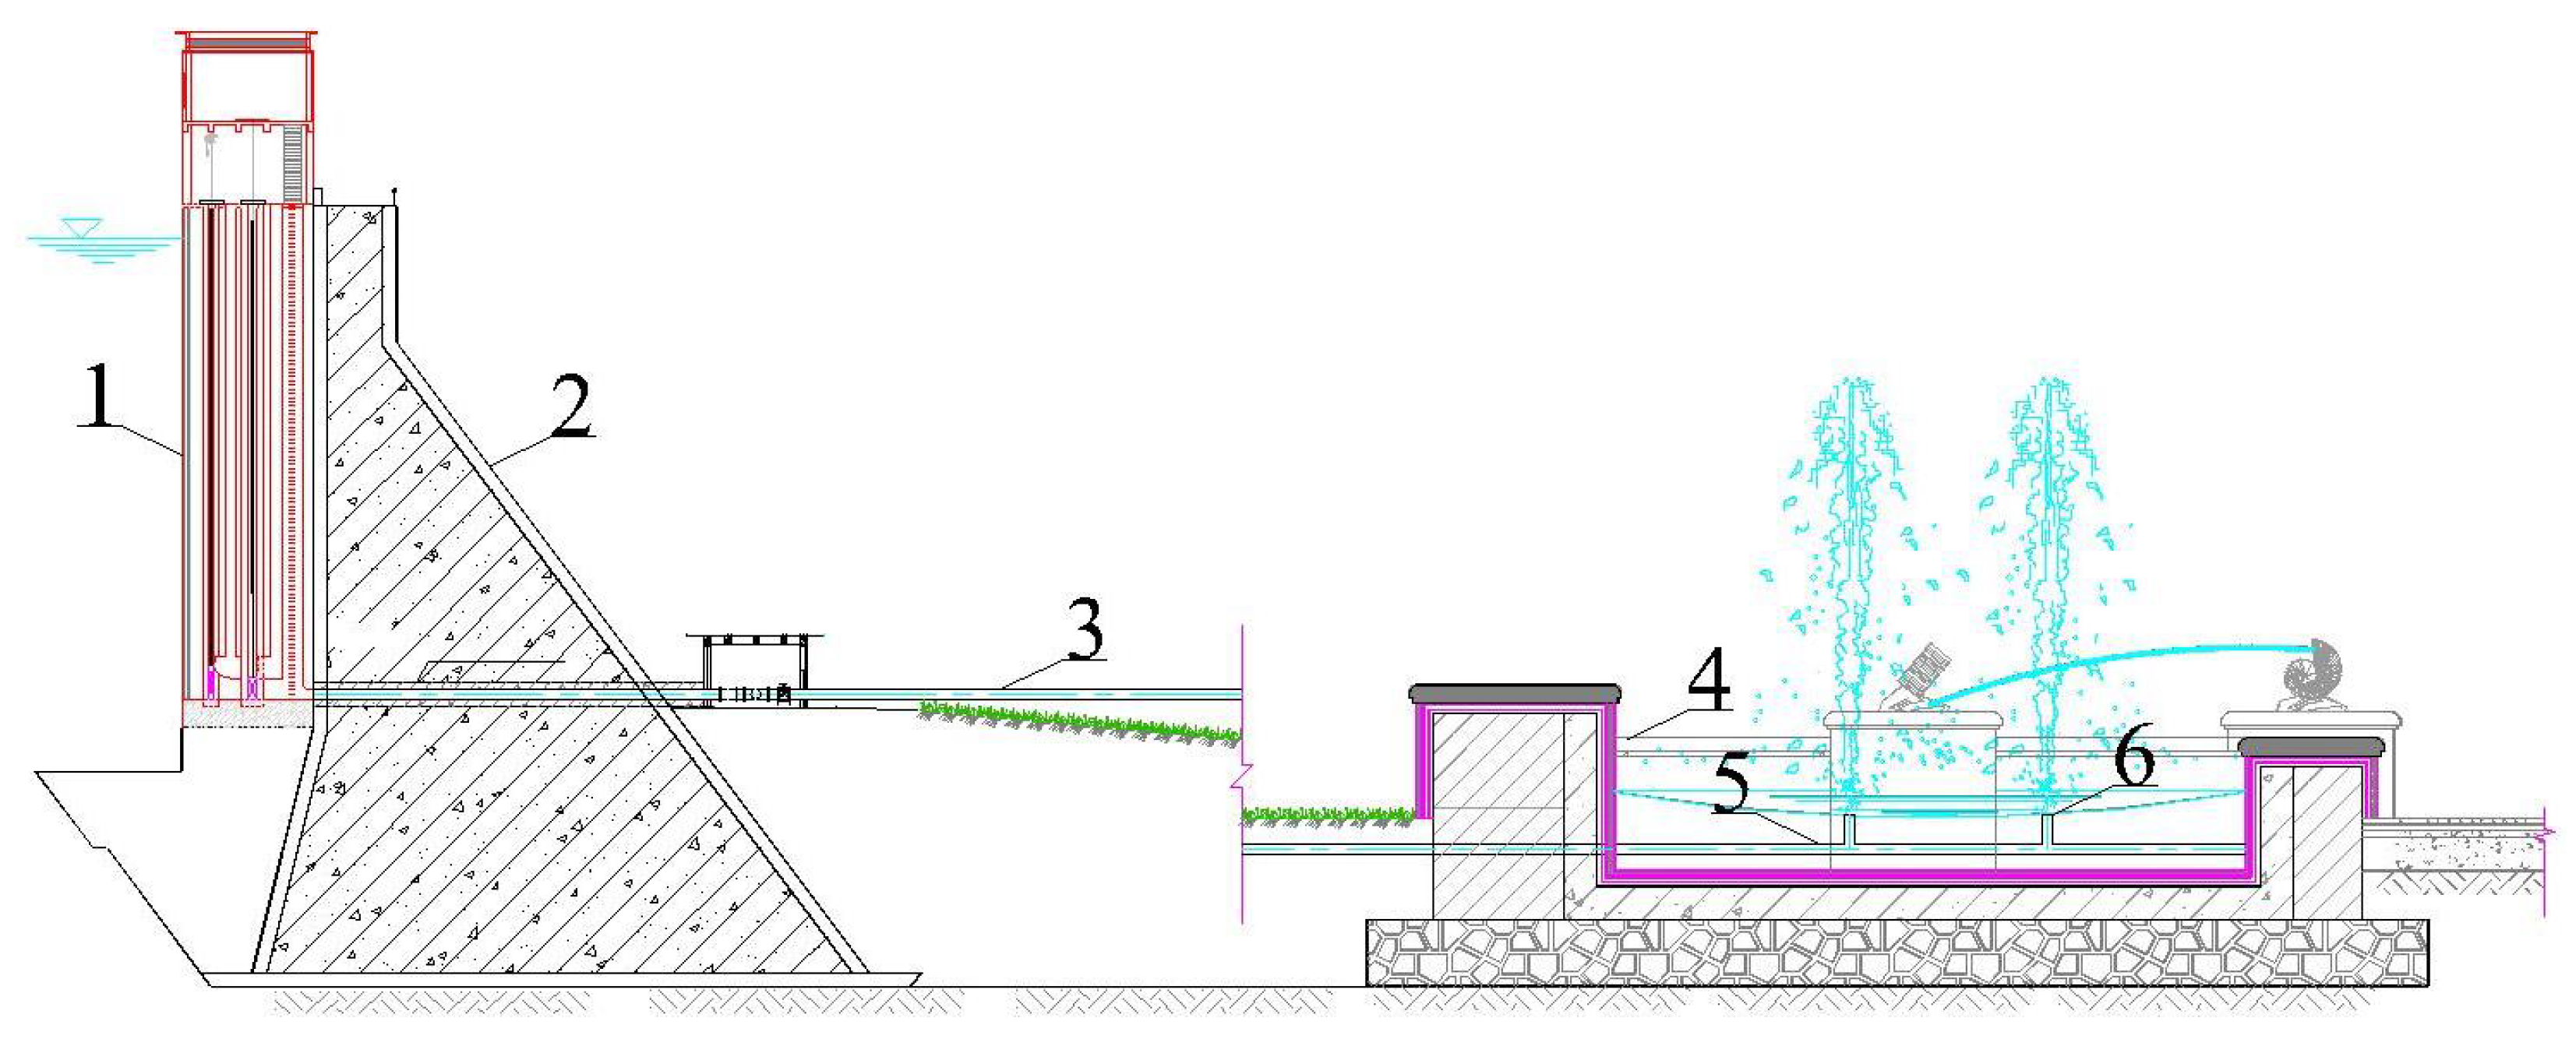
The vertical jet energy dissipator is a dam-type energy dissipator (see
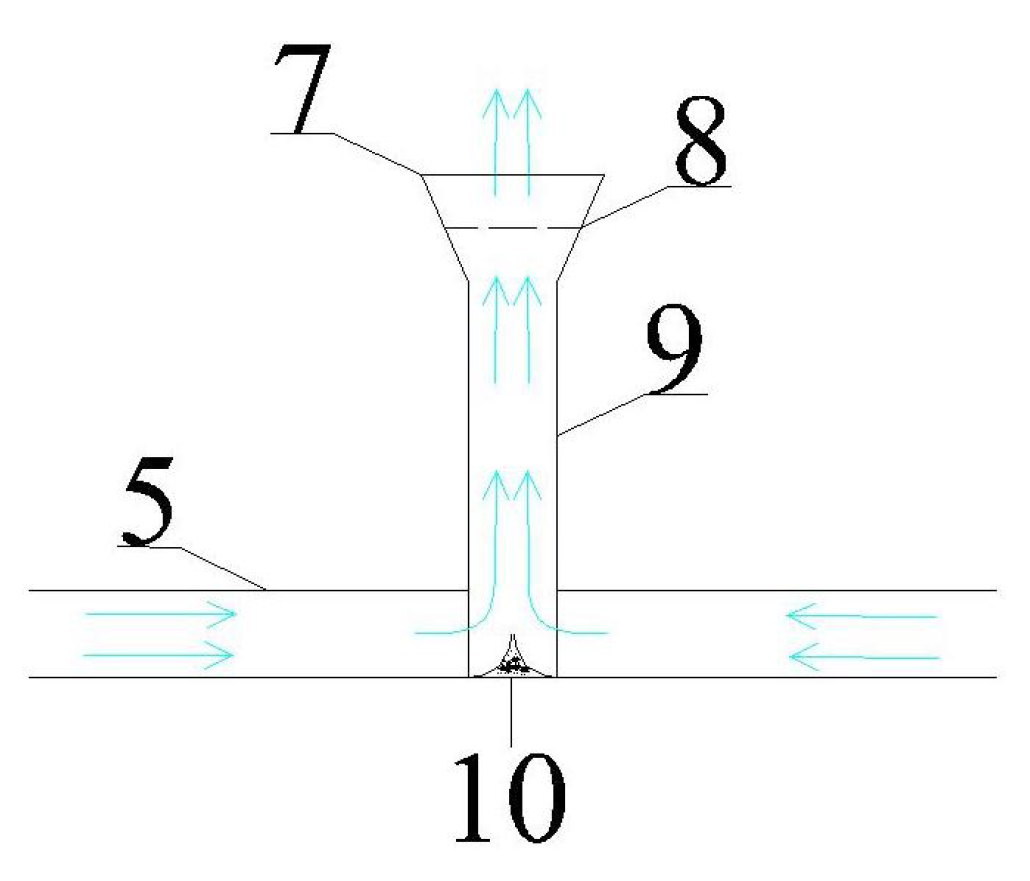
Figure 1). The crushing needles are installed at the jet nozzle of the vertical jet pipeline (see
Figure 2). As a special boundary condition, the structure of the crushing needles, that is, the number and size of the crushing needles, has a great influence on the energy dissipation characteristics of the vertical jet energy dissipator. The shape of the crushing needle studied in this paper is a cylinder. The ratio of the diameter D of the cylinder crushing needle to the radius R of the vertical jet pipe nozzle is uniformly expressed by the size m of the crushing needle and n is the number of crushing needles.
In
Figure 1 and
Figure 2 are shown the (1) intake tower, (2) dam, (3) dissipation pipeline, (4) dissipation tank, (5) distributor, (6) vertical jet energy dissipation component, (7) conical diffusion port, (8) crushing needles, (9) vertical jet pipeline, and (10) streamlined boundary layer.
2.2. Physical Test
To ensure the precision of the simulation results of the vertical jet energy dissipator, it is necessary to carry out a physical test verification on the vertical jet energy dissipator. The whole test system consists of intake tank, centrifugal pump, control valve, electromagnetic flowmeter, vertical jet pipeline, crushing needles, pressure sensor, dissipation tank, open channel, fixed, and fixed inclined support (see
Figure 3). During the test, the control valve and the electromagnetic flowmeter are used to adjust and read the flow rate. The water is pumped from the intake tank to the pipeline through the centrifugal pump. The intake tank is equipped with a wave fence to stabilize the water flow on the right side of the tank. The water is pumped out of the vertical pipeline; then the jet tongue falls into the dissipation tank, and finally, the water flows through the open channel to the intake tank, forming a complete circulation test system. The horizontal plane 70 mm from the nozzle in the vertical pipeline is selected as the section
, and the horizontal plane at the outlet of the vertical pipeline is selected as the section
.
In
Figure 3 and
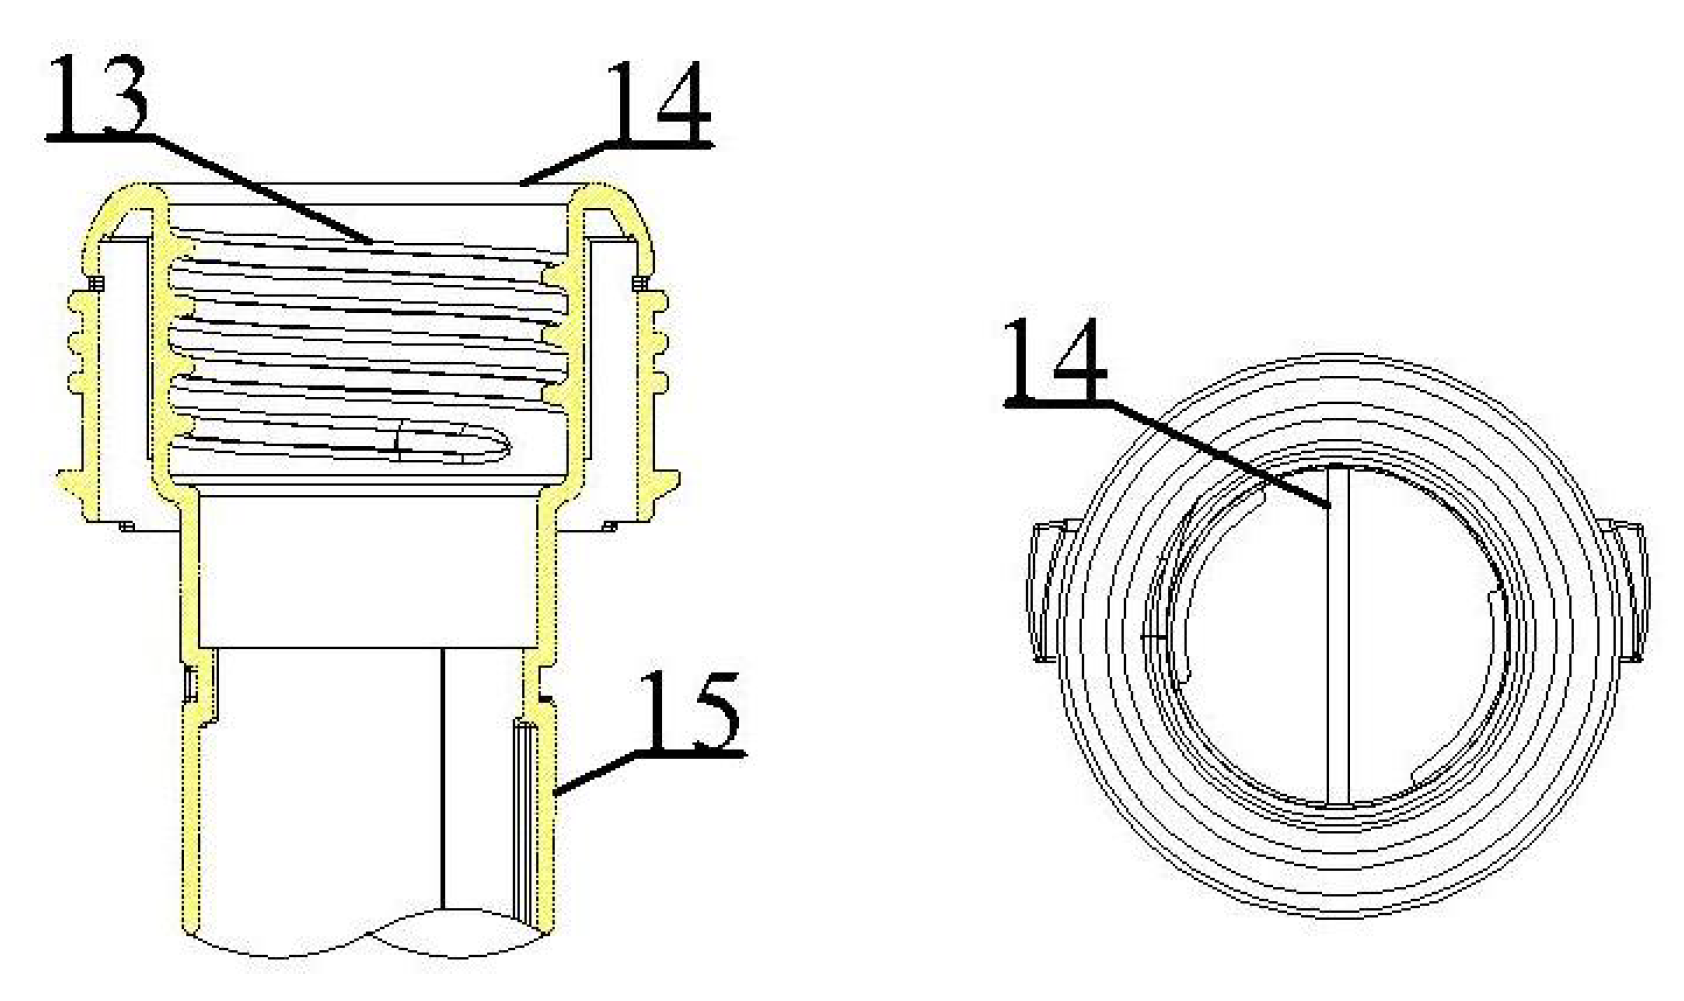
Figure 4 are shown the (1) vertical jet energy dissipation components, (2) pressure sensor, (3) fixed inclined support, (4) fixed, (5) fixed inclined support, (6) dissipation pipeline, (7) electromagnetic flowmeter, (8) control valve, (9) centrifugal pump, (10) intake tank, (11) open channel, (12) dissipation tank, (13) screw mouth, (14) crushing needles, and (15) vertical jet pipeline.
The height of the vertical jet tube is 300 mm; the inner diameter is 19 mm; and the m sizes are 0.1, 0.15, and 0.2. A cylindrical hole is arranged at a distance of 70 mm from the nozzle on the vertical jet pipeline to install a pressure sensor to measure the pressure. The screw connection diagram is shown in
Figure 4. The crushing needles are installed at the nozzle of the vertical jet pipeline, and the screw port is integrated. The screw port is filled with threads, which is convenient for disassembly. The number and arrangement of the crushing needles is set in 6 working conditions, and the crushing needles are arranged at the same central angle, as shown in
Figure 5. In the range of experimental conditions, the Reynolds number of the jet determined by the velocity
of the nozzle center point as the characteristic velocity and the diameter D of the vertical jet pipeline as the characteristic length are between 24,000 and 49,000, so the jet belongs to the fully developed turbulent state. The injection Reynolds number of the test is set to 4 working conditions, 24,471, 32,639, 40,786, and 48,943. Then, to nondimensionalize Reynolds stress, the boundary shear stress was also calculated as
, where
is the shear coefficient,
.
2.3. Numerical Calculation
In order to understand the turbulent statistical characteristics of the vertical jet energy dissipator, the three-dimensional (3D) height and turbulent statistical characteristics of the vertical jet were simulated by numerical simulation. The effectiveness and accuracy of the wall-modeled large eddy simulation (WMLES) in simulating the height of the jet were verified by the experimental results. The large eddy simulation belongs to the fully developed numerical turbulence calculation method with a high Reynolds number [
40]. The jet studied in this paper belongs to a high-speed jet, which is calculated by using a wall-modeled large eddy simulation (WMLES) turbulence model. WMLES is scalable and applicable to a wide range of contexts, particularly for high Reynolds number flows and complex geometries. However, its scalability is limited by computational costs, and its applicability depends on the accuracy of wall models and SGS models in different flow regimes. With ongoing advancements in computational power and modeling techniques, WMLES is likely to become even more scalable and applicable in the future. For specific applications, careful validation and adaptation of the method are essential to ensure reliable results.
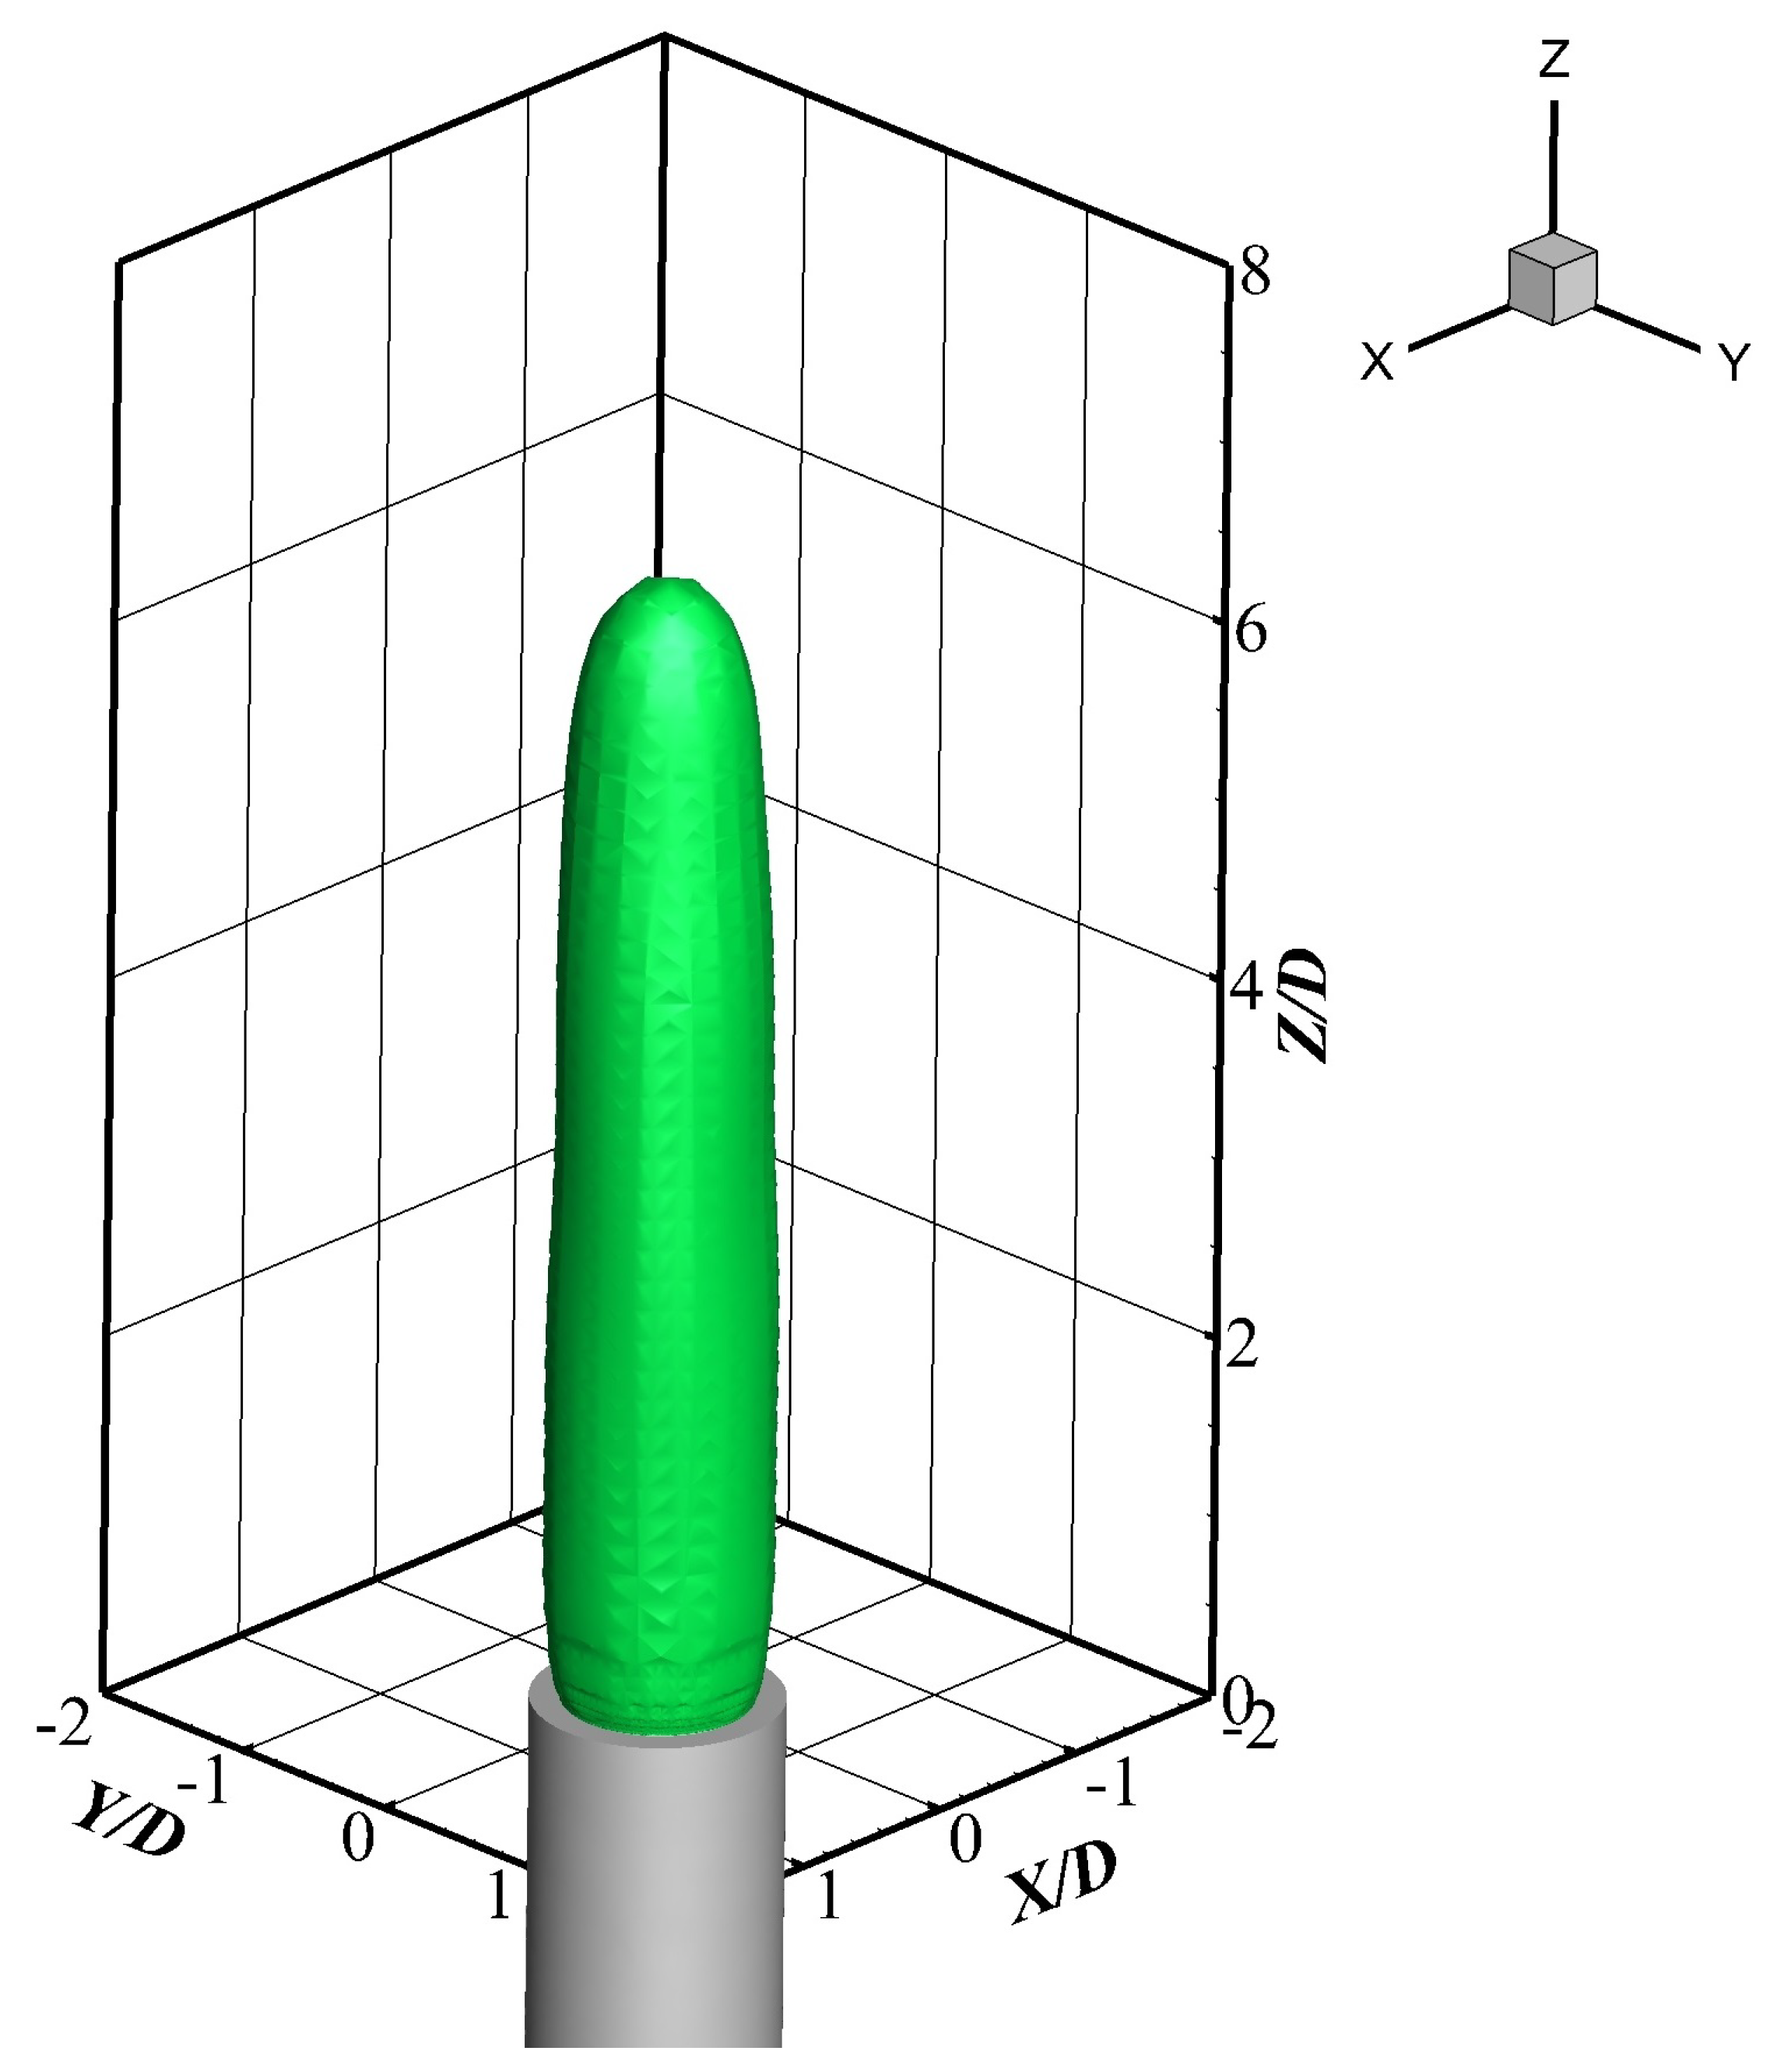
In the flow direction measured from the nozzle, Z is the vertical coordinate, X is the lateral coordinate, and Y is the radial coordinate. The vertical velocity is W, the lateral velocity is U, and the radial velocity is V.
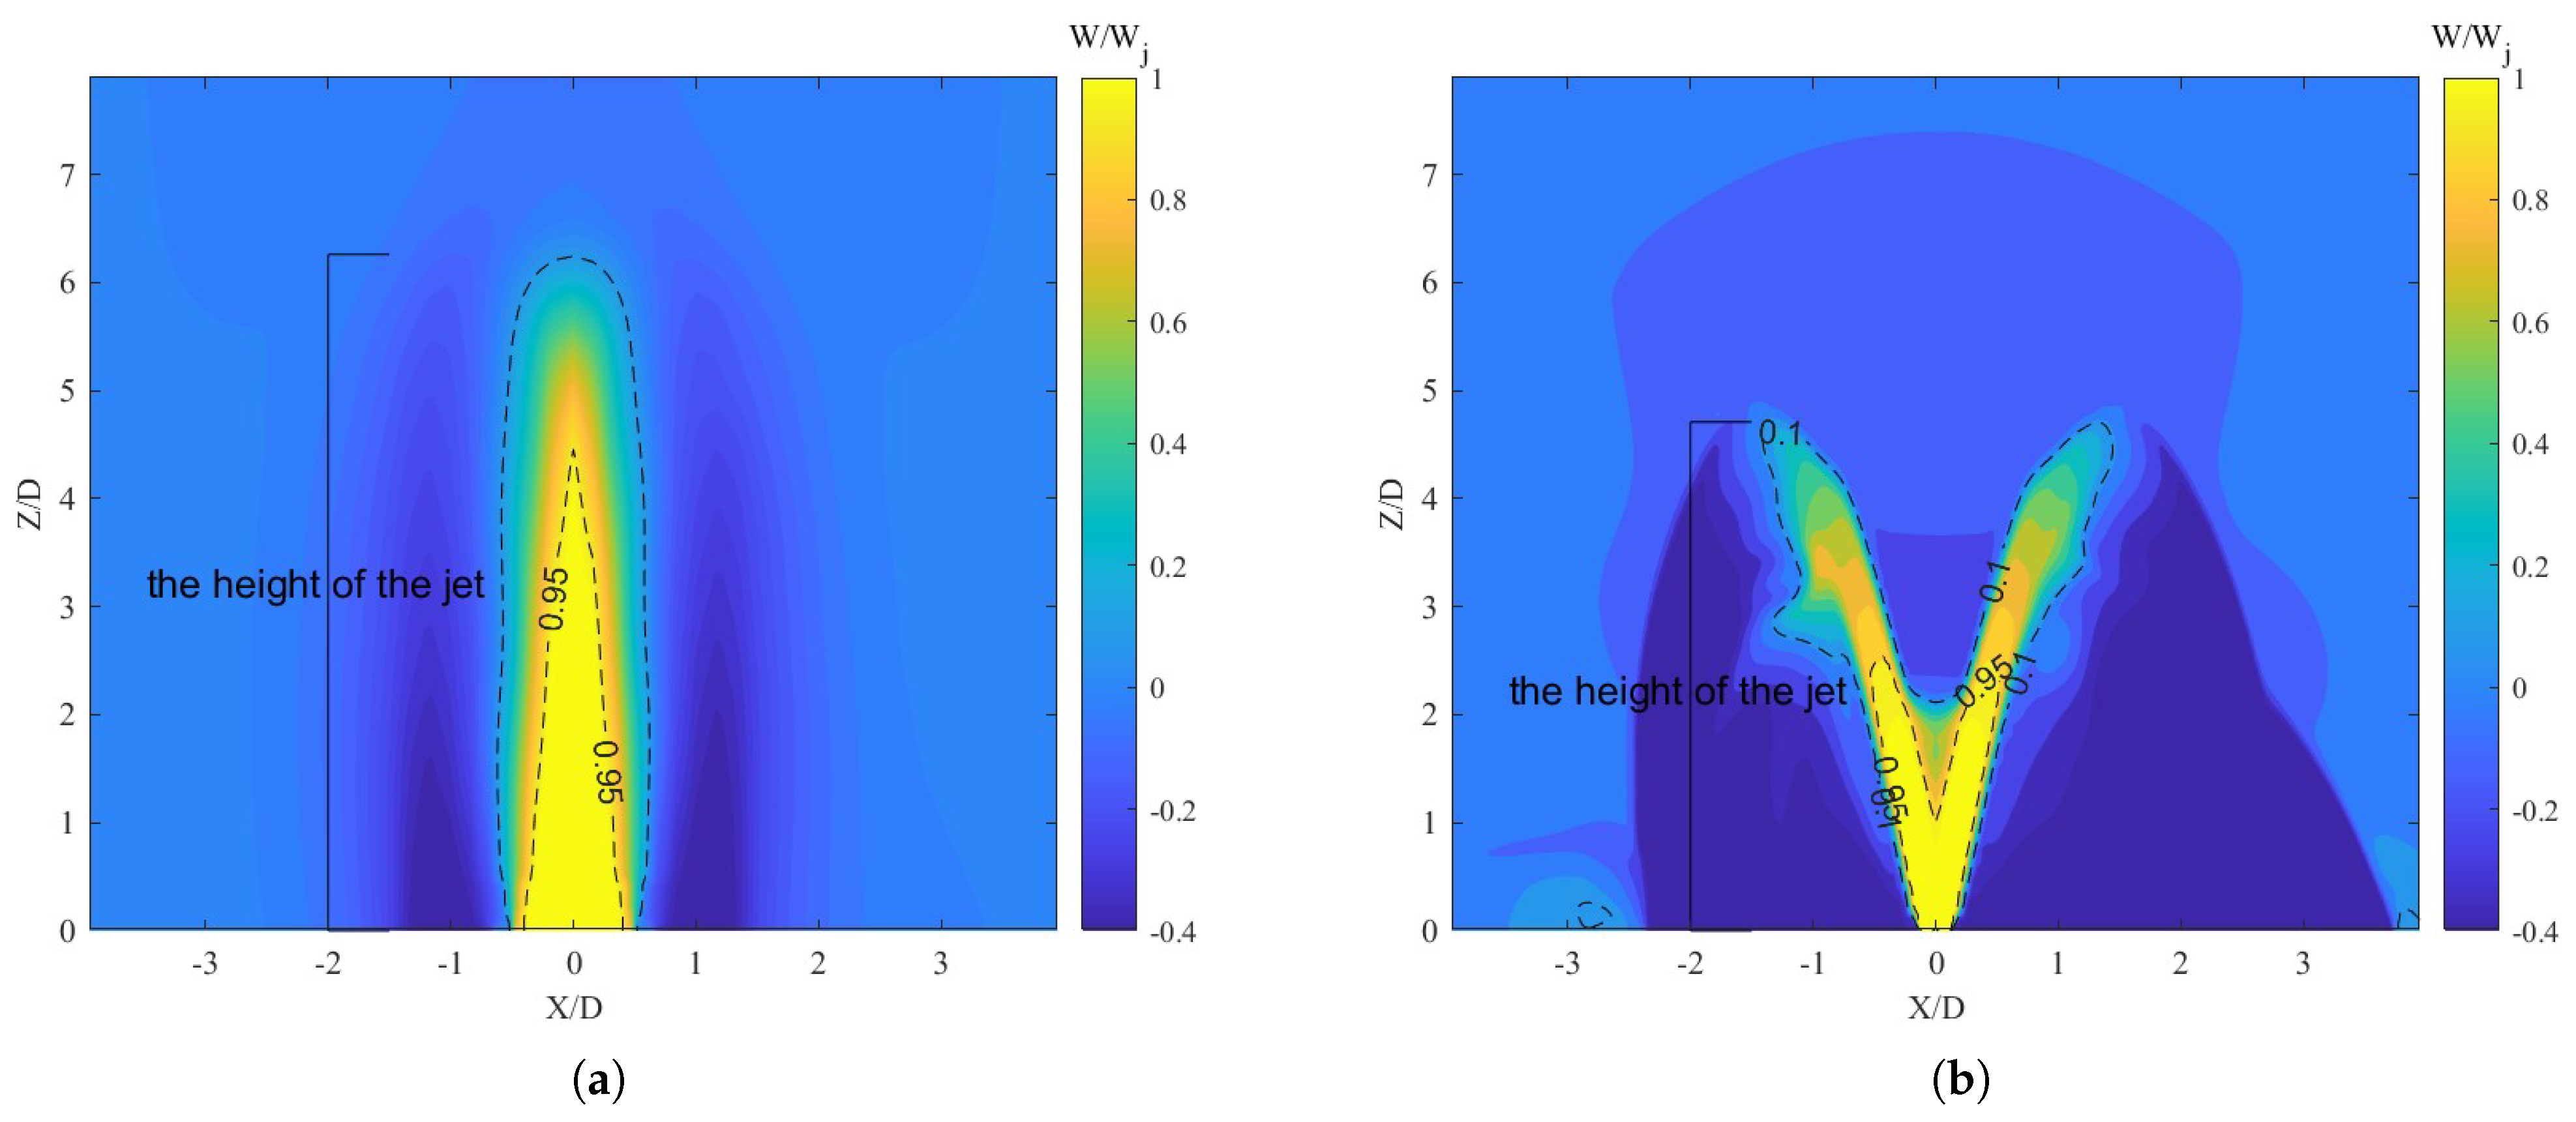
Figure 6 uses the isosurface
to show the outer boundary of the shear layer in the instantaneous flow field under the conditions of Re = 32,639, the size of the crushing needles m = 0.15, and the number n = 0. In this study, the height of the jet is defined as the distance between the jet from the outlet to the highest point of the outer boundary of the shear layer. Under dimensionless conditions, the spatial scale of the jet is dimensionless by the ratio of the distance in the Z direction, the distance in the X direction, to the diameter D of the nozzle. The whole model is divided by a structured grid, the grid size of the model is 0.17 D, and the crushing needle area is locally encrypted. The minimum grid size of the crushing needles’ area is 0.005 D, and the maximum grid size is 0.01 D. In the numerical simulation, the velocity input is used below the vertical jet pipeline, and the atmospheric pressure is set above the vertical jet pipeline. The outlet boundary is the pressure outlet; the wall is a non-slip wall.
The following assumptions were made in this study:
The flow is incompressible and steady.
The fluid is Newtonian with constant properties.
The effect of gravity is negligible.
The flow is fully developed at the inlet.
The governing equations for the fluid flow are as follows:
Momentum equation:
where
u is the velocity vector,
p is the pressure,
is the fluid density, and
is the dynamic viscosity.
The following boundary conditions were applied:
Inlet: Uniform velocity profile, , ;
Outlet: Zero pressure gradient, ;
Walls: No-slip condition, , .
WMLES Implementation Details:
Governing Equations: The filtered Navier–Stokes equations were solved using a finite volume method with a second-order accurate spatial discretization scheme.
SGS Model: The dynamic Smagorinsky model was used to account for subgrid-scale turbulence, with model coefficients computed dynamically based on the local flow field.
Wall Model: An equilibrium wall model based on the logarithmic law of the wall was employed, with wall shear stress computed using the Spalding formula.
Grid Resolution: A structured grid with 10 million cells was used, with clustering near the wall to ensure in the first grid cell.
Boundary Conditions: No-slip boundary conditions were applied at the walls, while periodic boundary conditions were used in the streamwise and spanwise directions.
Time Integration: A second-order implicit time-stepping scheme was used with a time step size of s, corresponding to a maximum CFL number of 0.5.
Parallelization: The solver was parallelized using MPI, with the computational domain decomposed into 512 subdomains. Simulations were performed on a high-performance computing cluster using 512 cores.
Validation: The WMLES results were validated against experimental data for turbulent jet flow, showing excellent agreement in mean velocity profiles and Reynolds stresses.
The LES solver can capture the size of the vortex. The biggest decisive factor is the size of the mesh. At least four meshes are needed to capture a vortex.
Integral length scale:
Here,
k is the turbulent kinetic energy,
is the turbulent dissipation rate, and
is the turbulent specific dissipation rate.
Define a new variable LRV, which is defined as
The value of LRV in the important area of the computational domain in this study is greater than 10; that is, there are at least 10 grids in an integral length scale, which can be considered to meet the requirements. The time analysis and space analysis of the flow of the grid meet the requirements.
The entire model is divided using a structured mesh, with a mesh size of 0.17 D. Local refinement is applied to the fragmentation needle region, where the minimum mesh size is 0.005 D and the maximum mesh size is 0.01 D. During the numerical simulation, a velocity inlet is applied below the vertical jet pipe, while the upper part of the vertical jet pipe is set to atmospheric pressure. The outlet boundary is the pressure outlet, and the wall boundary is the no-slip wall.
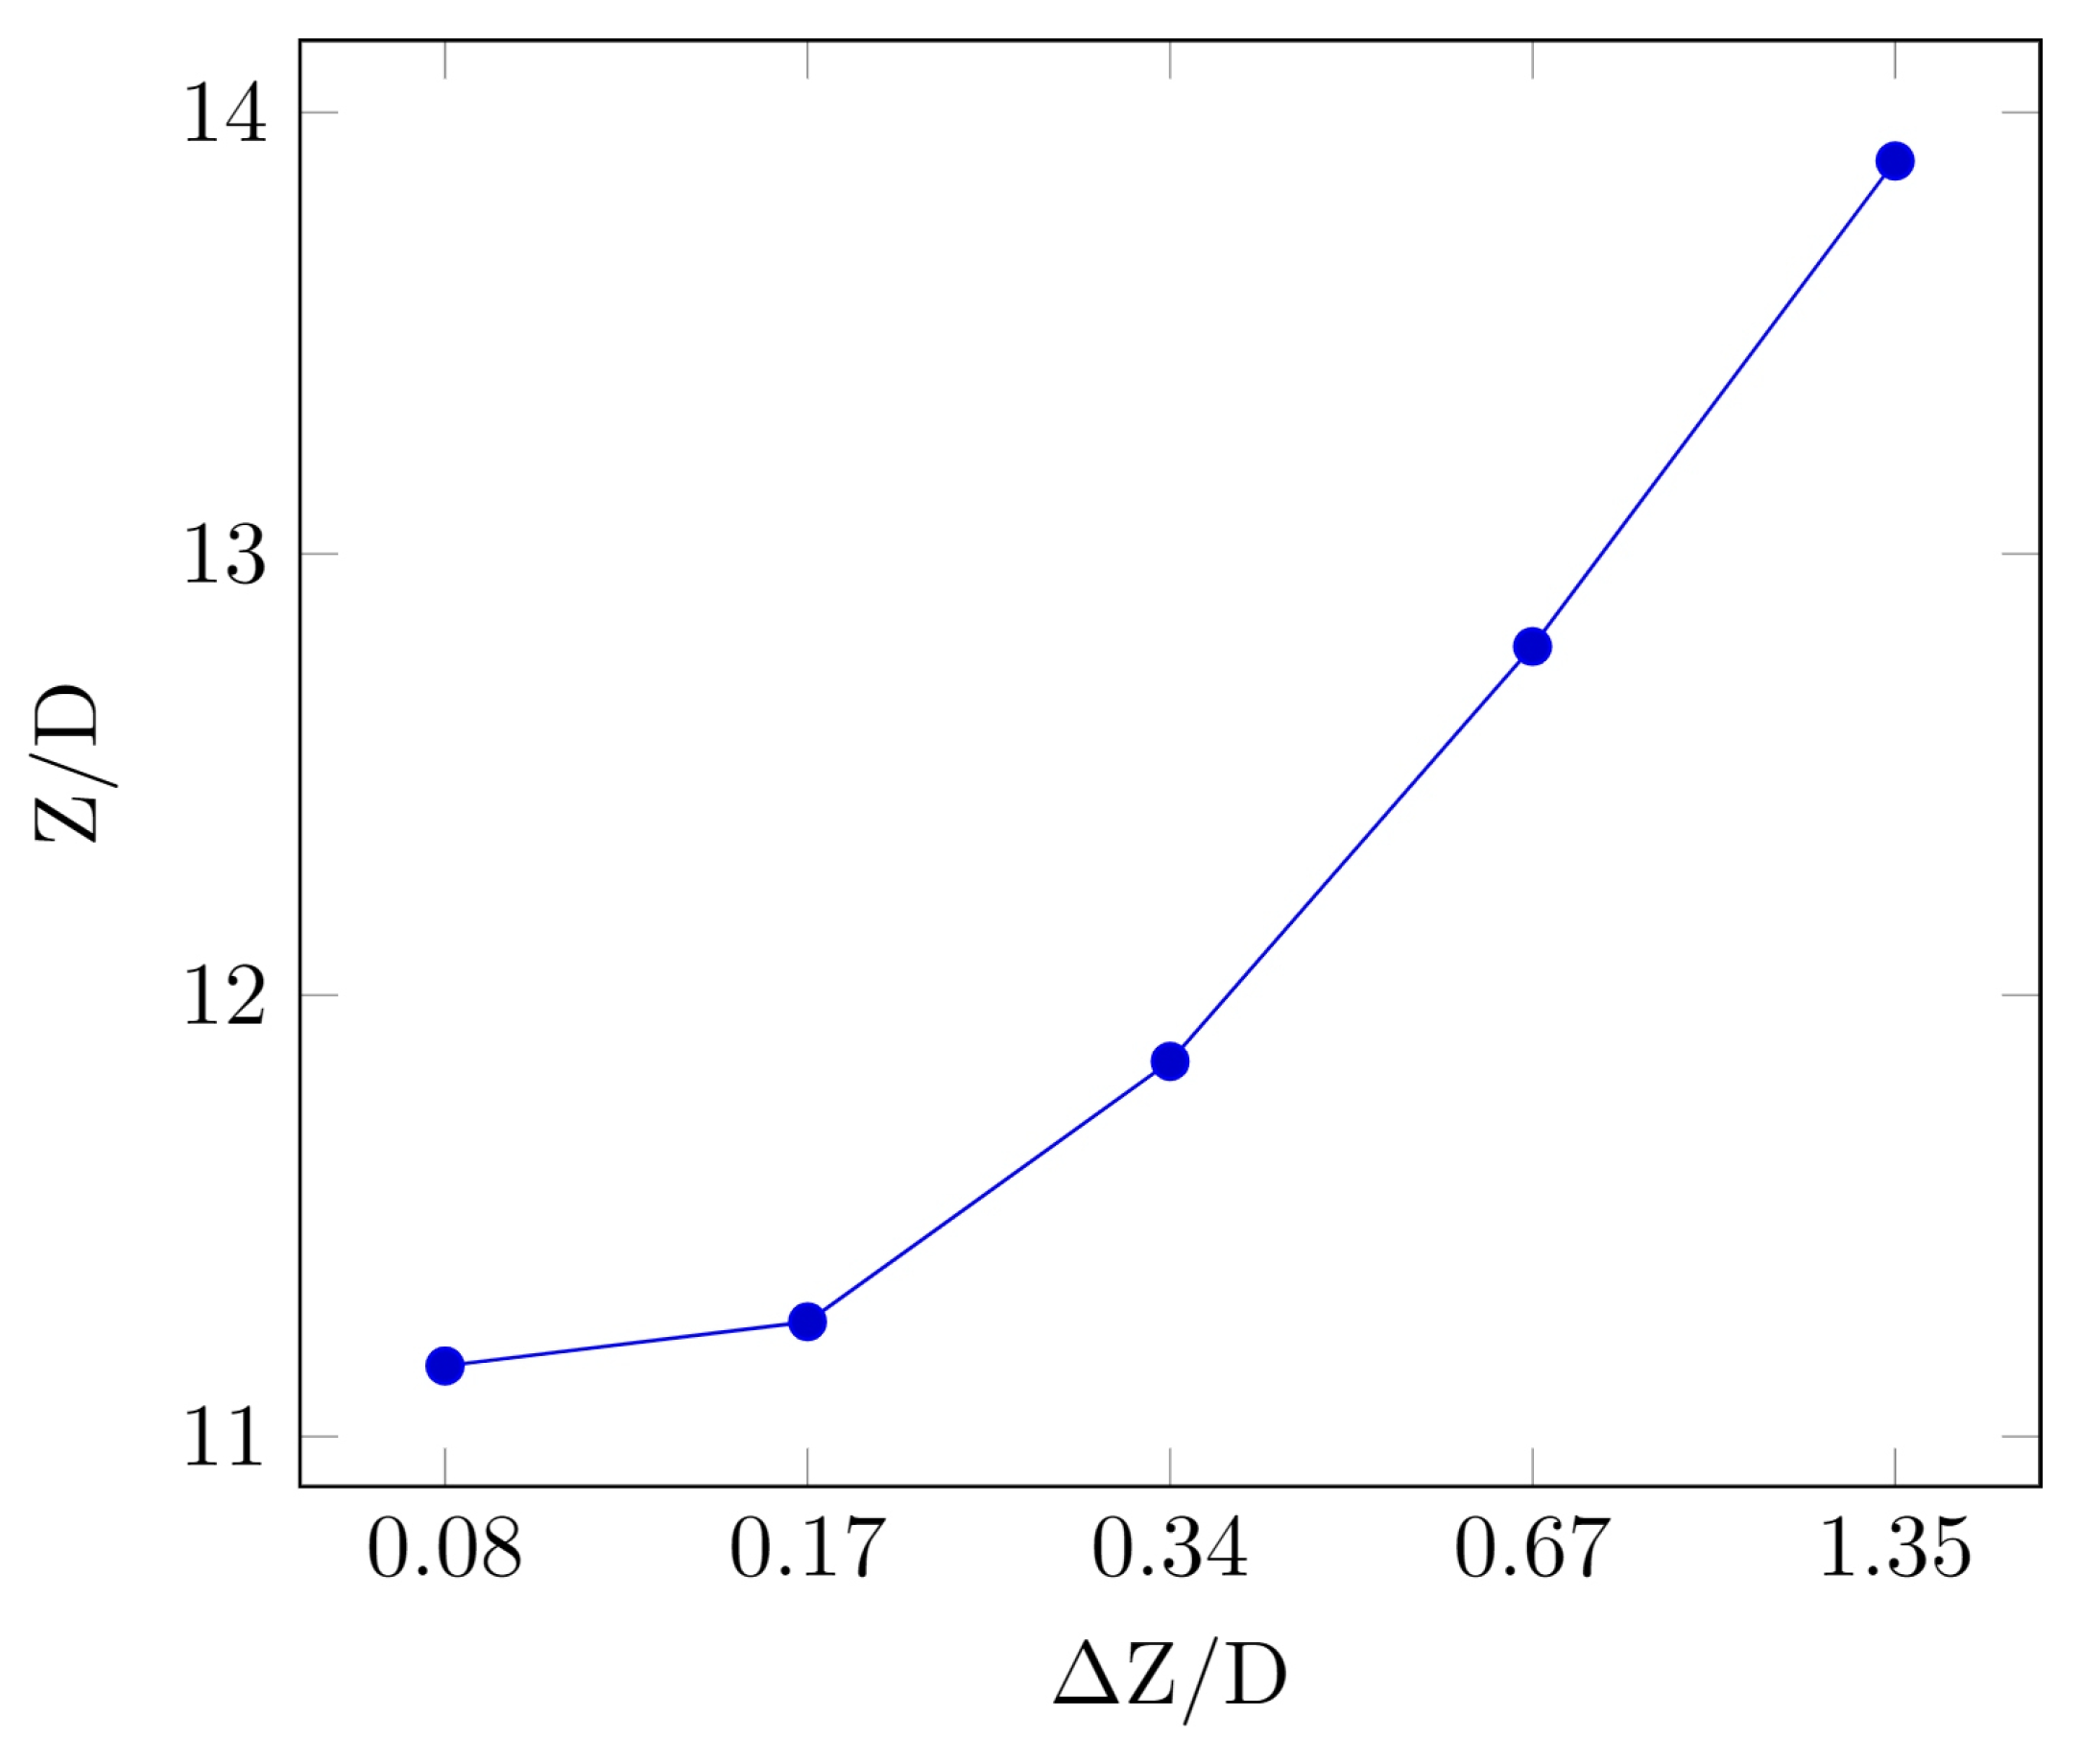
To verify the correctness of the selected mesh size, a mesh independence test was conducted. Polyhedral structured meshes with ΔZ/D values of 0.08, 0.17, 0.34, 0.67, and 1.35 were used to analyze the energy dissipation pool.
Figure 7 shows the dimensionless jet height for five mesh sizes at a Reynolds number of 32,639, without fragmentation needle arrangement. The analysis shows that the total height of the jet varies with different mesh sizes. As the mesh size increases, the total height of the jet gradually increases. The total height of the jet stabilizes at dimensionless mesh sizes of 0.08 and 0.17, with a relative error of 0.68%. It can be concluded that a further reduction in mesh size had little effect on improving the simulation accuracy. In addition, the computational time increases significantly when the dimensionless mesh size is reduced from 0.17 to 0.08. Therefore, a polyhedral mesh with a mesh size of 0.17 D was used for the simulation.
In an LES-type turbulence model,
The kinematic viscosity () represents the global, molecular dissipation.
The turbulent viscosity () represents the local, subgrid-scale dissipation.
The total effective viscosity () ensures that energy is dissipated at all scales, from the largest resolved eddies to the smallest subgrid-scale motions.
By combining these concepts, LES accurately captures the local energy dissipation in turbulent flows, ensuring that the energy cascade and dissipation mechanisms are properly represented.
2.4. Simulation Results Verify
The precision of the numerical simulation of the height of the jet is verified by the statistical index determination coefficient (
) and the mean absolute percentage error (MAPE). Although the coefficient of determination (
) is a widely used metric to assess the goodness of fit in regression models, it has limitations. It does not indicate whether the model is biased. It can be misleading if used alone, especially in cases where the model is overfitted or when the relationship between variables is nonlinear. Including additional indices can provide a more comprehensive evaluation of the performance of the model. The mean absolute percentage error can provide the actual size information of the error, which is intuitive and easy to understand, and can evaluate the performance of the model with the determination coefficient. The calculation method of (
) is as follows:
where
N is the number of data,
is simulated data,
is the average value of the simulated data, and
is the test data, the average value of the test data. When
, the simulation results are considered to be more reliable, and the closer
is to 1, the higher is the reliability of the results.
The physical model test results are used to verify the results of the numerical simulation of the jet height. The number of crushing needles n = 0, n = 2, n = 3, n = 4, n = 5 and n = 6, and the size of the crushing needles m = 0.1, m = 0.15, m = 0.2 are selected. The combination scheme of test conditions is used to verify the jet height of the vertical jet energy dissipator.
Figure 8 shows a comparison between the simulated value and the experimental value of the dimensionless jet height of the vertical jet energy dissipator. It can be seen from the figure that both the simulated value and the experimental value decrease with the increase in Reynolds number. With increasing numbers and sizes of the crushing needles, the jet height also gradually decreases. The simulated value of the jet height corresponding to each test condition is close to the experimental value. The range of the correlation coefficient
is between 0.99 and 1.00, and the maximum mean absolute percentage error is 7.80%, indicating that it is feasible to use Fluent 2022 R1 commercial software to simulate the jet height of the vertical jet energy dissipator.
4. Discussion
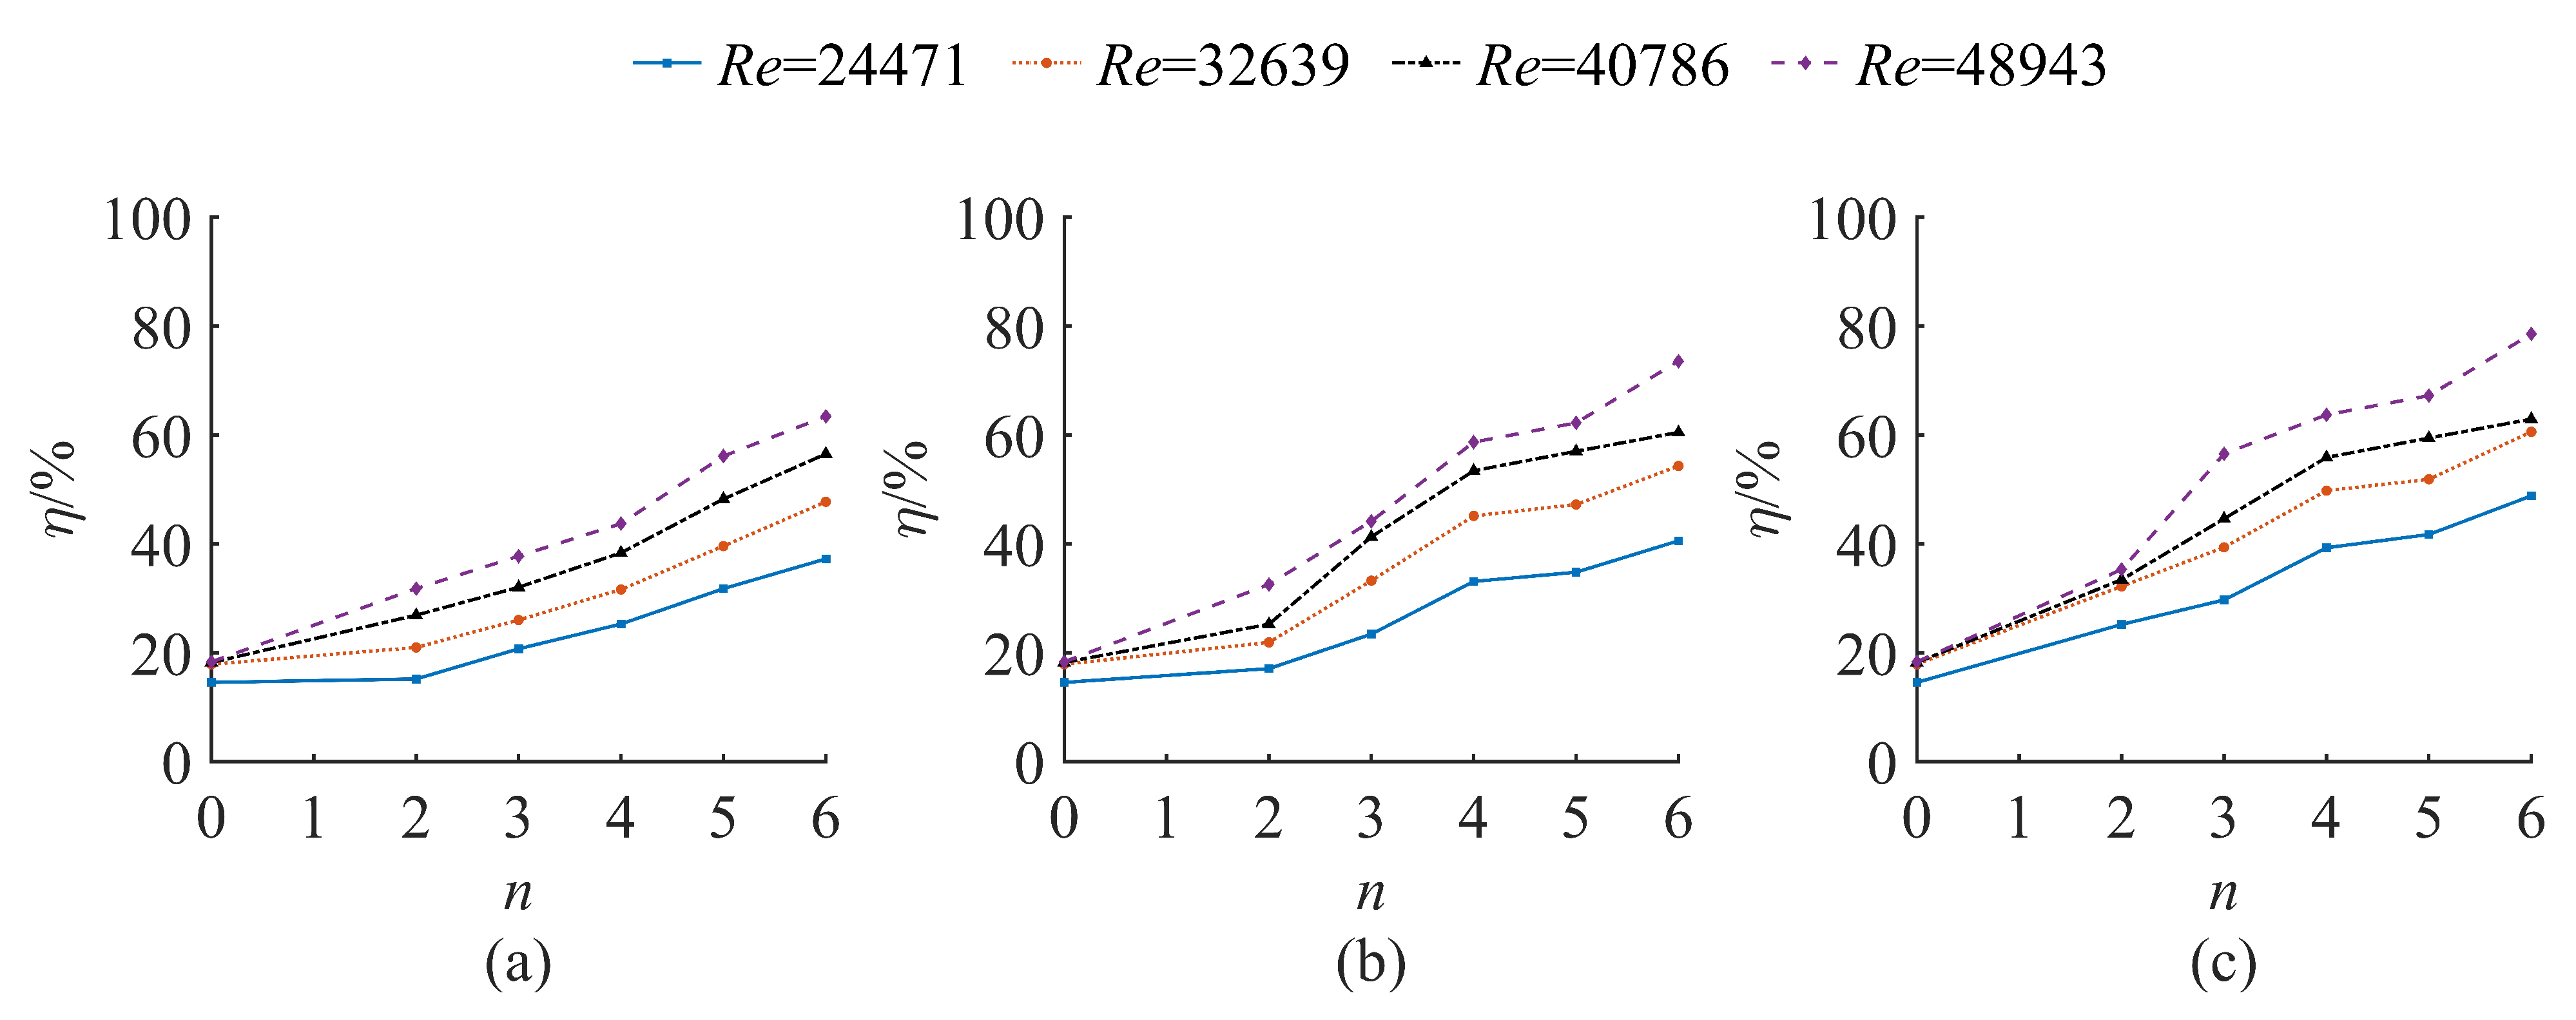
In this chapter, the results of the analyses carried out are presented, divided into three types: the first-order and second-order statistical characteristics and the energy dissipation rate of vertical jet energy dissipators under different structural parameters. These results were obtained through numerical simulations and physical model tests. The findings indicate that the energy dissipation rate of the vertical jet increases with the increase in the Reynolds number, the number of crushing needles, and the size of crushing needles.
The observed increase in energy dissipation rate with higher Reynolds numbers aligns with previous studies, which have demonstrated that turbulent flow conditions, typically associated with higher Reynolds numbers, enhance energy dissipation due to increased mixing and momentum transfer [
15]. This is consistent with the classical turbulence theory, where energy dissipation is directly related to the intensity of turbulent fluctuations.
The positive correlation between the number of crushing needles and the energy dissipation rate can be explained by the increased surface area for interaction between the jet and the needles. This finding is supported by the work of Bogoi et al. [
13], who reported that additional obstacles in the flow path significantly enhance energy dissipation by creating more turbulence and flow resistance. Similarly, the increase in energy dissipation with larger crushing needle sizes can be attributed to the greater disruption of the jet flow, leading to more effective energy dissipation. This observation is in agreement with the results of the study of Julianne [
10], who found that larger structures in the flow path result in higher energy losses due to increased flow separation and vortex formation.
However, it is important to note that while increasing the number and size of crushing needles improves energy dissipation, there may be practical limitations. For instance, excessive numbers or sizes of needles could lead to increased construction costs and potential flow blockage issues, as highlighted by Ribeiro et al. [
12]. Therefore, an optimal balance must be sought to maximize energy dissipation without compromising the efficiency and feasibility of the dissipator design.
In conclusion, the results presented in this study are consistent with existing literature, reinforcing the understanding of the factors influencing energy dissipation in vertical jet energy dissipators. Future research could explore the optimization of crushing needle configurations to achieve the most efficient energy dissipation while considering practical constraints.
