Article

Microplastic Retention in Secondary Sewage Sludge: Characterization and Influence of Solid Concentration

Department of Chemical and Environmental Engineering, University of Oviedo, C/. Julián Clavería s/n, 33006 Oviedo, Spain
*
Author to whom correspondence should be addressed.
Appl. Sci. 2025, 15(7), 3557; https://doi.org/10.3390/app15073557
Submission received: 4 February 2025 / Revised: 20 March 2025 / Accepted: 22 March 2025 / Published: 25 March 2025
(This article belongs to the Special Issue Advances in Pollutant Removal from Water Environments)

Abstract

:
The majority of microplastics (MPs) removed from urban wastewater during conventional treatments end up in sewage sludge (around 95%). There are not many studies focused on the retention of MPs in secondary sewage sludge. This study explores the amount and kind of MPs retained in secondary sludge from a municipal wastewater treatment plant (WWTP) and the factors affecting the entrapment of MPs within the sludge flocs. The most abundant MPs in the sludges were fibres (61%), and the majority were within the size range of 250–500 μm. In addition, the effect of solid concentration on MP retention in settled sludge was analysed by carrying out a mixing–settling test. Without the addition of any chemicals, a maximum MP retention efficacy of 63% was obtained for a total suspended solids (TSS) concentration of 5.33 g/L. The effect of adding FeCl3 and non-ionic polyacrylamide (PAM) was also investigated, and the percentage of retained MPs increased to values of 82% and 70%, respectively (with only 0.63 g TSS/L). This improvement occurred predominantly in the case of fibres. The results suggest the possibility of adding chemicals before the secondary settling stage as a means of reducing MP contamination in treated water.

1. Introduction

Wastewater treatment plants (WWTPs) represent an indirect source of MP emissions into the environment, due to the amounts of MPs still contained in the treated water [1,2]. Because MPs have a multifactorial origin, municipal wastewater is significantly polluted by them. In particular, MP concentrations between 0.28 and 3.14·104 MPs/L have been reported in the influent of municipal WWTPs [3,4,5]. The treatment processes carried out in these facilities can remove more than 90% of the MPs initially contained in the wastewater; however, the majority of these MPs accumulate in the sewage sludge [1,6]. Very different concentrations of MPs have been measured in sewage sludge, ranging from 400 to 170,000 MPs/kg [7,8,9]. Taking action at these facilities to improve the MP removal efficiency is key to preventing their release into the aquatic environment [10]. However, at the same time, the sludge containing the removed MPs is applied to agricultural soils, introducing the MPs into the environment. In WWTPs, sewage sludge is mainly produced during the primary and secondary settling processes. Additionally, coagulation and flocculation are an essential part of drinking water treatment and can also be used to improve the performance of some tertiary wastewater treatments [11,12,13,14]. Coagulant and flocculant agents are used to destabilize present colloids and form larger “particles” capable of settling [15,16,17]. Physical-chemical processes, which occur simultaneously when these chemicals are added, may enhance MP retention in sewage sludge [15,16,18]. The efficiency of MP entrapment in the flocs is highly influenced by the type and surface charge of the MPs, coagulant/flocculant dosages, mixing speed, pH, characteristics of the flocs, the presence of extracellular polymeric substances (EPS), and even the presence of other pollutants [19,20,21]. It has been reported that the use of chemicals achieves MP removal rates between 44 and 98% from wastewater [22,23]. For example, a coagulation/flocculation step after secondary treatment removed up to 93% of the MPs. Using polyaluminum chloride (PAC) as a coagulant in the range of 36–72 mg/L, wastewater samples from the primary clarifier, secondary clarifier, and final effluent outflow were examined; the MP removal rate ranged from 23 to 93%. According to another investigation, an aluminum-based coagulant concentration of 405 mg/L resulted in MP removal efficiencies within the range of 47.1% to 81.6% [23,24]. At a laboratory scale, a study investigated the removal efficiency of polyethylene MPs (PE-MPs) from wastewaters, using FeCl3·6H2O and AlCl3 with cationic and anionic polyacrylamide (PAM) at different concentrations (coagulation with jar tests; after maintaining the rapid mixing speed at 300 r/min for 1 min, it was lowered to 100 r/min for 14 min and then allowed to settle for 30 min). In terms of PE-MP removal efficiency, Al-based salts outperformed Fe-based salts in the experiment. PE-MP retention increased to over 91% with the addition of anionic and cationic PAM and high AlCl3 concentrations [23,25]. With the use of cationic PAM, the removal efficiency of PE particles increased, especially for small-sized PE-MP particles. However, when anionic PAM was used, the removal rate of PE-MPs was significantly greater (61%) [23,25]. The reason behind this is the development of thick Al-based flocs, which improved PE-MP adsorption and sedimentation throughout the coagulation phase. Other studies also reported better performances for the anionic PAM compared to the cationic one [26]. Additionally, in laboratory studies employing a batch approach, it was observed that the combination of MgCl2 and anionic PAM produced larger and more stable flocs, resulting in the best MP retention efficiency (84.9%) [12,27].
All the above studies were carried out with synthetic waters or after different treatments in the WWTPs, including a new coagulation-flocculation step. The aim of this study was to explore the retention of MPs in settled secondary sewage sludge, as in many cases the secondary settling acts as the “last barrier” prior to MP release into the aquatic environment. In this study, the concentrations of MPs in secondary sludges taken from a municipal WWTP were determined, and the physical (morphology, size, and colour) and chemical (plastic type) characteristics of the MPs were analysed. In addition, different mixtures of sludges and field-obtained, mixed MPs were employed in mixture–settling experiments to determine the effect of total suspended solids (TSS) and the addition of chemicals on the MP retention efficacy. It is important to understand the effect of TSS concentration on MP removal, since it can vary between 1.5 g/L and 4.0 g/L in conventional activated sludge bioreactors. In addition, understanding the effect of TSS concentration may help clarify the mechanisms that regulate MP capture within sludge flocs. The present study is the first to investigate the effect of TSS concentration on MP uptake, establishing the TSS threshold in relation to the removal efficiency of MPs. In addition, the synergistic effect of MP settling after the use of chemicals (FeCl3 and nonionic PAM) together with the presence of organic flocs was evaluated.

2. Materials and Methods

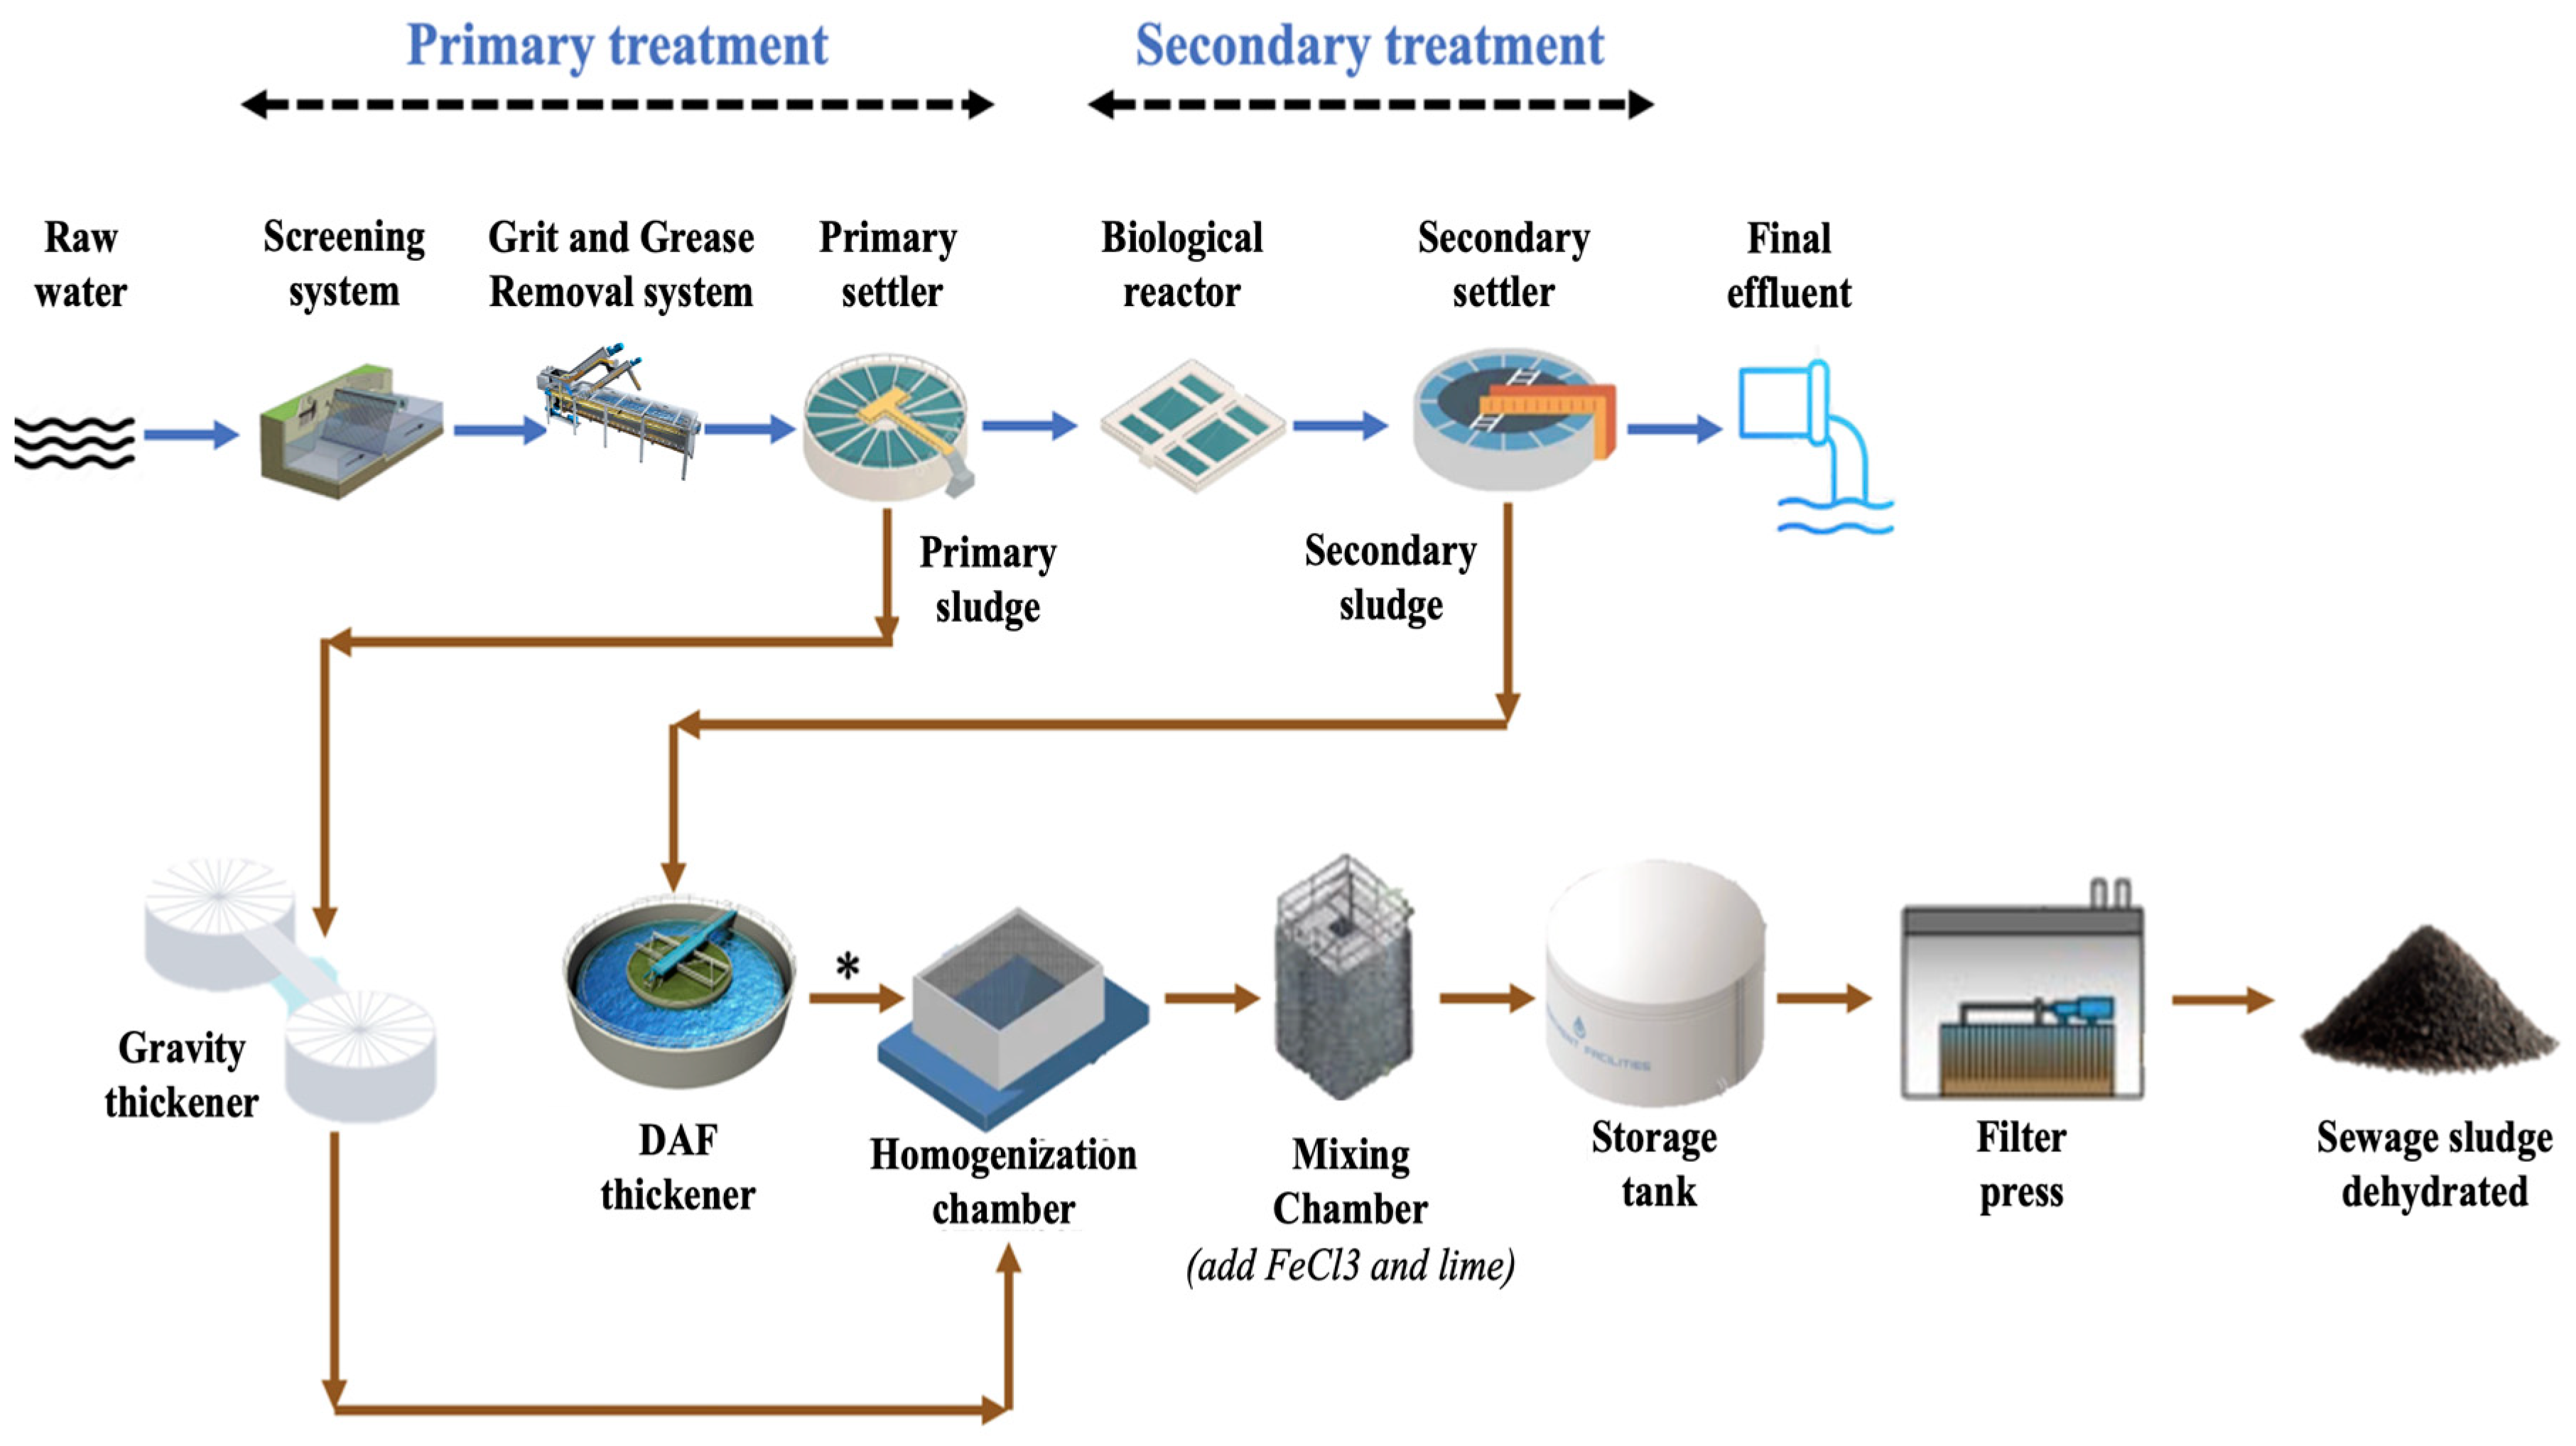
2.1. WWTP Characteristics

The municipal WWTP that supplied the sludge used in this study is located in the northwest of Spain and treats an average daily flow of 23,786 m3, serving 84,000 equivalent inhabitants. The flow sheet is shown in Figure 1. The raw wastewater passes through two subsequent screening systems (with pore sizes of 30 mm and 8 mm) and, afterwards, through the grit and grease system. The primary treatment consists of 3 circular decanters, each 30 m in diameter, that allow a maximum instantaneous capacity of 8640 m3/h. Subsequently, in the aerated biological reactor, which has a maximum capacity of 2520 m3/h, organic matter and nitrogen are processed. In the sludge line, the sludge recovered from the primary and secondary treatments are processed. The primary sludge is thickened in a gravity thickening tank and the secondary sludge in a dissolved air flotation (DAF) tank. Both sludges are then mixed in the homogenization and mixing chamber, where a coagulant (FeCl3) and lime are added to improve dehydration (through filter presses) and stabilize the mixture. All water from the overflows is taken to the head of the plant, where it is mixed with the raw water to be processed again. Finally, the dehydrated sludge is crushed and accumulated in silos for subsequent drying and transportation to an authorized landfill.

2.2. Sludge Characteristics

Single samples of thickened sludge were taken from the surface of the DAF equipment (Figure 1) once a month, between June 2023 and November 2023. The physicochemical parameters of the sludge evaluated were pH, TSS, humidity, dry matter (DM), total chemical oxygen demand (tCOD), and total organic carbon (TOC). For pH measurements, a basic benchtop pH meter (ORP sensION+ PH3, HACH, Düsseldorf, Germany) was used. DM content was obtained by the difference in weight between raw sewage sludge and after drying at 105 °C, and TSS was determined by a gravimetric analysis as described in the Standard Methods for the Examination of Wastewater (Standard Methods 2540 D, APHA, 2005) [28]. A weighted standard glass filter was used to filter sludge samples, and the residue left on the filter was dried to a constant weight at 103 to 105 °C (for at least one hour in an oven, followed by cooling in a desiccator to equilibrate the temperature).
tCOD was measured according to Standard Methods (APHA, AWWA, WEF, Standard Methods for the Examination of Water and Wastewater, 2005) [28]. Total organic carbon (TOC) concentrations were measured using a Shimadzu TOC-V CSH device (Tokio, Japan, Shimadzu). The physical and chemical properties of the sludge samples are indicated in Table 1. In addition, the size of the sludge flocs was measured using a semi-automatic stereomicroscope (Leica M205FA, Leica Microsystems CMS GmbH, Wetzlar, Germany) equipped with a high-resolution digital colour camera (Leica DFC310FX; 1.4 Mpixel, CCD, Leica Microsystems CMS GmbH, Wetzlar, Germany), using ImageJ (Confocal UniOvi ImageJ) software.

2.3. Treatment of Sludge Samples for MP Analysis

All distilled water and reagents used (Fenton’s reagent and ZnCl2 solution) were previously filtered through a glass microfiber filter (pore size of 0.7 μm, Whatman, Florham Park, NJ, USA) to avoid MP contamination. A 200 g sewage sludge sample (wet weight) was placed in a beaker. The sample was then oxidized for 24 h at room temperature by adding 30 mL of a 50% H2O2 solution (VWR Chemicals, Briare, France). Subsequently, 40 mL of Fenton’s reagent was added at room temperature for 24 h. Finally, the sample was filtered through an assembled module made of stainless steel (CISA Sieving Technologies, Barcelona, Spain) containing overlapped sieves with mesh sizes of 500, 250, 100, and 20 μm. The solids retained on each sieve were washed away with filtered distilled water and collected into beakers. MPs were separated from the inorganic impurities by flotation using a ZnCl2 solution (d = 1.5 g/mL, 97% purity, VWR Chemicals, France). The resulting supernatants were then vacuum-filtered using glass microfiber filters (0.7 μm pore, Whatman, USA) [3].

2.4. Mixing–Settling Experiments

Experiments were carried out using the Flocculation Tester JLT6 (VELPS Scientifica, Usmate Velata, MB, Italy). It is equipped with 6 positions for glass beakers, a digital display, an electronic speed regulation system (10–300 rpm), and a programmable timer (0–99 h). To evaluate the effect of the TSS concentration on MP retention efficacy, samples prepared with different thickened sludge:water ratios were supplemented with field-obtained MPs (collected from secondary sludges; see Table S1) so that the initial MP concentrations were within the same order in all cases (240–440 MPs/L). Two types of experiments were carried out:
(a)
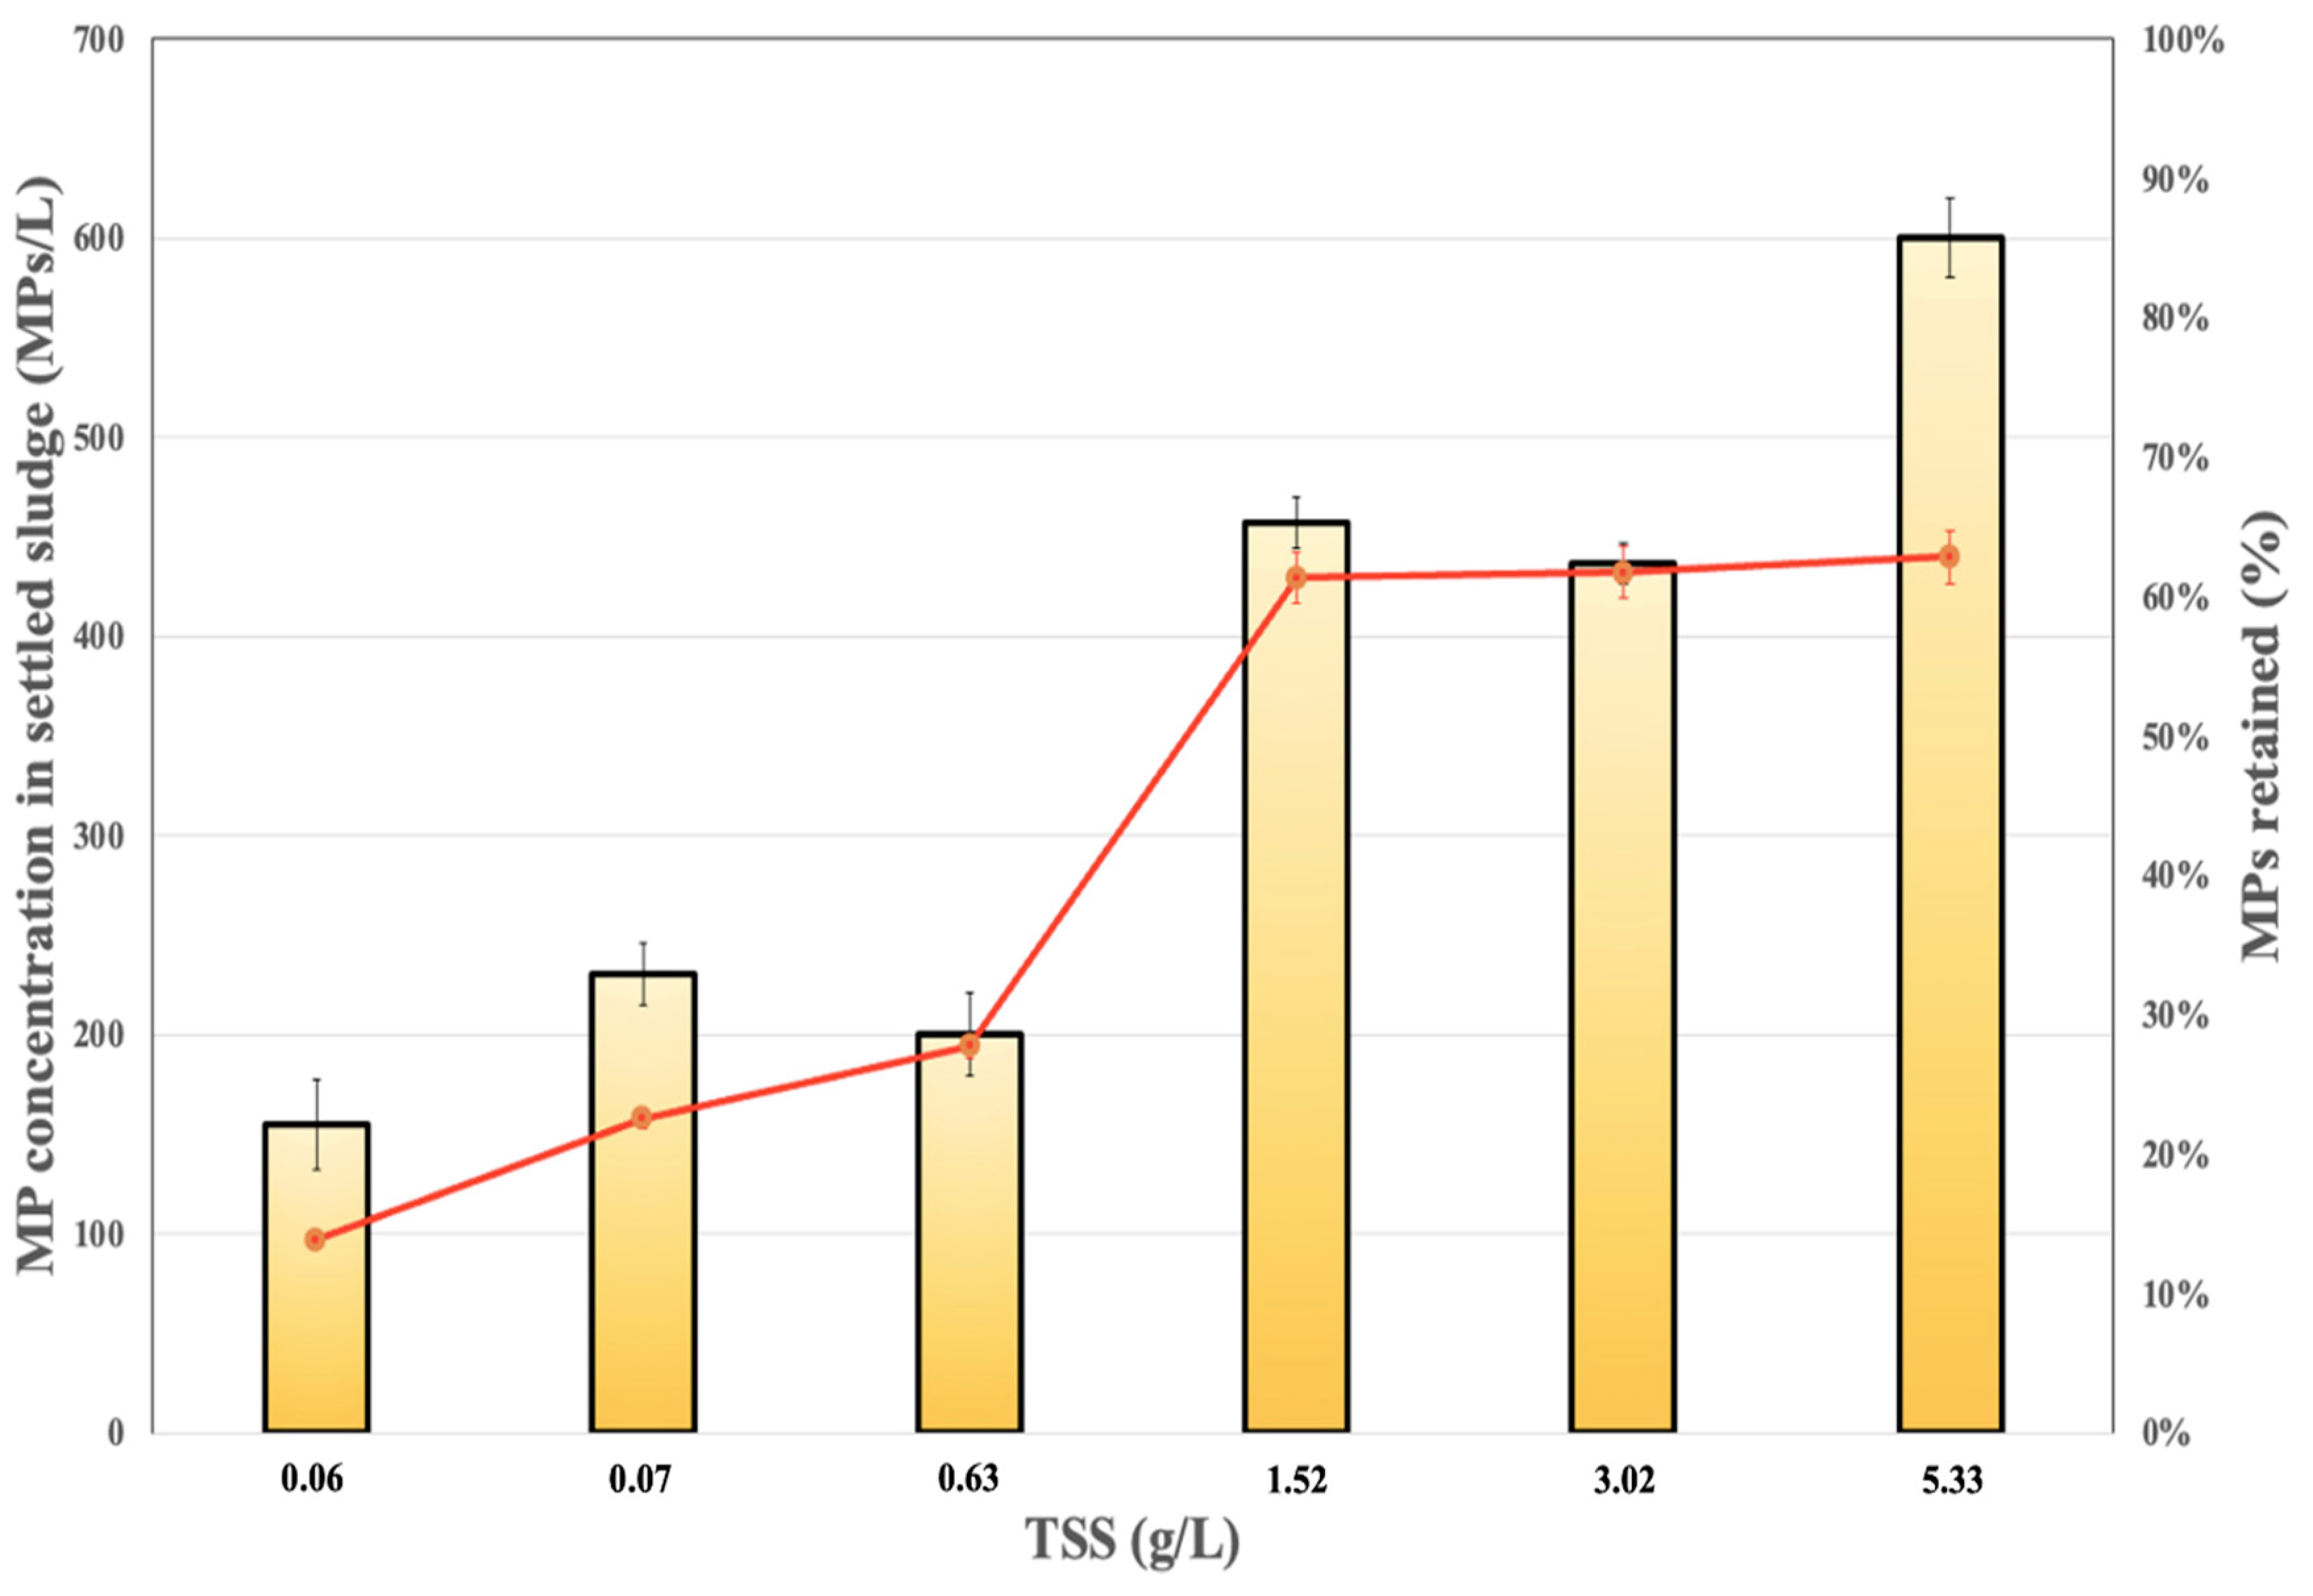
To test the effect of solid concentration, different sludge:water ratios were used. Six different weights of sewage sludge (1, 5, 10, 25, 50, and 100 g) were diluted with 500 mL of filtered distilled water (enriched with field-obtained MPs, within the range of 120 to 220 MPs) and were shaken for 30 min at 30 rpm. Afterward, the samples were left to rest for 3 h to favour the sedimentation process, and the supernatant was collected. The settled sludge and the supernatant were then treated following the same experimental procedure described in Section 2.3.
(b)
To test the effect of adding a coagulant (FeCl3, 5%, Sigma Aldrich, Steinheim, Germany) and a flocculant (non-ionic granular PAM, 5 ppm, Thermo Scientific, Shangai, China), the same sludge:water ratio was used [25,26,27]. Specifically, 10 g of sewage sludge was diluted with 500 mL of filtered distilled water (enriched with field-obtained MPs, ranging from 164 to 174 MPs). Subsequently, 10 mL of coagulant and 10 mL of flocculant were added to two glass beakers containing the diluted sludge. A 5% solution of FeCl3 (97%, Sigma-Aldrich, Germany) was used as the coagulant, while a 5ppm solution of non-ionic granular PAM (97.5%, Thermo Scientific, China) was used as the flocculant. Jar test experiments and the sample collection were carried out as described above.
The field-obtained MPs used to enrich the suspensions were isolated from thickened sludge collected in the DAF thickener of the studied WWTP (data available in Table S1). The MPs isolated from these samples were obtained by recovering them from the glass microfiber filters following the protocol described by [29].

2.5. Microplastic Analysis

Filters with MPs, obtained as described in Section 2.3, were examined using a semi-automatic stereomicroscope (Leica M205FA) equipped with a high-resolution colour digital camera (Leica DFC310FX; 1.4 Mpixel, CCD), and the number of MPs in each sample was obtained (objective 1x, zoom 34x, and work distance of 61.5 mm) so that the MP concentrations in the original samples could be calculated. In addition, ImageJ software (Confocal UniOvi ImageJ, LAS V4.0 Leica Application Suite, Version 4.0.0) was used to estimate the size of fibres and fragments.
The chemical composition of the MPs was determined using a µ-FTIR microscope (Perkin Elmer Spotlight 200i FTIR spectrophotometer, Springfield, IL, USA) by the Molecular Spectroscopy Unit of the Autonomous University of Madrid (UAM). The analysis process involved preparing supports transparent to infrared radiation (KBr pellets), placing MPs on them, and analysing them by transmission. An automated analysis of the generated IR spectra was performed by comparing the results with a spectral database stored in the aforementioned equipment, which contains about 36,000 spectra of different compounds. The analysis of the MPs was carried out under the following measurement parameters: number of scans (30), resolution (16 cm−1), spectral range (550–4000 cm−1), and aperture of the infrared beam (20 × 100 microns, for MP-fibres and 50 × 50 microns for MP-fragments).

2.6. Quality Assurance and Quality Control (QA/QC)

From MP sampling to quantification, the quality assurance and control (QA/QC) procedures were performed following methodologies described by several authors [30,31]. Key QA/QC measures include filtering chemical reagents before use, avoiding polymeric materials in the lab, and using glass microfiber filters (0.7 μm pore). Good field and laboratory practices (GLP) were followed from sampling to analysis in order to reduce secondary contamination from MPs that were present in the air, on surfaces, and ultimately on the equipment. For this reason, the use of plastic was minimized during the sampling and processing of samples and, where this was not possible, procedural blanks were employed. In this regard, it was considered that plastic bottles and Falcon tubes used during sampling and sample treatment might release a certain number of MPs. To avoid any interference in the analyses, control experiments were conducted in both cases. The average MP concentrations emitted from plastic bottles and Falcon tubes were 3.33 ± 0.58 MPs/L and 3.67 ± 1.15 MPs/L, respectively. These contributions represented less than 1% of the total MP concentration used in each experiment and were considered negligible, consistent with previous studies [5]. Finally, all experiments and analyses were carried out in duplicate.

3. Results and Discussions

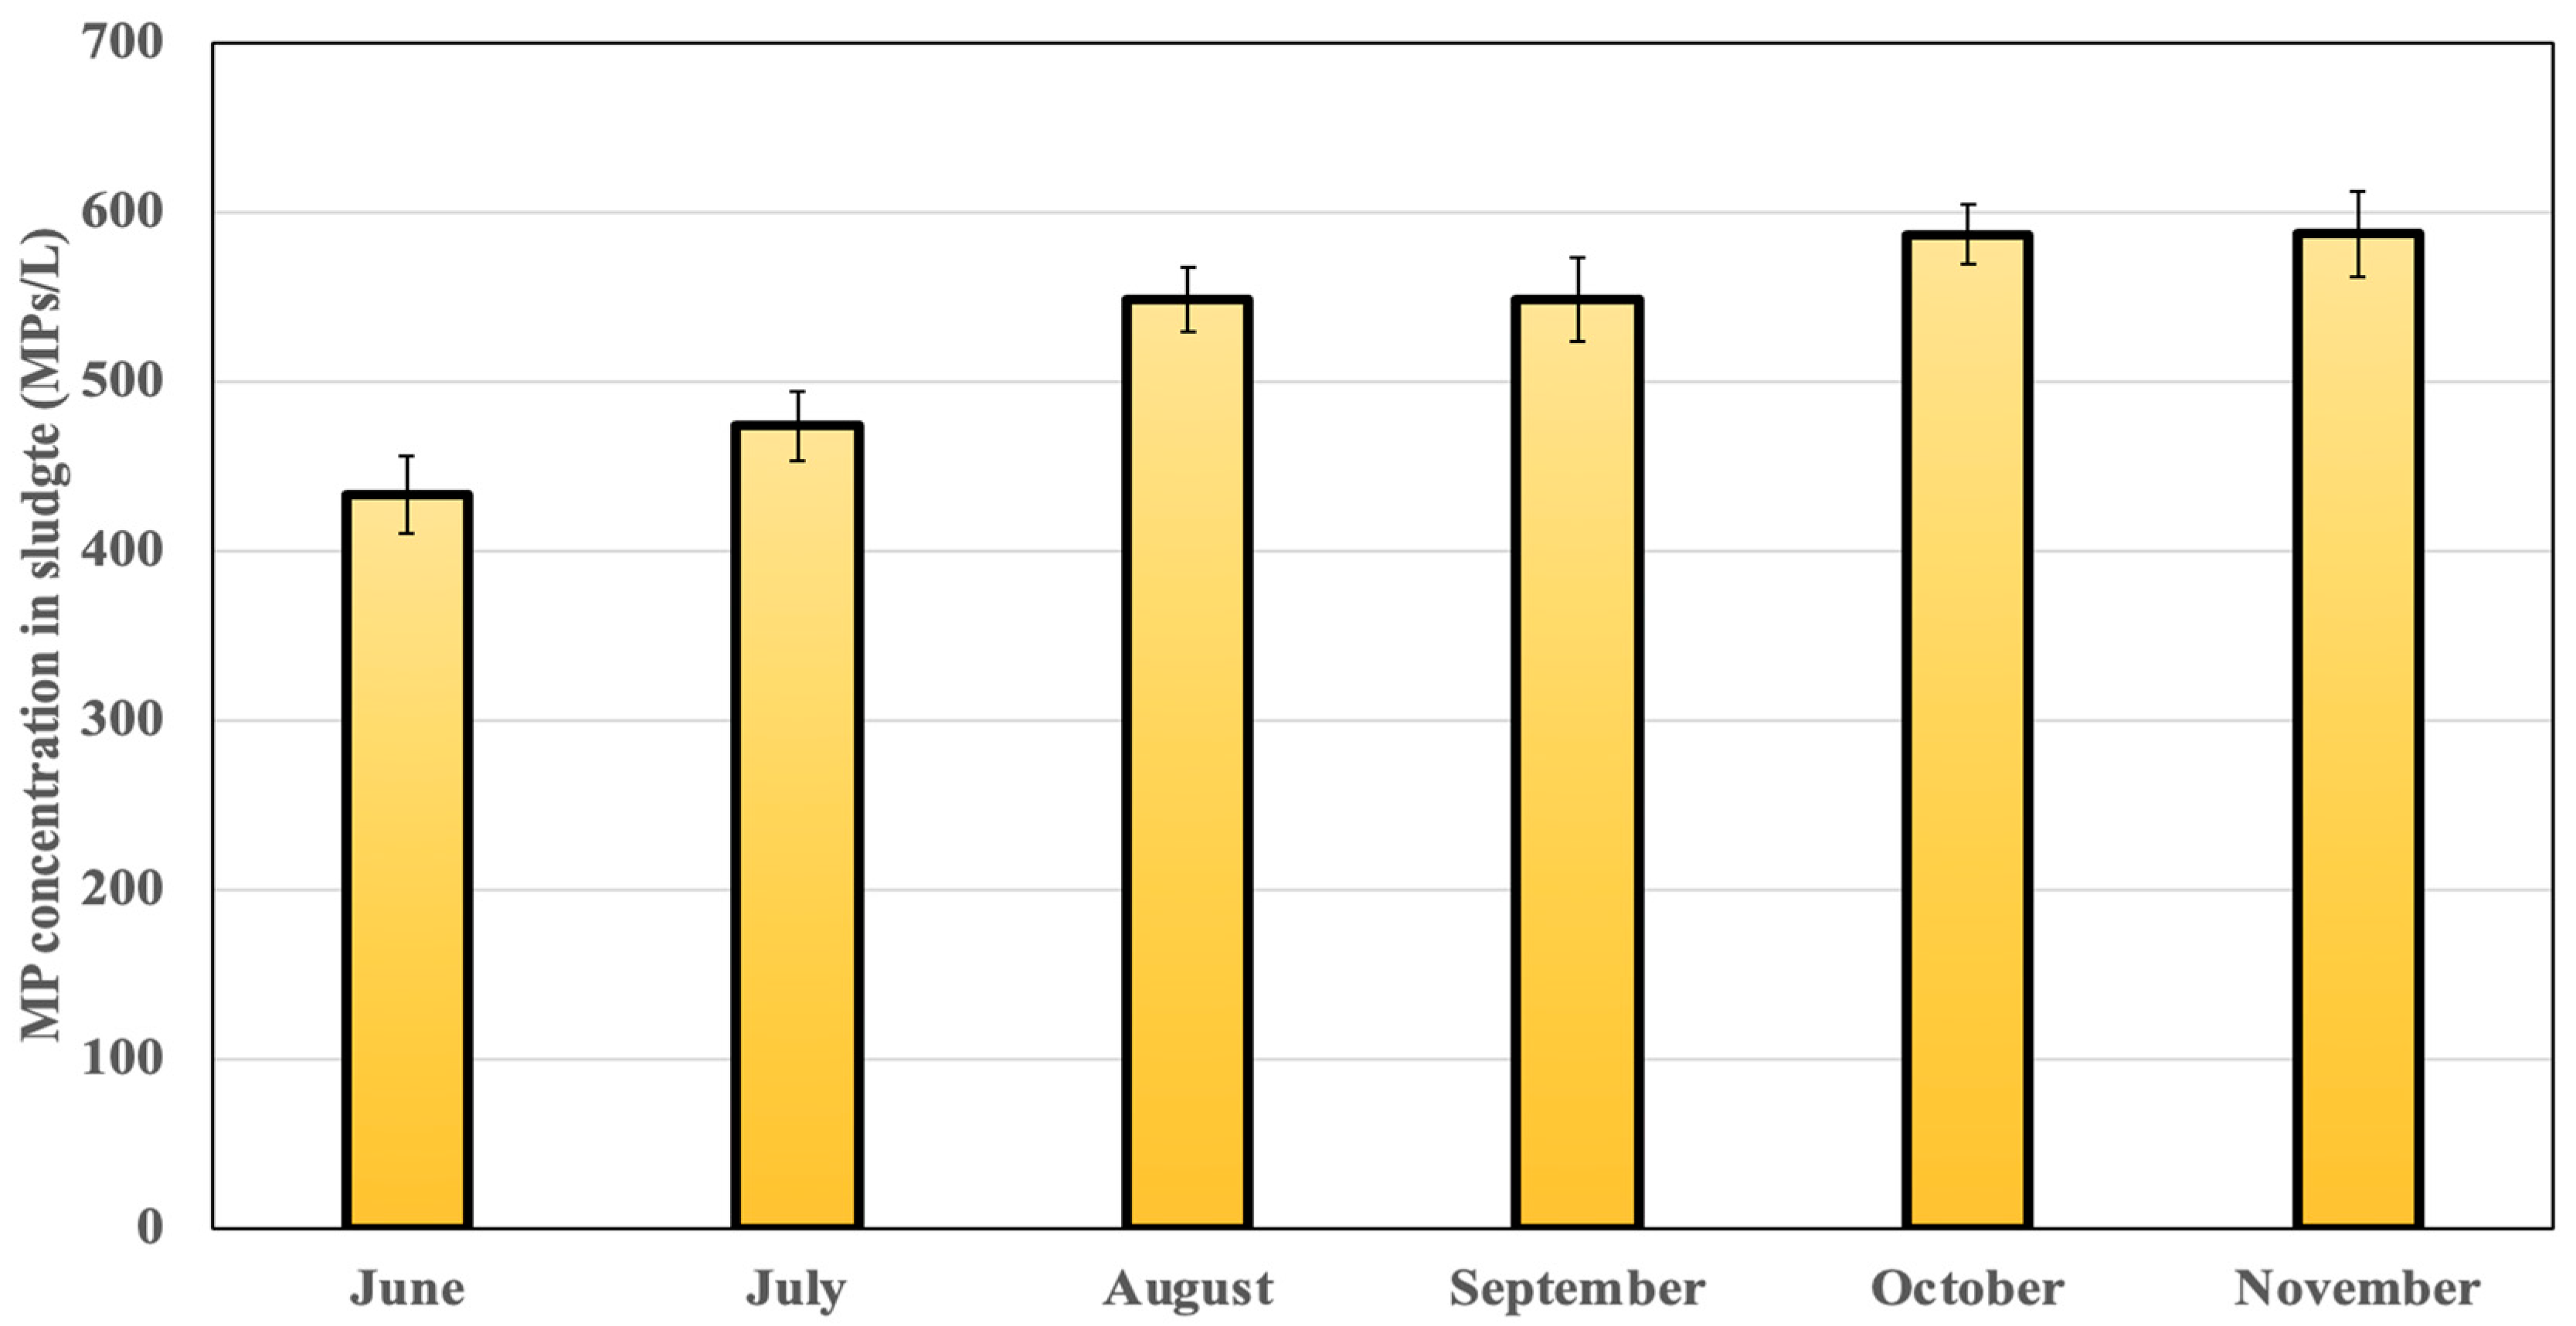
3.1. Native MPs in the Sewage Sludge

Figure 2a shows a micrograph of the sewage sludge used for the experiments. The flocs observed are generally irregular in shape (Figure 2b), which may be due to the presence of filamentous organisms that provide networks for the floc structure [32]. EPS are a fundamental component of activated sludge flocs, and they are present in both the internal and external layers, playing a fundamental role in the properties of the sludge, such as flocculation, sedimentation, and subsequent dehydration [33,34]. As can be seen, some MPs are incorporated into the sludge flocs, primarily through the EPS [35]. The presence of MPs influences the buoyancy and settling speed of the flocs [33,36].
To determine the size of the flocs (before the experiments), 150 sludge flocs from the sludge sample were measured, obtaining an average value of 486 ± 267 μm (Figure 3), with a size distribution ranging from 51 to 1811 μm. Specifically, it was found that most of the flocs were within the 300–600 μm range, consistent with previous studies [37]. The size of the flocs depends on the specific treatment the sludge undergoes and is highly influenced by physical parameters such as rotation speed, hydrodynamic properties, etc. [38]. It is noteworthy that most of the flocs have similar sizes to those commonly reported for MPs found in wastewater (250–500 μm) [17,29], and it is likely that this facilitates chemical interactions between them, such as Van der Waals forces. As shown in Figure 2, it can be noted that smaller MPs (essentially in the form of fragments) can become trapped inside the flocs, while, in particular, MP fibres can protrude and simultaneously be linked to more than one floc.
The concentrations of native MPs were analysed in the sewage sludge used for the experiments, and they ranged between 433 and 587 MPs/L, with an average value of 530 ± 63 MPs/L. As can be seen in Figure 4, the differences observed between months were minimal, allowing for comparisons between experiments carried out with sludge samples taken on different dates. These values fall within the range of MP concentrations found for thickened secondary sludge samples, i.e., 138–8120 MPs/L [39,40,41,42,43,44].
The MPs found in the sludge samples were characterized according to their shape, size, and chemical composition (Figure S1). The sum of fibres and fragments accounted for 64.3 ± 8.7% and 34.0 ± 9.0% of the total MPs, respectively, whereas films and microbeads represented only 1.0 ± 0.6% and 0.7 ± 0.8%, respectively (Figure S1a). These results are consistent with the data reported in most published studies [1,2,45,46]. In particular, values exceeding 96% of the sum of fibres and fragments were found by [7,47]. The size distributions for the analysed MPs were as follows: 20.8 ± 2.5% (>500 μm), 42.2 ± 3.3% (500–250 μm), 27.0 ± 2.2% (250–100 μm), and 10.0 ± 2.1% (100–20 μm) (Figure S1b). The majority (69%) of all identified MPs were within the 500–100 μm range, in accordance with previous studies [1,48]. MP fibres found in wastewater and sludge are typically derived from textiles, such as synthetic apparel and textiles like acrylic, RA, PEST and PA. Small fibres are released during the washing of synthetic materials and wind up in the wastewater. However, MP fragments are mainly produced when bigger plastic particles (such as disposable bags and packaging) break down into smaller pieces as the result of biological, chemical, and mechanical processes [1,3,36].
Regarding chemical composition, 14 different polymers were detected in the sludge samples, of which the most abundant were the following: rayon (RA) 39%, polyethylene (PE) 19%, polyester (PEST) 9%, cellulose (CE) 9%, polyethyleneimine (PEI) 8%, polyacrylamide (PAM) 3%, polyethylene terephthalate (PET) 3%, acrylic fiber (orlon) (AF) 3%, and polyamide (PA) 2%. The following polymers each accounted for around 1%: epoxy resin (ER), ethylene-vinyl acetate (EVA), polyacrylic acid (PAA), polyether ester urethane (PEEU), and polyether urethane (PEUR) (Figures S2 and S3). According to previous studies, up to 30 distinct polymers have been identified in WWTPs, with their presence primarily influenced by the origin of the wastewater. The sources of MPs in sewage sludge include synthetic textiles, pieces of broken plastic, paints, and agricultural waste. It has been reported that the presence of MPs made of PE, PET, PEST PA, and RA, identified in the present study, is typically associated with wastewater of domestic origin and the release of these polymers from garments during household washing [1,19,36]. The MP removal efficiency is directly influenced by MP size and polymer density. MPs that are less dense than wastewater, such as semi-crystalline PE and PP, progress through the WWTP’s stages and are typically discovered in the final effluent [19]. In the secondary sludges samples analysed in this study, PP was not found, despite being a common polymer.
Conversely, during the various WWTP treatments, MPs that are denser than wastewater become less abundant in the water and more readily settle into secondary sewage sludge [1,49,50]. This is the case for RA, PEST, CE, PEI, PAM, PET, AF, and PA, which were the most frequently found MPs in the sludge samples analysed here. Additionally, MPs are mainly found in sludge as fibres and fragments, and, since fibres are often longer, the percentage of fibres in the sludge can impact the size distribution of the MPs [50]. Furthermore, the growth of microbial communities and the adsorption of substances, such as fats and oils, on the MPs can change their apparent density, therefore affecting their tendency to settle or float [51]. This may be the case for the PE-MPs found in the sludges.

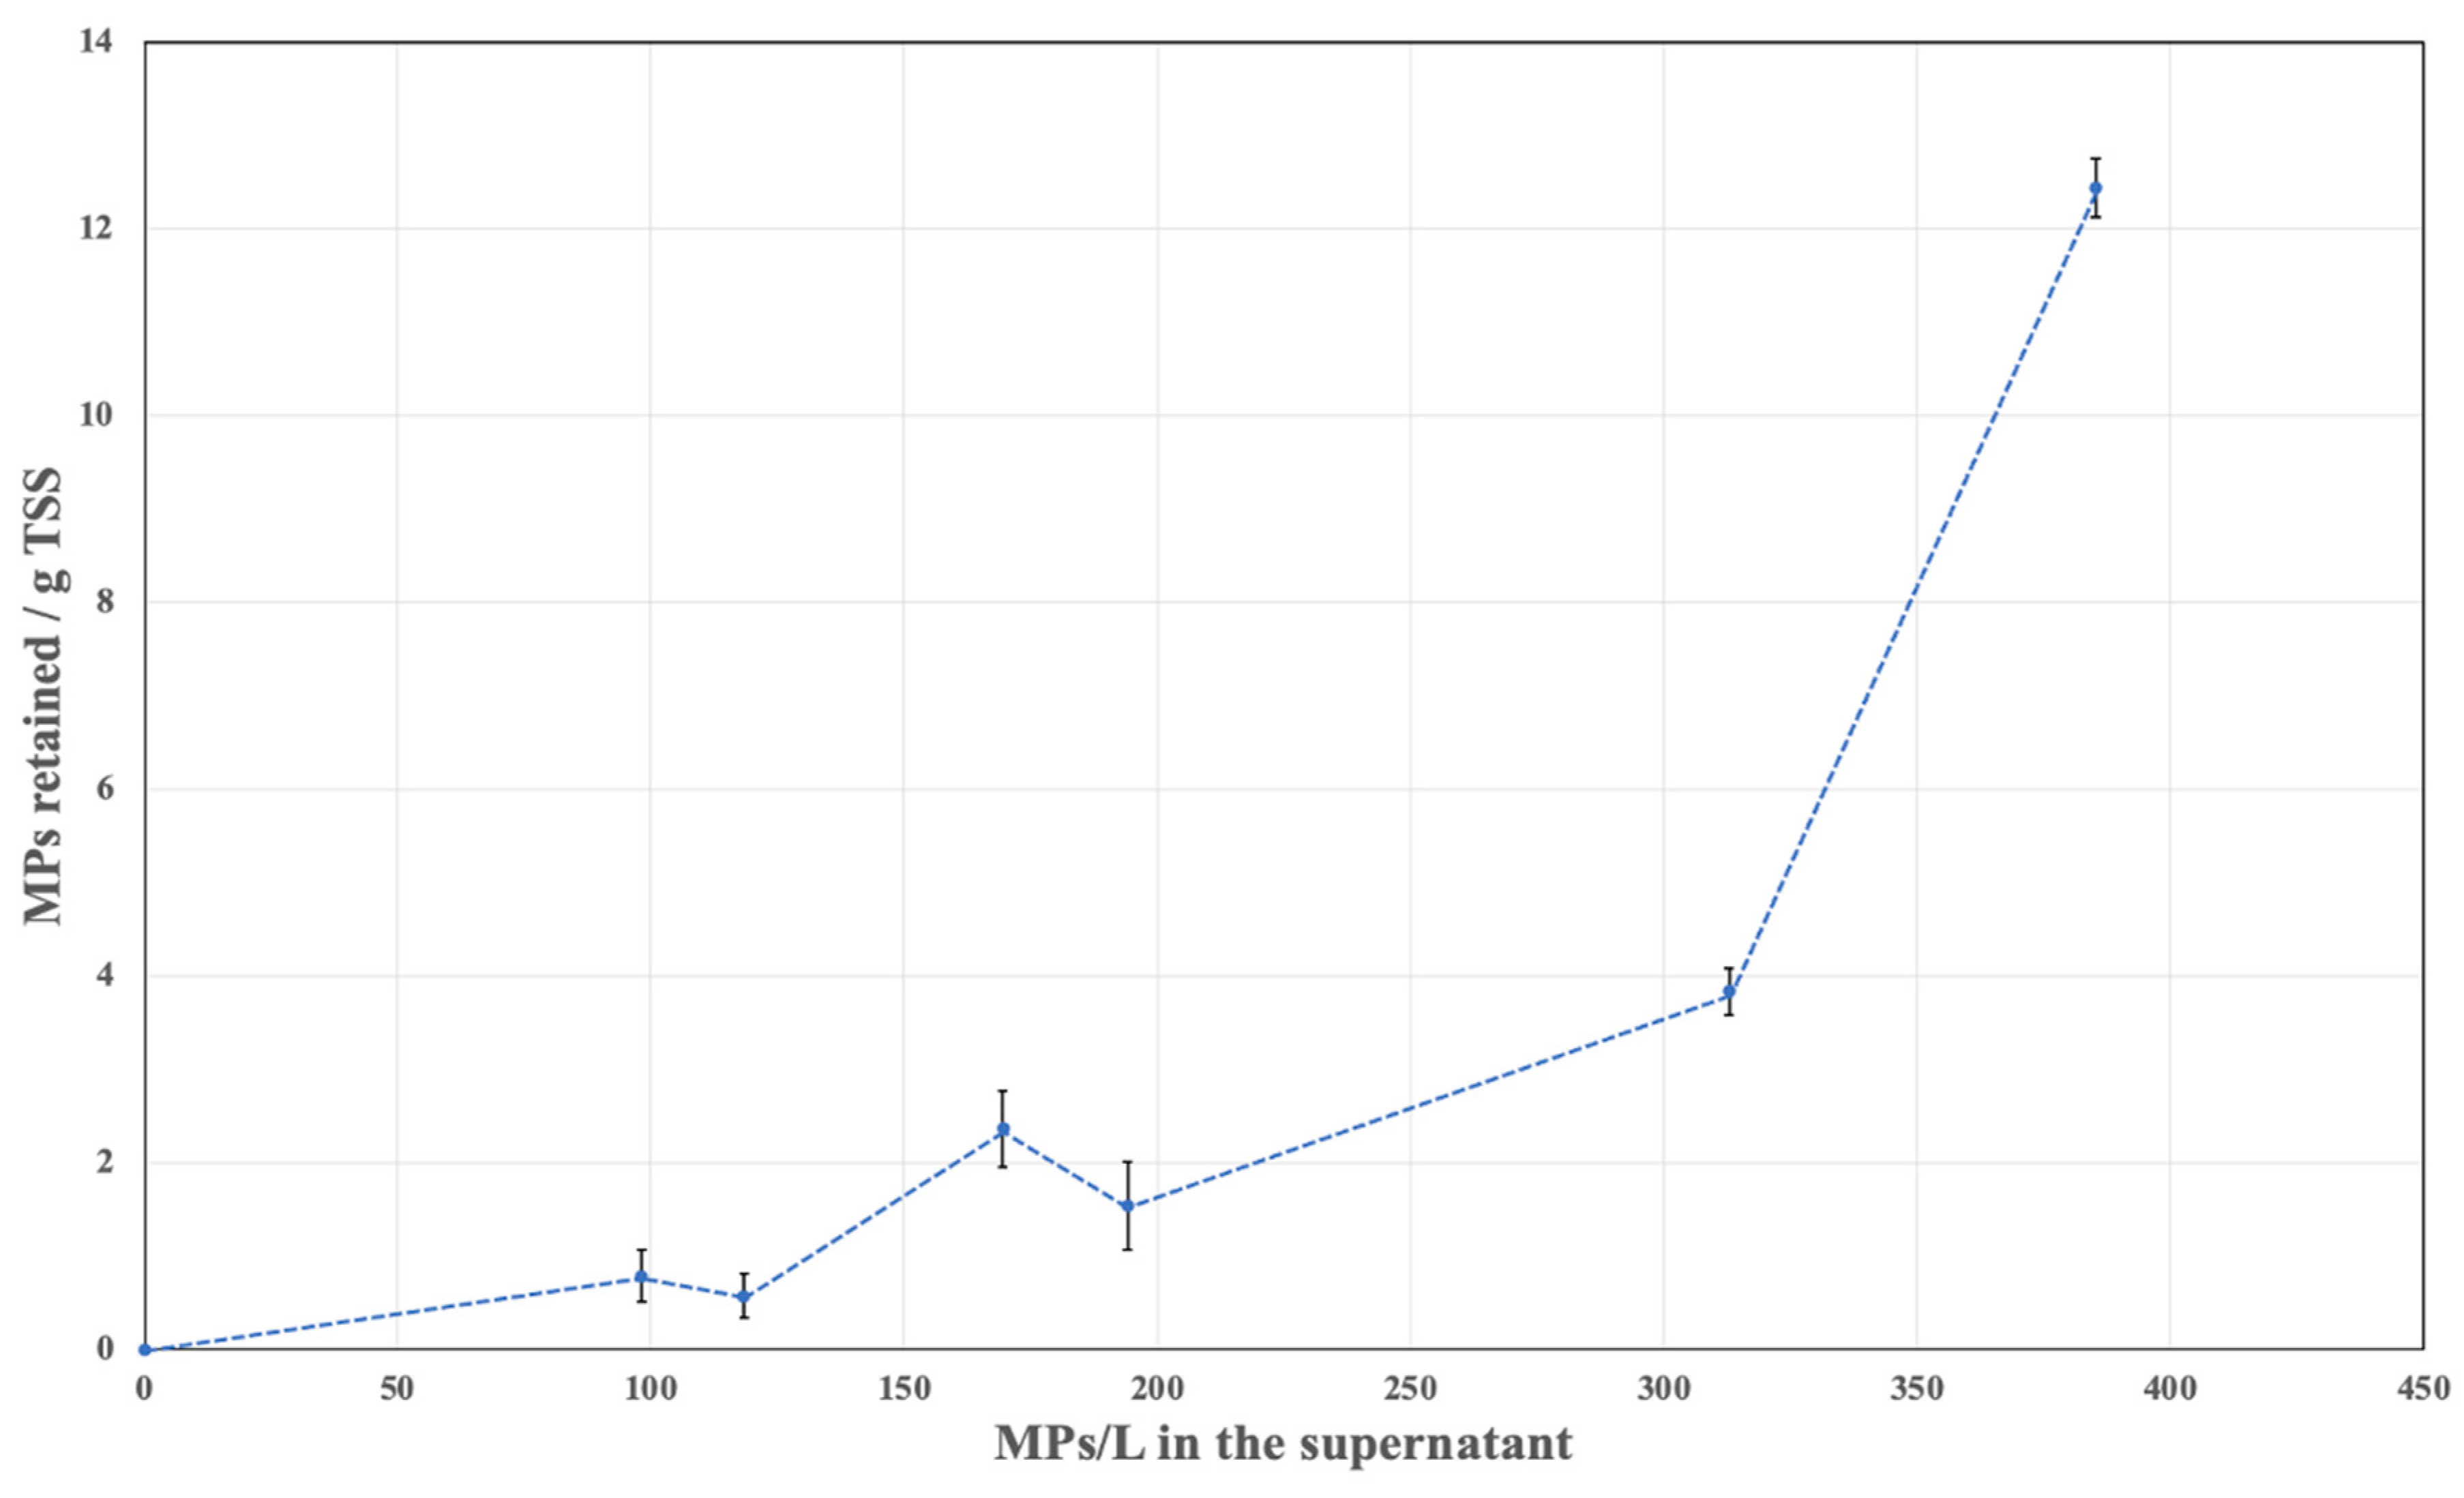
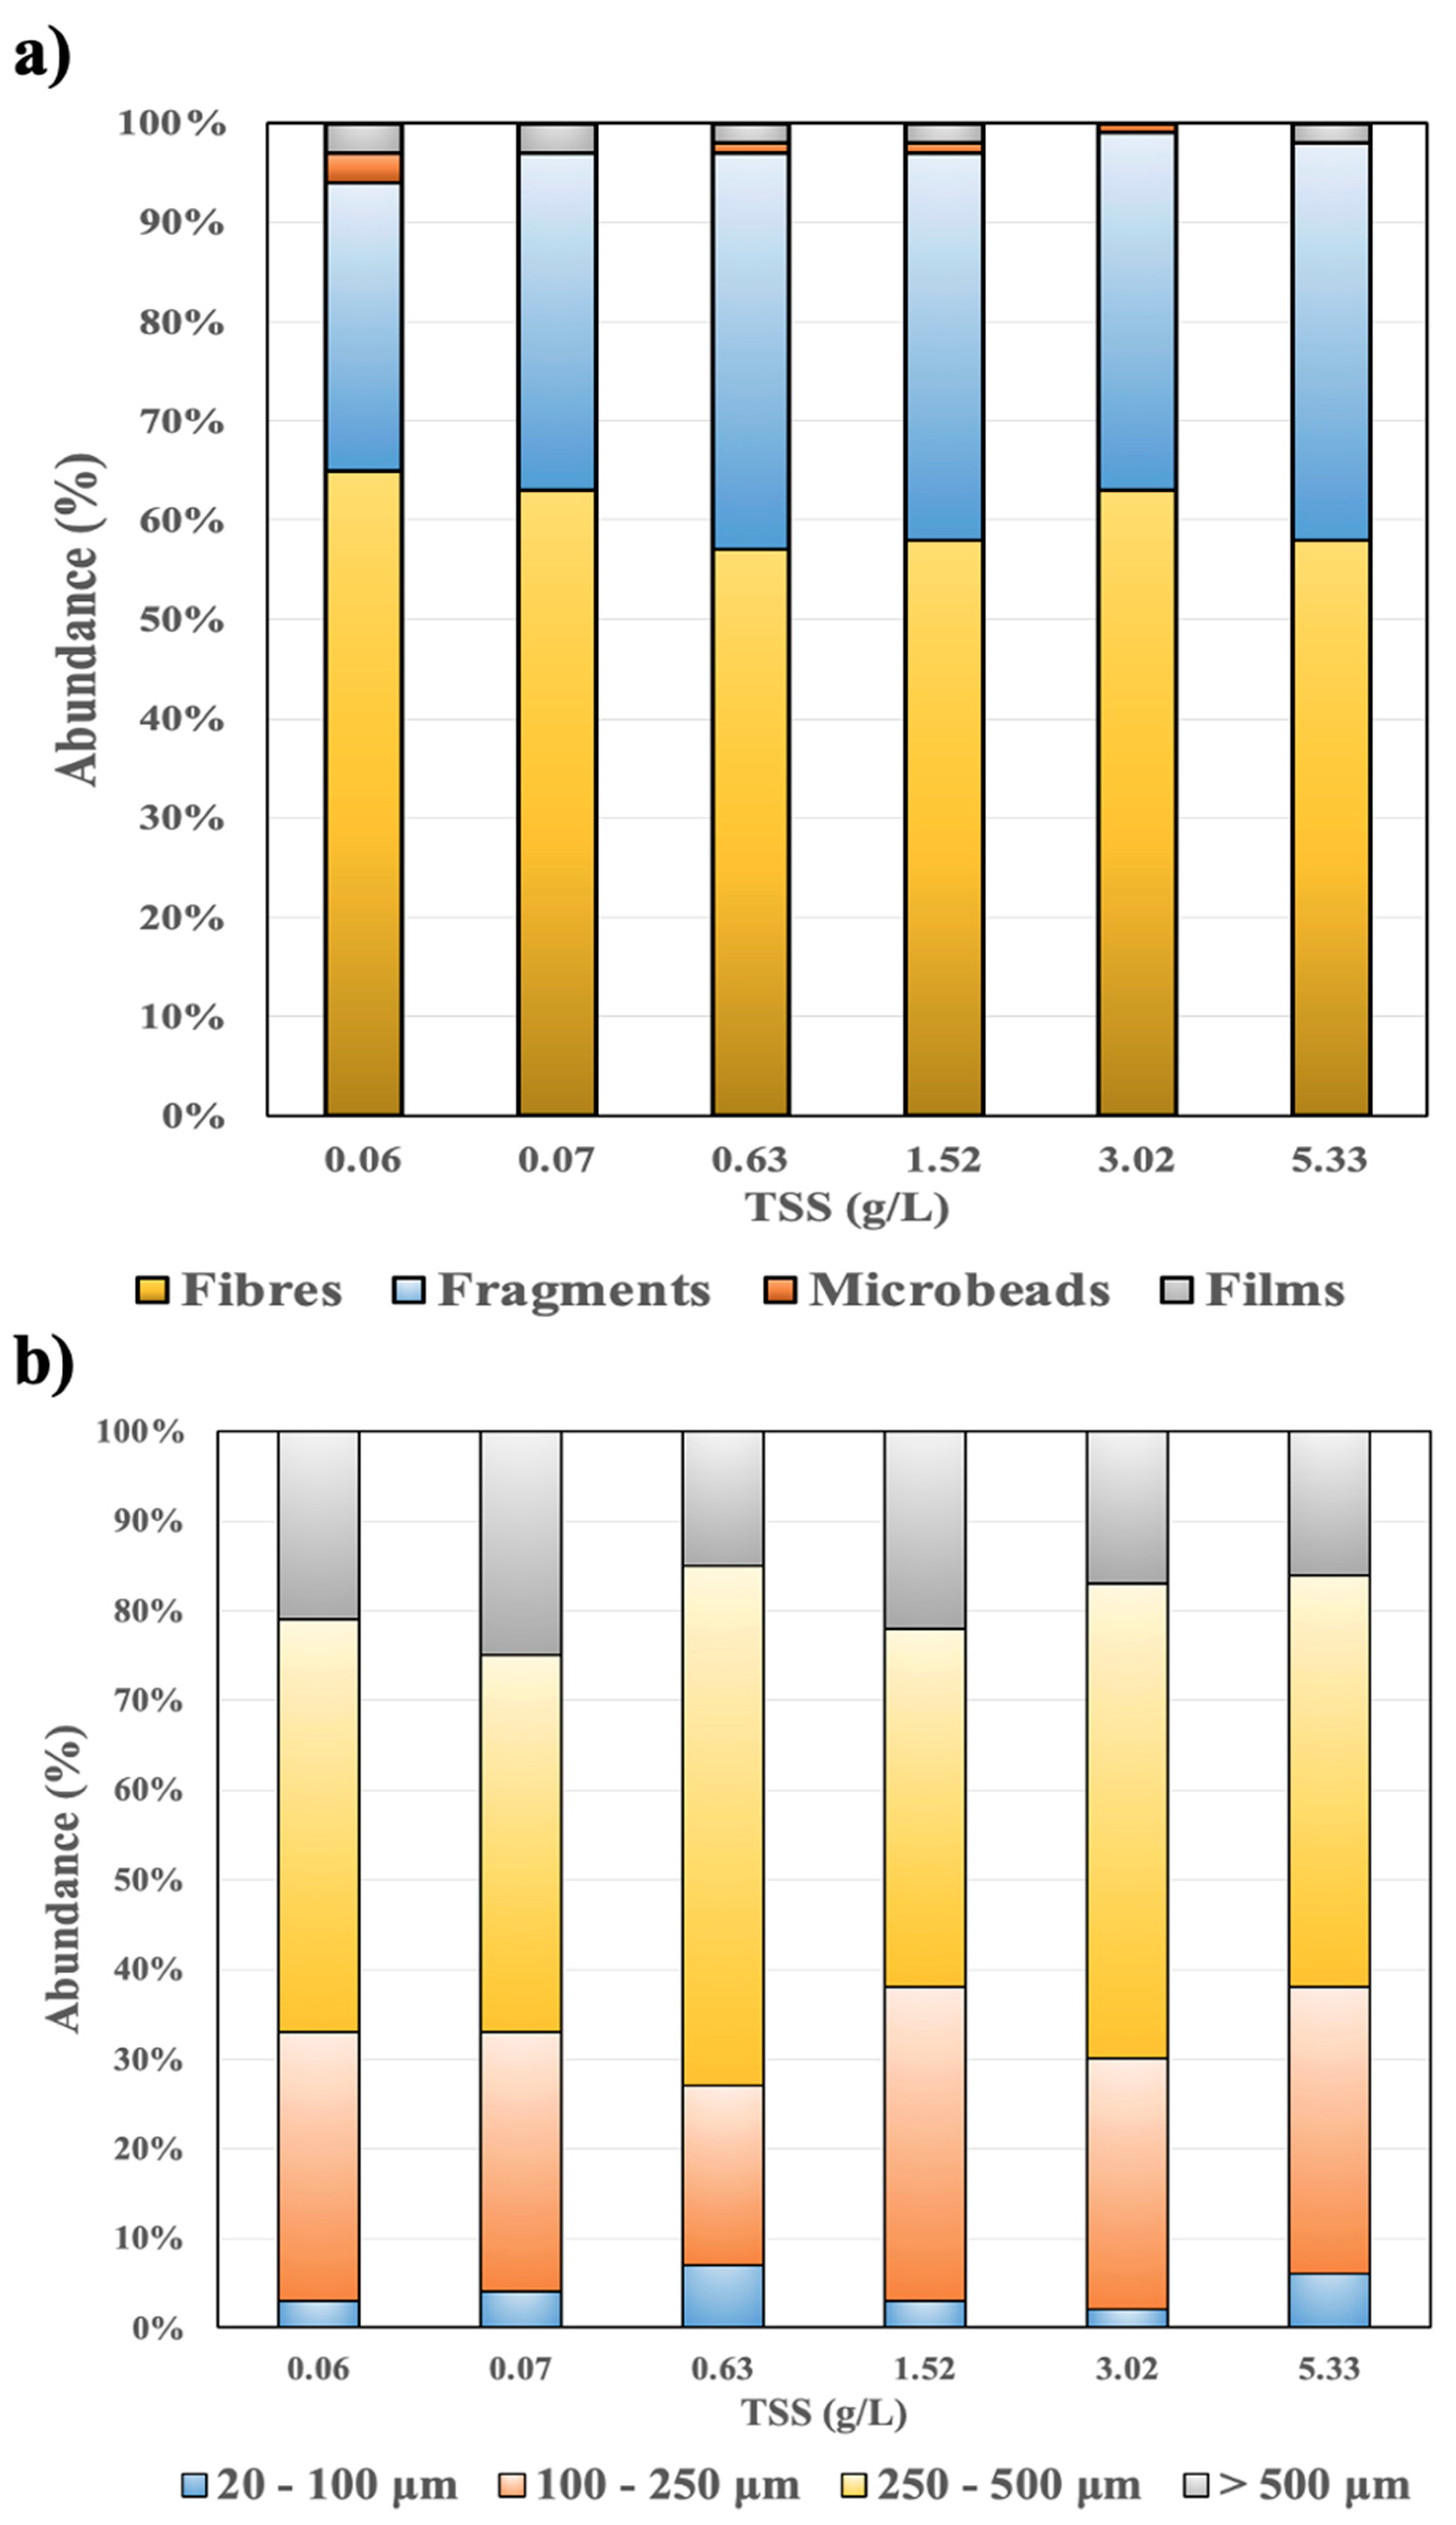
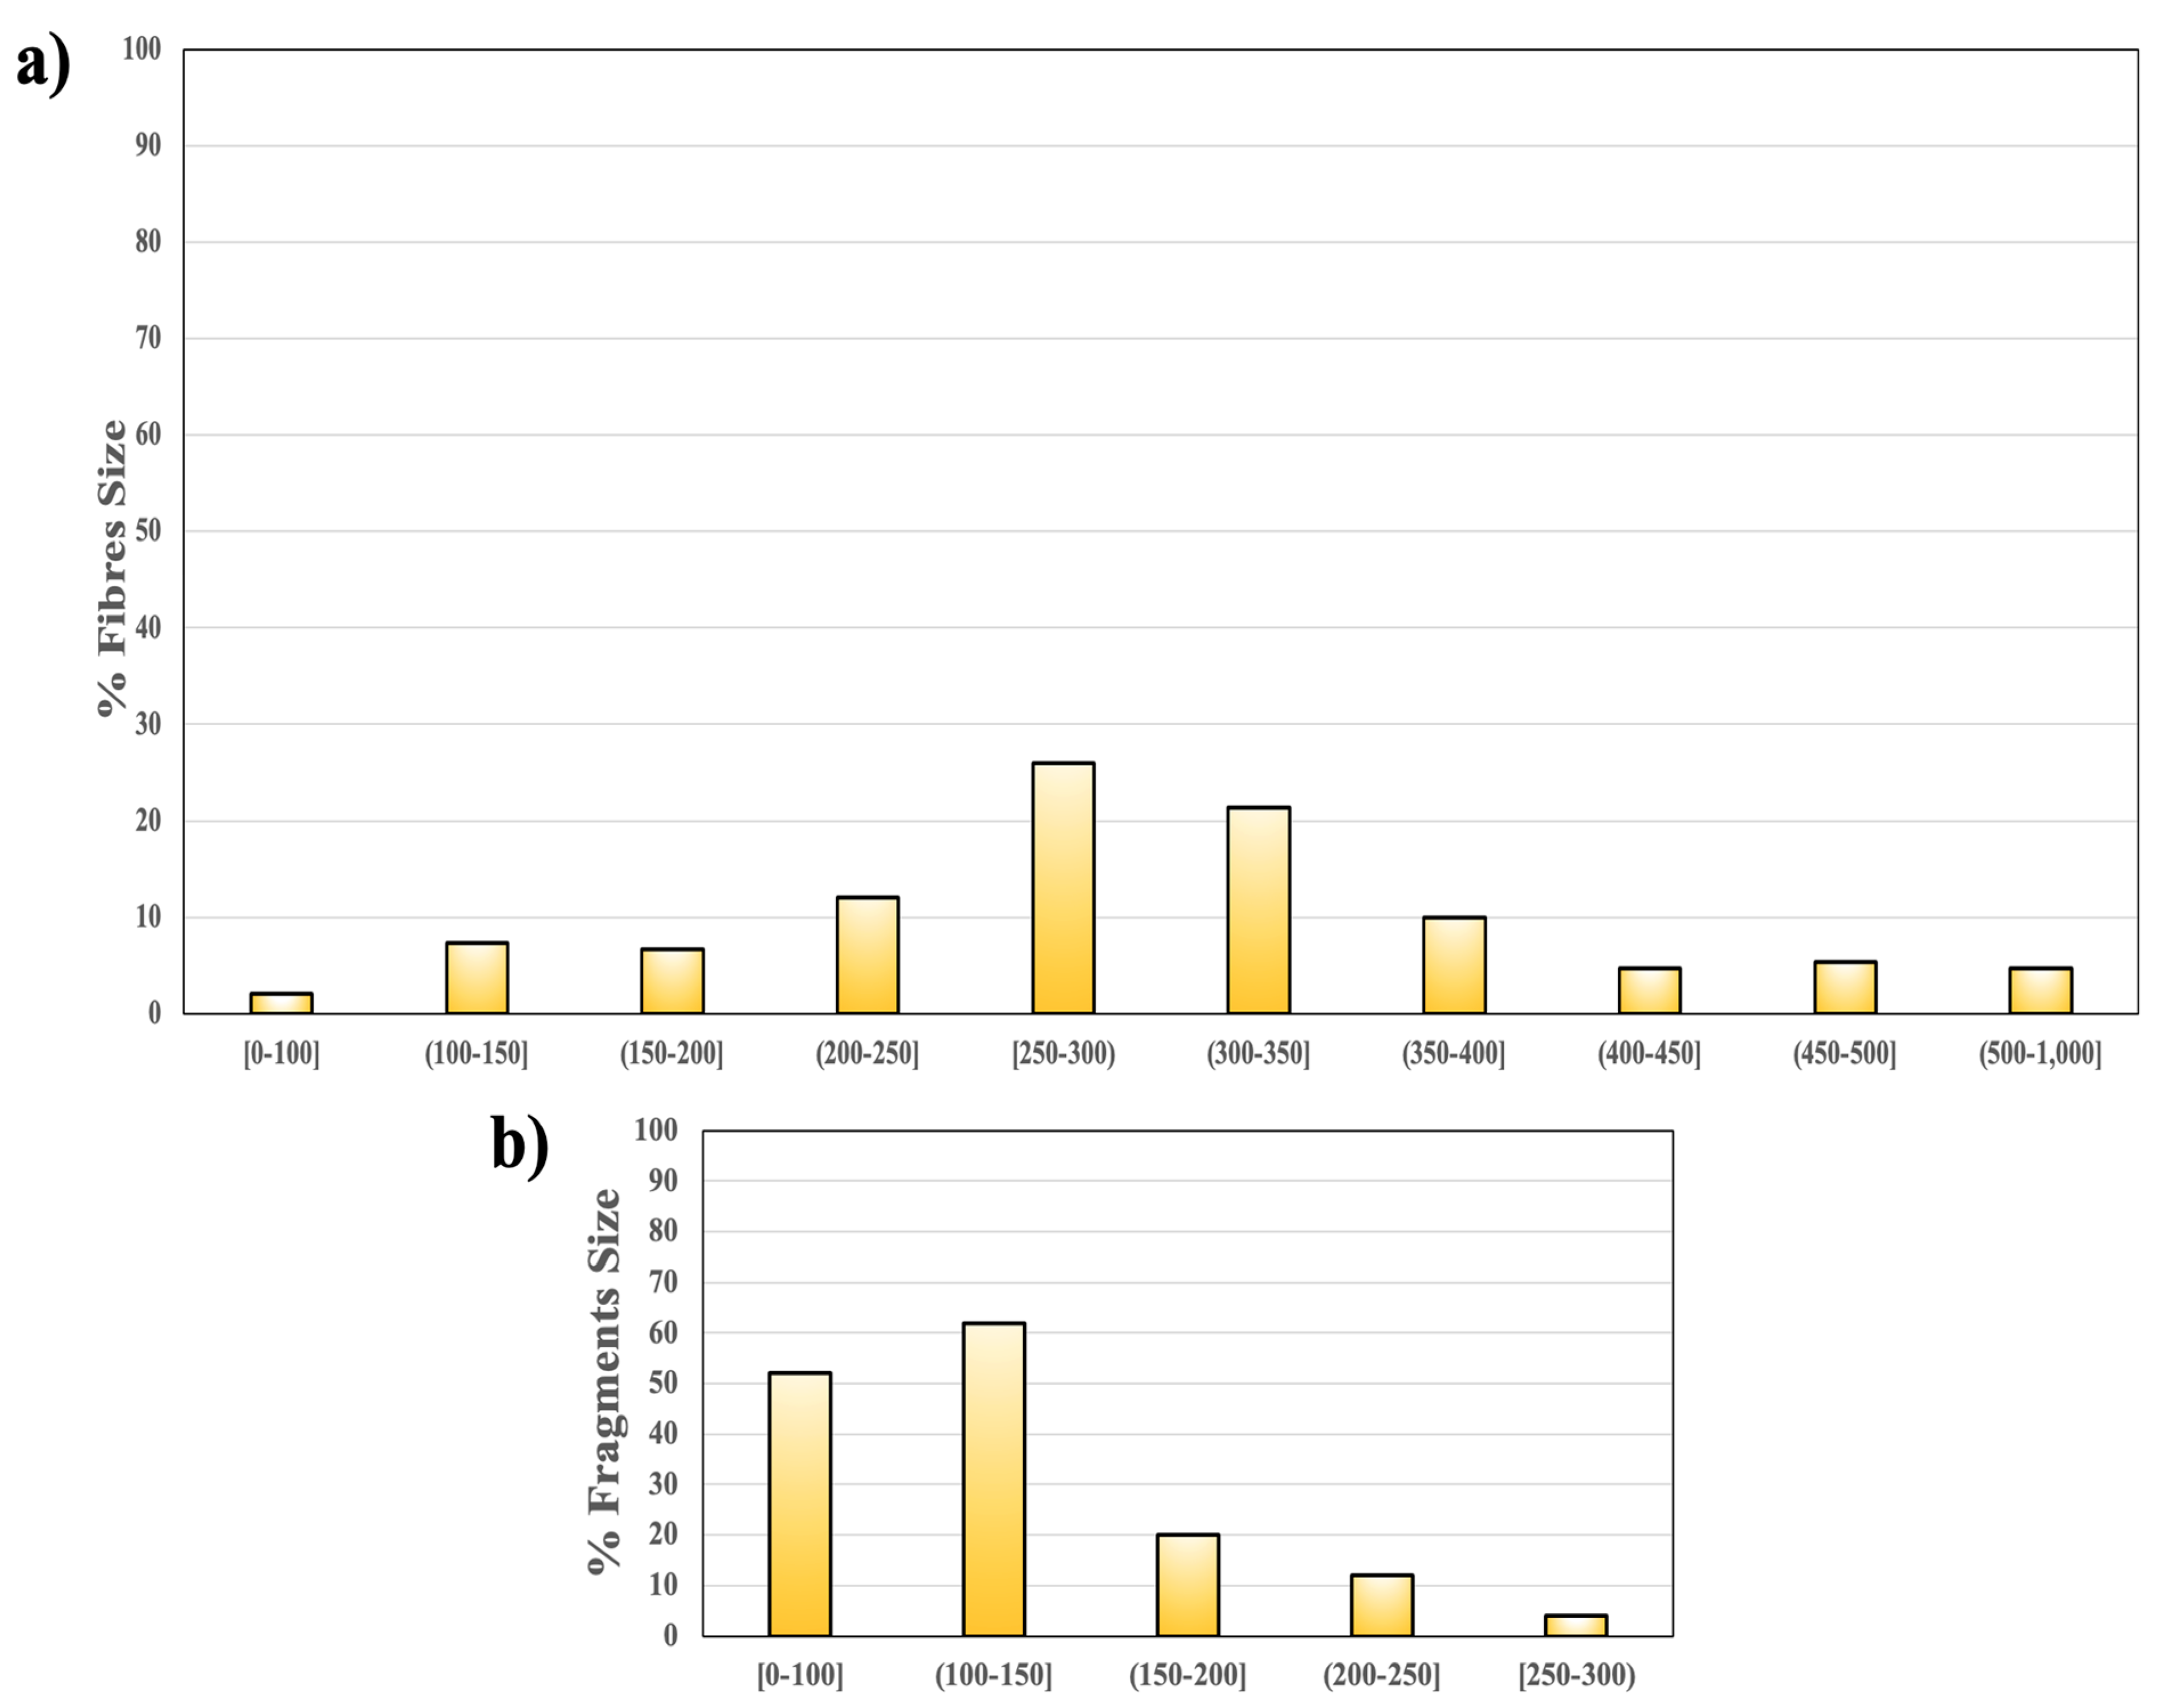
3.2. Effect of Solid Concentration on MP Retention

Different concentrations of sludge (1, 5, 10, 25, 50, and 100 g) were mixed with 500 mL of filtered distilled water, resulting in TSS concentrations between 0.06 and 5.33 g/L, a range that included the values usually employed in activated sludge systems. The retention effectiveness vs. TSS concentration and MP concentration in the settled sludge following agitation–settling studies is shown in Figure 5 (the bars indicate MP concentrations and the red lines indicate percentages of retained MPs). As can be observed in Figure 5, at the lowest TSS concentration (0.06 g/L), the percentage of MPs retained in the settled sludge was only 13.8%. This value increased sharply with TSS concentration until reaching a value of 61% for a TSS concentration of 1.5 g TSS/L. Using higher sludge concentrations did not significantly improve MP retention (62% for 5.3 g TSS/L). Therefore, sludge saturation is observed, where it is not capable of capturing any more MPs, regardless of whether the amount of sludge is increased or not. The heterogeneity in terms of MP concentration retained in different types of sludge, depending on the type of WWTP and the treatments, prevents the establishment of a clear, significant correlation for MP retention in sewage sludge [50,52].
Figure 6 illustrates how the quantity of MPs retained per mass of TSS increases with the MP concentration in the supernatant. If this process was compared to an adsorption process, according to Giles’s classification, this curve could be considered the first part of an S-shaped isotherm with one inflection point [53]. The S curve usually indicates the presence of mesopores and appears when the adsorbate–adsorbent attraction is moderate and there is a strong competition for substrate sites [53,54,55]. However, more phenomena than just sorption processes are involved. The retention of MPs in sewage sludge happens due to the interactions between MPs and flocs during the agitation phase and subsequently in the static sedimentation phase. Intense agitation would be counterproductive, as flocs might disintegrate, causing them to shrink and release more MPs. Consequently, slow agitation was used for the experiments to allow the flocs to aggregate with one another or with suspended solids or MPs. This way, MPs can be dragged by the flocs or, depending on their size, even be encapsulated within the flocs. Fibres, which are usually longer than other shapes, can come into contact with multiple flocs simultaneously, increasing the settling rate. Larger flocs are preferable for MP retention because, if the size of the floc is too small, the removal of MPs can be inhibited [27].
As shown in Figure 7a, the MPs retained in the settled sludge were mainly fibres and fragments, with similar percentages across all the experiments, i.e., average values of 60.7 ± 3.4% and 36.3 ± 4.3%, respectively. Compared to the shape distribution obtained in the initial sewage sludge, the percentage of fibres slightly decreased (from 64% to 61%), while the percentage of fragments slightly increased (from 34% to 36%). Other authors have observed that fragments have a greater tendency to be trapped by the sludge [1,7,45,50]. However, in the present study, it seems that there is not a significant difference between the percentage of fibres and fragments found in the initial and settled sludges. In addition, MPs isolated from the sludge samples were analysed according to the following size ranges: 19.3 ± 3.9% (>500 μm), 47.5 ± 6.8% (500–250 μm), 29.0 ± 5.1% (250–100 μm), and 4.2 ± 1.9% (100–20 μm) (Figure 7b). The percentage of MP retention in the range between 100 and 500 μm increased by around 7% compared to the initial sewage sludge.
After the pre-treatment (screening and degreasing system) in a WWTP, the majority of MPs contained in the wastewater had a size between 100 μm and 500 μm, which is beneficial for their removal in the biological step (Figure 8) [1,56]. It is noteworthy that the percentage of MPs smaller than 100 μm in the settled sludge was around half of the initial amount, indicating that the efficacy of retaining these smaller MPs is much lower compared to MPs with sizes closer to those of the flocs. The main characteristics of the MPs remaining in the supernatant samples are reported in Table S2. In the tests carried out with coagulant and flocculant agents, it can be observed that fibres and fragments represent around 75% and 20%, respectively, in the supernatant samples. In contrast, fibres and fragments accounted for 59% and 40%, respectively, in the supernatants of samples without chemical treatment. Therefore, it seems that the use of chemical agents improves the removal of fibres. With respect to the average size of the MPs recovered in the supernatant samples, no important differences were observed between the tests with and without chemical agents.

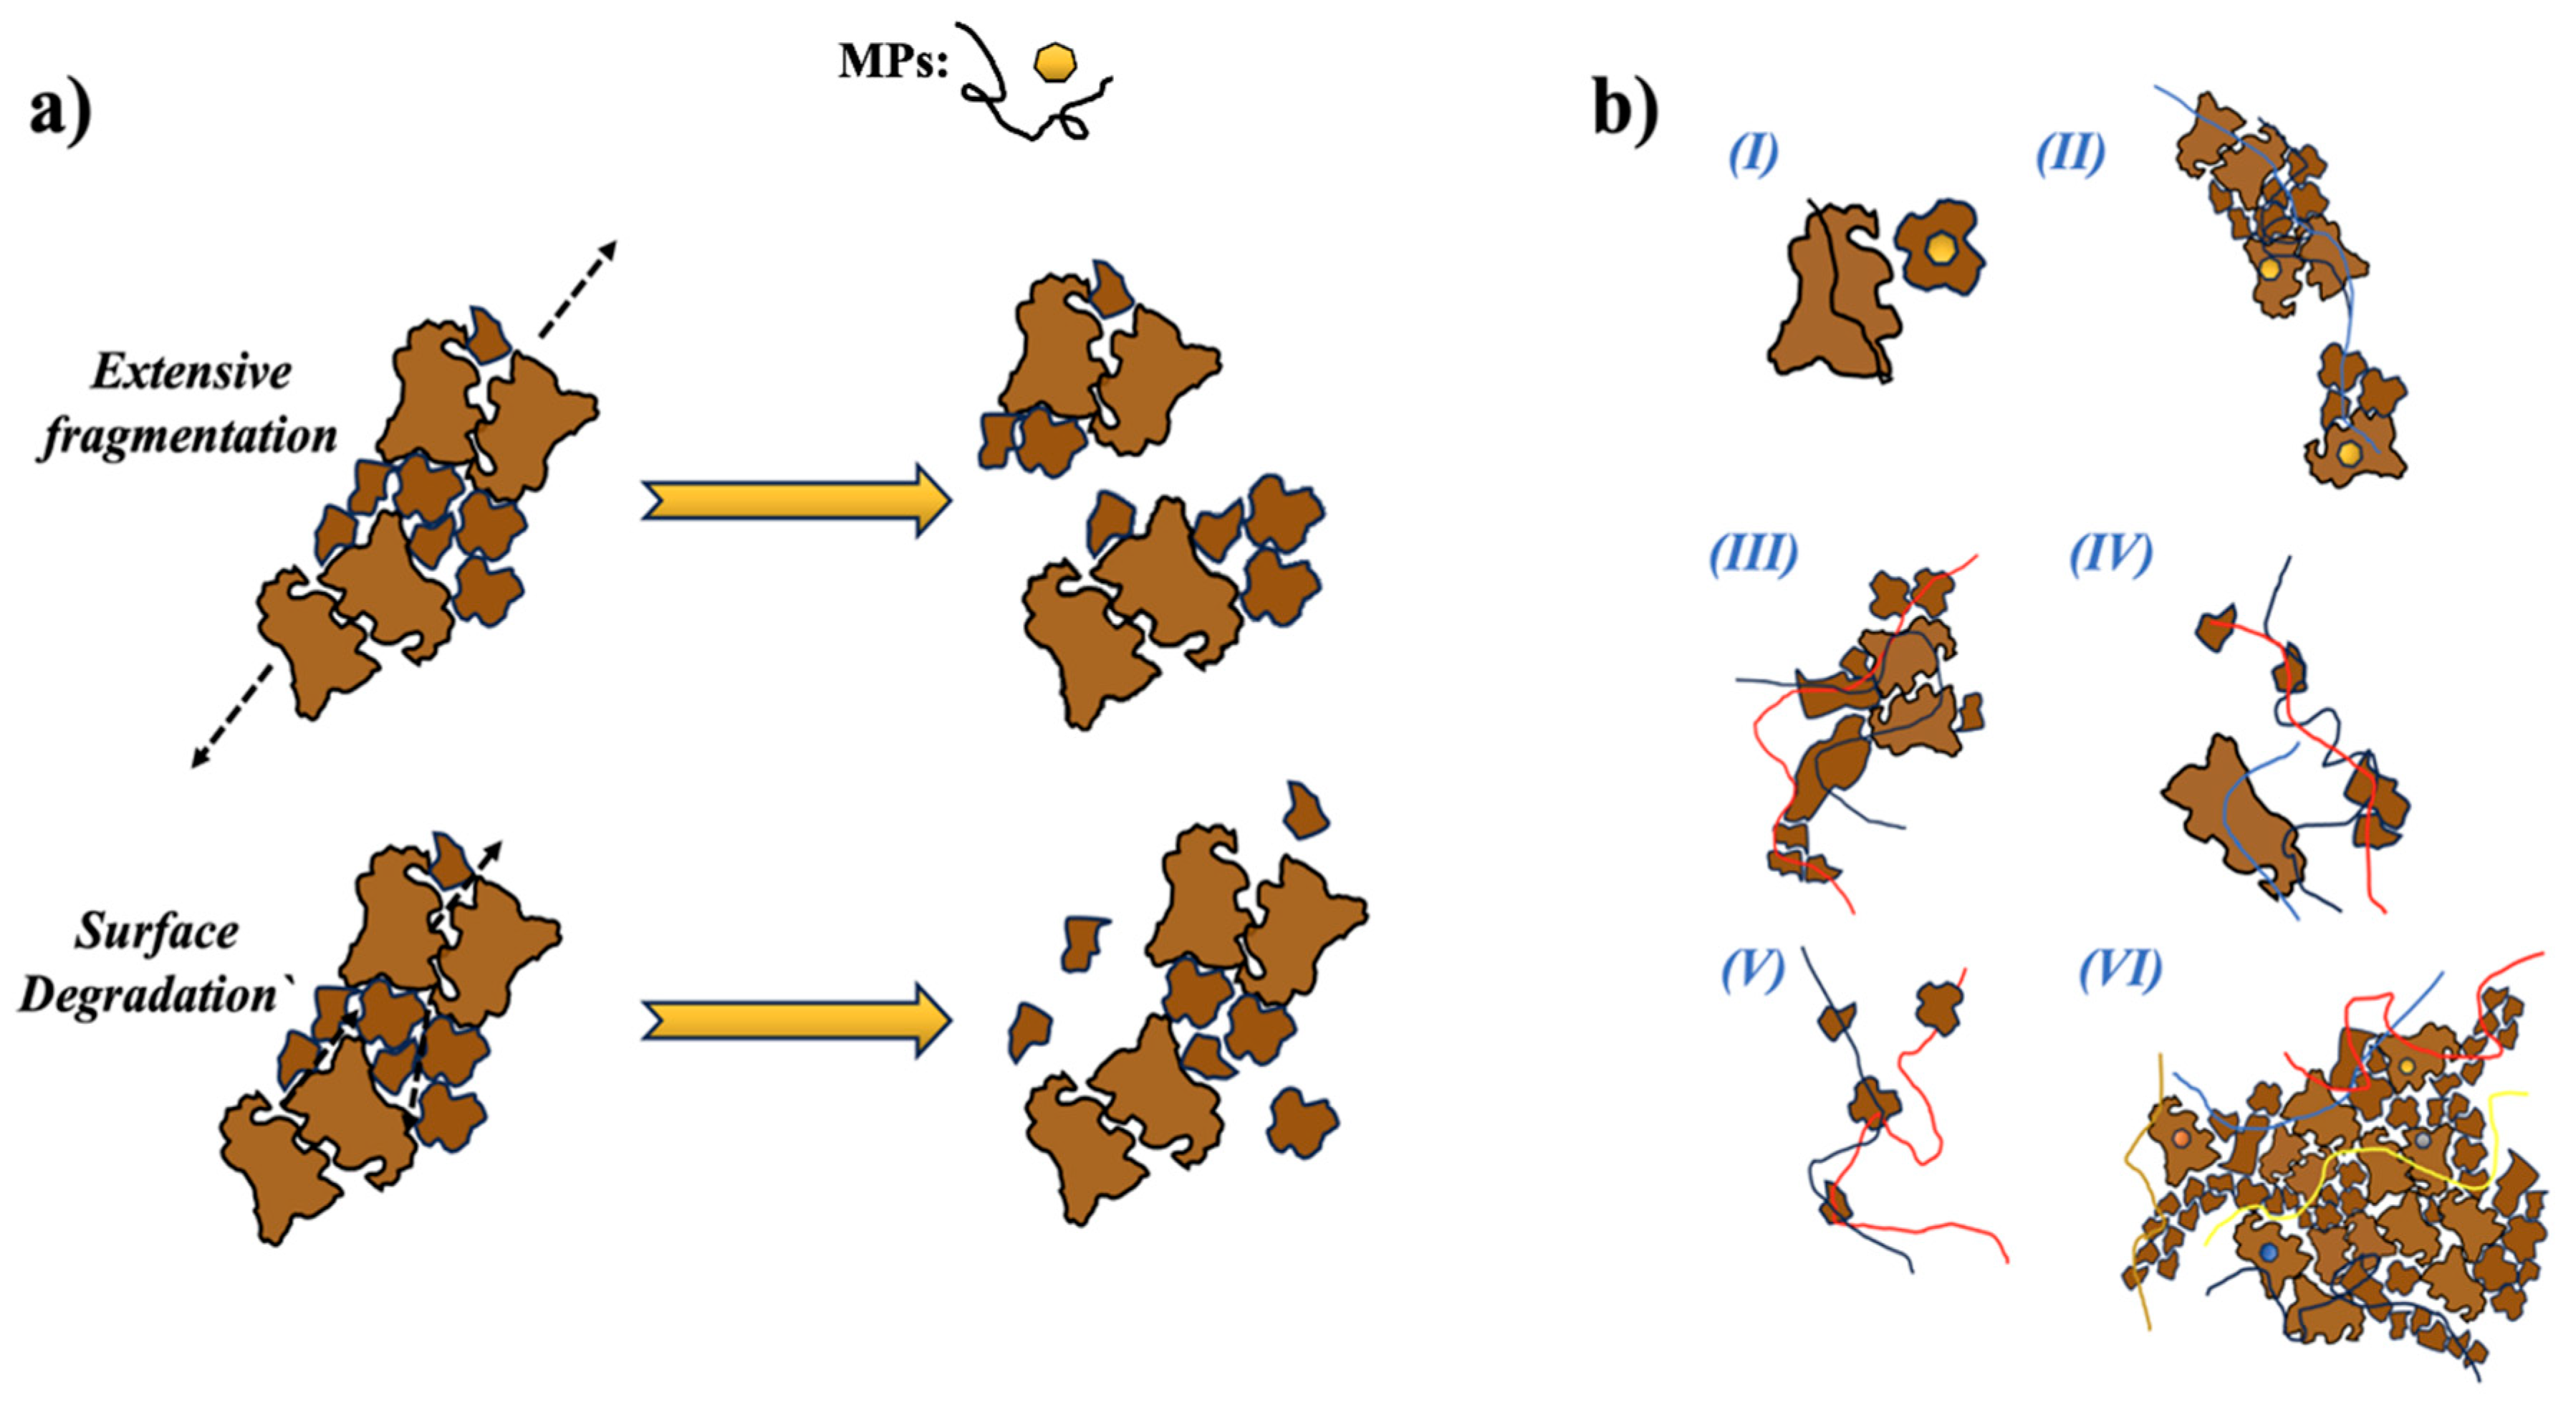
3.3. Floc Stability and MP Entrapment Mechanism

As mentioned above, flocs break up if they are subjected to strong agitation. The floc breakage may occur through erosion and rupture, with the predominant process depending on the floc size in relation to the Kolmogoroff microscale [57]. Therefore, we operated at a low speed of 30 rpm to prevent floc breakage.
Additionally, the stability of the flocs depends on the combination of interactions that bind the bacteria and other components to the flocs. EPS, which make up more than 50% of the organic part of the flocs, are primarily responsible for floc stability [57,58,59]. The three-dimensional EPS network structure that encases the microbial cells and water in the floc creates a gel-like structure that encourages MP aggregation. In particular, it has been reported that MPs are mainly retained in flocs by binding to humic acids, which are part of EPS. Furthermore, it was observed that MPs act as environmental stressors that increase EPS production [34,35]. The presence of MPs in the sludge decreases the size of the flocs and their hydrophobicity and increases their negative zeta potential [13]. Figure 9a shows two possible mechanisms of floc rupture.
As shown in Figure 9b, fibre-MPs and fragment-MPs can interact with flocs in a variety of ways, becoming part of the flocs themselves and influencing the sedimentation rate. Most of the fragments were within the range of 50–150 μm (Figure S4), a smaller size than the flocs after 30 min of stirring at 30 rpm (average size of 387 μm), which is why they were mostly fully contained within the flocs. On the contrary, the length of most of the fibres was within the range of 250–350 μm (Figure 8). This larger size, combined with the gentle stirring (30 rpm), meant that the majority of fibre-MPs were only partially trapped in the flocs. In some cases, the same fibre was trapped by two or more flocs (see types II, III, IV, and V in Figure 9b) resulting in “bridging” that joined different flocs to form a “Pangea shape” macrofloc (see type VI in Figure 9b), which favoured the sedimentation process [60]. Furthermore, the electrostatic repulsion between coexisting MPs could be nullified, thanks to better collision and aggregation of the polymer particles with the sludge flocs [61,62]. In addition to the shape and relative size of the MPs with respect to the flocs, other factors that are expected to affect the phenomenon of entrapment of MPs in flocs include the physicochemical properties of the MPs’ surface and the possible presence of other substances that may facilitate or hinder the interaction. In this sense, it is expected that the use of flocculants and coagulants would result in a better MP removal, although further studies are required to confirm this [63].

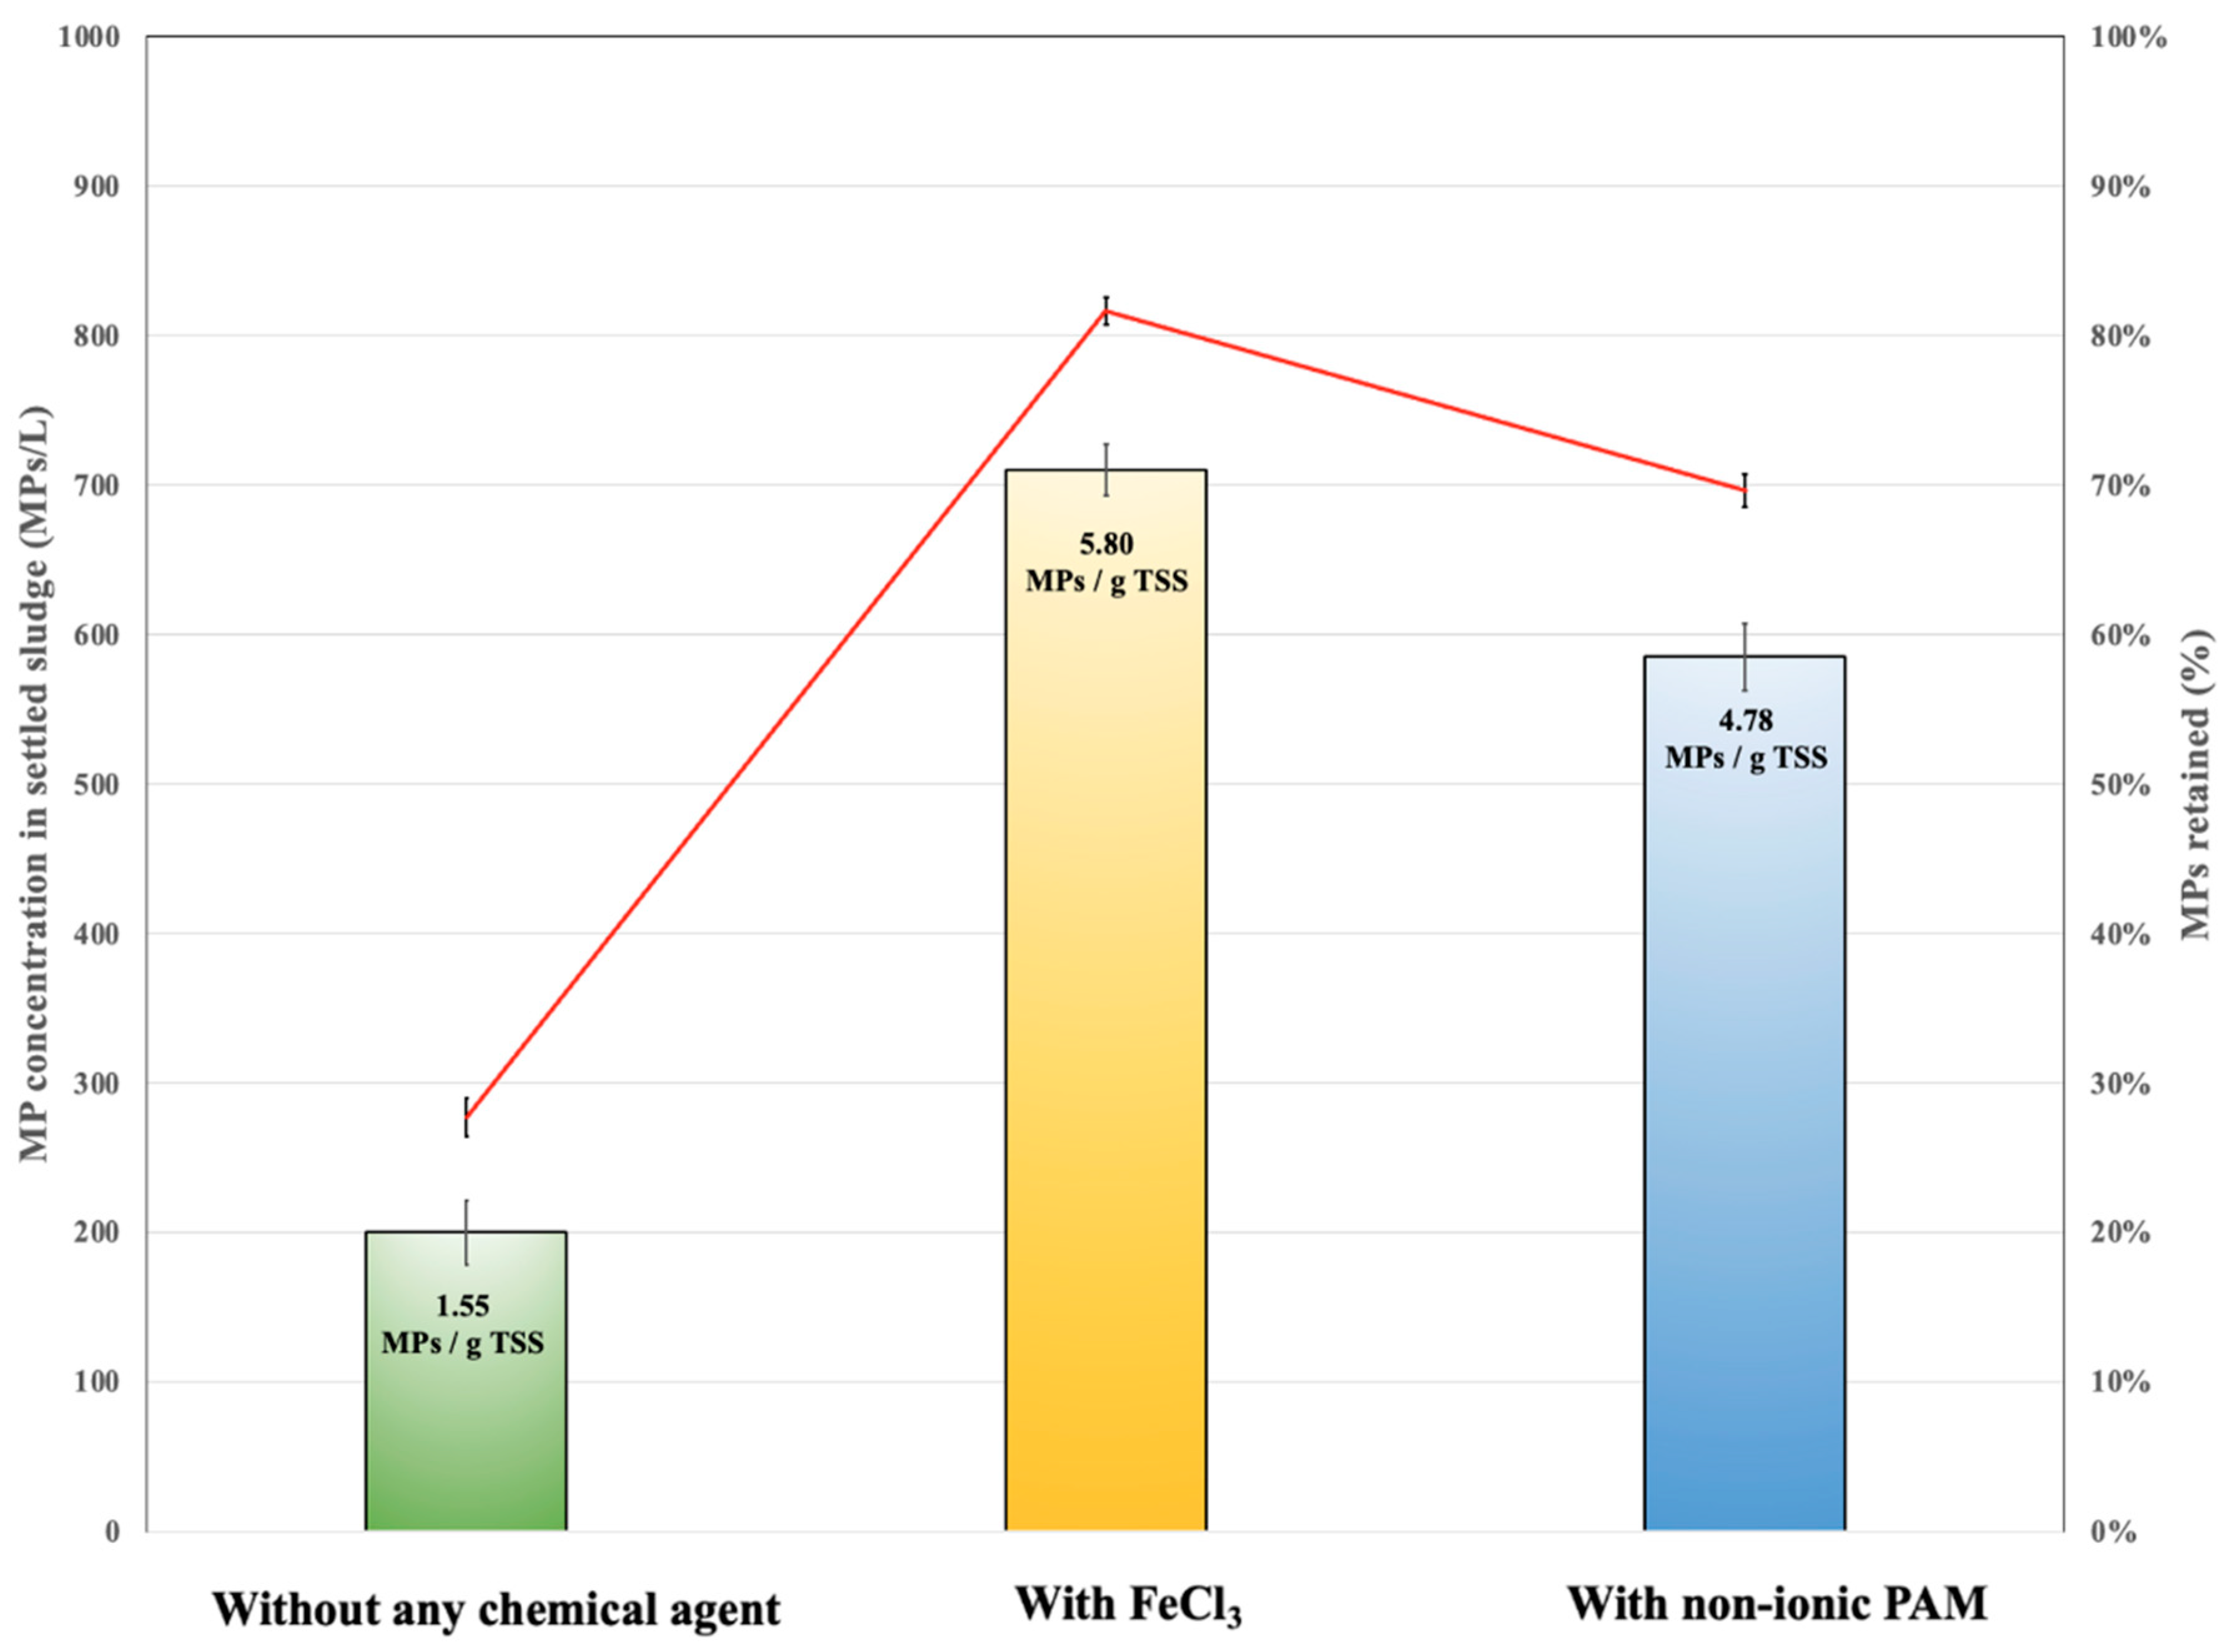
3.4. Effect of Adding Coagulant/Flocculant Agents on MP Retention

To analyse the possibility of improving the capacity of the sludge to retain MPs using chemical agents, the experiment with a sludge concentration equivalent to 0.63 g TSS/L was repeated under the same conditions, except for the addition of a coagulant or a flocculant. Specifically, as explained in Section 2.4, FeCl3 and PAM were assayed separately, with final concentrations of 1000 and 0.1 ppm, respectively. These concentrations were chosen as a first approach so that they fall within the ranges reported in the literature and are low enough to be economically feasible [23,25,26,27]. As shown in Figure 10, the percentage of MPs retained in the settled sludge notably improved with the addition of chemicals, i.e., from 27.7%, without chemicals, to 81.6 ± 0.7% and 69.6 ± 0.3%, with FeCl3 and PAM, respectively. These findings are consistent with previous studies [25,26,27].
As before, MPs retained in the settled sludge were characterized by their shape and size. When a coagulant was employed, the percentages of fibres and fragments were 69% and 28%, respectively. In addition, when a flocculant was used, the percentages of fibres and fragments were 77.0% and 21.0%, respectively (Figure 11a). Compared to the analogous experiment without the addition of chemicals, fibres and fragments continued to be the most abundant shapes, together representing 97–98% in all three cases. However, when the percentages of fibres and fragments were analysed separately, some differences could be observed. Specifically, compared to the percentage of fibres in the absence of chemicals (60%), an increase of 9% was observed with the addition of a coagulant, and 16% with a flocculant. On the other hand, the percentage of fragments decreased with the addition of both chemicals (by 8% with the coagulant and 15% with the flocculant) compared to the experiment without chemicals (36%). The observed improvement in MP retention primarily occurred for fibres, with both FeCl3 and non-ionic PAM (Table S3). A lower zeta potential value and the development of larger flocs (such as the “pangea” shape) favoured by the flocculation process likely contributed to the increased percentage of fibres. Because of the “bridging effect” between the MPs and the flocculant or coagulant, medium- and large-sized fibres can interact with several flocs, increasing their sedimentation. Another notable finding is that, with the coagulant, the percentage of microspheres trapped in the settled sludge improved, reaching a percentage of 7% (compared to 2% without chemicals) (Table S3).
The percentages of MPs of different sizes found in the sludge settled using coagulants and flocculants are shown in Figure 11b. No important differences were observed in the size distribution compared to the sludge settled without chemicals. Other studies have found that the use of flocculants particularly favours the removal of smaller MPs [63,64]. However, in this case, the improvement was observed across all sizes to a similar degree (Table S2).
Regarding the chemical composition of the MPs entrapped by the settled sludge, significant variations were observed when coagulant and flocculant agents were used. When non-ionic PAM was used, the percentage of fibres was higher (77%), corresponding to an increase in RA, PEST, and PEI. However, when FeCl3 was added, the percentage of fragments was higher (28%) than with PAM, which was associated to a higher presence of PE-MPs. More research on the use of agents that improve the removal of MPs during secondary sedimentation and to reduce settling times should be considered in the future.

4. Conclusions

The present work analysed the MPs contained in thickened secondary sludge from a local WWTP. In all samples, fibres were the most common type, followed by fragments. MPs with a size between 500 and 250 μm were the most abundant, and RA and PE were the most common polymers. MPs recovered from these sludge samples were then used to study the effect of TSS concentration and the addition of chemical agents (FeCl3/PAM) on the effectiveness of MP entrapment in sludge flocs. Agitation–settling experiments showed that when TSS concentration was higher the MP removal efficacy increased. Higher amounts of TSS during the agitation step promotes more collisions and encourages the formation of MP–TSS aggregates through hydrophobic and electrostatic interactions, which settle more easily than the MPs. Maximum removal efficacies of around 60% were achieved for TSS concentrations above 1.5 g/L. Furthermore, the use of flocculants and coagulants improved the removal efficacy from 28% to 70% and 82%, respectively. MPs typically have a negative surface charge, and iron acts as a cationic bridge facilitating their retention in flocs whereas PAM creates hydrophobic bridges. The characterization of the MPs settled with and without adding chemicals showed that both flocculants and coagulants preferentially benefited the capture of fibres.
The results found here demonstrate the potential of taking advantage of the synergistic effect that the presence of a certain amount of solids and the addition of chemicals exert on the trapping of MPs in the flocs. In particular, the high removal efficiencies obtained for concentrations of TSS similar to those used in activated sludge systems suggest the interest of adding modest quantities of chemicals before the secondary sedimentation step, in order to improve the removal of MPs from water and, at the same time, enhance the performance of the settling and subsequent DAF processes. It is necessary to take into account that the quantity of samples analysed represents a limitation that could compromise the direct applicability of the conclusions drawn here to other sludges and wastewater treatment facility types. This drawback should be addressed in future studies by examining more samples and incorporating a greater range of treatment plants in order to confirm and broaden the findings. In addition, further research is necessary to investigate in depth the most suitable chemicals, the minimum effective doses, and the economic feasibility of this approach to improve MP removal from treated waters, as an alternative to costly tertiary treatments.

Supplementary Materials

The following supporting information can be downloaded at https://www.mdpi.com/article/10.3390/app15073557/s1, Table S1: MPs present in the sludge used in jar test experiments (beakers filled with 500 mL of distilled water); Figure S1: comparison of the abundance of native MPs in thickened secondary sludges: shape (a) and size (b) (samples before the treatments); Figure S2: % chemical composition of MPs analysed in secondary sewage sludges; Figure S3: µFTIR spectra of all 14 MP types analysed in this study; Table S2: main characteristics of MPs recovered in the supernatant samples; Table S3: comparing MPs in settled sludges according to their sizes and shapes.

Author Contributions

Conceptualization, C.C., D.S., and A.L.; methodology, C.C. and A.L.; formal analysis, A.L.; investigation, C.C.; data curation, C.C. and A.L.; writing—original draft preparation, C.C.; writing—review and editing, A.L. and M.D.; visualization, C.C. and D.S.; supervision, M.D. All authors have read and agreed to the published version of the manuscript.

Funding

The authors are grateful for the financial support from the Employment, Industry and Tourism Office of the Principality of Asturias (Spain) through the project GRUPIN AYUD/2021/51041.

Institutional Review Board Statement

Not applicable.

Informed Consent Statement

Not applicable.

Data Availability Statement

The datasets used and/or analysed during this study are available from the corresponding author on reasonable request.

Acknowledgments

The authors are grateful to the Photonic Microscopy and Imaging Processing Unit of the Scientific-Technical Services of the University of Oviedo (Confocal UniOvi ImageJ), for assistance in the MPs analysis, and the Molecular Spectroscopy Unit of the Autonomous University of Madrid (UAM), for assistance in FTIR analysis. This article is dedicated to Alexander Santiago Casella Flores.

Conflicts of Interest

The authors declare that they have no known competing financial interest or personal relationships that could have influenced the work reported in this paper.

Abbreviations

The following abbreviations are used in this manuscript:
CECellulose
DAFDissolved air flotation
DMDry matter
EPSExtracellular polymeric substances
EREpoxy resim
EVAEthylene-vynil acetate
GLPGood laboratory procedures
MPsMicroplastics
PAPolyamide
PAAPolyacrylic acid
PACPolyaluminum chloride
PAMPolyacrylamide
PCPolycarbonate
PEPolyethylene
PEEUPolyether ester urethane
PEIPolyethylenimine
PESTPolyester
PETPolyethylene terephthalate
PMMAPolymethyl methacrylate
PEURPolyether urethane
PPPolypropylene
PSPolystyrene
PVCPolyvinvyl chloride
PUPolyurethane
QA/QCQuality assurance/quality control
RARayon
SSSuspended solids
tCODTotal chemical oxygen demand
TOCTotal organic carbon
TSSTotal suspended solids
WWTPWastewater treatment plant

References

  1. Franco, A.A.; Martín-García, A.P.; Egea-Corbacho, A.; Arellano, J.M.; Albendín, G.; Rodríguez-Barroso, R.; Coello, M.D. Assessment and accumulation of microplastics in sewage sludge at wastewater treatment plants located in Cádiz, Spain. Environ. Pollut. 2023, 317, 120689. [Google Scholar] [CrossRef] [PubMed]
  2. Harley-Nyang, D.; Memon, F.A.; Baquero, A.O.; Galloway, T. Variation in microplastic concentration, characteristics and distribution in sewage sludge & biosolids around the world. Sci. Total Environ. 2023, 891, 164068. [Google Scholar] [CrossRef]
  3. Casella, C.; Sol, D.; Laca, A.; Díaz, M. Microplastics in Sewage Sludge: A review. Environ. Sci. Pollut. Res. 2023, 30, 63382–63415. [Google Scholar] [CrossRef]
  4. Sol, D.; Laca, A.; Laca, A.; Díaz, M. Wastewater treatment approaches to remove microplastics. Polluting Textiles: The Problem with Microfibres. In Polluting Textiles; Routledge: London, UK, 2022. [Google Scholar] [CrossRef]
  5. Sol, D.; Solís-Balbín, C.; Laca, A.; Laca, A.; Díaz, M. A standard analytical approach and establishing criteria for microplastic concentrations in wastewater, drinking water and tap water. Sci. Total Environ. 2023, 899, 165356. [Google Scholar] [CrossRef]
  6. Masiá, P.; Sol, D.; Ardura, A.; Laca, A.; Borrell, Y.J.; Dopico, E.; Garcia-Vazquez, E. Bioremediation as a promising strategy for microplastics removal in wastewater treatment plants. Mar. Pollut. Bull. 2020, 156, 111252. [Google Scholar] [CrossRef] [PubMed]
  7. Edo, C.; González-Pleiter, M.; Leganés, F.; Fernández-Piñas, F.; Rosal, R. Fate of microplastics in wastewater treatment plants and their environmental dispersion with effluent and sludge. Environ. Pollut. 2020, 259, 113837. [Google Scholar] [CrossRef]
  8. Rolsky, C.; Kelkar, V.; Driver, E.; Halden, R.U. Municipal sewage sludge as a source of microplastics in the environment. Curr. Opin. Environ. Sci. Health 2020, 14, 16–22. [Google Scholar]
  9. van den Berg, P.; Huerta-Lwanga, E.; Corradini, F.; Geissen, V. Sewage sludge application as a vehicle for microplastics in eastern Spanish agricultural soils. Environ. Pollut. 2020, 261, 114198. [Google Scholar] [CrossRef] [PubMed]
  10. Ren, S.Y.; Sun, Q.; Xia, S.Y.; Tong, D.; Ni, H.G. Microplastics in wastewater treatment plants and their contributions to surface water and farmland pollution in China. Chemosphere 2023, 343, 140239. [Google Scholar] [CrossRef]
  11. Gholami, M.; Ghaneian, M.T.; Fatemi, S.S.; Talebi, P.; Dalvand, A. Investigating the efficiency of coagulation and flocculation process in wastewater treatment of paper and cardboard recycling industry. Int. J. Environ. Anal. Chem. 2022, 102, 5860–5872. [Google Scholar] [CrossRef]
  12. Li, B.; Zhao, J.; Ge, W.; Li, W.; Yuan, H. Coagulation-flocculation performance and floc properties for microplastics removal by magnesium hydroxide and PAM. J. Environ. Chem. Eng. 2022, 10, 107263. [Google Scholar] [CrossRef]
  13. Maliwan, T.; Pungrasmi, W.; Lohwacharin, J. Effects of microplastic accumulation on floc characteristics and fouling behavior in a membrane bioreactor. J. Hazard. Mater. 2021, 411, 124991. [Google Scholar] [CrossRef] [PubMed]
  14. Sun, Q.; Ren, S.Y.; Ni, H.G. Incidence of microplastics in personal care products: An appreciable part of plastic pollution. Sci. Total Environ. 2020, 742, 140218. [Google Scholar] [CrossRef] [PubMed]
  15. Li, Z.; Zhang, Y.; Wei, X.; Huang, L.; Zhang, J.; Wu, Y.; Xiang, Y. A comprehensive study on the performance and mechanism of microplastics removal by enhanced coagulation methods. J. Water Process Eng. 2023, 56, 104238. [Google Scholar] [CrossRef]
  16. Robles-Bueno, Y.; Castillo-Suárez, L.A.; Linares-Hernández, I.; Martínez-Miranda, V.; Garduño-Pineda, L.; Alanis, C.; Natividad, R. Denim washing wastewater treatment by coupling coagulation–flocculation/Fe-garnet filtration: Life cycle assessment and the fertilization with the sludge. Int. J. Environ. Sci. Technol. 2024, 21, 6109–6132. [Google Scholar] [CrossRef]
  17. Sol, D.; Laca, A.; Laca, A.; Díaz, M. Approaching the environmental problem of microplastics: Importance of WWTP treatments. Sci. Total Environ. 2020, 740, 140016. [Google Scholar] [CrossRef]
  18. Sun, Q.; Lu, F.H.; Ni, H.G. Microplastic-water partitioning of two states halogenated PAHs: Solute and sol. Environ. Res. 2021, 202, 111634. [Google Scholar] [CrossRef]
  19. Acarer, S. Microplastics in wastewater treatment plants: Sources, properties, removal efficiency, removal mechanisms, and interactions with pollutants. Water Sci. Technol. 2023, 87, 685–710. [Google Scholar] [CrossRef]
  20. Lapointe, M.; Farner, J.M.; Hernandez, L.M.; Tufenkji, N. Understanding and improving microplastic removal during water treatment: Impact of coagulation and flocculation. Environ. Sci Technol. 2020, 54, 8719–8727. [Google Scholar] [CrossRef]
  21. Na, S.H.; Kim, M.J.; Kim, J.T.; Jeong, S.; Lee, S.; Chung, J.; Kim, E.J. Microplastic removal in conventional drinking water treatment processes: Performance, mechanism, and potential risk. Water Res. 2021, 202, 117417. [Google Scholar] [CrossRef]
  22. Kwon, H.J.; Hidayaturrahman, H.; Peera, S.G.; Lee, T.G. Elimination of microplastics at different stages in wastewater treatment plants. Water 2022, 14, 2404. [Google Scholar] [CrossRef]
  23. Tang, W.; Li, H.; Fei, L.; Wei, B.; Zhou, T.; Zhang, H. The removal of microplastics from water by coagulation: A comprehensive review. Sci. Total Environ. 2022, 851, 158224. [Google Scholar] [CrossRef]
  24. Hidayaturrahman, H.; Lee, T.G. A study on characteristics of microplastic in wastewater of South Korea: Identification, quantification, and fate of microplastics during treatment process. Mar. Pollut. Bull. 2019, 146, 696–702. [Google Scholar] [CrossRef]
  25. Ma, B.; Xue, W.; Ding, Y.; Hu, C.; Liu, H.; Qu, J. Removal characteristics of microplastics by Fe-based coagulants during drinking water treatment. J. Environ. Sci. 2019, 78, 267–275. [Google Scholar] [CrossRef]
  26. Ma, B.; Xue, W.; Hu, C.; Liu, H.; Qu, J.; Li, L. Characteristics of microplastic removal via coagulation and ultrafiltration during drinking water treatment. Chem. Eng. J. 2019, 359, 159–167. [Google Scholar] [CrossRef]
  27. Awan, M.M.; Malkoske, T.; Almuhtaram, H.; Andrews, R.C. Microplastic removal in batch and dynamic coagulation-flocculation-sedimentation systems is controlled by floc size. Sci. Total Environ. 2024, 909, 168631. [Google Scholar] [CrossRef] [PubMed]
  28. APHA-AWWA-WEF. Standard Methods for the Examination of Water and Wastewater. 21th Edition. New York, Total Solids Suspended, Method 2540 D, 2-55 a 2-59. 2005.
  29. Solís-Balbín, C.; Sol, D.; Laca, A.; Laca, A.; Díaz, M. Destruction and entrainment of microplastics in ozonation and wet oxidation processes. J. Water Process. Eng. 2023, 51, 103456. [Google Scholar] [CrossRef]
  30. Kutralam-Muniasamy, G.; Shruti, V.C.; Pérez-Guevara, F.; Roy, P.D.; Elizalde-Martínez, I. Common laboratory reagents: Are they a double-edged sword in microplastics research? Sci. Total Environ. 2023, 875, 162610. [Google Scholar] [CrossRef] [PubMed]
  31. Shruti, V.C.; Kutralam-Muniasamy, G. Blanks and bias in microplastic research: Implications for future quality assurance. Trends Environ. Anal. Chem. 2023, 38, e00203. [Google Scholar] [CrossRef]
  32. Xu, J.; Wang, X.; Zhang, Z.; Yan, Z.; Zhang, Y. Effects of chronic exposure to different sizes and polymers of microplastics on the characteristics of activated sludge. Sci. Total Environ. 2021, 783, 146954. [Google Scholar] [CrossRef]
  33. Li, X.; Chen, L.; Ji, Y.; Li, M.; Dong, B.; Qian, G.; Dai, X. Effects of chemical pretreatments on microplastic extraction in sewage sludge and their physicochemical characteristics. Water Res. 2020, 171, 115379. [Google Scholar] [CrossRef] [PubMed]
  34. Subramanian, S.B.; Yan, S.; Tyagi, R.D.; Surampalli, R.Y. Extracellular polymeric substances (EPS) producing bacterial strains of municipal wastewater sludge: Isolation, molecular identification, EPS characterization and performance for sludge settling and dewatering. Water Res. 2010, 44, 2253–2266. [Google Scholar] [CrossRef]
  35. González-Menéndez, C.; Sol, D.; Laca, A.; Laca, A.; Díaz, M. Interrelation between extracellular polymer substances (EPSs) and MPs in an MBR. J. Environ. Chem. Eng. 2024, 12, 112021. [Google Scholar] [CrossRef]
  36. Komorowska-Kaufman, M.; Marciniak, W. Removal of microplastic particles during municipal wastewater treatment: A current review. Desalin. Water Treat. 2024, 317, 100006. [Google Scholar] [CrossRef]
  37. Liu, R.; Xu, Y.; Song, L.; Liu, S.; Liang, Z.; Zhu, D.; Dai, X. The effect of repeated energy inputs on the release profiles of extracellular organic substances in sewage sludge. Water Res. 2023, 233, 119776. [Google Scholar] [CrossRef]
  38. Tan, X.; Zeng, S.; Chen, Z.; Lv, M.; Tang, X.; He, X.; Zhang, J. Synergistic effect of organic matter-floc size-bound water and multifactorial quantitative model of optimal reagent demand in sewage sludge conditioning process prior to dewatering. Water Res. 2024, 251, 121108. [Google Scholar] [CrossRef] [PubMed]
  39. Gies, E.A.; LeNoble, J.L.; Noël, M.; Etemadifar, A.; Bishay, F.; Hall, E.R.; Ross, P.S. Retention of microplastics in a major secondary wastewater treatment plant in Vancouver, Canada. Mar. Pollut. Bull. 2018, 133, 553–561. [Google Scholar] [CrossRef]
  40. Hongprasith, N.; Kittimethawong, C.; Lertluksanaporn, R.; Eamchotchawalit, T.; Kittipongvises, S.; Lohwacharin, J. IR microspectroscopic identification of microplastics in municipal wastewater treatment plants. Environ. Sci. Pollut. Res. 2020, 27, 18557–18564. [Google Scholar] [CrossRef]
  41. Nakao, S.; Akita, K.; Ozaki, A.; Masumoto, K.; Okuda, T. Circulation of fibrous microplastic (microfiber) in sewage and sewage sludge treatment processes. Sci. Total Environ. 2021, 795, 148873. [Google Scholar] [CrossRef]
  42. Tadsuwan, K.; Babel, S. Microplastic contamination in a conventional wastewater treatment plant in Thailand. Waste Manag. Res. 2021, 39, 754–761. [Google Scholar] [CrossRef]
  43. Vardar, S.; Onay, T.T.; Demirel, B.; Kideys, A.E. Evaluation of microplastics removal efficiency at a wastewater treatment plant discharging to the Sea of Marmara. Environ. Pollut. 2021, 289, 117862. [Google Scholar] [CrossRef] [PubMed]
  44. Zhang, Z.; Su, Y.; Zhu, J.; Shi, J.; Huang, H.; Xie, B. Distribution and removal characteristics of microplastics in different processes of the leachate treatment system. Waste Manag. 2021, 120, 240–247. [Google Scholar] [CrossRef] [PubMed]
  45. Gao, Z.; Cizdziel, J.V.; Chen, L. Microplastics profile in sludge from a university wastewater treatment plant and the influence of chemical digestions on Nile red stained microplastics. J. Environ. Chem. Eng. 2023, 11, 109671. [Google Scholar] [CrossRef]
  46. Ziajahromi, S.; Neale, P.A.; Silveira, I.T.; Chua, A.; Leusch, F.D. An audit of microplastic abundance throughout three Australian wastewater treatment plants. Chemosphere 2021, 263, 128294. [Google Scholar] [CrossRef]
  47. Mahon, A.M.; O’Connell, B.; Healy, M.G.; O’Connor, I.; Officer, R.; Nash, R.; Morrison, L. Microplastics in sewage sludge: Effects of treatment. Environ. Sci. Technol. 2017, 51, 810–818. [Google Scholar] [CrossRef]
  48. Collivignarelli, M.C.; Carnevale Miino, M.; Caccamo, F.M.; Milanese, C. Microplastics in sewage sludge: A known but underrated pathway in wastewater treatment plants. Sustainability 2021, 13, 12591. [Google Scholar] [CrossRef]
  49. Hajji, S.; Ben-Haddad, M.; Abelouah, M.R.; De-la-Torre, G.E.; Alla, A.A. Sludge drying and dewatering processes influence the abundance and characteristics of microplastics in wastewater treatment plants. Chemosphere 2023, 339, 139743. [Google Scholar] [CrossRef]
  50. Gao, Z.; Chen, L.; Cizdziel, J.; Huang, Y. Research progress on microplastics in wastewater treatment plants: A holistic review. J. Environ. Manag. 2023, 325, 116411. [Google Scholar] [CrossRef]
  51. Sheriff, I.; Yusoff, M.S.; Halim, H.B. Microplastics in wastewater treatment plants: A review of the occurrence, removal, impact on ecosystem, and abatement measures. J. Water Process Eng. 2023, 54, 104039. [Google Scholar] [CrossRef]
  52. Yuan, F.; Zhao, H.; Sun, H.; Sun, Y.; Zhao, J.; Xia, T. Investigation of microplastics in sludge from five wastewater treatment plants in Nanjing, China. J. Environ. Manag. 2022, 301, 113793. [Google Scholar] [CrossRef]
  53. Giles, C.H.; Smith, D.; Huitson, A. A general treatment and classification of the solute adsorption isotherm. I. Theoretical. J. Colloid Interface Sci. 1974, 47, 755–765. [Google Scholar] [CrossRef]
  54. Nayyar, D.; Shaikh, M.A.N.; Nawaz, T. Remediation of emerging contaminants by naturally derived adsorbents. New Trends Emerg. Environ. Contam. 2022, 225–260. [Google Scholar] [CrossRef]
  55. Nguyen, M.K.; Hadi, M.; Lin, C.; Nguyen, H.L.; Thai, V.B.; Hoang, H.G.; Tran, H.T. Microplastics in sewage sludge: Distribution, toxicity, identification methods, and engineered technologies. Chemosphere 2022, 308, 136455. [Google Scholar] [CrossRef] [PubMed]
  56. Menéndez-Manjón, A.; Martínez-Díez, R.; Sol, D.; Laca, A.; Laca, A.; Rancaño, A.; Díaz, M. Long-term occurrence and fate of microplastics in WWTPs: A case study in southwest Europe. Appl. Sci. 2022, 12, 2133. [Google Scholar] [CrossRef]
  57. Chen, G.; Li, C.; Ruan, Z.; Bürger, R.; Hou, H. Research on floc structure and physical properties based on pipeline flocculation. J. Water Process Eng. 2023, 53, 103627. [Google Scholar] [CrossRef]
  58. Asensi, E.; Alemany, E. A hindered settling velocity model related to the fractal dimension and activated sludge flocs characteristics: Application to a sludge with a previous fragmentation and flocculation process. Sep. Purif. Technol. 2022, 300, 121812. [Google Scholar] [CrossRef]
  59. Wilén, B.M.; Jin, B.; Lant, P. Impacts of structural characteristics on activated sludge floc stability. Water Res. 2003, 37, 3632–3645. [Google Scholar] [CrossRef] [PubMed]
  60. Alioua, W.; Lapointe, M. Fiber-based super-bridging agents enable efficient contaminant removal via settling and screening: Impact on microplastics, textile fibers, and turbidity. J. Environ. Chem. Eng. 2023, 11, 110195. [Google Scholar] [CrossRef]
  61. Xu, Q.; Huang, Q.S.; Luo, T.Y.; Wu, R.L.; Wei, W.; Ni, B.J. Coagulation removal and photocatalytic degradation of microplastics in urban waters. Chem. Eng. J. 2021, 416, 129123. [Google Scholar] [CrossRef]
  62. He, W.; Chen, X.; Xu, C.; Zhou, C.; Wang, C. Internal interaction between chemically-pretreated polypropylene microplastics and floc growth during flocculation: Critical effect on floc properties and flocculation mechanisms. Sep. Purif. Technol. 2023, 306, 122710. [Google Scholar] [CrossRef]
  63. Ruan, Y.; Zhang, K.; Wu, C.; Wu, R.; Lam, P.K. A preliminary screening of HBCD enantiomers transported by microplastics in wastewater treatment plants. Sci. Total Environ. 2019, 674, 171–178. [Google Scholar] [CrossRef] [PubMed]
  64. Radityaningrum, A.D.; Trihadiningrum, Y.; Soedjono, E.S.; Herumurti, W. Microplastic contamination in water supply and the removal efficiencies of the treatment plants: A case of Surabaya City, Indonesia. J. Water Process Eng. 2021, 43, 102195. [Google Scholar] [CrossRef]
Figure 1. Scheme of the WWTP that supplied the sludge samples. The asterisk indicates the sampling point.
Applsci 15 03557 g001
Figure 2. (a) Stereomicroscope micrograph of sludge flocs and (b) sketch illustrating how sludge flocs contain the MPs.
Applsci 15 03557 g002
Figure 3. Floc size distribution in the sludge samples.
Applsci 15 03557 g003
Figure 4. MP concentrations in the analysed samples of secondary sludge.
Applsci 15 03557 g004
Figure 5. MP concentration in the settled sludge after the agitation–settling experiments and retention effectiveness versus TSS concentration (the bars represent MP concentration, and the red line represents percentages of MPs retained). The percentage of retained MPs was calculated by subtracting the number of MPs that remained in the supernatant after settling from the number of MPs that were initially in the water–sludge mixture and dividing the result by the initial number of MPs.
Applsci 15 03557 g005
Figure 6. Number of MPs retained in the settled sludge (given per mass of TSS) versus MP concentration in the supernatant.
Applsci 15 03557 g006
Figure 7. Comparison of the abundance of MP shapes (a) and sizes (b) depending on the different sludge concentrations.
Applsci 15 03557 g007
Figure 8. Size distribution of fibres (a) and fragments (b) in thickened sludge, before the experiment.
Applsci 15 03557 g008
Figure 9. (a) Sketch of the main mechanisms of floc rupture; (b) sketch of possible ways of MP entrapment in sludge flocs.
Applsci 15 03557 g009
Figure 10. Comparison of efficiencies of MP retention in the settled sludges (0.63 g TSS/L) with and without the addition of chemicals (the bars represent MP concentrations in the settled sludge, and the red line represents percentages of retained MPs).
Applsci 15 03557 g010
Figure 11. Comparison of the abundance of MP shapes (a) and sizes (b) in sludge samples, with the application of coagulant or flocculant agents.
Applsci 15 03557 g011
Table 1. Physicochemical parameters of the secondary sewage sludge samples taken at the WWTP.
Month
(2023)
TSS (g/L)pHMoisture
(%)
Dry Matter
(g DM/kg Sludge)
tCOD
(g O2/kg DM)
TOC
(g C/kg DM)
June32.6 ± 2.67.1 ± 0.193.5 ± 1.731 ± 21050 ± 30420 ± 3
July32.6 ± 4.17.4 ± 0.294.9 ± 2.132 ± 31050 ± 30415 ± 2
August31.4 ± 3.27.3 ± 0.195.2± 1.634 ± 31046 ± 27416 ± 1
September31.4 ± 4.47.3 ± 0.495.2 ± 2.334 ± 31041 ± 32419 ± 2
October33.9 ± 2.87.2 ± 0.294.4 ± 1.233 ± 21055 ± 21415 ± 1
November33.9 ± 3.77.2 ± 0.294.4 ± 2.233 ± 21045 ± 31417 ± 1
Disclaimer/Publisher’s Note: The statements, opinions and data contained in all publications are solely those of the individual author(s) and contributor(s) and not of MDPI and/or the editor(s). MDPI and/or the editor(s) disclaim responsibility for any injury to people or property resulting from any ideas, methods, instructions or products referred to in the content.

