Article

Defining the Optimal Ranges of Tourist Visits in UNESCO World Heritage Caves with Rock Art: The Case of El Castillo and Covalanas (Cantabria, Spain)

by
Angel Fernandez-Cortes
1,
Eduardo Palacio-Perez
2,
Tamara Martin-Pozas
3,
Soledad Cuezva
4,
Roberto Ontañon
2,5,
Javier Lario
6,* and
Sergio Sanchez-Moral
4
1
Departamento de Biología y Geología, Universidad de Almería, 04120 Almería, Spain
2
Cuevas Prehistóricas de Cantabria, Cuevas de Monte Castillo, 39670 Puente Viesgo, Spain
3
Instituto de Recursos Naturales y Agrobiología de Sevilla (IRNAS-CSIC), 41012 Sevilla, Spain
4
Museo Nacional de Ciencias Naturales (MNCN-CSIC), 28006 Madrid, Spain
5
Museo de Prehistoria y Arqueología de Cantabria, 39009 Santander, Spain
6
Facultad de Ciencias, Universidad Nacional de Educación a Distancia (UNED), 28232 Las Rozas, Spain
*
Author to whom correspondence should be addressed.
Appl. Sci. 2025, 15(7), 3484; https://doi.org/10.3390/app15073484
Submission received: 15 January 2025 / Revised: 10 March 2025 / Accepted: 20 March 2025 / Published: 22 March 2025
(This article belongs to the Section Environmental Sciences)

Abstract

:
The Cantabrian region, located in north Spain, is home to many caves with parietal art, some of them included on the UNESCO World Heritage list, such as El Castillo and Covalanas. These two caves are currently open to tourism and boast an exceptional archaeological heritage that includes magnificent examples of Palaeolithic cave art. Through a multiyear research project (2020–2022) sponsored by the Government of Cantabria, a precise characterisation of the environmental dynamics of each cave under different meteorological contexts was carried out, as well as an evaluation of the evolution of the impacts of anthropic origin on the underground microclimate under different degrees of influx of visitors on an interannual scale. We aimed to unravel the effects of daily visitor flow on cave environmental stability and offer well-defined recommendations to harmonise conservation priorities with public accessibility based on sustainable tourism management. Once the microclimatic control parameters for the conservation of the paintings, engravings, and supporting rock, such as temperature and CO2 concentration in the air, were assessed under different seasonal meteorological conditions, a standardised graphic method was implemented based on the frequency distribution of the variations in each parameter, grouped according to the different increasing ranges of daily visits. With this method, it is possible to evaluate, probabilistically and in percentage terms, the microclimatic destabilisation of the cave generated by each group of visitors, taking as a reference the daily variation ranges of each control parameter under natural conditions, i.e., during the days or periods of time in which each cave remained closed to tourist visits. The recommended values of maximum visitor capacity for each cave, in terms of average monthly daily visitor numbers, have been set at 60 and 15 visitors/day for El Castillo and Covalanas caves, respectively. Based on these results, the cave managers are carrying out, from May 2024, a progressive adaptation in the tourist management of these caves until they are fully adapted to the environmental sustainability parameters defined in this study.

1. Introduction

The conservation and protection of tourist caves require appropriate management tools based on knowledge of the temporal evolution and spatial variation in the environmental parameters of the subterranean environment. Environmental impact may occur because tourist caves require a physical modification of natural passages, installation of lighting, pathways, platforms, and related infrastructure. Their related effects on the physical environment of the cave constitute a challenge for management that aims to properly evaluate the relative vulnerability of each cave passage [1].
Monitoring air temperature and CO2 concentration with adequate resolution and temporal extension is essential to perform a basic characterisation of the state and environmental dynamics of a cavity, as well as to analyse the destabilisation of the subterranean environment in the face of anthropogenic changes of a certain magnitude [2]. Both parameters play a key role in the air exchange process with the external atmosphere that involves the introduction of nutrients and the dispersion of airborne bacteria and fungi, which could potentially colonise and biodegrade the rock panels with prehistoric paintings and engravings [3,4,5]. In this regard, the knowledge on the confinement state of caves, evidenced by long-term continuous monitoring, helps managers to establish the best strategies to improve their conservation properties [6].
The main tool for karst management is the definition and delimitation of protection areas and, in the case of tourist caves, the establishment of an environmentally sustainable visitor regime. There are numerous examples of tourist caves under continuous environmental monitoring, but in many cases, the analysis of the microclimatic destabilisation generated by continuous visits over time is usually addressed once the cave has been opened to tourism or after a long history of visits, which prevents us from knowing its environmental characteristics in a natural regime. In these cases, the detailed monitoring of basic microclimatic parameters and under different visitor flow rates and occasional closures to the public is essential to obtain baseline data to define numerical tools for the sustainable management of the cave in question [7]. These tools focus on defining the carrying capacity of each tourist cave, understood as the maximum flow of visitors in a cave that will produce changes in a microclimatic control parameter within a natural fluctuation range [8,9,10,11,12,13,14]. Since caves are considered stable habitats, medium-term microbiological monitoring has also been used to understand temporal and spatial carrying capacity for sensitive underground sites [3,15,16,17].
This study presents a characterisation of the environmental dynamics of two of the main tourist caves with parietal art in Cantabria—El Castillo and Covalanas—both included in the UNESCO Word Heritage site Cave of Altamira and Palaeolithic Cave Art of Northern Spain (Figure 1) but with a very different pattern of visitation on an annual and daily basis. Based on the records obtained during three annual cycles, the evolution of the temperature and gaseous composition of the underground air in each cave was studied in relation to seasonal changes in the local meteorology, as well as the interannual evolution of anthropogenic impacts on the underground microclimate under different regimes of daily visits. The objective of this study is to determine the carrying capacity of the two caves. This aims to prevent changes in key environmental parameters (air temperature and CO2 concentration) that exceed their natural daily and/or seasonal variations, thus avoiding cumulative effects that could lead to the irreversible progression of corrosion and biodeterioration.

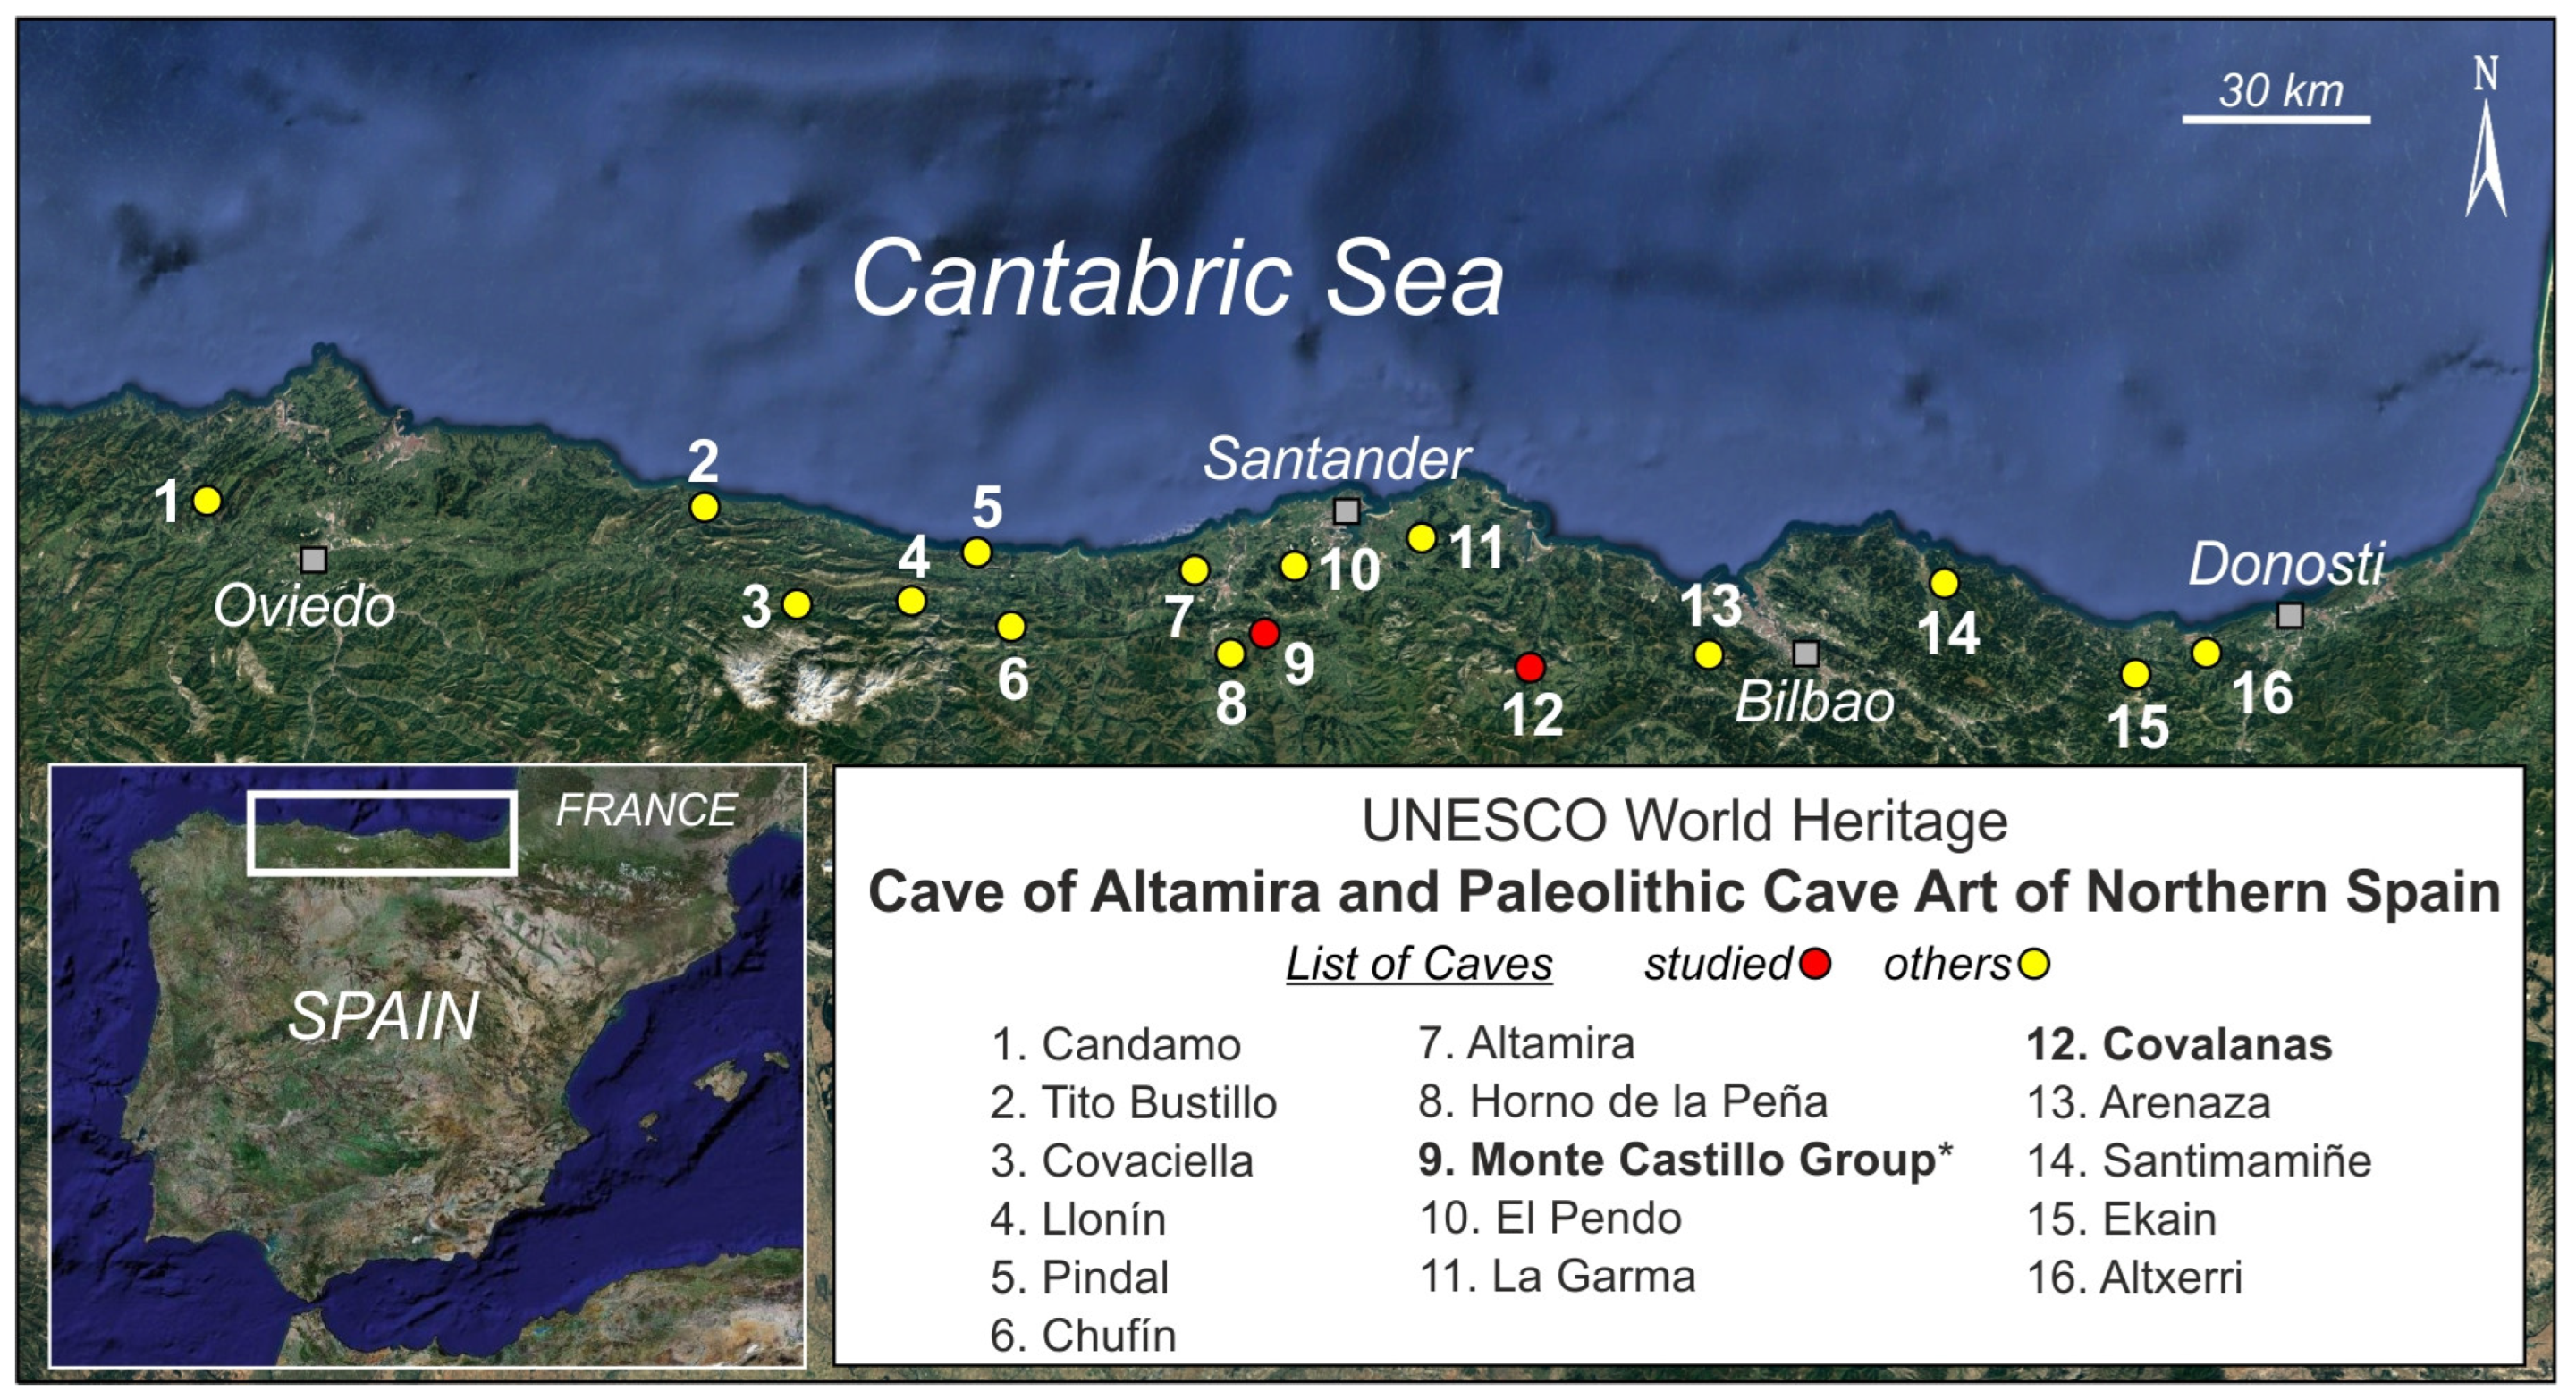
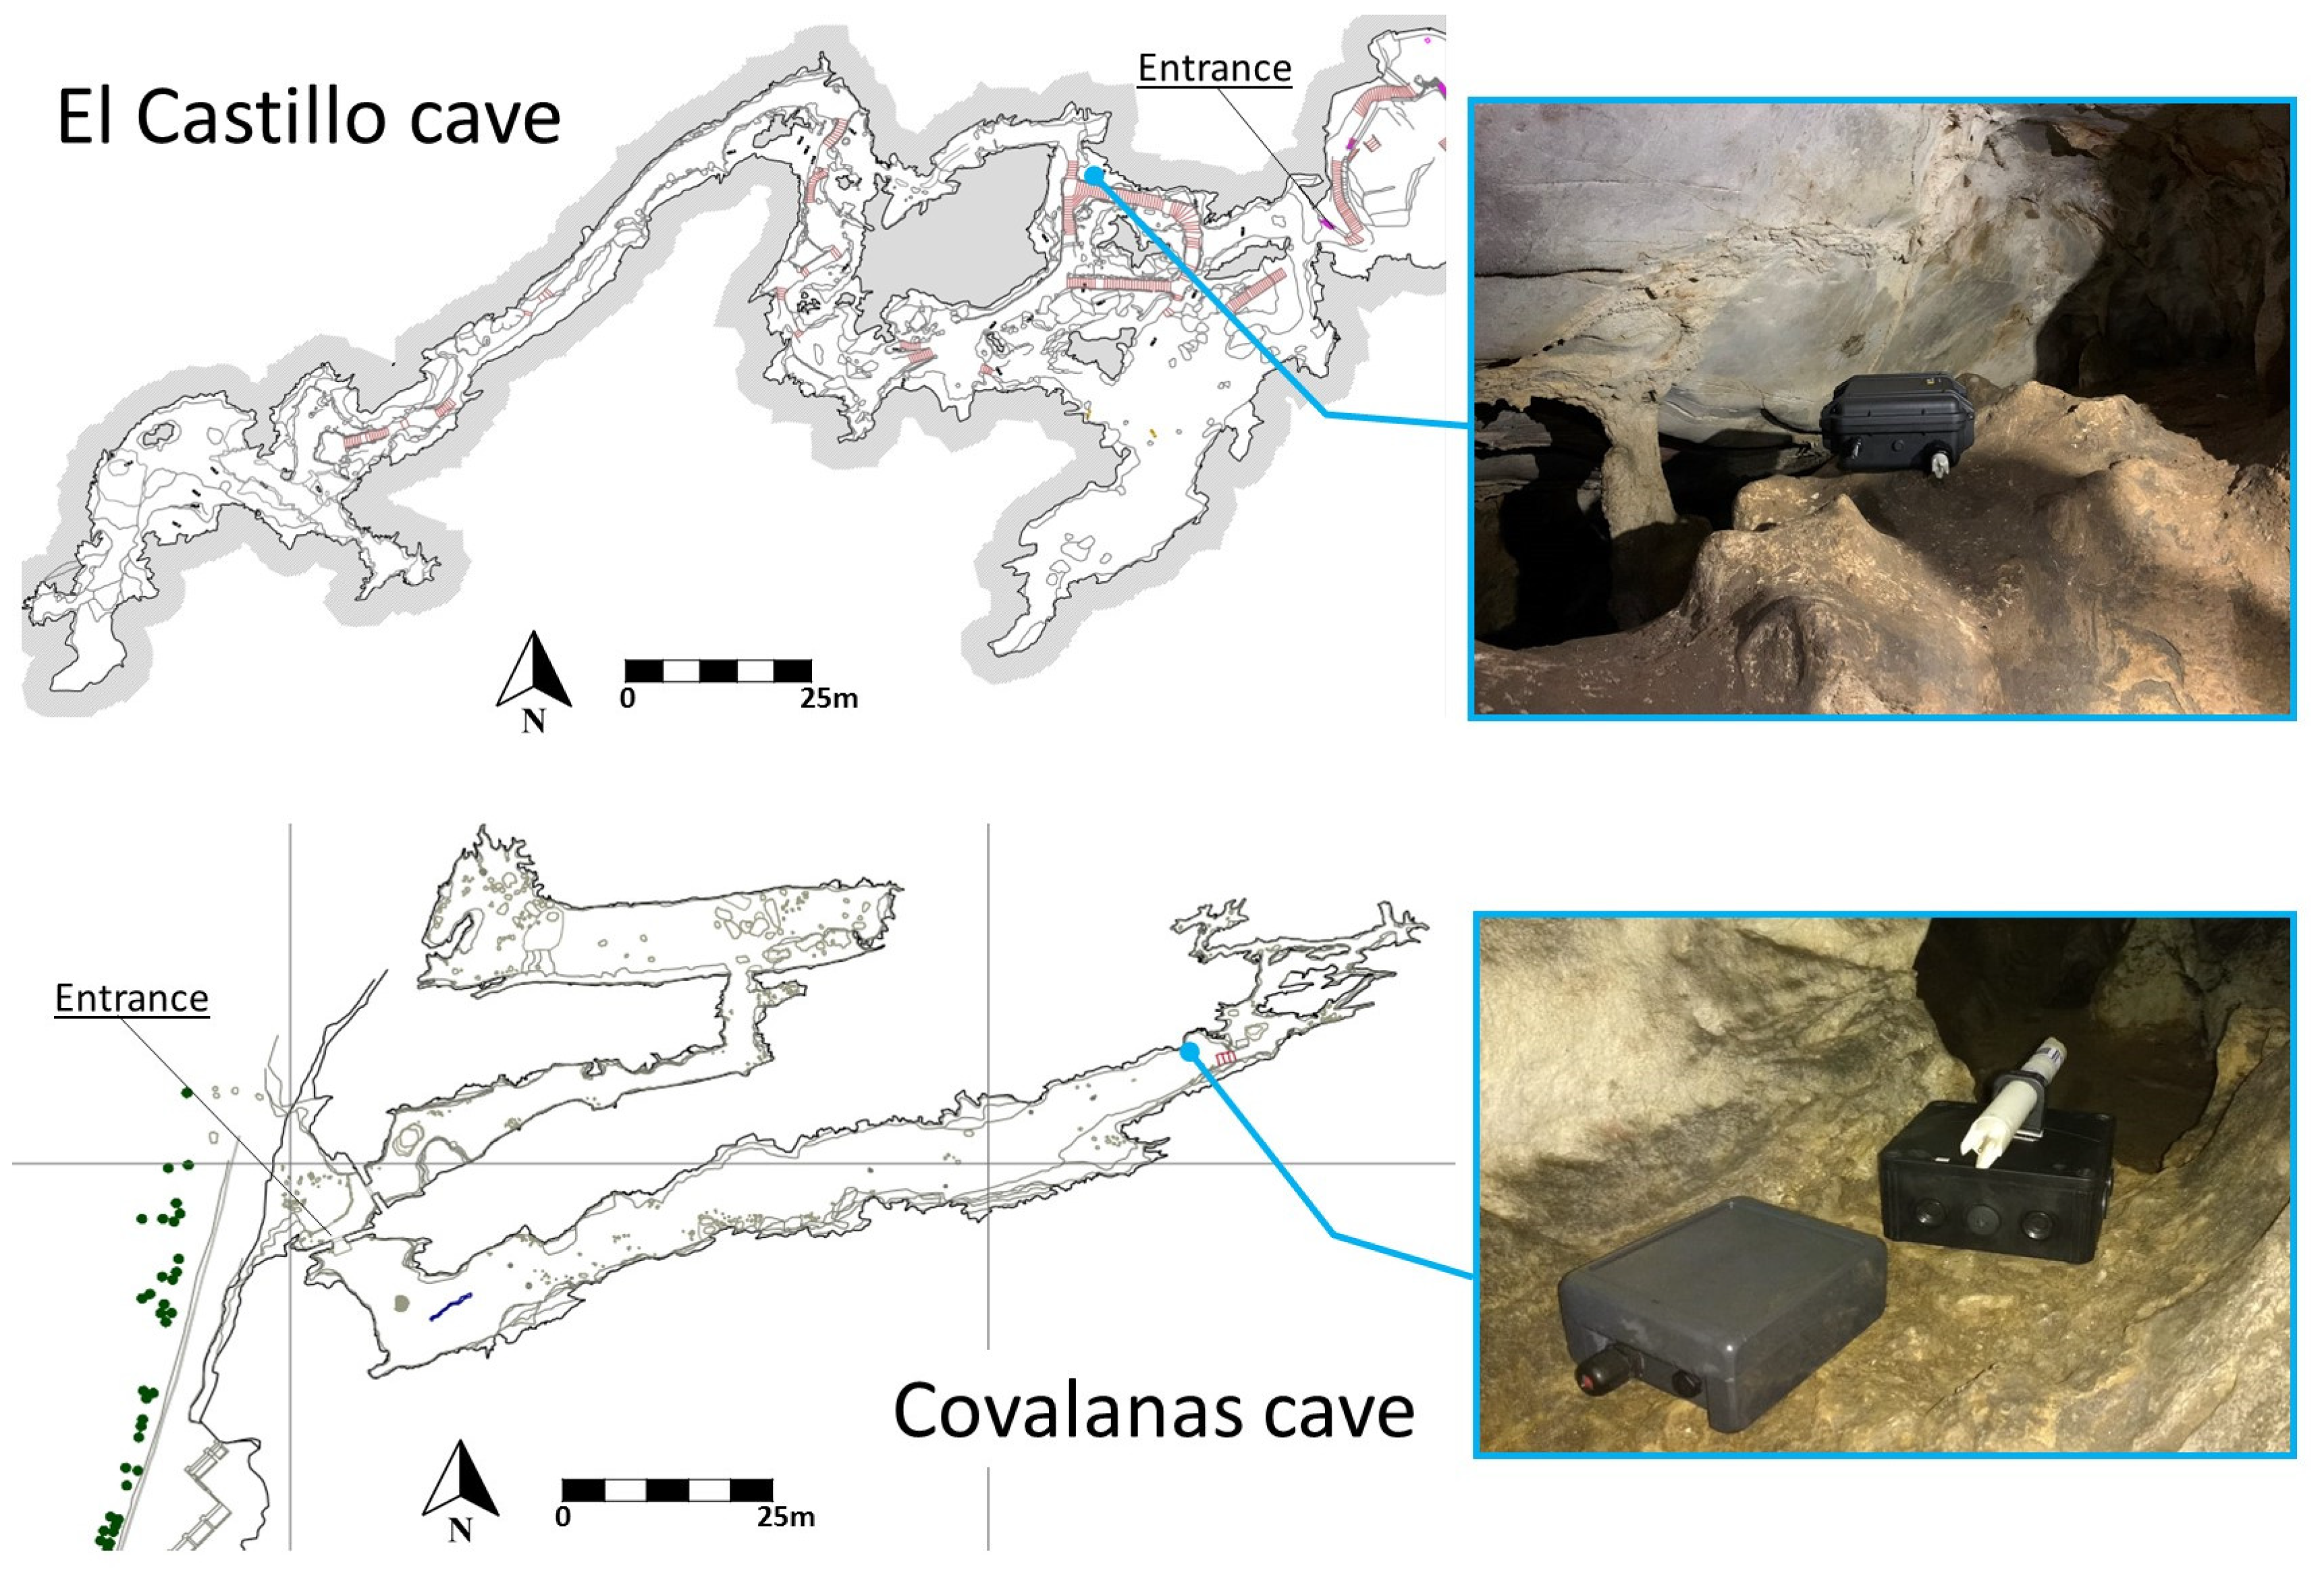
2. Caves Studied: Tourist Visit Regimen

The El Castillo cave forms part of the karstic system of Monte Castillo (Puente Viesgo, Cantabria, Spain), where there are more than forty cavities excavated in Carboniferous limestone [18], six of them decorated during the Upper Palaeolithic, namely El Oso, El Lago, La Flecha, Las Monedas, La Pasiega, and Las Chimeneas. Monte Castillo is 385 m high and is a conical hill that dominates the left bank of the wide fluvial plain formed by the Pas river. The single entrance to the El Castillo cave is located at a point of 195 metres and is currently a large shelter as a result of the different archaeological excavations carried out since its discovery in 1903. This large shelter is protected from the exterior by a visitor reception building, while it connects to the rest of the cave through a small door for the passage of tourists in single file. The length of El Castillo cave is almost 800 m with a descent of −16 m, distributed in five main halls. The more eastern hall, closer to the cave entrance, is the largest volume of the cave (30 m wide, 25 m long, and 8 m high) [19]. Huge blocks and columns occupy the central area of this hall, determining the existence of numerous compartmentalised places and secondary corridors of minor dimensions, some of them currently connected by staircases for modern tourists. The microclimatic monitoring station is situated in the north of this large hall in a small chamber, namely Hands Ceiling, with an outstanding rock panel decorated mainly with non-figurative images but also including nine outlined bison, two engraved deer, and at least 40 hand stencils [20].
The Covalanas cave is located in a steep relief of the Lower Cretaceous Urgonian limestones of Mount Pando (Ramales de la Victoria, Cantabria, Spain). The single entrance to the cave is 320 m above sea level on the right bank of the Calera River. The cave is divided in two parallel running galleries; the one on the left extending 40 m and the right hand one a straight and quasi-horizontal passage of approximately 100 m long. The width of the longest gallery ranges 3–5 m until 60 m from the entrance, and it narrows to 1–2 m in the end sector where the microclimatic monitoring station is located. The gallery has hardly any speleothems of significant size, such as obstructing the direct bidirectional airflow between the cave and the exterior. This gallery contains stunning quality paintings, including figurative images and geometric signs, mainly located between 60 and 90 m from the cave entrance [21].
El Castillo and Covalanas are part of the seven Cantabrian caves open to the public. One of the main points of conflict is how to maintain public visits to these caves without endangering the conservation of the paintings [22]. The tourist demand for the caves has increased in the last two decades. In 2003, 64,570 visitors visited the region’s rock art sites, and following their World Heritage status, this figure increased to 117,731 in 2019 [23]. Most visitors come during the high- and medium-tourist season in Spain (May to September).
Ideally, a carrying capacity study should commence with the installation of instruments to establish a baseline of the cave’s natural environmental conditions, free from anthropogenic alterations and prior to any tourist activity. Achieving this requires nearly a year of microenvironmental recording without human disturbance [11,24,25,26,27]. Although this particular study began after years of tourist activity and some modifications to the natural environment, the cave, with restricted access during the COVID-19 pandemic, provided a unique opportunity. This closure allowed for the collection of data that closely reflected the cave’s natural state, minimising the influence of visitor activity and offering a valuable approximation of pre-tourism conditions.
The calendar and opening hours of the two caves studied were initially pre-established by the Government of Cantabria (https://cuevas.culturadecantabria.com/, accessed on 19 March 2025), setting as closing days for tourist visits every Monday of each week and on public holidays. The maximum quotas for each group of visitors accompanied by a guide were also established at 14 visitors/group (El Castillo) and eight visitors/group (Covalanas). In both caves, each guided visit takes approximately 45 min. Since the reopening of caves for tourism on 26 May 2020 after a forced public closure on 14 March 2020 due to the COVID-19 epidemic, these visitors per group quotas changed according to the health situation. Table 1 and Table 2 summarise the monthly and daily rates of visitors to the El Castillo cave and Covalanas cave, respectively, during the monitoring period of 2020–2022.
From 2020, marked by limitations and temporary closures to the public, until 2022, there has been a notable increase in the number of visitors to the three caves. In the El Castillo cave, there was a 72% increase in visits in 2021 (23,274 visitors) compared to 2020 (13,558 visitors from February to December), while in 2022 (41,415 visitors/year), the number of visitors tripled compared to 2020. In the Covalanas cave, visits doubled in 2021 (5196 visitors) compared to 2020 (2528 visitors from February to December), while in 2022 (7798 visitors/year), the number of visitors tripled compared to 2020.
On a daily scale, there was also an increase in the average and maximum daily visits to the three caves in all months of the year compared to the same period (month) of the previous year, except for the first quarter of 2021 (low season), when restrictions on tourist activity were still in place due to the health situation. At the El Castillo cave, the annual average of average daily visits increased from 55 visitors/day in 2020 to 72 visitors/day in 2021 and 127 visitors/day in 2022. The daily visitor flow rates at the Covalanas cave changed from monthly average values of 12 visitors/day in 2020 to 19 visitors/day in 2021 and 27 visitors/day in 2022.

3. Methodology

3.1. Environmental Control System

Each microclimatic monitoring station (one in each cavity) was equipped with the following instrumentation:
  • Datalogger Tinytag TGP 4505 (measuring ranges −25 + 85 °C and 0–100% RH) with external combined temperature and humidity (RH) probe: Thermistor 10 K NTC (accuracy: 0.35 °C, with resolution of 0.01 °C) and capacitive sensor (accuracy: ± 3.0% RH at 25 °C and resolution < 0.3% RH). Recording rate of 10 min.
  • SeaBird (SEB56) high-performance Temperature Recorder Probe: accuracy: ±0.002 °C (−5 to +35 °C); temperature range: −5 to +45 °C; resolution: 0.0001 °C. Recording rate: 5 min.
  • CO2 monitor, Goodsell Systems CO2log, equipped with an NDIR sensor with a measuring range of 400 ppm −10,000 ppm and accuracy +/− 30 ppm. Logging every 30 min.
  • AlphaE (Bertin Instruments, Montigny-le-Bretonneux, France) radon (222Rn) gas logger monitor, equipped with a silicon diode diffusion chamber detector. Measuring range: 20 Bq/m3 to 10 MBq/m3. Detector sensitivity: 3 cph at 100 Bq/m3. Recording every 1 h.
The location of the micro-environmental monitoring stations inside each cave was selected based on the presence of the main cave painting panels of interest under the technical supervision of the cave curators and managers, as well as according to the route and timing of guided tourist visits in each cave (Figure 2).
The meteorological data used in the study of the Cueva de El Castillo (Monte Castillo, Puente Viesgo, at approximately 187 m a.s.l.) correspond to the station ref. 1152 belonging to the State Meteorological Agency—AEMET—Spanish Government, located in San Felices Buelna, at 105 m a.s.l. and about 7 km to the west of Monte Castillo. In the case of the Covalanas cave (Ramales de la Victoria, 307 m a.s.l.), the meteorological data records were compiled from the AEMET Station ref. 1089U, located in the same locality at 80 m a.s.l. and 1.8 km northwest of the cave.

3.2. Assessment of the Impacts Generated by the Influx of Visitors on Air Temperature and CO2 Concentration

The use of a large amount of environmental data from different caves requires the use of statistical techniques to simplify and re-evaluate this environmental information. In this study, daily impact assessments of thermal and CO2 concentrations from visitors to each cave were conducted using a standard and widely used graphical method. This was based on the frequency distribution of variations in each parameter (temperature and CO2), grouped on box-and-whisker charts for different increasing daily visits. It is a simple and practical approach to exploratory data analysis, which allows for an accurate assessment of the range of variation in control parameters based on the probability distribution (interquartile range) of the variations generated in these control parameters. Hence, this would be a useful method, easy to implement and interpret by cave managers from their own microclimatic records and in confrontation with rigorous daily control of the number of visitors and access to their own caves.
For each range of daily visits, the following statistics have been calculated for the variations generated in each control parameter (temperature and CO2 concentration): median and first and third quartiles, as well as the maximum and minimum non-atypical values (variance) of each parameter (Figure 3). In this way, the daily impacts on the microclimate can be characterised for different increasing ranges of visits, and this information is synthesised graphically by means of box-and-whisker plots. The box-and-whisker method is based on the variance decomposition that can assess the contribution of input factors to the variance of outputs [28]. Each box plot shows the statistics used, including the median, third quartile, and first quartile, i.e., 50%, 75%, and 25% of the distribution of values for each parameter for a given range of daily visits to the cave (number of visitors each day).
With this method, it is possible to evaluate, probabilistically and in percentage terms, the microclimatic destabilisation of the cavity generated by each group of visitors, taking as a reference the daily variation ranges of each control parameter under natural conditions, i.e., during the days or periods in which each cave remained closed to tourist visits. To this end, it must be considered that the caves were closed every Monday during the three-year monitoring period, to which must be added the forced closure between 14 March and 26 May 2020 due to the stoppage of tourist activity due to the COVID-19 health crisis.

4. Results

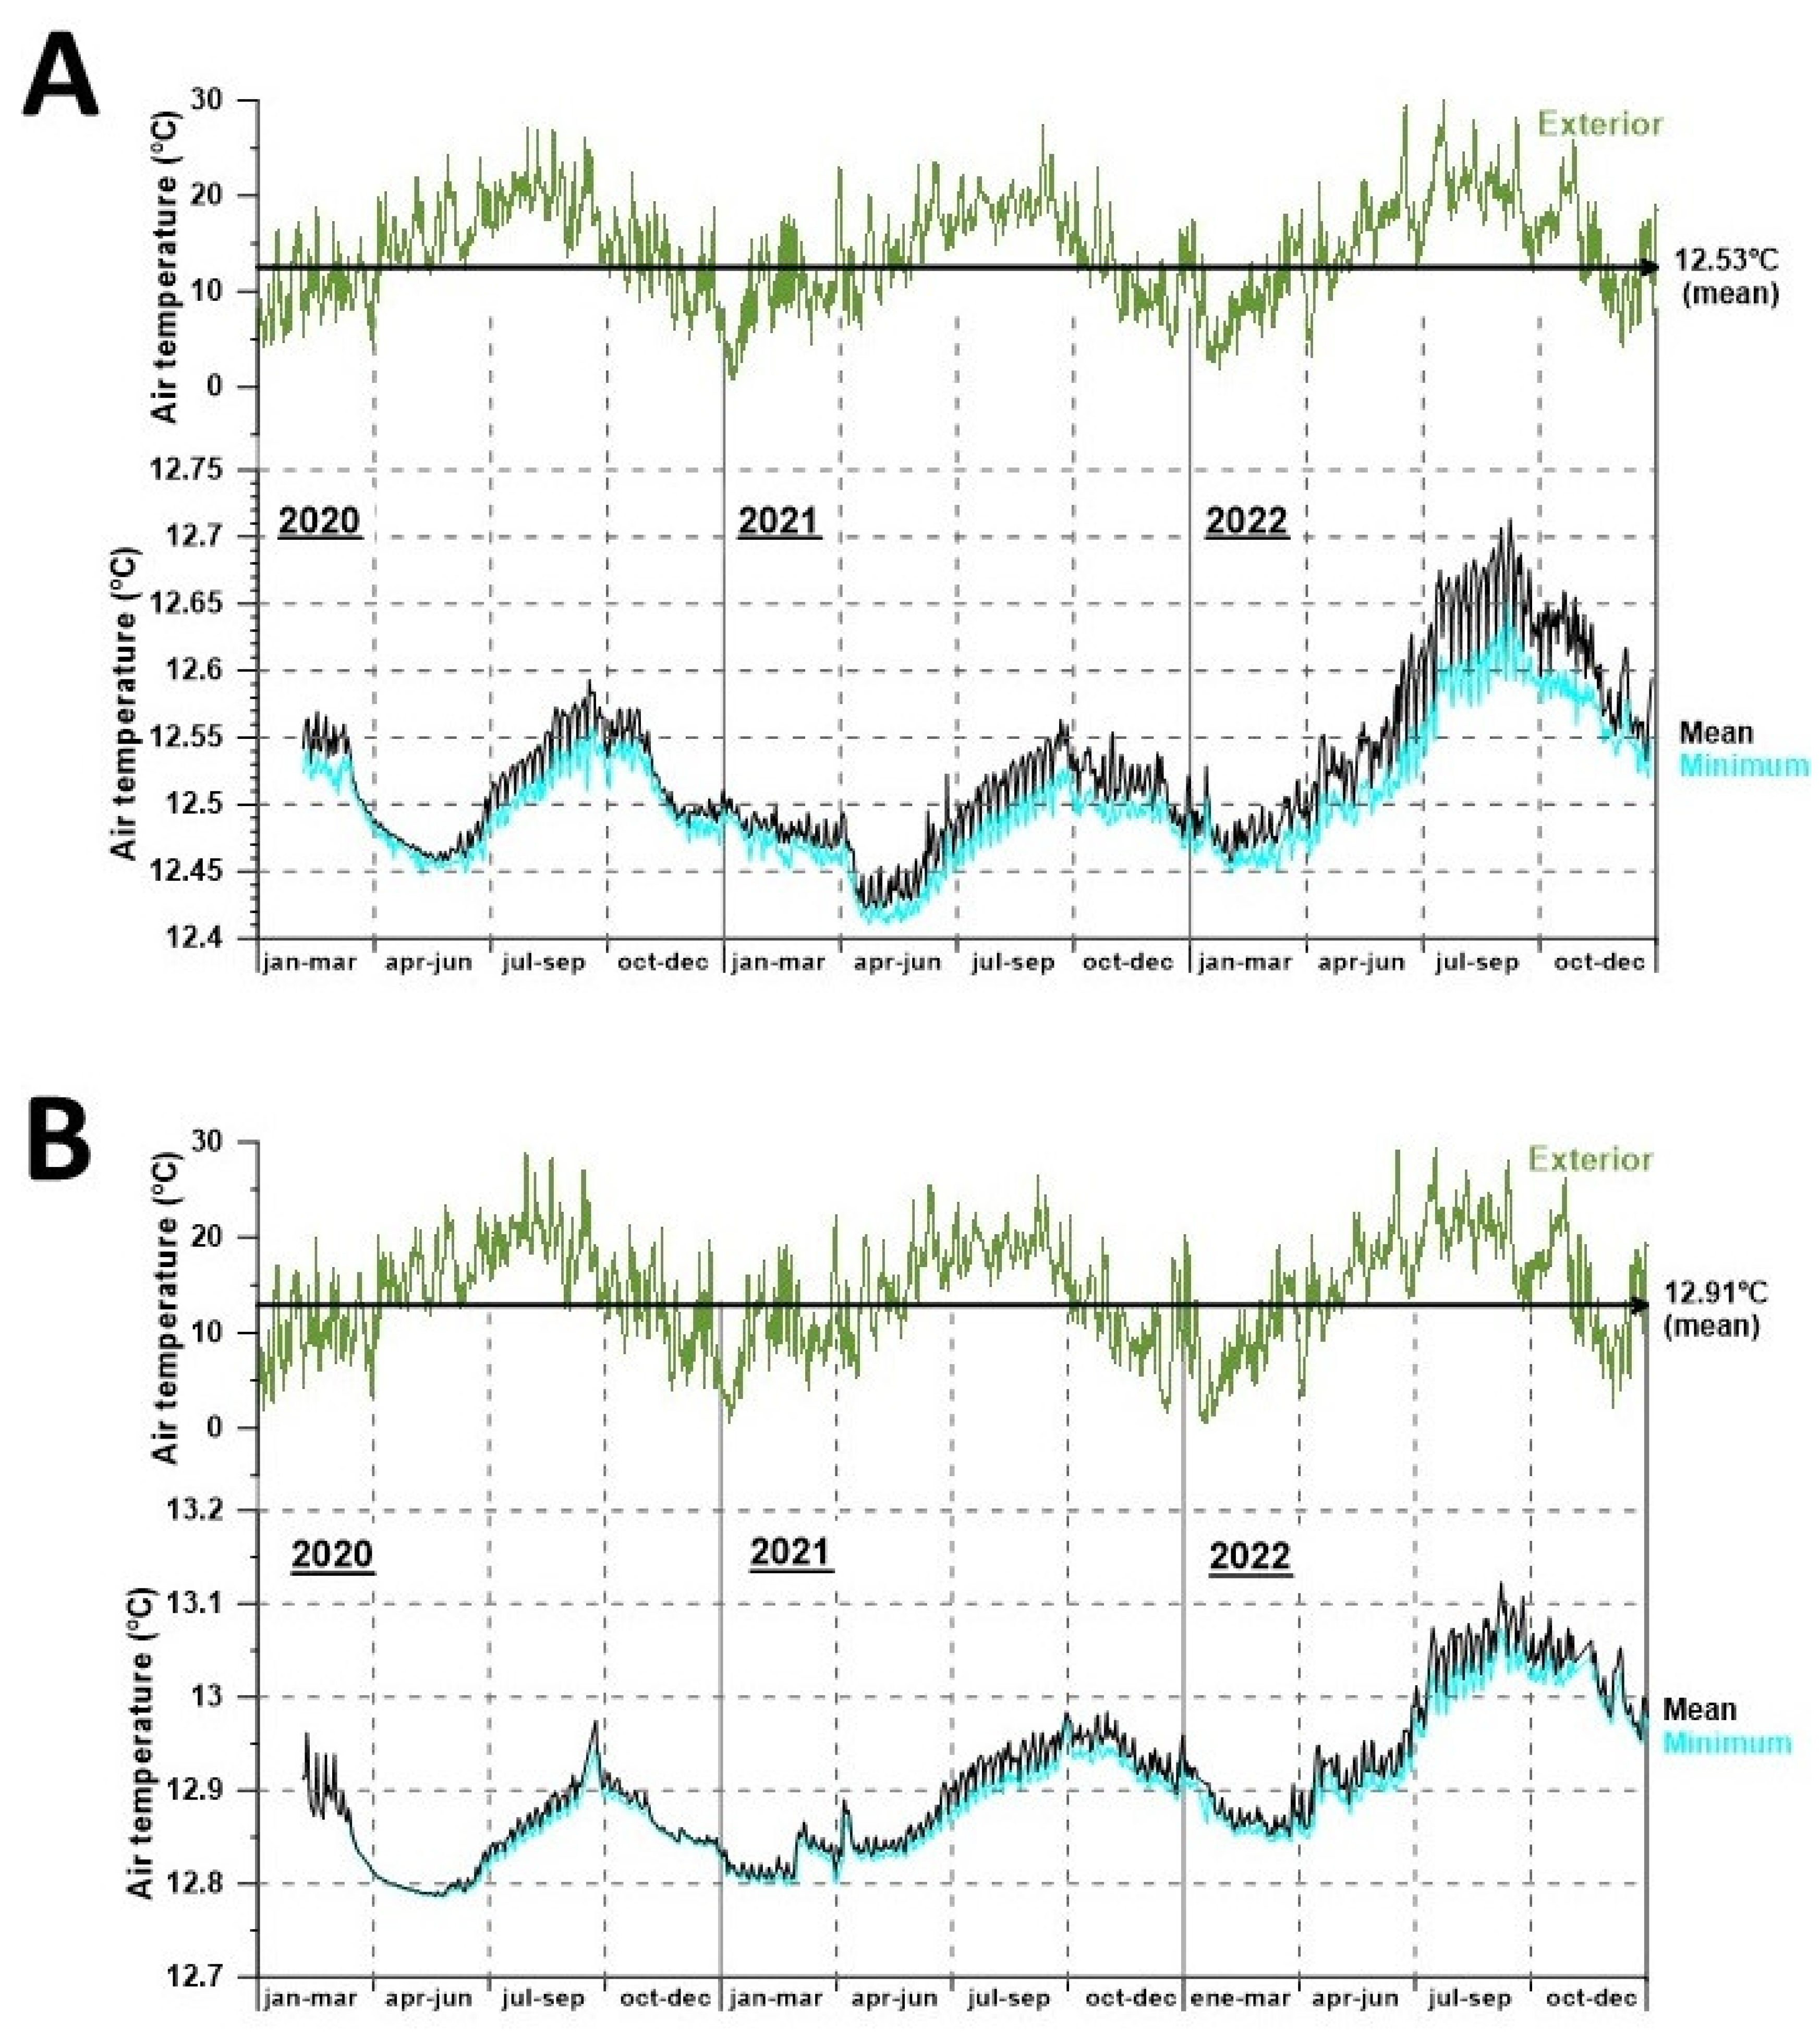
4.1. Temporal Evolution of Cave Air Temperature

The air temperature in a cave is a reliable parameter that is easy to measure and calibrate, and it responds clearly to any alteration of the subterranean environment. Precision thermometers, such as those used in this study, can detect small-magnitude thermal changes (±0.001 °C), which is particularly important in an underground environment where the spatiotemporal stability of this parameter is extremely high. Moreover, from a temporal perspective, temperature recovery curves show minimal hysteresis and therefore are usually more representative and accurate of environmental recovery than those provided by any other microclimatic variable.
Figure 4 shows the evolution of the daily mean and minimum air temperature of each cave during the entire recording period together with the evolution of the outdoor temperature.
Both caves show a similar pattern of internal temperature variation governed by external climatic conditions and anthropogenic factors such as visitor entry and fixed lighting equipment present on the tourist trail. The influence of the local climate is evident in the sinusoidal shape of the annual air temperature evolution curve (Figure 3) although with a certain time delay of 1–2 months in the internal response to external temperature variations. In both caves, the maximum temperatures are recorded in the third quarter (August–September), while the minimum temperatures occur between the first and second quarters, strongly influenced by the number of visitors during these periods in each of the years analysed. This strong influence of visitor flow is superimposed on the natural pattern, as demonstrated by studying the data collected during the closure of the caves to the public due to the COVID-19 pandemic from 14 March to 26 May 2020. During those two months without visitors, the minimum and average temperatures were practically the same in the two caves, falling progressively. This drop was interrupted with the reopening, being most notable in the El Castillo cave, where the trend seems to indicate that the visitor regime exerts an impact that keeps the underground air overheated.

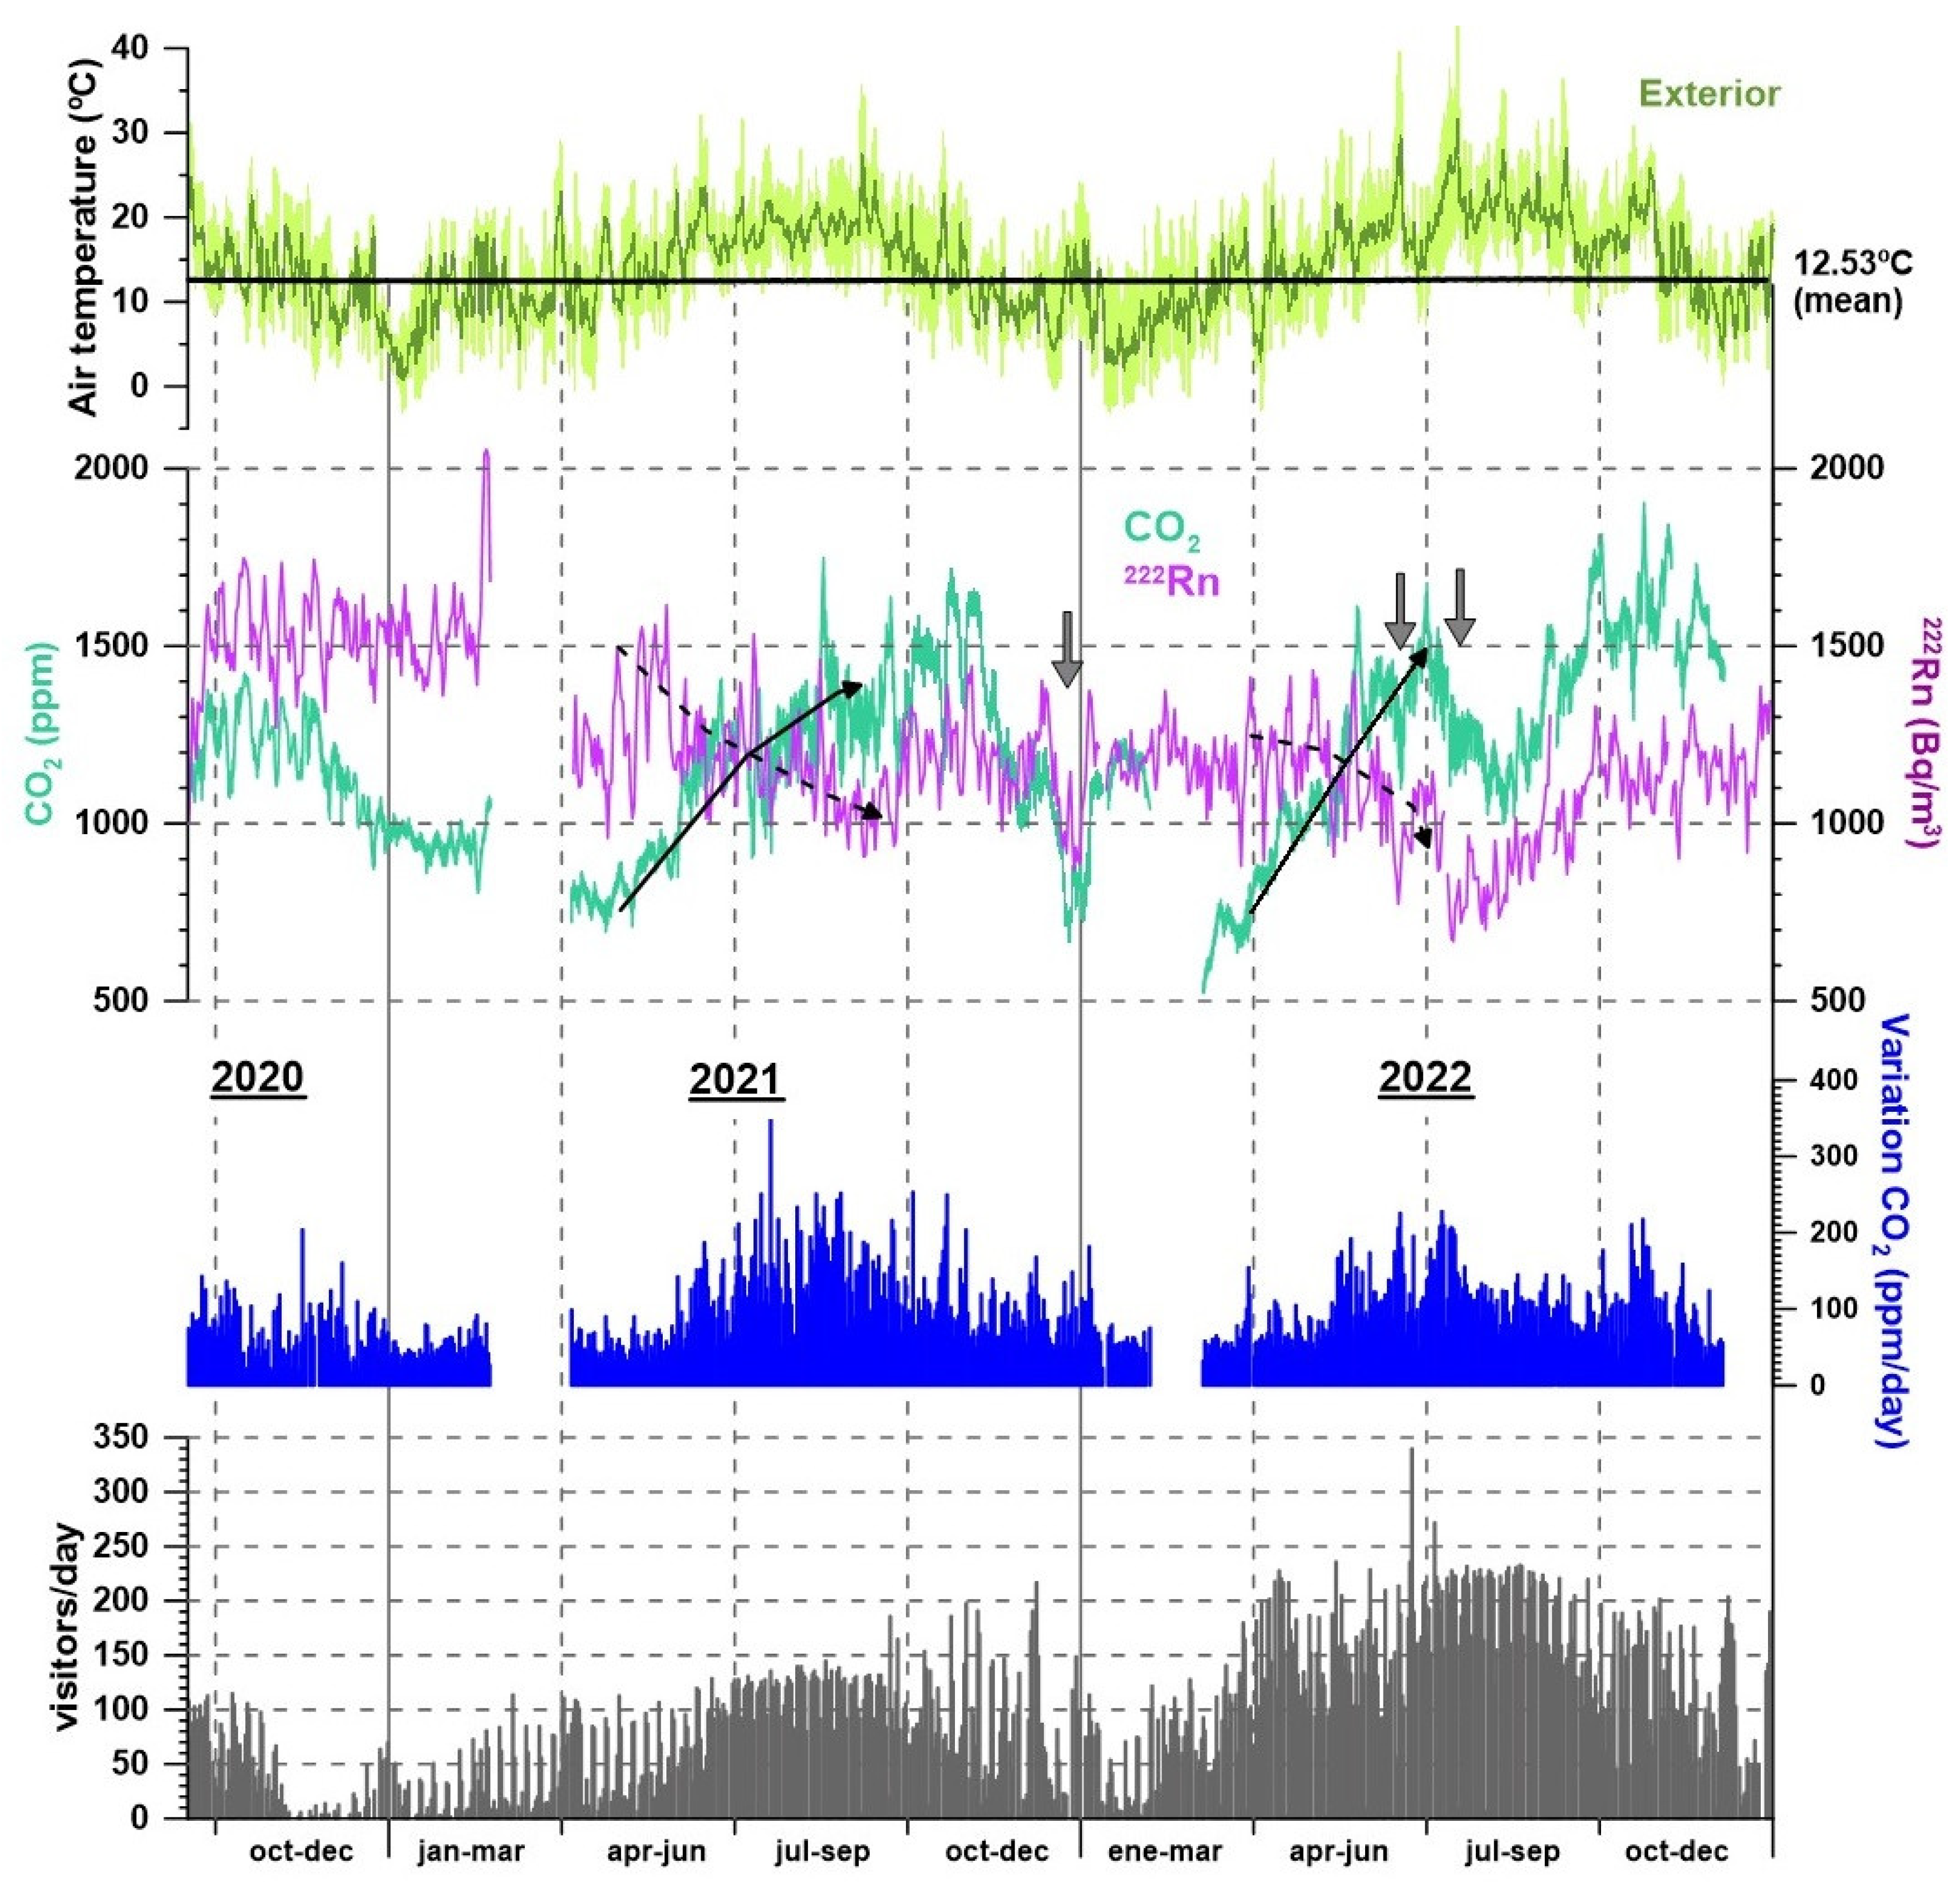
4.2. Gaseous Composition of Caver Air

Monitoring the composition of underground air in gases such as carbon dioxide (CO2) or radon (222Rn) is key to characterise the process of the renewal or mixing of air with the external atmosphere and, therefore, monitoring these tracer gases allows us to evaluate over time the degree of isolation and environmental stability of a cavity. Controlling CO2 concentration is also essential in the study of speleogenetic processes, and its detailed monitoring allows us to evaluate the degree of environmental destabilisation generated by visits which, together with thermal disturbances, can activate the deterioration processes of the rock supporting the cave paintings. In particular, the CO2 emitted by visitors’ respiration can dissolve in the infiltration or condensation water that is in contact with the supporting rock, triggering corrosion processes [27,29,30,31,32,33,34].
As an example, the time evolution of the composition of the air in the El Castillo cave is shown with reference to these two tracer gases (Figure 5). The mean annual CO2 concentration in the El Castillo cave remained stable during the period of 2021–2022 (1225 ppm and 1255 ppm, respectively). On an annual scale, the mean monthly concentration of the gas showed a seasonal evolution pattern, in general, with relative maximum values above the annual mean in summer and early autumn (in a range between 1400 and 1800 ppm, from July to October) and minimums in March–April (with mean concentrations below 1000 ppm). In 2022, the peaks in the mean monthly radon concentration were reached later (1586 ppm in October–November), which seems to respond to the significant increase in visits compared to the previous year, as evaluated in detail in the following:
Daily variations in CO2 concentration in El Castillo are greater than 100 ppm/day in the summer period (May to October), when the average outside temperature is higher than the temperature of the cave and the daily influx of visitors reaches its maximum values (>100 visitors/day in 2021 and >150 visitors/day in 2022). On the contrary, in the remaining months, daily variations in CO2 concentration were recorded within a narrow range between 50 and 80 ppm/day. On an annual scale, seasonal variations in CO2 have a range of around 1000 ppm in each of the years studied.
The average concentration of radon ranged from 1183 Bq/m3 in 2021 to 1100 Bq/m3 in 2022. On an annual scale, seasonal variations in radon were recorded with an amplitude of approximately 1100 Bq/m3 in both years, although there is not a defined pattern as in the case of CO2. The minimum values in the monthly mean concentrations were recorded in July–August, whereas the maximum values do not follow a defined seasonal pattern.
The opposite evolutionary trend between the two gases in the El Castillo cave during the period when the outside temperature is higher than that of the cavity (April–September) reveals the clear seasonal anthropic effect on CO2 levels, which masks the summer ventilation process in this gas. On the other hand, the ventilation process is confirmed, since the levels of radon follow a decreasing trend during the summer period, indicating an active renewal of the underground air. Thus, from mid-June and throughout the summer months, the outdoor air temperature is clearly above the internal temperature. In this thermal situation, a convective ventilation process is triggered, evacuating the lower-temperature air from the inside and renewing it with warmer air from the outside. This aerodynamic exchange should preferably take place through discontinuities in the rock and karstified zones located at lower elevations with respect to the cavity and within the Monte Castillo karst massif. The ventilation pulses in both cavities, detected by the rapid dilution of the subsurface air in CO2 and radon, coincide with significant increases in the outside temperature during the recurrent succession of abnormally high-temperature periods in summer (e.g., in 2022).
The relative minimum levels of CO2 in the winter period in the El Castillo cave could indicate that the prevailing cave ventilation favours a gradient of air density, which would imply the entry of external air, colder and denser, and the removal of the subterranean air, at a higher temperature and less dense than the outside atmosphere. However, this process cannot be asserted, since this decrease in CO2 levels during winter also coincides with the lower rate of visitors in winter.
In the Covalanas cave, the mean CO2 concentration varied from 1178 ppm in 2021 to 1442 ppm in 2022 (Figure 6), a fact that appears to be related to the significant increase in visitation; the annual influx of visitors in 2022 was 1.5 times higher than that recorded in 2021. On an annual scale, no clear seasonal pattern in CO2 concentration was recorded, so that relative maxima in monthly averages varied from year to year; 1460 ppm on average between October and December 2021 and between 1800 and 1900 ppm recorded in April–May 2022. Minimum concentrations were recorded in January–February, presenting a notable interannual difference in their average values as a result of the increasing cumulative effect of anthropogenic impacts on gas levels.
The mean radon concentration in the Covalanas cave was 1340 Bq/m3, with interannual variations in the range of 1100–1600 Bq/m3 for the monitoring period. Seasonal variations in radon were recorded with minimum values in monthly mean concentrations in July–August (<1000 Bq/m3), while maxima were usually recorded between March and May (>1300 Bq/m3).
Short-period fluctuations in radon levels are correlated with CO2 variations, at least those with a periodicity greater than daily. Similarly, the decreasing trend recorded in the concentration of both gases in the second half of 2022 reveals an important seasonal ventilation of the cavity, controlled by the succession of periods with abnormally high external temperatures, as described in the El Castillo cave for the same period. This seasonal ventilation was not as evident in previous years. The Covalanas cave is located on the northeastern slope of Monte Pando, which forms a very steep relief with a difference in elevation of more than 200 m with respect to the valley formed by the Calera River. In this context, cave ventilation events, such as the one described above, occur preferentially through discontinuities in the rock and karstified areas of Monte Pando located at lower elevations with respect to the cavity.
Unlike the El Castillo cave, the Covalanas cave shows a high average daily variation in CO2 concentration (247 ppm, on average, for the 2021–2022 biennium) compared to the average daily variations recorded for the same period in the El Castillo cave (97 ppm). This greater daily variability (not observable in the radon records) is clearly related to the effect of the visits and is influenced, to a large extent, by the reduced dimensions of this cave, which determine that the impacts of the visits on the gas levels are more pronounced. Therefore, taking as a reference a value of 400 ppm/day in the variability of CO2 in Covalanas, in 2022, there was a higher frequency of days in which this value is exceeded compared to the previous year due to the increase in the number of visitors from one year to another.

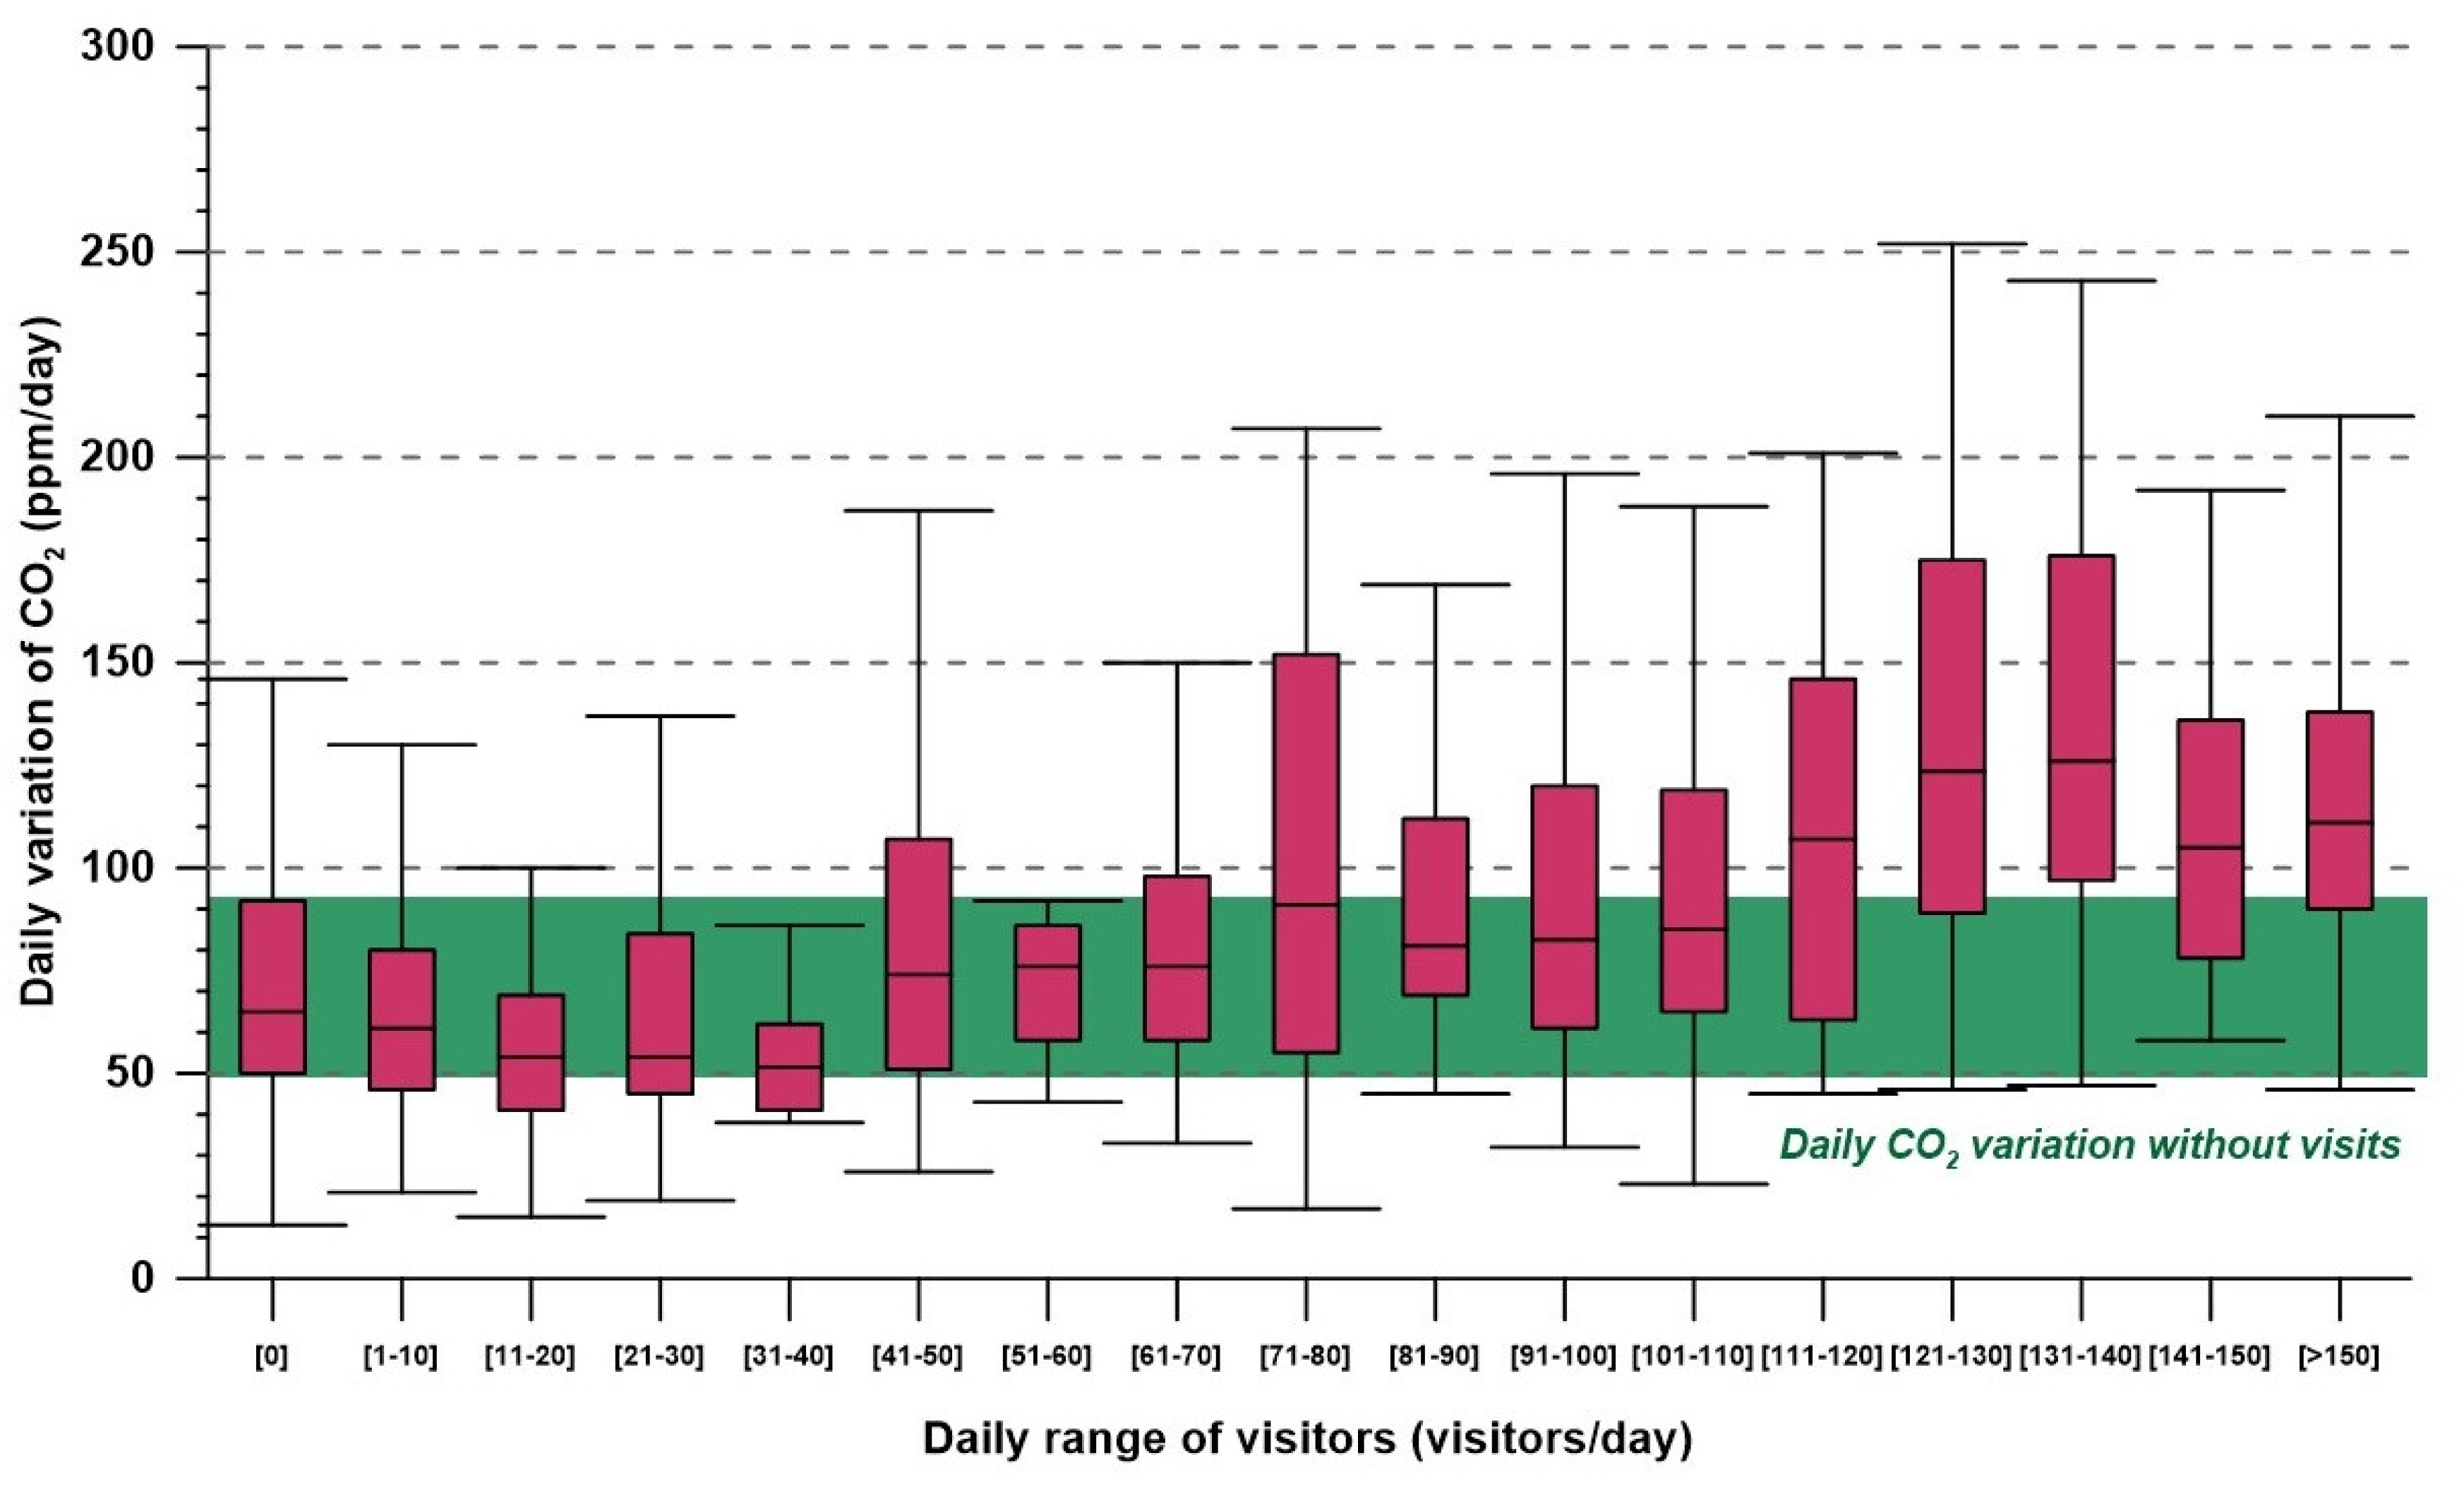
4.3. Criteria for Preliminary Evaluation of the Microclimatic Destabilisation Generated by Daily Visits

With the box-and-whisker method, it was possible to evaluate probabilistically and in percentage terms the microclimatic destabilisation of the cavity generated by each group of visitors, taking as a reference the daily variation ranges of each control parameter under natural conditions. These conditions were approximately reached during the days or periods of time that each cavity remained closed to tourist visits (every Monday during the three-year monitoring period and during forced closure between 14 March and 26 May 2020).
The priority criterion for establishing recommended maximum thresholds of microclimatic destabilisation is that no cumulative effects are generated in daily increases in the key parameters (temperature and CO2) due to the continuous entry of visitors. In the event to register short- or medium-term cumulative effects, a pattern of seasonal variation should persist, i.e., that the annual relative minimum and maximum values of each control parameter do not show an inter-annual increasing trend.
To avoid long-term microclimatic destabilisation, it is important that thermal impacts and increases in the CO2 concentration of cave air do not exceed, on a daily scale, a certain percentage of those recorded under natural conditions without visits. Through a detailed analysis of the time series for both control parameters, we identified the daily deviations caused by visits that can produce cumulative medium-term effects. Additionally, we quantified the percentage of these variations relative to the natural variation range of each cave. This analysis was based on statistical distributions of variations in each control parameter (temperature and CO2). With this methodological approach, the criteria adopted to establish the microclimatic destabilisation thresholds for gradual increases in the range of daily visits are as follows:
  • Reference threshold: The value of the third quartile (Q3 = 75%) of the data set of variations in the control parameter does not exceed the same statistic calculated for the variations in natural regime (without visits). Alternatively, at least, it does not exceed the maximum daily variation in this parameter (maximum non-atypical, i.e., non-outlier) in the periods in which the cave is closed to tourist visits.
  • Maximum threshold: The interquartile range of the variations in the control parameter does not lie in its entirety above the third quartile (Q3) or the maximum daily variation (maximum non-atypical, i.e., non-outlier) of the data set of variations in the control parameter in the natural regime (without visits). The interquartile range represents the middle 50% of the data, that is, it shows the distance between the first quartile and the third quartile (Q3–Q1), thus representing the most frequent variations in the control parameter considered.

4.3.1. Microclimate Disturbances by Visitors in El Castillo Cave

The variations in air temperature in the El Castillo cave generated by the daily influx of visitors are shown in Figure 7. The maximum daily thermal amplitude during periods without visitors was 0.03 °C, with an interquartile variation range of only 0.01 °C. This high thermal stability under natural conditions was altered with the continued entry of a small number of visitors per day, showing a clear increasing trend in daily thermal variation as the ranges of daily visitors increase. Rapid thermal destabilisation, generated even in reduced ranges of visits (10–20 visitors/day), may be caused by the cave lighting system, which remains on during all opening hours to the public. The calorific effect of lighting causes the air temperature to exceed the maximum ranges of thermal variation in natural conditions, increasing the thermal impacts synergistically as the daily number of visitors increases.
The daily thermal impacts were lower than 0.10 °C for an influx of the public of less than 50 visitors per day, considering the third quartile (Q3) of the variations as a reference statistic. Thermal destabilisation followed a more attenuated linear behaviour for increasing ranges of daily visitation, reaching variations of 0.16 °C/day (Q3) and maximums of 0.22 °C/day for ranges up to 140 daily visitors. This attenuation in the increasing trend of thermal impacts when the number of visitors increases would be indicative of the high heat adsorption capacity of the subterranean atmosphere, favoured by the dimensions of the cave, as well as by the possible activation of air mass exchange processes between different sectors of the cave. On the other hand, when the number of visitors exceeded 140 visitors/day, the impact increased and 50% of the daily thermal variation values (interquartile range) exceeded 0.15 °C, with maximum values between 0.30 and 0.35 °C/day. Therefore, the thermal impacts generated by visits to the El Castillo cave clearly exceeded the maximum pre-established thresholds of microclimatic destabilisation. The reference threshold was exceeded with the entry of only a maximum of 10 visitors per day, while the maximum threshold was exceeded for ranges of more than 20 visitors per day.
It is possible to set a more flexible limit on the daily influx of visitors into the cavity, assuming that these daily thermal fluctuations can cause cumulative effects in the short or medium term. This more flexible limitation would lead to the generation of daily thermal impacts above the present thresholds, but on the other hand, it allows the variation in air temperature to follow a pattern with seasonal minimums that do not show an inter-annual increasing trend and that, therefore, are indicative of the thermal recovery of the cavity in the medium term.
With this approach, the total closure of the cavity to tourism as a consequence of the stoppage of activity due to the COVID-19 health crisis (between 14 March and 26 May 2020) has allowed us to determine the ranges of daily temperature variation without anthropogenic influence over a longer period. In addition, we defined the trend and some thermal stabilisation characteristic of a regime closer to the natural regime of the cavity. Specifically, during this period of closure to the public, the air temperature varied in a narrow range of 0.03 °C, with minimal daily variations (0.01 °C/day) and, most remarkably, it reached a stable base level of 12.46 °C without an increasing trend (Figure 8). This pattern of air temperature stability contrasts with the periods of accumulation of thermal impacts recorded during periods of a high daily rate of visits.
This pattern of thermal stability was again recorded in certain periods with a moderate daily visitation rate, specifically from February to June 2021 and between January and February 2022. During these months, the mean air temperature oscillated within the natural range of thermal variation recorded during the period of total closure of the cavity to the public, although thermal impacts continued to be recorded with daily maximum temperatures that did not exceed 12.6 °C, with an effective daily recovery and, therefore, without signs of cumulative effect. In short, this thermal situation of the cavity in the visitation regime can be considered as the closest to that recorded in natural conditions and, therefore, would mark a first reference to determine a sustainable daily visitation ratio considering temperature as a critical control parameter. The ratio of visitors associated with this pattern of thermal stability of the cavity corresponds to a daily influx of 54 visitors in terms of monthly average, with daily maximums of less than 130 visitors/day. According to the temperature disturbances generated by the daily influx of visitors to the El Castillo cave (Figure 7), the average visit of 54 visitors/day would imply a daily destabilisation of the temperature in the range of 0.05 to 0.11 °C without generating a short-term change in trend. On the other hand, in the case of maximum daily visits of up to 130 visitors, the maximum thermal variation generated could reach 0.22 °C and be less than 0.16 °C on most occasions.
The variations in the CO2 concentration of the air in the El Castillo cave generated by the daily influx of visitors are shown in Figure 9. Under natural conditions, without visitors, the daily variation in CO2 concentration was within a wide range, between 10 and 145 ppm, with an interquartile range between 50 and 90 ppm that included 50% of the most frequent daily variations in this parameter. Therefore, the reference threshold under natural conditions is 90 ppm/day, that is, the one corresponding to the third quartile of daily variations in CO2 in the unvisited regime. This threshold of daily variation in CO2 was continuously exceeded when the ratio of visitors to the cave is greater than 60 visitors/day, reaching a maximum variation of 180 ppm (Q3) when visits reached a range of 120 to 140 visitors/day.
The maximum threshold, marked by the interquartile range of daily CO2 variations in the natural regime, was exceeded with daily visits greater than 130 persons/day. Above this daily visitation ratio, impacts on CO2 levels regularly exceeded 90 ppm/day with an absolute maximum of up to 250 ppm, thus increasing the likelihood of triggering a cumulative effect on daily impacts on CO2 concentration. These reference and maximum thresholds determined using CO2 concentration as a control parameter (60 visitors/day and 130 visitors/day, respectively) agree with those estimated from the seasonal evolution of temperature in reference to the basal temperature reached under natural conditions.

4.3.2. Microclimate Disturbances by Visitors in Covalanas Cave

The variations in air temperature in the Covalanas cave (Figure 10 and Figure 11) are analysed below by applying both the standardised graphical method based on the frequency distribution of the daily variations in this parameter and the environmental destabilisation thresholds mentioned above based on the inter-annual trend of seasonal minimums of temperature. This cavity presents a high thermal stability on a daily scale while it remains closed to tourist visits, with a maximum variation of only 0.05 °C/day (non-atypical maximum) so that the influx of small groups of more than 10 visitors/day already generates thermal impacts above this threshold under natural conditions (Figure 10). The thermal impacts increase progressively for increasing ranges of daily visits, with daily temperature variations reaching 0.20 °C with an influx of 40 visitors/day, considering the third quartile as the reference statistic.
During the 72-day period of continuous closure for visitors (14 March to 25 May 2020), the temperature varied only by ±0.03 °C around 12.80 °C and did not present any notable daily cycles (Figure 10). This reference pattern of thermal stability under natural conditions continued in the initial stages of the reopening of the cave to tourism (June 2020) and returned seasonally during the two-month period of January–February 2021, with daily amplitudes due to the influx of visitors that did not exceed 0.10 °C/day. The number of visitors during these periods was limited, with a monthly average of 11 visitors/day and monthly maximums always below 25 visitors/day. In contrast, in the same winter period of the following year (January–March 2022), the air temperature, despite following a decreasing trend, did not reach these reference levels of stability (Figure 11). The cumulative effect on air temperature during 2022 was quite intense and demonstrated the fragility of the cave in the face of such a large-scale visitation regime.
The above periods of thermal stability in a limited regime of visits were interrupted in the following months by a change in the trend of the average air temperature due to the accumulation of daily thermal impacts. This cumulative effect on impacts was triggered once the average monthly visitor flow rates exceeded 15 persons/day. According to the temperature disturbances generated by the daily influx of visitors to the Covalanas cave, the average visit of 15 visitors/day would imply a daily destabilisation of the temperature, with an interquartile range between 0.05 and 0.11 °C/day and maximum impacts around 0.17 °C/day (non-atypical maximums). These thermal changes are usually lower than the maximum daily amplitudes recorded during periods of the limited rate of visitor per day and, therefore, would allow for a thermal pattern like that recorded under natural conditions to be achieved with variations of less than 0.10 °C/day and no trend changes in the mean temperature.
The variations in CO2 concentration in the air of the Covalanas cave generated by the daily influx of visitors are shown in Figure 12. The levels of daily variation in this gas in the periods without visitors presented an interquartile range between 50 and 210 ppm, which encompasses 50% of the most frequent daily variations, with maximums (not atypical) reaching 440 ppm/day. The upper limit of the interquartile range (Q3 = 210 ppm) was significantly higher than that recorded in the El Castillo cave (90 ppm/day).
Despite the remarkable daily amplitude in CO2 concentration in the Covalanas cave, the influx of more than 15 visitors/day caused an impact on gas levels higher than the variations recorded under natural conditions, considering the third quartile as the reference statistic. For visitation ratios greater than 20 visitors/day, 50% of the most frequent impacts on CO2 levels exceeded the interquartile range of daily gas variations during non-visitor periods. As the range of daily visitor influx increased, the impacts on CO2 concentration increased linearly from 350 ppm/day (21–25 persons/day) to 550 ppm/day (41–45 persons/day), considering the third quartile as the reference statistic. In a regime of maximum daily visitor flow (>45 visitors/day), half of the most frequent impacts always exceeded 350 ppm/day, reaching maxima (non-atypical) of 800 ppm/day. Compared to the El Castillo cave, these daily impacts on CO2 concentration were much higher. In this sense, the influx of only 20–30 visitors/day into the Covalanas cave already generated CO2 variations higher than the maximum recorded in the El Castillo cave under the maximum daily influx of tourists (>100 visitors/day).

5. Discussion: Optimal Ranges of Daily Visits in Each Cavity

Contemporary leisure tourism, which is characterised by an increase in the number of visitors to underground places such as caves, poses a significant threat to the preservation of cultural heritage. Archaeologists, environmentalists, and microbiologists are increasingly arguing for the need to take restrictive measures to mitigate the deterioration, including a temporary or permanent closure of caves. This research-supported view emphasises that human intervention is critical in the environmental disruptions of these subterranean ecosystems [4].
Monitoring air temperature and CO2 concentration with an adequate resolution and temporal extension allows us to characterise the behaviour of the cavity relatively close to the natural one, as well as to analyse the destabilisation of the subterranean environment in the event of a change in anthropic origin of a certain magnitude. Both parameters are critical due to their key role in the biogeochemical processes involved both in the speleogenesis of a cavity and in the mechanisms of deterioration of the elements it may harbour. Therefore, monitoring these parameters is essential for a basic characterisation of the microclimatic dynamics of a cave, as well as for the design of an environmentally sustainable tourist visitation regime [8,11,27,35,36,37,38].
There are numerous examples of tourist caves under continuous environmental control, but in many cases, the analysis of the microclimatic destabilisation generated by continuous visits over time is usually addressed once the cave has been opened to tourism or after a long history of visits, which prevents us from knowing its environmental characteristics in a natural regime.
The detailed monitoring of basic microclimatic parameters in the UNESCO World Heritage caves with rock art with different morphology and galleries sizes and under different public attendance ratios has provided the basis for defining numerical tools for the sustainable management of each cave. These tools focus on defining the carrying capacity of each tourist cave. The carrying capacity is based on a flexible model that combines the analysis of environmental conservation situations with the need for tourism management and maintenance [39]. Carrying capacity must be a planning tool designed to open further avenues that consider the needs of several actors, such as inhabitants, scientists, decision makers, and tourism professionals [12,40].
Strictly from the point of view of cave protection, visitor capacity would be established as the maximum flow of visitors to the cave that causes changes in a key environmental variable, such as air temperature or CO2 concentration, within its natural range of fluctuation [9]. Ideally, the determination of the transport capacity of tourists for individual underground sites should also include microbial indicators, since visitors introduce and disperse many airborne particles and microorganisms in the cave environment [17]. The carrying capacity of a cave can be quantified by the break in slope of the curve of the temperature time series, which would be considered as the first effect of destabilisation [13]. A similar approach established that the sum of temperature increments produced by visitors must be less than the maximum temperature variation under natural conditions. For instance, Hoyos et al. [11] estimated a carrying capacity of 29 visitors/day for the Candamo cave, Spain. Another suitable approach is to define the maximum number of people that can be accommodated simultaneously inside the cave without inducing a thermal imbalance, e.g., 53 visitors for the Agua cave, Spain [8]. Others particular factors related to the visits, such as how varying walking speeds and queue formations, affect the cave’s carrying capacity have also been studied [41].
To ensure their protection, some caves such as Lascaux, Altamira, or Chauvet are, partially or totally, closed to the public due to their vulnerability to the environmental disruption due to the continued presence of visitors. The access to the Lascaux cave is strictly limited in order to respect the number of hours of human presence determined to be acceptable by environmental monitoring studies. Indeed, in 2013, access was limited to 390 human-hours in the decorated part of the cave and 194 human-hours in the vestibule sector [42].
The Altamira cave has repeatedly closed its doors after noticing a rapid degradation of the Palaeolithic paintings or due to the appearance of phototrophic microorganisms on the decorated ceiling of the Polychromes hall [43]. However, public access to this cave was resumed in 2014, although restricted to a very low number of visitors (five per week). This preventive conservation strategy currently in place, while essential, has not proven to provide sufficient mitigation of the degradation observed in recent years. Indeed, there are currently obvious signs of pigment loss at specific locations on the ceiling of the Polychromes hall due to increased water infiltration [44,45], probably due to inadequate management of the vegetation cover in the water catchment area outside.
In contrast, the Chauvet–Pont d’Arc cave is a paradigmatic case with an astonishing preservation state, where the environment has been kept mostly unchanged and controlled since its discovery and no evolution has been recorded in the cave microclimate [6]. Due to its great fragility, the French State declared in 1995 that the cave would be not opened to the public, being only accessible for research under comprehensive protection measures, including a restriction of access to certain areas and time-limited access [46].
The evaluation of the microclimatic destabilisation generated by visits and the proposal of the daily regime of visits for the El Castillo and Covalanas caves were based on the following tools: (1) impacts on the microclimatic control parameters (temperature and CO2 concentration in the air) generated by different ranges of daily visits and (2) a reference pattern of thermal stability under natural conditions and an evaluation of its seasonal repetition under a limited regime of visits. This reference pattern has been defined in an approximate way, taking advantage of the 72-day environmental recovery period of the caves due to the closure to the public (COVID-19 health crisis). Table 3 summarises the recommended daily rate of visitors for each cave and their corresponding expected microclimate destabilisation. According to the weekly open-to-the-public calendar (from Tuesday to Sunday), the recommended visitor capacity values for each cave are 60 visitors per day on average in the El Castillo cave with a maximum daily rate of 130 visitors per day, while in the Covalanas cave, the maximum daily rate of 15 visitors per day is 25 visitors per day. These carrying capacity thresholds correspond to a sustainable regime of daily visits to each cave so as not to generate changes in the microclimatic control parameters of a magnitude greater than their natural variations on a daily and/or seasonal scale, nor to generate cumulative effects.
The proposed carrying capacity thresholds are key to regulating the visit regime of each cave, where thermal disturbances under a humidity close to saturation during the year-long cycle are critical for triggering some biogeochemical processes. In addition to high humidity, the dilation of the recovery period would favour the microcorrosion of rocks that support paintings among other biodeterioration processes associated with the metabolic activation of microorganisms present on rock surfaces or potential colonisation [47].

6. Conclusions: Effective Implementation of Corrective Measures

The possibility of incorporating the results of environmental monitoring in caves into a comprehensive management model, which also takes socioeconomic aspects into account, is the main interest of this type of research for managers of show caves. Such monitoring will also allow for the adjustment of initial carrying capacity thresholds as a function of changes in consumption patterns, local realities, and the identification of unanticipated but unacceptable environmental impacts [40]. The tourism stakeholders and cave conservation technicians from the autonomous government of Cantabria have carried out a progressive adaptation in the tourism management of these caves until they are fully adapted to the environmental sustainability defined in this study. The new visiting regime maintains the opening of the two caves from Tuesday to Sunday and reduces the number of daily accesses to the caves and the number of visitors in each of them through two phases, namely a transitory one from 10 May 2024 until 15 September 2024 and a definitive one from this last date. The El Castillo cave went from receiving 1236 visitors per week to 780 during this transitory phase, through 10 passes per day with a maximum of 13 people per visit. With the definitive regime, the El Castillo cave can be visited by a maximum of 384 people per week, with eight passes and a maximum of eight visitors per pass (including the cave guide). In the Covalanas cave, these visits rates were adjusted from 102 visits per week to 90, both in the transition period and in the definitive period, through three visits per day of five people each (including the cave guide). In any case, this proposal of recommended daily visit limits for each cave is preliminary in nature, and there is an ongoing continuous environmental monitoring after it was fully implemented to assess its suitability and effectiveness in the medium and long term.

Author Contributions

Conceptualization, A.F.-C. and S.S.-M.; methodology, A.F.-C. and S.S.-M.; validation A.F.-C., S.S.-M., and S.C.; formal analysis, A.F.-C. and S.S.-M.; investigation, A.F.-C., E.P.-P., T.M.-P., S.C., R.O., J.L., and S.S.-M.; resources, E.P.-P. and R.O.; data curation, A.F.-C.; writing—original draft preparation, A.F.-C., S.S.-M., and J.L.; writing—review and editing, A.F.-C., S.S.-M., and J.L.; visualisation, A.F.-C. and J.L.; supervision, A.F.-C.; project administration, A.F.-C. and S.S.-M.; funding acquisition, A.F.-C. and S.S.-M. All authors have read and agreed to the published version of the manuscript.

Funding

This research was funded by the “Consejería de Universidades, Igualdad, Cultura y Deporte del Gobierno de Cantabria” and the Spanish Ministry of Science, Innovation through project PID2023-146299OB-C21. This is a contribution from CSIC Interdisciplinary Thematic Platform Open Heritage: Research and Society (PTI-PAIS).

Institutional Review Board Statement

Not applicable.

Informed Consent Statement

Not applicable.

Data Availability Statement

The original contributions presented in this study are included in the article. Further inquiries can be directed to the corresponding author.

Conflicts of Interest

The authors declare no conflicts of interest.

References

  1. Gillieson, D. Caves: Processes, Development, Management; Blackwell: Oxford, UK, 1996; p. 324. [Google Scholar]
  2. Debevec, V.; Rakovec, J. Impact of visits on the microclimates of caves experimental evidence from Skocjan caves. Acta Carsologica 2021, 50, 269–290. [Google Scholar]
  3. Fernandez-Cortes, A.; Cuezva, S.; Sanchez-Moral, S.; Cañaveras, J.C.; Porca, E.; Jurado, V.; Martin-Sanchez, P.M.; Saiz-Jimenez, C. Detection of human-induced environmental disturbances in a show cave. Environ. Sci. Pollut. Res. 2011, 18, 1037–1045. [Google Scholar] [CrossRef] [PubMed]
  4. Saiz-Jimenez, C.; Cuezva, S.; Jurado, V.; Fernandez-Cortes, A.; Porca, E.; Benavente, D.; Cañaveras, J.C.; Sanchez-Moral, S. Paleolithic art in peril: Policy and science collide at Altamira Cave. Science 2011, 334, 42–43. [Google Scholar]
  5. Sanchez-Moral, S.; Jurado, V.; Fernandez-Cortes, A.; Cuezva, S.; Martin-Pozas, T.; Gonzalez-Pimentel, J.L.; Ontañon, R.; Saiz-Jimenez, C. Environment-driven control of fungi in subterranean ecosystems: The case of La Garma Cave (northern Spain). Int. Microbiol. 2021, 24, 573–591. [Google Scholar] [CrossRef]
  6. Bourges, F.; Genthon, P.; Genty, D.; Lorblanchet, M.; Mauduit, E.; D’Hulst, D. Conservation of prehistoric caves and stability of their inner climate: Lessons from Chauvet and other French caves. Sci. Total Environ. 2014, 493, 79–91. [Google Scholar]
  7. De Freitas, C.R. The role and importance of cave microclimate in the sustainable use and management of show caves. Acta Carsologica 2010, 39, 477–489. [Google Scholar]
  8. Calaforra, J.M.; Fernandez-Cortes, A.; Sanchez-Martos, F.; Gisbert, J.; Pulido-Bosch, A. Environmental control for determining human impact and permanent visitors capacity in a potential show cave before tourist use. Environ. Conserv. 2003, 30, 163–167. [Google Scholar]
  9. Cigna, A.; Forti, P. The environmental impact assessment of a tourist cave. In Cave Tourism: Proceedings of International Symposium on the 170th Anniversary of Postojnska Jama; Kranjc, A., Ed.; Karst Research Institute ZRC-SAZU: Postojna, Slovenia, 1989; pp. 29–38. [Google Scholar]
  10. Guirado, E.; Ramos-Lopez, D.; Maldonado, A.D.; Moreno-Balcazar, J.J.; Calaforra, J.M. Modeling carbon dioxide for show cave conservation. J. Nat. Conserv. 2019, 49, 76–84. [Google Scholar] [CrossRef]
  11. Hoyos, M.; Soler, V.; Cañaveras, J.C.; Sanchez-Moral, S.; Sanz-Rubio, E. Microclimatic characterization of a karstic cave: Human impact on microenvironmental parameters of a prehistoric rock art cave (Candamo Cave, northern Spain). Environ. Geol. 1998, 33, 231–242. [Google Scholar]
  12. Lobo, H.A.S. Tourist carrying capacity of Santana cave (PETAR-SP, Brazil): A new method based on a critical atmospheric parameter. Tour. Manag. Perspect. 2015, 16, 67–75. [Google Scholar]
  13. Mangin, A.; Bourges, F.; D’Hulst, D. La conservation des grottes ornées: Un problème de stabilité d’un système naturel (l’exemple de la grotte préhistorique de Gargas, Pyrénées francaises). Comptes Rendús L’académie Sci. Paris Sci. Terre Planètes 1999, 328, 295–301. [Google Scholar]
  14. Piano, E.; Mammola, S.; Nicolisi, G.; Isaia, M. Advancing tourism sustainability in show caves. Cell Rep. Sustain. 2024, 1, 100057. [Google Scholar]
  15. Bontemps, Z.; Moënne-Loccoz, Y.; Hugoni, M. Contributions of DNA Sequencing Technologies to the Integrative Monitoring of Karstic Caves. Appl. Sci. 2024, 14, 9438. [Google Scholar] [CrossRef]
  16. Martin-Pozas, T.; Fernandez-Cortes, A.; Cuezva, S.; Jurado, V.; Gonzalez-Pimentel, J.L.; Hermosin, B.; Ontañon, R.; Arias, P.; Cañaveras, J.C.; Sanchez-Moral, S.; et al. Microclimate, airborne particles, and microbiological monitoring protocol for conservation of rock-art caves: The case of the world-heritage site La Garma cave (Spain). J. Environ. Manag. 2024, 351, 119762. [Google Scholar]
  17. Mulec, J. Human impact on underground cultural and natural heritage sites, biological parameters of monitoring and remediation actions forinsensitive surfaces: Case of Slovenian show caves. J. Nat. Conserv. 2014, 22, 132–141. [Google Scholar]
  18. Foyo, A.; Sanchez, M.A.; Tomillo, C.; Iriarte, E. El Castillo Mountain prehistoric caves (Cantabria, North of Spain). Structural geology, karstic development and prehistoric art manifestations. In Proceedings of the 3rd IASME/WSEAS International Conference on GEOLOGY and SEISMOLOGY (GES’09), Mathematics and Computers in Science and Engineering A Series of Reference Books and Textbooks; World Heritage, UNESCO 2008; Trilling, L., Perkins, D., Dionysios, D., Perlovsky, L., Davey, K., Landgrebe, D., Marino, M.A., Russell, D.L., Collicott, S.H., Ceccarelli, M., et al., Eds.; World Scientific and Engineering Academy and Society (WSEAS) Press: Wisconsin, WI, USA, 2009; pp. 148–152. [Google Scholar]
  19. Bayarri, V.; Castillo, E.; Ripoll, S.; Sebastian, M.A. Control of Laser Scanner Trilateration Networks for Accurate Georeferencing of Caves: Application to El Castillo Cave (Spain). Sustainability 2021, 13, 13526. [Google Scholar] [CrossRef]
  20. Sakamoto, T.; Pettitt, P.; Ontañon-Peredo, R. Upper Palaeolithic Installation Art: Topography, Distortion, Animation and Participation in the Production and Experience of Cantabrian Cave Art. Camb. Archaeol. J. 2020, 30, 665–688. [Google Scholar]
  21. Sakamoto, T. Cave Art as Installation Art: Analysis of the Human-Art-Wall Triad in Three Cantabrian Caves, and Embedded Interactivity in the Image-Making and Image-Viewing Process. Ph.D. Thesis, Durham University, Durham, UK, 2019. Available online: https://etheses.dur.ac.uk/13196/1/PhD_Thesis_pdf.pdf?DDD6+ (accessed on 19 March 2025).
  22. Ontañon-Peredo, R.; Bayarri, V.; Herrera, J.; Rodriguez, R. The conservation of prehistoric caves in Cantabria, Spain. In The Conservation of Subterranean Cultural Heritage; Saiz-Jimenez, C., Ed.; CRC Press/Taylor & Francis: London, UK, 2014; pp. 185–192. [Google Scholar]
  23. Palacio-Perez, E. The UNESCO World Heritage List in a Globalized World: The Case of the Paleolithic Caves of Northern Spain (1985–2008). In Deep-Time Images in the Age of Globalization. Rock Art in the 21st Century; Abadía, Ó.M., Conkey, M.W., McDonald, J., Eds.; Springer: Cham, Switzerland, 2024; pp. 207–217. [Google Scholar]
  24. Faimon, J.; Stelcl, J.; Sas, D. Anthropogenic CO2-flux into cave atmosphere and its environmental impact: A case study in the Cisarska Cave (Moravian Karst, Czech Republic). Sci. Total Environ. 2006, 369, 231–245. [Google Scholar]
  25. Lario, J.; Sanchez-Moral, S.; Soler, V.; Cañaveras, J.C.; Cuezva, S. Caracterización microambiental de la Cueva de Pozalagua (Vizcaya): Aplicación a la gestión y protección de cavidades turísticas. Estud. Geológicos. 2005, 61, 41–59. [Google Scholar]
  26. Lario, J.; Soler, V. Microclimate monitoring of Pozalagua cave (Vizcaya, Spain): Application to management and protection of show caves. J. Cave Karst Stud. 2010, 72, 169–180. [Google Scholar]
  27. Sanchez-Moral, S.; Soler, V.; Cañaveras, J.C.; Sanz, E.; Van Grieken, R.; Gysells, K. Inorganic deterioration affecting Altamira Cave: Quantitative approach to wall-corrosion (solutional etching) processes induced by visitor. Sci. Total Environ. 1999, 243, 67–84. [Google Scholar]
  28. Toit, S.H.C.; Steyn, A.G.W.; Stumpf, R.H. Graphical Exploratory Data Analysis; Springer Texts in Statistics; Springer: New York, NY, USA, 1986; p. 314. [Google Scholar] [CrossRef]
  29. De Freitas, C.R.; Banbury, K. Build up and diffusion of carbon dioxide in cave air in relation to visitor numbers at the Glowworm Cave, New Zealand, in Cave Management in Australasia XIII. In Proceedings of the Thirteenth Australasian Conference on Cave and Karst Management, Carlton South, Victoria; Australasian Cave and Karst Management Association: Mount Gambier, Australia, 1999; pp. 84–89. [Google Scholar]
  30. Gillieson, D.S. Management of Caves. In Karst Management; van Beynen, P., Ed.; Springer: Dordrecht, The Netherlands, 2011. [Google Scholar]
  31. Huppert, G.; Burri, E.; Forti, P.; Cigna, A. Effects of tourist development on caves and karst. In Karst Terrains: Environmental Changes and Human Impact: Cremlingen-Destedt; Williams, P.W., Ed.; Catena: Dresden, Germany, 1993; Supplement 25; pp. 251–268. [Google Scholar]
  32. Kermode, L.O. Cave corrosion by tourists. In Cave Management in Australia 3: Proceedings of the 3rd Australian Conference on Cave Tourism and Management, Mt. Gambier, South Australia; Australasian Cave and Karst Management Association: Carlton South, Australia, 1979; pp. 97–104. [Google Scholar]
  33. Pulido-Bosch, A.; Martín-Rosales, W.; Lopez-Chicano, M.; Rodriguez-Navarro, C.M.; Vallejos, A. Human impact in a tourist karstic cave (Aracena, Spain). Environ. Geol. 1997, 31, 142–149. [Google Scholar]
  34. Russel, M.J.; MacLean, V.L. Management issues in a Tasmanian tourist cave: Potential microclimatic impacts of cave modifications. J. Environ. Manag. 2008, 87, 474–483. [Google Scholar]
  35. Cigna, A.A. Environmental management of tourist caves. The examples of Grotta di Castellana and Grotta Grande del Vento, Italy. Environ. Geol. 1993, 21, 173–180. [Google Scholar]
  36. Fernandez-Cortes, A.; Calaforra, J.M.; Sanchez-Martos, F. Spatiotemporal analysis of air conditions as a tool for the environmental management of a show cave (Cueva del Agua, Spain). Atmos. Environ. 2006, 40, 7378–7394. [Google Scholar]
  37. Lobo, H.A.; Boggiani, P.C.; Perinotto, J.A. Speleoclimate dynamics in Santana Cave (PETAR, Sao Paulo State, Brazil): General caracterization and implications for tourist management. Int. J. Speleol. 2015, 44, 61–73. [Google Scholar]
  38. Sebela, S.; Prelovsek, M.; Janez, T. Impact of Peak Period Visits on the Postojna Cave (Slovenia) Microclimate. Theor. Appl. Climatol. 2013, 111, 51–64. [Google Scholar]
  39. Buonincontri, P.; Micera, R.; Murillo-Romero, M.; Pianese, T. Where Does Sustainability Stand in Underground Tourism? A Literature Review. Sustainability 2021, 13, 12745. [Google Scholar] [CrossRef]
  40. Lobo, H.A.S.; Trajano, E.; Marinho, M.D.; Bichuette, M.E.; Scaleante, J.A.B.; Scaleante, O.A.F.; Rocha, B.N.; Laterza, F.V. Projection of tourist scenarios onto fragility maps: Framework for determination of provisional tourist carrying capacity in a Brazilian show cave. Tour. Manag. 2013, 35, 234–243. [Google Scholar]
  41. Zhang, S.; Chen, A. Do Different Queue Formations Influence the Overestimation of Tourism Carrying Capacity? Sustainability 2024, 16, 11047. [Google Scholar] [CrossRef]
  42. Geneste, J.M.; Mauriac, M. The conservation of Lascaux Cave, France. In The Conservation of Subterranean Cultural Heritage; Saiz-Jimenez, C., Ed.; CRC Press/Taylor & Francis: London, UK, 2014; pp. 165–172. [Google Scholar]
  43. Cuezva, S.; Jurado, V.; Fernandez-Cortes, A.; Garcia-Anton, E.; Rogerio-Candelera, M.A.; Ariño, X.; Benavente, D.; Cañaveras, J.C.; Saiz-Jimenez, C.; Sanchez-Moral, S. Scientific data suggest Altamira Cave should remain closed. In Microbial Life of Cave Systems. Life in Extreme Environments; Engel, A.S., Ed.; De Gruyter: Boston, MA, USA, 2015; Volume 3, pp. 303–320. [Google Scholar]
  44. Bayarri, V.; Prada, A.; Garcia, F.; De Las Heras, C.; Fatas, P. Remote Sensing and Environmental Monitoring Analysis of Pigment Migrations in Cave of Altamira’s Prehistoric Paintings. Remote Sens. 2024, 16, 2099. [Google Scholar] [CrossRef]
  45. Prada, A.; Bayarri, V. Methodology for the Monitoring and Control of the Alterations Related to Biodeterioration and Physical-Chemical Processes Produced on the Paintings on the Ceiling of the Polychrome Hall at Altamira. Conservation 2024, 4, 703–730. [Google Scholar] [CrossRef]
  46. Geneste, J.M.; Bardisa, M. The conservation of Chauvet Cave, France. The conservation, research organization and the diffusion of knowledge of a cave inaccessible to the public. In The Conservation of Subterranean Cultural Heritage; Saiz-Jimenez, C., Ed.; CRC Press/Taylor & Francis: London, UK, 2014; pp. 173–183. [Google Scholar]
  47. Jurado, V.; Gonzalez-Pimentel, J.L.; Fernandez-Cortes, A.; Martin-Pozas, T.; Ontañon-Peredo, R.; Palacio-Perez, E.; Hermosin, B.; Sanchez-Moral, S.; Saiz-Jimenez, C. Early detection of phototrophic bioflms in the polychrome panel, El Castillo cave, Spain. Appl. Biosci. 2022, 1, 40–63. [Google Scholar]
Figure 1. Location and list of caves included in Cave of Altamira and Palaeolithic Cave Art of Northern Spain UNESCO World Heritage. * The Monte Castillo Group includes El Castillo, La Pasiega, Las Monedas, and Las Chimeneas caves.
Applsci 15 03484 g001
Figure 2. Location of microclimatic monitoring stations.
Applsci 15 03484 g002
Figure 3. Example of standardised diagram and derived statistics based on the frequency distribution of the variations in each control parameter (temperature and CO2) for a given range of daily visits.
Applsci 15 03484 g003
Figure 4. Time series of outdoor and indoor air temperatures (mean and minimum values) in the El Castillo cave (A) and Covalanas cave (B) during the triennium 2020–2022.
Applsci 15 03484 g004
Figure 5. Time series of tracer gas concentration (CO2 and 222Rn) in the El Castillo cave during the period of October 2020–December 2022. The black arrows, continuous and dashed, highlight the opposite trend in the concentration of both gases, indicative of a ventilation process (222Rn) masked, in the case of CO2, by the cumulative effect of the impacts generated by the increasing rate of daily visits. Vertical grey arrows indicate ventilation pulses due to the entry of warmer external air from lower levels.
Applsci 15 03484 g005
Figure 6. Time series of tracer gas concentration (CO2 and 222Rn) in the Covanalas cave during the period of October 2020–December 2022. The black arrows, continuous and dashed, highlight the simultaneous trend in the concentration of both gases, indicative of the summer ventilation process.
Applsci 15 03484 g006
Figure 7. Box-and-whisker plot with variations in the air temperature of the El Castillo cave generated by different ranges of daily visits. The green shaded area indicates the daily temperature variation without visits.
Applsci 15 03484 g007
Figure 8. Evolution of the mean and minimum daily air temperature in the El Castillo cave in relation to the monthly visitor data (daily mean and maximum). The dashed lines indicate the air temperature thresholds of the cave under natural conditions (without visits). The grey shaded area indicates the daily rate of visits that ensure that daily variations in temperature are within the thresholds of cave air temperature under natural conditions.
Applsci 15 03484 g008
Figure 9. Box-and-whisker plot with variations in the CO2 concentration of air in the El Castillo cave generated by different ranges of daily visits. The green shaded area indicates the daily variation in CO2 without visits.
Applsci 15 03484 g009
Figure 10. Box-and-whisker plot with variations in the air temperature of the Covalanas cave generated by different ranges of daily visits. The green shaded area indicates the daily temperature variation without visits.
Applsci 15 03484 g010
Figure 11. Evolution of the mean and minimum daily air temperature in the Covalanas cave in relation to the monthly visitor data (daily mean and maximum). The dashed lines indicate the air temperature thresholds of the cave under natural conditions (without visits). The grey shaded area indicates the daily rate of visits that ensure that daily variations in temperature are within the thresholds of cave air temperature under natural conditions.
Applsci 15 03484 g011
Figure 12. Box-and-whisker plot with variations in the CO2 concentration of air in the Covalanas cave generated by different ranges of daily visits. The green shaded area indicates the daily variation in CO2 without visits.
Applsci 15 03484 g012
Table 1. Monthly statistics of the number of visitors to the El Castillo cave during the 3-year period of 2020–2022 (data from the beginning of the environmental monitoring work in February 2020). The columns Mean and Max correspond to the average daily values and the average of the maximum daily values in each month, respectively.
202020212022
TotalMeanMax.TotalMeanMax.TotalMen.Max.
January---493215199940114
February2101961687563384167967128
March8868112488735114244184180
April0001529591114148148228
May5311201382531133861133236
June87937802195841294122159340
July2168809332121151365579192272
August268110312431831181455451202233
September25469812630221041864156154221
October1621601152645911983679131197
November18414672101781912833105202
December4192870186172217225098204
Annual13,538559023,2667214041,198126213
Table 2. Monthly statistics of the number of visitors to the Covalanas cave during the 3-year period of 2020–2022 (data from the beginning of the environmental monitoring work in February 2020). The columns Mean and Max correspond to the average daily values and the average of the maximum daily values in each month, respectively.
202020212022
TotalMeanMax.TotalMeanMax.TotalMen.Max.
January---1349183371331
February436215016912253371632
March173193925213274091746
April00038615297943148
May265943716296512747
June179101744719257183043
July430162253221289613890
August341162353423279473843
September287182558925457713246
October485162968425407332851
November7772553823425402382
December9491848924425632348
Annual252812235191193177612651
Table 3. Recommended daily rate of visitors in terms of monthly average values and maximum thresholds and expected increases generated in the temperature and CO2 concentration of cave air. The expected microclimate impacts are defined by the upper level of the interquartile range of variation for each parameter, generated by both the monthly averages and the maximum thresholds of daily visitors.
CaveMonthly AverageMicroclimate ImpactsMaximum ThresholdMicroclimate Impacts
Visitors/DayΔT (°C)ΔCO2 (ppm)Visitors/DayΔT (°C)ΔCO2 (ppm)
El Castillo≤60≤0.10≤110130≤0.16≤180
Covalanas≤15≤0.11≤22025≤0.15≤350
Disclaimer/Publisher’s Note: The statements, opinions and data contained in all publications are solely those of the individual author(s) and contributor(s) and not of MDPI and/or the editor(s). MDPI and/or the editor(s) disclaim responsibility for any injury to people or property resulting from any ideas, methods, instructions or products referred to in the content.

