Article

Study on the Load-Bearing and Mechanical Properties of Coal Specimens Under Uniaxial Compression with Polyurea Spraying

1
Coal Mining Branch, China Coal Research Institute, Beijing 100013, China
2
CCTEG Coal Mining Research Institute, Beijing 100013, China
3
School of Safety Science and Engineering, Anhui University of Science & Technology, Huainan 232001, China
*
Author to whom correspondence should be addressed.
Appl. Sci. 2025, 15(7), 3486; https://doi.org/10.3390/app15073486
Submission received: 10 February 2025 / Revised: 16 March 2025 / Accepted: 19 March 2025 / Published: 22 March 2025

Abstract

:
Polyurea spraying is a new temporary support technology that can significantly enhance the mechanical properties of coal. However, the mechanism of interactions between the polymer coating and coal is unclear. In this study, the No. 4 non-stick coal from Mengcun Coal Mine and polyurea material were used to conduct experiments and numerical simulations. The tests and simulations were used to examine the role of the sprayed coating in the formation of residual strength and the unloading and rebound mechanism after brittle failure of the coal. The results showed that the presence of the polyurea coating had a significant impact on the mechanical behavior of the coal. The specimens sprayed with polyurea were affected by the confining pressure applied by the coating and the internal friction of the coal; consequently, the specimens exhibited certain plastic characteristics and maintained their residual strength after experiencing brittle failure. The polyurea coating not only effectively prevents the loosening and slippage of the coal but also improves the stability of the coal by altering its mechanical behavior during the loading process. This study lays the foundation for popularizing and applying polyurea spraying technology in coal mine support while providing rich data to support further theoretical research.

1. Introduction

Traditional anchor rod and mesh support systems significantly impact the tunneling speed in coal mines because of their long installation periods [1,2]. An efficient and fast method for temporary tunnel support is the spraying support technology [3,4,5,6], which involves injecting liquid materials into the surrounding rock through the surface for attachment and curing, thereby improving its mechanical properties. This technology, characterized by high mechanization, can effectively stabilize the surrounding rock in areas such as the overhead and sidewalls of the tunneling face. The technology also provides space and time for anchor installation, thus enhancing tunneling speed and improving the coordination of the mechanized excavation system [7,8].
Polymer spraying materials can substantially increase the strength of surrounding rock within a short period. Globally, researchers have conducted extensive experiments on coal rock bodies after applying polymer spraying materials, examining the tensile, compressive, and shear strengths. These studies have indicated that such sprayed coatings can effectively improve the mechanical properties of coal rock bodies [9,10,11,12,13,14]. The curing time of polymer coatings is much shorter than that of concrete (in the order of seconds, approximately 10 s) [15]; the time to reach peak strength is also shorter [16]. When polymer materials are sprayed onto the surface of a surrounding rock, they form a continuous film that effectively prevents swelling, loosening, and slippage of the surrounding rock. They force interactions between the rock particles and provide a self-stabilizing effect, thus replacing the role of metallic meshes [9,17]. Additionally, owing to their excellent air-tightness, polymer coatings can block air from entering fissures, preventing the crack propagation and weathering of the surrounding rock [18]. Moreover, as a flexible material, the polymer coating applies a flexible confining pressure on the surrounding rock, altering the bearing mechanical characteristics of the rock [19] and demonstrating certain energy-absorption capabilities [17,20].
However, the interaction between the coating and surrounding rock remains unclear, particularly the plastic deformation of the surrounding rock under the confining pressure of the coating when the coal pillar becomes brittle through mining activities. This unclear aspect requires further research and the establishment of theoretical models. Furthermore, the thickness of polymer coatings typically used in engineering applications is on the millimeter scale [21,22,23]; however, the coating thickness still needs further optimization.
In this study, we conducted uniaxial compression tests on coal before and after the spraying of polyurea [24,25], comparing the failure modes and stress–strain curves. An elastic-theory-based stress–strain model for coal under polyurea spraying conditions was established and experimentally validated. The study revealed the deformation and failure patterns of coal under polyurea spraying, clarifying how the coating applies confining pressure to maintain residual strength in coal after brittle failure. The model was also used to compare the residual strength of coal with different coating thicknesses.

2. Sample Processing and Preparation

The coal samples used in this experiment were extracted from the No. 4 coal seam of the Mengcun Coal Mine. The macroscopic and microscopic structures of the coal samples are shown in Figure 1a. The coring direction was perpendicular to the coal seam joints, and the standard specimens were cylindrical with a diameter of 50 mm and a height-to-diameter ratio of two. The samples displayed no apparent cracks, as shown in Figure 1b. After polishing, some of the specimens were left untreated as a control group and directly subjected to uniaxial compression tests. The other specimens were sprayed with polyurea on their surface (hereinafter referred to as the “polyurea coal samples”), with an average coating thickness of 3 ± 0.5 mm. The spraying process, illustrated in Figure 1c, was as follows: first, the coal specimen was placed at the center of an electric turntable, which rotated at a speed of 0.02 r·s−1. A spraying gun was used to apply the polyurea on the specimen’s surface from a distance of 15 cm. Both the top and bottom of the specimen were covered with Teflon pads to prevent polyurea from adhering to these surfaces. The initial curing time of the polyurea was 30 s. Owing to gravity, the liquid polyurea flowed to the bottom of the specimen, gradually increasing the coating thickness from the top to the bottom of the coal pillar after the first spraying. Therefore, after the initial spraying, the specimen was left to cure completely. The specimen was then flipped and spraying was repeated until a uniform polyurea coating thickness was achieved on the specimen’s surface.

3. Uniaxial Compression Test and Particle Flow Numerical Simulation

3.1. Uniaxial Compression Test

The standard specimens and polyurea-coated specimens were subjected to uniaxial compression loading tests using a universal testing machine; the strain was measured using an extensometer (see Figure 2a). During the uniaxial compression test, displacement-controlled loading was applied at a loading rate of 0.1 mm·min−1. The unloading phase began when the strain of the specimen reached 4%, with an unloading rate of 100 N·s−1. Figure 2 and Figure 3 illustrate the uniaxial compression test processes for the standard and polyurea-coated specimens, respectively.
As shown in Figure 2b, after uniaxial compression failure, a primary crack appeared in the middle of the standard specimen. Considering the stress–strain curve of the standard specimen under uniaxial loading (Figure 4), we characterize the failure of the standard specimen as brittle failure, with the maximum stress at failure, σc, being 25 MPa. During the compression process, the coal specimen first undergoes a compaction phase where porosity gradually decreases and the modulus increases [26,27,28]. The fitting results show that the elastic modulus of the coal specimen was 2.2 GPa and the Poisson’s ratio was 0.25. By using the Mohr–Coulomb criterion to fit the experimental data, we obtained a value of 0.457 for the friction coefficient μ0 in the elastic stage, and the internal friction angle was 24.593°.
As shown in Figure 2c, in addition to longitudinal cracks, the coal sample also exhibits a large number of transverse cracks (marked with red dashed lines in Figure 2c). Figure 3b shows the condition where the polyurea-coated specimen was compressed to its limit using a universal testing machine. At this point, the coal specimen was completely pulverized (as shown in Figure 3c). It can be observed that the polyurea coating, which is applied around the coal sample, behaves as a hyperelastic material. Despite the complete pulverization of the coal specimen, the polyurea coating remained intact and crack-free on the surface.

3.2. Construction of the Particle Flow Numerical Model

A cylindrical coal specimen model with dimensions matching the laboratory samples (50 mm in diameter and 100 mm in height) was constructed using PFC3D 5.00 software, as shown in Figure 5. In the model, the coal specimen was represented in blue, the polyurea coating applied to the surface was represented in yellow, and the transparent upper and lower walls served as the loading plates. The boundary conditions were defined by constructing the walls, within which particles were randomly generated according to a specific grading distribution and contact conditions. The walls were set as the top and bottom loading plates, with the upper and lower walls slowly moving toward each other to simulate the loading process. The numerical model consisted of three main components: the coal specimen, coating material, and uniaxial compression walls. The minimum and maximum particle sizes for the coal specimen were set to 0.5 mm and 1.2 mm, respectively, to balance computational accuracy and efficiency. The particle size for the polyurea coating was set to 0.15 mm.
The linear model in PFC3D (Figure 6a shows the Linear Model) can only transfer inter-particle forces, the linear parallel bond model (Figure 6b shows the Linear Parallel Bond Model) can transfer both inter-particle forces and moments, and the linear contact bond model (Figure 6c shows the Linear Contact Bond Model) eliminates the possibility of slip due to the existence of contact bonds. Hence, we used the linear parallel bond model to represent coal samples, the linear model to simulate the mechanical behavior of the interface between the sprayed material and the coal sample, and the linear contact bond model to simulate the sprayed polyurea. The mechanical properties of rock mineral components and cementing materials were characterized by PFC particle strength and contact parameters. A trial-and-error method was used to adjust the parameters gradually to ensure that the obtained stress–strain curve closely matched the experimental stress–strain curve. When the macroscopic failure modes of both curves were similar, then the constructed numerical model was considered valid.

4. Theoretical Analysis of the Load-Bearing Mechanical Characteristics of Coal Under Polyurea Spray Coating Conditions

We established a theoretical model based on the above experimental results, as shown in Figure 7. The model consists of an internal cylindrical coal specimen and an external polyurea thin shell. During the axial loading process, the specimen undergoes radial expansion and displacement continuity is maintained at the interface between the polyurea thin shell and the coal pillar. As the axial deformation of the polyurea-coated coal specimen progresses, the upper and lower end faces of the coal pillar are subjected to a uniform load PC1, while the wall surfaces experience radial compressive pressure P2 from the thin shell (as shown in Figure 7c). On the thin shell, the pressure P2 on the inner wall and the internal tension FP in the thin shell remain in equilibrium (as shown in Figure 7d). Because the cross-sectional area and elastic modulus (34.5 MPa) of the thin shell are much smaller than those of the coal specimen, we can neglect the contribution of the axial stress within the coating to the overall average stress of the specimen. Therefore, the axial stress measured during the experiment can be approximated as the axial stress σz inside the coal body.
For the compaction phase, an ideal plastic model was adopted; thus, we ignored the internal stress variation within the coal specimen due to deformation, as shown by the yellow solid line in Figure 6. According to the linear elasticity, small deformation assumption, the axial strain εz of the specimen is defined as εz = δ/l0, where δ is the axial displacement at the elastic stage and l0 is the initial height of the specimen. The radial stress σr and circumferential stress σθ of the coal specimen can be expressed as follows:
σ r = E 1 + μ μ 1 2 μ ε r + ε θ + δ l 0 + ε r ,
σ θ = E 1 + μ μ 1 2 μ ε r + ε θ + δ l 0 + ε θ ,
where E, μ, εr, and εθ are the elastic modulus, Poisson’s ratio, radial strain, and circumferential strain of the specimen, respectively. Because the circumferential stress of the specimen is zero under axial loading, the following equation can be obtained from Formula (2):
ε θ = μ μ 1 ε r + δ l 0 ,
Considering that the radial stress of the specimen is P2, Equation (1) can be rewritten as follows:
ε r = 1 + μ P 2 l 0 μ δ E E l 0 ,
In the thin shell model, the torque and bending moments within the coating are neglected, as well as variations in the stress and displacement along the thickness direction of the coating. The force equilibrium equation and the relationship between force and displacement can be expressed as follows:
F p 2 = r 0 P 2 ,
u z = F p 1 μ p F p 2 E p m ,
v β + w r 0 = F p 2 μ p F p 1 E p m ,
u β + v z = 2 1 + μ p F T E p m ,
where u, v, and w are the axial, tangential, and radial displacements of the coating; Fp1 and Fp2 are the tangential and normal (tensile/compressive) forces within the coating; FT is the shear force within the coating; z and β are the axial and tangential coordinates; and μp, Ep, m, and r0 are the Poisson’s ratio, elastic modulus, thickness, and initial radius of the coal specimen, respectively. The coating deformation is consistent with that of the specimen’s outermost layer; hence, the displacement can be expressed as follows:
w = w c = ε r r = r 0 r 0 ,
u = δ l 0 z ,
v = ε θ r = r 0 β ,
where r is the radial coordinate. From Equations (8), (10), and (11), it can be concluded that the shear force within the coating is zero. By simultaneously solving Equations (6), (7), and (9)–(11), we obtain the following:
F P 2 = E p m δ μ p l 0 + ε θ r = r 0 + ε r 1 μ p 2 ,
From Equations (5) and (12), we can obtain
P 2 = E p m δ μ p + l 0 ε θ r = r 0 + l 0 ε r 1 μ p 2 l 0 r 0 ,
Because the coal specimen deforms uniformly under axial pressure, the radial and tangential strains on the specimen are equal at every point. By simultaneously solving Equations (3), (4), and (13), we obtain the following:
P 2 = δ μ 1 2 μ μ p E p E μ m 2 r 0 E μ μ 1 1 μ p 2 + E p m μ 1 + 2 μ 2 l 0 ,
The relationship between the axial stress and axial displacement of the specimen can be expressed as follows:
σ z = E 1 + μ 1 2 μ μ ε r + ε θ + 1 μ δ l 0 ,
The theoretical results are indicated by the red solid line in Figure 7. After the elastic stage, the sudden drop in stress is due to the brittle failure of the coal specimen. The longitudinal cracks in Figure 2b indicate that the coal specimen fails when the radial strain exceeds its limit. According to the maximum strain criterion, the maximum strain at failure of the specimen is εrc = μE1σc. Considering the relationship between radial strain and stress, εr = E−1(P2μσz), and Equation (15), we can deduce that when the radial strain reaches the maximum strain that the specimen can withstand the axial strain of the polyurea-coated specimen is ε1. Considering the material parameters obtained from the experiment and the strain during the compaction stage, we calculated the axial strain at the failure of the specimen to be 1.57%.
At the failure stage, the polyurea-coated coal specimen exhibits plastic characteristics due to the presence of transverse cracks within the specimen, which induces a lateral slip in the fractured coal blocks. No shear stress component exists in the radial direction under the action of axial stress; thus, the interface parallel to the radial direction remains intact. As the coal body is a sedimentary rock, the interfaces between different sedimentary layers are weak; therefore, when the direction forms an angle greater than 0° and less than 90° with the axial direction, shear stresses cause slippage and cracking along these interfaces. The specimen undergoes radial deformation along these transverse cracks and friction occurs between the rock on either side of the cracks. The frictional force and axial stress are related by σf = υσz, where υ is the friction coefficient, which depends on the specimen’s strain and loading conditions.
The axial compression of the polyurea-coated specimen closes the radial cracks, thereby increasing the friction coefficient. During the unloading process, the friction coefficient decreases. We assume the friction coefficient can be expressed as υ = υ0C(εzεi), where C is a constant related to the loading method and material, υ0 is the friction coefficient during the elastic stage, and εi is the strain at the state change of the sample (with subscript i = 1, 2 representing the strain at the end of the compaction phase and during unloading, respectively).
At the point of failure, the internal radial stress of the coal sample decreases considerably, whereas the confining pressure P2′ from the coating remains. When the axial displacement remains constant, the fractured coal does not move; therefore, the residual radial stress within the coal body can be ignored. It can be assumed that the confining pressure and friction force are equal, i.e., P2′ = σf. At this stage, the coal body is fractured and contains numerous internal cracks. Thus, the radial and axial displacements of the polyurea-coated specimen are determined by the deformation of the coating.
Polyurea (volume V0 = 2πr0ml0) is incompressible; thus, the radial and circumferential strains at the failure stage are given as follows: εθ′ = εr′ = V0/[2πr0m(l0 + δ)] − 1. From Equation (6), the confining pressure at the failure stage of the specimen can be obtained as follows:
P 2 = E p m δ μ p + l 0 ε θ + l 0 ε r 1 μ p 2 l 0 r 0 ,
Therefore, the stress–strain relationship of the coal body during uniaxial loading at the failure stage can be expressed as follows:
σ z = P 2 C ν 0 ε z ε 1 ,
where C = 0.0021. During unloading, both the stress and friction coefficient vary with time, and the friction coefficient is given by υ′ = υ0C′(εzεi). The relationship between the axial stress and confining pressure can be written as  P ˙ 2 = ν σ ˙ z + σ z ν ˙ , where the variation of axial stress with time can be approximated as  σ ˙ z = Δ F / π r 0 2 ; ΔF is the load unloaded per unit time, and the unloading time t = [πr02(σ0σz)]/ΔF, where σ0 is the axial stress at the beginning of unloading. Therefore, we can derive the following:
δ ˙ = Δ F ν π r 0 2 E p m μ p π r 0 m l 0 + δ 2 V 0 l 0 l 0 r 0 1 μ p 2 π r 0 m l 0 + δ 2 + σ z ν 0 C ε z ε 2 l 0 ,
By numerically solving Equation (18), we can express the axial strain as  ε z = δ 0 + δ ˙ t / l 0 , where δ0 is the axial deformation at the beginning of unloading, which is 0.004 m, and the stress during unloading is 4.19 MPa. The coefficient C′ is −0.0021. Figure 8 shows the theoretical stress–strain curves of coal samples under different thicknesses of polyurea coatings during loading and unloading.
Because the thickness and elastic modulus of the polyurea coating are much lower than those of the coal specimen, the confining pressure applied to the specimen’s surface after deformation is relatively small (in the order of 105 Pa). This results in a limited contribution to the enhancement of the specimen’s overall compressive strength. However, because polyurea possesses ultra-elastic and high-toughness characteristics, it can prevent significant slippage and instability after the structural failure of the specimen, thereby exhibiting good plasticity. The residual strength of the polyurea-coated specimen is mainly attributed to the combined effects of frictional forces and confining pressure between the fractured coal blocks. According to calculations based on the ideal plasticity model, when the polyurea coating thickness is in the order of 10−3 m, the magnitude of the residual strength is approximately 106 Pa (as shown in Figure 8). The friction coefficient between the fractured coal blocks changes because of the specimen’s deformation. This phenomenon occurs because the opening and closing of cracks and the porosity of the coal blocks themselves affect the frictional interactions. During unloading, the previously closed cracks reopen, reducing the friction coefficient. This behavior facilitates the radial contraction and recovery of axial deformation of the polyurea coating.

5. Load-Bearing Mechanical Characteristics of Coal Under Sprayed Coating Conditions

5.1. Analysis of Laboratory Experiment Results

A hysteresis curve of the polyurea-coated coal sample was obtained from uniaxial compression tests (see Figure 9). The axial loading and unloading process of the polyurea-coated coal specimen can be divided into three stages: the compaction, elastic, and failure stages. The results of the first two stages show no significant differences from those of the axial loading of the standard coal specimens.
At the compaction stage, the initial pores within the coal specimen gradually close under the applied load and the elastic modulus of the coal increases rapidly with rising strain. As the strain increases (approximately 0.3%), the specimen enters the elastic stage, where stress and strain exhibit a linear relationship. Here, the specimen’s uniaxial compressive strength is approximately 25 MPa. Because the polyurea coating has a thickness and elastic modulus (1.27 MPa) much lower than those of the coal body, the influence of the polyurea coating can be ignored during the compaction and elastic stages.
At the failure stage, the coating allows for the coal sample to retain a high residual strength even after brittle failure, exhibiting significant plastic characteristics. During the experiment, after the coal specimen underwent brittle failure it continued to undergo displacement loading until the strain reached 4%, at which point the residual strength was found to be approximately 5 MPa. The specimen was unloaded using a stress control method. Although the specimen recovered partially from the deformation, approximately 3% of the deformation remained and the unloading process displayed nonlinear characteristics.

5.2. Analysis of Numerical Simulation Results

The displacement, velocity, and forces in the bonding contacts of the particles were monitored during the PFC3D numerical simulation. Microcracks occurred when the parallel bonding contacts failed and were categorized into shear cracks and tensile cracks according to the failure modes. This categorization allowed for a microscopic representation of the rock failure process in the numerical simulation.
Figure 10 presents the statistical variation of the number of microcracks and the different types of microcracks within the polyurea-coated coal sample during uniaxial loading and unloading in the numerical simulation. As the axial strain increases, similar growth trends are observed for both the shear cracks and tensile cracks within the coal specimen. At the initial loading stage, the microcrack curve remains nearly horizontal and little to no microcrack formation occurs within the specimen. After loading into the later part of the elastic stage, the slope of the microcrack curve gradually increases, followed by an acceleration of the growth rate of the microcracks. After reaching the peak strength, the microcrack curve increases linearly, indicating the onset of the failure stage.
The growth rate and quantity of shear cracks are both smaller than those of tensile cracks throughout the entire compressive deformation process. When the axial strain reaches 1.9% and the uniaxial compression reaches the residual strength, the number of tensile cracks and shear cracks accounts for 22.16% and 77.84% of the total cracks, respectively, (at this stage, the coal sample contains a total of 7388 cracks, including 1637 tensile cracks and 5751 shear cracks). This result indicates that the cracks are predominantly shear cracks and the specimen exhibits overall shear failure.
Figure 11 presents the crack increment at different compression stages in the numerical simulation of the polyurea-coated coal sample under uniaxial loading and unloading. As the axial strain increases, similar growth trends are observed for both shear cracks and tensile cracks within the coal specimen. The rapid crack growth phase occurs between the peak and residual strengths, following a normal distribution.

6. Conclusions

In this study, to simplify the deformation model of the sprayed polyurea-coated coal body, the influence of deformation-induced internal stress variations within the coal body was not considered. Future research will incorporate this effect to enhance the predictive accuracy of the model. Moreover, in practical coal mine roadway support, the polyurea coating on the roof is subjected to the downward pressure exerted by the overlying coal seam, necessitating the development of a tensile stress model. The main findings of this study are as follows:
(1)
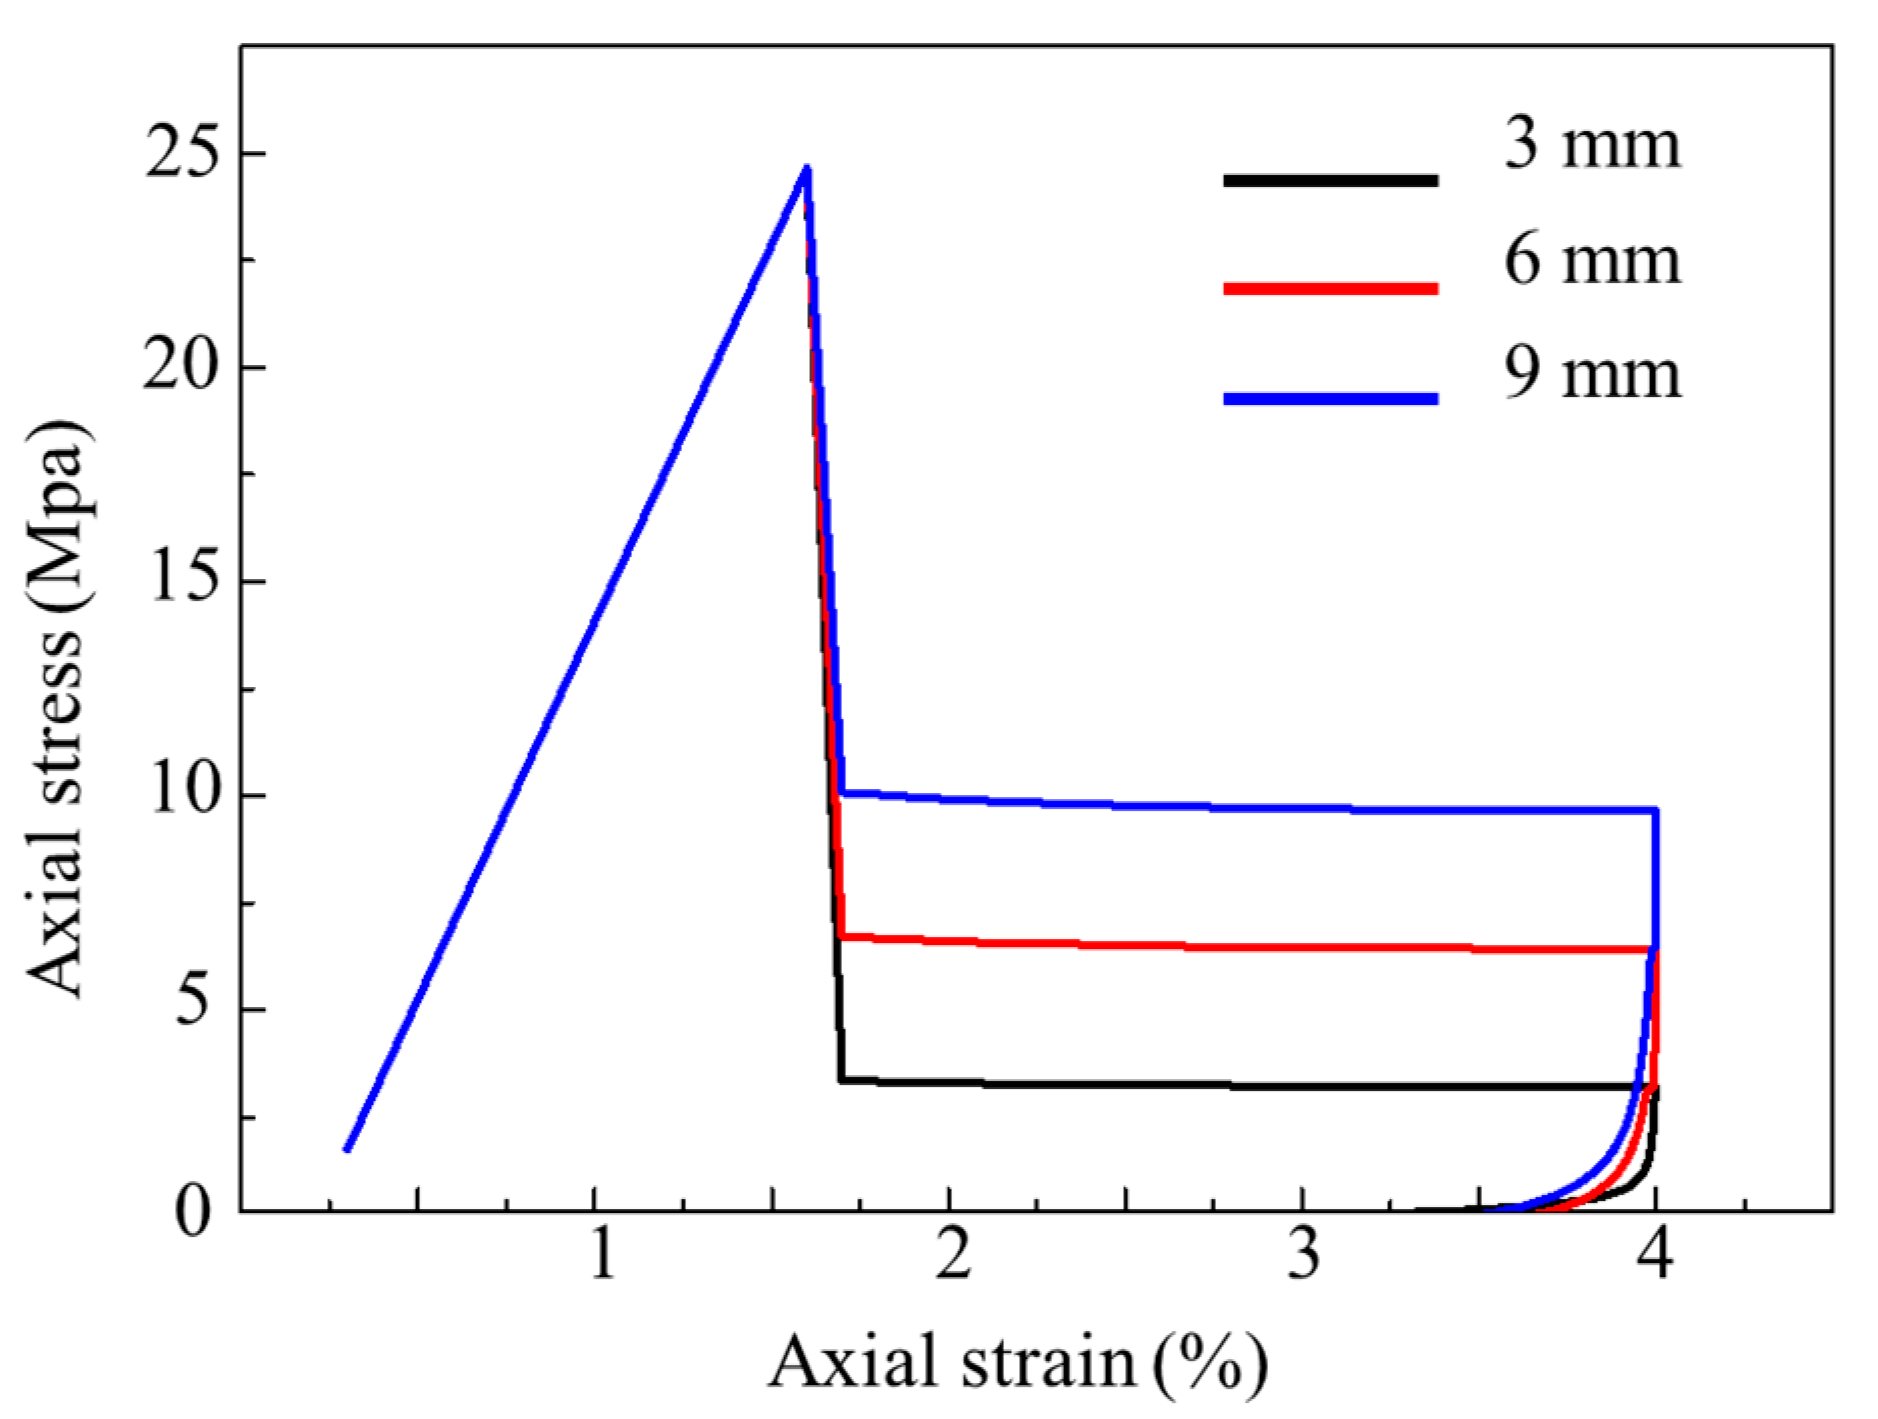
The spraying of polyurea significantly improves the mechanical load-bearing properties of coal specimens, particularly after brittle failure. The confining pressure exerted by polyurea on the coal enhances the frictional resistance between internal fractures, thereby delaying the occurrence of collapse and effectively increasing the residual strength of the coal. This finding underscores the critical role of polyurea in coal mine support.
(2)
Although a polyurea coating is generally thin, its effect on the mechanical performance of the specimen at the elastic stage is relatively limited. Our results show that the elastic modulus of polyurea is much lower than that of coal specimens. Hence, in the early loading phase, the coating has no significant influence on the stress–strain response. In engineering applications, balancing the coating thickness and material properties is essential to meet the requirements of different working conditions.
(3)
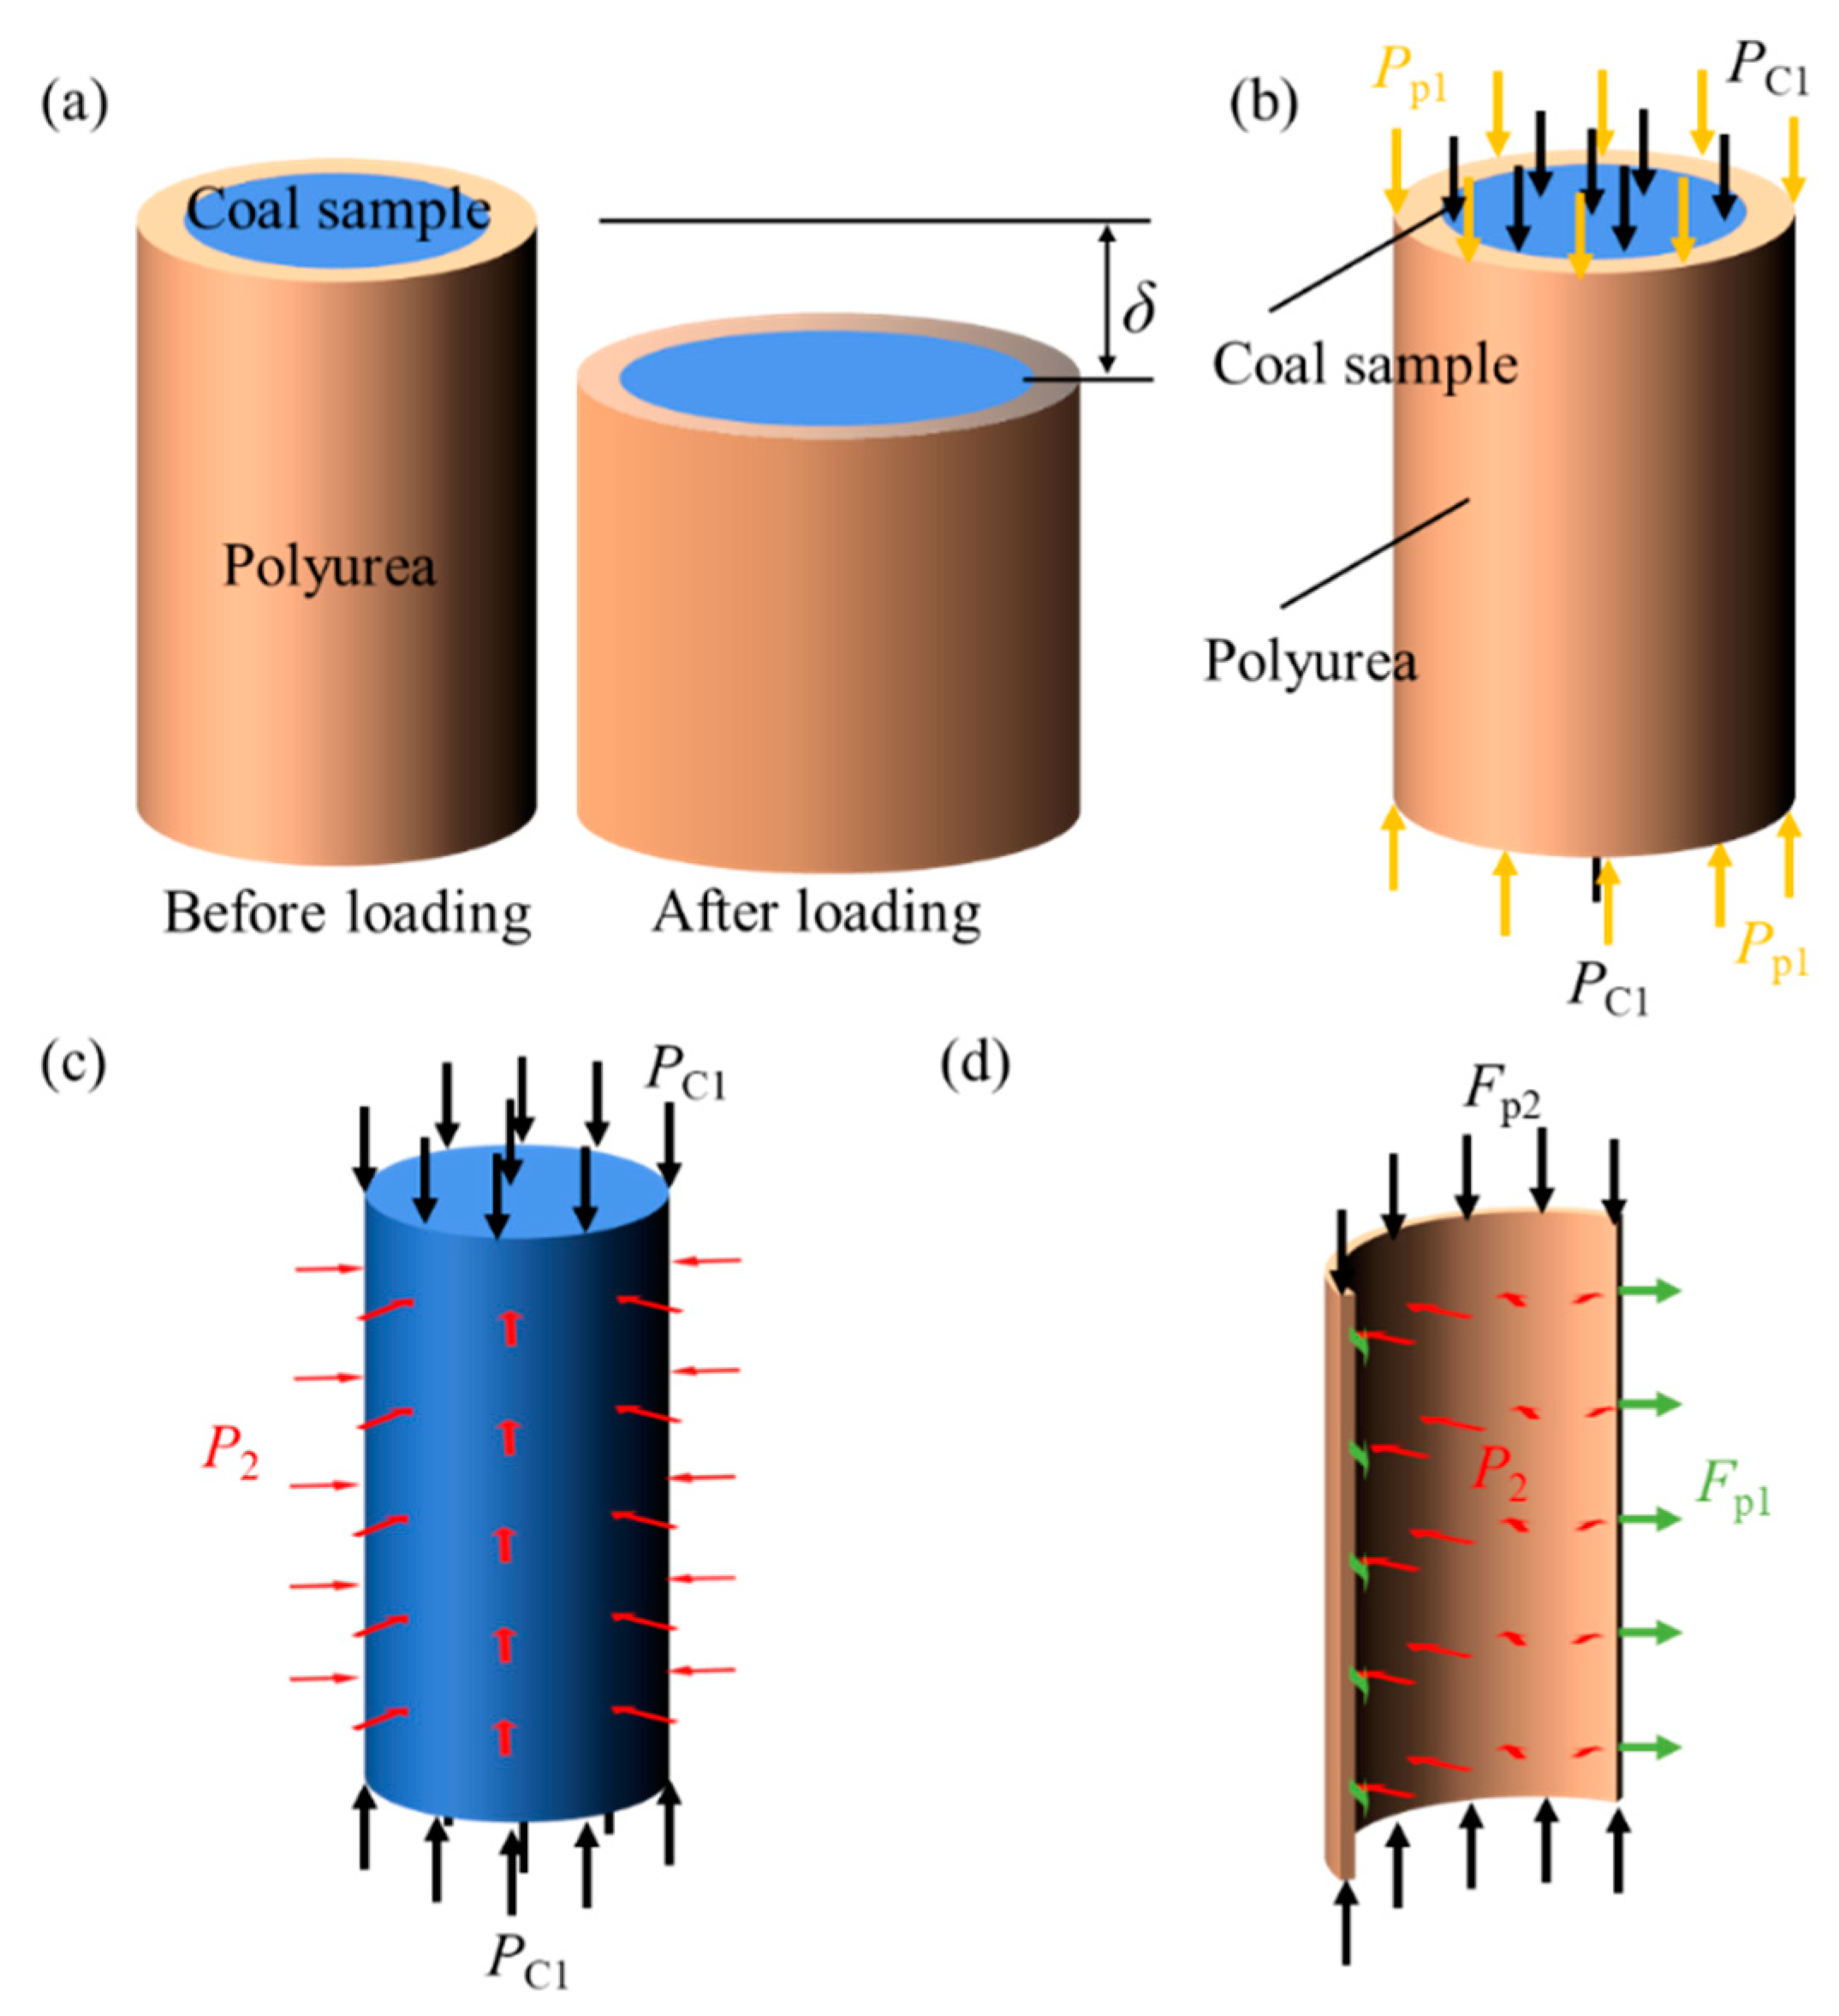
The theoretical model developed in this study successfully predicts the deformation behavior of coal specimens sprayed with polyurea. The model reflects the stress–strain relationship of the specimens during the loading process; it also explains the confining pressure effect of the polyurea coating and changes in the friction coefficient after brittle failure. The model provides valuable insights into the complex interactions between the coating and the coal body.
(4)
As a novel temporary support material, polyurea coatings demonstrate significant potential for widespread application in coal mining and other extraction operations. Our results are expected to promote the development of spraying support technology in optimizing the material properties, spraying technology, and application scenarios of polyurea coatings; they also provide guidance for engineering practice.

Author Contributions

Conceptualization, S.C.; methodology, S.C.; software, J.Y.; validation, J.Y.; formal analysis, S.C.; investigation, S.C.; resources, S.C.; data curation, S.C.; writing—original draft preparation, S.C.; writing—review and editing, D.H.; visualization, J.Y.; supervision, D.H.; project administration, S.C.; funding acquisition, D.H. All authors have read and agreed to the published version of the manuscript.

Funding

This research was funded by the CCTEG Coal Mining Research Institute (KCYJY-2024-MS-02) and the National Natural Science Foundation of China (52204123).

Institutional Review Board Statement

Not applicable.

Informed Consent Statement

Not applicable.

Data Availability Statement

Data will be made available on request.

Conflicts of Interest

Authors Shuwen Cao and Jinhong Yang were employed by the companies Coal Mining Branch, China Coal Research Institute and CCTEG Coal Mining Research Institute. The remaining authors declare that the research was conducted in the absence of any commercial or financial relationships that could be construed as a potential conflict of interest.

References

  1. Kolapo, P.; Onifade, M.; Said, K.O.; Amwaama, M.; Aladejare, A.E.; Lawal, A.I.; Akinseye, P.O. On the application of the novel thin spray-on liner (TSL): A progress report in mining operations. Geotech. Geol. Eng. 2021, 39, 5445–5477. [Google Scholar]
  2. Tang, Y.; Tang, B.; Cheng, H. New prefabricated support structure for TBM tunneling in complex strata of coal mines: Engineering practice. Coal Sci. Technol. 2024, 52, 68–75. [Google Scholar]
  3. Du Plessis, M.; Malan, D.F. Investigating the use of polymer-modified cementitious thin spray-on liners as stope face support. Int. J. Rock Mech. Min. Sci. 2021, 142, 104728. [Google Scholar] [CrossRef]
  4. Roache, B.; Jardine, J.; Sainsbury, B. Thin spray liners for face support at Kanmantoo. In Proceedings of the Underground Operators Conference, Brisbane, QLD, Australia, 27–29 March 2023. [Google Scholar]
  5. Kang, H.; Jiang, P.; Song, D.; Lei, Y.; Li, Z.; Wang, Z.; Zhang, X.; Li, F.; Han, C.; Wang, R. Drilling and anchoring integrated intelligent rapid excavation complete equipment. J. Intell. Mine 2023, 4, 9–14. [Google Scholar]
  6. Kang, H.; Jiang, P.; Wang, Z.; Zhang, X.; Liu, C.; Luo, C.; Wei, Y.; Guo, J.; Chen, Z.; Wang, R.; et al. Coal roadway rapid driving technology and equipment with integrated drilling and anchoring and its application. J. China Coal Soc. 2024, 49, 131–151. [Google Scholar]
  7. Kang, H.; Jiang, P.; Gao, F.; Wang, Z.; Liu, C.; Yang, J. Analysis on stability of rock surrounding heading faces and technical approaches for rapid heading. J. China Coal Soc. 2021, 46, 2023–2045. [Google Scholar]
  8. Wang, H. Present Status and Development of Mine Roadway Heading Technology and Equipment in China Coal Mine. Coal Sci. Technol. 2010, 38, 57–62. [Google Scholar]
  9. Mpunzi, P.; Masethe, R.; Rizwan, M.; Stacey, T. Enhancement of the tensile strengths of rock and shotcrete by thin spray-on liners. Tunn. Undergr. Space Technol. 2015, 49, 369–375. [Google Scholar]
  10. Qiao, Q.; Nemcik, J.; Porter, I.; Baafi, E. Laboratory investigation of support mechanism of thin spray-on liner for pillar reinforcement. Géotech. Lett. 2014, 4, 317–321. [Google Scholar]
  11. Zhao, Y.; Fu, X.; Shi, Y.; Zhao, B.; Fu, X.; Zhang, X.; Chen, Y. Research on Mechanical Behavior and Energy Evolution of Coal and Rocks with Different Thin Spray-On Liners Thickness under Uniaxial Compressive Loading. Sustainability 2022, 14, 5909. [Google Scholar] [CrossRef]
  12. Kanda, M.J.; Stacey, T.R. Review of the practical effectiveness of thin spray-on liners based on information from suppliers and observations from the mining industry. In Proceedings of the MGR 2019, First International Conference on Mining Geomechanical Risk, Perth, Australia, 9–11 April 2019; Australian Centre for Geomechanics: Perth, Australia, 2019; pp. 443–458. [Google Scholar]
  13. Shan, Z.J.; Porter, I.; Nemcik, J.; Zhang, Z.Y. Investigation on the Rock Surface Support Performance of Welded Steel Mesh and Thin Spray-On Liners Using Full-Scale Laboratory Testing. Rock Mech. Rock Eng. 2020, 53, 171–183. [Google Scholar]
  14. Ozturk, H.; Guner, D. Laboratory and distinct element analysis of the deformability behaviour of thin spray-on liners. Int. J. Rock Mech. Min. Sci. 2019, 123, 104118. [Google Scholar]
  15. Kouchesfehani, Z.K.; Tehrani, A.D.; Najafi, M.; Syar, J. Laboratory testing of invert-cut corrugated metal pipes renewed with polymeric spray applied pipe lining. Transp. Geotech. 2020, 25, 100413. [Google Scholar]
  16. Kang, H.; Li, W.; Gao, F.; Yang, J. Grouting theories and technologies for the reinforcement of fractured rocks surrounding deep roadways. Deep Undergr. Sci. Eng. 2023, 2, 2–19. [Google Scholar]
  17. Archibald, J.F.; Dirige, P.A. Development of thin, spray-on liner and composite superliner area supports for damage mitigation in blast- and rock burst-induced rock failure events. WIT Trans. Built Environ. 2006, 87, 10. [Google Scholar]
  18. Lau, V.; Saydam, S.; Cai, Y.; Mitra, R. Laboratory Investigation of Support Mechanism for Thin Spray-on Liners. In Proceedings of the 12th International Conference of International Association for Computer Methods and Advances in Geomechanics (IACMAG), Goa, India, 1–6 October 2008. [Google Scholar]
  19. Ozturk, H.; Guner, D. Failure analysis of thin spray-on liner coated rock cores. Eng. Fail. Anal. 2017, 79, 25–33. [Google Scholar]
  20. Guner, D.; Ozturk, H. Experimental and numerical analysis of the effects of curing time on tensile mechanical properties of thin spray-on liners. Rock Mech. Rock Eng. 2016, 49, 3205–3222. [Google Scholar]
  21. Chen, L.; Zhou, Z.; Liu, G.; Cui, X.; Dong, Q.; Cao, H. Effects of substrate materials and liner thickness on the adhesive strength of the novel thin spray-on liner. Adv. Mech. Eng. 2020, 12, 1687814020904574. [Google Scholar]
  22. Ozturk, H.; Tannant, D.D. Thin spray-on liner adhesive strength test method and effect of liner thickness on adhesion. Int. J. Rock Mech. Min. Sci. 2010, 47, 808–815. [Google Scholar]
  23. Li, Z.; Nocelli, B.; Saydam, S. Effect of rock strength and surface roughness on adhesion strength of thin spray-on liners. Int. J. Rock Mech. Min. Sci. 2017, 91, 195–202. [Google Scholar]
  24. Wang, C.; Zhang, C.; Yao, H.; Wang, N. Preparation and properties of modified fiber reinforced polyurea composites. Fine Chem. 2024, 8, 1–11. [Google Scholar]
  25. Li, B.; Zhang, J.; Liu, X.; Meng, T. Study on the coupling effect and failure mechanism of mesh fabriereinforced polyurea coating. J. Hydraul. Eng. 2024, 437, 136963. [Google Scholar]
  26. Gao, F.; Peng, X.; Yuan, G.; Liu, W. Laboratory investigation of scale effects in bursting failure of quasi-brittle materials. Int. J. Rock Mech. Min. Sci. 2023, 171, 105579. [Google Scholar]
  27. Li, B.; Liang, Y.; Zhang, L.; Zou, Q. Experimental investigation on compaction characteristics and permeability evolution of broken coal. Int. J. Rock Mech. Min. Sci. 2019, 118, 63–76. [Google Scholar]
  28. Shan, P.; Li, W.; Lai, X.; Zhang, S.; Chen, X.; Wu, X. Research on the Response Mechanism of Coal Rock Mass under Stress and Pressure. Materials 2023, 16, 3235. [Google Scholar] [CrossRef]
Figure 1. Schematic of the sample preparation process. (a) Macroscopic and microscopic morphology of the coal sample (the white dashed lines in the inset represent the boundaries of the coal block’s laminated joints); (b) A coal specimen after cutting and polishing; (c) Schematic of the polyurea spraying process; (d) Coal specimen after polyurea spraying.
Applsci 15 03486 g001
Figure 2. Uniaxial compression test of the standard coal sample. (a) Uniaxial compression test of the standard sample; (b) Surface cracks after failure of the standard sample; (c) Crack distribution inside the standard sample.
Applsci 15 03486 g002
Figure 3. Uniaxial compression test of the polyurea-coated coal sample. (a) Uniaxial compression test; (b) Removal of the extensometer and compressing the polyurea-coated coal sample to complete fragmentation; (c) Flaky appearance of the polyurea-coated coal sample after fragmentation.
Applsci 15 03486 g003
Figure 4. Stress–strain curve of the standard coal sample under uniaxial loading.
Applsci 15 03486 g004
Figure 5. PFC3D numerical simulation model.
Applsci 15 03486 g005
Figure 6. Schematic diagram of model components in PFC3D. (a) Linear Model; (b) Linear Parallel Bond Model; (c) Linear Contact Bond Model.
Applsci 15 03486 g006
Figure 7. Schematic of the deformation and stress principles of the polyurea-coated coal specimen. (a) Deformation of coal specimen before and after loading; (b) Load distribution on coal specimen; (c) Stress boundary conditions of coal specimen; (d) Force analysis of infinitesimal element of polyurea thin shell.
Applsci 15 03486 g007
Figure 8. Loading and unloading stress–strain curves of the coal sample under different polyurea coating thicknesses.
Applsci 15 03486 g008
Figure 9. Uniaxial compression loading and unloading stress–strain curve of polyurea-coated coal specimen.
Applsci 15 03486 g009
Figure 10. Variation in the number of cracks during the loading and unloading process of the polyurea-coated coal sample.
Applsci 15 03486 g010
Figure 11. Incremental fracture growth at each stage of the loading and unloading process.
Applsci 15 03486 g011
Disclaimer/Publisher’s Note: The statements, opinions and data contained in all publications are solely those of the individual author(s) and contributor(s) and not of MDPI and/or the editor(s). MDPI and/or the editor(s) disclaim responsibility for any injury to people or property resulting from any ideas, methods, instructions or products referred to in the content.

