1. Introduction
In modern programming education, algorithmic problem-solving training is crucial in enhancing students’ programming skills. Through the process of solving problems, students gradually master data structures and classical algorithms. However, when addressing the same problem, different students may employ distinct strategies, and teachers must provide personalized feedback accordingly. As programming education rapidly evolves, online problem-solving platforms have seen a surge in use, increasing both the number of students and the diversity of code submissions. This has made it increasingly difficult for educators to review and provide feedback on all student submissions manually. Therefore, automated clustering of student-submitted code based on code strategies offers a promising solution, enabling teachers to provide more timely and targeted feedback, thereby improving the overall quality of programming education.
Despite the progress, current automated clustering methods face several challenges:
The same problem can be solved using various approaches. The definition of a coding strategy depends on multiple features, such as program structure and semantic information, making it challenging to effectively model coding strategies.
Existing methods for learning code representations often focus on specific downstream tasks, which can result in representations that fail to adequately capture the strategic aspects of code.
Existing code clustering methods often rely on supervised learning, but manually labeling coding strategies is a subjective and time-consuming task. As a result, labeled datasets are difficult to scale, limiting the applicability of supervised methods.
Most code clustering methods rely on program execution behaviors and code compilation. However, these methods typically overlook deeper insights into the diversity of code features, making them less effective for code strategy clustering in the context of programming education.
To address these challenges, this study aims to answer the following research question: How can we effectively cluster student-submitted code based on problem-solving strategies without relying on extensive labeled data or execution-based methods? To this end, we propose CMVAE, a deep clustering model designed to cluster student code strategies based on multi-view code representations. The main contributions of this paper are as follows:
We propose a code representation method that first statically parses the code into an abstract syntax tree (AST), enhances edges related to strategy structures, and extracts structural features using centrality metrics. Additionally, we introduce a multi-view self-supervised learning framework that combines semantic features from pre-trained models to strengthen the expressive power of both structural and semantic representations, thereby providing robust support for the subsequent deep clustering phase.
We propose CMVAE, a deep clustering model based on multi-view code representations, and we successfully apply it to the task of code strategy clustering in programming education.
Experiments on four datasets (both labeled and unlabeled) demonstrate the effectiveness of our model in identifying and clustering students’ code strategies.
The remainder of this paper is organized as follows:
Section 2 presents a review of related work in code representation learning and deep clustering. This section discusses various approaches to code representation, including sequence-based, tree-based, and pre-trained model-based methods. We also review existing deep clustering methods and focus on code strategy clustering.
Section 3, Methodology, provides an overview of the clustering model and details the process of pre-trained code representation learning. It covers the transformation of code into ASTs, the extraction of structural features, and the multi-view pre-training phase. This section also discusses the deep clustering process. In
Section 4, Experiment and Discussion, we present the experimental setup and datasets used in our evaluation, followed by a discussion of the experimental results and analysis. Finally,
Section 5 concludes the paper with a summary of the findings and suggestions for future work.
2. Related Work
2.1. Code Representation Learning
The goal of code representation learning is to learn an efficient vector representation of the source code, and the learned code representations can be applied to various downstream programming language processing tasks [
1], such as code generation, code clustering, clone detection, and so on. In the early research, source code was directly regarded as plain text for representation learning. Later, to better capture the syntactic structure and semantic information of the code, researchers proposed a variety of different code representation learning techniques, which gradually make up for the shortcomings of the early methods and play an important role in extracting code features and improving the performance of the model.
Sequence-based code characterization methods treat the source code as a sequence of keywords, symbols, and identifiers, read the independent lexical units in the code, and model and learn them in a similar way as natural language text. CCFinder [
2] treats the code as a sequence of words and learns the code characterization by extracting the lexical information. Allamanis et al. [
3] use the model of the convolutional attention mechanism to learn to obtain the attention vector of each word in the code and combine it with a recurrent neural network to obtain the whole code representation. Sequence-based methods lack consideration of the syntactic structure and semantic representation of the code, making it more difficult for them to extract higher-order features of the code.
Program code has many different representations, among which AST is a typical code feature with multi-level and multi-nested structure, which can effectively represent the syntax of a program and its structure, and is the basis of many mainstream code characterization approaches. TBCNN [
4] performs feature extraction on the syntax tree by representing AST nodes as vectors and introducing a continuous binary tree structure to obtain a vector representation of the whole program. Zhang et al. [
5] propose ASTNN, which parses the program into small syntax trees divided by statements and shows good results in downstream tasks of code classification as well as code clone detection. Code2Vec [
6] constructs code fragments as ASTs and later constructs code representation vectors by path extraction methods. Hu et al. [
7] convert code ASTs into simple graph representations, transforming trees into code representations containing structural information, which perform well on the task of code clone detection. Allamanis et al. [
8] propose representing the syntax and semantics of source code through graph structures, using graph neural networks to solve two key tasks, variable naming and variable misuse, demonstrating the potential of graph neural networks to learn program semantics. Hellendorn et al. [
9] propose transformer-based graph relational embedding attention transformers (GREATs) to extract global relational feature information from graphs representing codes. Zhang et al. [
10] constructed heterogeneous program graphs (HPGs) to represent programs using the type information in the code graph, and the resulting code representations performed well on method name prediction and code classification tasks.
Inspired by natural language pre-training models, many code pre-training models have emerged in recent years, mostly based on the transformer [
11] architecture. These models employ self-supervised learning on extensive source code datasets, which are subsequently fine-tuned for specific downstream tasks. Among these, CodeBERT [
12] stands out as a prominent model designed to extract bimodal information from both programming languages and natural language descriptions of code. It is trained on six diverse programming language datasets and is built on the robust transformer encoder architecture of RoBERTa [
13], enabling it to capture the semantic and structural nuances of code effectively. GraphCodeBERT [
14] extracts code information using data streams of codes and designs multiple pre-training tasks for representation learning. Jiang et al. [
15] realized that previous pre-training efforts rarely incorporated tree structures into the learning process, but ASTs are essential features of code and can effectively help the model learn the code semantics. Thus, they proposed a tree-based pre-training code model, TreeBERT, which uses the set of constituent paths of an AST as input and adopts an encoder-decoder architecture and works well in code summarization and code documentation tasks. Tipirneni et al. [
16] introduced two types of code structure information, AST and data flow graphs, along with three modalities of the code text as inputs. They proposed the StructCoder model and developed a structure-aware self-attention mechanism to enhance the structural awareness of the model’s encoder.
2.2. Clustering Methods
Clustering is an unsupervised learning method to divide samples in a dataset based on similarity. In the task of code policy clustering, clustering methods can help to discover similar policy patterns in codes, and traditional clustering methods include k-means clustering [
17], spectral clustering [
18], and mean shift clustering [
19]. Deep clustering methods, on the other hand, achieve efficient clustering on unlabeled data by combining the feature learning capability of deep neural networks and the clustering capability of traditional clustering algorithms, by automatically learning features to better capture potential patterns in the data. Classical deep clustering methods usually use a self-encoder [
20] generation method. The deep-embedded clustering method DEC [
21] learns feature representation and cluster assignment to achieve end-to-end deep clustering. IDEC [
22] improves on DEC by preserving the local structure of the samples while clustering to improve the clustering results.
Due to the growth of programming education, there has been some work on how to automate the clustering of student code submissions to assist teachers in quickly checking a large number of programming submissions. Fu et al. [
23] proposed a strategy-oriented clustering method for programming commits, PaCon, which aims to help instructors identify strategies in functionally correct commits by using a symbolic analysis method that clusters solution strategies for different problems based on the semantic equivalence of program path conditions. Strategy clustering of student code is achieved through the steps of generating test inputs, collecting path conditions for tests, and clustering based on path conditions. OverCode [
24] is a visualization system that cleans up the code by renaming public variables that have the same sequences in the program trace, and later clusters codes containing the same set of program statements into the same class. Clara [
25] clusters submissions with the same control flow structure and bijective relationships between variables into the same cluster. TipsC [
26] first normalizes programs into linear representations and then clusters similar programs based on distance variants. SemCluster [
27] computes program control flow and data flow features from a test suite and then generates vectors for clustering programs.
3. Methodology
3.1. Problem Formulation
In programming education, students often encounter the same algorithmic problem and submit various solutions. Despite implementing the same functionality, these solutions can vary significantly in terms of the coding strategy used. For example, the same functionality that implements array sorting can have many different strategies, such as selection sorting by constantly selecting the smallest element to swap positions, or insertion sorting by inserting elements into a sorted section. However, due to the lack of explicit labels, it is challenging to directly determine which solutions employ similar strategies. Identifying and grouping student codes based on the strategies underlying these problem-solving solutions is critical to providing more personalized feedback and enabling students to optimize their problem-solving approach.
The main challenge lies in automatically extracting and clustering solution strategy-related code representations from student code submissions. Given a set of code submissions, our goal is to group them based on the similarity of their solution strategies. The point of difficulty lies in capturing the structural and semantic aspects of the code, which are crucial for identifying code strategies beyond the functionality of the code.
Formally, we define the problem as follows:
Given a set of code snippets , where each code snippet represents a solution to a common algorithmic problem, we aim to group these snippets into clusters , where each cluster contains code snippets that implement similar solution strategies. The challenge is to design a model that can automatically learn a meaningful representation of the code, accounting for both structural and semantic features, and use these representations for clustering.
The objective is to learn a function , where R is the space of code representations, and then cluster the learned representations into k groups that reflect the underlying solution strategies. The model should capture both the syntactic structure and the semantic meaning of the code snippets.
3.2. The CMVAE Framework
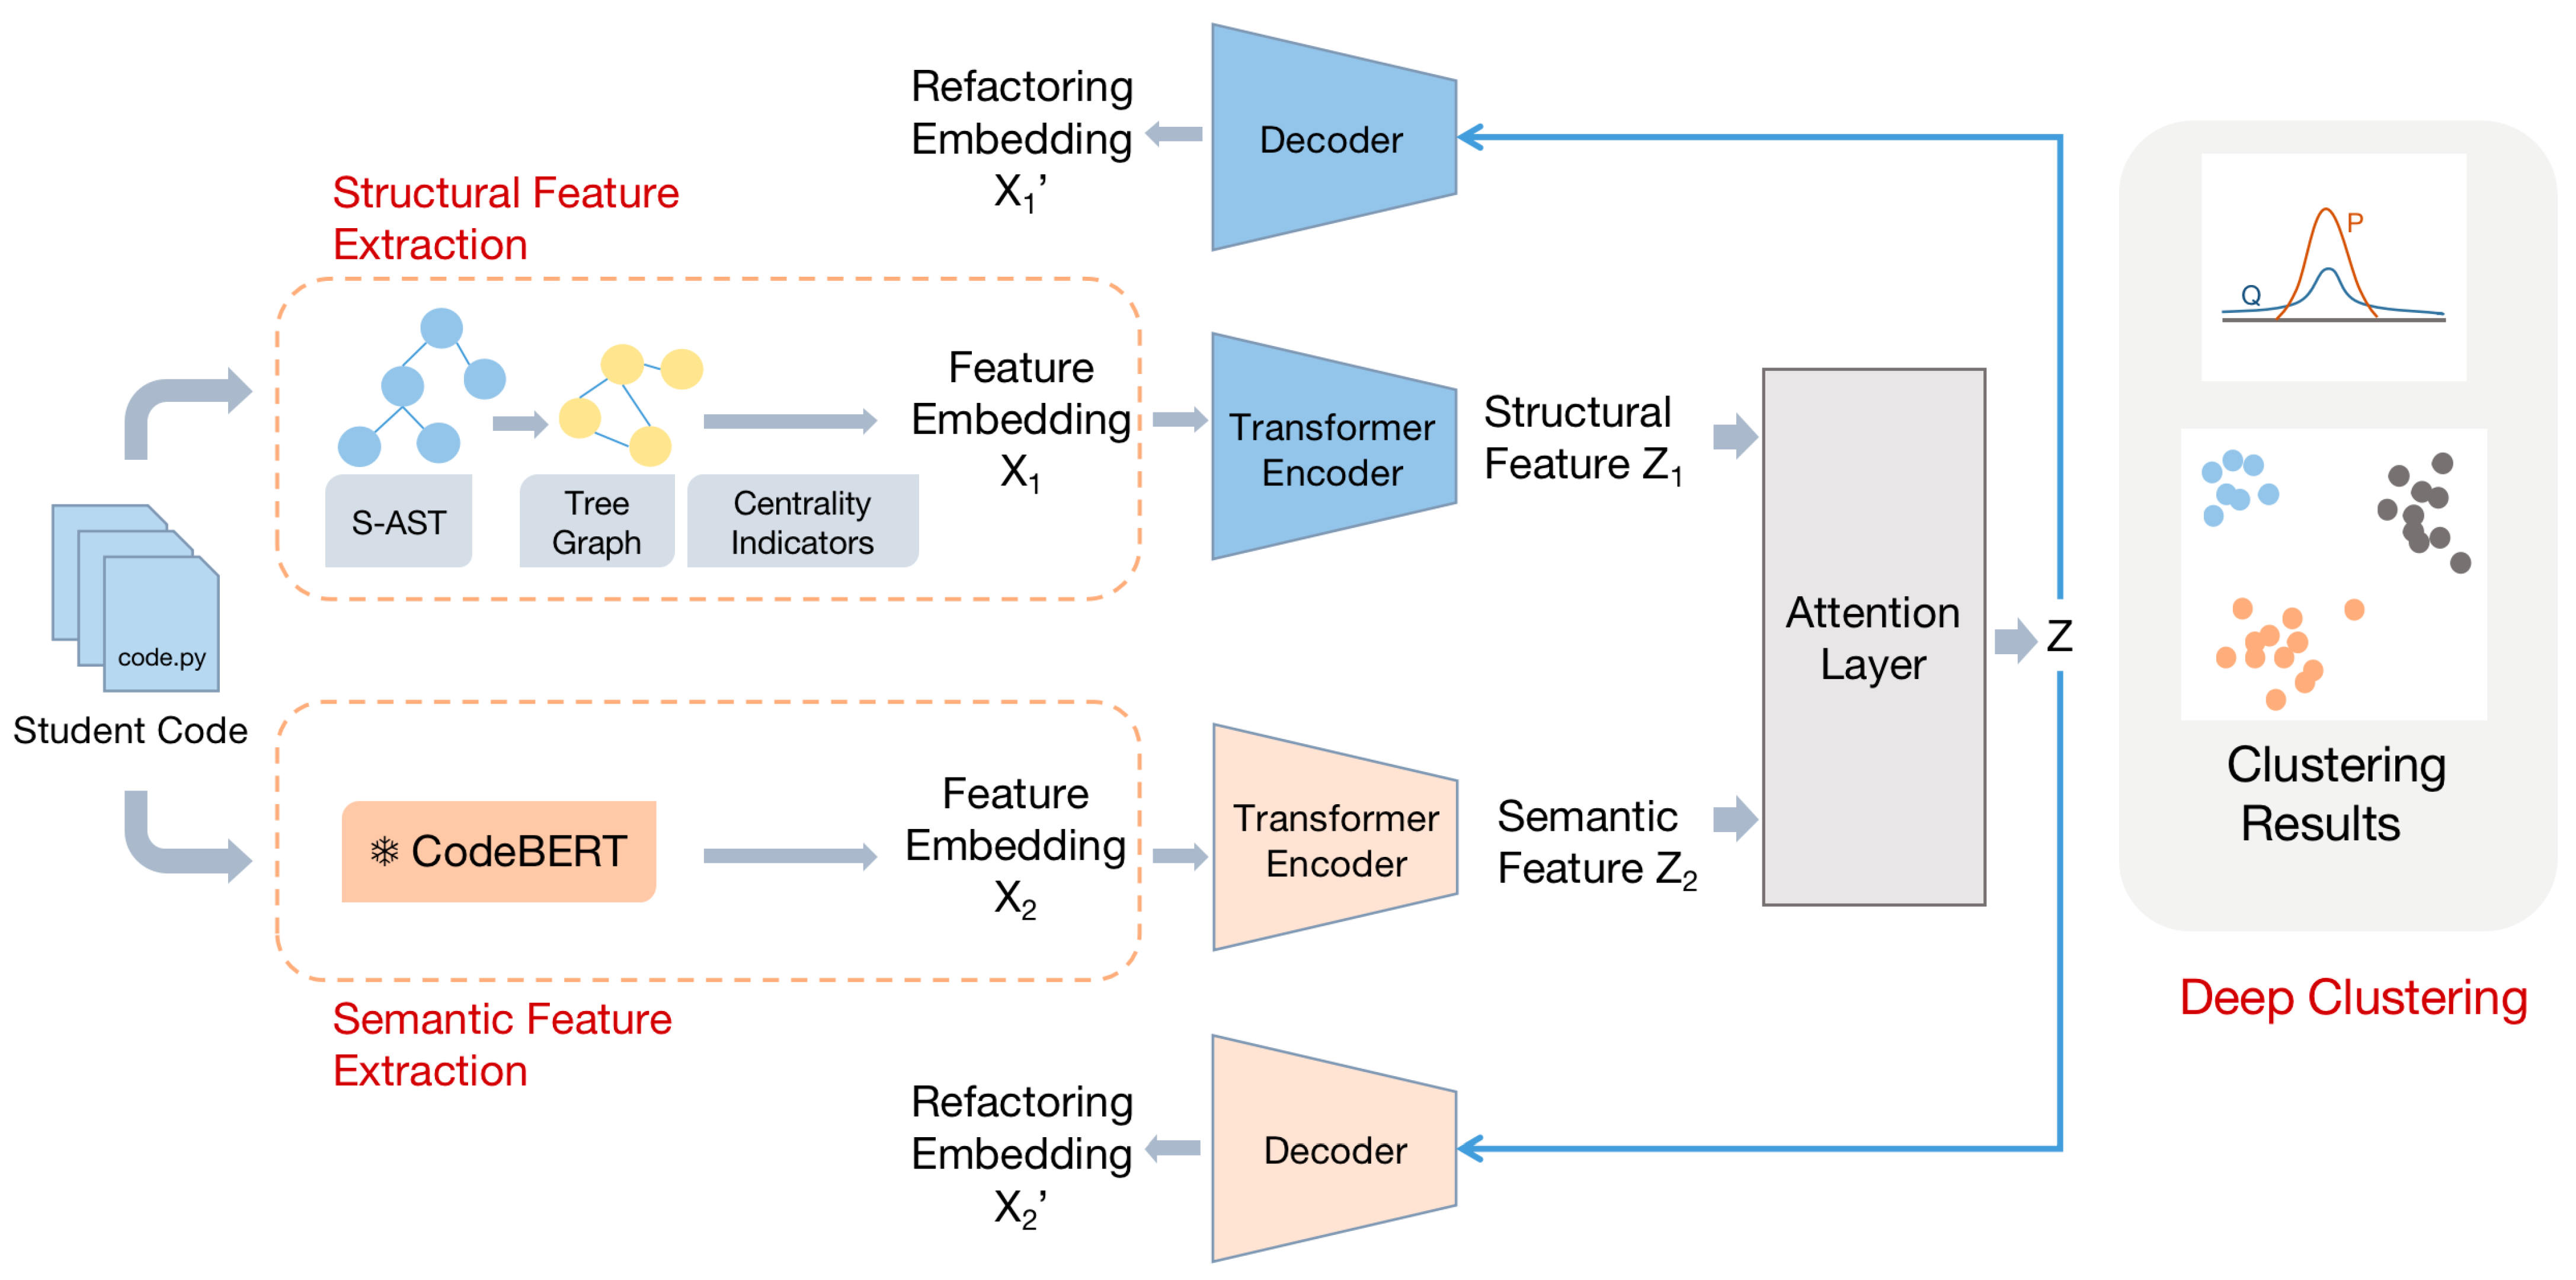
To address the above challenges, this paper proposes CMVAE, a deep clustering model for code based on multi-view representations. This method first converts codes into ASTs, enhances their strategy structures, and then transforms them into tree graphs with a fixed number of nodes and extracts the centrality metric vectors of each node to obtain structurally relevant code representations. Meanwhile, the semantically relevant code representations are extracted using the CodeBERT pre-training model, which is combined with the reconstruction loss and contrast loss of the transformer encoder for model pre-training. Under the premise of ensuring that the core features of the input data are not lost, the complementarity between the representations from different perspectives is enhanced, so that the resulting representations are more relevant to the coding strategy. On this basis, joint training is performed by deep clustering methods, which are applied to the downstream task of code strategy clustering. The overall framework of CMVAE is shown in
Figure 1. The model contains the following two important parts:
Pre-training learning yields code representations that can embody code strategies. We divide code strategy representations into the understanding of structure and the understanding of semantics. The representations of different views of the code are obtained through the centrality feature of tree diagrams and the code pre-training model CodeBERT, respectively. Representation fusion by dynamically selecting weights for different representations through the attention layer. Then, a pre-training process that jointly trains reconstruction loss and contrast loss is designed to integrate the features that utilize different views of the code to learn how to obtain code representations rich in structural and semantic information.
The part of clustering student code strategies is implemented through a joint encoder-decoder-based training approach. After obtaining the code representation for clustering, the quality of clustering is improved without losing essential features by minimizing the difference between the pairwise soft assignment probabilities and the target distribution, jointly reconstructing the loss and clustering loss.
3.3. Pre-Training to Learn Code Representations
3.3.1. Conversion of Code Tree Graph
The parsing flow of the tree diagram is illustrated in
Figure 2. Taking a Python (version 3.8) code fragment as an example, first use a static code analysis tool to parse the source code into the corresponding AST. In this paper, we utilize the ast package (the ast module in the Python standard library is used for parsing Python code and generating ASTs. Official documentation:
https://docs.python.org/3/library/ast.html, accessed on 21 July 2024) for parsing Python code. For other commonly used programming languages in programming education, tools such as Tree-sitter (Tree-sitter is a parsing framework that supports various programming languages for code analysis and editor plug-in development. Official documentation:
https://tree-sitter.github.io/tree-sitter/, accessed on 21 July 2024) or Joern (Joern is a code analysis tool based on code attribute maps, designed for vulnerability detection and code understanding. Official documentation:
https://joern.io, accessed on 21 July 2024) can be used to parse source code. The AST obtained through parsing represents the overall structure of the source code in a tree form, where different node types, such as FunctionDef, If, etc., correspond to different syntactic elements, and edges between parent and child nodes represent the hierarchical structure of the code.
To parse all the source codes in the dataset, we extract the node types and count the number of occurrences. Based on this, a node type mapping table is created, mapping node type names to corresponding integer identifiers according to their frequency of occurrence. For example, using Python code, a mapping table with 50 node types is constructed, plus an additional node for unknown types. This results in an undirected tree graph containing 51 nodes.
The hierarchical arrangement of branches and loops is fundamental to the code’s flow control. The edges that represent these branches and loops help illustrate the code’s logical framework. Therefore, based on the basic AST, we introduce the following enhancements:
Conditional judgment enhancement edges: Add enhancement edges between conditional expressions and branch nodes. Conditional judgments include various structures, such as if statements, else statements, elif (else-if) statements, and switch (case) statements. These control flow structures are the basis for directing the flow of program execution based on specific conditions. The decision logic and hierarchy of the code’s control flow can be better captured by adding augmented edges between conditional expressions and the corresponding branch nodes.
For loop enhancement edges: Add enhancement edges from the loop variable to the loop body node. In the case of for loops, loop variables are an important part of the iteration process, controlling the number of iterations and the data that are iterated over. By adding enhancement edges from the loop variable to the corresponding loop body node, you can emphasize the relationship between the role of the variable in the loop and the actions performed in the loop body. This is important for understanding the overall logic of the program.
While loop enhancement edge: Add an enhancement edge from the loop condition to the loop body node. Similar to for loops, while loops rely on a condition to determine whether the loop body should execute repeatedly. By adding an enhancement edge from the loop condition to the loop body node, we explicitly capture the dependency between the condition and the execution of the loop body, highlighting the control flow that governs the loop’s execution.
This results in a structured version of the AST (S-AST), where the added enhancement edges provide additional explicit relational information, offering a more strategy-specific input representation for subsequent deep clustering tasks.
Algorithm 1 summarizes the algorithmic procedure for constructing the tree graph. Initialize all possible AST node types as graph nodes, traverse the augmented AST and consider each node as a node in the graph, node types are mapped to corresponding IDs using the node type mapping table. When a parent node is present, an edge is established between it and the current node. If such an edge already exists, its weight is incremented to reflect the accumulation of connections. As a result, the edge weights in the undirected tree graph correspond to the number of edges connecting different node types in the AST.
3.3.2. Extraction of Structural Features
The generated tree graph is viewed as a network to analyze it structurally using graph theoretic methods. The centrality measures of the nodes are extracted from the graph as features and the relationships between the features and edges of the nodes are mapped to a vectorized representation. Using the graph theory library NetworkX (NetworkX is a Python library for manipulating and analyzing complex networks. Official Documentation:
https://networkx.org, accessed on 21 July 2024) to compute centrality metrics for each node in each tree graph to obtain feature vectors.
| Algorithm 1 Conversion from source code to tree graph |
- 1:
Input: Source code submitted by students - 2:
Output: Tree graph g of the source code - 3:
Function FromSourceCodeToTreeGraph(code) - 4:
Parse code to generate ast_tree - 5:
Initialize an empty graph g - 6:
for each node in ast_tree do - 7:
Get node type node_type - 8:
Map node type to corresponding node_id using a node type mapping table - 9:
Add node_id to graph g with attributes {name: node_type} - 10:
if the node has a parent then - 11:
Get parent node type parent_type - 12:
Map parent type to corresponding parent_id using the node type mapping table - 13:
if edge (parent_id, node_id) already exists in graph g then - 14:
Increase the weight of edge (parent_id, node_id) - 15:
else - 16:
Add edge (parent_id, node_id) to graph g - 17:
end if - 18:
end if - 19:
for each child node of the current node do - 20:
Recursively process child node - 21:
end for - 22:
if the node is strategy-related (If, For, While) then - 23:
Add strategy-related edges in graph g - 24:
end if - 25:
end for - 26:
Return graph g as output
|
Seven centrality metrics are computed for the graph, and each centrality produces a vector with a length equal to the total number of nodes in the graph.The seven centrality metrics of a graph are computed, each producing a vector whose length matches the total number of nodes in the graph. The calculation proceeds as follows:
Harmonic Centrality [
28]: This measures the closeness between a node and all other nodes, reflecting the global accessibility of the node. The calculation method is shown in Equation (
1):
where
is the minimal path distance between nodes
u and
v.
Eigenvector Centrality [
29]: This measures the importance of a node, reflecting its importance in logical propagation and dependency relationships. The calculation method is shown in Equation (
2):
where
is the set of neighbors of node
v, and
is the largest eigenvalue of the adjacency matrix.
Closeness Centrality [
30]: This measures the average distance between a node and all other nodes, reflecting the efficiency of node access. The calculation method is shown in Equation (
3):
where
is the minimal path distance between nodes
u and
v.
Betweenness Centrality [
31]: This measures the ability of a node to act as an intermediary in the network, reflecting the node’s control over the network. The calculation method is shown in Equation (
4):
where
is the overall number of shortest paths between nodes
s and
t, and
represents the number of shortest paths from
s to
t that pass through node
v.
Degree Centrality [
32]: This metric measures the number of connections a node has, reflecting its local importance. The calculation is shown in Equation (
5):
where
is the number of neighbors of the node
v, and
n is the total number of nodes.
Katz Centrality [
33]: This metric measures a node’s importance, taking into account its connections to other important nodes. The calculation is shown in Equation (
6):
where
is the attenuation factor, and
is the initial constant term.
Clustering Coefficient [
34]: This measures the connectivity between the neighbors of a node, reflecting the local clustering characteristics of the network. The calculation formula is provided in Equation (
7):
where
represents the count of actual connections among the neighbors of node
v, and
denotes the node’s degree.
These seven centrality metrics measure the significance and importance of code structures at different levels of the graph, and are capable of extracting core information from the code structure, such as dependencies and call relationships. By concatenating them into a complete structural feature vector, it facilitates input into downstream tasks in subsequent deep learning models. The final structural feature embedding
can be represented as follows:
where concat denotes the concatenation operation of the vectors. The result is a vector of dimension
, where
d denotes the total number of nodes.
This representation primarily reflects the structural information of the code and has a weaker capability in capturing the semantic information of functions (such as variable meanings, function purposes, etc.). To address this limitation, the pre-trained model CodeBERT is used to extract semantic features of the code. Through contrastive learning, these semantic features are fused with the structural features, enhancing the code representation’s understanding of both semantics and structure.
3.3.3. Extraction of Semantic Features
Based on the transformer architecture, CodeBERT [
14] is a pre-trained model that has been trained on large-scale code and natural language corpora. It generates embedding vectors that capture both the syntactic and semantic properties of valid code. While there are various pre-trained models available for code-related tasks, the resource-intensive nature of fine-tuning these models led us to choose a more efficient approach. Instead of fine-tuning, we opt to freeze the parameters of CodeBERT, directly utilizing its pre-trained embeddings as input features.
To begin with, the source code files submitted by students undergo preprocessing to remove unnecessary distracting information, which includes the following steps:
Removing comments and documentation strings from the code while retaining the core logic.
Using regular expressions to eliminate redundant whitespace characters and line breaks, ensuring that the input is concise and standardized.
After cleaning the code, CodeBERT’s tokenizer is used to break the code into tokens, enabling truncation and padding as needed to ensure uniform token sequence lengths. These tokenized sequences are then passed through the CodeBERT model, which generates context embeddings for each token. The global vector representation of the code is obtained by averaging the context embeddings of all tokens, providing a semantic feature for the code. This process is described in Equation (
9):
where
denotes the semantic embedding vector of the code,
N represents the number of tokens in the code sequence, and
represents the context embedding vector of each token.
3.4. Pre-Training for Multi-View Representations
After obtaining the structural and semantic representation of the code, a pre-training phase is performed. The aim is to learn an unsupervised representation of the code that reflects the code strategy by simultaneously optimizing the reconstruction loss of the autoencoder and the contrast loss between different views.
An autoencoder consists of an encoder and a decoder and is commonly used in self-supervised learning for feature extraction. It works by reducing the discrepancy between the input and its reconstructed version, effectively capturing hidden patterns or features in the data. The advantage of this approach is that there is no need to label the data and the reconstruction target can be constructed solely from the input data.
In this work, the code is treated as multi-view data, where the structural feature embedding and the semantic feature embedding are first extracted. These embeddings are then fed into separate transformer encoders, which generate the corresponding structural feature representation and semantic feature representation . By using independent encoders to model the structural and semantic features separately, the uniqueness of each view is preserved. This prevents information loss from occurring in the early stages and ensures the completeness and complementarity of the structural and semantic representations in the latent space.
The model employs an attention mechanism to fuse structural and semantic features to generate a unified code representation. The mechanism captures fine-grained relationships between different representations and dynamically assigns weights to structural features and semantic features according to task requirements. As a result, the contribution of each feature to the fused representation is dynamically adjusted and the final representation is projected into a unified potential space. The calculation is shown in Equation (
10):
where
Z denotes the unified code representation, and
and
represent the structural and semantic features, respectively.
The fused code representation then reconstructs the original structural features and semantic features through a decoder. The reconstruction loss, which is used to measure the error between the input and reconstructed data, ensures that the model retains as much input information as possible while preserving the full information from both views in the fused features, allowing for better capture of the global features of the structural features and semantic features of the code. The reconstruction loss is computed as shown in Equation (
11):
where
denotes the Euclidean distance between the input and the reconstructed representations.
To better capture the commonality and differences between multi-view information in the representation, contrastive learning loss is incorporated. Each representation is normalized, and the structural and semantic representations are concatenated in different directions. To create pairs of positive samples, corresponding structural and semantic features of the same code were used. Cosine similarity was then applied to measure the similarity between these samples and the model was optimized using cross-entropy loss to encourage a more consistent alignment of structural and semantic features in the latent space. The contrast loss aims to enhance the fusion of multi-view data by increasing the alignment between structural and semantic representations. The contrastive loss is computed as shown in Equation (
13):
where
is the temperature hyperparameter,
and
represent the concatenated structural and semantic representations in different directions, and
is the cross-entropy loss applied to the similarity matrices
and
.
During the pre-training phase, the model jointly optimizes both the reconstruction loss and the contrastive loss. This leads to a learned representation that effectively extracts these features, which are then used in downstream clustering tasks. The overall loss is computed as shown in Equation (
14):
where
and
are weight coefficients used to balance the impact of the reconstruction and contrastive loss terms.
3.5. Deep Clustering
In the deep clustering phase, CMVAE adopts a joint training approach, optimizing both reconstruction loss and clustering loss simultaneously. The initial clustering of the fused representations is carried out using the k-means algorithm. In the absence of labeled data, the silhouette score is used to identify the optimal number of clusters, which in turn determines the initial cluster centers. These initial cluster centers provide a reasonable starting point for subsequent clustering optimization.
The next step involves using the Student’s t-distribution to calculate the soft assignment probabilities for each data point with respect to the cluster centers. By adjusting the degrees of freedom of the distribution, the assignments can more effectively reflect the relative distance between the data points and the cluster centers. The calculation of the soft assignment probability of a data point relative to a cluster center is given by Equation (
15):
where
represents the Euclidean distance between the data point
and the cluster center
, and
is a scale parameter that controls the spread of the distribution.
A reweighted target distribution is generated based on the soft assignment of probabilities to further optimize the clustering performance. The design of the target distribution aims to increase the contribution of high-confidence samples to the cluster centers while diminishing the influence of low-confidence samples. By amplifying the weight of high-confidence samples, the model emphasizes the data points that are more valuable for optimization. The calculation of the target distribution is shown in Equation (
16):
where
is a parameter that controls the sharpness of the distribution, increasing its focus on high-confidence points.
Similar to DEC [
21] and IDEC [
22], the clustering loss is calculated as the Kullback–Leibler (KL) divergence between the soft assignment probabilities and the target distribution. By minimizing the difference between the soft assignment probability and the target distribution, the model gradually adjusts the position of the clustering centers during the iteration process to make it closer to the real clustering structure of the data and improve the clustering performance. The loss function is outlined in Equation (
17):
where
is the soft assignment probability from the Student’s t-distribution, and
is the target distribution.
Throughout this process, the clustering module is optimized not only through the KL divergence but also by incorporating the reconstruction loss from the pre-training phase. This ensures that the model retains its ability to reconstruct the original data while simultaneously capturing code strategy features. As a result, the model can gradually approximate the true clustering structure. The overall joint loss function is computed as shown in Equation (
18):
where
and
are balancing coefficients used to adjust the relative weights of the clustering optimization and reconstruction loss.
As the joint optimization proceeds through multiple iterations, the cluster center positions are gradually adjusted, and the model converges to a stable state, ultimately producing the final clustering results.
4. Experiment and Discussion
4.1. Experiment Setting
4.1.1. Datasets
In this study, the proposed method was evaluated on datasets from two programming languages (Python and C#) to verify its effectiveness for the code strategy clustering task. The datasets are detailed below:
CodeNetPython800 (
https://developer.ibm.com/exchanges/data/all/project-codenet/, accessed on 21 July 2024) (Unlabeled): A subset of the extensive CodeNet programming problem dataset introduced by IBM. It contains 800 Python programming problems, with 300 student code submissions per problem, totaling 240,000 Python programs.
Sorting-Python Dataset (
https://github.com/big-tangyuan/sorting_algo_py, accessed on 21 July 2024) (Labeled): This dataset consists of 151 Python sorting algorithm programs collected from GitHub, covering six classical sorting strategies: Selection Sort, Bubble Sort, Merge Sort, Heap Sort, Quick Sort, and Insertion Sort.
PaCon Dataset (
https://sites.google.com/view/paconproj/, accessed on 21 July 2024) (Labeled): This dataset, constructed in the PaCon paper [
23], is publicly available and is based on the Code-Hunt dataset. After a series of filtering processes, it includes only correct and C#-compatible code submissions, with nine programming problems and a total of 519 student submissions. The dataset was manually labeled according to different problem-solving strategies.
Sorting-C# Dataset (Labeled): In the PaCon paper [
23], the authors collected 66 C# sorting algorithm programs, covering five classical sorting strategies: Bubble Sort, Heap Sort, Insertion Sort, Quick Sort, and Merge Sort.
4.1.2. Baseline
To evaluate the effectiveness of CMVAE, we compare it with both traditional clustering methods and a deep clustering approach. Since there are limited prior studies specifically focused on code strategy clustering, we adopt widely used clustering techniques as baselines to provide a comprehensive performance evaluation. We select three classical clustering methods and one deep clustering method as baselines:
K-means [
17]: A widely used centroid-based clustering algorithm. It partitions data into clusters by minimizing the within-cluster variance.
Spectral Clustering [
18]: A graph-based clustering method. It leverages eigenvalues of the similarity matrix to perform clustering.
MeanShift [
19]: A density-based clustering algorithm. It finds clusters by shifting points towards regions of higher density.
DEC [
21]: A well-known deep clustering method. It jointly learns feature representations and cluster assignments through a self-supervised learning process.
For a fair comparison, all baseline methods are applied to the same extracted features and pre-training phase as CMVAE. Specifically, the feature extraction process remains unchanged. The same multi-view representations obtained from AST-based structural analysis and CodeBERT embeddings are used. The only difference lies in the clustering stage, where CMVAE’s deep clustering component is replaced with the selected baselines. By doing so, any differences in clustering performance arise from the clustering methods themselves rather than variations in feature extraction.
4.1.3. Evaluation Metrics
For labeled datasets, accuracy and the Fowlkes–Mallows index (FM index) were used for evaluation. The accuracy metric aligns the predicted labels with the ground truth using the Hungarian algorithm and computes the proportion of correctly classified samples. The FM index assesses the alignment between the clustering outcomes and the actual labels, with a scale from 0 to 1. A higher value indicates that the results are closer to the true labels, thus representing better clustering performance.
For unlabeled datasets, performance evaluation primarily relies on internal clustering metrics. In this study, we used the silhouette coefficient, the Calinski–Harabasz (CH) index, and the Davies–Bouldin (DB) index as evaluation metrics. These three indices are able to measure the closeness and separation of clusters in order to assess the intrinsic quality of the cluster results. The value of the silhouette coefficient ranges from −1 to 1, with higher values indicating better clustering performance. It quantifies the degree of cluster definition by calculating the average distance between each sample and other points within the same cluster, as well as the average distance to the nearest points in different clusters. The CH index is used to measure the balance between cluster separation and the compactness within clusters, while the DB index is used to assess the proximity between each cluster and its nearest neighbor. A higher CH index indicates better clustering, while a lower DB index indicates better separation and better clustering performance.
4.2. Experimental Results and Analysis
4.2.1. Labeled Datasets
Table 1 shows the clustering results of the proposed model on labeled datasets across different problems. For each problem, the programming language used, the topics, the clustering accuracy, and the FM index are listed. The accuracy and FM index measure the classification precision and consistency of the clustering results, respectively. A higher accuracy reflects a stronger match between the clustering outcomes and the true labels, whereas the FM index takes both precision and recall into account when evaluating the clustering performance.
For the 11 labeled problems, the average clustering accuracy reached 84.2%, and the average FM index was 0.806, indicating that the proposed model can effectively cluster code strategies. In the Sorting-C# and Sorting-Python datasets, although they involve code from different programming languages, both belong to the category of sorting algorithms, and the clustering results were relatively consistent. The accuracy for these datasets was 93.9% and 91.4%, respectively, demonstrating the stability of the proposed model in similar tasks.
Table 2 presents the clustering results using different clustering methods on labeled datasets, with the evaluation metrics for the PaCon dataset being averaged over the nine problems in the dataset. To evaluate the effectiveness of CMVAE, we compare it with the following classical clustering methods: k-means [
17], spectral clustering [
18], MeanShift [
19], and deep clustering DEC [
21].
When compared to conventional methods such as k-means and spectral clustering, the CMVAE model achieves considerable improvements in both its accuracy and FM index scores, underlining the effectiveness of the model in the clustering stage. Meanwhile, the traditional deep clustering method MeanShift [
19] performed poorly across the datasets, with an accuracy of only 30.3% on the Sorting-C# dataset. This may be due to its limited effectiveness in clustering high-dimensional data. When dealing with high-dimensional and complex data, traditional clustering methods are limited by the model’s representational capacity, which hampers the effective integration of multi-view features. By contrast, DEC [
21] leverages deep feature extraction capabilities, achieving overall better performance than traditional methods. However, the CMVAE model, through multi-view feature fusion and deep embedding learning, achieves comprehensive improvements in accuracy and FM index, demonstrating its superiority in the code strategy clustering task.
4.2.2. Unlabeled Datasets
Similarly, the clustering effect of this paper’s model is compared with four classes of classical clustering methods, and the evaluation metrics are calculated based on the average of the 800 questions in the dataset.
Table 3 shows the clustering results obtained using different clustering methods on the unlabeled dataset CodeNetPython800.
Traditional clustering methods such as k-means [
17], spectral clustering [
18], and Meanshift [
19], perform numerically lower for each evaluation metric than the deep clustering methods like DEC [
21] and the proposed CMVAE model. This performance gap can be attributed to the fact that traditional clustering methods rely on predefined distance metrics in the original feature space. By contrast, deep clustering methods leverage neural networks to learn meaningful feature representations, enabling more effective clustering. Among the deep clustering methods, DEC [
21] improves upon traditional approaches by jointly learning feature representations and cluster assignments. In comparison, our proposed CMVAE model incorporates a multi-view representation learning framework that employs a joint optimization strategy combining clustering loss and reconstruction loss from two autoencoders, which enhances the quality of learned representations and improves clustering performance. The CMVAE method achieves the highest values for contour coefficient (0.390), CH index (593.795), and DB index (1.118), indicating that the method is better able to classify the samples into tight and separated clusters.
By comparing the clustering results of the different clustering methods, it is reflected that the CMVAE method based on multi-view learning proposed in this paper has a clear advantage in the clustering task, which can better capture the code’s policy features and generate high-quality clustering results.
4.2.3. Ablation Experiments
Ablation experiments were performed on both labeled and unlabeled datasets to assess the effect of various innovative strategies on the CMVAE model. The impact of each component on the final performance was observed and analyzed in detail by removing specific functional parts from the model. Systematically removing key parts of the model helps verify the contribution of each innovation to the model’s performance. The specific design of the ablation experiments corresponds to the following four components in the model:
Remove CodeBERT Semantic Features (No-CodeBERT): This experiment removed the code semantic features extracted through CodeBERT and only used the tree graph structural features and other functionalities. This experiment evaluates the impact of removing semantic features on model performance.
Remove Tree Graph Structural Features (No-TreeGraph): This experiment removed the code structure features obtained through the centrality measures of the tree graph and only used the semantic features and other functionalities. This design investigates the effect of removing the tree graph structural features on clustering performance.
Remove Attention Mechanism Fusion (No-Attention): This experiment removed the attention mechanism fusion step and relied only on the direct concatenation of structural and semantic features. This design aims to validate the effectiveness of the attention mechanism in fusing multi-view representations.
Remove Deep Clustering Module (No-DeepClustering): This experiment removed the deep clustering module from the model and used only the reconstruction loss from the pre-training phase, applying the k-means algorithm for clustering. This design examines the impact of the deep clustering module on the final clustering results.
Table 4 shows the results of the ablation tests performed on the labeled dataset, demonstrating the clustering performance of the model under various ablation experimental configurations using evaluation metrics such as accuracy and FM index. By comparing the results from various experimental settings, the impact of each functional component on the final performance can be observed.
After removing any of the code features, the model was converted from a multi-view code representation to a single-view code representation, and there was a reduction in the accuracy and FM index of the clustering results. The removal of the tree graph structural features resulted in a more significant drop in these metrics, indicating that the tree graph has a significant impact in capturing the strategy features of the code. Specifically, when dealing with complex code structures, it provides additional structural information that significantly enhances clustering performance.
After removing the fusion component of the attention mechanism, the model’s clustering performance deteriorates, resulting in a less effective clustering outcome compared to the complete model. This demonstrates the crucial role of the attention mechanism in integrating multi-view representations and leveraging complementary features. By enhancing the synergistic effect of these features, the attention mechanism ensures that the fused representations are both comprehensive and diverse, thereby improving the model’s performance in unsupervised tasks. After removing the deep clustering module and using only the k-means algorithm for direct clustering, the decrease in model performance indicates that the deep clustering module has a significant impact on the final clustering results. By optimizing the cluster center positions and incorporating reconstruction loss during the pre-training stage, deep clustering enhances clustering accuracy, ensuring that the generated viewpoint representations maintain high-quality semantic and structural features. Taken together, removing any of the components leads to a decrease in model performance, verifying the key role of tree diagram structural features, CodeBERT semantic features, attention mechanism fusion, and deep clustering on the performance outcomes of the CMVAE model.
The same ablation experiments were performed on the unlabeled CodeNetPython800 dataset to obtain the average clustering internal metrics over the dataset with the values shown in
Table 5. The experimental results show that the performance of the internal metrics for the clustering results decreases when transitioning from a multi-view to a single-view approach. Among them, the performance is slightly stronger using only the tree diagram structural features, indicating that the tree diagram structural features can provide some support for clustering, while the semantic features have more limited support for clustering in the absence of structural information.
The complete CMVAE model combines structural features obtained from code extraction by transforming the tree diagram, CodeBERT semantic features, attention mechanism fusion, and deep clustering module, and performs better on the internal evaluation index of clustering. Although it is slightly inferior to the No-Attention experiment in the DB index, indicating that the attention mechanism may interfere with the inter-cluster separation to some extent, it significantly outperforms the No-Attention experiment in both profile coefficient (0.390) and CH index (593.795), indicating that the attention mechanism remains essential in the overall fusion of the representations and the optimization of the clustering performance. It has been demonstrated that the CMVAE model introduced here captures code strategy features more effectively, leading to enhanced clustering performance on unlabeled datasets through the deep fusion of multi-view features and optimization of the clustering process.
5. Conclusions
The focus of this paper is the proposal of CMVAE, a deep clustering model leveraging multi-view representations to address critical issues in code strategy clustering. The model leverages static analysis to extract ASTs from student codes, enriching them with strategy-related edges. By combining graph theory techniques to generate centrality metrics, along with the semantic information captured through CodeBERT, the model integrates both structural and semantic representations. The fusion of reconstruction and contrastive losses enables the model to mine complementary information between different views, producing a code representation that embodies the code strategy.
In the experimental session, we conducted a series of comparison and ablation experiments on datasets in C# and Python programming languages containing different cases of labeled and unlabeled datasets. The results show that CMVAE outperforms traditional clustering methods and classical deep clustering methods on several datasets. In addition, the ablation experiments underscore the importance of the multi-view fusion module, contrastive learning loss module, and autoencoder module in enhancing the model’s performance. These experimental findings not only show that CMVAE excels in clustering tasks but also confirm its strong generalizability and robustness, establishing its effectiveness in the context of code strategy clustering.
Although our experiments are conducted only on C# and Python code, the methodology is not limited to these two languages. As long as a programming language can be parsed into ASTs and its semantic features can be effectively captured by a suitable pre-trained model, our approach can be adapted to analyze its features for clustering.
CMVAE has great potential applications in programming education. Automatically clustering student code submissions based on problem-solving strategies can assist teachers in identifying common patterns in students’ approaches. This can enable teachers to provide personalized feedback efficiently and tailor instructional content to address specific learning challenges. Moreover, CMVAE could be integrated into automated assessment systems, offering a new approach to evaluating students’ coding behaviors. Such insights could help educators to improve curriculum design.
However, our method is primarily designed for introductory programming coursework and may face challenges in handling complex software architectures, such as object-oriented programs with extensive class hierarchies. For instance, in advanced software development scenarios involving classes, inheritance, polymorphism, and distributed method implementations, the AST-based structural analysis may struggle to fully capture the interdependencies between components. Our future work involves exploring higher-level semantic modeling to address this limitation, and exploring semi-supervised learning techniques to enhance the model’s performance further. Additionally, we aim to refine code feature representations and investigate the application of CMVAE in programming education to enhance automated assessments of students’ code strategies.
Author Contributions
Conceptualization, Z.T. and L.C.; methodology, Z.T. and L.C.; software, Z.T.; validation, Z.T. and S.W.; formal analysis, Z.T.; investigation, Z.T. and S.W.; resources, Z.T.; data curation, Z.T.; writing—original draft preparation, Z.T. and L.C.; writing—review and editing, Z.T. and L.C.; visualization, Z.T.; supervision, L.C.; project administration, L.C. All authors have read and agreed to the published version of the manuscript.
Funding
This research received no external funding.
Institutional Review Board Statement
Not applicable.
Data Availability Statement
Conflicts of Interest
The authors declare no conflicts of interest.
References
- Husain, H.; Wu, H.H.; Gazit, T.; Allamanis, M.; Brockschmidt, M. Codesearchnet challenge: Evaluating the state of semantic code search. arXiv 2019, arXiv:1909.09436. [Google Scholar]
- Kamiya, T.; Kusumoto, S.; Inoue, K. CCFinder: A multilinguistic token-based code clone detection system for large scale source code. IEEE Trans. Softw. Eng. 2002, 28, 654–670. [Google Scholar]
- Allamanis, M.; Peng, H.; Sutton, C. A Convolutional Attention Network for Extreme Summarization of Source Code. In Proceedings of the 33rd International Conference on Machine Learning (ICML), New York, NY, USA, 19–24 June 2016; pp. 2091–2100. [Google Scholar]
- Mou, L.; Li, G.; Zhang, L.; Wang, T.; Jin, Z. Convolutional Neural Networks over Tree Structures for Programming Language Processing. In Proceedings of the 30th AAAI Conference on Artificial Intelligence (AAAI), Phoenix, AZ, USA, 12–17 February 2016; pp. 1287–1293. [Google Scholar]
- Zhang, J.; Wang, X.; Zhang, H.; Sun, H.; Wang, K.; Liu, X. A novel neural source code representation based on abstract syntax tree. In Proceedings of the 2019 IEEE/ACM 41st International Conference on Software Engineering (ICSE), Montreal, QC, Canada, 25–31 May 2019; pp. 783–794. [Google Scholar]
- Alon, U.; Zilberstein, M.; Levy, O.; Yahav, E. Code2vec: Learning Distributed Representations of Code. Proc. ACM Program. Lang. 2019, 3, 1–29. [Google Scholar] [CrossRef]
- Hu, Y.; Zou, D.; Peng, J.; Wu, Y.; Shan, J.; Jin, H. TreeCen: Building tree graph for scalable semantic code clone detection. In Proceedings of the 37th IEEE/ACM International Conference on Automated Software Engineering, Rochester, MI, USA, 10–14 October 2022; pp. 1–12. [Google Scholar]
- Allamanis, M.; Brockschmidt, M.; Khademi, M. Learning to Represent Programs with Graphs. arXiv 2017, arXiv:1711.00740. [Google Scholar]
- Hellendoorn, V.J.; Sutton, C.; Singh, R.; Maniatis, P.; Bieber, D. Global Relational Models of Source Code. In Proceedings of the International Conference on Learning Representations (ICLR 2020), Addis Ababa, Ethiopia, 26–30 April 2020. [Google Scholar]
- Zhang, K.; Wang, W.; Zhang, H.; Li, G.; Jin, Z. Learning to Represent Programs with Heterogeneous Graphs. In Proceedings of the 30th IEEE/ACM International Conference on Program Comprehension, Pittsburgh, PA, USA, 16–17 May 2022; pp. 378–389. [Google Scholar]
- Vaswani, A.; Shazeer, N.; Parmar, N.; Uszkoreit, J.; Jones, L.; Gomez, A.N.; Kaiser, Ł.; Polosukhin, I. Attention is All you Need. In Proceedings of the 31st International Conference on Neural Information Processing Systems, Long Beach, CA, USA, 4–9 December 2017; pp. 6000–6010. [Google Scholar]
- Feng, Z.; Guo, D.; Tang, D.; Duan, N.; Feng, X.; Gong, M.; Shou, L.; Qin, B.; Liu, T.; Jiang, D. Codebert: A pre-trained model for programming and natural languages. In Findings of the Association for Computational Linguistics: EMNLP 2020; Association for Computational Linguistics: Kerrville, TX, USA, 2020; pp. 1536–1547. [Google Scholar]
- Liu, Z.; Lin, W.; Shi, Y.; Zhao, J. A robustly optimized BERT pre-training approach with post-training. In Proceedings of the China National Conference on Chinese Computational Linguistics, Hohhot, China, 13–15 August 2021; Springer International Publishing: Cham, Switzerland, 2021; pp. 471–484. [Google Scholar]
- Guo, D.; Ren, S.; Lu, S.; Feng, Z.; Tang, D.; Liu, S.; Zhou, L.; Duan, N.; Svyatkovskiy, A.; Fu, S.; et al. GraphCodeBERT: Pre-training Code Representations with Data Flow. In Proceedings of the International Conference on Learning Representations (ICLR 2021), Virtual Event, 3–7 May 2021. [Google Scholar]
- Jiang, X.; Zheng, Z.; Lyu, C.; Li, L.; Lyu, L. TreeBERT: A Tree-Based Pre-Trained Model for Programming Language. In Proceedings of the Thirty-Seventh Conference on Uncertainty in Artificial Intelligence (UAI 2021), PMLR, Online, 27–30 July 2021; pp. 54–63. [Google Scholar]
- Tipirneni, S.; Zhu, M.; Reddy, C.K. StructCoder: Structure-Aware Transformer for Code Generation. ACM Trans. Knowl. Discov. Data 2024, 18, 1–20. [Google Scholar] [CrossRef]
- MacQueen, J. Some methods for classification and analysis of multivariate observations. In Proceedings of the 5th Berkeley Symposium on Mathematical Statistics and Probability; University of California Press: Berkeley, CA, USA, 1967; pp. 281–297. [Google Scholar]
- Ng, A.; Jordan, M.; Weiss, Y. On spectral clustering: Analysis and an algorithm. Adv. Neural Inf. Process. Syst. 2001, 14, 849–856. [Google Scholar]
- Cheng, Y. Mean shift, mode seeking, and clustering. IEEE Trans. Pattern Anal. Mach. Intell. 1995, 17, 790–799. [Google Scholar] [CrossRef]
- Bengio, Y.; Courville, A.; Vincent, P. Representation learning: A review and new perspectives. IEEE Trans. Pattern Anal. Mach. Intell. 2013, 35, 1798–1828. [Google Scholar] [PubMed]
- Xie, J.; Girshick, R.; Farhadi, A. Unsupervised deep embedding for clustering analysis. In Proceedings of the 33rd International Conference on Machine Learning (ICML), New York, NY, USA, 19–24 June 2016; pp. 478–487. [Google Scholar]
- Guo, X.; Gao, L.; Liu, X.; Yin, J. Improved deep embedded clustering with local structure preservation. In Proceedings of the Twenty-Sixth International Joint Conference on Artificial Intelligence (IJCAI-17), Melbourne, Australia, 19–25 August 2017; pp. 1753–1759. [Google Scholar]
- Fu, Y.; Osei-Owusu, J.; Astorga, A.; Zhao, Z.N.; Zhang, W.; Xie, T. PaCon: A symbolic analysis approach for tactic-oriented clustering of programming submissions. In Proceedings of the 2021 ACM SIGPLAN International Symposium on SPLASH-E, Chicago, IL, USA, 20 October 2021; pp. 32–42. [Google Scholar]
- Glassman, E.L.; Scott, J.; Singh, R.; Guo, P.J.; Miller, R.C. OverCode: Visualizing variation in student solutions to programming problems at scale. ACM Trans. Comput.-Hum. Interact. 2015, 22, 1–35. [Google Scholar]
- Gulwani, S.; Radiček, I.; Zuleger, F. Automated clustering and program repair for introductory programming assignments. ACM SIGPLAN Not. 2018, 53, 465–480. [Google Scholar] [CrossRef]
- Sharma, S.; Agarwal, P.; Mor, P.; Karkare, A. TipsC: Tips and corrections for programming MOOCs. In Artificial Intelligence in Education: 19th International Conference, AIED 2018, London, UK, 27–30 June 2018, Proceedings, Part II; Springer International Publishing: Cham, Switzerland, 2018; pp. 322–326. [Google Scholar]
- Perry, D.M.; Kim, D.; Samanta, R.; Zhang, X. SemCluster: Clustering of imperative programming assignments based on quantitative semantic features. In Proceedings of the 40th ACM SIGPLAN Conference on Programming Language Design and Implementation, Phoenix, AZ, USA, 22–26 June 2019; ACM: New York, NY, USA, 2019; pp. 860–873. [Google Scholar]
- Marchiori, M.; Latora, V. Harmony in the small-world. Phys. A Stat. Mech. Its Appl. 2000, 285, 539–546. [Google Scholar] [CrossRef]
- Alvarez-Socorro, A.J.; Herrera-Almarza, G.C.; González-Díaz, L.A. Eigencentrality based on dissimilarity measures reveals central nodes in complex networks. Sci. Rep. 2015, 5, 17095. [Google Scholar]
- Bellon, S.; Koschke, R.; Antoniol, G.; Krinke, J.; Merlo, E. Comparison and evaluation of clone detection tools. IEEE Trans. Softw. Eng. 2007, 33, 577–591. [Google Scholar]
- Freeman, L.C. A set of measures of centrality based on betweenness. Sociometry 1977, 40, 35–41. [Google Scholar] [CrossRef]
- Freeman, L.C. Centrality in social networks: Conceptual clarification. In Social Network: Critical Concepts in Sociology; Routledge: London, UK, 2002; Volume 1, pp. 238–263. [Google Scholar]
- Katz, L. A new status index derived from sociometric analysis. Psychometrika 1953, 18, 39–43. [Google Scholar]
- Watts, D.J.; Strogatz, S.H. Collective dynamics of ‘small-world’ networks. Nature 1998, 393, 440–442. [Google Scholar] [PubMed]
| Disclaimer/Publisher’s Note: The statements, opinions and data contained in all publications are solely those of the individual author(s) and contributor(s) and not of MDPI and/or the editor(s). MDPI and/or the editor(s) disclaim responsibility for any injury to people or property resulting from any ideas, methods, instructions or products referred to in the content. |
© 2025 by the authors. Licensee MDPI, Basel, Switzerland. This article is an open access article distributed under the terms and conditions of the Creative Commons Attribution (CC BY) license (https://creativecommons.org/licenses/by/4.0/).


