1. Introduction
With the predicted growth in e-commerce [
1,
2,
3] and the increasing demand for efficient and sustainable logistics processes, delivery robots are expected to play a pivotal role in the future of supply chain management [
4,
5,
6]. Consequently, a significant increase in the number of mobile robots handling package deliveries, both inside and outside buildings, should be expected [
7,
8]. This trend extends to multi-story residential and office buildings, where packages must be transported indoors from central receiving areas to their final destinations.
Leveraging an operational indoor robot for environmental monitoring offers significant advantages due to its ability to collect spatially and temporally dispersed data. The ability of mobile robots to cover large areas is essential for assessing environmental conditions and detecting potentially hazardous situations [
9,
10]. Unlike stationary sensors, the use of sensors embedded in mobile robots can cover larger areas more efficiently, enabling a more comprehensive evaluation of environmental parameters [
11,
12,
13]. The use of mobile sensors is crucial in applications such as pollution detection and gas source localization, where extensive spatial coverage is required to identify contamination sources accurately [
14,
15,
16,
17,
18,
19,
20]. Furthermore, the importance of real-time data collection in environmental monitoring cannot be overstated.
Embedding advanced sensors in mobile robots designed to develop other primary tasks, such as indoor parcel delivery, enables continuous and reliable environmental data to be obtained, which is essential for timely decision-making in environmental management and emergency response scenarios [
21].
There are several application examples of mobile robots used for environmental monitoring. Jin et al. [
22] evaluated the performance of a ventilation system using a mobile robot equipped with carbon dioxide and volatile organic compound sensors, comparing the results with those obtained from a stationary sensor network. Similarly, Gallego et al. [
23] proposed a method to localize and map carbon monoxide gas concentrations using an unmanned aerial vehicle (UAV) equipped with a specialized sensor array. Other researchers have further advanced this concept by developing UAVs specifically designed for natural gas and methane leak detection in transport pipelines, demonstrating the effectiveness of these vehicles for aerial inspections [
24,
25,
26,
27,
28].
The gas sensors used in such applications are usually tailored to detect single specific chemical compounds and often come with significant drawbacks. In general, they are typically expensive, require complex calibration procedures, and have no application to detect a broad range of gases or complex odors composed of various volatile chemical compounds. In recent years, the development of low-cost gas sensors, such as metal oxide (MOX) semiconductor sensors, has garnered significant attention, particularly for applications in early gas leak detection [
29,
30,
31] as a feasible alternative to traditional gas sensors.
Table 1 compares some relevant factors of the different gas sensing technologies available on the market, including laser-based chromatography, catalytic combustion detectors, electrochemical sensors, photoionization detectors, and MOX gas sensors. Comparatively, the main advantages of MOX gas sensors are their compact size, low power requirements, and low cost, which make this sensing technology suitable for embedded device designs and battery-operated mobile applications [
32]. However, MOX gas sensors also have known limitations such as their limit of detection [
33,
34,
35], lack of selectivity, and cross-sensitivity to environmental factors such as humidity and temperature [
36,
37,
38].
The combination of multiple gas sensors into a single device, commonly referred to as an electronic nose (also known as an eNose), has become a widely adopted approach in various gas detection applications [
53,
54]. For example, Wilson studied the applications of eNose technology for the early detection of plant, animal, and human diseases [
55]. Arroyo et al. [
56] developed an eNose with various MOX sensors types as a small portable device for air quality measurement. The sensor data are analyzed using Principal Component Analysis (PCA) and Partial Least Squares (PLS) to correlate sensor response to different pollutant concentrations. Radi et al. [
57] analyzed the performance of an eNose for synthetic flavor classification using eight different types of low-cost MOX sensors. They also used PCA for the processing and classification of the data to differentiate between two fruit flavors. In the field of gas leakage, Abdullah et al. [
58] developed an Internet of Things device to monitor liquified petroleum gas that could communicate and send warnings through a Wi-Fi network. Attallah also presented a gas leakage detection approach that combines eNose data and thermal imaging using a complex multimodal data processing model [
59].
The main goal of combining multiple sensors in an eNose implementation is to mitigate their selectivity issues through the combination of different sensor readings and data processing techniques [
54,
60]. These devices can be seamlessly integrated into existing robotic platforms, thereby extending their functionality to include environmental monitoring tasks.
1.1. New Contribution
The new contribution of this work is the integration of background environmental monitoring capabilities into an indoor mobile delivery robot. Compared with that described in [
53,
54,
55,
56,
57,
58,
59], the main advantage of our proposal is the economic savings that come with being able to combine transport and environmental monitoring functions into one mobile robot.
Specifically, this work assesses the use of a compact and low-power eNose trained for the early detection of a single gas leak. The eNose used is composed of sixteen single-type, unspecific, and low-cost metal oxide (MOX) gas sensors powered with different target preheating temperatures. The raw gas sensing information provided by this eNose is unspecific and requires prior calibration and training to detect specific gases. However, the non-specificity of this sensing information has the advantage that it can be trained to detect simultaneously different gases and to detect complex odors composed of a mixture of volatile chemical compounds. Experimental application results obtained in real operation conditions confirmed that a mobile delivery robot embedded with a compact eNose can detect ethanol leaks while making a package delivery inside a building.
1.2. Paper Structure
The paper is structured as follows:
Section 2 describes the materials and methods used.
Section 3 describes the procedure used for the calibration and training of the eNose used as an ethanol gas detector.
Section 4 presents the practical results obtained with the mobile robot embedded with the eNose for early gas leak detection during an indoor delivery. Finally,
Section 5,
Section 6 and
Section 7 discuss the results, highlight the limitations of the system, present the conclusions, and outline future research directions.
2. Materials and Methods
The materials and methods used in this paper are a single-type eNose, the LDA classification method, a mobile delivery robot, and the performance metrics used to evaluate the overall correctness of the gas leak detection.
2.1. Electronic Nose (eNose)
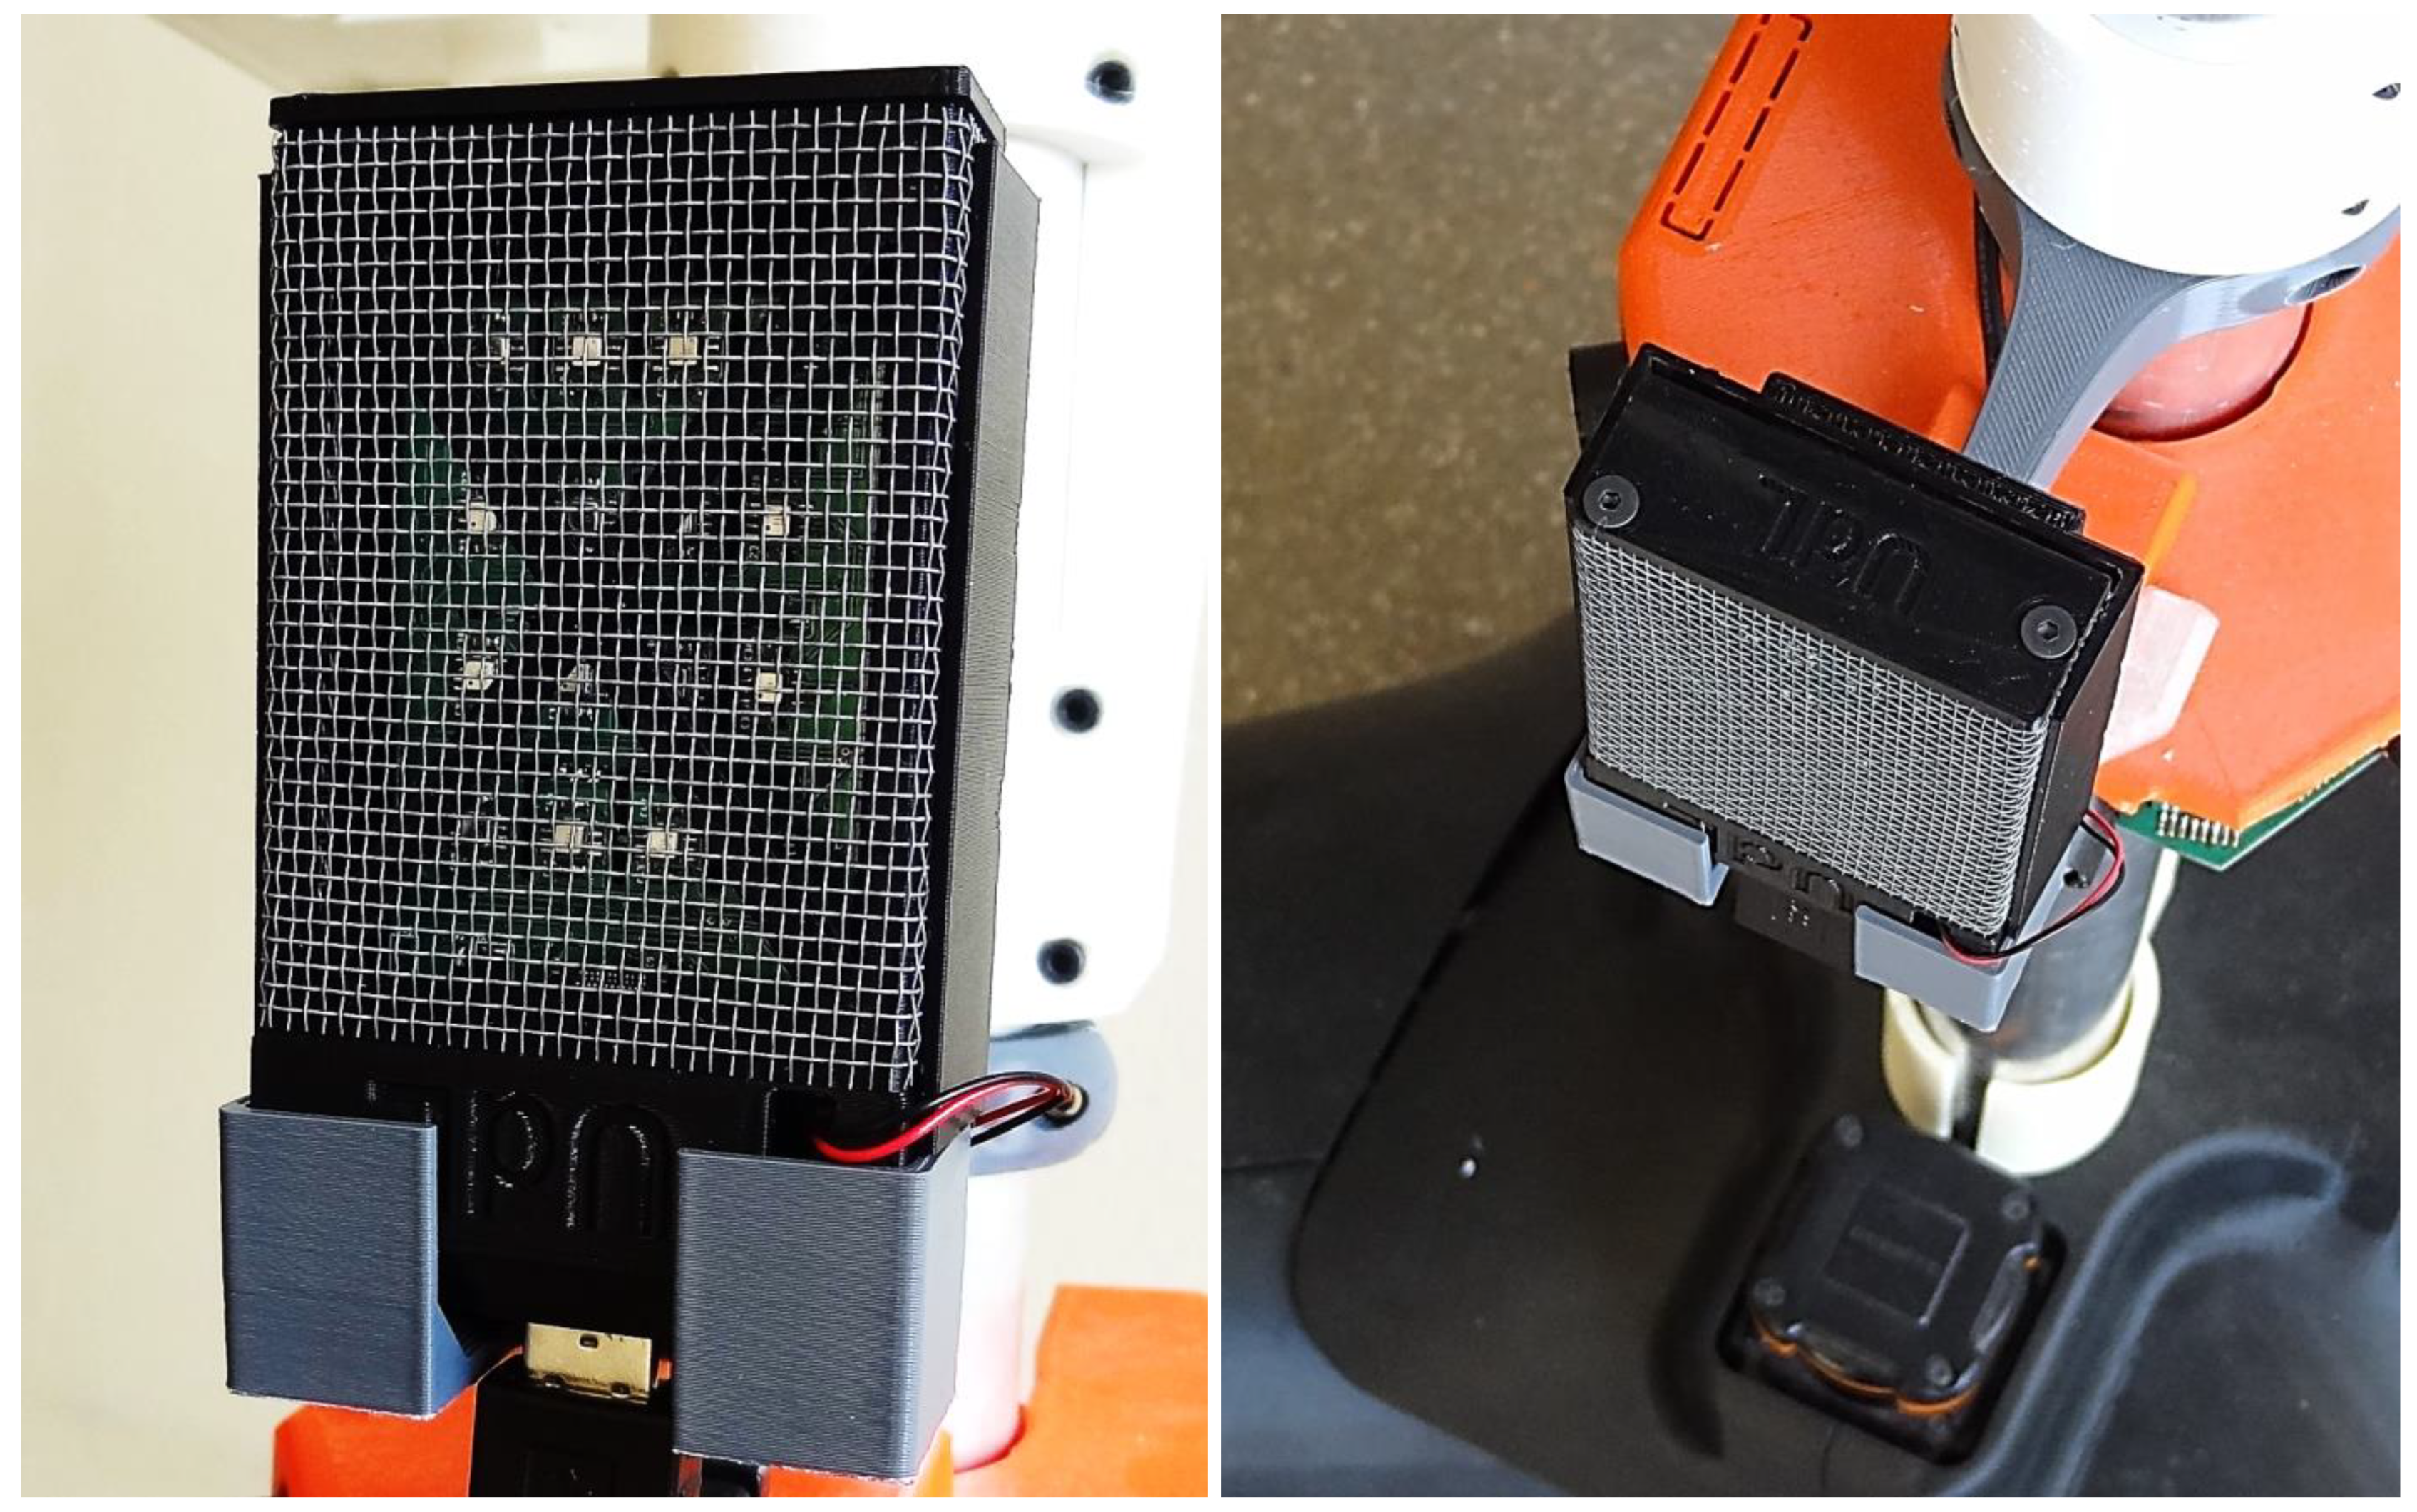
Figure 1 shows the eNose used in this work, a custom compact implementation developed at the Robotics Laboratory of the Universitat de Lleida [
61]. This eNose consists of an array of sixteen BME680 environmental sensors from Bosch Sensortec [
51]. The BME680 is a system-on-a-chip (SoC) device that integrates a temperature sensor, a humidity sensor, a pressure sensor, and a gas sensor. This eNose has been applied to discriminate different gases and odors [
62] but this is the first application operating as a mobile sensing device.
The gas sensor embedded in the BME680 is based on a MOX [
52] resistive layer whose ohmic resistance changes in the presence of various volatile compounds. The sensing deposition layer of the MOX gas sensors embedded in the BME680 has particles of different sizes to sense a wide range of gases. This deposition layer configuration provides poor selectivity, making it difficult to identify a particular volatile compound without additional data processing. Additionally, MOX gas sensors present an inherent variability between sensors in the response curve to various gases. This eNose implementation can overcome these individual limitations by processing the readings of its sixteen gas sensors. Additionally, this eNose implementation applies different configuration parameters to each gas sensor to increase sensor variations and enhance its combined detection performance. A detailed explanation of the eNose design and implementation is provided in [
61].
The eNose (
Figure 1) uses a standard USB-A male connector for the main power and data connection with the main central processing unit of the robot. The eNose power consumption under normal operation conditions is 900 mW [
61] so it can be plugged into any USB 2.0 host device as this specification allows a power output of up to 2.5 W. The device also incorporates a redundant secondary power input that powers the device in case the USB connector is powered off or disconnected. The eNose is automatically activated when it receives power from any of its inputs. In this case, the redundant power is connected directly to the main battery of the robot to keep the eNose activated even when the central processing unit of the robot is switched off.
The BME680 sensor devices used in the eNose are controlled internally through a shared SPI connector. The registers of the BME680 allow the definition of the target preheating temperature used to heat the sensor resistor of the MOX gas sensor. This preheating temperature affects the response curve to the gas mixtures and therefore must be maintained between calibrations. Following the manufacturer’s recommendations, the eNose was powered on, using the auxiliary power supply, at least 24 h before the first experiment to ensure the sensing elements were fully heat soaked and operated in a steady state. In this application, the redundant power of the device is used to keep the eNose active, even when the robot is switched off between the different experiments.
The BME680 gas sensor’s target preheating temperature can be set in a range between 200 °C and 400 °C.
Table 2 contains the target preheating temperatures defined for the sixteen eNose gas sensors. As stated before, the target preheating is different for each sensor to enhance the variability between sensors and create a multi-sensor device.
2.2. LDA Classification Method
The classification method used in this work to classify the data samples provided by the eNose is the Linear Discriminant Analysis (LDA), also referred to as Normal Discriminant Analysis (NDA) or Discriminant Function Analysis (DFA). The LDA is a supervised classification technique based on Fisher’s linear discriminant [
63]. LDA relies on the projection of high-dimensional data (with three or more dimensions) into a lower-dimensional space (typically two or three dimensions) for better class separability.
The projection transformation is determined during the training phase that requires a dataset of labeled samples. The labels identify the samples pertaining to each group or class. LDA calculates a transformation that maximizes the separation between class means while simultaneously minimizing the variance within each class. This ensures that data points from different classes are more distinguishable in the projected space. Once this transformation is learned, it can be applied to classify new, unlabeled samples.
In this paper, the training of the LDA model is performed by the
fitcdiscr function from the Statistics and Machine Learning toolbox from the Matlab software [
64]. This function takes a table of training data and returns a
ClassificationDiscriminant model object. Once the model is trained, new unlabeled samples can be classified using the object’s built-in method
predict [
65].
2.3. Mobile Delivery Robot
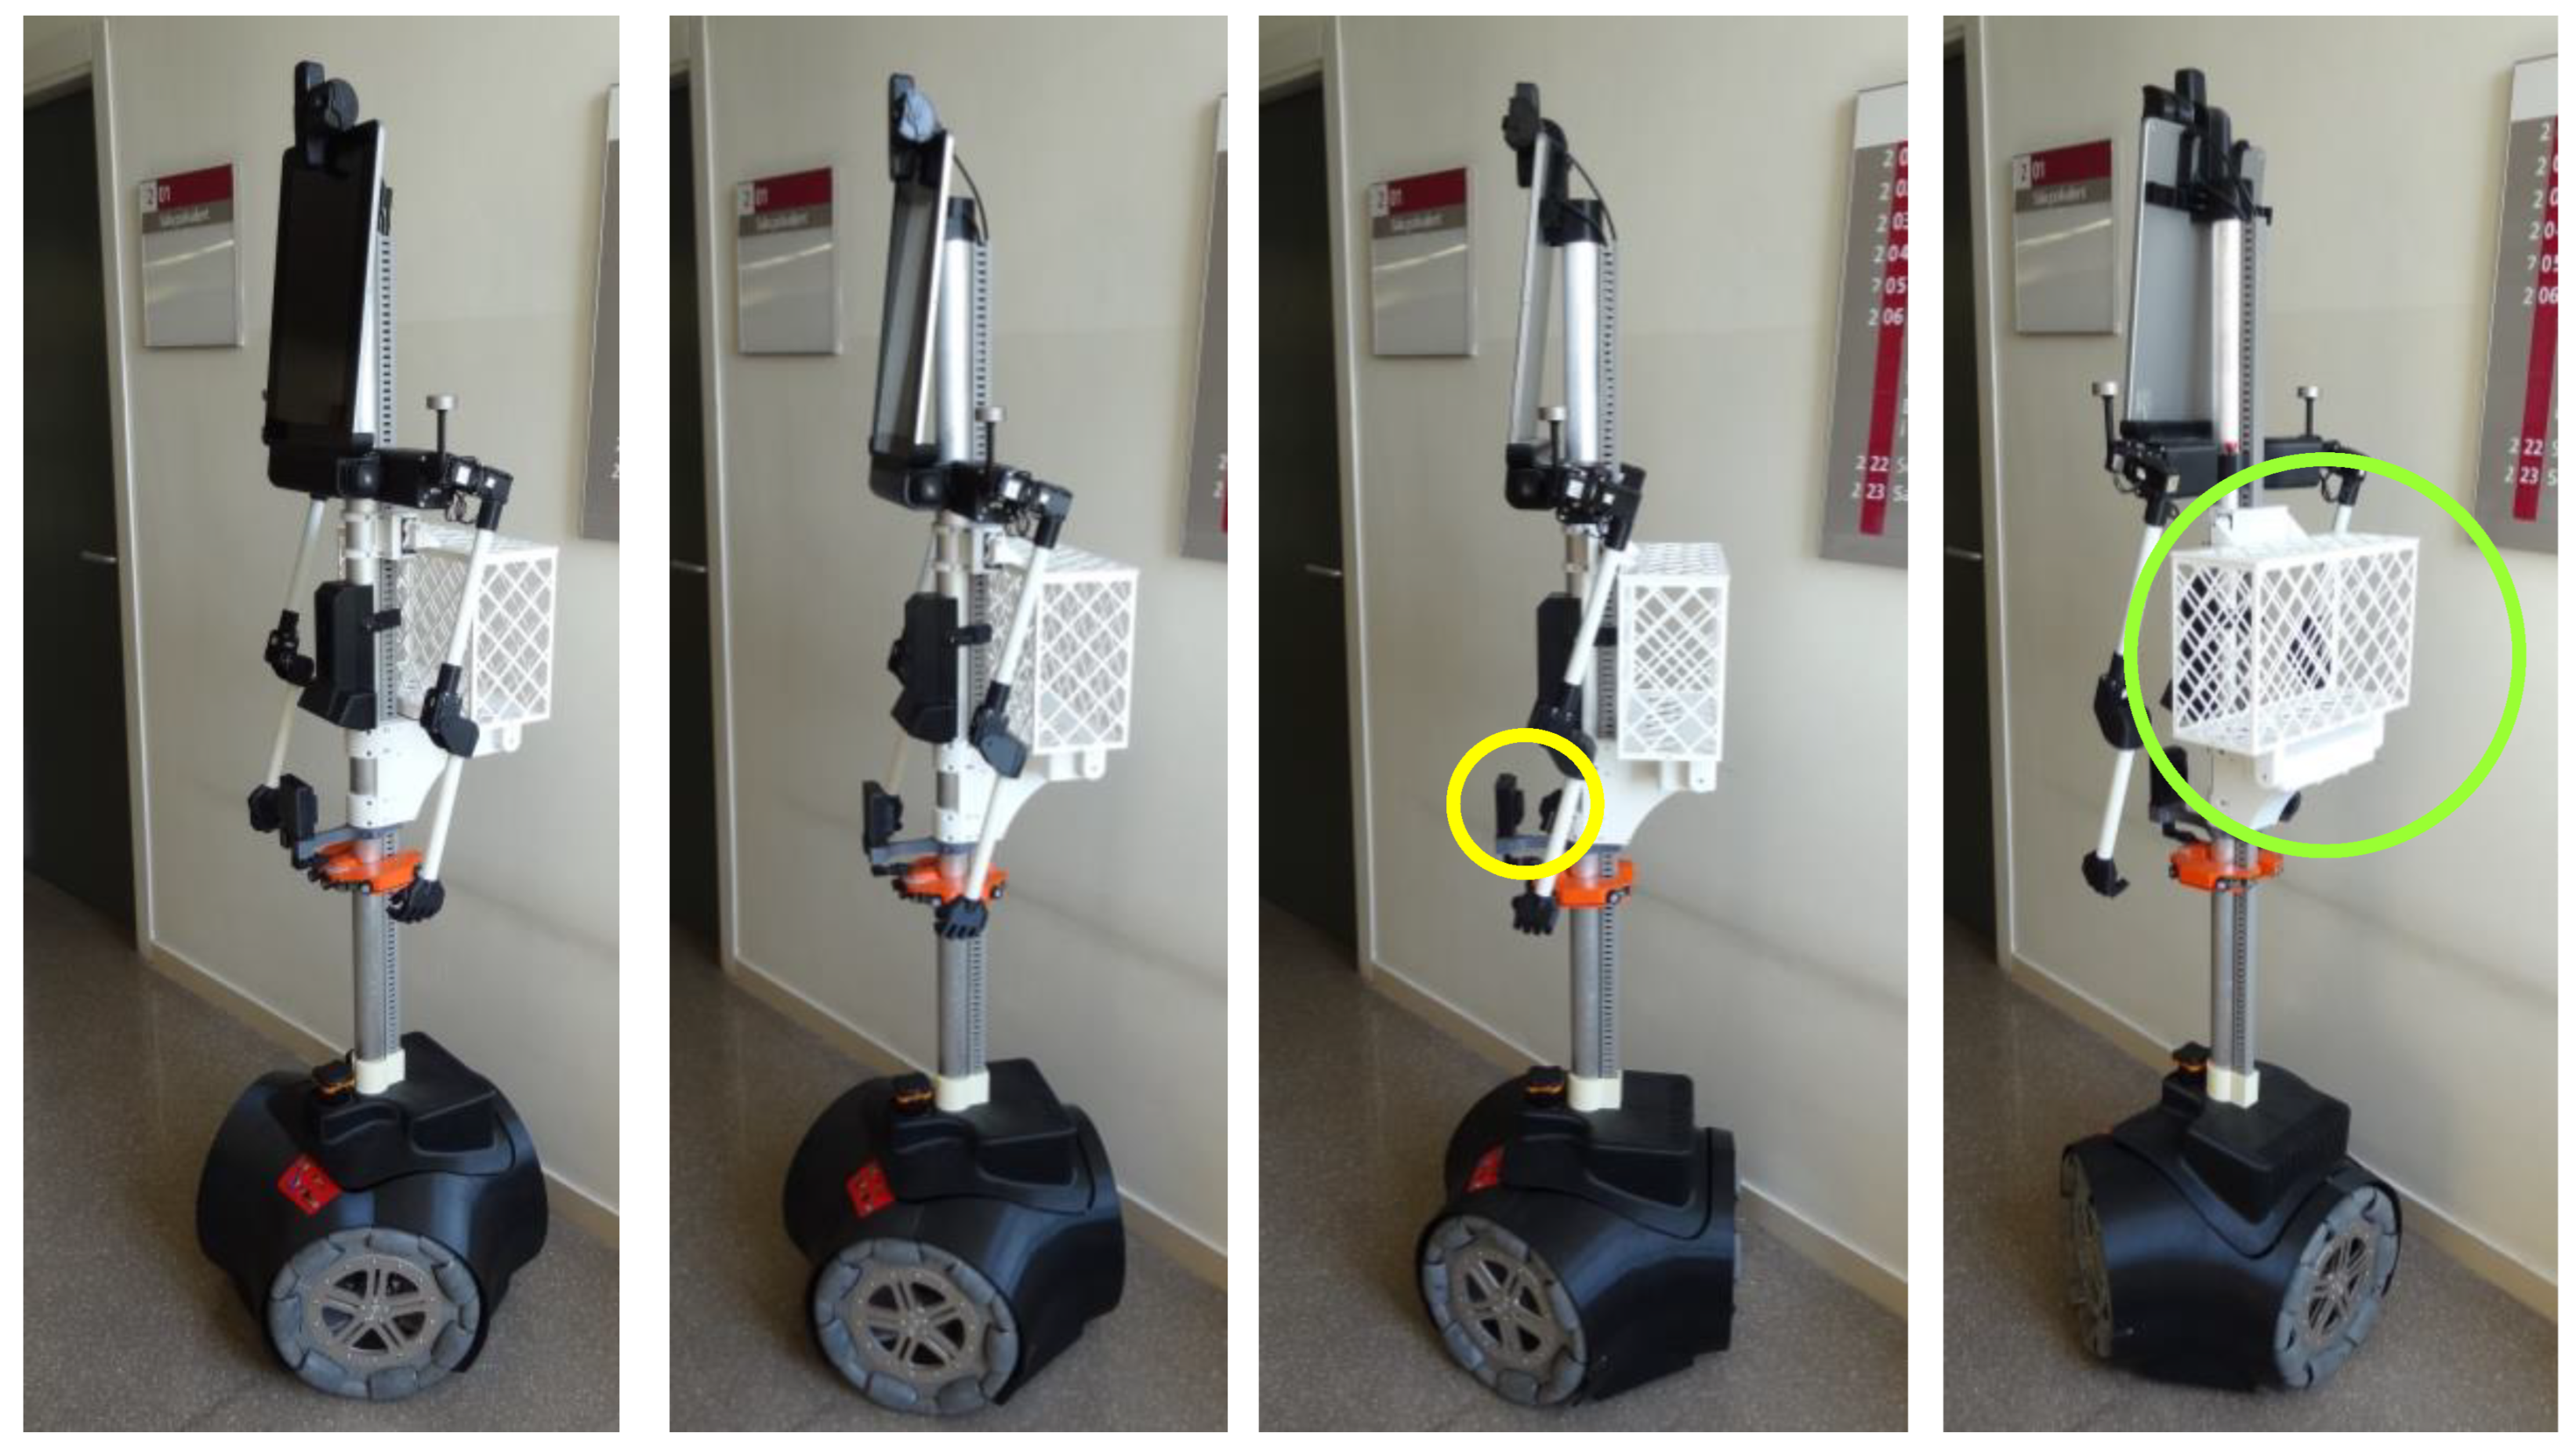
Figure 2 shows the mobile delivery robot used to develop the motion experiments conducted in this work. This robot is an adaptation of the assistant personal robot (APR) robot developed at the Automation and Robotics Laboratory of the Universitat de Lleida [
66]. The APR is a mobile robot platform originally designed to assist humans in a variety of tasks. Its current second version (APR-02) is used as a versatile mobile robot testbench for various research tasks.
The mobile robot uses an omnidirectional motion system based on three omnidirectional wheels with transversal passive rollers. This omnidirectional motion system provides simultaneous translation and rotation, a motion feature that is ideal for performing autonomous navigation in unstructured indoor environments. The main sensor of the robot is a Hokuyo UTM-30XL 2D LiDAR sensor [
67] which provides a horizontal scan of the surrounding environment. The data from the LiDAR scan is processed by an onboard computer which then generates the control commands for the motion system. The robot is also equipped with a tactile screen for user interaction and a pair of figurative arms. In this work, the mobile robot has been enhanced with a transport basket [
68] to automate the delivery of parcels inside a building.
In previous works, this mobile robot was evaluated as an early gas leak detection tool [
32] by using an array of MOX gas sensors but its power consumption and computer requirements did not allow other tasks to be performed simultaneously. In this work, the low-power consumption of the eNose embedded in the robot and the low computer requirements required to detect gas leaks allowed its operation to occur as a background agent that does not affect the normal execution of the main task assigned to the robot.
2.4. Performance Metrics of the Gas Leak Detection
The performance metrics used to evaluate the overall correctness of the gas leak detection are common statistical metrics: accuracy, sensitivity, specificity, precision, and F1-score. These metrics are computed from the number of samples classified as true positives (TP), true negatives (TN), false positives (FP), and false negatives (FN). True positives are defined as the samples correctly classified into a class, true negatives are the samples correctly not classified as a particular class, false positives are the samples misclassified as a given class, and false negatives are the samples misclassified as not a given class. The metrics were computed using the following equations:
4. Results of Early Detection of Ethanol Gas Leaks
This section presents the results of the early detection of an Ethanol gas leak obtained when the mobile robot embedded with the eNose was performing an indoor package delivery.
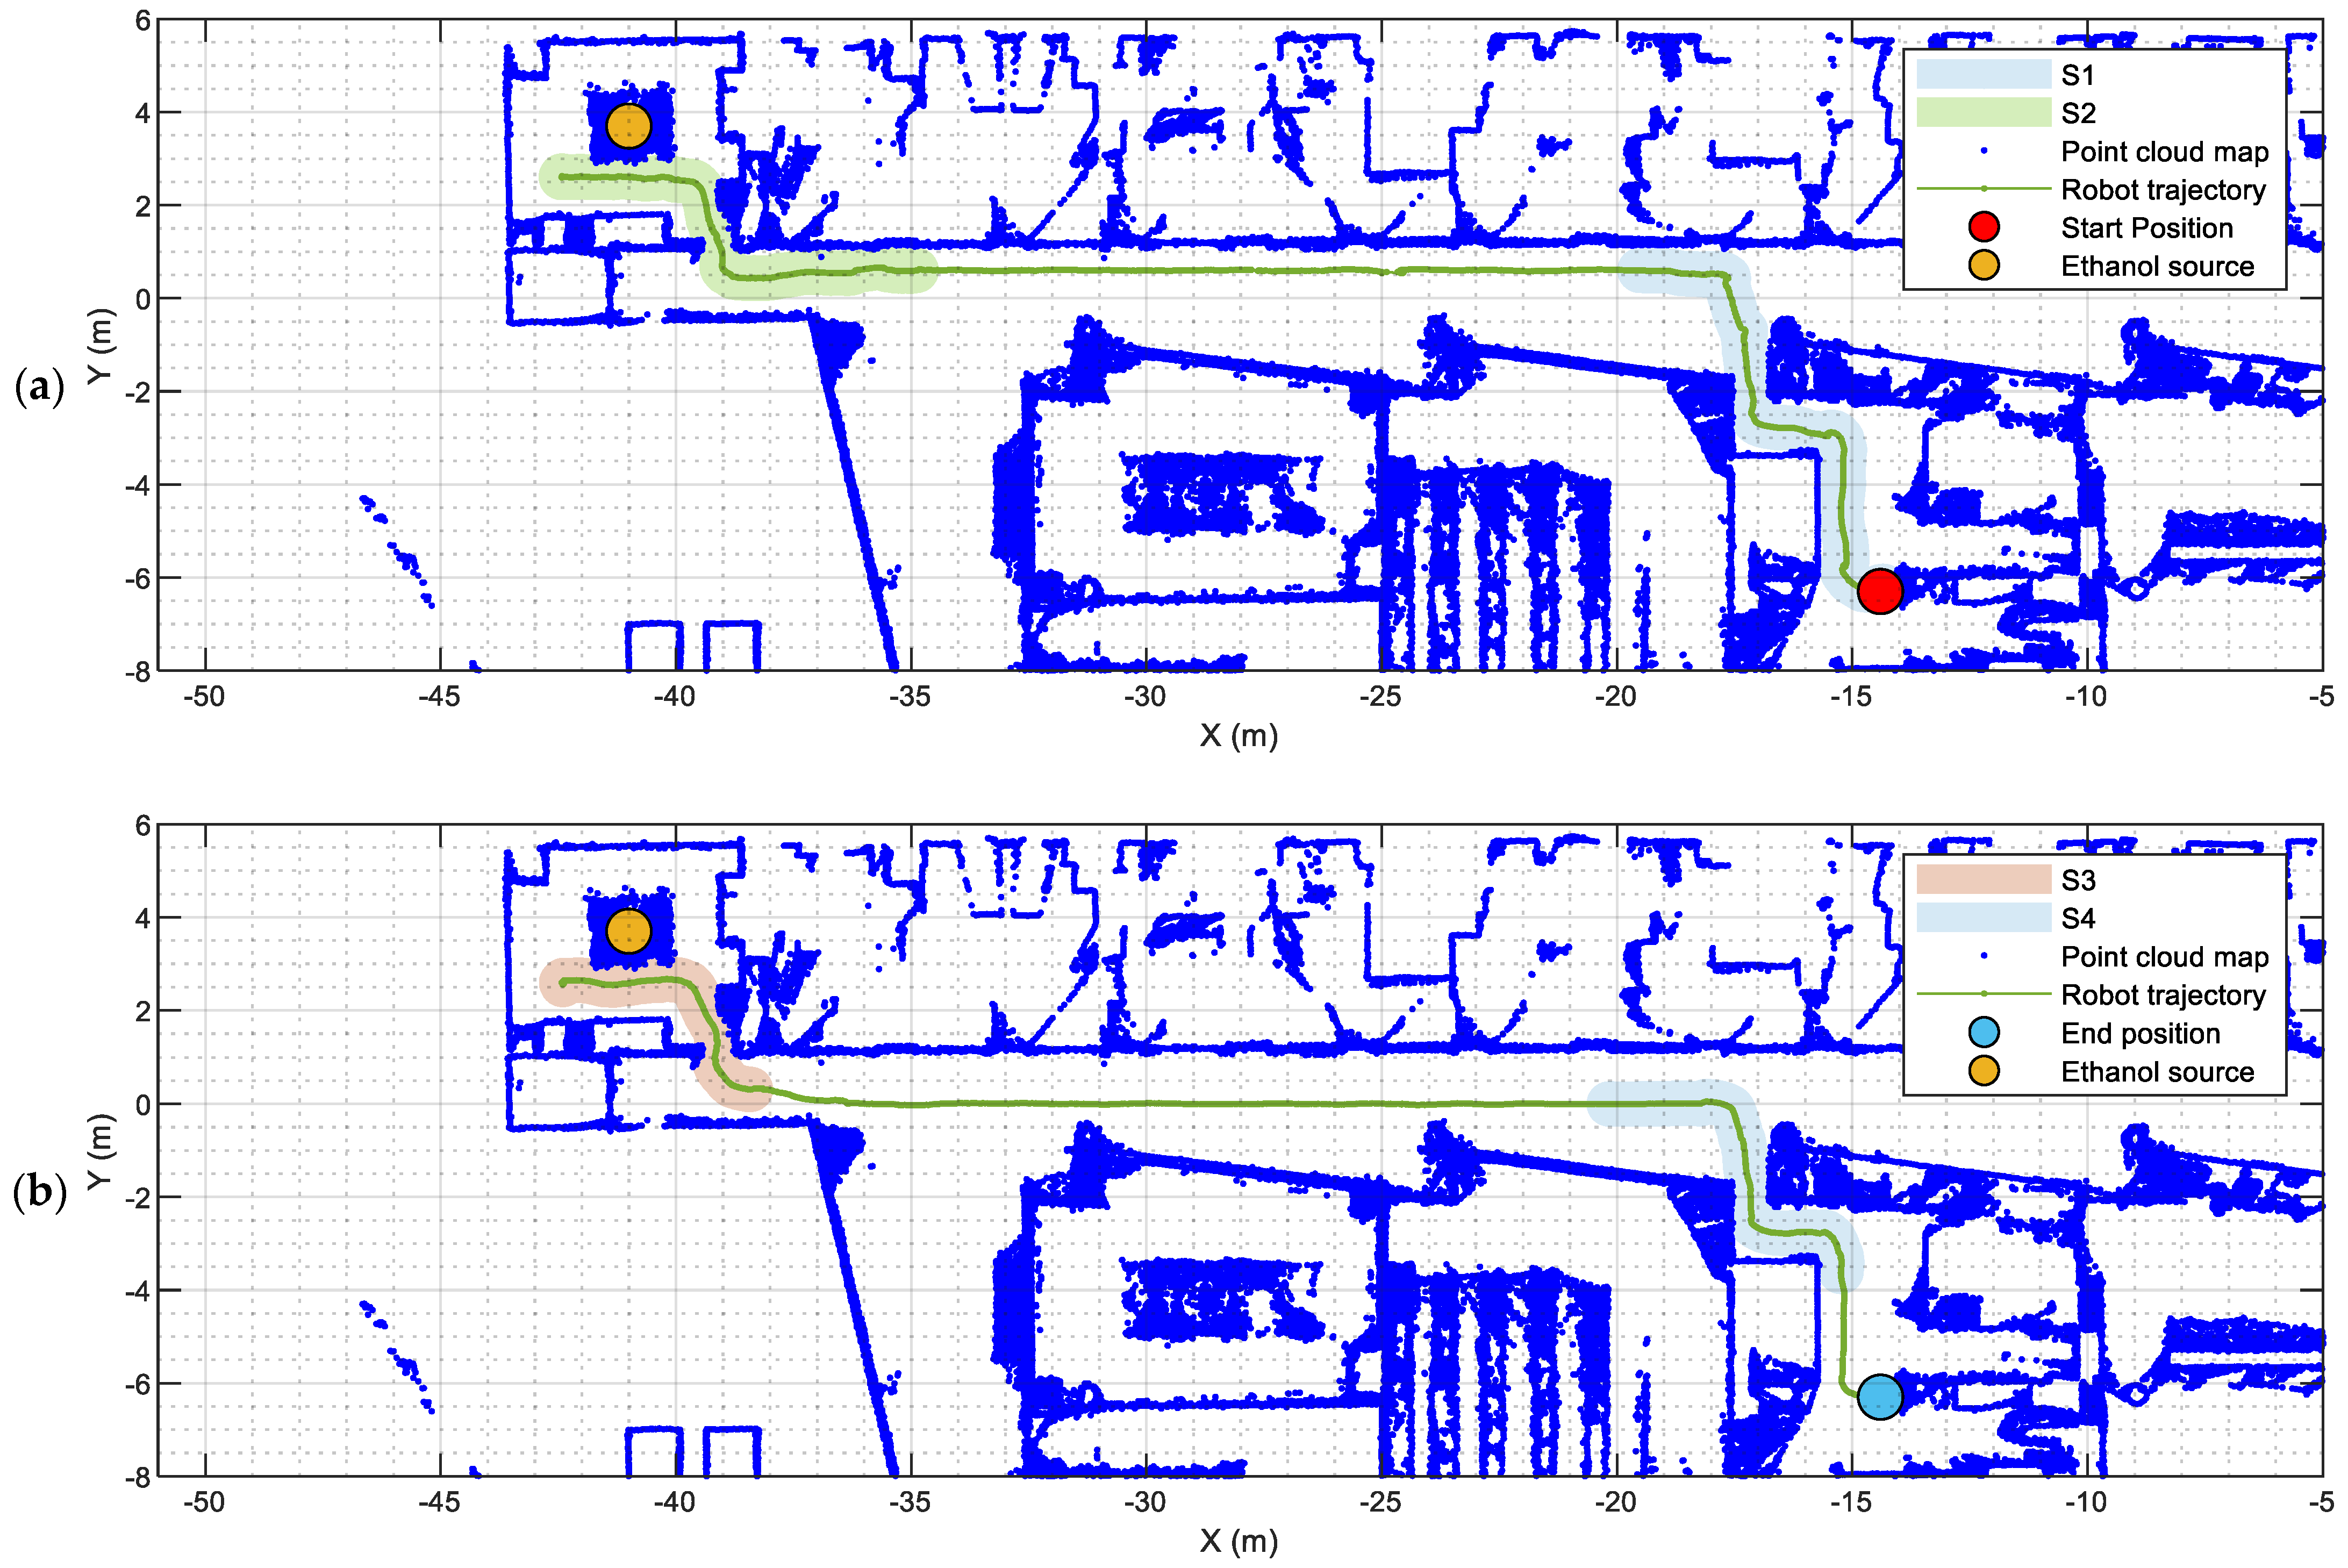
4.1. Trajectory of the Indoor Mobile Delivery Robot
Figure 5 shows the trajectory followed by the delivery robot inside the second floor of the building of the Polytechnic School of the Universitat de Lleida. This trajectory takes place on the second floor of the building and is a consequence of receiving a package at the building’s reception center addressed to one of its laboratories. Then, the indoor mobile delivery robot is called to make the transportation and delivery of the package inside the building. To focus attention on gas leak detection, the following assumptions and simplifications were made:
The floor of the building’s reception area in charge of registering the parcels received from external logistic companies and the floor of the destination of the parcel inside the building were assumed to be the same.
There is only one mobile delivery robot, and its charging station is located inside the Robotics Laboratory.
Once a package is received in the building, the mobile delivery robot is called from the building’s reception area. Then, the robot must plan a path to travel from its charging station to the building’s reception area.
Figure 5a depicts the real trajectory followed by the mobile robot in the building. This trajectory starts at the charging station of the robot, located inside the Robotics Laboratory (
Figure 5a, red dot), and ends at the building’s reception area where the robot waits for the package to be loaded inside its transportation basket.
The package received in the building is addressed to the Robotics Laboratory which is also where the robot’s charging station is located.
Once the package destination is entered into the intralogistics system, the robot must plan a path to travel from the building’s reception area to the delivery destination.
Figure 5b depicts the real trajectory followed by the mobile robot in the building. This trajectory starts at the building’s reception area and ends at the Robotics Laboratory (
Figure 5b, blue dot) where the robot can automatically unload the package [
68].
If no other delivery calls are received, the indoor mobile robot returns to its charging station which is located inside the Robotics Laboratory.
The evaluation of the indoor delivery robot for the early detection of an Ethanol gas leak consists of the inclusion of a gas leak in the trajectory of the mobile robot. This gas source is located in the building’s reception area, with the windows closed and the access door open. The location of the gas source is represented in
Figure 5 by a brown dot and the Ethanol was evaporated at a rate of 130 mg/min.
Figure 5 also highlights some regions of the robot’s trajectory: S1 (light blue area) highlights a region in which the robot is exiting from the Robotics Laboratory, S2 (light green area) highlights the region in which the robot is approaching and entering the room with the Ethanol gas leakage, and S3 (light brown area) highlight a region in which the robot is leaving the room with the Ethanol gas leakage.
4.2. Ethanol Gas Leak Detection During an Indoor Parcel Delivery
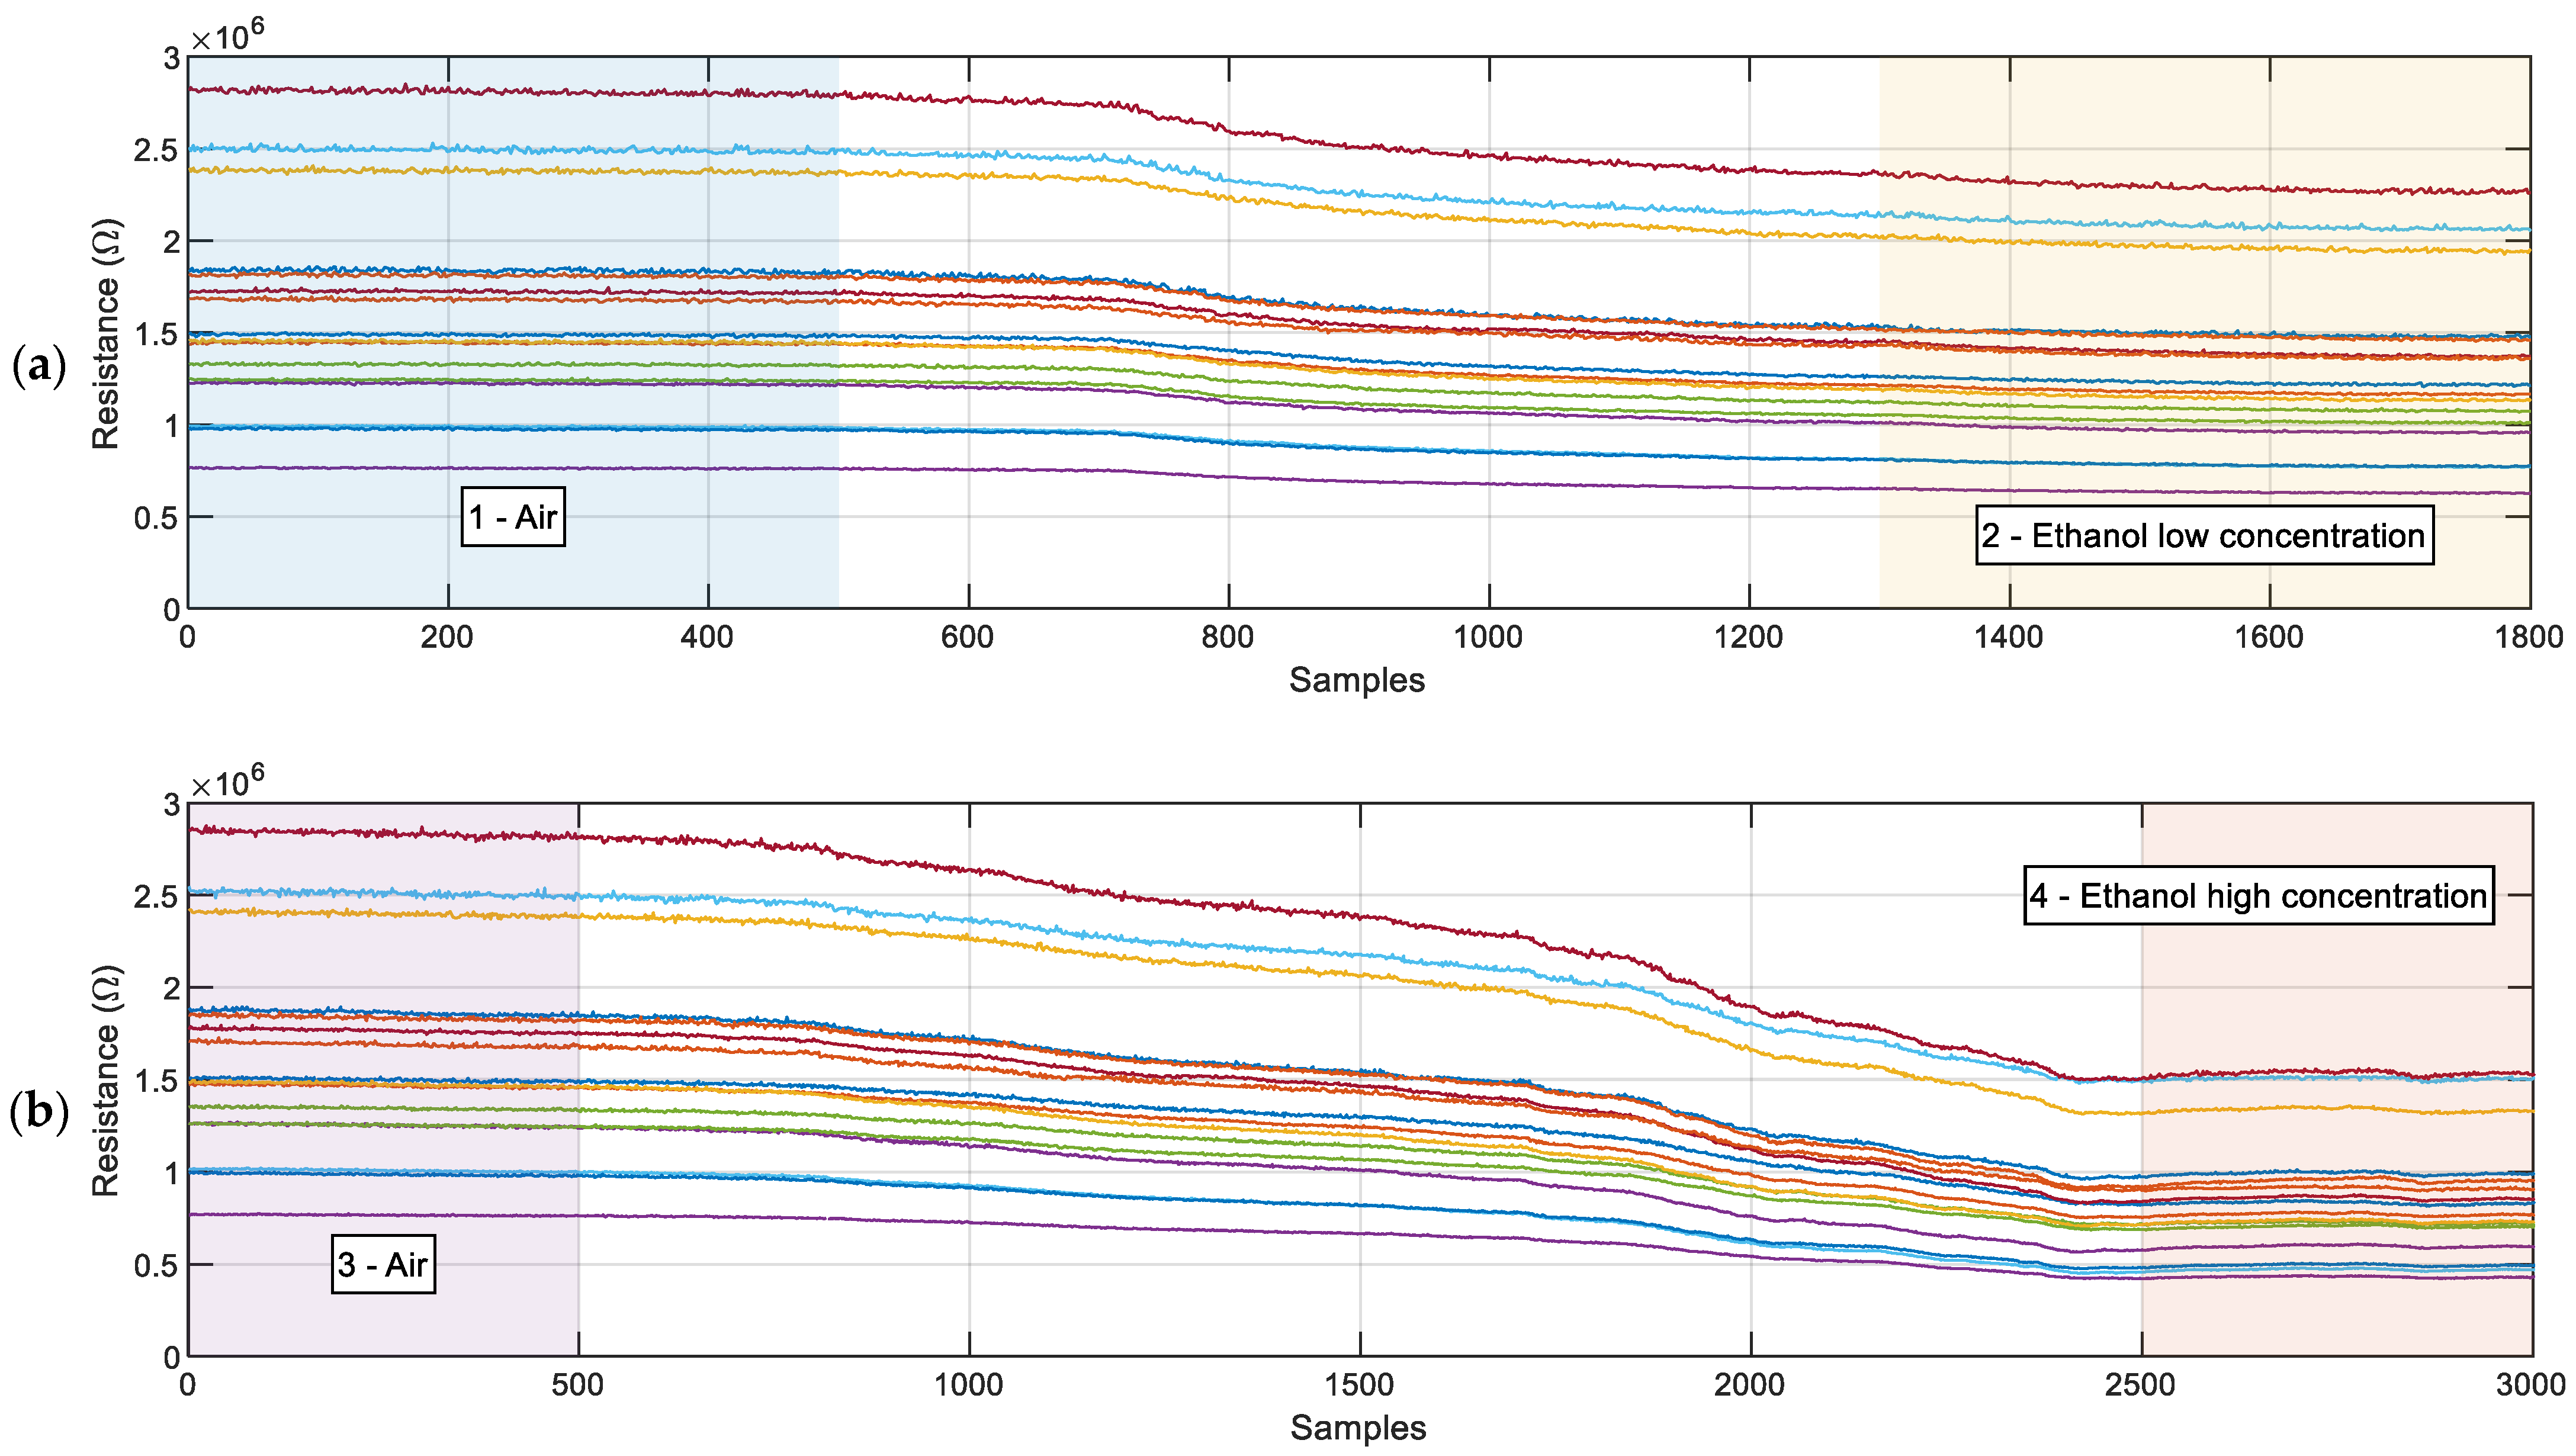
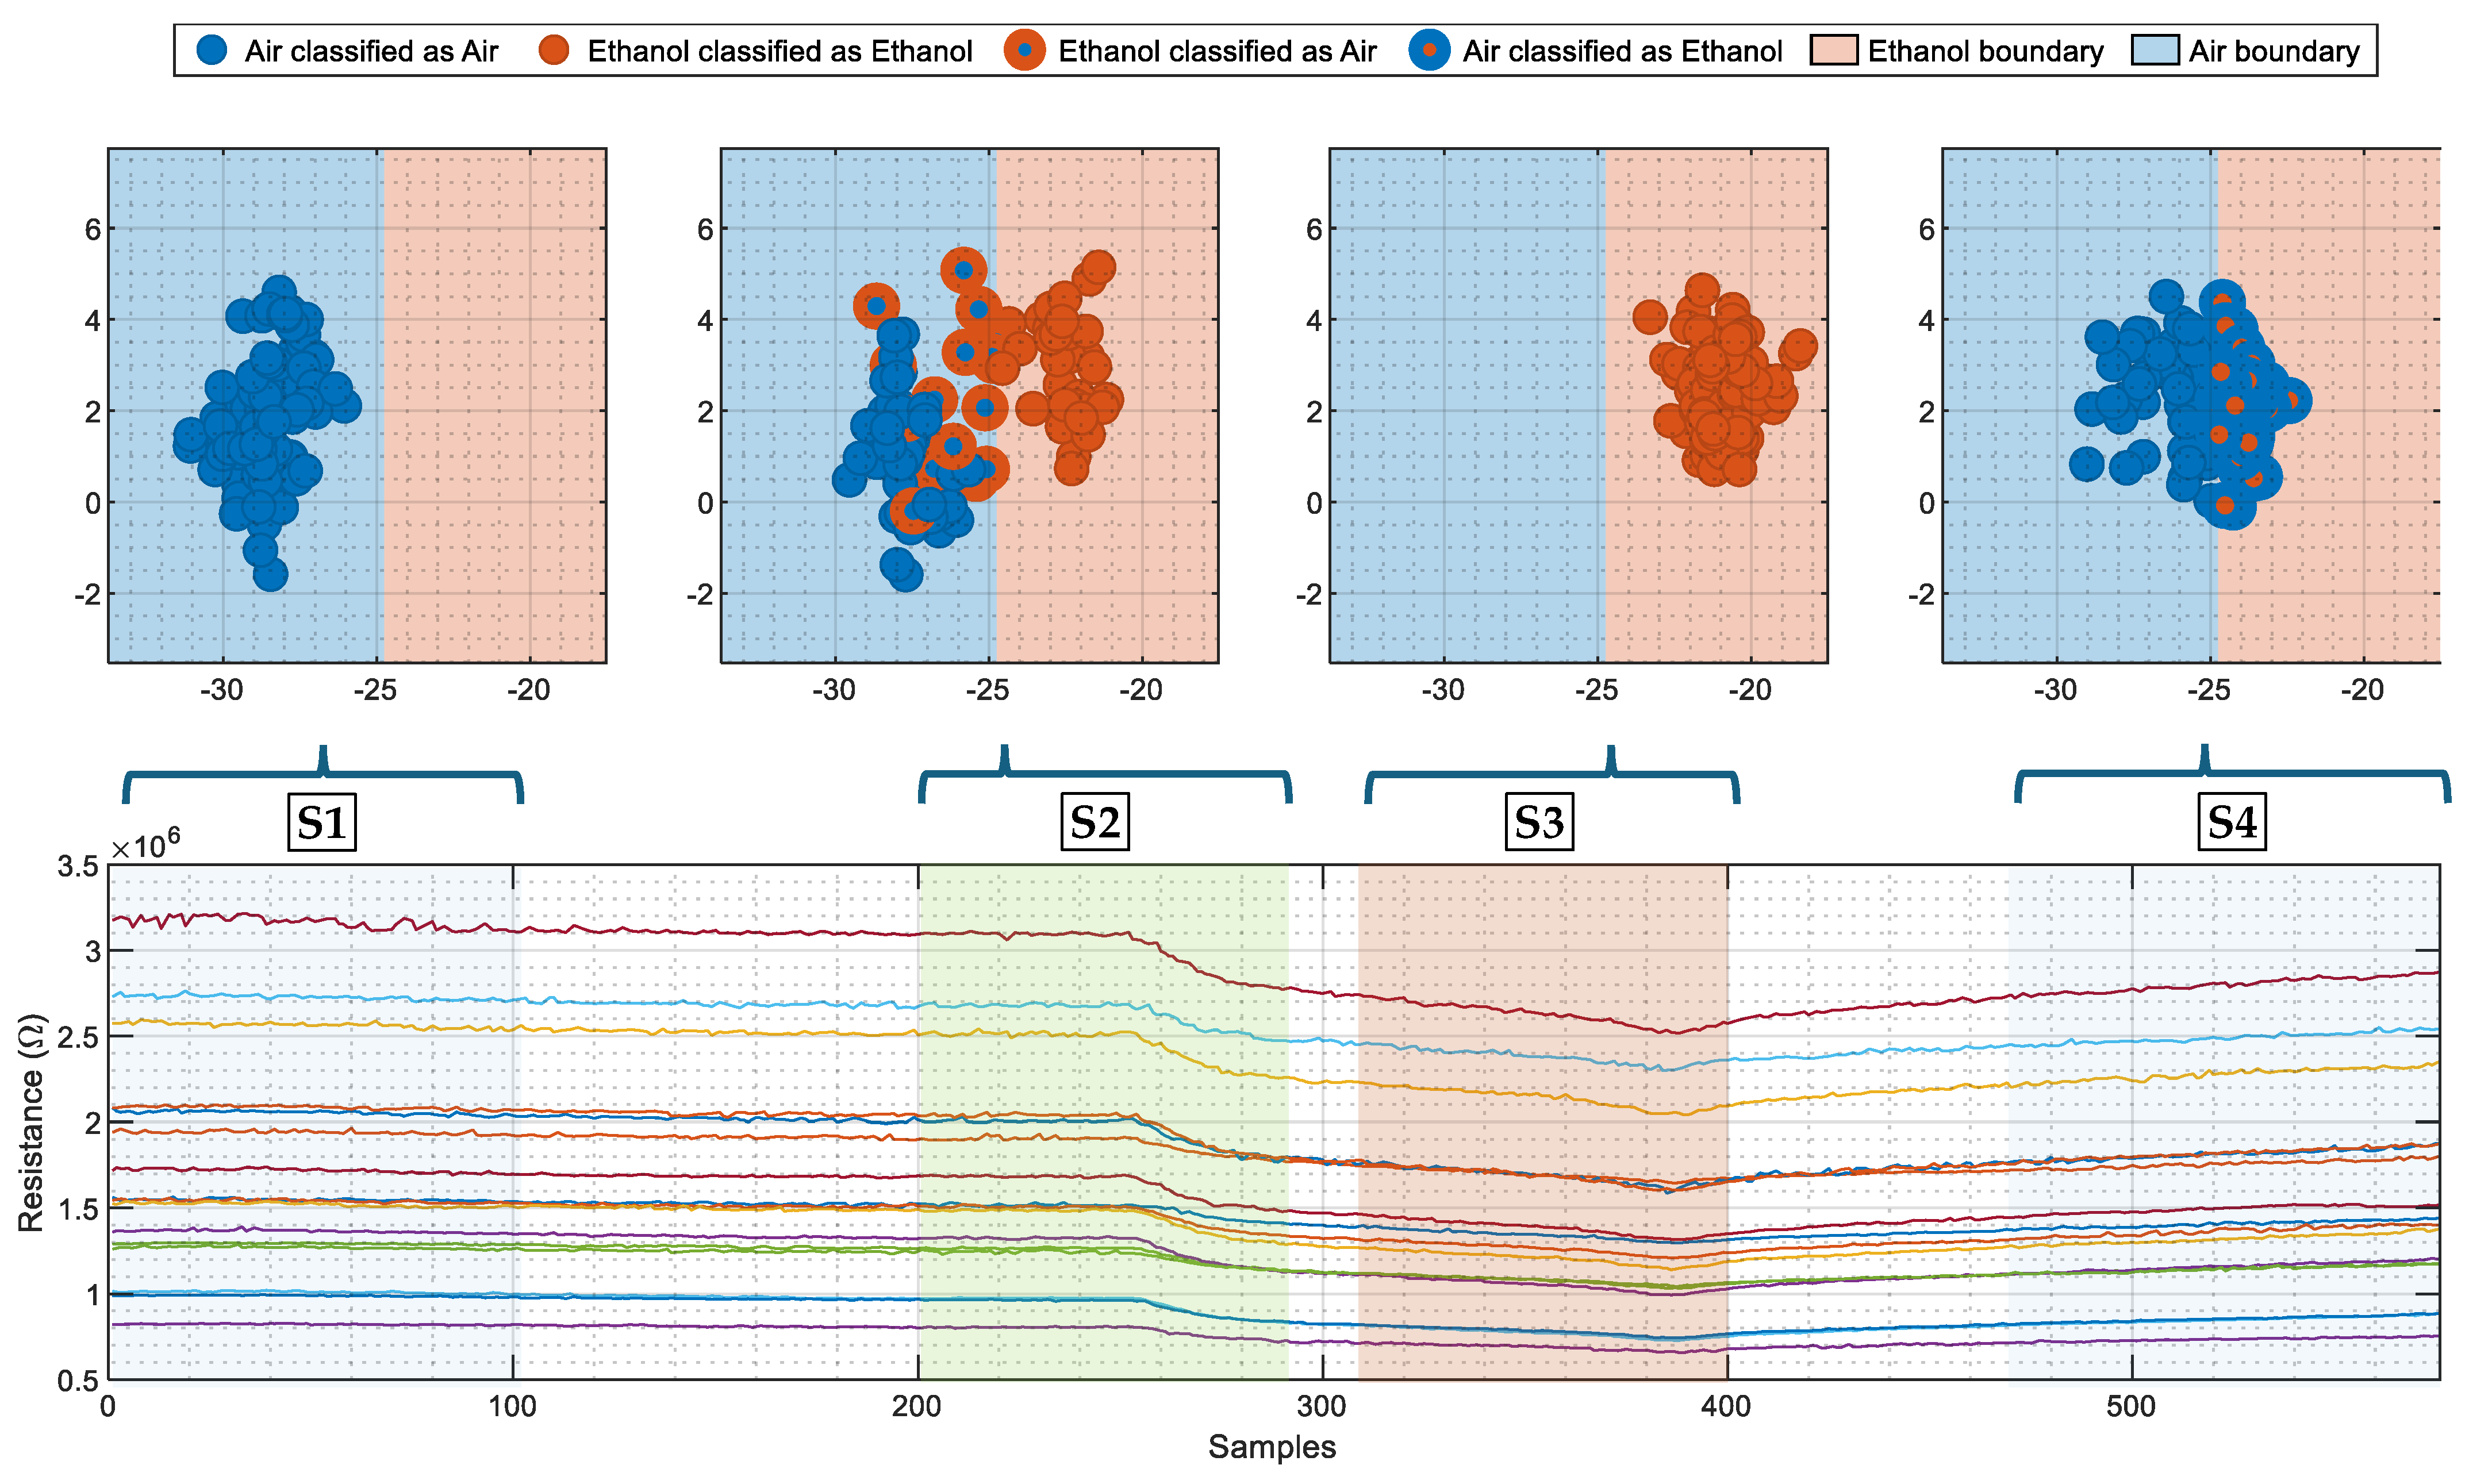
In this work, the information provided by the eNose embedded in the mobile delivery robot was registered at a rate of 0.5 samples/s for online and offline analysis.
Figure 6 presents the evolution of the sensing resistance of the sixteen MOX gas sensors of the eNose during the delivery experiment presented in
Figure 5. Additionally,
Figure 6 highlights the data points gathered by the eNose that are inside Sections S1, S2, and S3 indicated on the mobile robot trajectory shown previously in
Figure 5.
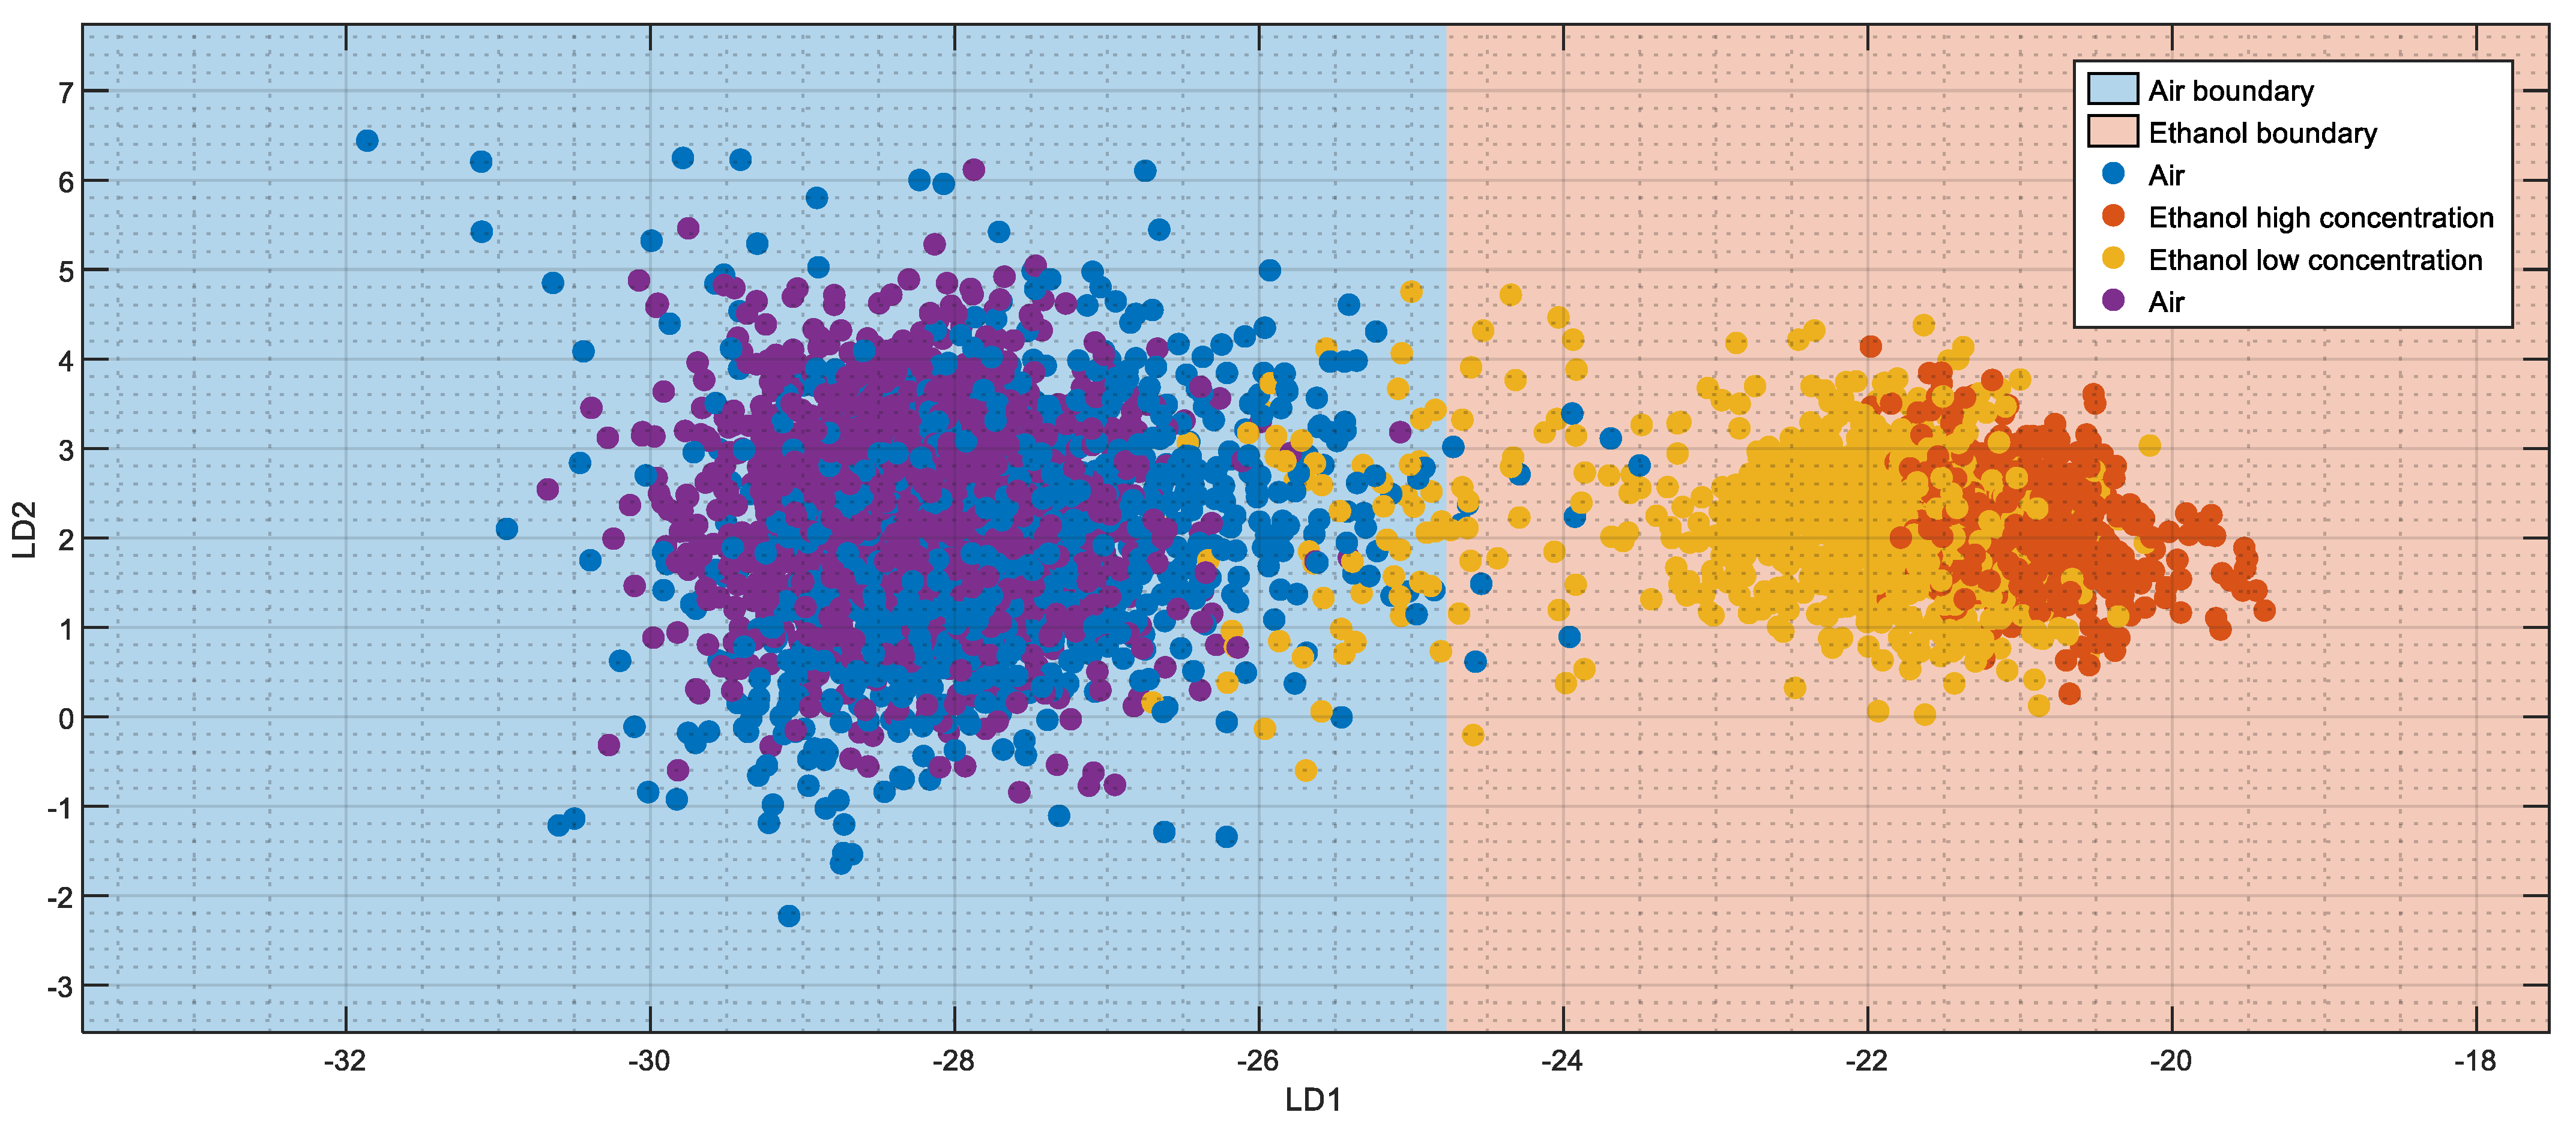
Figure 6 also includes the projection of the data points inside the sections in the LDA space. Since each data point can measure Air or Ethanol and can be classified by the LDA projection either as Air or Ethanol, there are four possible classification outcomes: a sample expected to be Air and correctly classified as Air (blue dot with a blue border), a sample expected to be Air but misclassified as Ethanol (orange dot with a blue border), a sample expected to be Ethanol and correctly classified as Ethanol (orange dot with an orange border), a sample expected to be Ethanol but misclassified as Air (blue dot with an orange border). In summary, the color of the border represents the real class of the sample, and the internal color represents the result of the LDA classification. A closer look at the LDA classification results provides the following remarks.
During subset 1 (S1), at the beginning of the gas measurement experiment, the mobile robot was in a clean Air environment and far from the Ethanol source. In this S1 region, all the samples gathered were projected into the Air region of the LDA projection and successfully classified as Air samples.
Subset 2 (S2) comprises the gas samples collected before entering the room and while inside the room with the Ethanol source. In the S2 region, the samples gathered before entering the room were correctly classified as Air. When the robot entered the room the projection of the gas samples started transitioning to the Ethanol region. During this short period, the result of the LDA classification was Air although it must be Ethanol because the robot was close to the Ethanol source. A few seconds later, when the sensor stabilized, the result of the LDA classification was Ethanol as expected.
Subset 3 (S3) includes the eNose measurements taken inside the room and while exiting the room with the Ethanol gas leak. In this situation, the mobile robot was moving away from the Ethanol source but still all samples were correctly classified as Ethanol.
Finally, subset 4 (S4) contains the resistance values measured while returning to the Robotics Laboratory. At this point, the expectation was to detect Air, but the LDA classification suggested Ethanol for several seconds while the sensors were recovering. After some delay, the classification finally becomes Air.
At this point, it must be noted that the visual interpretation of the projection of the eNose information on the LDA 2D space agrees with the physical interpretation of the results as the misclassifications are always produced in the boundary regions between the Air and Ethanol classes. It is also interesting to highlight that, despite the micro-dimensions of the MOX gas sensor, the response of the eNose still has some inertia.
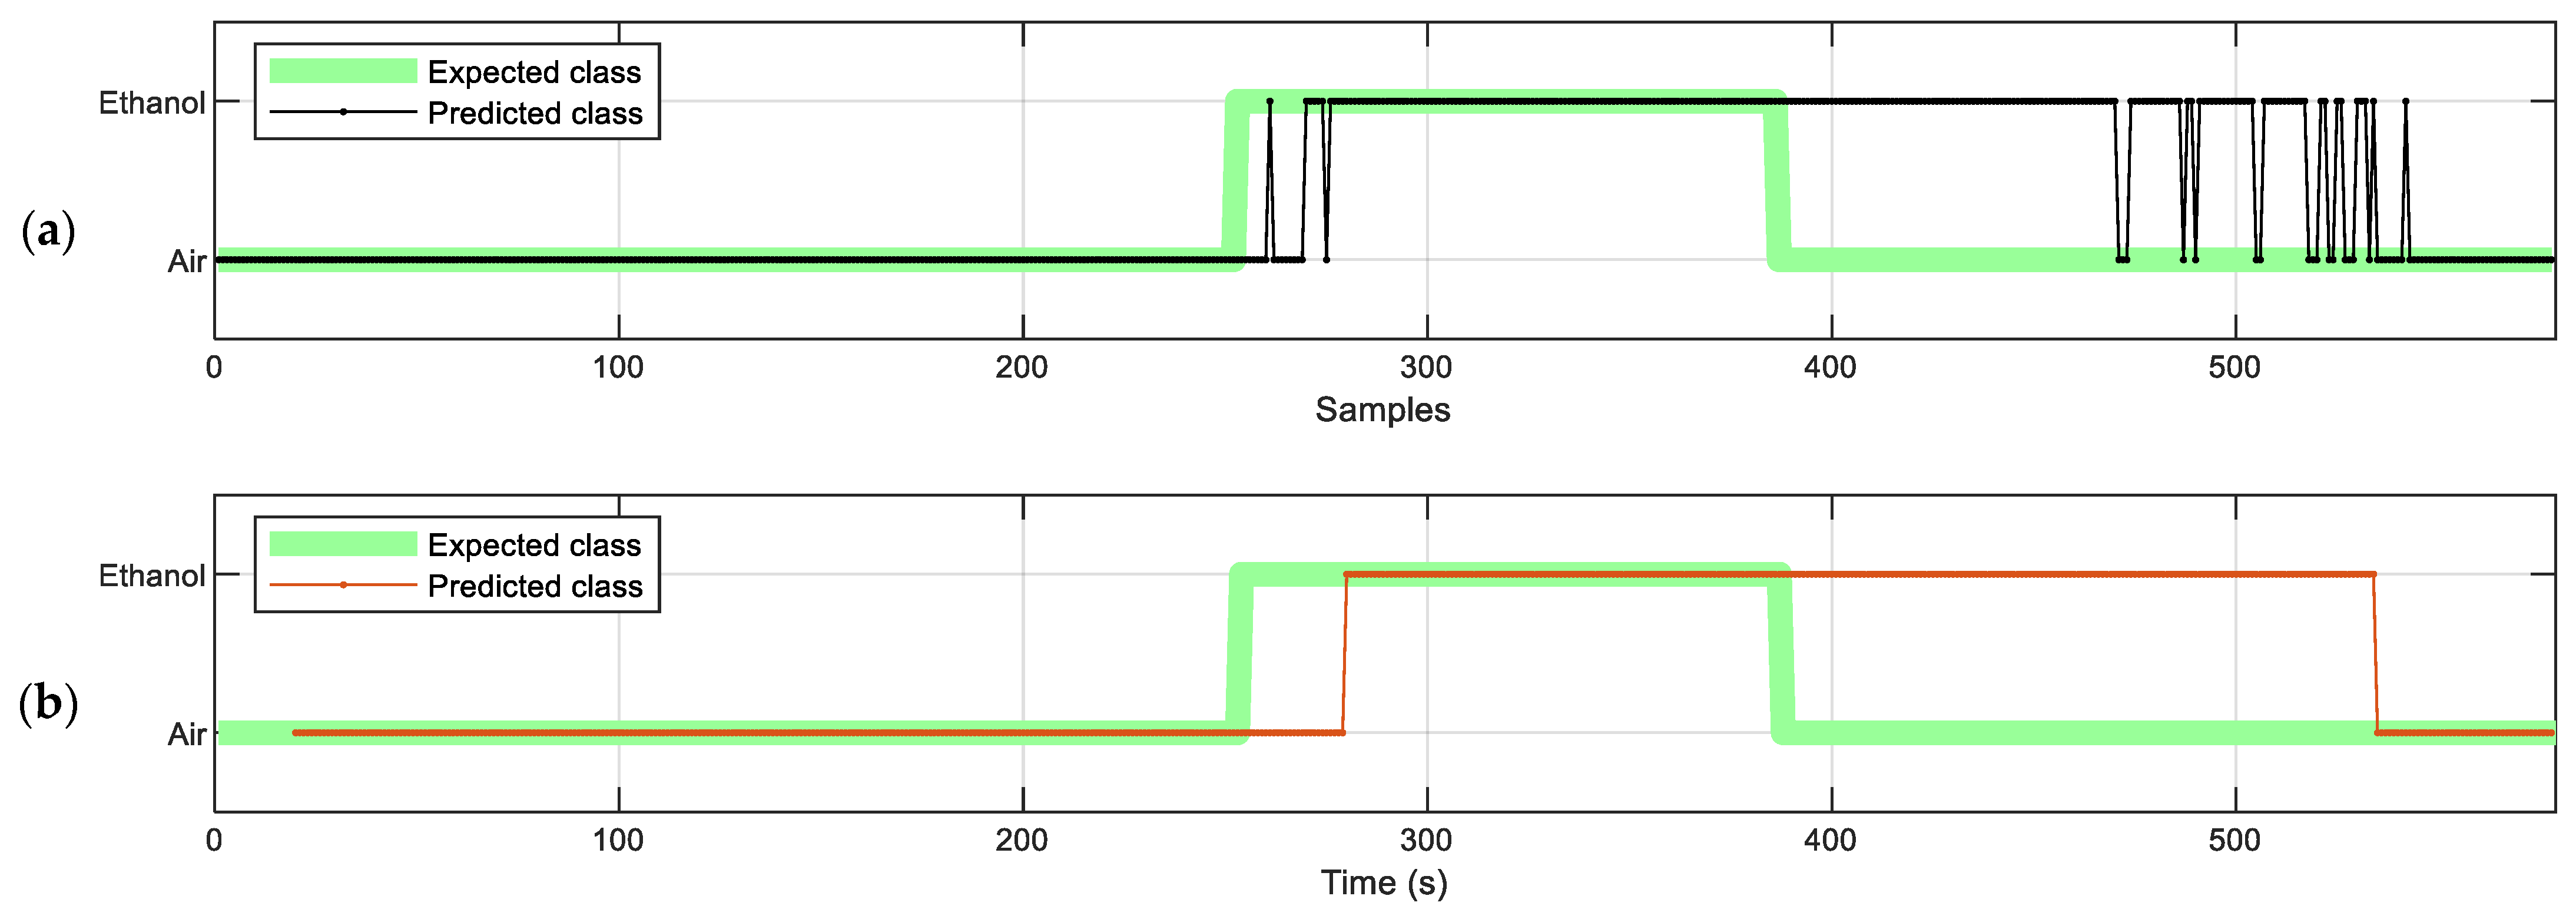
Figure 7 illustrates the raw classification results obtained when applying the pre-trained LDA model to classify all gas samples gathered by the eNose (shown in
Figure 6) during the indoor delivery operation whose trajectory is described in
Figure 5. The bold green line indicates the true or expected class of the gas samples through the experiment and the thin dark and red lines are the output of the early detection of an Ethanol gas leak. The bold green line has been generated manually by considering the possible extent of the Ethanol leak and when it should be detected.
Figure 7 shows two interpretations of the LDA classification.
Figure 7a displays the instantaneous real-time classification of each eNose data sample. As expected, during the transition intervals from Air to Ethanol and vice versa, the output of the LDA classifier oscillates back and forth between the two classes. As stated before, this effect is caused because the eNose data samples are transitioning between Air and Ethanol or vice versa. Alternatively,
Figure 7b displays a windowed interpretation of the instantaneous real-time classification results of the eNose data samples, proposed to filter the LDA classifier results to avoid oscillating classifications. The windowed interpretation shows the most frequent results evaluated in the last N samples gathered from the eNose. The value of N for the eNose used in this work and the mobile robot application performed has been set to 19 samples using a holistic trial and error approach evaluated in different gas leak experiments. The drawback of this filter is that it adds a delay in the Ethanol gas leak detection of around 10 s although this is not a problem in this indoor delivery application as the mobile robot usually stays more than 60 s inside rooms and laboratories where a real gas leak could occur.
4.3. Metrics of the Ethanol Gas Leak Detection
This section displays and discusses the confusion matrix of the classification performed by the LDA classifier and the performance metrics of Ethanol gas leak detection.
Table 3 summarizes the confusion matrix of the classification results displayed in subsets S1, S2, S3, and S4 (described in
Figure 6). In summary, in subset S1, all the samples are correctly classified as Air; in subset S2, all Air samples are correctly classified but during the transition from Air to Ethanol, 34.69% of the samples are misclassified as Air. The misclassification is caused by the response delay explained previously. The accuracy of the classification increases rapidly after this transitory period; in subset S3, all the Ethanol samples are correctly classified as Ethanol; finally, in subset S4, the transition from Ethanol is misclassified as Ethanol although the accuracy of the classification increases rapidly after this transitory period and the samples are finally classified as Air.
Finally,
Table 4,
Table 5,
Table 6 and
Table 7 summarize the performance metrics of the Ethanol gas leak detection obtained in the different classification subsets displayed in
Figure 6.
Table 4 contains the scores obtained in the classification of the eNose data gathered during the S1 subset. In this case, all the gas samples belong to the Air class and are classified successfully. Therefore, the classification obtains the maximum score in all categories.
Table 5 shows the scores obtained in the classification of the eNose data gathered during the subset S2. In this case, the subset contains samples from both classes and the classifier performed slightly better when classifying Air samples compared to the Ethanol ones, as denoted by its F1-score. However, the specificity and precision are higher for the Ethanol class. The average scores of the S2 subset are accuracy 83.17%, sensitivity 82.65%, specificity 82.65%, precision 87.68%, and F1-Score 82.48%.
Table 6 shows the scores obtained in the classification of the eNose data gathered during subset S3. In this case, all samples in this subset are correctly classified as Ethanol, obtaining the maximum score in all categories.
Finally,
Table 7 shows the scores obtained in the classification of the eNose data gathered during the subset S4. In this case, the expected class is Air but the data in the subset shows a transition from Ethanol to Air, making more than half of the samples misclassified as Ethanol. This resulted in a high false positives count of 57% lowering the overall classification score. The average scores of the S4 subset are accuracy 43.00%, precision 50.00%, and F1-Score 30.07%.
5. Discussion
This paper presents the results obtained by embedding a compact and low-power eNose in an indoor mobile robot performing package delivery. The mobile robot was assessed for the early detection of Ethanol gas leaks inside a building.
The use of an eNose instead of a selective gas sensor to detect a gas leak has the advantage that it can be trained to detect either specific gases or odors composed of various volatile chemical compounds. This means that the detected gas or gases can be changed depending on the needs of the application or activities deployed in the building, without modifying the actual sensing element.
The eNose used in this work is composed of sixteen single-type (identical) BME680 miniature gas sensors. In previous works, this eNose implementation has proved useful in discriminating different gases [
62] and aromas [
69]. This eNose is powered through a standard USB 2.0 connection and has a low power consumption of 900 mW, allowing continuous usage in battery-operated applications such as mobile robotics.
The indoor delivery robot used in this work is an adaptation of a mobile robot initially designed to assist humans. The robot has two figurative arms able to gesticulate and includes a transportation box to operate as an indoor mobile delivery robot. More details of the robot’s adaptation and the delivery operation procedures can be found in [
68].
The objective of this work was the evaluation of the delivery robot embedded with a compact eNose for the early detection of an Ethanol gas leak. The calibration procedure performed in this work consisted of exposing the eNose to Air and two Ethanol gas leaks, with evaporation rates of 4.3 mg/min and 130 mg/min. The assumption is that these two evaporation rates are the minimum and the maximum that the mobile robot can be exposed to during a package delivery operation. Then, these measurements were used to train an LDA classifier to detect Air or Ethanol.
The indoor mobile delivery robot embedded with the eNose has been programmed to perform parcel delivery in the building. The delivery procedure described in this work has been limited to a single-floor trajectory to focus attention on the early detection of gas leaks. The robot was sent on a parcel delivery where it must enter a room with an Ethanol gas leak. The results of the real-time LDA classification showed that the compact eNose embedded in the mobile robot is capable of detecting gas leaks while making a package delivery inside a building.


