1. Introduction
Perception is essential for enabling autonomous vehicles to understand their surrounding traffic environment, leading to significant advancements in research. The release of several large-scale open-source datasets [
1,
2,
3] has facilitated the development of highly effective models [
4,
5,
6,
7]. However, single-vehicle perception systems have notable limitations, primarily due to the restricted range of vehicle-mounted sensors, which can create blind spots in detection. Additionally, outfitting vehicles with a dense array of sensors can be prohibitively expensive.
Vehicle–infrastructure cooperative perception addresses these challenges by facilitating information sharing between vehicles and infrastructure, thereby enhancing the perception capabilities of autonomous vehicles [
8,
9]. It extends the perception range and reduces blind spots, effectively mitigating some limitations inherent in single-vehicle systems [
10,
11,
12,
13]. Infrastructure sensors, typically installed at higher positions, provide different viewing angles compared to vehicle-mounted sensors, enabling vehicles to detect obstacles at greater distances and within blind spots that would otherwise remain invisible. Furthermore, vehicle–infrastructure cooperative perception enhances the robustness and reliability of the overall perception system; in the event of a failure in the vehicle’s perception system, the infrastructure can serve as a backup, ensuring continued functionality.
Despite its potential, research on vehicle–infrastructure cooperative perception is still in its early stages and faces numerous challenges. A critical issue is the effective fusion of features from vehicle and infrastructure sensors, which directly impacts the performance of cooperative perception. Therefore, there is an urgent need to explore effective methods for integrating vehicle–infrastructure features.
Our research focuses on the fusion of vehicle–infrastructure features to enhance the perception performance of cooperative systems. Differences in installation angles, resolutions, and environmental conditions between vehicle and infrastructure sensors lead to distinct distributions of acquired feature information, resulting in a domain gap. This discrepancy complicates the direct fusion of features, limiting the maximization of cooperative performance. Previous work has explored various methods for effective feature fusion. For instance, F-Cooper [
14] employs the max-out method to highlight important features and filter out trivial ones, and Ref. [
15] concatenates vehicle–infrastructure features; meanwhile, Ren et al. [
16] implement a weighting scheme for merging. However, these methods typically perform fusion at a single resolution, which limits their ability to fully leverage complementary information across different scales, such as local spatial details and global semantic context. Additionally, existing methods do not sufficiently account for distribution differences between vehicle and infrastructure features. Simple concatenation or weighting can lead to interference between these two feature sources, resulting in inconsistently or suboptimally fused features and ultimately degrading detection accuracy.
Currently, datasets in the field of vehicle–infrastructure cooperative perception include both simulation datasets and real-world datasets. However, simulation datasets do not fully capture the complexity and uncertainty of real-world scenarios, such as calibration errors, localization errors, delays, and communication issues, which are practical challenges that require urgent investigation [
17]. The only existing real-world dataset, DAIR-V2X [
18], is insufficient for verifying the generalization of algorithms. Moreover, existing vehicle–infrastructure perception datasets typically only contain annotations for vehicles, lacking other important categories like pedestrians and cyclists, which restricts comprehensive studies of traffic scenarios.
To address these challenges, we propose a vehicle–infrastructure cooperative perception network that achieves comprehensive fusion of vehicle–infrastructure features. This network takes point clouds from both vehicle and infrastructure sensors as input and facilitates feature sharing to perform 3D object detection.
Additionally, we present a multi-category real-world dataset called DZGSet, which offers richer and more diverse scenarios for vehicle–infrastructure cooperative perception. This dataset captures multiple categories of traffic participants, addressing the limitations in existing datasets. To evaluate our approach, we conduct experiments on DZGSet and DAIR-V2X dataset, comparing it with single-vehicle perception method and state-of-the-art cooperative perception methods.
In summary, the main contributions of our work are as follows:
We introduce a vehicle–infrastructure cooperative perception network that employs a Multi-Scale Dynamic Feature Fusion Module, incorporating the Multi-Source Dynamic Interaction (MSDI) and Per-Point Self-Attention (PPSA) modules to effectively integrate features from vehicle and infrastructure, thereby significantly enhancing their cooperative perception capabilities.
We construct DZGSet, a self-collected real-world dataset featuring high-quality annotations for various traffic participants, including “car”, “pedestrian”, and “cyclist”, which addresses the limitations of existing datasets.
Our extensive experimental evaluations demonstrate that the proposed vehicle–infrastructure cooperative perception network successfully fuses vehicle and infrastructure features, resulting in improved accuracy and a more holistic understanding of the cooperative perception.
The rest of this paper is arranged as follows:
Section 2 discusses the recent works that have been undertaken in cooperative perception and autonomous driving datasets.
Section 3 portrays information on the proposed vehicle–infrastructure cooperative perception network. The results acquired with the proposed modules are discussed briefly in
Section 4.
Section 5 concludes this paper.
3. Method
In vehicle–infrastructure cooperative perception, it is essential to address the domain gap between features obtained from vehicle and infrastructure sensors. To enhance the performance of vehicle–infrastructure cooperative perception, we propose a cooperative perception network. The overall architecture of the proposed network is shown in
Figure 1, which comprises four main components: (1) point cloud feature extraction; (2) vehicle–infrastructure information sharing; (3) Multi-Scale Dynamic Feature Fusion; (4) detection head.
3.1. Point Cloud Feature Extraction
Point cloud feature extraction is a critical step in the vehicle–infrastructure cooperative perception network. We utilize the Pillar Feature Network from PointPillars to extract features from both vehicle and infrastructure point cloud data. For infrastructure point cloud and vehicle point cloud , we partition each into multiple pillars and employ a convolutional neural network to extract features from the points within each pillar. These features are then integrated and transformed into feature maps from a bird’s-eye view (BEV) perspective, resulting in the infrastructure point cloud feature map and the vehicle point cloud feature map , where H, W, and C represent the height, width, and channels of the feature maps, respectively. During the feature extraction process, the Pillar Feature Network, used for both vehicle and infrastructure, shares the same parameters. This ensures that the features from both sources possess similar representational capabilities, facilitating effective subsequent feature fusion.
3.2. Vehicle–Infrastructure Information Sharing
To minimize communication overhead, we implement an encoder–decoder-based information sharing mechanism [
15] that effectively compresses and decompresses feature information, ensuring high-quality transmission even under limited bandwidth conditions. At the infrastructure level, the extracted point cloud features
are compressed using a convolutional neural network, which reduces their dimensionality and data volume:
where
represents the compressed infrastructure features, Conv denotes the convolutional neural network layer, and
,
, and
correspond to the height, width, and channels of the compressed features, respectively. Upon reaching the vehicle, the compressed features
are decompressed through a deconvolution operation to restore their original scale and detail:
where Deconv is the deconvolutional neural network layer responsible for reconstructing the original feature representation,
.
3.3. Multi-Scale Dynamic Feature Fusion
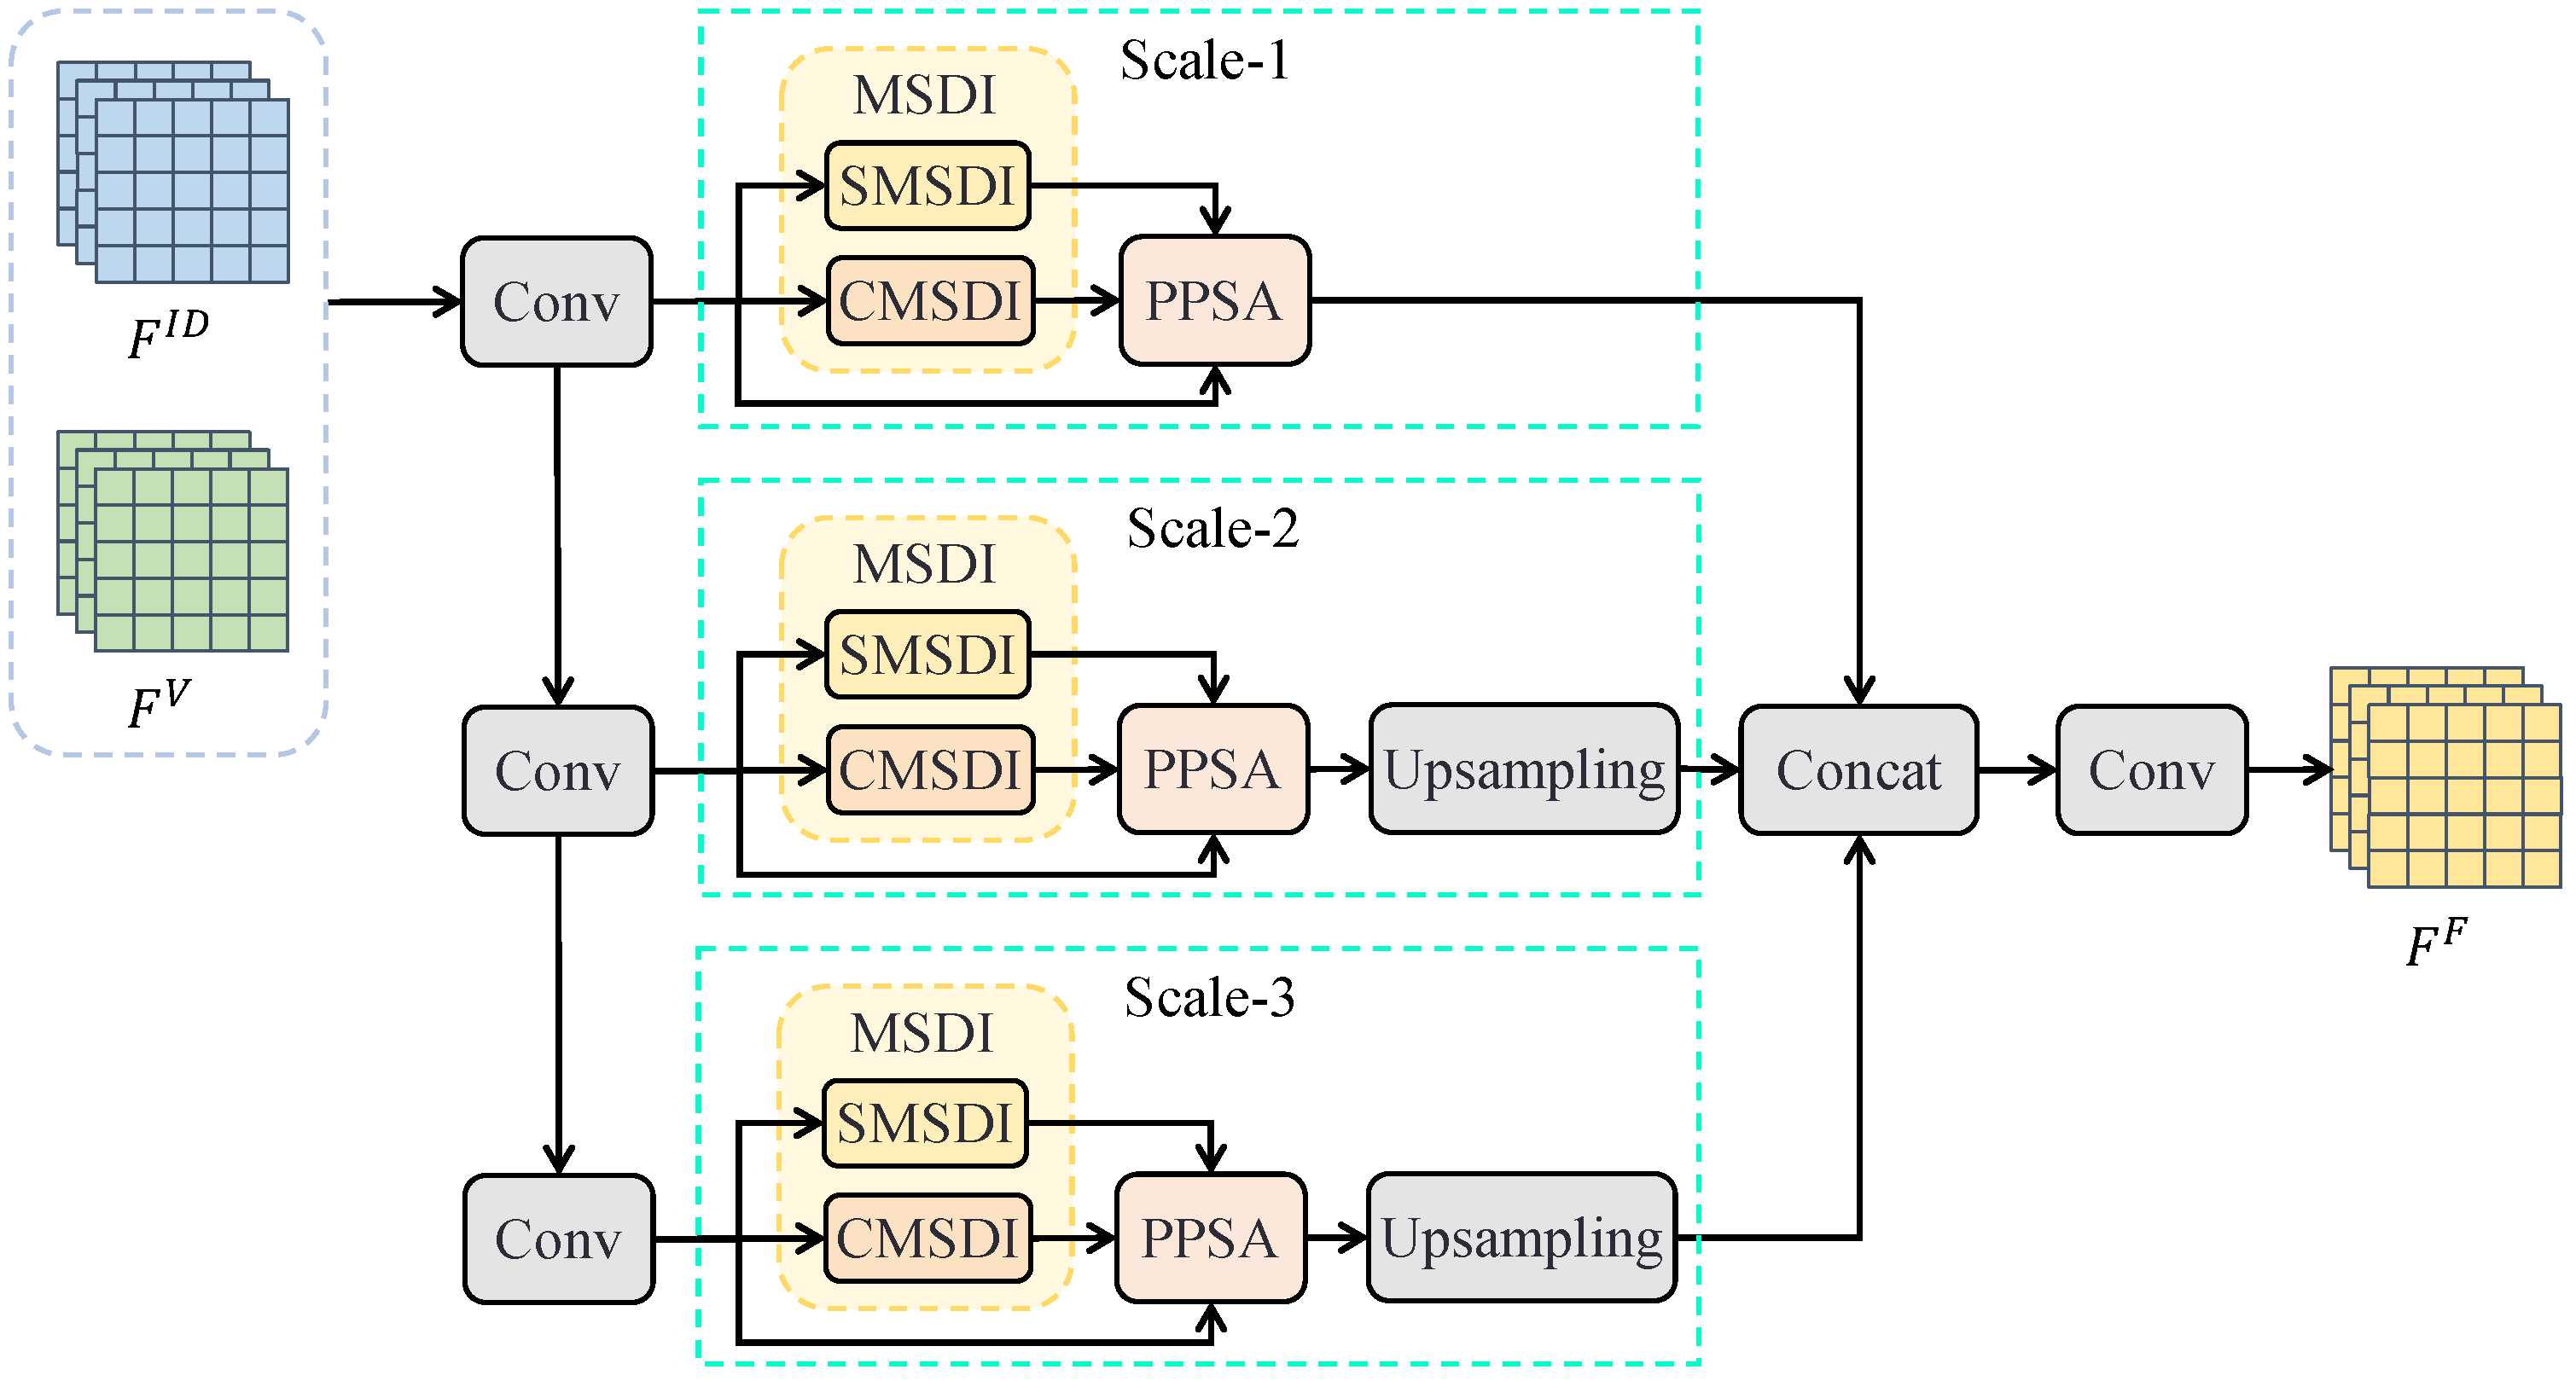
In the vehicle–infrastructure cooperative perception network, the Multi-Scale Dynamic Feature Fusion Module is tasked with fusing vehicle features and decompressed infrastructure features to produce a unified output, as depicted in
Figure 2. This fusion process incorporates two essential components at each scale: the MSDI and the PPSA, ensuring comprehensive utilization of features from both vehicle and infrastructure. The Multi-Scale Dynamic Feature Fusion Module consists of four primary processes: (1) Multi-Scale Feature Construction; (2) Multi-Source Dynamic Interaction Module; (3) Per-Point Self-Attention Module; and (4) Multi-Scale Feature Aggregation.
3.3.1. Multi-Scale Feature Construction
The first step in the Multi-Scale Dynamic Feature Fusion Module is Multi-Scale Feature Construction, which involves downsampling the vehicle features, , and the decompressed infrastructure features, , to various scales using convolution operations. This process ensures that information across different scales is effectively utilized.
Large-scale features capture broader contextual information within a scene and exhibit lower sensitivity to local changes. They emphasize the overall layout rather than precise positional details, providing stable and reliable semantic information less affected by minor environmental variations. Conversely, small-scale features focus on fine-grained attributes, such as specific vehicle parts or pedestrian movements, delivering detailed information that enhances perception accuracy. By integrating both large-scale and small-scale features, the system maintains robustness while remaining attentive to critical details.
To generate feature maps at multiple scales, we employ a step-wise downsampling strategy. Vehicle and decompressed infrastructure features are processed through a series of convolutional and pooling layers to obtain features at three different scales. The multi-scale vehicle and infrastructure features are denoted as and , respectively, where , , and represent the dimensions (height, width, and channels) of the features, with indicating different scale levels.
3.3.2. Multi-Source Dynamic Interaction Module
The Multi-Source Dynamic Interaction Module (MSDI) is a crucial component of the Multi-Scale Dynamic Feature Fusion Module, facilitating deep interactions between vehicle and infrastructure features at each scale. As illustrated in
Figure 2, this module consists of two parallel sub-modules: the Spatial Multi-Source Dynamic Interaction Module (SMSDI) and the Channel Multi-Source Dynamic Interaction Module (CMSDI). The SMSDI captures correlations between features in the spatial dimension, while the CMSDI focuses on channel-wise correlations, as depicted in
Figure 3.
The input to the SMSDI consists of vehicle and infrastructure point cloud features. The SMSDI generates a spatial priority map through a spatial priority generator, which indicates the importance of different spatial locations in the feature map. This allows the system to concentrate on critical spatial areas, thereby reducing interference from irrelevant background information.
As shown in
Figure 3, the SMSDI first processes vehicle and infrastructure features through the spatial priority generator. It then obtains spatial priority maps via convolution operations, enhancing the robustness of these maps, given by
where
and
represent the spatial priority maps for vehicle and infrastructure features, respectively, and
denotes the spatial priority generator following a detection decoder from PointPillars.
Subsequently, we concatenate the spatial priority maps for vehicle and infrastructure features to ensure alignment at corresponding spatial locations. A Softmax function is then applied at each location to dynamically adjust the weights, thereby reinforcing the association between vehicle and infrastructure features, as detailed below:
where
denotes the spatial priority map after interaction, with higher values indicating greater importance at the corresponding locations. Likewise,
represents the processed spatial priority map for infrastructure features.
The spatial priority maps obtained after interaction are applied to the vehicle and infrastructure features, enabling each point to be re-weighted based on its spatial location’s priority, thus enhancing feature expressiveness. Finally, the weighted vehicle and infrastructure features are combined to produce the final spatial dynamic interaction features:
where
represents the spatial dynamic interaction feature, fully integrating perception information from both vehicles and infrastructure.
CMSDI operates similarly to SMSDI but focuses on dynamic interactions in the channel dimension. Instead of spatial priority maps, it generates channel priority maps
and
through the channel priority generator
, which consists of parallel max pooling and average pooling operations. These maps are then normalized via Softmax (as in Equation (
4)) to produce channel weights,
and
, which re-scale features along the channel dimension.
The output is fused as follows:
where
denotes the channel dynamic interaction feature, representing a deep integration of vehicle and infrastructure features at the channel level.
3.3.3. Per-Point Self-Attention Module
The PPSA module, illustrated in
Figure 4, builds upon dynamic feature interactions by performing self-attention at identical spatial locations. This approach effectively captures the relationships between features from various sources at the same spatial coordinates, allowing for comprehensive integration of these features. The input to the PPSA consists of spatial and channel dynamic interaction features, along with the original vehicle and infrastructure features. This holistic input strategy reduces the risk of information loss during MSDI, thereby enhancing the network’s robustness and ensuring strong performance in complex environments.
Initially, the features , , , and are concatenated and reshaped into a tensor with dimensions , denoted as . This reshaping aligns the data with the input requirements of the self-attention mechanism.
Next, we express the applied self-attention mechanism along the second dimension of
.
where
, and
are learnable projection matrices that transform the reshaped features into queries (Q), keys (K), and values (V) through linear transformations. After calculating the scaled dot–product attention scores using the Softmax function, the final fused features are derived by aggregating the value vectors weighted by the attention scores, followed by layer normalization (LN) and a residual connection.
3.3.4. Multi-Scale Feature Aggregation
The Multi-Scale Feature Aggregation module is designed to unify multi-scale features by first upsampling them to a consistent size using deconvolution techniques. Subsequently, these features are concatenated along the channel dimension. This concatenated feature then passes through a convolutional layer for dimensionality reduction, resulting in an integrated vehicle–infrastructure feature, denoted as . The final fused feature contains rich semantic information and spatial details, effectively merging multi-scale features from both vehicle and infrastructure domains, thereby enhancing the overall understanding and representation of the environment.
3.4. Detection Head
Within the vehicle–infrastructure cooperative perception network, the detection head is tasked with executing 3D object detection based on the fused features, which assimilate information from both vehicle and infrastructure. The detection head directly adopts the standard implementation of PointPillars, utilizing L1 loss for bounding box regression, focal loss for classification, and a direction loss for orientation estimation. The final output encompasses the object category, position, size, and yaw angle for each bounding box, thereby completing the 3D object detection process.
4. Experiment
This section presents experiments conducted to evaluate the performance of the proposed method for cooperative 3D object detection, utilizing both the DZGSet and DAIR-V2X datasets. We assess detection performance and benchmark our method against state-of-the-art approaches. Furthermore, qualitative visual analyses are performed to gain deeper insights into the capabilities of the proposed method. An ablation study is also carried out to investigate the contributions of individual modules within the network.
4.1. Datasets
4.1.1. DZGSet Dataset
To address the limitations of existing vehicle–infrastructure cooperative perception datasets, particularly regarding the number of object categories, we developed the DZGSet dataset. This dataset is collected from real-world scenarios and encompasses multi-modal, multi-category data for vehicle–infrastructure cooperative perception. The dataset construction process includes the following:
Hardware configuration: The collection of the DZGSet dataset relies on an advanced hardware setup, featuring an 80-line resolution LiDAR and a 1920 × 1080 pixel camera installed on infrastructure, alongside a 16-line resolution LiDAR and a camera with the same specifications mounted on vehicle. More detailed specifications of the sensors are shown in
Table 1. Both vehicle and infrastructure are equipped with time servers to ensure precise synchronization across all devices. Additionally, vehicles are outfitted with a Real-Time Kinematic (RTK) system for the real-time acquisition of high-precision pose information. This comprehensive configuration enhances the richness and accuracy of the dataset by capturing detailed multi-modal data from both vehicle and infrastructure perspectives.
Software configuration: On the software side, high-precision time synchronization is achieved through time servers, allowing accurate alignment of data from various sources. Furthermore, precise calibration techniques are employed to ensure the spatial coordinate alignment between the different sensors, enabling data from diverse perspectives to be processed within a unified spatial coordinate system.
Data collection and annotation: Data are collected in real-world road environments through multiple driving experiments. During each experiment, data from both vehicle and infrastructure sensors are recorded. Professional annotators then perform high-quality manual annotations on objects based on image and point cloud data. The DZGSet dataset features 3D annotations for LiDAR point clouds and 2D annotations for camera images. The dataset primarily annotates on three object categories: “car”, “pedestrian”, and “cyclist”. When annotating point clouds, annotators assign a category and ID to each object, along with a 7-degree-of-freedom (DoF) 3D bounding box. The parameters for the 3D bounding box include the center position coordinates (
x,
y,
z) and the dimensions and orientation defined by length, width, height, and yaw. During image annotation, annotators also label each object’s category and ID, along with its 4-degree-of-freedom 2D bounding box. The parameters for the 2D bounding box consist of the center position coordinates (
x,
y) and the dimensions defined by length and width. Examples from the DZGSet dataset are depicted in
Figure 5.
Data analysis: The DZGSet dataset consists of 4240 frames of synchronized point cloud and image data, meticulously organized to facilitate reproducibility. It is divided into training, validation, and test sets in a 60%, 20%, and 20% ratio, respectively. The dataset features a total of 24,676 annotated objects, averaging six objects per frame. Data collection occurred during daytime under two weather conditions, sunny and cloudy, with 64% of the frames captured in sunny conditions and 36% in cloudy conditions. In terms of object distribution, the frames contain 12,920 pedestrians, 7708 cars, and 4048 cyclists. Pedestrians constitute the majority at 52%, while cars and cyclists represent 31% and 17%, respectively. In contrast to other cooperative perception datasets that focus solely on vehicle categories, DZGSet enriches categories by including pedestrians and cyclists, which are often considered smaller objects in the context of autonomous driving. This enhanced diversity significantly increases the dataset’s value for developing robust perception systems in complex urban environments.
4.1.2. DAIR-V2X Dataset
The DAIR-V2X dataset represents the first large-scale, real-world vehicle–infrastructure cooperative perception dataset. It includes both LiDAR point clouds and camera images collected from vehicle and infrastructure. The dataset contains 9000 frames, each annotated with 3D information for point clouds and 2D information for images. Notably, all annotations are limited to the vehicle categories throughout the dataset.
4.2. Evaluation Metrics
The performance of the proposed network is evaluated using the Average Precision (AP) metric, which quantifies the precision-recall trade-off by calculating the area under the precision–recall (P-R) curve [
30]. The Intersection over Union (IoU) metric measures the overlap between detected and ground truth bounding boxes, defined as the area of overlap divided by the area of union. This metric is crucial for determining true positives in object detection. For evaluation purposes, AP is calculated at IoU thresholds of 0.5 and 0.7, reflecting detection accuracy at these commonly used thresholds in 3D object detection tasks.
4.3. Implementation Details
In the experiments, the detection range is set to for the DZGSet dataset, and for the DAIR-V2X dataset. The communication range between vehicle and infrastructure is established at 50 m for the DZGSet dataset and 100 m for the DAIR-V2X dataset. Beyond this broadcasting radius, vehicles are unable to receive information from the infrastructure.
For the PointPillars feature extraction network, the voxel size is set to 0.4 m for both height and width. All models are trained and tested on a platform equipped with a GeForce RTX 2080 Ti GPU. The training process spans 30 epochs with a batch size of 4. The Adam optimizer is employed, starting with an initial learning rate of 0.002 and a weight decay of 0.0001. A multi-step learning rate scheduler is utilized, reducing the learning rate by a factor of 0.1 at the 10th and 15th epochs. Furthermore, Kaiming Uniform is used for weight initialization.
4.4. Quantitative Results
To validate the detection performance of the proposed method, we conducted extensive experiments on both the DZGSet and DAIR-V2X datasets. Our network was compared against several benchmarks, including single-vehicle perception (baseline), early and late cooperative perception, and state-of-the-art intermediate cooperative perception methods. As summarized in
Table 2, the proposed method consistently achieved the highest AP, underscoring its superiority in vehicle–infrastructure cooperative perception.
Specifically, the proposed method achieved an AP@0.5 of 0.652 and an AP@0.7 of 0.493 on the DZGSet dataset, and an AP@0.5 of 0.780 and an AP@0.7 of 0.632 on the DAIR-V2X dataset. When compared to the single-vehicle perception method (PointPillars), our approach demonstrated a substantial improvement, with an AP@0.5 increase of 0.288 on the DZGSet and 0.299 on the DAIR-V2X datasets. Clearly, the AP@0.5 and AP@0.7 values on the DAIR-V2X dataset are generally higher than those on the DZGSet dataset. This indicates that the larger-scale DAIR-V2X dataset offers a more diverse array of training samples, enabling the model to learn more robust features and enhance detection accuracy, while the DZGSet is smaller in scale, its multi-category annotations create a more complex learning environment, allowing for a broader evaluation of the model’s generalization capabilities. This complexity ultimately improves the model’s adaptability to various detection scenarios. Furthermore, against early, late, and state-of-the-art intermediate cooperative perception methods, our method achieves minimum improvements of an AP@0.5 increase of 0.037 (F-Cooper) and an AP@0.7 increase of 0.043 (F-Cooper) on the DZGSet dataset, as well as an AP@0.5 increase of 0.034 (Coalign) and an AP@0.7 increase of 0.028 (Coalign) on the DAIR-V2X dataset.
The single-vehicle perception method relies solely on the vehicle’s sensors and does not utilize supplementary infrastructure information, leading to significantly lower performance compared to the proposed method. On the other hand, intermediate cooperative perception methods typically fuse vehicle and infrastructure features at a single scale through concatenation or weighting mechanisms, which is insufficient for optimal detection performance, and therefore inferior to the proposed method as well.
The advancements of our vehicle–infrastructure cooperative perception network are primarily attributed to the Multi-Scale Dynamic Feature Fusion Module, which effectively integrates features from both domains. Specifically, at smaller scales, it refines bounding box localization by fusing spatial details, while at larger scales, it aggregates semantic information to mitigate spatial misalignment between vehicle and infrastructure sensors. By dynamically capturing correlations between vehicle and infrastructure features in both channel and spatial dimensions, it ensures thorough fusion of interacted features and the original vehicle–infrastructure features at each spatial location. This synergy allows the proposed approach to fully exploit the complementary perception data from infrastructure, achieving state-of-the-art detection accuracy while maintaining robustness in complex real-world scenarios.
Furthermore, we performed inference time experiments on the DAIR-V2X dataset. The analysis reveals a trade-off between computational efficiency and detection performance. The single-vehicle perception method achieves the fastest inference time of 28.27 ms, owing to its low model complexity. In contrast, V2X-ViT has the slowest inference time at 172.01 ms, primarily due to the high computational demands of its attention mechanisms. The proposed method records an inference time of 57.62 ms, achieving a balance between accuracy and computational cost. However, this time is still higher than that of the single-vehicle perception method, suggesting that further optimization may be necessary for deployment on edge devices with limited computational resources.
4.5. Qualitative Results
To intuitively illustrate the perception capability of different models, we present detection visualization comparisons in typical scenarios in
Figure 6 and
Figure 7.
Comparison with single-vehicle perception method (
Figure 6):
Figure 6a highlights the limitations of single-vehicle perception in occlusion and long-range scenarios. For instance, the cyclist marked by the blue circle is occluded by a nearby car, rendering it undetectable for the ego vehicle. Additionally, two pedestrians marked by yellow circles are located at a significant distance, leading to missed or misaligned detections. In contrast, as shown in
Figure 6b, the proposed method successfully detects these objects by leveraging complementary information from infrastructure LiDAR. This demonstrates that in a vehicle–infrastructure cooperation system, infrastructure sensors enhance single-vehicle perception capabilities by providing complementary viewpoint data, effectively mitigating blind spots caused by occlusion and reducing performance degradation typically observed in single-vehicle perception at extended distances.
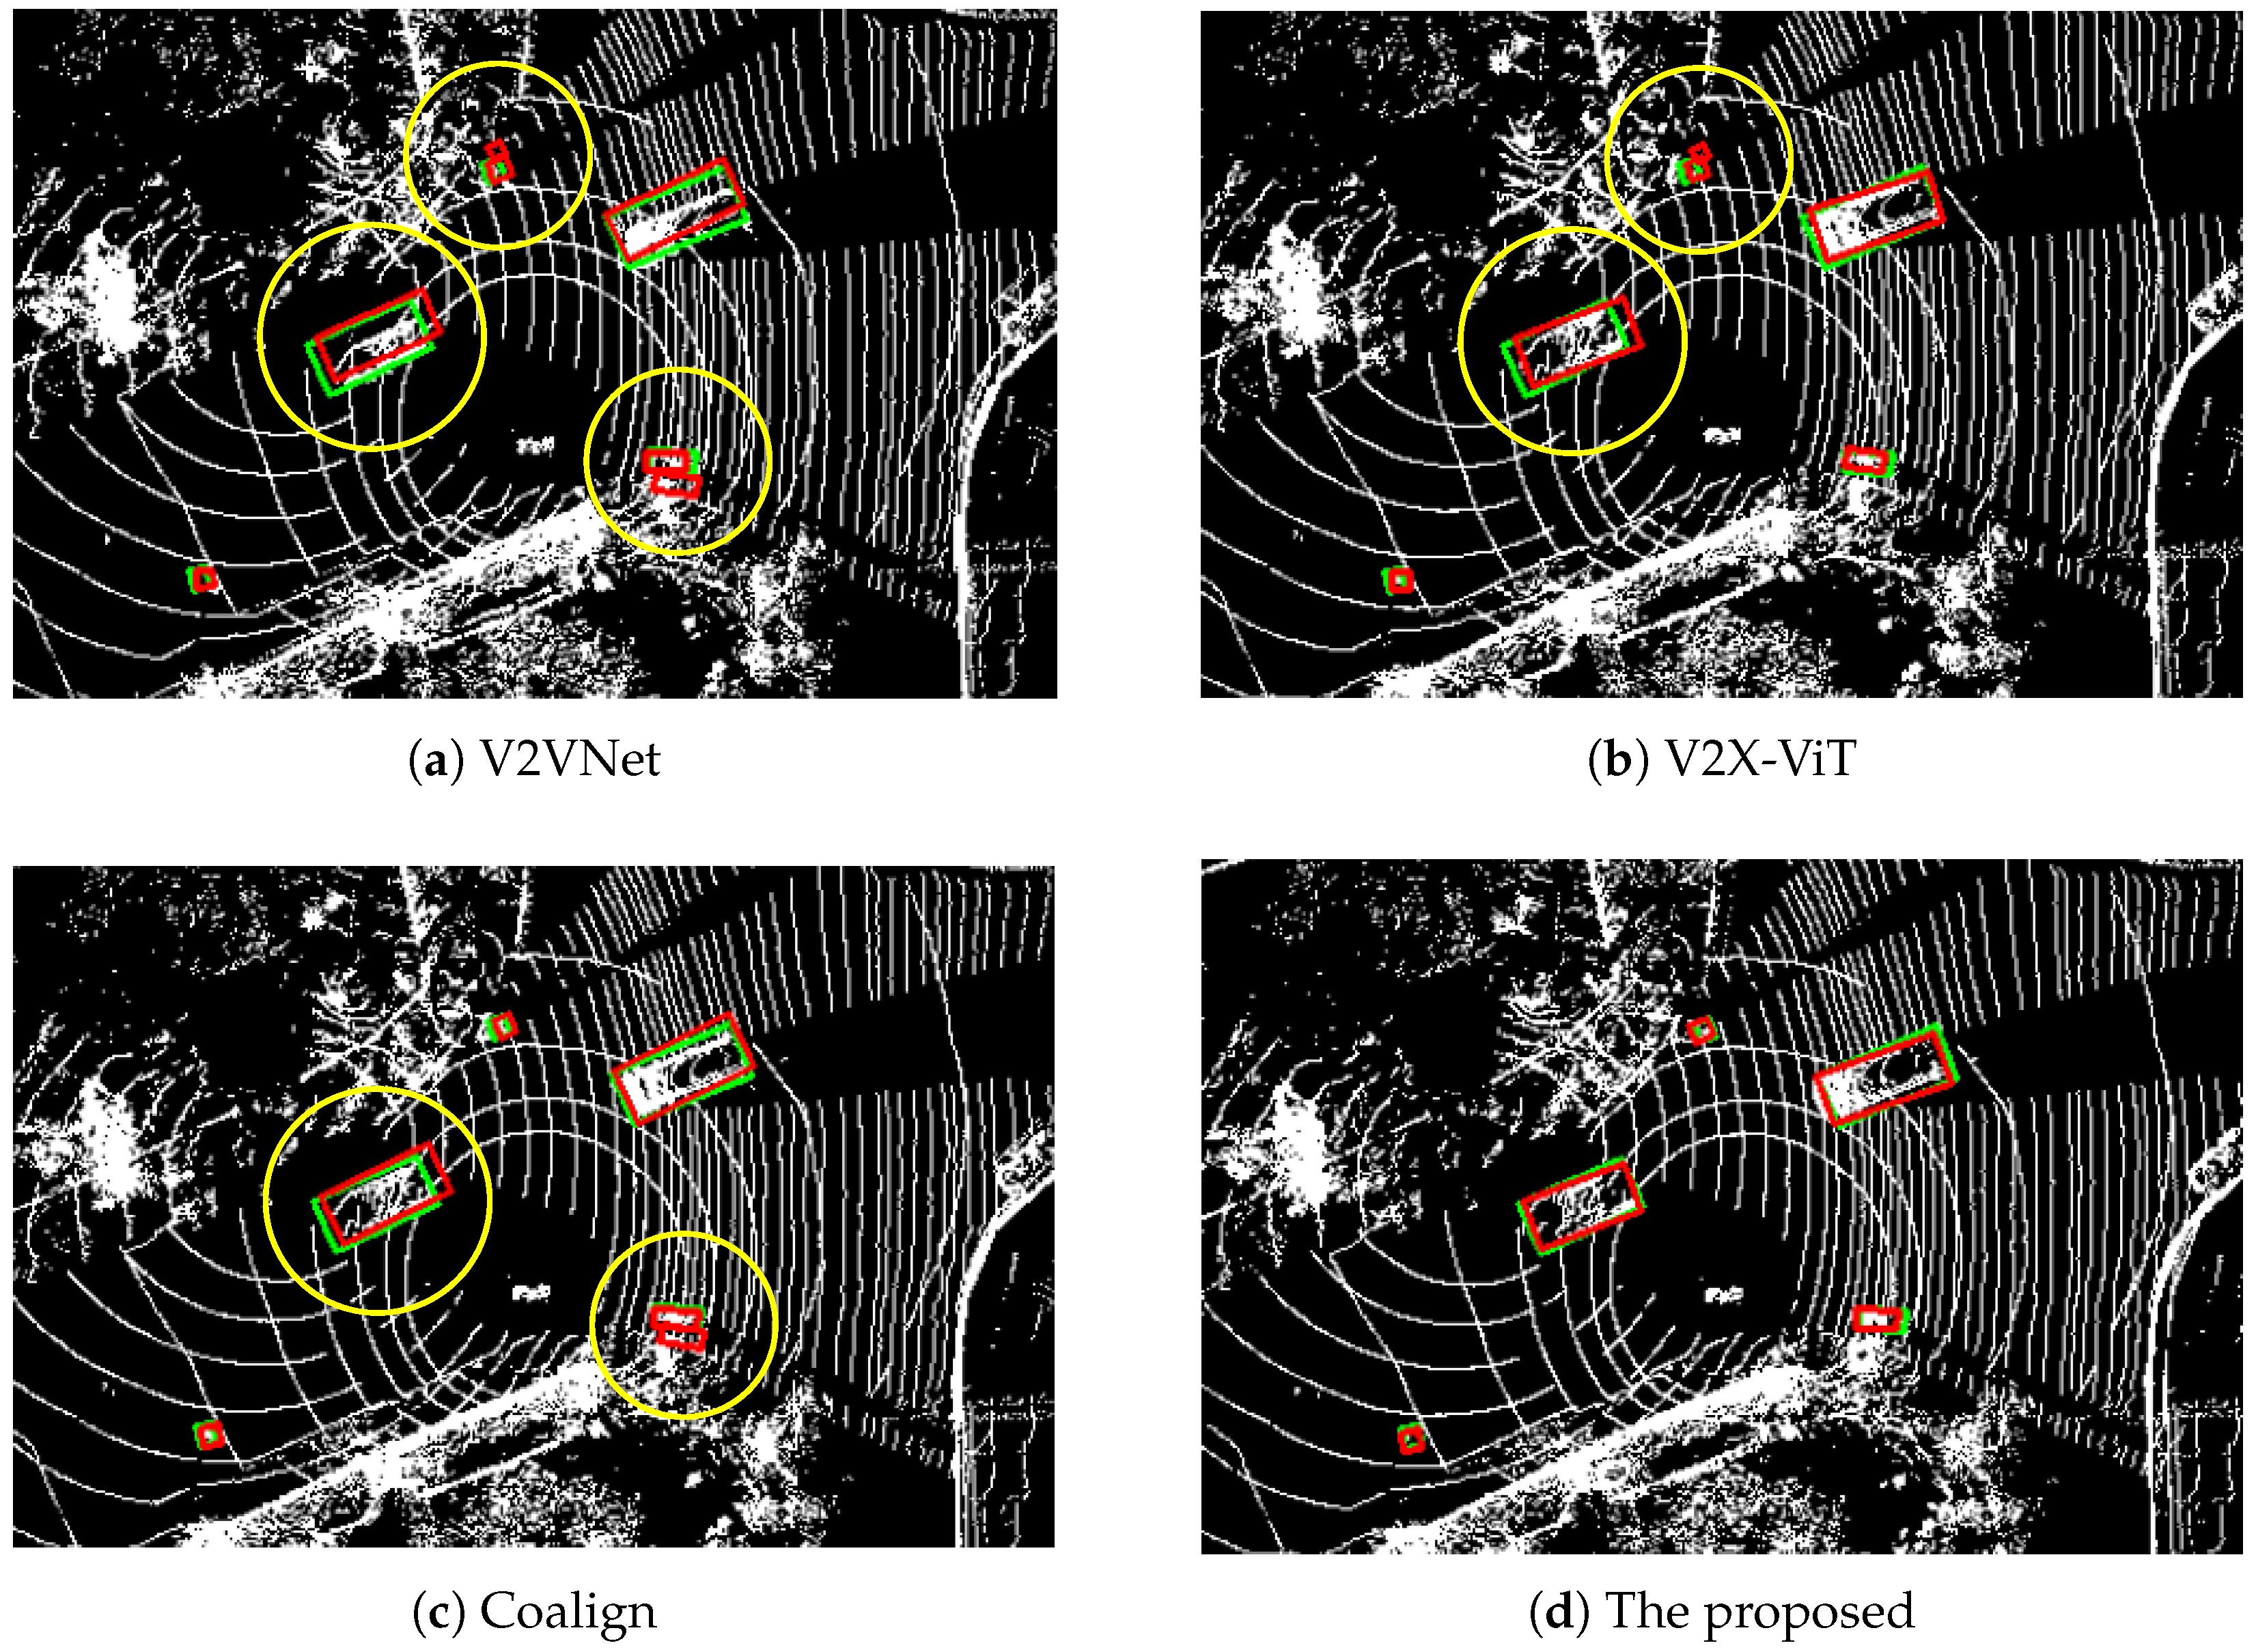
Comparison with advanced cooperative perception methods (
Figure 7):
Figure 7a–c visualize the detection results of various cooperative methods (V2VNet, V2X-ViT, and CoAlign). The yellow circles indicate inaccurate detections, including false positives for pedestrians and cyclists, as well as misaligned bounding boxes for cars. In comparison, the proposed method produces predictions that are closely aligned with the ground truth, as shown in
Figure 7d. The superiority of the proposed method arises from its ability to process vehicle and infrastructure features through the MSDI and PPSA modules at multiple scales. It effectively aggregates spatial details and semantic information from both vehicle and infrastructure features, resulting in more accurate and stable detection outcomes.
Overall, qualitative results highlight that the proposed approach achieved more accurate detection results compared to single-vehicle perception method and state-of-the-art cooperative perception methods.
4.6. Ablation Study
To validate the effectiveness of each component in the proposed vehicle–infrastructure cooperative perception network, we conducted comprehensive ablation studies on both the DZGSet and DAIR-V2X datasets. The results are summarized in
Table 3, where we systematically integrated key modules into the baseline model and evaluate their contributions.
The results indicate that each component significantly enhances detection accuracy, with the multi-scale fusion strategy demonstrating the most substantial impact, improving AP@0.5 by 0.040 and AP@0.7 by 0.035 on the DZGSet dataset, and AP@0.5 by 0.020 and AP@0.7 by 0.037 on the DAIR-V2X dataset. This enhancement is attributed to the multi-scale fusion’s ability to capture complementary information from vehicle–infrastructure features: small-scale features improve spatial localization by preserving geometric details, while large-scale features aggregate semantic context to mitigate ambiguities arising from sensor misalignment. Furthermore, within the MSDI module, the SMSDI shows a more significant contribution to performance gains compared to the CMSDI. This suggests that the interaction between vehicle and infrastructure features in the spatial dimension is particularly advantageous for the comprehensive fusion of these features. By synergizing these components, our network achieves state-of-the-art performance on both the DZGSet and DAIR-V2X datasets.
5. Conclusions
To tackle the significant challenge of domain gap arising from sensor characteristics in real-world applications, we introduce the Multi-Scale Dynamic Feature Fusion Module. This module integrates vehicle and infrastructure features through a multi-scale fusion strategy that operates at both fine-grained spatial and broad semantic levels. This approach facilitates a more effective exploration of the correlations and complementarities between vehicle and infrastructure features.
During the feature fusion process at each scale, we implement two key components: the Multi-Source Dynamic Interaction Module (MSDI) and the Per-Point Self-Attention Module (PPSA). The MSDI module adaptively aggregates vehicle–infrastructure features across spatial and channel dimensions in response to environmental variations, while the PPSA module optimizes feature aggregation at each spatial location through a self-attention mechanism. This combination ensures that vehicle–infrastructure features at every scale are fully utilized and effectively fused.
Additionally, we have constructed DZGSet, a self-collected real-world cooperative perception dataset that includes annotations for multiple object categories. Extensive validation on both the DAIR-V2X and the self-collected DZGSet datasets demonstrates state-of-the-art performance. Compared to advanced cooperative perception methods, our approach achieves improvements of 0.037 in AP@0.5 and 0.043 in AP@0.7 on the DZGSet dataset, and improvements of 0.034 in AP@0.5 and 0.028 in AP@0.7 on the DAIR-V2X dataset. The ablation studies further confirm that each proposed module significantly contributes to these performance gains.
While LiDAR point clouds provide precise 3D information, they often lack color and texture details. By combining high-resolution images with LiDAR point clouds, we can compensate for this deficiency, resulting in a more comprehensive environmental perception. In future work, we aim to extend our method to incorporate multi-modal data integration.
In conclusion, the proposed method achieves excellent vehicle–infrastructure cooperative perception performance by efficiently fusing vehicle–infrastructure features, thereby providing high-precision and robust data support that serves as a solid foundation for decision making in autonomous vehicles.


