1. Introduction
Change detection identifies differences between two images captured at different times at the same location; it labels the pixels in the changed areas as 0 and the pixels in the unchanged areas as 1. With the ongoing advancement of remote sensing technology, change detection in remote sensing images has become a key focus in the field [
1]. In addition, change detection in remote sensing images plays a significant role in various fields such as urban development planning [
2], agricultural surveys [
3,
4], land management [
5], and more.
Weismiller [
6] introduced the difference method in 1977 to distinguish differences in remote sensing images, marking the beginning of traditional change detection methods. Since then, numerous scientific advancements have been made in this area, including methods such as change vector analysis [
7], post-classification refinement [
8], and principal component analysis [
9]. These methods are capable of effectively distinguishing differences in remote sensing images within a short period of time, significantly improving the efficiency. However, as sensors continue to advance, remote sensing images are achieving higher resolutions, resulting in greater diversity in the appearance, color, and brightness of different land features. Therefore, the detection accuracy of traditional change detection methods is often unsatisfactory. In this context, it is highly meaningful to develop a change detection method that can quickly and accurately adapt to high-resolution remote sensing images.
AlexNet, proposed by Krizhevsky et al. [
10], achieved the championship in the ImageNet image classification competition, demonstrating the powerful feature extraction capability of deep learning-based image processing methods at that time. Moreover, with the continuous advancement of hardware technology, deep learning-based image processing methods quickly realized end-to-end training, showing significant advantages in terms of efficiency and speed. Subsequently, deep learning-based image processing methods experienced rapid development and were also applied in the field of change detection in remote sensing images. Gong et al. [
11] proposed a novel deep learning-based method for image change detection; it demonstrated the effectiveness of convolutional neural networks (CNNs) in change detection tasks. In 2018, Rodrigo et al. [
12] introduced three convolutional neural network (CNN) architectures specifically designed for change detection tasks. Additionally, they proposed a novel Siamese network structure with shared weights for processing two remote sensing images, achieving the best scores on two datasets. The Siamese network structure subsequently became one of the mainstream methods in the field of change detection. These convolution-based methods exhibit good adaptability in handling various sizes of images and achieve good accuracy. However, the limited receptive field of convolutional networks restricts their ability to capture broader features, which is a key drawback that convolutional neural networks tend to overlook.
Due to the excellent capability of Transformers [
13,
14] in extracting global semantic features in the field of natural language processing, Dosovitskiy et al. [
15] applied Transformers to the domain of image processing in 2020, providing new insights for image processing. Subsequently, many networks utilizing Transformers emerged in the field of image processing. However, while Transformers provide the ability to extract global semantic features, they also increase the number parameters. Liu et al. [
16] incorporated a sliding window mechanism into Transformer-based networks, which retained the advantages of Transformers while significantly reducing the number of parameters. Additionally, some studies have combined Transformers with convolutional operations, using Transformers to overcome the limitations of convolutional neural networks in extracting global semantic information while leveraging convolutional networks to reduce the large parameter count associated with Transformers alone. These approaches have shown promise. Zhang et al. [
17] designed a pure Transformer network called SwinSUNet with a Siamese U-shaped structure to solve the change detection problem. Peng et al. [
18] proposed the Conformer network, which combines Transformer and CNN architectures. They introduced coupling units to fuse the features extracted by both models. Chen et al. [
19] proposed the Bitemporal Image Transformer (BIT), which expresses bitemporal images as a small number of semantic tokens. The Transformer encoder and decoder are used to effectively model the context in the spatio-temporal domain, and BIT is integrated into a change detection framework based on deep feature differencing. Zhan et al. [
20] proposed an attention-guided multi-scale fusion network for bi-temporal change detection for change detection. Li et al. [
21] proposed an end-to-end encoding–decoding hybrid Transformer model for CD known as TransUNetCD. This model solves the problem of redundant information generated when extracting low-level features under the UNet framework and improves the effectiveness of the network and the accuracy of extracting changing features by weighting each pixel and selectively aggregating features.
The aforementioned work can process images more effectively and increase the model’s accuracy when compared to pure convolution and pure Transformers. However, there are still some issues with them:
The extensive usage of Transformers in the encoding stage overlooks the high computational cost of Transformers. Additionally, Transformer modules with a high number of parameters are susceptible to overfitting, particularly on small- to medium-sized datasets.
Due to the computational cost of the encoding stage, these models often use relatively simple fusion methods in the decoding stage. However, such fusion approaches may lead to inadequate information integration, negatively impacting the restoration of feature maps during decoding.
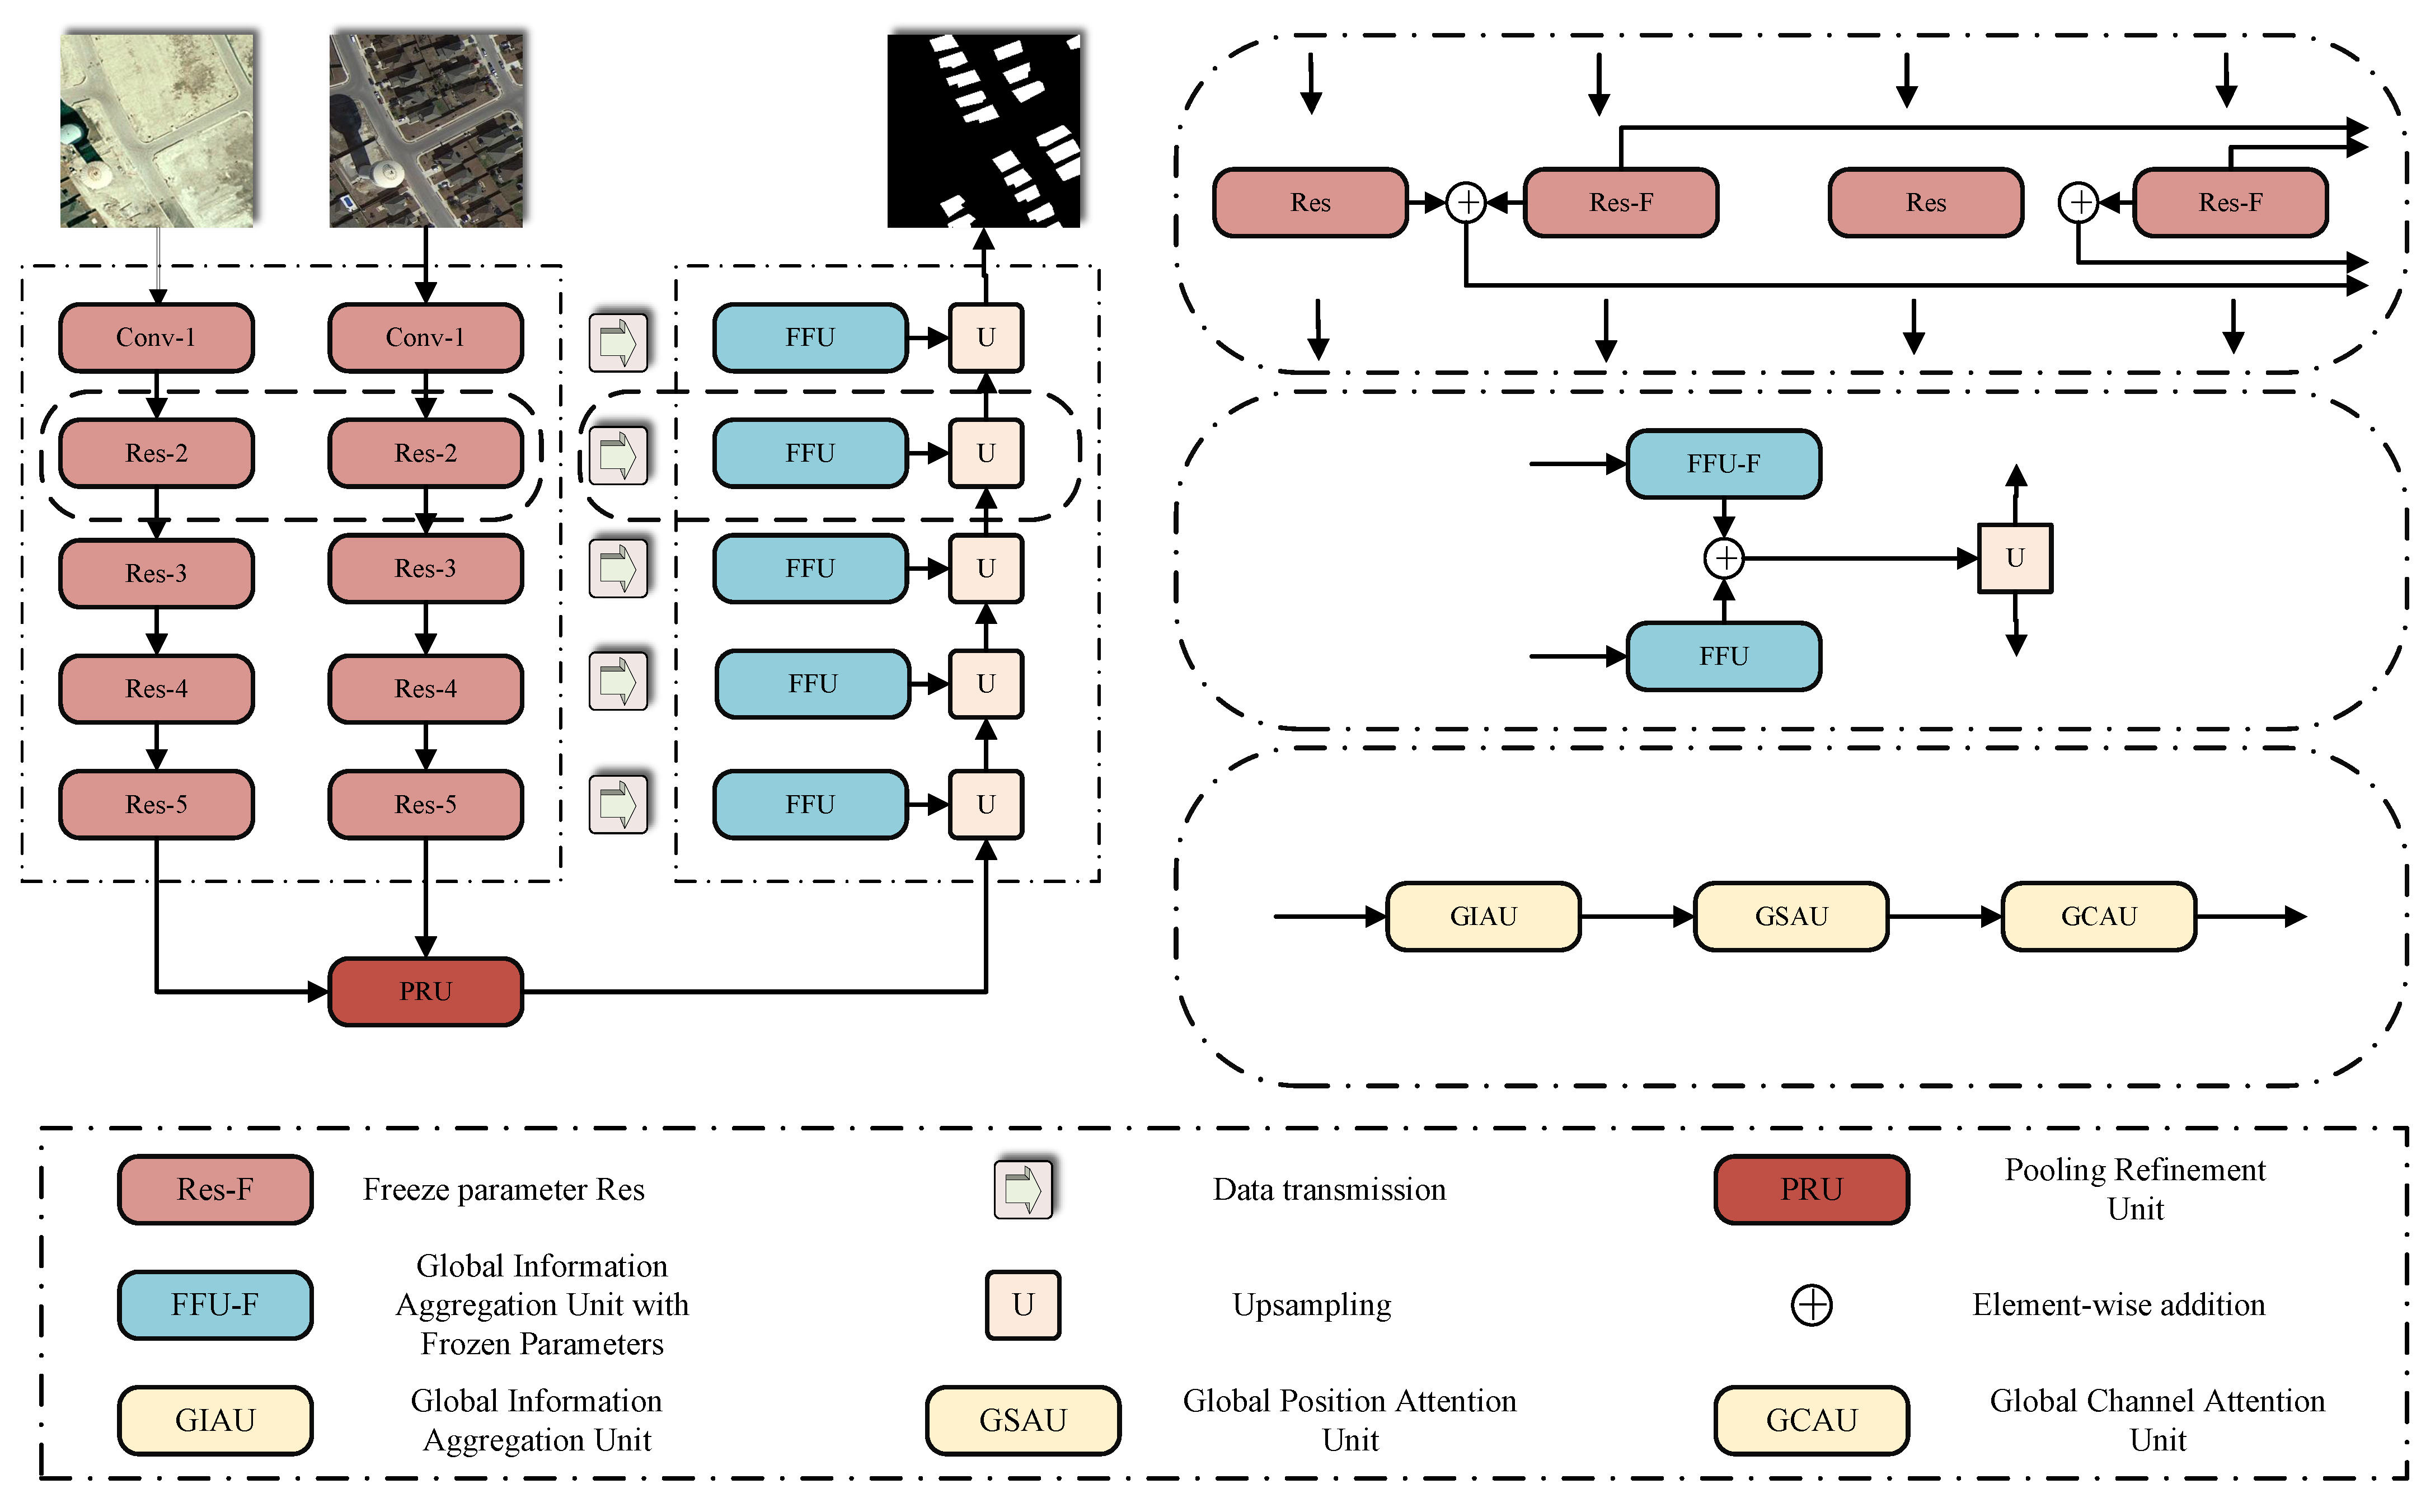
ResNet-34 serves as the backbone network to extract features from two original remote sensing images. The data obtained from each layer are then fed into the Feature Fusion Unit (FFU) for fusion. Simultaneously, at the bottom-most layer of the network, we sum the outputs of the two ResNet-34 branches and feed the result into a Patch Refinement Unit (PRU) module. The output of the PRU module is then passed to the upsampling stage. Finally, in the upsampling stage, we perform summation between the output of the PRU module and the outputs of each level of the FFU. This summation is then followed by upsampling operations until the feature maps are restored to their original size.
In this study, we employed parameter freezing techniques to optimize network performance. Specifically, we first trained the network normally until it achieved satisfactory performance metrics (such as IOU and F1 scores). Once the network met the expected performance, we froze its parameters and constructed a new network with the same architecture. At this point, the frozen parameters from each layer (such as the outputs of ResNet-34 and FFU units) were integrated with the untrained parts of the new network, forming a new network for further training and optimization. This strategy ensures that the pre-trained weights are utilized to their fullest potential in the frozen network, and the improvement in network performance is closely related to the selection of frozen parameters. The best performance of ZAQNet is typically achieved when optimal pre-trained weights are obtained, so we have added detailed explanations in the relevant sections.
The following points can be used to sum up this paper’s contribution:
A parameter-frozen Transformer self-attentional change detection network is proposed. The information contained in remote sensing photos can be fully utilized by the network to perform the change detection task.
We propose three modules: the GIAU, GSAU, and GSCU. The GIAU effectively integrates features from two remote sensing images. The GSAU performs self-attention processing on the input features in the spatial dimension of the image. The GSCU performs self-attention processing on the input features in the channel dimension.
ZAQNet achieved the best performance over the other change detection algorithms on two different datasets, demonstrating its superiority.
2. Methodology
2.1. Overall Framework
Indeed, CNN and Transformer methods are two prominent methods in the field of image processing [
22]. CNNs excel in extracting local features, while Transformers are known for their ability to capture global features. Combining these two approaches can be a promising choice, because it leverages the strengths of both methods. Additionally, we introduce the method of parameter freezing, where we freeze the parameters of certain modules in the pre-trained network and combine them with the untrained network to form a new network. This approach resembles a residual-like structure, where the untrained network essentially learns to fit the difference between the frozen parameters and the optimal solution. Based on the aforementioned points, we propose the frozen-parameter Transformer self-attention change detection network. This network combines the powerful feature extraction capabilities of Transformers and the parameter-freezing technique to improve change detection performance.
Figure 1 provides a detailed illustration of the overall framework of the ZAQNet. This paper aims to propose a Transformer self-attention change detection network, ZAQNet, based on freezing parameters, which is used to detect change regions more accurately. In addition, this paper also introduces four innovative modules: the GIAU (Global Information Aggregation Unit), GSAU (Global Spatial Attention Unit), GSCU (Global Channel Attention Unit), and PRU (Pooling Refinement Unit). As shown in
Figure 2,
Figure 3,
Figure 4 and
Figure 5, these modules optimize the performance of the model from the aspects of feature fusion, spatial dimension attention, channel dimension attention, and spatial position refinement. The GIAU accurately locates the change area by fusing the features of dual-temporal remote sensing images. The GSAU implements a self-attention mechanism in the spatial dimension to enhance the model’s ability to capture global change information; the GSCU implements self-attention operation in the channel dimension to strengthen the model’s attention to the change feature map. The PRU further improves the recovery effect of the feature map by extracting and refining the spatial location information of the underlying feature map. In the downsampling stage, we employ two pairs of ResNets with shared weights to extract features from the two remote sensing images. Notably, one of the ResNet pairs undergoes pre-training, and its parameters are subsequently frozen. Afterwards, the feature maps obtained from the two pairs of ResNets are summed together and fed into the Feature Fusion Unit (FFU) for further processing. The specific operations are illustrated in the pink region of
Figure 1. The features extracted by the ResNet pairs with frozen parameters are fed into the FFU with frozen parameters for processing, while the features extracted by the ResNet pairs involved in training are passed through the FFU involved in training. Finally, the processed feature maps are summed and fed into the upsampling stage to assist the model in generating the mask image. The specific operations are depicted in the blue region of
Figure 1. Additionally, within the FFU, we introduce three auxiliary units—the GIAU, GSAU, and GCAU—to process the extracted features at different levels. The internal structure of the FFU is depicted in the flaxen region of
Figure 1. Furthermore, in
Table 1, the specific details of the parameters in the model are shown.
2.2. Global Information Aggregation Unit (GIAU)
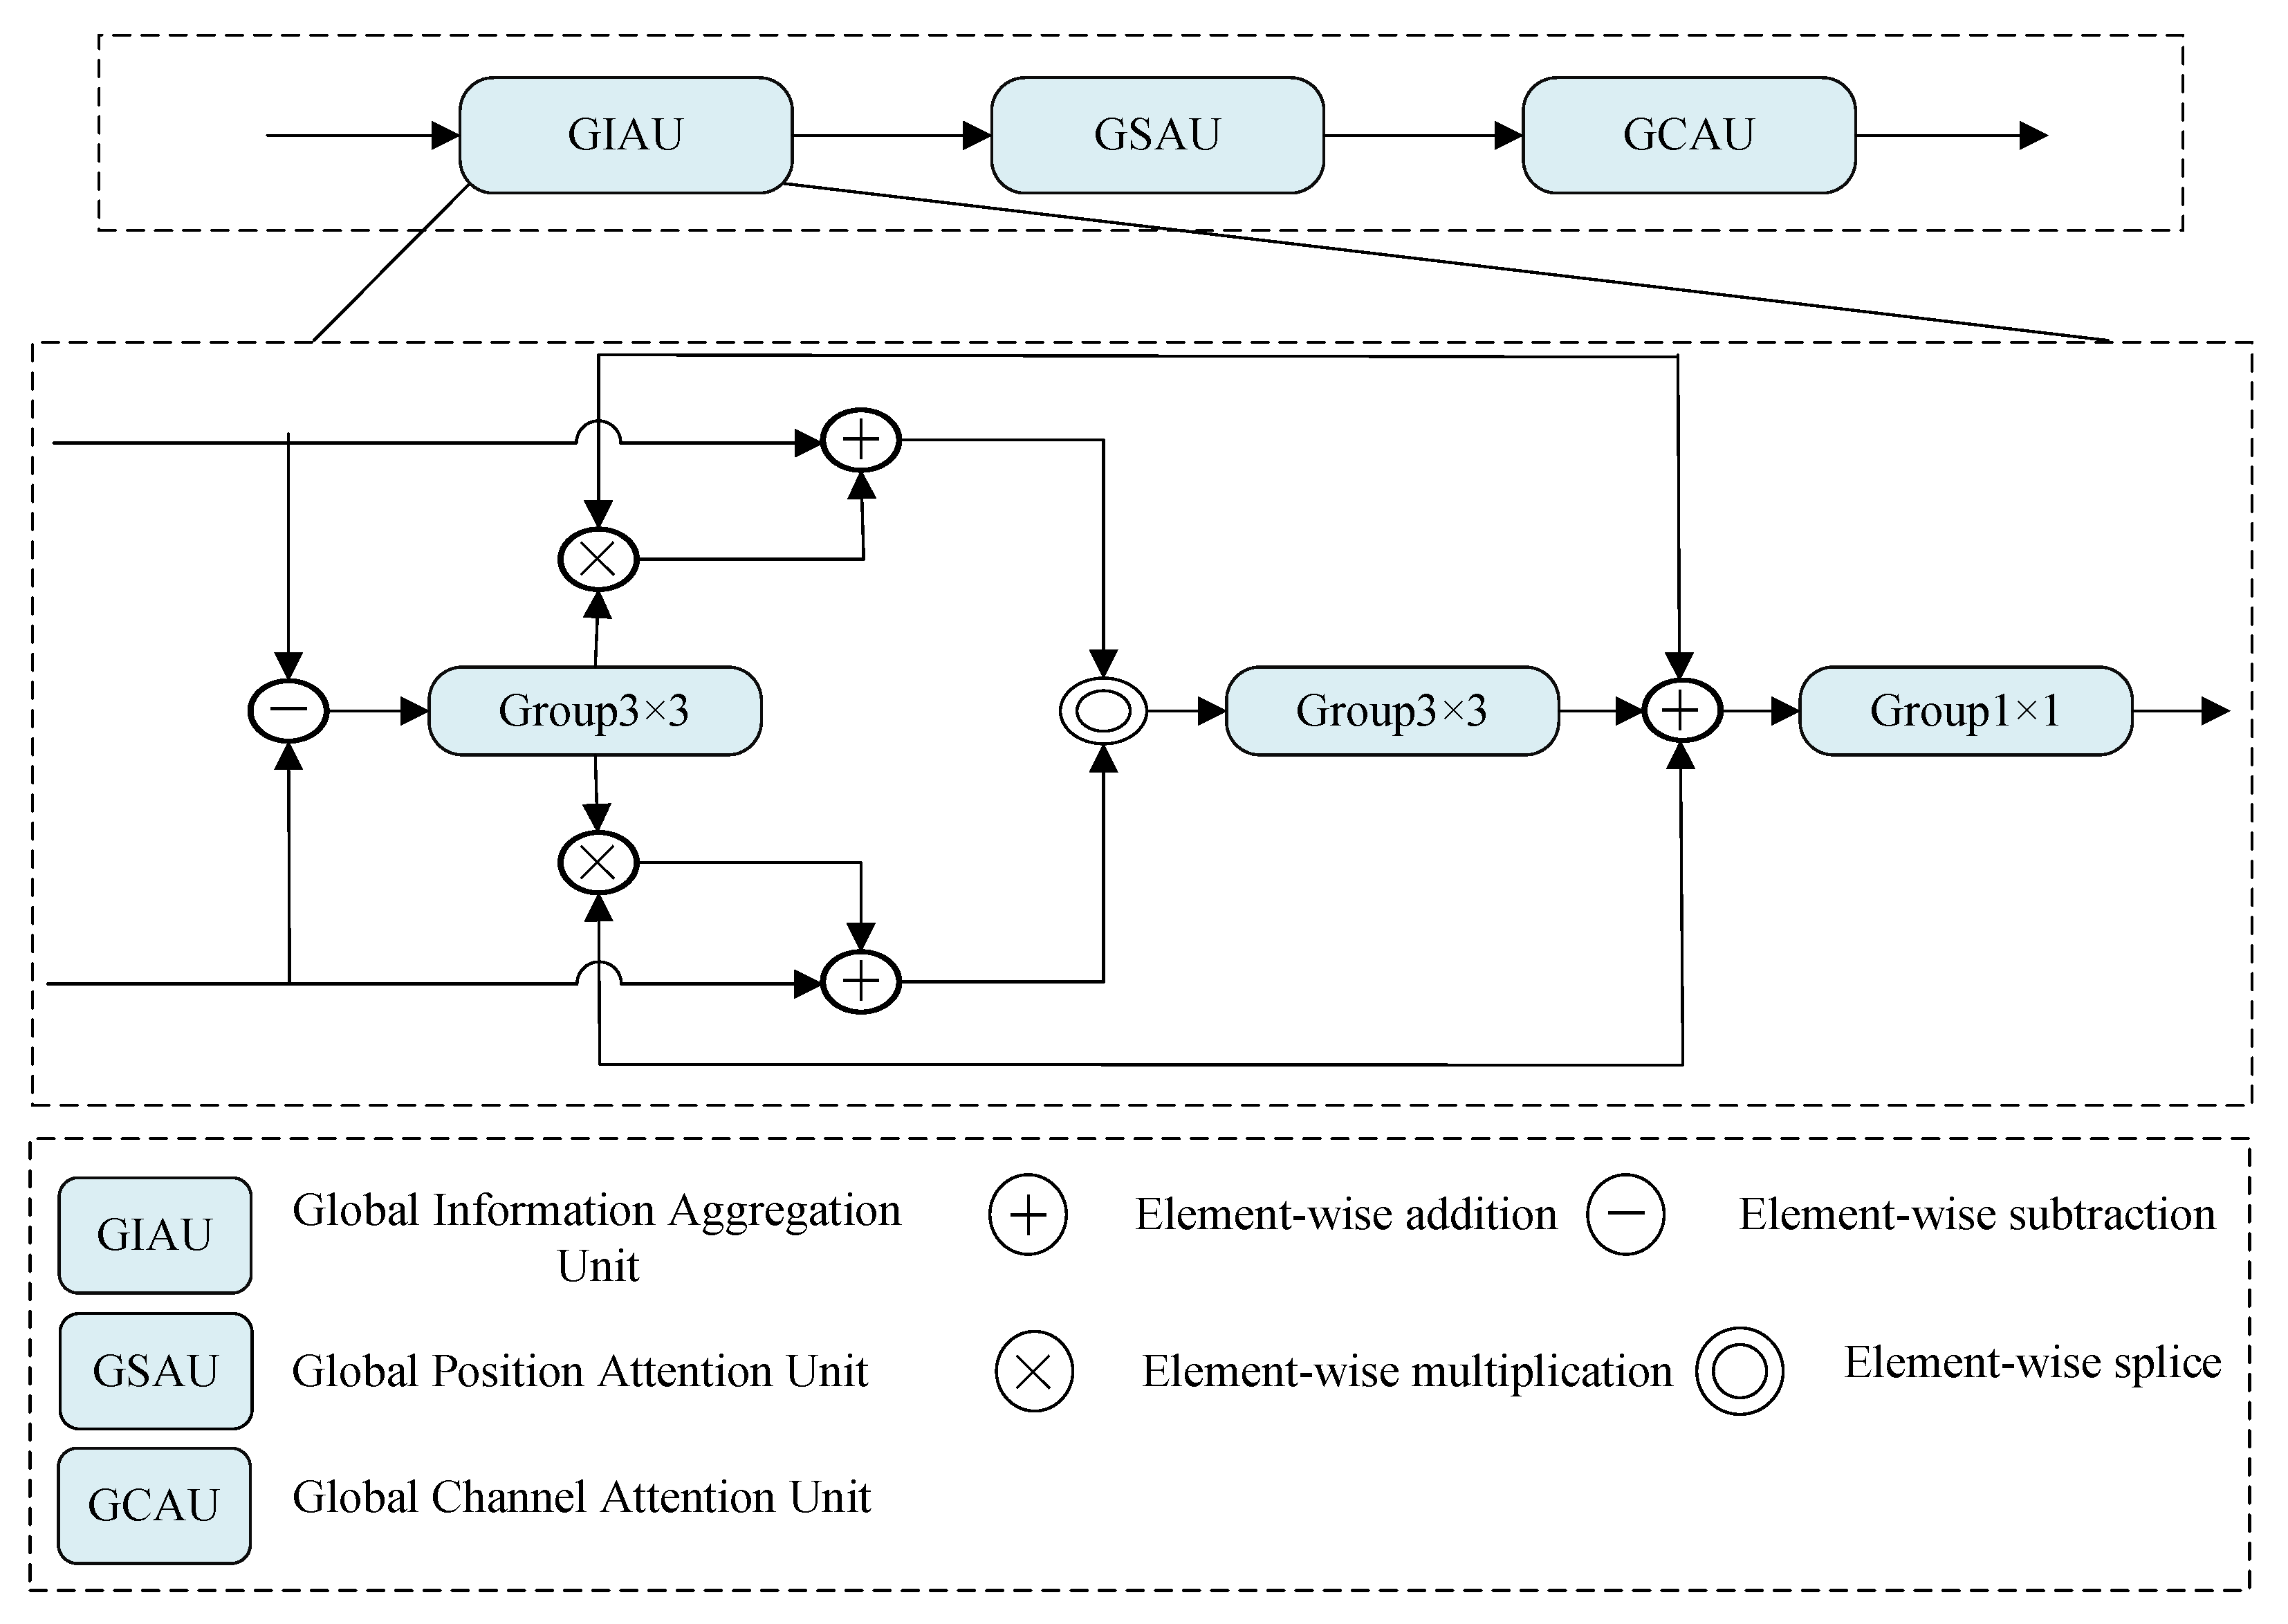
The unique aspect of change detection tasks lies in the handling of two remote sensing pictures taken at various times and the generation of a mask image that identifies the changed and unchanged regions. This implies that the two sets of feature information extracted by a pair of ResNets with shared weights need to be aggregated into one set of feature information that is strongly correlated with the changed regions. Furthermore, due to the difference in capture time, the two images often exhibit variations beyond the identified changed regions, such as shooting angle deviations, shadow effects, cloud cover, and seasonal vegetation changes. To extract the true changed regions from these noise sources, simple fusion approaches may lead to a loss of information integrity or even compromise the extracted feature information. We propose a novel Feature Fusion Unit (FFU) to perform the fusion and extraction of two sets of feature information. The FFU consists of three independent units and receives the feature sets extracted during the downsampling stage. To facilitate comprehensive interaction between these sets, we designed the Global Information Aggregation Unit (GIAU), which selectively extracts the information most relevant to the changed regions.
The GIAU is designed to handle variations in input remote sensing images, such as angular deviations, shadows, and seasonal changes. The core mechanism involves first subtracting features from the two images and applying a convolutional layer to compute the differences. These differences are used to calculate weights, which are then multiplied with the feature maps to enhance relevant change information. The operations in the GIAU, particularly the convolutional layer, enable the model to focus on the most significant changes, effectively addressing variations in environmental conditions. Furthermore, the selective extraction mechanism is enhanced by aggregating features from the two images, which helps to focus on genuine changes rather than noise or irrelevant variations.
Figure 2 shows a schematic diagram of the GIAU, where the inputs of the GIAU are set to
and
. First, we subtract
and
and then send the result to a
convolutional layer that keep the number of channels. Then, we use the output of the
convolutional layer as the weight to multiply the two input information and add the inputs
and
. Afterwards, the obtained two pieces of information are sent to the
convolutional layer, in which the number of channels is halved in the channel dimension. Finally, the output of the convolutional layer with the number of channels is halved, and the first two pieces of input information are added and sent to the
convolutional layer without changing the number of channels to obtain the final output
. The specific arithmetic expression is as follows:
where
represents the absolute value operation, and
represents the concatenation along the channel dimension.
2.3. Global Spatial Attention Unit (GSAU)
Self-attention possesses powerful capabilities for global information extraction by computing the relationships between each pixel and the other pixels in an image. However, this computation approach can lead to significant memory consumption. Furthermore, as mentioned earlier, the feature maps often contain a significant amount of noise and interference for various reasons. If a straightforward and coarse application of self-attention is used to attend to global information, it can lead to efficiency issues. Therefore, we propose the Global Spatial Attention Unit (GSAU), which retains the global information extraction capabilities of self-attention while reducing memory consumption.
Figure 3 shows a schematic diagram of the GSAU, where the input of the GSAU is set to
. First,
f is sent to the pooling layer that is globally averaged in the horizontal and vertical directions to obtain
and
; then, we perform dimension extrusion on
and
to obtain
and
. Then, we send
and
to two multi-head self-attention modules to obtain
and
, and we perform dimension expansion on
and
to obtain
and
. Then, we use the broadcast mechanism to sum
and
and multiply them by
f. Finally, the product is convolved with
and then added to itself to obtain the final output
. The specific arithmetic expression is as follows:
In this context, represents the multi-head self-attention module, denotes the dimension compression along the vertical direction, denotes the dimension compression along the horizontal direction, represents the dimension expansion along the vertical direction, and represents the dimension expansion along the horizontal direction.
2.4. Global Channel Attention Unit (GCAU)
The GCAU utilizes self-attention to achieve global information extraction on feature maps. However, it cannot simultaneously attend to the information between different feature maps. From
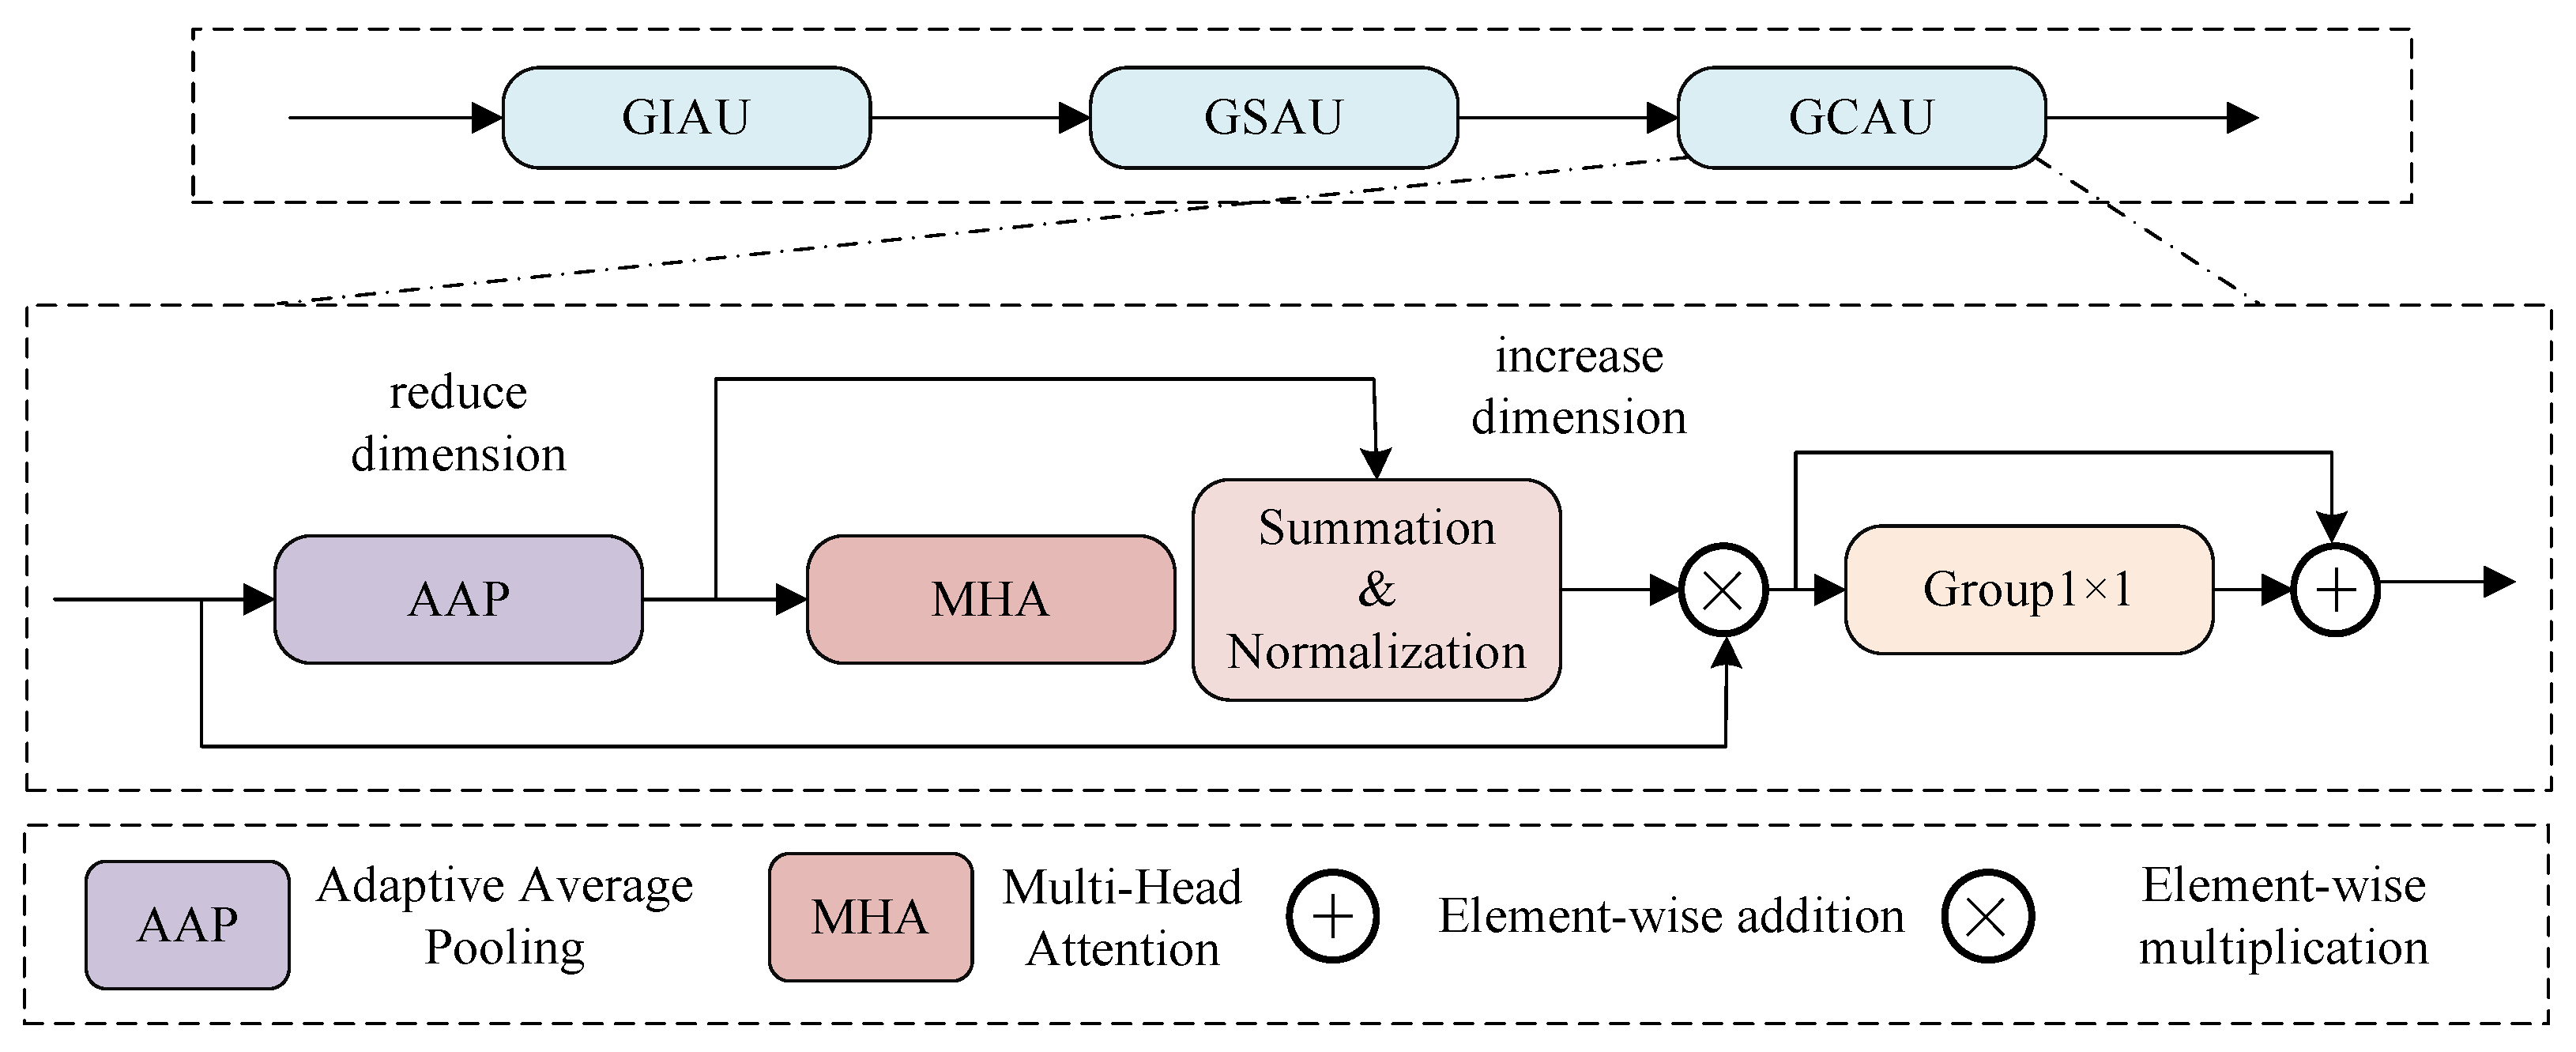
Table 1, it is evident that the channel numbers of the feature maps propagated to the FFU range from 64 to 512. To capture the information between different feature maps at various levels, we propose the GCAU. Similar to the GSAU, we introduce self-attention in the GCAU to explore the information between all the feature maps. Subsequently, this information is used as weights to assign to the original information, thereby enhancing the model’s focus on feature maps containing change-related information.
A schematic diagram of the GCAU is shown in
Figure 4, and the input of the GCAU is set to
. First, we send
f to the global average pooling to obtain
; then, we perform dimension compression on
and transpose it to obtain
; then, we send
to the output obtained in the multi-head self-attention module as the weight, and we also use
f for multiplication. Finally, the product is convolved with
and then added to itself to obtain the final output
. The specific arithmetic expression is as follows:
where
represents the dimension compression operation,
represents the transpose operation on the tensor, and
represents the multi-head sub-attention module.
2.5. Pooling Refinement Unit (PRU)
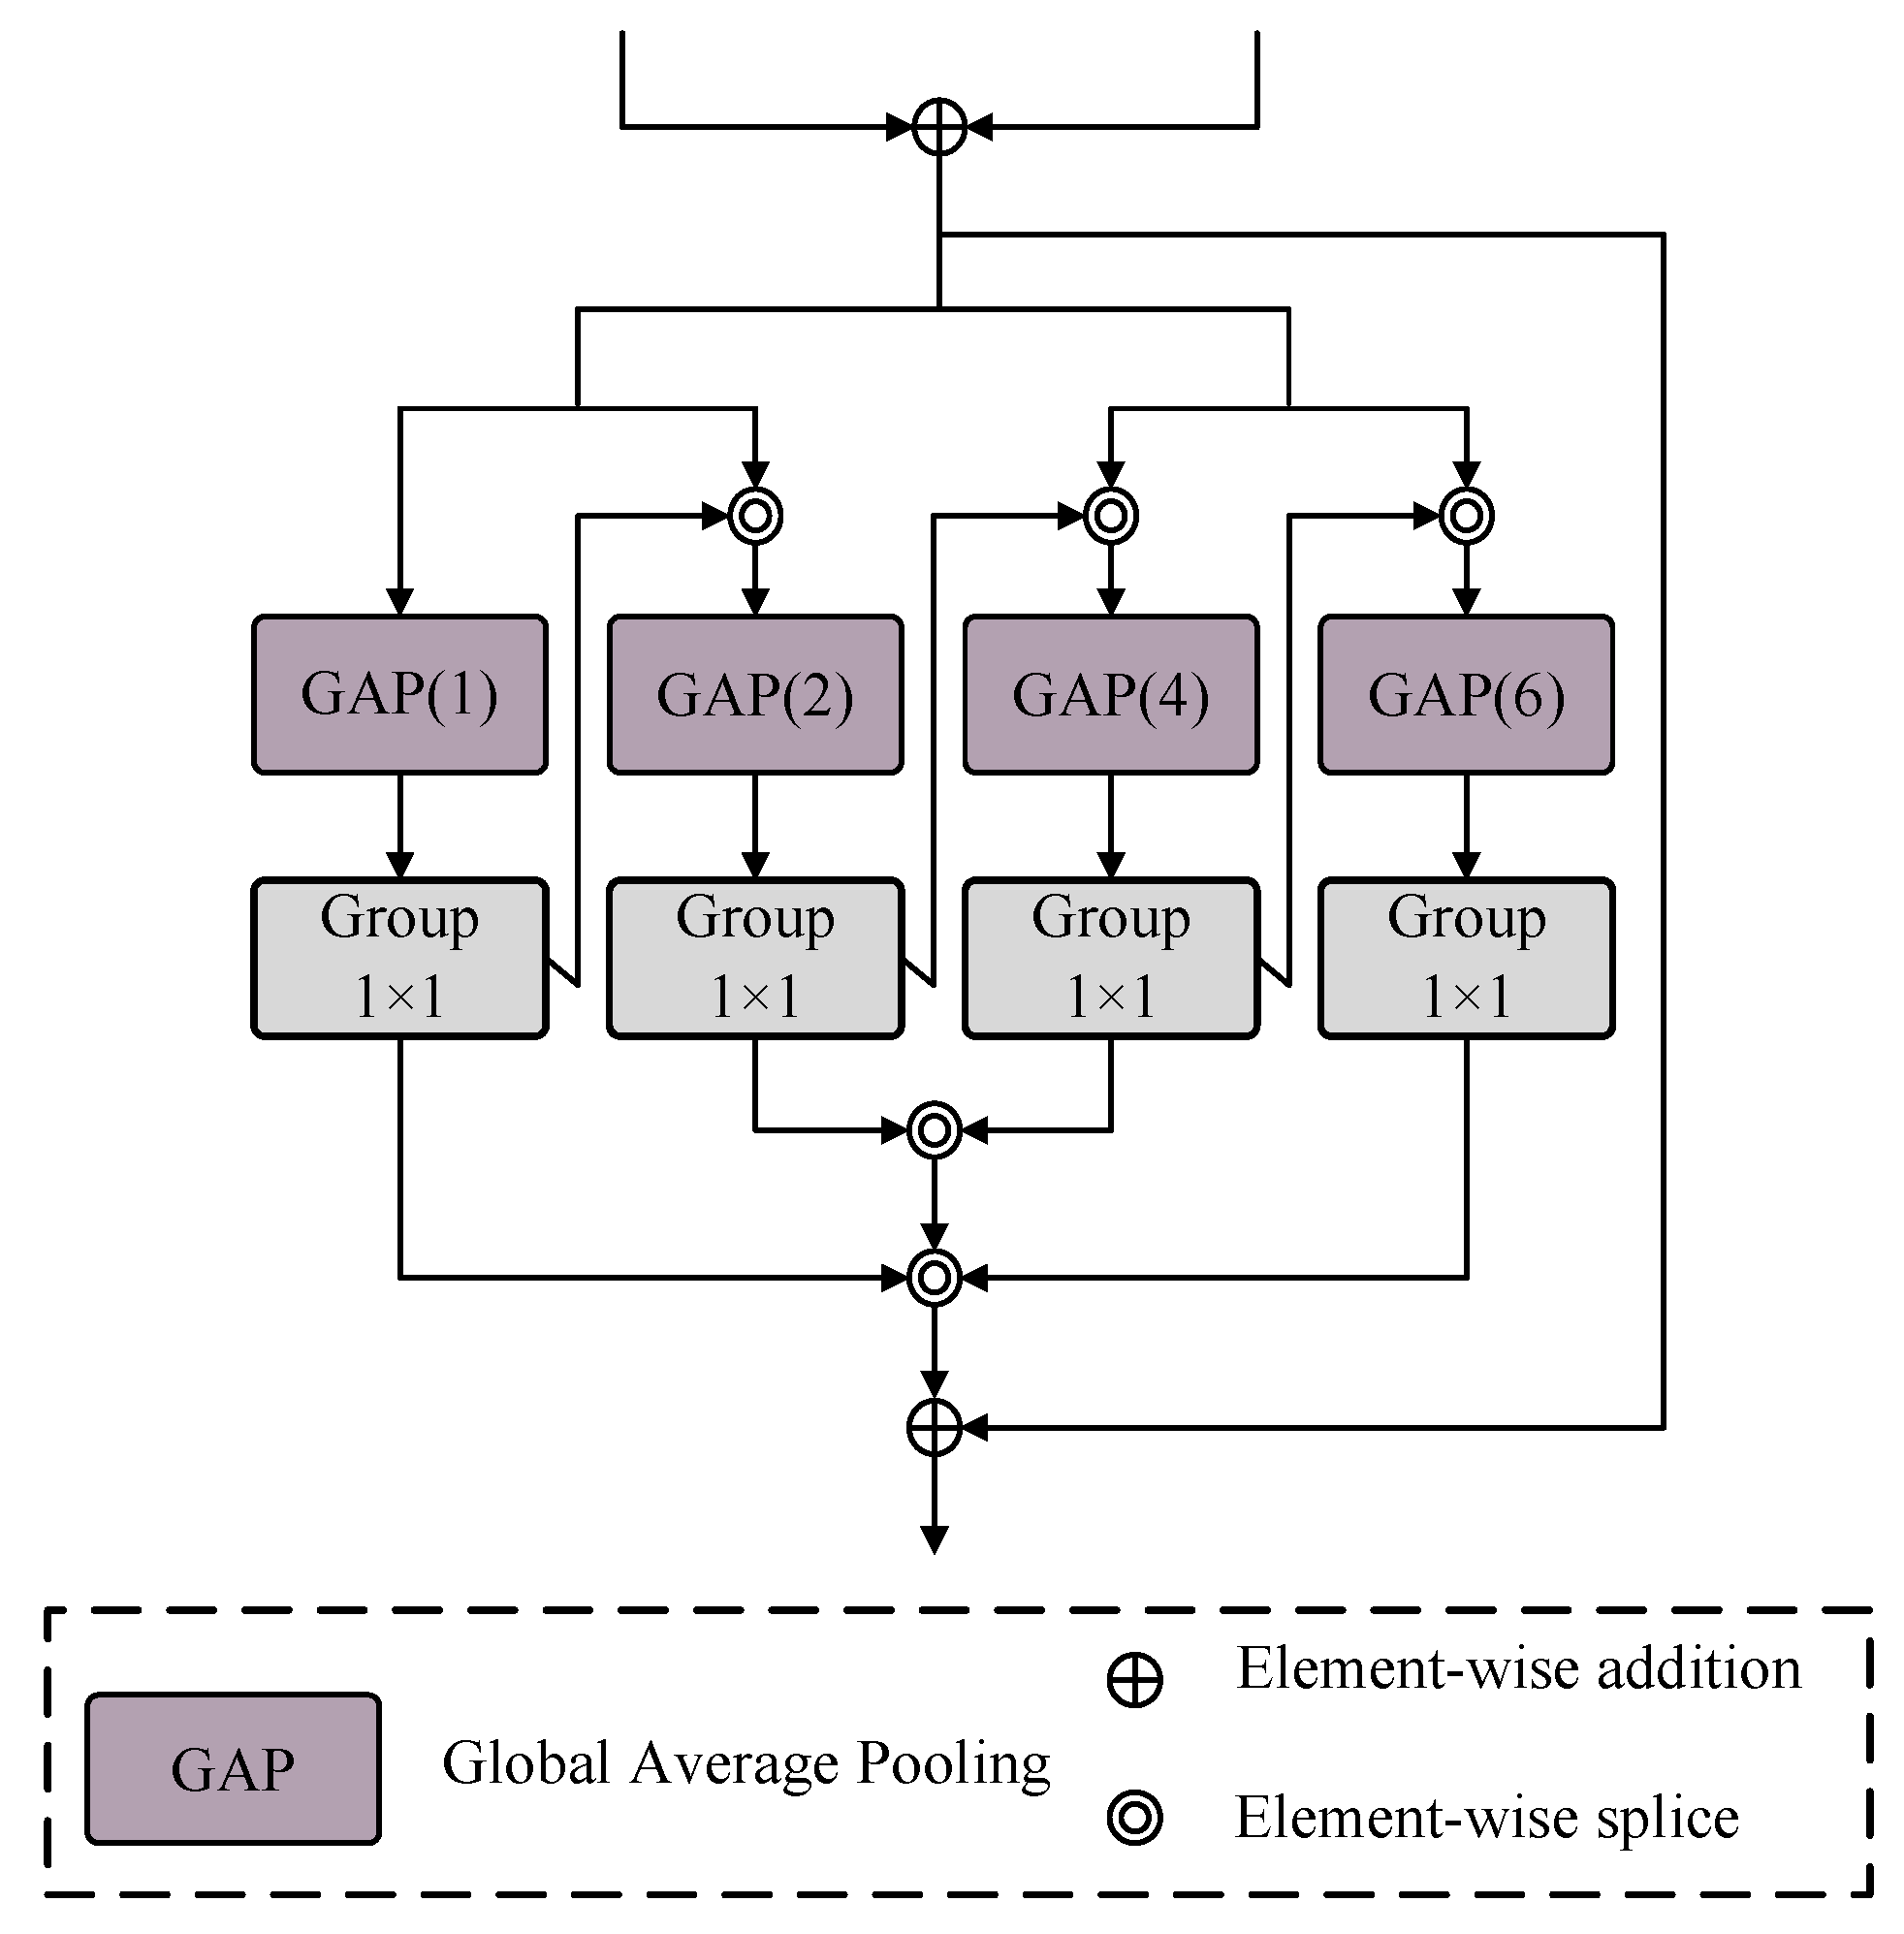
As the depth of the ResNet increases, the receptive field of the model also expands. In the feature maps extracted by the lower-level networks, a single pixel often represents the result of convolutions over a spatial region in the original image. Therefore, these feature maps contain rich spatial position information. To extract and refine this spatial position information, we propose the Pooling Refinement Unit (PRU). The PPM [
23] module applies different convolutions on the original feature map to obtain multiple feature maps of different sizes. These feature maps are then concatenated together. This approach utilizes the mutual guidance of context to enhance the model’s prediction accuracy. However, it tends to overlook pixel-level local details. Building on its advantages, we utilized four pooling layers to extract the contextual information from the feature maps at the lowest layer of the network. At this stage, the feature maps themselves are at the pixel level, thereby mitigating the drawback of overlooking local details. Furthermore, we strengthened the guidance of context by concatenating the output of the pooling layer with a smaller pooling kernel and the original input along the channel dimension. This concatenation effectively guides the pooling layer with a larger pooling kernel, enabling it to capture richer contextual information.
A schematic diagram of the PRU is shown in
Figure 5, and the input of the PRU is set to
; we sum
and
to obtain
f. First, we send
f to the pooling layer with a core of 1; then, the result is concatenated with
f and sent to the pooling layer with a core of 2 and a convolution of
. After that, the result is concatenated with
f and sent to the pooling layer with a core of 4 and a convolution of
. Similarly, the result is concatenated with
f and sent to a pooling layer with a core of 6 and a convolution of
. Finally, the results of the four convolutional layers are concatenated in the channel dimension and added to the original input to obtain the final output
. The specific arithmetic expression is as follows:
where
indicates splicing in the channel dimension;
indicates the average pooling with the pooling core as
a.
4. Experiment
4.1. Introduction to Experimental Indicators
In this study, we employed several commonly used metrics, including the
PR,
RC,
IoU, and
F1 score, to assess the performance of the model. Their mathematical formulas are as follows:
Here,
TP stands for true positive,
FN for false negative,
FP for false positive, and
TN for true negative. The Poly strategy can dynamically adjust the learning rate, and this paper adopts this strategy for learning rate scheduling. The Poly strategy’s specific mathematical representation is as follows:
In the above formula, represents the current learning rate, is the base learning rate, e is the current iteration, is the maximum number of iterations, and p is the decay exponent.
4.2. Experimental Parameter Settings
We conducted all experiments using the PyTorch deep learning framework on a single RTX 3080Ti graphics card. The appropriate learning rate is crucial for the training process. Using a larger learning rate at the beginning of the training process can accelerate the convergence of the model. However, if the learning rate remains too large, the model may fail to converge. In such cases, using a smaller learning rate would be more appropriate. In all the experiments conducted in this paper, was set to 0.0015, was set to 200, and p was set to 0.95. Adam is the optimization algorithm employed in this work. We used BCEWithLogitsLoss as the loss function.
Additionally, we set the batch size to 8 for training on the 512 × 512 pixel BTRS-CD dataset and to 16 for training on the 256 × 256 pixel dataset.
We performed ablation experiments on the two datasets to further validate our network. The specific experimental results are presented in
Table 2.
The experimental results in the first five rows represent the performance of progressively adding modules on top of the backbone network. The last row represents the results obtained by introducing parameter freezing in the network. The ablation experiments on the two datasets demonstrate that the proposed method in our network can improve its performance, leading to the following conclusions:
The PRU module extracts contextual semantic information from the bottom-level feature maps to guide the recovery of the mask. On the two datasets, the PRU improved the IOU metric by 0.84% and 1.12%, respectively, and the F1 metric by 0.97% and 0.68%, respectively. The GIAU is used to aggregate the two sets of feature information obtained from each level and extract the information strongly related to the change region. The GIAU improved the IOU metric by 0.97% and 1.40%, respectively, and the F1 metric by 0.74% and 1.17%, respectively. The GSAU provides the model with global attention capability, enhancing the model’s global focus on change information at the image level. The GSAU improved the IOU metric by 0.81% and 0.50%, respectively, and the F1 metric by 0.75% and 0.28%, respectively. The GCAU provides the model with global attention capability in the channel dimension, allowing the model to focus more on feature maps that contain change information. The GCAU improved the IOU metric by 0.55% and 0.51%, respectively, and the F1 metric by 0.37% and 0.21%, respectively. Net_F is the introduced parameter-freezing method in the complete network, which provides a structure similar to residual networks to re-fit the difference between predicted values and ground truth. This method improved the IOU metric by 0.30% and 0.38%, respectively, and the F1 metric by 0.21% and 0.11%, respectively.
4.3. Comparative Experiment
Comparative experiments can further demonstrate the performance of the model. Additionally, conducting experiments on different datasets can verify the robustness of the model. We conducted comparative experiments on two datasets, and the specific values of all parameters involved in the experiments are presented in
Section 4.2. To make the experimental setup more compelling, we selected CNN-based and Transformer-based change detection methods as baselines. The descriptions of these networks are as follows:
The three networks of FC-EF, FC-Siam-Conc, and FC-Siam-Diff come from the same article. The author first proposed the Siamese structure of shared weights. TCDNet [
25], SNUNet [
26], MFGAN [
27], STANet [
28], DASNet [
29], TFI-GR [
30], and ChangeNet [
31] are CNN-based change detection methods proposed in recent years. BIT [
19] and ChangeFormer [
32] are change detection methods proposed in recent years, which combine the CNN and Transformer.
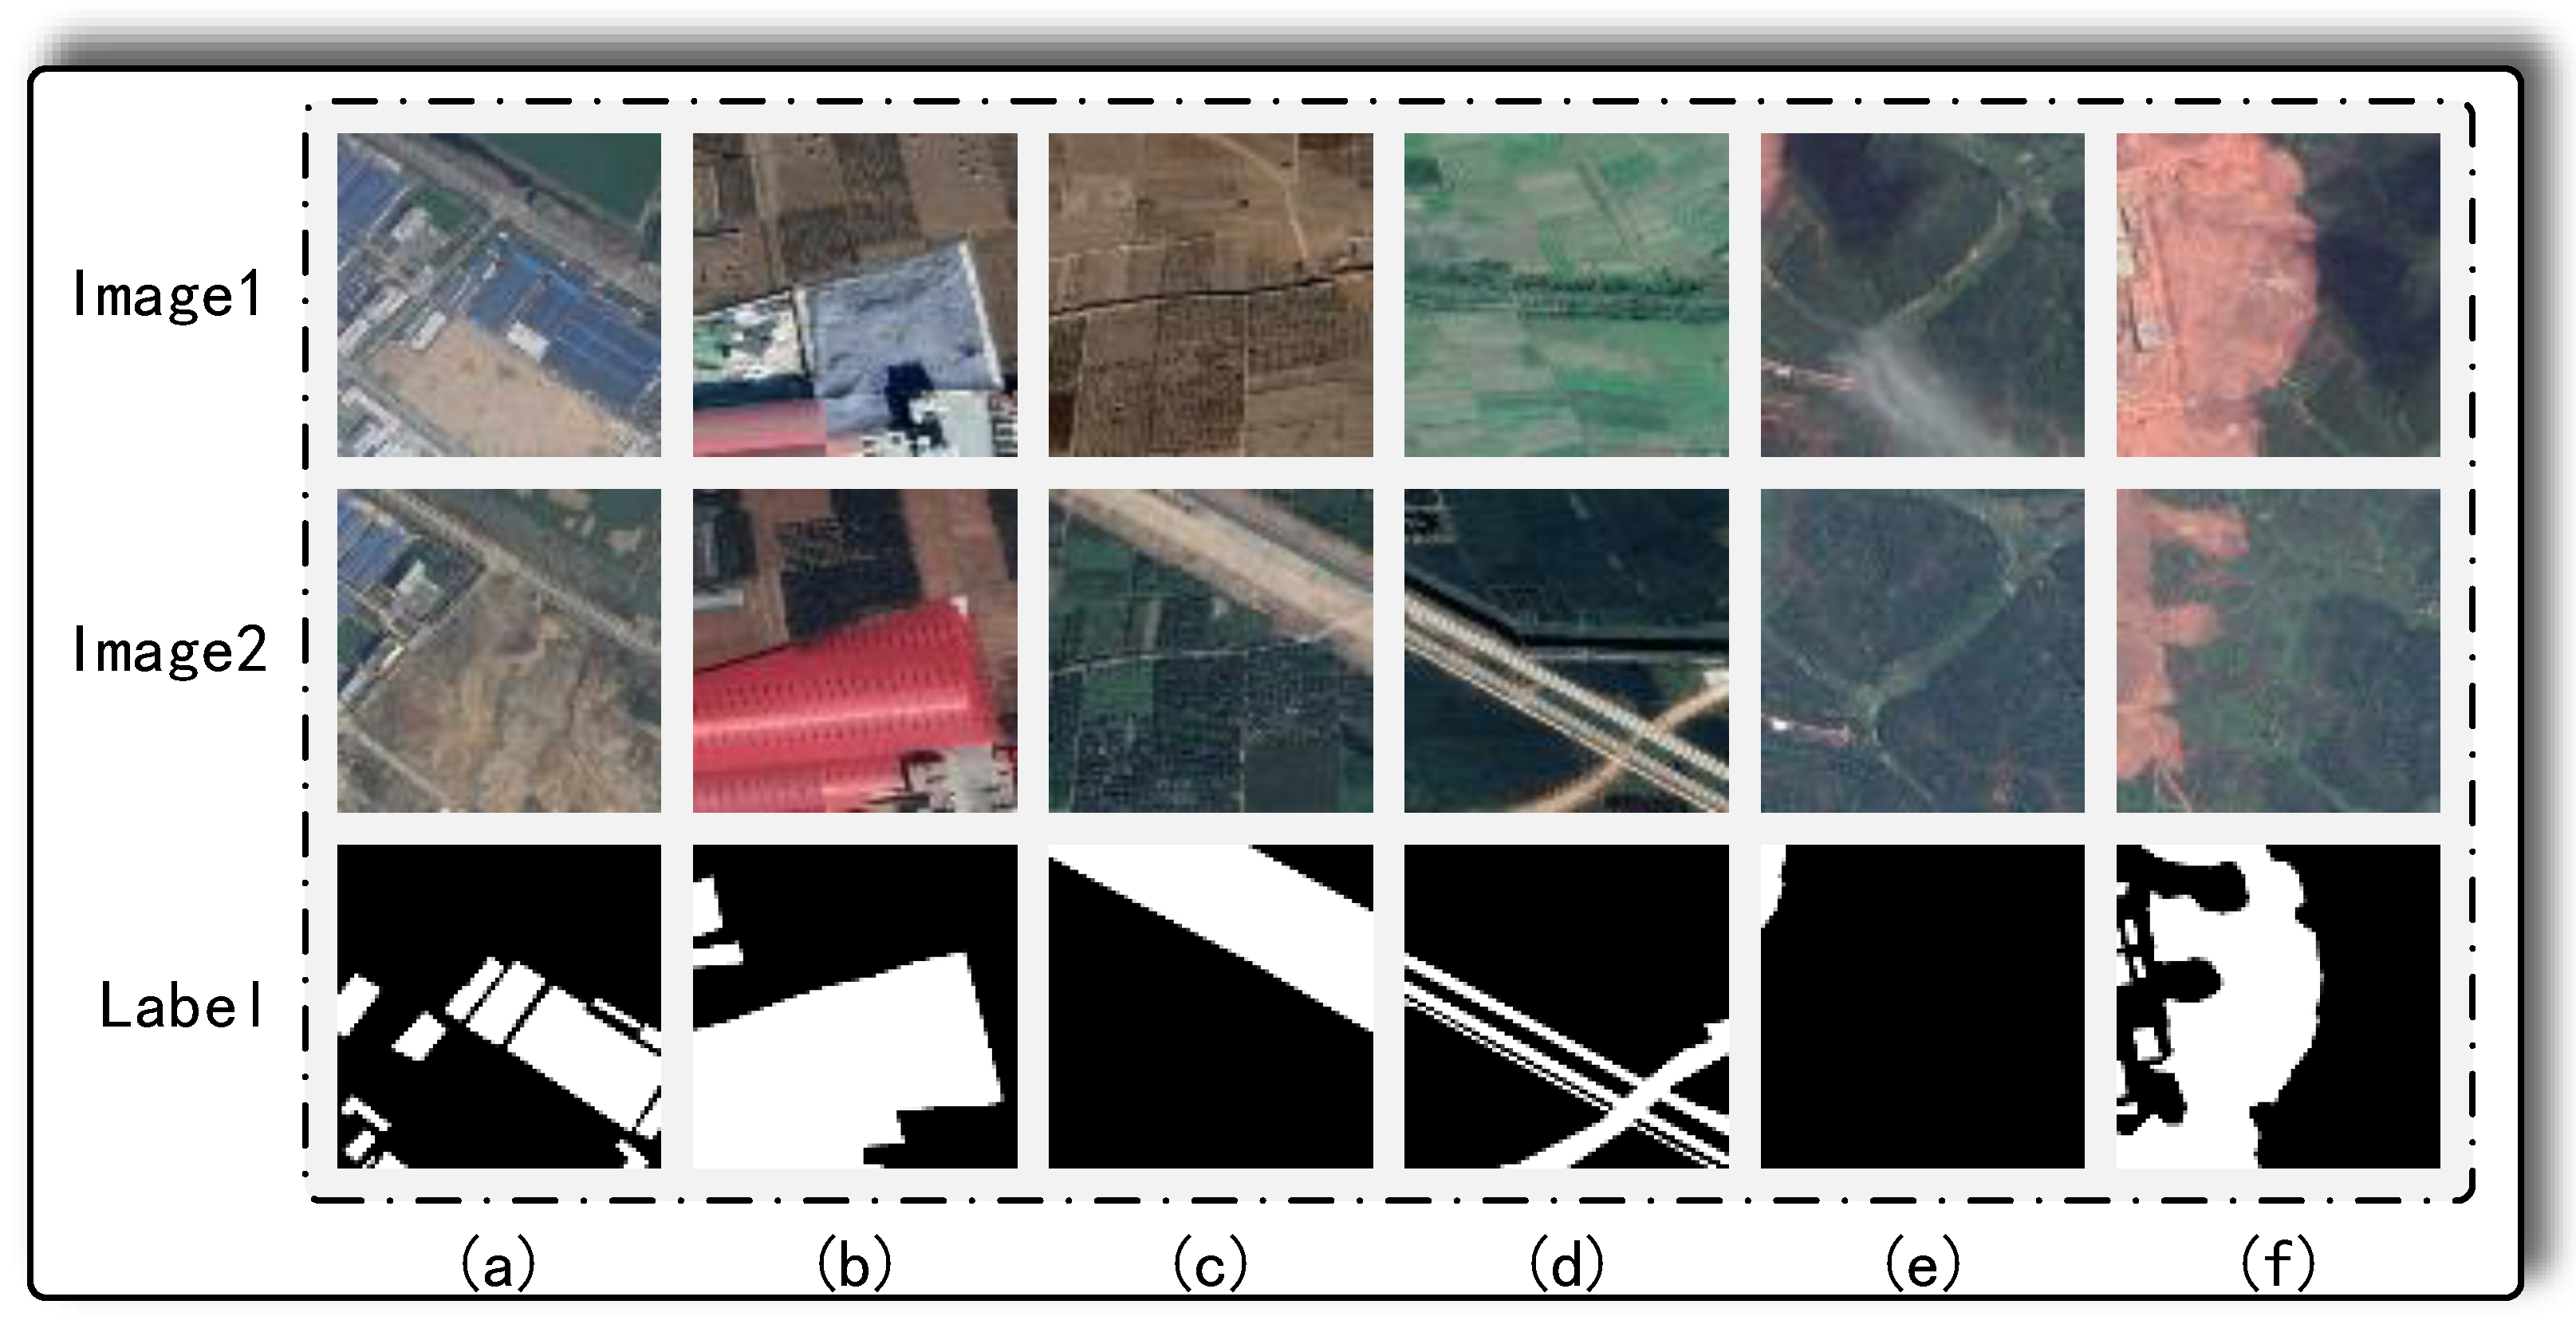
4.3.1. Comparative Experiments on the BTRS-CD Dataset
The details of the comparison tests on the BTRS-CD dataset are provided in
Table 3. In the data presented in
Table 3, it is evident that ZAQNet achieved superior accuracy on the BTRS_CD dataset, surpassing other networks by at least 1.63% and 1.75% in terms of the
IOU and
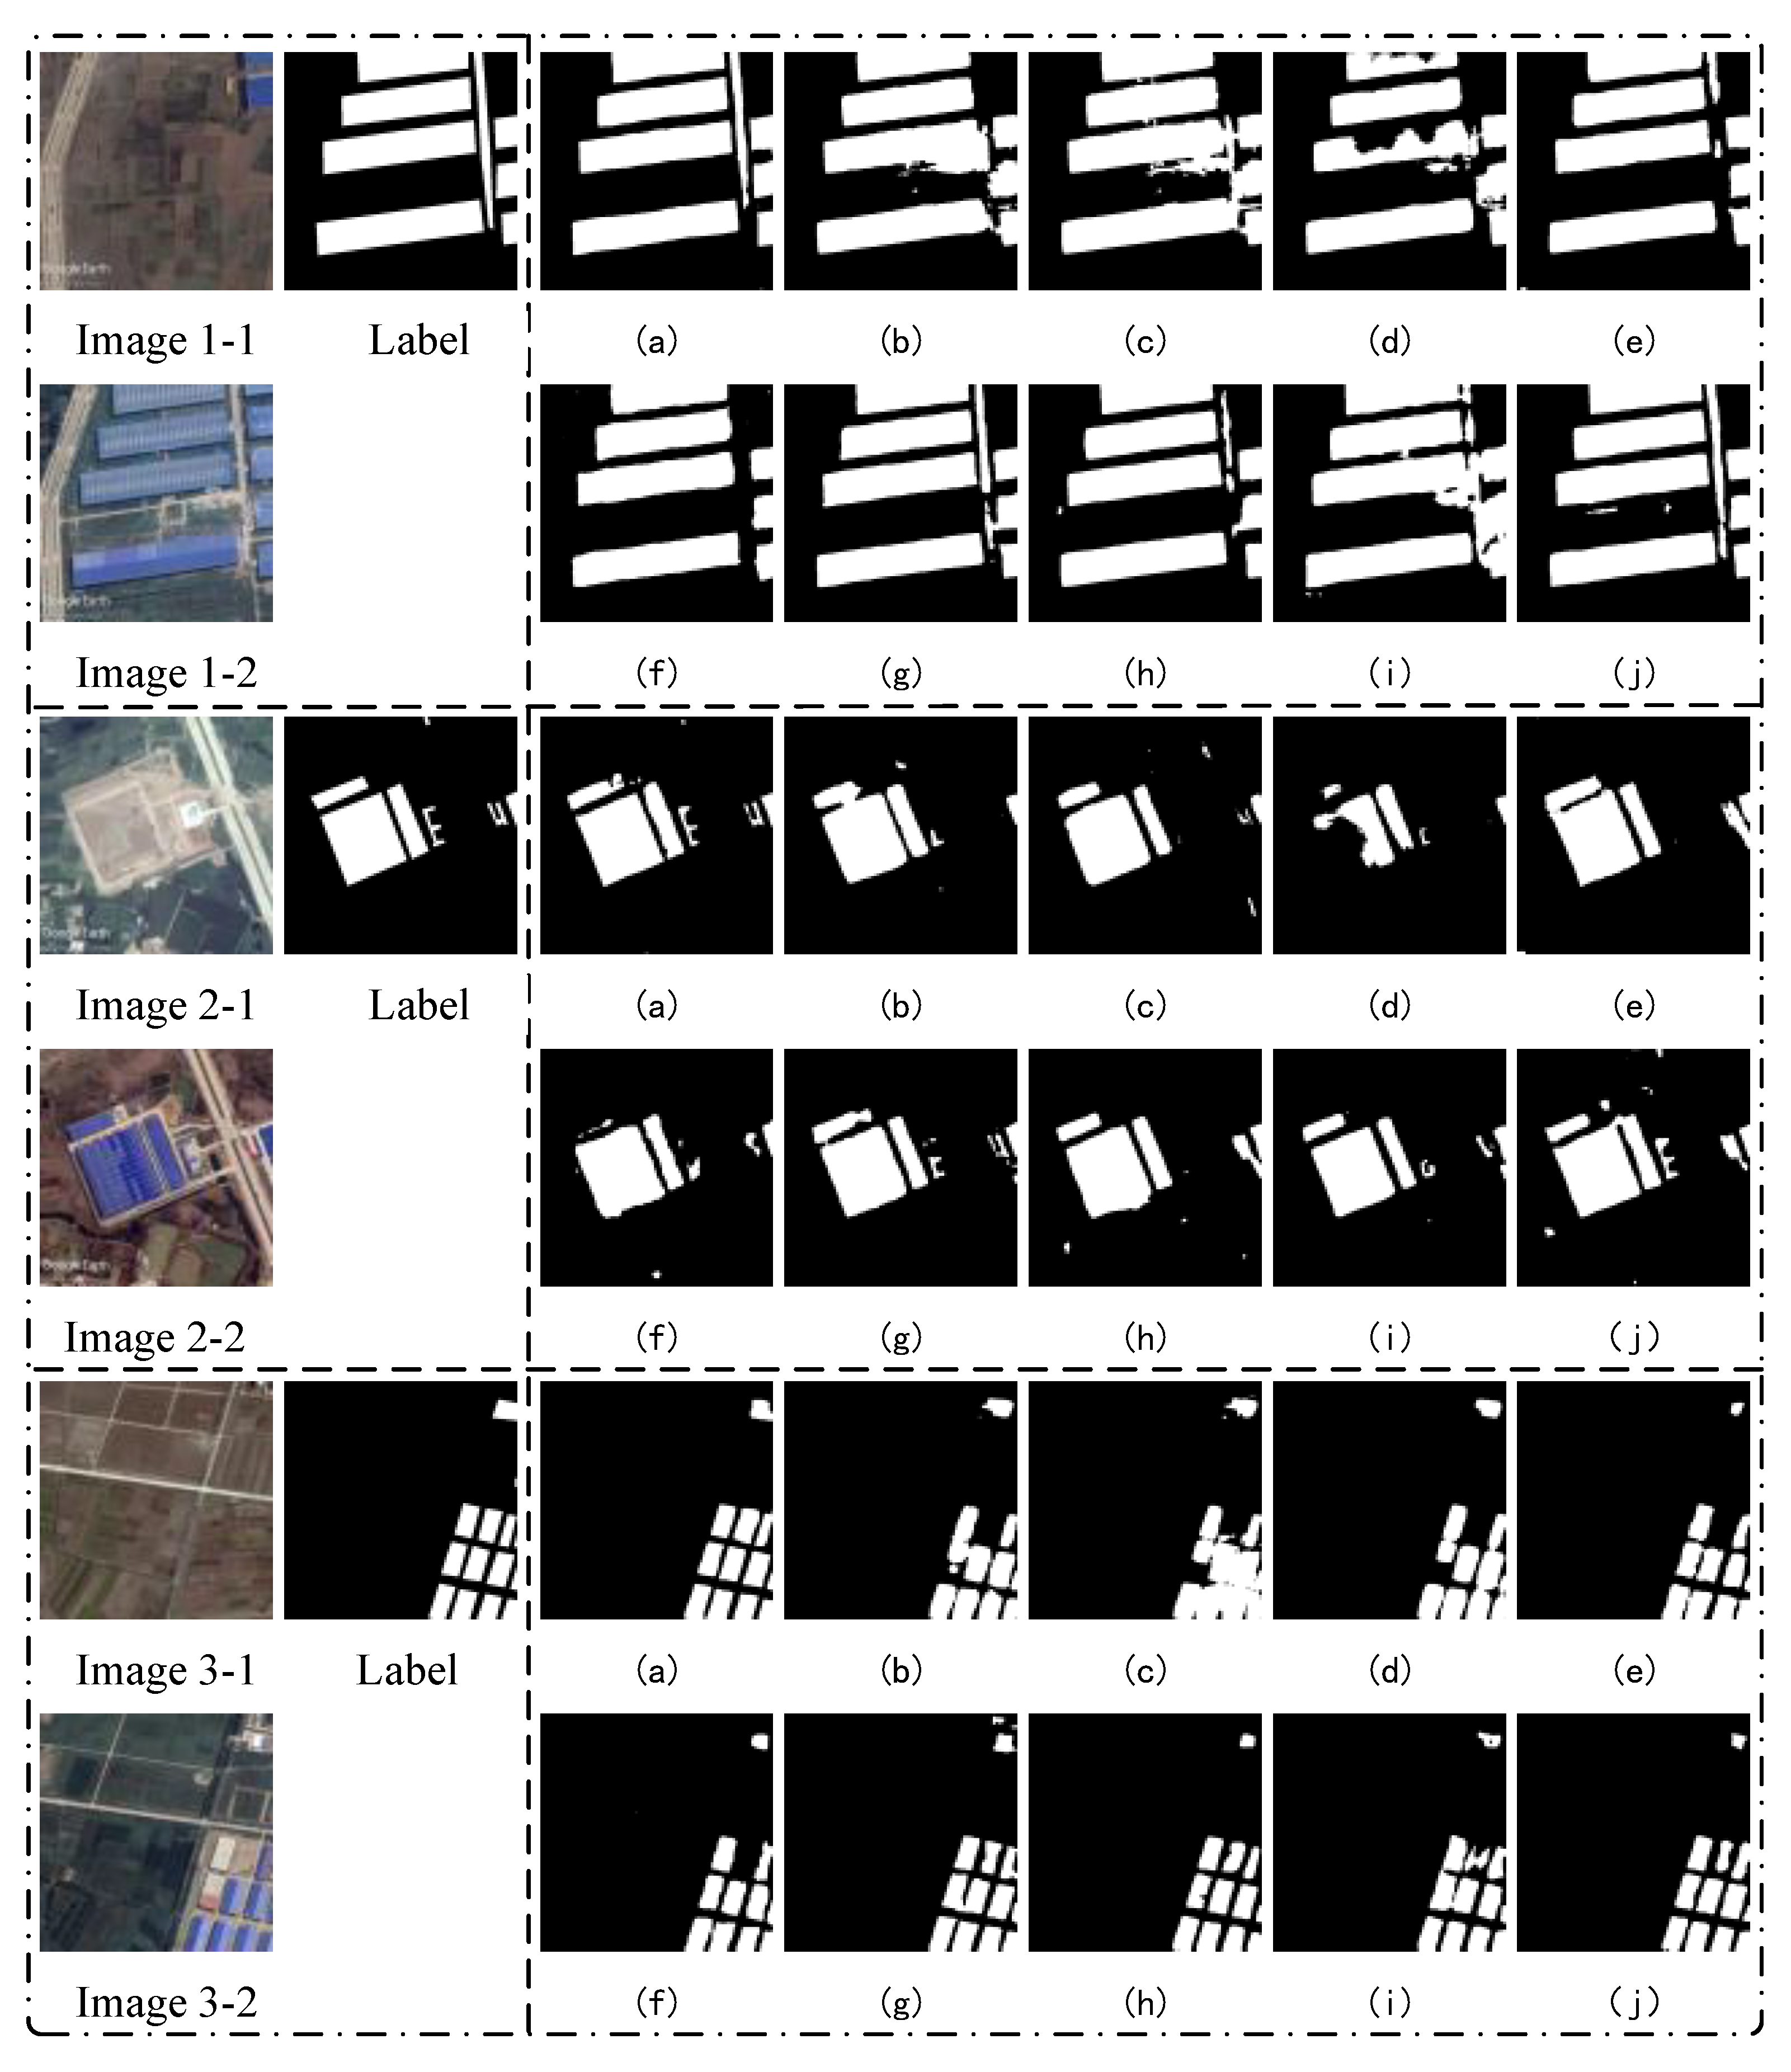
F1 scores, respectively. To further illustrate the performance of the models, we visualized the results of each network on the BTRS_CD dataset. The specific visualizations are shown in
Figure 8.
In
Figure 8, the first set of comparison images shows larger and regular changed regions. The second set of comparison images includes challenging details in the changed regions. The third set of comparison images depicts densely distributed and small changed regions. As can be seen by looking at the visualizations in these three sets of comparison photographs, our network performed the best, efficiently collecting the details of the changing regions.
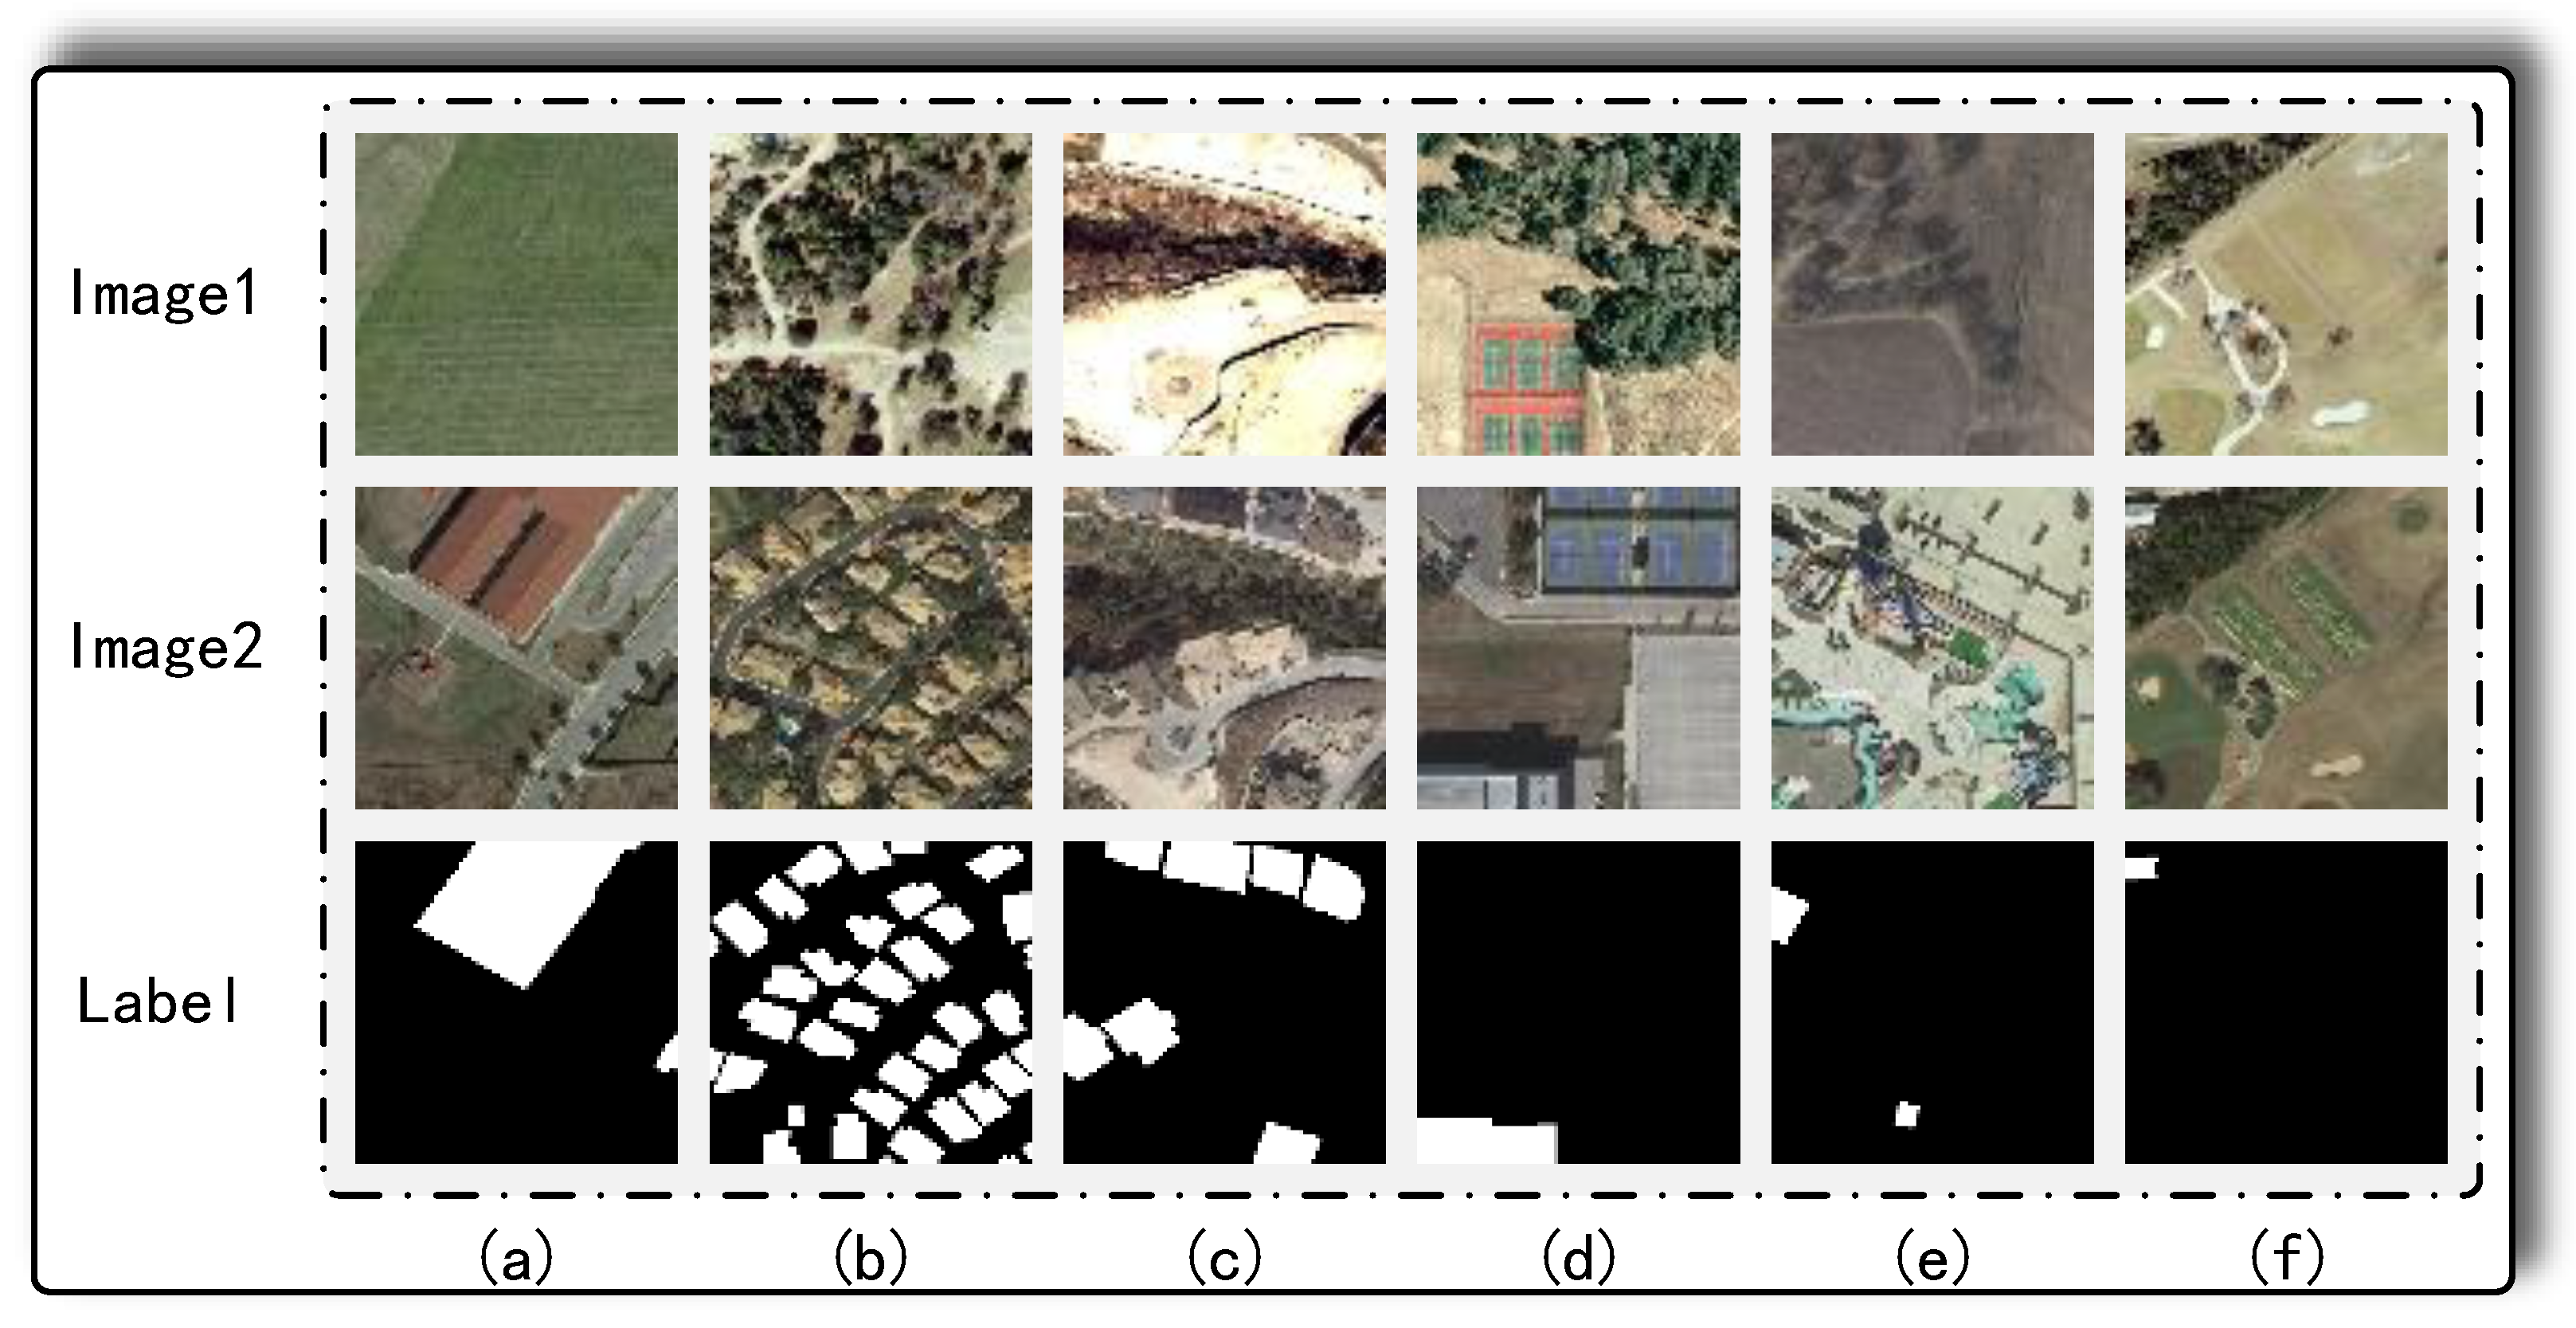
4.3.2. Comparative Experiments on the LEVIR-CD Dataset
Additionally, we conducted comparative experiments on the LEVIR-CD dataset, and the specific experimental results are presented in
Table 4. In
Table 4, our network achieved the best accuracy, specifically outperforming the other networks by at least 0.58% in the
IOU and 0.36% in the
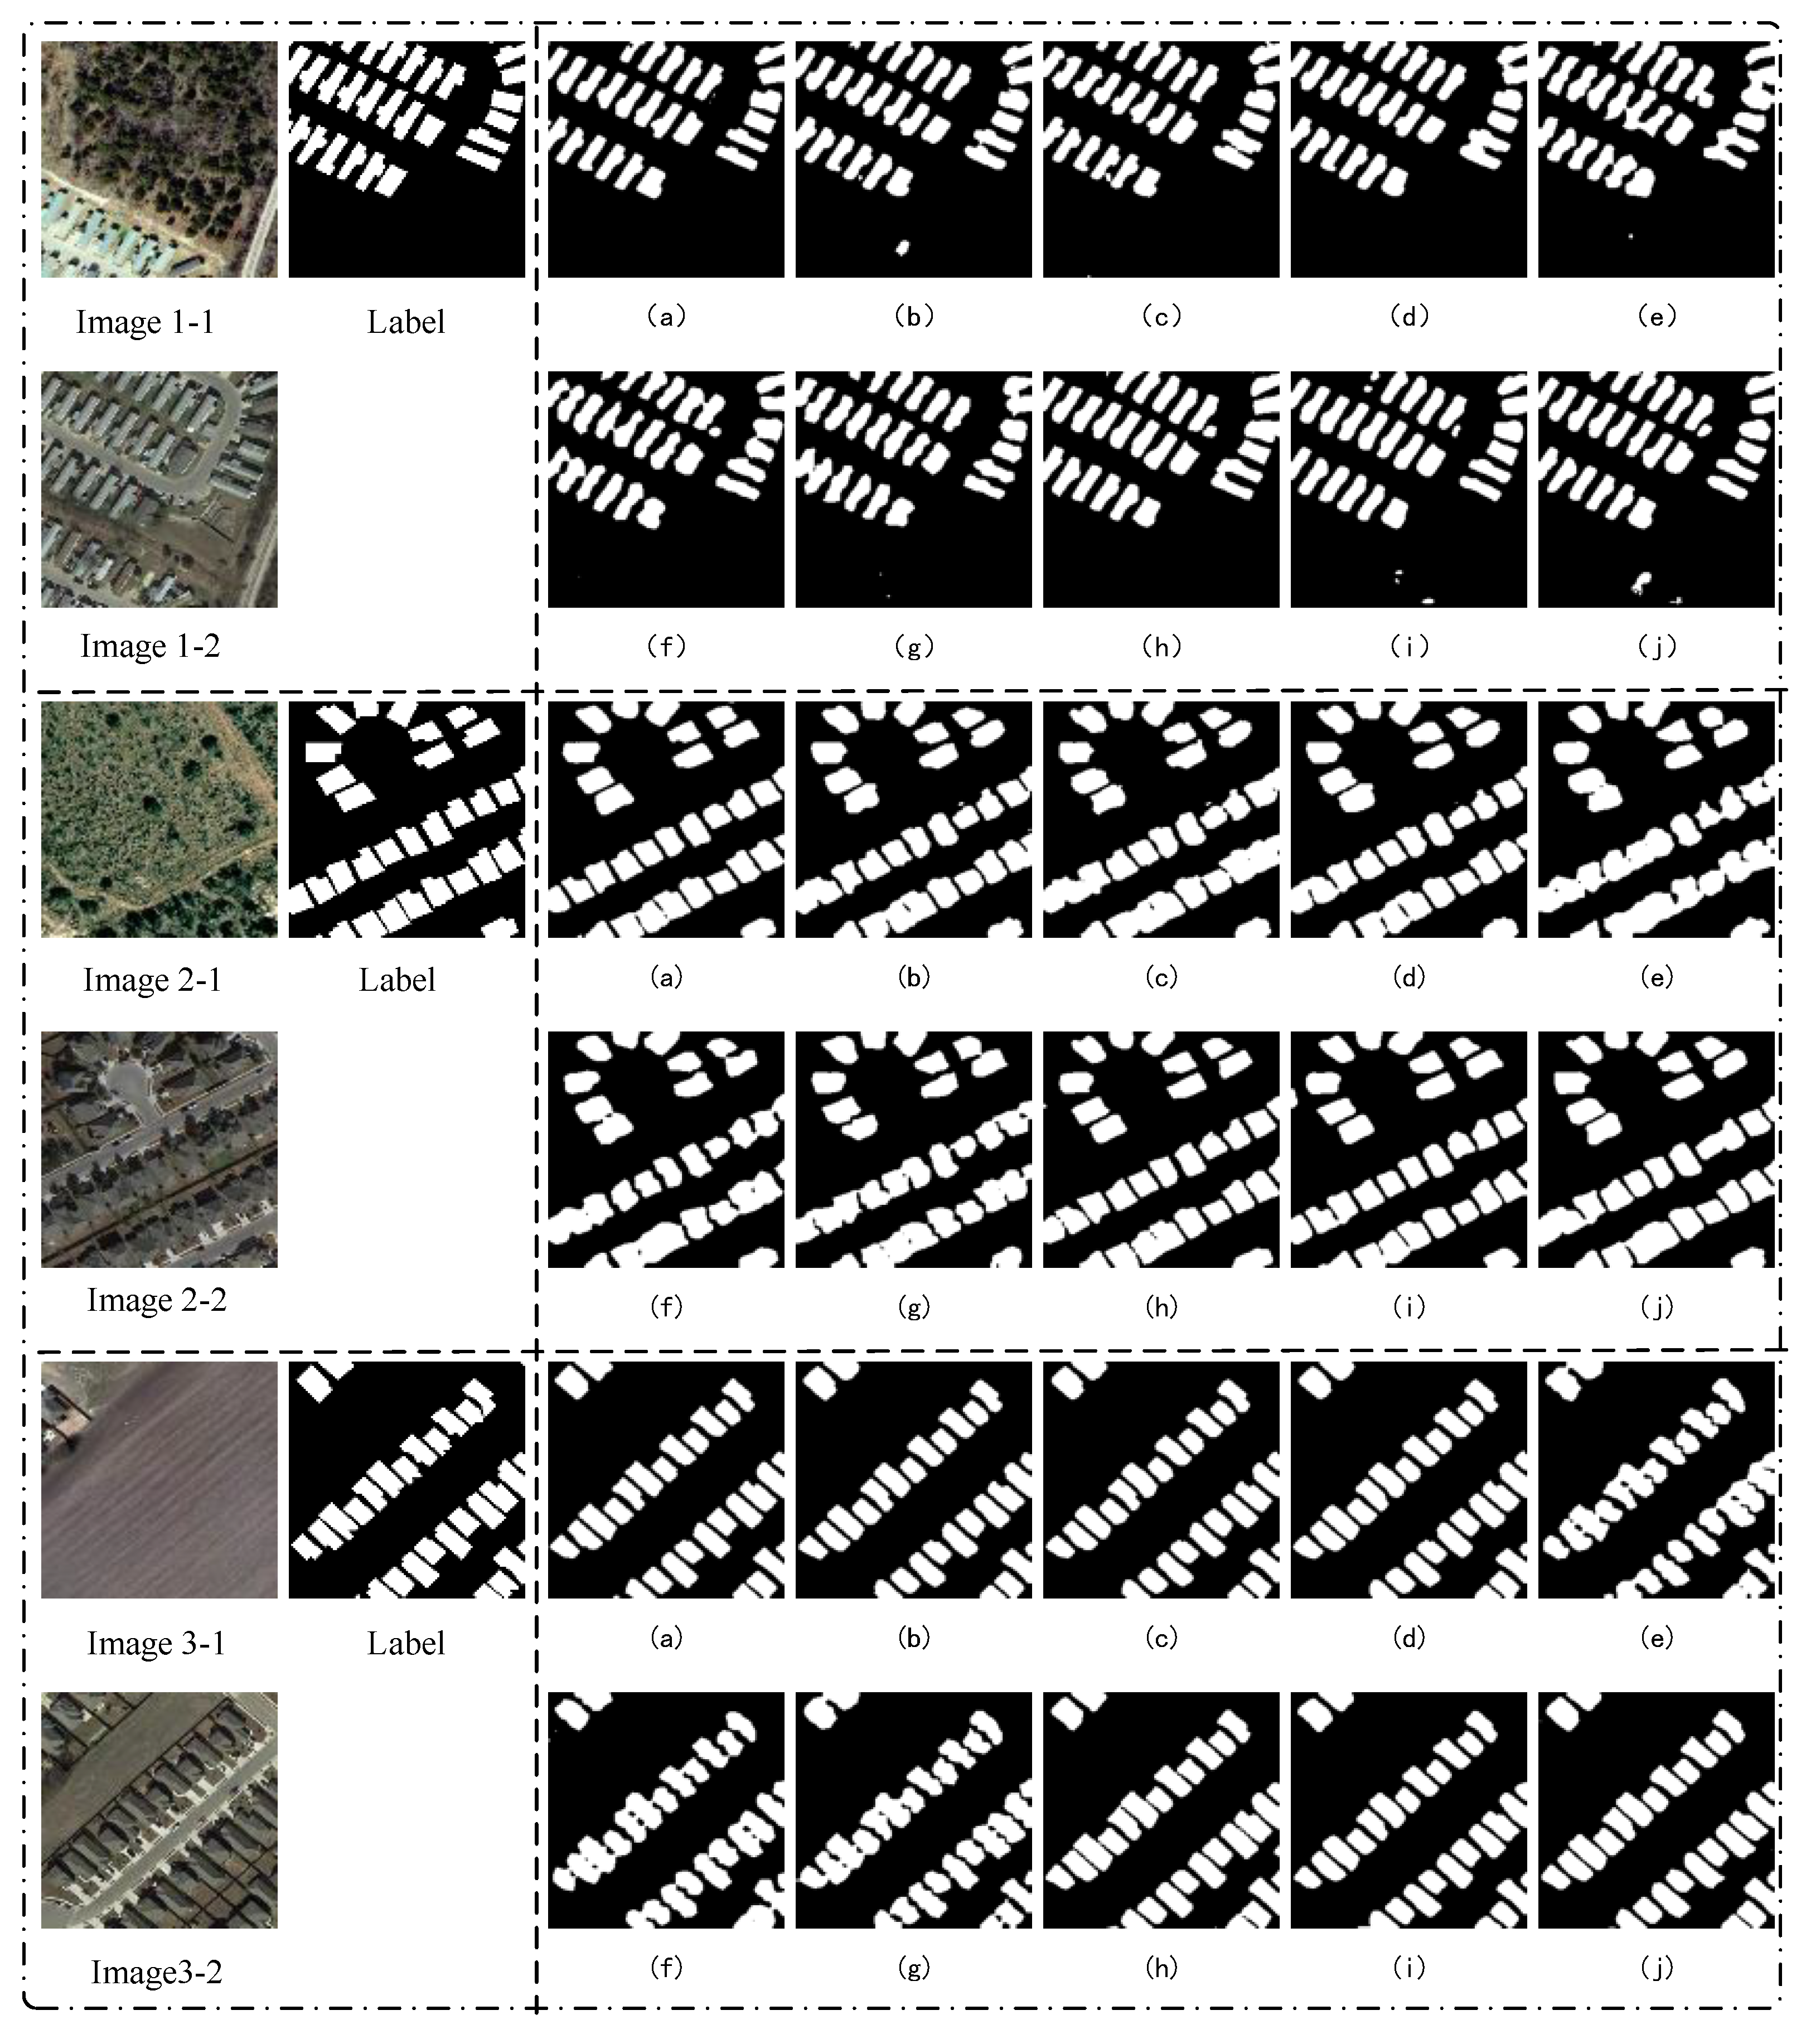
F1 score. This indicates that our network exhibits good generalization performance. In addition, we also visualized the performance of all the networks on the LEVIR-CD dataset. The specific visualization results are shown below.
The LEVIR-CD dataset contains densely populated clusters of small buildings. On the one hand, the model may have difficulty in distinguishing the boundaries of change regions, resulting in two separate change regions being detected as a single unified change region. On the other hand, the dense arrangement of buildings can result in missed detections and false detections. In
Figure 9, we illustrate three different scenarios of building clusters. Our network achieved the best results in these three scenarios, successfully avoiding the two aforementioned issues.
4.3.3. Comprehensive Efficiency Analysis of the Models
This paper aims to achieve high-precision detection while reducing computational complexity. Therefore, we conducted a comprehensive analysis and comparison of networks on the LEVIR-CD dataset, with evaluation metrics including the floating point operations (FLOPs), number of parameters (Params), inference time, and
F1 score. We randomly selected 1000 images of 256 × 256 pixels from the validation set for inference operations and averaged all results to evaluate the model’s inference time, as detailed in
Table 5. ZAQNet had lower FLOPs and Params results compared to the average levels of the other models, yet it ultimately achieved the highest
F1 score. This indicates that ZAQNet significantly reduces computational burden while improving performance, offering a more efficient solution for practical applications. Overall, ZAQNet achieves excellent detection results with lower computational costs, making it more suitable for hardware deployment, especially in resource-constrained environments. ZAQNet demonstrates its potential in high-performance change detection. We will add explanatory text in relevant sections.
5. Discussion
This study proposes a Transformer self-attention change detection network (ZAQNet) with frozen parameters, aiming to improve the accuracy and efficiency of change detection in remote sensing images. The model combines the advantages of convolutional neural networks (CNNs) and Transformers, extracting both local and global features while reducing the computational burden of standard Transformer architectures. Additionally, the introduction of frozen parameters stabilizes feature extraction, reduces overfitting, and enhances the generalization ability of the model.
Experimental results show that ZAQNet outperformed existing advanced change detection methods on the BTRS-CD and LEVIR-CD datasets. The model achieved superior performance in multiple metrics, including precision, recall, IoU, and F1 score, particularly excelling in detecting fine-grained and spatially complex changes. The GIAU (Global Information Aggregation Unit) ensures effective fusion of dual-temporal features, the GSAU (Global Spatial Attention Unit) enhances spatial awareness, and the GSCU (Global Channel Attention Unit) improves channel-wise feature discrimination. Additionally, the PRU (Pooling Refinement Unit) further optimizes spatial features, leading to more precise change localization.
Despite these advancements, some limitations remain. First, relying on frozen parameters may limit the model’s adaptability to new datasets with significantly different distributions. Future research could explore adaptive parameter freezing mechanisms to enhance model transferability. Second, while ZAQNet achieved excellent performance, its real-time inference speed and computational efficiency still require optimization. Lightweight Transformer modules or knowledge distillation techniques could be investigated to improve deployment efficiency. Finally, the current model primarily focuses on optical remote sensing images. Future work could explore multi-modal fusion strategies, integrating SAR or LiDAR data to improve robustness under varying environmental conditions such as cloud cover or seasonal changes.
6. Conclusions
This paper proposes ZAQNet, a Transformer self-attention change detection network with frozen parameters, designed to improve the accuracy of change detection in remote sensing images. By leveraging the advantages of CNNs and Transformers, ZAQNet effectively extracts both local and global features while reducing computational costs. The network integrates three key self-attention modules—the GIAU, GSAU, and GSCU—alongside the PRU module, ensuring precise feature extraction and refinement. Extensive experiments on the BTRS-CD and LEVIR-CD datasets validate the superiority of ZAQNet, achieving state-of-the-art performance in multiple evaluation metrics. These results highlight the effectiveness of parameter freezing and self-attention mechanisms in remote sensing change detection tasks. Looking ahead, further research will focus on improving model adaptability, optimizing computational efficiency, and extending the framework to multi-modal data fusion. By addressing these challenges, ZAQNet is expected to play a greater role in real-world applications such as environmental monitoring, urban planning, and disaster assessment.


